barrett business services, inc. · other accrued liabilities 806 442 workers’ compensation claims...
TRANSCRIPT

UNITED STATES
SECURITIES AND EXCHANGE COMMISSIONWASHINGTON, D.C. 20549
FORM 10-Q
x QUARTERLY REPORT PURSUANT TO SECTION 13 OR 15(d) OF THE SECURITIES EXCHANGEACT OF 1934
For the Quarterly Period Ended June 30, 2011
Commission File No. 0-21886
BARRETT BUSINESS SERVICES, INC.(Exact name of registrant as specified in its charter)
Maryland 52-0812977(State or other jurisdiction of
incorporation or organization) (IRS Employer
Identification No.)
8100 NE Parkway Drive, Suite 200Vancouver, Washington 98662
(Address of principal executive offices) (Zip Code)
(360) 828-0700(Registrant’s telephone number, including area code)
Indicate by check mark whether the registrant (1) has filed all reports required to be filed by Section 13 or 15(d) of the Securities ExchangeAct of 1934 during the preceding 12 months (or for such shorter period that the registrant was required to file such reports), and (2) hasbeen subject to such filing requirements for the past 90 days. Yes x No¨
Indicate by check mark whether the registrant has submitted electronically and posted on its corporate Website, if any, every InteractiveData File required to be submitted and posted pursuant to Rule 405 of Regulation S-T (§ 232.405 of this chapter) during the preceding 12months (or such shorter period that the registrant was required to submit and post such files). Yes x No ¨
Indicate by check mark whether the registrant is a large accelerated filer, an accelerated filer, a non-accelerated filer or a smaller reportingcompany (as defined in Rule 12b-2 of the Exchange Act). Large accelerated filer ¨ Accelerated filer x Non-accelerated filer ¨ Smaller reporting company ¨
Indicate by check mark whether the registrant is a shell company (as defined in Rule 12b-2 of the Exchange Act). Yes¨ No x
Number of shares of common stock, $.01 par value, outstanding at July 29, 2011 was 10,129,399 shares.
BARRETT BUSINESS SERVICES, INC.
INDEX Part I - Financial Information Page
Item 1. Unaudited Interim Consolidated Financial Statements 3
Consolidated Balance Sheets – June 30, 2011 and December 31, 2010 3
Consolidated Statements of Operations - Three Months Ended June 30, 2011 and 2010 4
Consolidated Statements of Operations - Six Months Ended June 30, 2011 and 2010 5
Consolidated Statements of Cash Flows - Six Months Ended June 30, 2011 and 2010 6
Notes to Unaudited Interim Consolidated Financial Statements 7
Item 2. Management’s Discussion and Analysis of Financial Condition and Results of Operations 18
Item 3. Quantitative and Qualitative Disclosures About Market Risk 27
Item 4. Controls and Procedures 27
Part II - Other Information
Item 1A. Risk Factors 30
Item 2. Unregistered Sales of Equity Securities and Use of Proceeds 30
Item 6. Exhibits 30
Signatures 31
Exhibit Index 32
- 2 -

Part I – Financial Information Item 1. Financial Statements
BARRETT BUSINESS SERVICES, INC.Consolidated Balance Sheets
(Unaudited)(In thousands, except per share amounts)
June 30,
2011 December 31,
2010 ASSETS
Current assets: Cash and cash equivalents $ 25,472 $ 30,924 Marketable securities 34,707 24,511 Trade accounts receivable, net 59,738 37,596 Income taxes receivable 2,356 2,356 Prepaid expenses and other 2,426 1,798 Deferred income taxes 5,810 6,101
Total current assets 130,509 103,286 Marketable securities 10,007 5,921 Property, equipment and software, net 14,819 15,037 Restricted marketable securities and workers’ compensation deposits 9,430 8,811 Other assets 3,100 3,094 Workers’ compensation receivables for insured losses and recoveries 3,800 3,915 Goodwill, net 47,820 47,820
$219,485 $ 187,884
LIABILITIES AND STOCKHOLDERS’ EQUITY Current liabilities:
Accounts payable $ 694 $ 964 Accrued payroll, payroll taxes and related benefits 60,355 37,525 Income taxes payable 498 0 Other accrued liabilities 806 442 Workers’ compensation claims liabilities 14,850 14,768 Safety incentives liability 5,057 5,024
Total current liabilities 82,260 58,723 Long-term workers’ compensation claims liabilities 23,504 21,847 Long-term workers’ compensation claims liabilities for insured claims 2,642 2,686 Deferred income taxes 7,841 7,841 Customer deposits and other long-term liabilities 1,393 1,422 Commitments and contingencies Stockholders’ equity:
Preferred stock, $.01 par value; 500 shares authorized; no shares issued and outstanding 0 0 Common stock, $.01 par value; 20,500 shares authorized, 10,140 and 10,202 shares issued and outstanding 101 102 Additional paid-in capital 24,452 25,164 Accumulated other comprehensive loss (30) (65) Retained earnings 77,322 70,164
101,845 95,365
$219,485 $ 187,884
The accompanying notes are an integral part of these financial statements
- 3 -
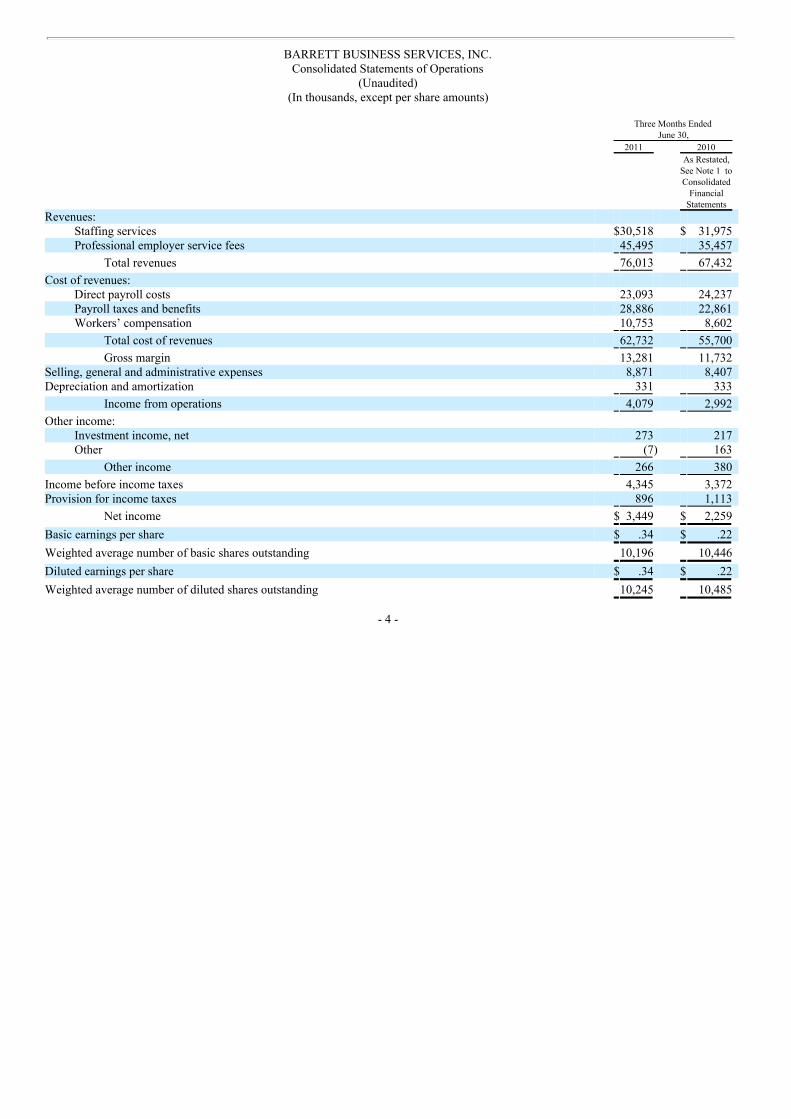
BARRETT BUSINESS SERVICES, INC.Consolidated Statements of Operations
(Unaudited)(In thousands, except per share amounts)
Three Months Ended
June 30, 2011 2010
As Restated,See Note 1 toConsolidated
FinancialStatements
Revenues: Staffing services $30,518 $ 31,975 Professional employer service fees 45,495 35,457
Total revenues 76,013 67,432
Cost of revenues: Direct payroll costs 23,093 24,237 Payroll taxes and benefits 28,886 22,861 Workers’ compensation 10,753 8,602
Total cost of revenues 62,732 55,700
Gross margin 13,281 11,732 Selling, general and administrative expenses 8,871 8,407 Depreciation and amortization 331 333
Income from operations 4,079 2,992
Other income: Investment income, net 273 217 Other (7) 163
Other income 266 380
Income before income taxes 4,345 3,372 Provision for income taxes 896 1,113
Net income $ 3,449 $ 2,259
Basic earnings per share $ .34 $ .22
Weighted average number of basic shares outstanding 10,196 10,446
Diluted earnings per share $ .34 $ .22
Weighted average number of diluted shares outstanding 10,245 10,485
- 4 -
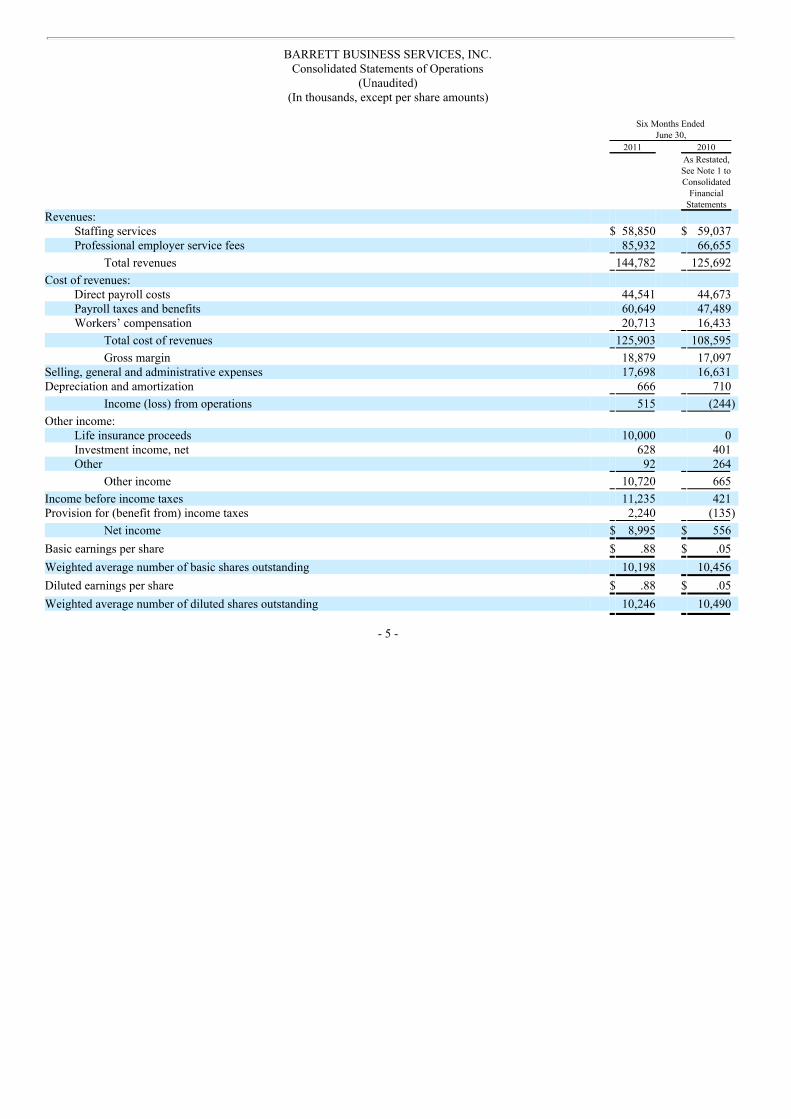
BARRETT BUSINESS SERVICES, INC.Consolidated Statements of Operations
(Unaudited)(In thousands, except per share amounts)
Six Months Ended
June 30, 2011 2010
As Restated,See Note 1 toConsolidated
FinancialStatements
Revenues: Staffing services $ 58,850 $ 59,037 Professional employer service fees 85,932 66,655
Total revenues 144,782 125,692
Cost of revenues: Direct payroll costs 44,541 44,673 Payroll taxes and benefits 60,649 47,489 Workers’ compensation 20,713 16,433
Total cost of revenues 125,903 108,595
Gross margin 18,879 17,097 Selling, general and administrative expenses 17,698 16,631 Depreciation and amortization 666 710
Income (loss) from operations 515 (244)
Other income: Life insurance proceeds 10,000 0 Investment income, net 628 401 Other 92 264
Other income 10,720 665
Income before income taxes 11,235 421 Provision for (benefit from) income taxes 2,240 (135)
Net income $ 8,995 $ 556
Basic earnings per share $ .88 $ .05
Weighted average number of basic shares outstanding 10,198 10,456
Diluted earnings per share $ .88 $ .05
Weighted average number of diluted shares outstanding 10,246 10,490
- 5 -
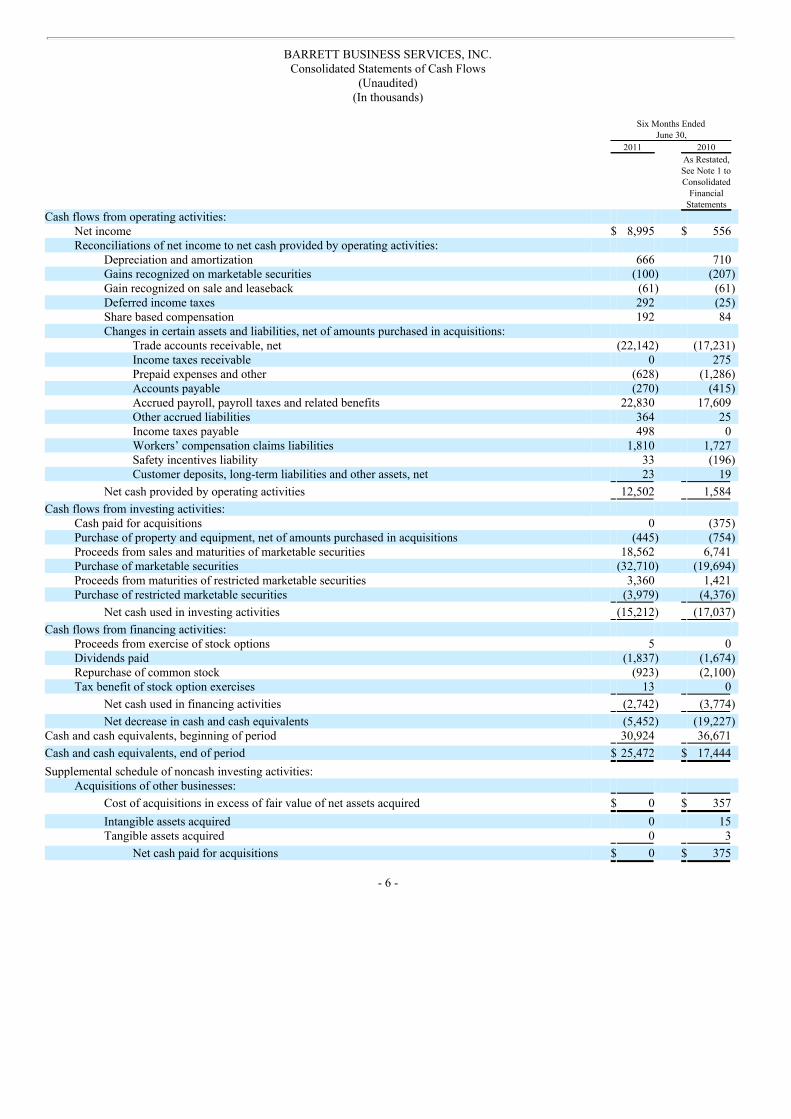
BARRETT BUSINESS SERVICES, INC.Consolidated Statements of Cash Flows
(Unaudited)(In thousands)
Six Months Ended
June 30, 2011 2010
As Restated,See Note 1 toConsolidated
FinancialStatements
Cash flows from operating activities: Net income $ 8,995 $ 556 Reconciliations of net income to net cash provided by operating activities:
Depreciation and amortization 666 710 Gains recognized on marketable securities (100) (207) Gain recognized on sale and leaseback (61) (61) Deferred income taxes 292 (25) Share based compensation 192 84 Changes in certain assets and liabilities, net of amounts purchased in acquisitions:
Trade accounts receivable, net (22,142) (17,231) Income taxes receivable 0 275 Prepaid expenses and other (628) (1,286) Accounts payable (270) (415) Accrued payroll, payroll taxes and related benefits 22,830 17,609 Other accrued liabilities 364 25 Income taxes payable 498 0 Workers’ compensation claims liabilities 1,810 1,727 Safety incentives liability 33 (196) Customer deposits, long-term liabilities and other assets, net 23 19
Net cash provided by operating activities 12,502 1,584
Cash flows from investing activities: Cash paid for acquisitions 0 (375) Purchase of property and equipment, net of amounts purchased in acquisitions (445) (754) Proceeds from sales and maturities of marketable securities 18,562 6,741 Purchase of marketable securities (32,710) (19,694) Proceeds from maturities of restricted marketable securities 3,360 1,421 Purchase of restricted marketable securities (3,979) (4,376)
Net cash used in investing activities (15,212) (17,037)
Cash flows from financing activities: Proceeds from exercise of stock options 5 0 Dividends paid (1,837) (1,674) Repurchase of common stock (923) (2,100) Tax benefit of stock option exercises 13 0
Net cash used in financing activities (2,742) (3,774)
Net decrease in cash and cash equivalents (5,452) (19,227) Cash and cash equivalents, beginning of period 30,924 36,671
Cash and cash equivalents, end of period $ 25,472 $ 17,444
Supplemental schedule of noncash investing activities: Acquisitions of other businesses:
Cost of acquisitions in excess of fair value of net assets acquired $ 0 $ 357
Intangible assets acquired 0 15 Tangible assets acquired 0 3
Net cash paid for acquisitions $ 0 $ 375
- 6 -

BARRETT BUSINESS SERVICES, INC.Notes to Consolidated Financial Statements (Unaudited) (Continued)
Note 1 - Basis of Presentation of Interim Period Statements
The accompanying consolidated financial statements are unaudited and have been prepared by Barrett Business Services, Inc.(“Barrett”, “BBSI” or the “Company”), pursuant to the rules and regulations of the Securities and Exchange Commission. Certaininformation and note disclosures typically included in financial statements prepared in accordance with accounting principles generallyaccepted in the United States of America have been condensed or omitted pursuant to such rules and regulations. In the opinion ofmanagement, the consolidated financial statements include all adjustments, consisting only of normal recurring adjustments, necessary for afair statement of the results for the interim periods presented. The preparation of financial statements in conformity with generally acceptedaccounting principles (“GAAP”) requires management to make estimates and assumptions that affect the amounts reported in the financialstatements and accompanying notes. Actual results may differ from such estimates and assumptions. The consolidated financial statementsshould be read in conjunction with the audited financial statements and notes thereto included in the Company’s 2010 Annual Report onForm 10-K at pages F1 – F32. The results of operations for an interim period are not necessarily indicative of the results of operations for afull year.
Effective January 5, 2010, the Company formed a wholly owned insurance company, Ecole Insurance Company (“Ecole”). Ecole is afully licensed insurance company holding a certificate of authority from the Arizona Department of Insurance. Ecole provides workers’compensation coverage to the Company’s employees working in Arizona for claims occurring on or after March 1, 2010. The cost tocapitalize the insurance company was approximately $6.1 million and is included in restricted marketable securities and workers’compensation deposits in the consolidated balance sheet.
- 7 -

BARRETT BUSINESS SERVICES, INC.Notes to Consolidated Financial Statements (Unaudited) (Continued)
Note 1 - Basis of Presentation of Interim Period Statements (Continued)Restatement of prior period
As described in Note 2 of the Consolidated Financial Statements in Item 15 in the Company’s 2010 Annual Report on Form 10-K, theCompany restated its consolidated financial statements to correct an error related to legal expenses incurred for the administration ofworkers’ compensation claims by Associated Insurance Company for Excess (“AICE”), the Company’s captive insurance subsidiaryformed January 1, 2007. The Company’s historical accounting method for legal expenses incurred for claims administration had been torecognize the expenses in the period incurred. The Company’s captive insurance subsidiary is subject to industry specific authoritativeaccounting guidance that requires the insurance subsidiary to include an estimate for such legal fees in its workers’ compensation claimsliabilities. Therefore, the Company’s method of recording legal fees in the period incurred for claims administration was determined to bean error. As a result, the Company has presented its consolidated financial statements for the three and six months ended June 30, 2010, asrestated to reflect the correction of this error. The Company also determined to make a conforming change to its accounting method forlegal expenses incurred for the administration of workers’ compensation claims that arose prior to the formation of AICE. The impact ofthe correction of the error and change in accounting method for the three and six months ended June 30, 2010, which has been reflectedthroughout the consolidated financial statements and accompanying notes, is as follows:
(in thousands, except per share amounts) Consolidated Statement of Operations for the
Three Months Ended June 30, 2010
As Previously
Reported Correction of
an Error
Change inAccounting
Policy Net
Adjustment Restated Cost of revenues $ 55,687 $ 198 $ (185) $ 13 $55,700 Provision from income taxes 1,107 91 (85) 6 1,113 Net income 2,278 (289) 270 (19) 2,259 Basic income per share 0.22 (0.03) 0.03 0 0.22 Diluted income per share 0.22 (0.03) 0.03 0 0.22
(in thousands, except per share amounts) Consolidated Statement of Operations for the
Six Months Ended June 30, 2010
As Previously
Reported Correction of
an Error
Change inAccounting
Policy Net
Adjustment Restated Cost of revenues $ 108,570 $ 396 $ (371) $ 25 $108,595 Benefit from income taxes (146) 182 (171) 11 (135) Net income 592 (578) 542 (36) 556 Basic income per share 0.06 (0.06) 0.06 0 0.06 Diluted income per share 0.06 (0.06) 0.06 0 0.06
Consolidated Statement of Cash Flows for the
Six Months Ended June 30, 2010
(in thousands) As Previously
Reported Correction of
an Error
Change inAccounting
Policy Net
Adjustment Restated Net income $ 592 $ (578) $ 542 $ (36) $ 556 Reconciliations of net income to cash provided by operating
activities: Deferred income taxes (148) 60 63 123 (25) Income taxes receivable 387 (186) 74 (112) 275 Workers’ compensation claims liabilities 1,702 396 (371) 25 1,727 Net cash provided by operating activities 1,584 0 0 0 1,584
- 8 -
BARRETT BUSINESS SERVICES, INC.Notes to Consolidated Financial Statements (Unaudited) (Continued)
Note 1 - Basis of Presentation of Interim Period Statements (Continued) Revenue recognition
We recognize revenue as services are rendered by our workforce. Staffing services are engaged by customers to meet short-term andlong-term personnel needs. Professional employer organization (“PEO”) services are normally used by organizations to satisfy ongoinghuman resource management needs and typically involve contracts with a minimum term of one year, which cover all employees at aparticular work site. Our PEO contracts are renewable on an annual basis and typically require 30 days’ written notice to cancel orterminate the contract by either party. Our PEO contracts provide for immediate termination upon any default of the client regardless ofwhen notice is given. We report PEO revenues in accordance with the current accounting guidance for revenue recognition, which requiresus to report such revenues on a net basis because we are not the primary obligor for the services provided by our PEO clients to theircustomers pursuant to our PEO contracts. Consequently, our PEO service fee revenues represent the gross margin generated from our PEOservices after deducting the amounts invoiced to PEO customers for direct payroll expenses such as salaries, wages, health insurance andemployee out-of-pocket expenses incurred incidental to employment and safety incentives. These amounts are also excluded from cost ofrevenues. PEO service fees also include amounts invoiced to our clients for employer payroll-related taxes and workers’ compensationcoverage.
Marketable securitiesAs of June 30, 2011, the Company’s marketable securities consisted of tax-exempt municipal securities, corporate bonds and U.S.
treasuries. The Company classifies municipal securities, U.S. treasuries, and certain of its corporate bonds as available for sale; they arereported at fair value with unrealized gains and losses, net of taxes, shown as a component of accumulated other comprehensive income(loss) in stockholders’ equity. In the event a loss is determined to be other-than-temporary, the loss will be recognized in the statement ofoperations. Certain of the Company’s corporate bonds are classified as held-to-maturity and are reported at amortized cost.
Allowance for doubtful accountsThe Company had an allowance for doubtful accounts of $463,000 and $374,000 at June 30, 2011 and December 31, 2010,
respectively. The Company must make estimates of the collectibility of accounts receivable. Management analyzes historical bad debts,customer concentrations, customer creditworthiness, current economic conditions and changes in customers’ payment trends whenevaluating the adequacy of the allowance for doubtful accounts. The Company deems an account balance uncollectible only after it haspursued all available assets of the customer and, where applicable, the assets of the personal guarantor.
Workers’ compensation claimsThe Company is a self-insured employer with respect to workers’ compensation coverage for all of its employees (including
employees subject to Professional Employer Organization (“PEO”) contracts) working in California, Oregon, Maryland, Delaware andColorado. In the state of Washington, state law allows only the Company’s staffing services and internal management employees to becovered under the Company’s self-insured workers’ compensation program. Additionally, effective January 5, 2010, we formed a wholly-owned fully licensed insurance company in Arizona to provide workers’ compensation coverage to our employees in Arizona.
- 9 -
BARRETT BUSINESS SERVICES, INC.Notes to Consolidated Financial Statements (Unaudited) (Continued)
Note 1 - Basis of Presentation of Interim Period Statements (Continued) Workers’ compensation claims (Continued)
To manage our financial exposure, in the event of catastrophic injuries or fatalities, we maintain excess workers’ compensationinsurance through our wholly owned captive insurance company, Associated Insurance Company for Excess (“AICE”), with a peroccurrence retention of $5.0 million, except in Maryland and Colorado, where our per occurrence retention is $1.0 million and $500,000,respectively. AICE maintains excess workers’ compensation insurance coverage with American Insurance Group, Inc. (“AIG”) between$5.0 million and $15.0 million per occurrence, except in Maryland, where coverage with AIG is between $1.0 million and $25.0 million peroccurrence, and in Colorado, where the coverage with AIG is between $500,000 and statutory limits per occurrence. We continue toevaluate the financial capacity of our insurers to assess the recoverability of the related insurer receivables.
The Company has provided a total of $41.0 million and $39.3 million at June 30, 2011 and December 31, 2010, respectively, as anestimated future liability for unsettled workers’ compensation claims liabilities. Included in the foregoing liabilities are insured claims thatwill be paid by the Company’s former excess workers’ compensation insurer and for which the Company has reported a receivable fromthe insurer for the insured claims liability. Insured claims totaled $2.6 million at June 30, 2011 and $2.7 million at December 31, 2010,respectively. The estimated liability for unsettled workers’ compensation claims represents management’s best estimate based upon anactuarial valuation provided by a third party actuary. Included in the claims liabilities are case reserve estimates for reported losses, plusadditional amounts based on projections for incurred but not reported claims and anticipated increases in case reserve estimates. Alsoincluded in these estimates are amounts for unallocated loss adjustment expenses, including legal costs. These estimates are continuallyreviewed and adjustments to liabilities are reflected in current operating results as they become known.
Safety incentives liabilitySafety incentives represent cash incentives paid to certain PEO client companies for maintaining safe-work practices in order to
minimize workplace injuries, thereby meeting agreed-upon loss objectives. The Company has provided $5.1 million at June 30, 2011 and$5.0 million at December 31, 2010 as an estimate of the liability for unpaid safety incentives. The incentive is based on a percentage ofannual payroll and is paid annually to customers who meet predetermined workers’ compensation claims cost objectives. Safety incentivepayments are made only after closure of all workers’ compensation claims incurred during the customer’s contract period. The liability isestimated and accrued each month based upon the incentive earned less the then-current amount of the customer’s estimated workers’compensation claims reserves as established by the Company’s internal and third-party claims administrators, and the expected payout asdetermined by historical incentive payment trends. Safety incentive expense is netted against PEO services revenue in our consolidatedstatements of operations.
- 10 -
BARRETT BUSINESS SERVICES, INC.Notes to Consolidated Financial Statements (Unaudited) (Continued)
Note 1 - Basis of Presentation of Interim Period Statements (Continued)Comprehensive income
Comprehensive income includes all changes in equity during a period except those that resulted from investments by or distributionsto a company’s stockholders. Comprehensive income totaled $3.5 million and $2.1 million for the three months ended June 30, 2011 and2010 and $9.0 million and $459,000 for the six months ended June 30, 2011 and 2010, respectively. Other comprehensive income (loss)refers to revenues, expenses, gains and losses that under GAAP are included in comprehensive income, but are excluded from net income asthese amounts are recorded directly as an adjustment to stockholders’ equity. The Company’s other comprehensive income (loss) iscomprised of unrealized holding gains and losses on its publicly traded marketable securities designated as “available-for-sale”, net ofrealized gains or losses included in net income.
Note 2 - Recent Accounting PronouncementsIn June 2011, the Financial Accounting Standards Board (“FASB”) issued ASU No. 2011-05, “Comprehensive Income: Presentation
of Comprehensive Income”. This new guidance requires the components of net income and other comprehensive income to be eitherpresented in one continuous statement, referred to as the statement of comprehensive income, or in two separate, but consecutivestatements. It also eliminates the current option to report other comprehensive income and its components in the statement of stockholders’equity. While the new guidance changes the presentation of comprehensive income, there are no changes to the components that arerecognized in net income or other comprehensive income under current accounting guidance. This new guidance is effective for theCompany beginning January 1, 2012. As this guidance only alters the presentation of the components of comprehensive income, theadoption will not have an impact on the Company’s consolidated financial position or results of operations.
- 11 -
BARRETT BUSINESS SERVICES, INC.Notes to Consolidated Financial Statements (Unaudited) (Continued)
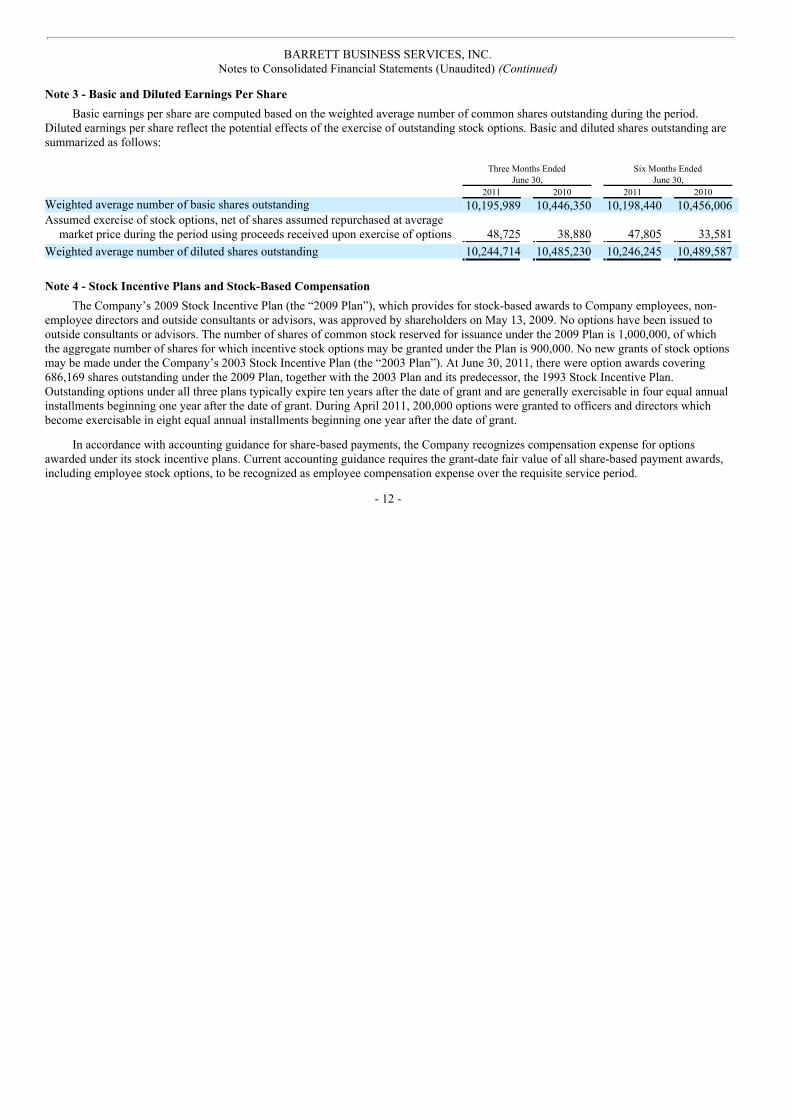
Note 3 - Basic and Diluted Earnings Per Share
Basic earnings per share are computed based on the weighted average number of common shares outstanding during the period.Diluted earnings per share reflect the potential effects of the exercise of outstanding stock options. Basic and diluted shares outstanding aresummarized as follows:
Three Months Ended
June 30, Six Months Ended
June 30, 2011 2010 2011 2010 Weighted average number of basic shares outstanding 10,195,989 10,446,350 10,198,440 10,456,006 Assumed exercise of stock options, net of shares assumed repurchased at average
market price during the period using proceeds received upon exercise of options 48,725 38,880 47,805 33,581
Weighted average number of diluted shares outstanding 10,244,714 10,485,230 10,246,245 10,489,587
Note 4 - Stock Incentive Plans and Stock-Based CompensationThe Company’s 2009 Stock Incentive Plan (the “2009 Plan”), which provides for stock-based awards to Company employees, non-
employee directors and outside consultants or advisors, was approved by shareholders on May 13, 2009. No options have been issued tooutside consultants or advisors. The number of shares of common stock reserved for issuance under the 2009 Plan is 1,000,000, of whichthe aggregate number of shares for which incentive stock options may be granted under the Plan is 900,000. No new grants of stock optionsmay be made under the Company’s 2003 Stock Incentive Plan (the “2003 Plan”). At June 30, 2011, there were option awards covering686,169 shares outstanding under the 2009 Plan, together with the 2003 Plan and its predecessor, the 1993 Stock Incentive Plan.Outstanding options under all three plans typically expire ten years after the date of grant and are generally exercisable in four equal annualinstallments beginning one year after the date of grant. During April 2011, 200,000 options were granted to officers and directors whichbecome exercisable in eight equal annual installments beginning one year after the date of grant.
In accordance with accounting guidance for share-based payments, the Company recognizes compensation expense for optionsawarded under its stock incentive plans. Current accounting guidance requires the grant-date fair value of all share-based payment awards,including employee stock options, to be recognized as employee compensation expense over the requisite service period.
- 12 -
BARRETT BUSINESS SERVICES, INC.Notes to Consolidated Financial Statements (Unaudited) (Continued)
Note 4 - Stock Incentive Plans and Stock-Based Compensation (Continued)
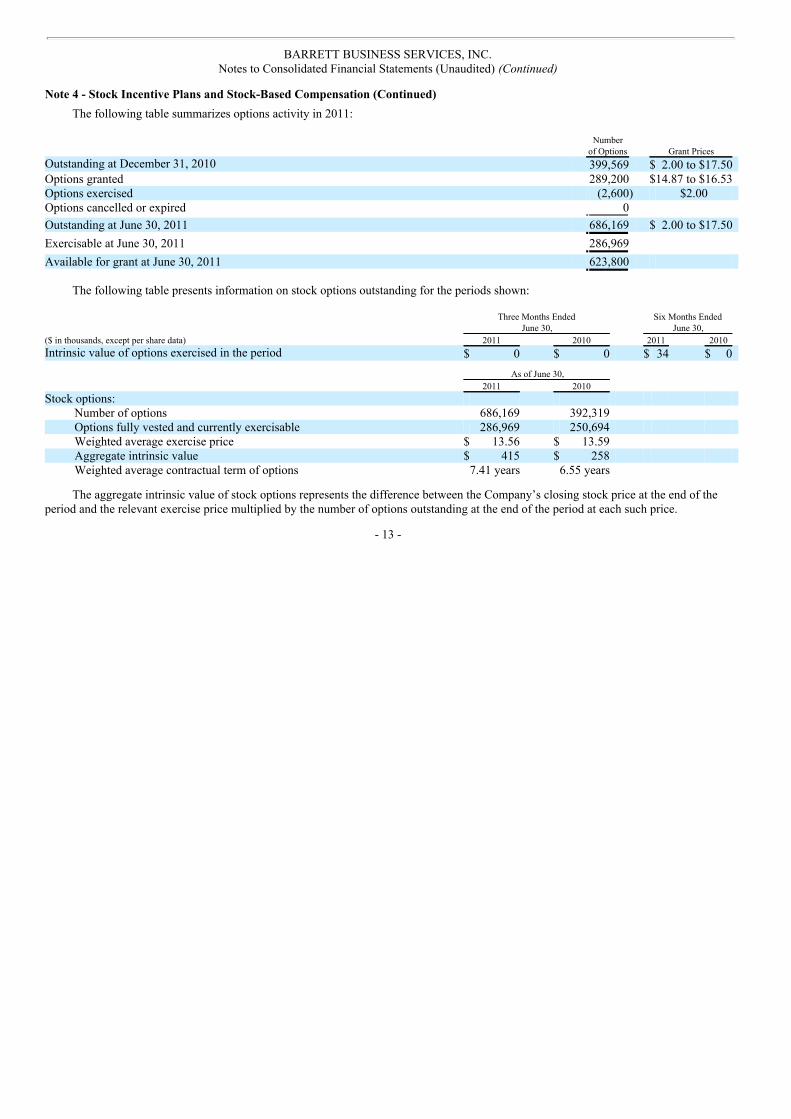
The following table summarizes options activity in 2011:
Number
of Options Grant Prices Outstanding at December 31, 2010 399,569 $ 2.00 to $17.50 Options granted 289,200 $14.87 to $16.53 Options exercised (2,600) $2.00 Options cancelled or expired 0
Outstanding at June 30, 2011 686,169 $ 2.00 to $17.50
Exercisable at June 30, 2011 286,969
Available for grant at June 30, 2011 623,800
The following table presents information on stock options outstanding for the periods shown:
Three Months Ended
June 30, Six Months Ended
June 30, ($ in thousands, except per share data) 2011 2010 2011 2010 Intrinsic value of options exercised in the period $ 0 $ 0 $ 34 $ 0 As of June 30, 2011 2010 Stock options:
Number of options 686,169 392,319 Options fully vested and currently exercisable 286,969 250,694 Weighted average exercise price $ 13.56 $ 13.59 Aggregate intrinsic value $ 415 $ 258 Weighted average contractual term of options 7.41 years 6.55 years
The aggregate intrinsic value of stock options represents the difference between the Company’s closing stock price at the end of theperiod and the relevant exercise price multiplied by the number of options outstanding at the end of the period at each such price.
- 13 -
BARRETT BUSINESS SERVICES, INC.Notes to Consolidated Financial Statements (Unaudited) (Continued)
Note 4 - Stock Incentive Plans and Stock-Based Compensation (Continued)
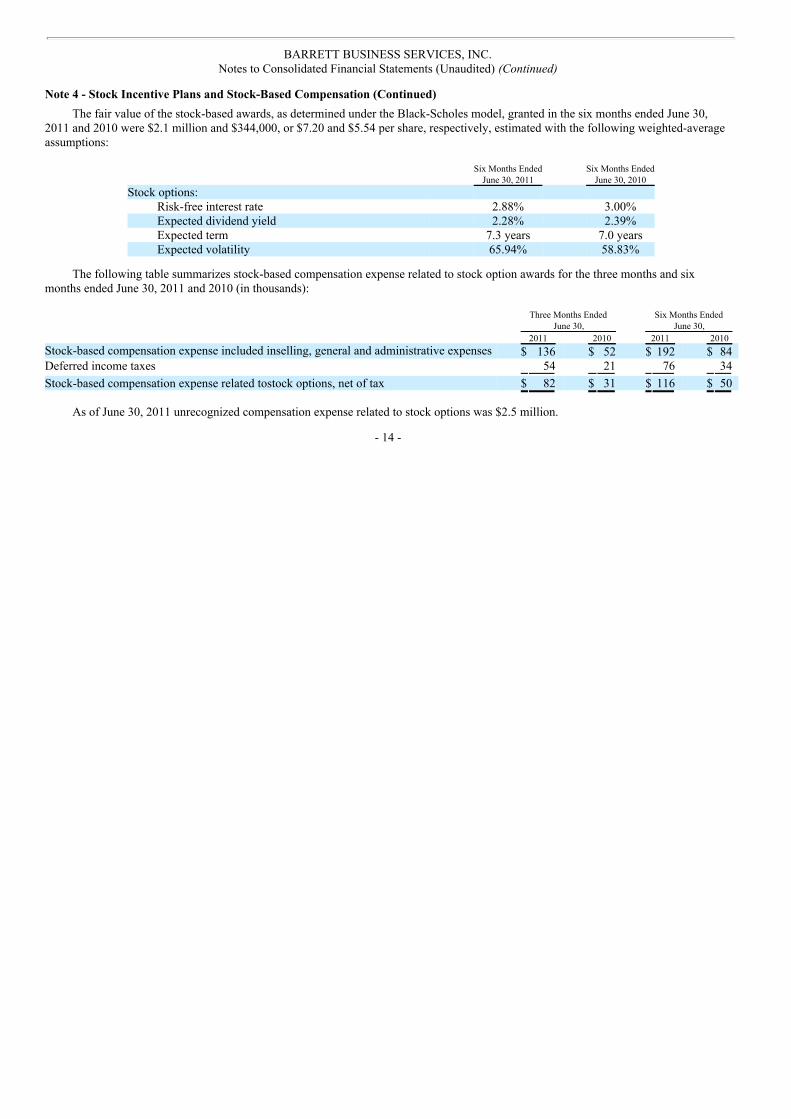
The fair value of the stock-based awards, as determined under the Black-Scholes model, granted in the six months ended June 30,2011 and 2010 were $2.1 million and $344,000, or $7.20 and $5.54 per share, respectively, estimated with the following weighted-averageassumptions:
Six Months Ended
June 30, 2011 Six Months Ended
June 30, 2010Stock options:
Risk-free interest rate 2.88% 3.00%Expected dividend yield 2.28% 2.39%Expected term 7.3 years 7.0 yearsExpected volatility 65.94% 58.83%
The following table summarizes stock-based compensation expense related to stock option awards for the three months and sixmonths ended June 30, 2011 and 2010 (in thousands):
Three Months Ended
June 30, Six Months Ended
June 30, 2011 2010 2011 2010 Stock-based compensation expense included inselling, general and administrative expenses $ 136 $ 52 $ 192 $ 84 Deferred income taxes 54 21 76 34
Stock-based compensation expense related tostock options, net of tax $ 82 $ 31 $ 116 $ 50
As of June 30, 2011 unrecognized compensation expense related to stock options was $2.5 million.
- 14 -

BARRETT BUSINESS SERVICES, INC.Notes to Consolidated Financial Statements (Unaudited) (Continued)
Note 5 - Workers’ Compensation
The following table summarizes the aggregate workers’ compensation reserve activity (in thousands):
Three Months Ended
June 30, Six Months Ended
June 30, 2011 2010 2011 2010
As Restated,See Note 1 toConsolidated
FinancialStatements
As Restated,See Note 1 toConsolidated
FinancialStatements
Beginning balance Workers’ compensation claims liabilities $39,783 $ 36,766 $39,301 $ 35,957
Add: claims expense accrual: Current period 5,279 3,971 9,985 7,671 Prior periods 286 44 522 191
Total expense accrual 5,565 4,015 10,507 7,862
Less: claim payments related to: Current period 962 668 1,219 855 Prior periods 3,390 2,655 7,593 5,506
Total paid 4,352 3,323 8,812 6,361
Ending balance Workers’ compensation claims liabilities $40,996 $ 37,458 $40,996 $ 37,458
Incurred but not reported (IBNR) $29,738 $ 25,937 $29,738 $ 25,937
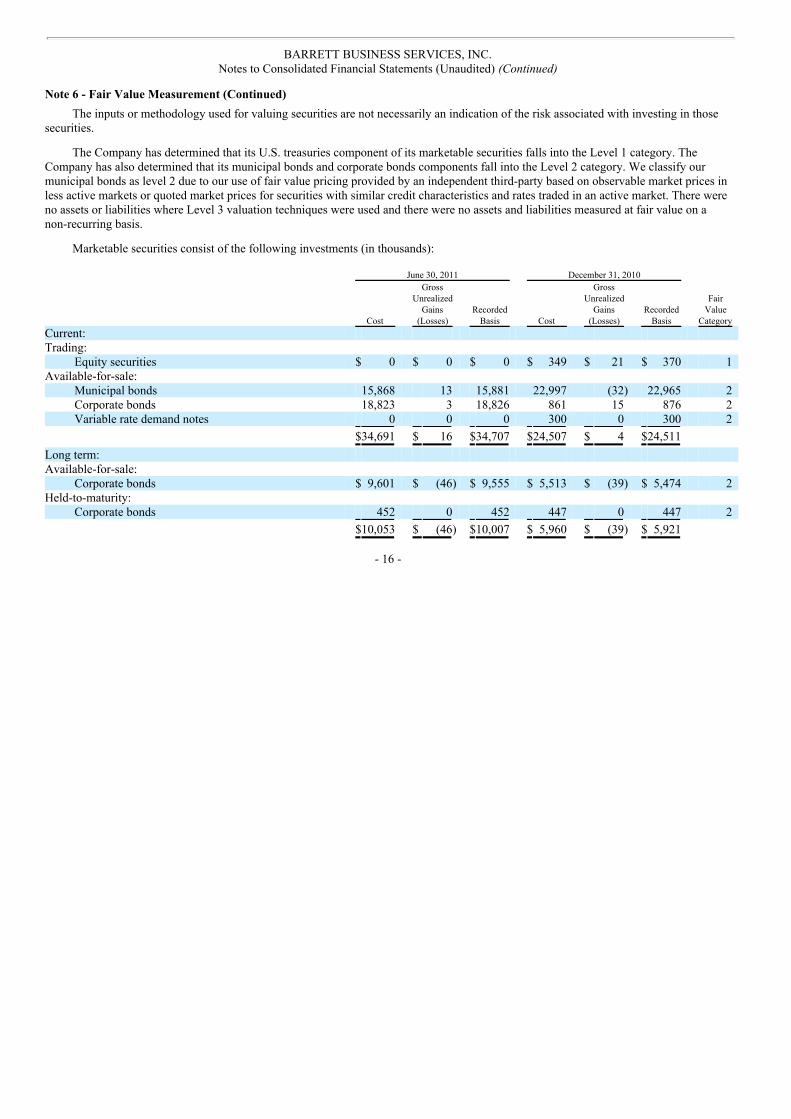
Note 6 - Fair Value MeasurementThe Company has determined that its marketable securities should be presented at their fair value. Fair value is the price that would
be received to sell an asset or paid to transfer a liability in an orderly transaction between market participants at the measurement date.
Factors used in determining the fair value of our financial assets and liabilities are summarized into three broad categories:
• Level 1 – quoted prices in active markets for identical securities;
• Level 2 – other significant observable inputs, including quoted prices for similar securities, interest rates, prepayment speeds,
credit risk, etc.; and
• Level 3 – significant unobservable inputs, including our own assumptions in determining fair value.
- 15 -
BARRETT BUSINESS SERVICES, INC.Notes to Consolidated Financial Statements (Unaudited) (Continued)
Note 6 - Fair Value Measurement (Continued)
The inputs or methodology used for valuing securities are not necessarily an indication of the risk associated with investing in thosesecurities.
The Company has determined that its U.S. treasuries component of its marketable securities falls into the Level 1 category. TheCompany has also determined that its municipal bonds and corporate bonds components fall into the Level 2 category. We classify ourmunicipal bonds as level 2 due to our use of fair value pricing provided by an independent third-party based on observable market prices inless active markets or quoted market prices for securities with similar credit characteristics and rates traded in an active market. There wereno assets or liabilities where Level 3 valuation techniques were used and there were no assets and liabilities measured at fair value on anon-recurring basis.
Marketable securities consist of the following investments (in thousands): June 30, 2011 December 31, 2010
Cost
GrossUnrealized
Gains(Losses)
RecordedBasis Cost
GrossUnrealized
Gains(Losses)
RecordedBasis
FairValue
Category Current: Trading:
Equity securities $ 0 $ 0 $ 0 $ 349 $ 21 $ 370 1 Available-for-sale:
Municipal bonds 15,868 13 15,881 22,997 (32) 22,965 2 Corporate bonds 18,823 3 18,826 861 15 876 2 Variable rate demand notes 0 0 0 300 0 300 2
$34,691 $ 16 $34,707 $24,507 $ 4 $24,511
Long term: Available-for-sale:
Corporate bonds $ 9,601 $ (46) $ 9,555 $ 5,513 $ (39) $ 5,474 2 Held-to-maturity:
Corporate bonds 452 0 452 447 0 447 2
$10,053 $ (46) $10,007 $ 5,960 $ (39) $ 5,921
- 16 -

BARRETT BUSINESS SERVICES, INC.Notes to Consolidated Financial Statements (Unaudited) (Continued)
Note 6 - Fair Value Measurement (Continued)
The Company’s restricted marketable securities component of restricted marketable securities and workers’ compensation depositsconsists of the following (in thousands): June 30, 2011 December 31, 2010
Cost
GrossUnrealized
Gains(Losses)
RecordedBasis Cost
GrossUnrealized
Gains(Losses)
RecordedBasis
FairValue
Category Available-for-sale:
Municipal bonds $5,376 $ 28 $5,404 $5,147 $ 0 $5,147 2 Corporate bonds 45 0 45 323 0 323 2 U.S. treasuries 1,567 0 1,567 1,567 0 1,567 1
$6,988 $ 28 $7,016 $7,037 $ 0 $7,037
- 17 -
Item 2. Management’s Discussion and Analysis of Financial Condition and Results of OperationsOverview
Barrett Business Services, Inc. (“Barrett”, the “Company” or “we”), a Maryland corporation, offers a comprehensive range of humanresource management services to help small and medium-sized businesses manage the increasing costs and complexities of a broad array ofemployment-related issues. The Company’s principal services, professional employer organization (“PEO”) services and staffing services,assist its clients in leveraging their investment in human capital. The Company believes that the combination of these two principalservices enables it to provide clients with a unique blend of services not offered by the Company’s competition. Barrett’s platform ofoutsourced human resource management services is built upon expertise in payroll processing, employee benefits and administration,workers’ compensation coverage, effective risk management and workplace safety programs, and human resource administration.
To provide PEO services to a client, the Company enters into a contract to become a co-employer of the client’s existing workforceand Barrett assumes responsibility for some or all of the client’s human resource management responsibilities. PEO services are normallyused by organizations to satisfy ongoing human resource management needs and typically involve contracts with a minimum term of oneyear, renewable annually, which cover all employees at a particular work site. Staffing services include on-demand or short-term staffingassignments, long-term or indefinite-term contract staffing and comprehensive on-site management. The Company’s staffing services alsoinclude direct placement services, which involve fee-based search efforts for specific employee candidates at the request of PEO clients,staffing customers or other businesses.
The Company’s ability to offer clients a broad mix of services allows Barrett to effectively become the human resource departmentand a strategic business partner for its clients. The Company believes its approach to human resource management services is designed topositively affect its clients’ business results by:
• allowing clients to focus on core business activities instead of human resource matters;
• increasing clients’ productivity by improving employee satisfaction and generating greater employee retention;
• reducing overall payroll expenses due to lower workers’ compensation and health insurance costs; and
• assisting clients in complying with complex and evolving human resource-related regulatory and tax issues.
The Company serves a growing and diverse client base of small and medium-sized businesses in a wide variety of industries through anetwork of branch offices in California, Oregon, Washington, Idaho, Arizona, Utah, Colorado, Maryland, Delaware and North Carolina.Barrett also has several smaller recruiting offices in its general market areas, which are under the direction of a branch office.
- 18 -
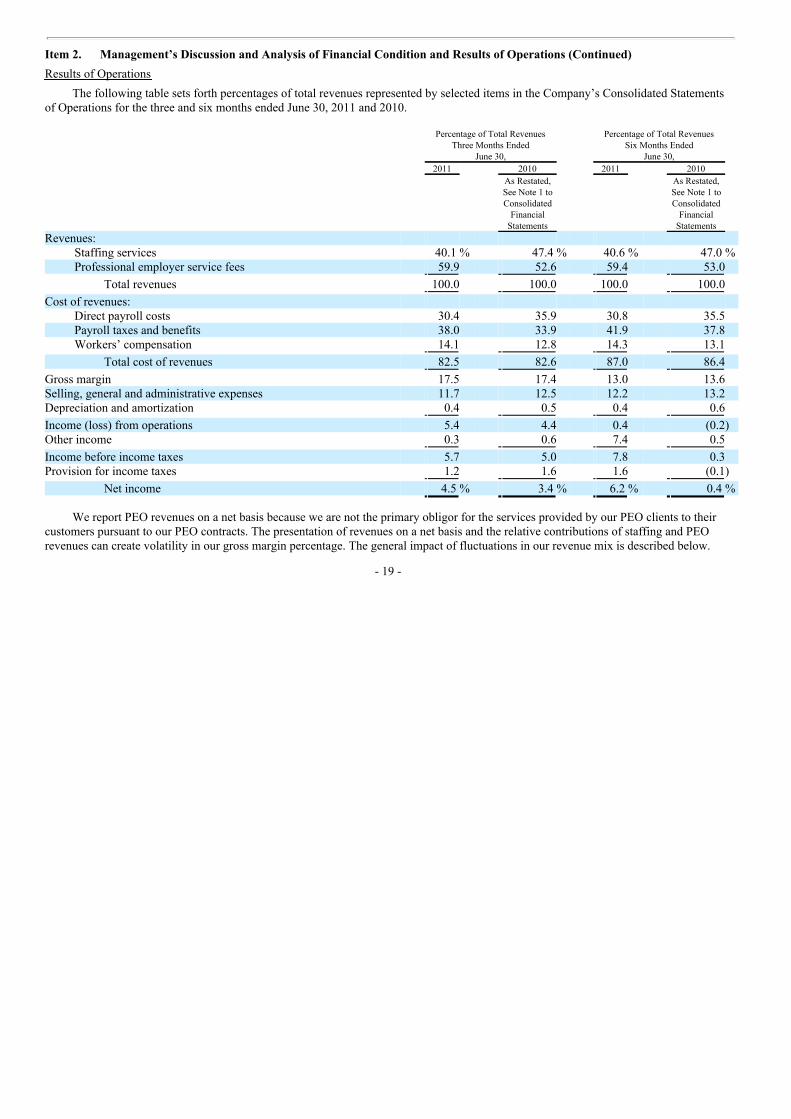
Item 2. Management’s Discussion and Analysis of Financial Condition and Results of Operations (Continued)Results of Operations
The following table sets forth percentages of total revenues represented by selected items in the Company’s Consolidated Statementsof Operations for the three and six months ended June 30, 2011 and 2010.
Percentage of Total RevenuesThree Months Ended
June 30,
Percentage of Total RevenuesSix Months Ended
June 30, 2011 2010 2011 2010
As Restated,See Note 1 toConsolidated
FinancialStatements
As Restated,See Note 1 toConsolidated
FinancialStatements
Revenues: Staffing services 40.1 % 47.4 % 40.6 % 47.0 % Professional employer service fees 59.9 52.6 59.4 53.0
Total revenues 100.0 100.0 100.0 100.0
Cost of revenues: Direct payroll costs 30.4 35.9 30.8 35.5 Payroll taxes and benefits 38.0 33.9 41.9 37.8 Workers’ compensation 14.1 12.8 14.3 13.1
Total cost of revenues 82.5 82.6 87.0 86.4
Gross margin 17.5 17.4 13.0 13.6 Selling, general and administrative expenses 11.7 12.5 12.2 13.2 Depreciation and amortization 0.4 0.5 0.4 0.6
Income (loss) from operations 5.4 4.4 0.4 (0.2) Other income 0.3 0.6 7.4 0.5
Income before income taxes 5.7 5.0 7.8 0.3 Provision for income taxes 1.2 1.6 1.6 (0.1)
Net income 4.5 % 3.4 % 6.2 % 0.4 %
We report PEO revenues on a net basis because we are not the primary obligor for the services provided by our PEO clients to theircustomers pursuant to our PEO contracts. The presentation of revenues on a net basis and the relative contributions of staffing and PEOrevenues can create volatility in our gross margin percentage. The general impact of fluctuations in our revenue mix is described below.
- 19 -
Item 2. Management’s Discussion and Analysis of Financial Condition and Results of Operations (Continued)Results of Operations (Continued)
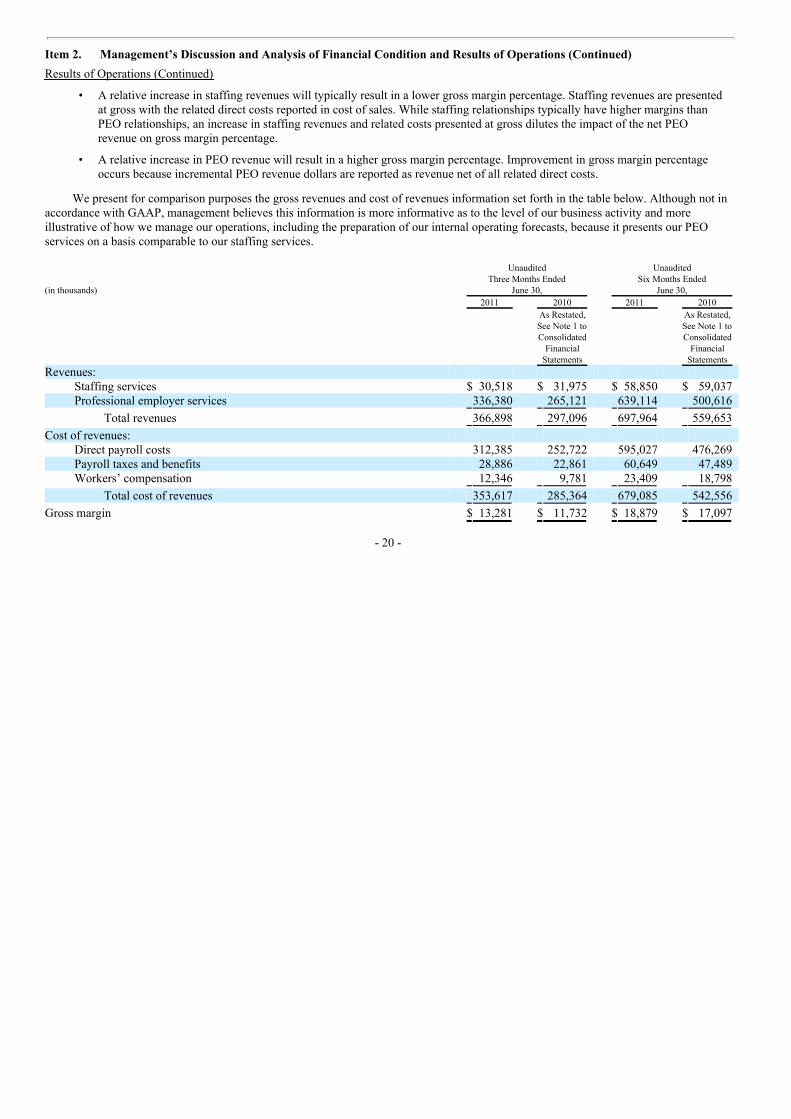
• A relative increase in staffing revenues will typically result in a lower gross margin percentage. Staffing revenues are presentedat gross with the related direct costs reported in cost of sales. While staffing relationships typically have higher margins thanPEO relationships, an increase in staffing revenues and related costs presented at gross dilutes the impact of the net PEOrevenue on gross margin percentage.
• A relative increase in PEO revenue will result in a higher gross margin percentage. Improvement in gross margin percentage
occurs because incremental PEO revenue dollars are reported as revenue net of all related direct costs.
We present for comparison purposes the gross revenues and cost of revenues information set forth in the table below. Although not inaccordance with GAAP, management believes this information is more informative as to the level of our business activity and moreillustrative of how we manage our operations, including the preparation of our internal operating forecasts, because it presents our PEOservices on a basis comparable to our staffing services.
(in thousands)
UnauditedThree Months Ended
June 30,
UnauditedSix Months Ended
June 30, 2011 2010 2011 2010
As Restated,See Note 1 toConsolidated
FinancialStatements
As Restated,See Note 1 toConsolidated
FinancialStatements
Revenues: Staffing services $ 30,518 $ 31,975 $ 58,850 $ 59,037 Professional employer services 336,380 265,121 639,114 500,616
Total revenues 366,898 297,096 697,964 559,653
Cost of revenues: Direct payroll costs 312,385 252,722 595,027 476,269 Payroll taxes and benefits 28,886 22,861 60,649 47,489 Workers’ compensation 12,346 9,781 23,409 18,798
Total cost of revenues 353,617 285,364 679,085 542,556
Gross margin $ 13,281 $ 11,732 $ 18,879 $ 17,097
- 20 -

Item 2. Management’s Discussion and Analysis of Financial Condition and Results of Operations (Continued)Results of Operations (Continued)
A reconciliation of non-GAAP gross PEO revenues to net PEO revenues is as follows:
Unaudited
Three Months Ended June 30,
(in thousands) Gross Revenue
Reporting Method Reclassification Net Revenue
Reporting Method 2011 2010 2011 2010 2011 2010
As Restated,See Note 1 toConsolidated
FinancialStatements
Revenues: Staffing services $ 30,518 $ 31,975 $ 0 $ 0 $30,518 $ 31,975 Professional employer services 336,380 265,121 (290,885) (229,664) 45,495 35,457
Total revenues $366,898 $297,096 $(290,885) $(229,664) $76,013 $ 67,432
Cost of revenues $353,617 $285,364 $(290,885) $(229,664) $62,732 $ 55,700
Unaudited
Six Months Ended June 30,
(in thousands) Gross Revenue
Reporting Method Reclassification Net Revenue
Reporting Method 2011 2010 2011 2010 2011 2010
As Restated,See Note 1 toConsolidated
FinancialStatements
Revenues: Staffing services $ 58,850 $ 59,037 $ 0 $ 0 $ 58,850 $ 59,037 Professional employer services 639,114 500,616 (553,182) (433,961) 85,932 66,655
Total revenues $697,964 $559,653 $(553,182) $(433,961) $144,782 $ 125,692
Cost of revenues $679,085 $542,556 $(553,182) $(433,961) $125,903 $ 108,595
The amount of the reclassification is comprised of direct payroll costs and safety incentives attributable to our PEO client companies.
- 21 -
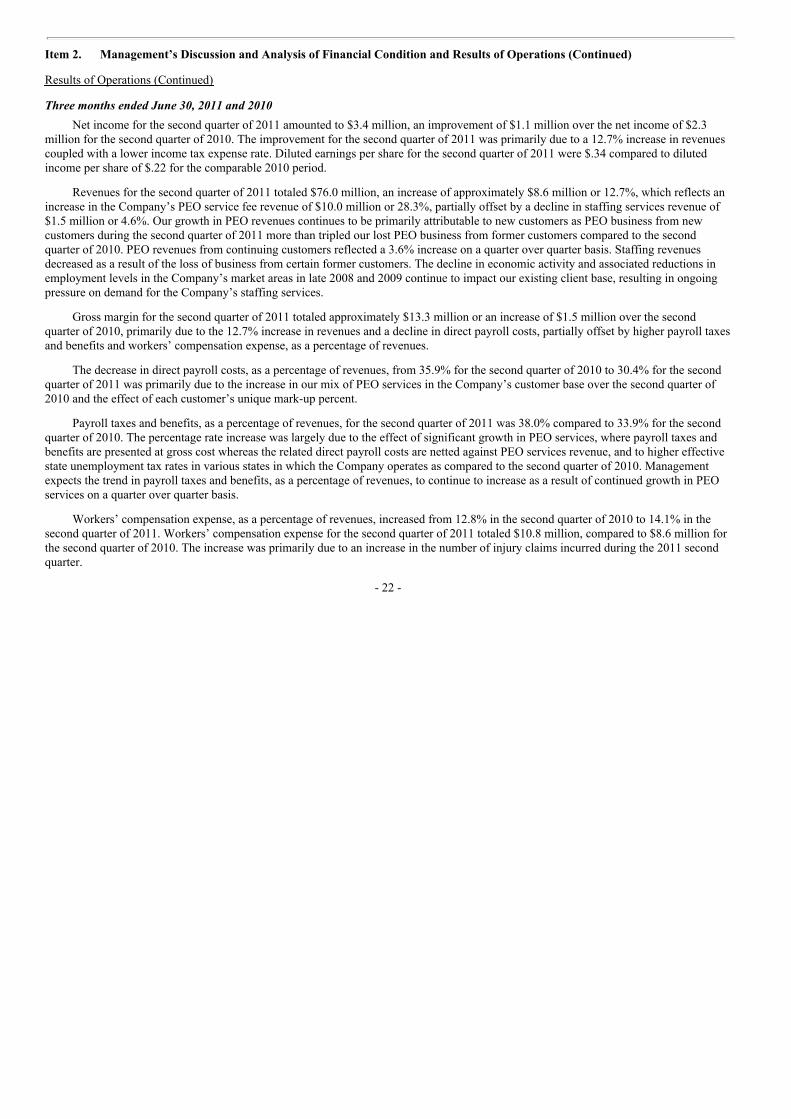
Item 2. Management’s Discussion and Analysis of Financial Condition and Results of Operations (Continued) Results of Operations (Continued) Three months ended June 30, 2011 and 2010
Net income for the second quarter of 2011 amounted to $3.4 million, an improvement of $1.1 million over the net income of $2.3million for the second quarter of 2010. The improvement for the second quarter of 2011 was primarily due to a 12.7% increase in revenuescoupled with a lower income tax expense rate. Diluted earnings per share for the second quarter of 2011 were $.34 compared to dilutedincome per share of $.22 for the comparable 2010 period.
Revenues for the second quarter of 2011 totaled $76.0 million, an increase of approximately $8.6 million or 12.7%, which reflects anincrease in the Company’s PEO service fee revenue of $10.0 million or 28.3%, partially offset by a decline in staffing services revenue of$1.5 million or 4.6%. Our growth in PEO revenues continues to be primarily attributable to new customers as PEO business from newcustomers during the second quarter of 2011 more than tripled our lost PEO business from former customers compared to the secondquarter of 2010. PEO revenues from continuing customers reflected a 3.6% increase on a quarter over quarter basis. Staffing revenuesdecreased as a result of the loss of business from certain former customers. The decline in economic activity and associated reductions inemployment levels in the Company’s market areas in late 2008 and 2009 continue to impact our existing client base, resulting in ongoingpressure on demand for the Company’s staffing services.
Gross margin for the second quarter of 2011 totaled approximately $13.3 million or an increase of $1.5 million over the secondquarter of 2010, primarily due to the 12.7% increase in revenues and a decline in direct payroll costs, partially offset by higher payroll taxesand benefits and workers’ compensation expense, as a percentage of revenues.
The decrease in direct payroll costs, as a percentage of revenues, from 35.9% for the second quarter of 2010 to 30.4% for the secondquarter of 2011 was primarily due to the increase in our mix of PEO services in the Company’s customer base over the second quarter of2010 and the effect of each customer’s unique mark-up percent.
Payroll taxes and benefits, as a percentage of revenues, for the second quarter of 2011 was 38.0% compared to 33.9% for the secondquarter of 2010. The percentage rate increase was largely due to the effect of significant growth in PEO services, where payroll taxes andbenefits are presented at gross cost whereas the related direct payroll costs are netted against PEO services revenue, and to higher effectivestate unemployment tax rates in various states in which the Company operates as compared to the second quarter of 2010. Managementexpects the trend in payroll taxes and benefits, as a percentage of revenues, to continue to increase as a result of continued growth in PEOservices on a quarter over quarter basis.
Workers’ compensation expense, as a percentage of revenues, increased from 12.8% in the second quarter of 2010 to 14.1% in thesecond quarter of 2011. Workers’ compensation expense for the second quarter of 2011 totaled $10.8 million, compared to $8.6 million forthe second quarter of 2010. The increase was primarily due to an increase in the number of injury claims incurred during the 2011 secondquarter.
- 22 -
Item 2. Management’s Discussion and Analysis of Financial Condition and Results of Operations (Continued) Results of Operations (Continued) Three months ended June 30, 2011 and 2010 (Continued)
Selling, general and administrative (“SG&A”) expenses for the second quarter of 2011 totaled approximately $8.9 million, an increaseof $464,000 or 5.5% over the second quarter of 2010. The increase was primarily attributable to increases in management payroll, legalexpenses and stock-based compensation expense.
Other income for the second quarter of 2011 was $266,000 compared to other income of $380,000 for the second quarter of 2010.Other income for the 2011 second quarter was primarily attributable to investment income earned on the Company’s cash and marketablesecurities. The second quarter of 2010 included gains of approximately $200,000 on the sale of certain marketable securities.
The income tax rate for the 2011 second quarter was 20.6% which included a favorable benefit from the effect of a much lower annualeffective tax rate attributable to the non-taxable $10.0 million life insurance proceeds from a key man life insurance policy the Companycarried on William W. Sherertz, the Company’s President and Chief Executive Officer, who passed away January 20, 2011. We expect theeffective income tax rate for the balance of 2011 to remain at a rate similar to the 2011 second quarter income tax rate.
Six months ended June 30, 2011 and 2010Net income for the six months ended June 30, 2011 amounted to $9.0 million, an improvement of $8.4 million over the net income of
$556,000 for the second quarter of 2010. The improvement for the first six months ended June 30, 2011 was primarily due to the $10.0million life insurance proceeds as well as a 15.2% increase in revenues. Diluted earnings per share for the first six months ended June 30,2011 was $.88 compared to diluted earnings per share of $.05 for the comparable 2010 period.
Revenues for the six months ended June 30, 2011 totaled $144.8 million, an increase of approximately $19.1 million or 15.2%, whichreflects an increase in the Company’s PEO service fee revenue of $19.3 million or 28.9% offset in part by a small decline in staffingservices revenue of $187,000 or 0.3%. Our growth in PEO revenues was primarily attributable to new customers as PEO business fromnew customers during the first six months of 2011 tripled our lost PEO business from former customers compared to the first six months of2010. PEO revenues from continuing customers reflected a 4.9% increase on a comparable six month basis. Staffing revenues decreasedslightly as a result of lost business from former customers, offset in part by new staffing business during the first six months of 2011.
Gross margin for the six months ended June 30, 2011 totaled approximately $18.9 million or an increase of $1.8 million over thecomparable period of 2010, primarily due to the 15.2% increase in revenues and a decline in direct payroll costs, partially offset by higherpayroll taxes and benefits and workers’ compensation expense, as a percentage of revenues.
- 23 -
Item 2. Management’s Discussion and Analysis of Financial Condition and Results of Operations (Continued) Results of Operations (Continued) Six months ended June 30, 2011 and 2010 (Continued)
The decrease in direct payroll costs, as a percentage of revenues, from 35.5% for the second quarter of 2010 to 30.8% for the first sixmonths of 2011 was primarily due to the increase in our mix of PEO services in the Company’s customer base over the 2010 six-monthperiod and the effect of each customer’s unique mark-up percent.
Payroll taxes and benefits, as a percentage of revenues, for the six months ended June 30, 2011 was 41.9% compared to 37.8% for thecomparable period of 2010. The percentage rate increase was largely due to the effect of significant growth in PEO services and to highereffective state unemployment tax rates in the majority of states in which the Company operates as compared to the same period of 2010.
Workers’ compensation expense, as a percentage of revenues, increased from 13.1% in the first six months of 2010 to 14.3% in thefirst six months of 2011. Workers’ compensation expense for the first six months of 2011 totaled $20.7 million, compared to $16.4 millionfor the first six months of 2010. The increase was primarily due to an increase in the number of injury claims incurred during the first sixmonths of 2011.
SG&A expenses for the first six months of 2011 totaled approximately $17.7 million, an increase of $1.1 million or 6.4% over thefirst six months of 2010. The increase was primarily attributable to increases in management payroll, travel and legal expenses.
Other income for the first six months of 2011 was $10.7 million compared to other income of $665,000 for the first six months of2010. The first six months of 2011 included the $10.0 million of life insurance proceeds and higher investment income, as compared to the2010 period.
The income tax rate for the first six months of 2011 was 19.9% which included a favorable benefit from the effect of the non-taxable$10.0 million life insurance proceeds. The income tax rate for the first six months of 2010 was 32.1%. The first six months of 2010included an additional benefit primarily from a reduction to a deferred tax asset allowance as sales of certain closed-end bond funds duringthe first six months of 2010 allowed the Company to apply current year capital losses to 2009 capital gains.
- 24 -
Item 2. Management’s Discussion and Analysis of Financial Condition and Results of Operations (Continued) Factors Affecting Quarterly Results
The Company has historically experienced significant fluctuations in its quarterly operating results and expects such fluctuations tocontinue in the future. The Company’s operating results may fluctuate due to a number of factors such as seasonality, wage limits onstatutory payroll taxes, claims experience for workers’ compensation, demand and competition for the Company’s services and the effect ofacquisitions. The Company’s revenue levels may fluctuate from quarter to quarter primarily due to the impact of seasonality on its staffingservices business and on certain of its PEO clients in the agriculture, food processing and construction-related industries. As a result, theCompany may have greater revenues and net income in the third quarter of its fiscal year. Revenue levels in the fourth quarter may beaffected by many customers’ practice of operating on holiday-shortened schedules. Payroll taxes and benefits fluctuate with the level ofdirect payroll costs, but tend to represent a smaller percentage of revenues and direct payroll later in the Company’s fiscal year as federaland state statutory wage limits for unemployment and social security taxes are exceeded on a per employee basis. Workers’ compensationexpense varies with both the frequency and severity of workplace injury claims reported during a quarter and the estimated future costs ofsuch claims. Adverse loss development of prior period claims during a subsequent quarter may also contribute to the volatility in theCompany’s estimated workers’ compensation expense.
Liquidity and Capital ResourcesThe Company’s cash position for the six months ended June 30, 2011 decreased $5.5 million from December 31, 2010, which
compares to a decrease of $19.2 million for the comparable period in 2010. The decrease in cash at June 30, 2011 as compared toDecember 31, 2010, was primarily due to net purchases of marketable securities of $14.1 million and $1.8 million used to pay cashdividends, offset in part by net income of $9.0 million.
Net cash provided by operating activities for the six months ended June 30, 2011 amounted to $12.5 million compared to $1.6 millionof net cash provided by operations for the comparable 2010 period. For the six months ended June 30, 2011, cash flow was principallyprovided by net income of $9.0 million together with increases in accrued payroll, payroll taxes and benefits of $22.8 million and increasesin workers’ compensation claims liabilities of $1.8 million, partially offset by an increase in accounts receivable of $22.1 million.
Net cash used in investing activities for the six months ended June 30, 2011 was $15.2 million as compared to $17.0 million of netcash used in investing activities for the similar 2010 period. For the 2011 period, cash from investing activities was principally used for thepurchase of marketable securities totaling $32.7 million and the purchases of restricted marketable securities of $4.0 million, partially offsetby the proceeds from the sales and maturities of marketable securities of $18.6 million and $3.4 million from the proceeds of restrictedmarketable securities. The transactions related to restricted marketable securities were scheduled maturities and the replacement of suchsecurities held for workers’ compensation surety deposit purposes. The Company presently has no material long-term capital commitments.
Net cash used in financing activities for the six months ended June 30, 2011 was $2.7 million as compared to $3.8 million for thesimilar 2010 period. For the 2011 period, the primary uses of cash for financing activities were the payment of regular quarterly cashdividends totaling $1.8 million to holders of the Company’s common stock and repurchases of the Company’s common stock totaling$923,000.
The Company’s business strategy continues to focus on growth through the expansion of operations at existing offices, together withthe selective acquisition of additional personnel-related business, both in its existing markets and other strategic geographic markets. TheCompany periodically evaluates proposals for various acquisition opportunities, but there can be no assurance that any additionaltransactions will be consummated.
- 25 -

Item 2. Management’s Discussion and Analysis of Financial Condition and Results of Operations (Continued) Liquidity and Capital Resources (Continued)
The Company is a party to a Standby Letter of Credit Agreement dated as of June 30, 2009 (the “Credit Agreement”) with itsprincipal bank. The Credit Agreement provides for standby letters of credit as to which there were $6.7 million outstanding at June 30, 2011in connection with various surety deposit requirements for workers’ compensation purposes.
Pursuant to the Credit Agreement, the Company is required to maintain compliance with the following covenants: (1) to maintain netincome after taxes not less than $1.00 (one dollar) on an annual basis, determined as of each fiscal year end; (2) to maintain liquid assets(defined as unencumbered cash, cash equivalents, and publicly traded and quoted marketable securities) having an aggregate fair marketvalue at all times not less than $10.0 million, determined as of the end of each fiscal quarter; and (3) to not borrow or permit to existindebtedness (other than from or to the bank), or mortgage, pledge, grant, or permit to exist a security interest in, or a lien upon, all or anyportion of the Company’s assets now owned or hereafter acquired, except for purchase money indebtedness (and related security interests)which does not at any time exceed $500,000. The Company was in compliance with all financial covenants at June 30, 2011.
Management expects that current liquid assets and the funds anticipated to be generated from operations will be sufficient in theaggregate to fund the Company’s working capital needs for the next twelve months.
InflationInflation generally has not been a significant factor in the Company’s operations during the periods discussed above. The Company
has taken into account the impact of escalating medical and other costs in establishing reserves for future expenses for self-insured workers’compensation claims.
- 26 -
Item 2. Management’s Discussion and Analysis of Financial Condition and Results of Operations (Continued) Forward-Looking Information
Statements in this report which are not historical in nature, including discussion of economic conditions in the Company’s marketareas and effect on revenue levels, the potential for and effect of past and future acquisitions, the effect of changes in the Company’s mix ofservices on gross margin, the adequacy of the Company’s workers’ compensation reserves and the effect of changes in estimate of itsclaims liabilities, the adequacy of the Company’s allowance for doubtful accounts, the effect of the Company’s formation and operation oftwo wholly owned, fully licensed captive insurance subsidiaries and becoming self-insured for certain business risks, the financial viabilityof the Company’s excess insurance carriers, the effectiveness of the Company’s management information systems, payment of futuredividends, and the availability of financing and working capital to meet the Company’s funding requirements, are forward-lookingstatements within the meaning of the Private Securities Litigation Reform Act of 1995. Such forward-looking statements involve knownand unknown risks, uncertainties and other factors that may cause the actual results, performance or achievements of the Company orindustry to be materially different from any future results, performance or achievements expressed or implied by such forward-lookingstatements. Such factors with respect to the Company include the ability to retain current customers and attract new customers, difficultiesassociated with integrating acquired businesses and clients into the Company’s operations, economic trends in the Company’s service areas,material deviations from expected future workers’ compensation claims experience, the effect of changes in the workers’ compensationregulatory environment in one or more of the Company’s primary markets, collectibility of accounts receivable, the carrying values ofdeferred income tax assets and goodwill, which may be affected by the Company’s future operating results, the availability of capital orletters of credit necessary to meet state-mandated surety deposit requirements for maintaining the Company’s status as a qualified self-insured employer for workers’ compensation coverage, and the use of $70.2 million in cash and marketable securities, among others. TheCompany disclaims any obligation to update any such factors or to publicly announce the result of any revisions to any of the forward-looking statements contained herein to reflect future events or developments. Item 3. Quantitative and Qualitative Disclosures About Market Risk
The Company’s exposure to market risk for changes in interest rates primarily relates to its investment portfolio of liquid assets. As ofJune 30, 2011, the Company’s investment portfolio consisted principally of approximately $19.3 million in tax-exempt money marketfunds, $21.3 million in tax-exempt municipal bonds with an average maturity of 137 days, and approximately $28.8 million in corporatebonds. Based on the Company’s overall interest exposure at June 30, 2011, a 100 basis point increase in market interest rates would nothave a material effect on the fair value of the Company’s investment portfolio of liquid assets or its results of operations because of thepredominantly short maturities of the securities within the investment portfolio. Item 4. Controls and ProceduresEvaluation of Disclosure Controls and Procedures
As of June 30, 2011 the Company carried out an evaluation, under the supervision and with the participation of the Company’smanagement, including the Company’s Chief Executive Officer and Chief Financial Officer, of the effectiveness of the design andoperation of the Company’ disclosure controls and procedures, as defined in Rule 13a-15(e) and 15d-15(e) of the Securities Exchange Actof 1934. Based on the evaluation, the Company’s Chief Executive Officer and Chief Financial Officer have concluded that the Company’sdisclosure controls and procedures are effective to ensure that information required to be disclosed by the Company in the reports it files orsubmits under the Securities Exchange Act of 1934 is recorded, processed, summarized and reported within the time periods specified inSecurities and Exchange Commission rules and forms and is accumulated and communicated to our management as appropriate to allowtimely decisions regarding required disclosure.
- 27 -
Item 4. Controls and Procedures (Continued) Previously Reported Material Weakness in Internal Control over Financial Reporting
A material weakness is a deficiency, or a combination of deficiencies, in internal control over financial reporting, such that there is areasonable possibility that a material misstatement of the Company’s annual or interim financial statements will not be prevented ordetected on a timely basis. In connection with management’s assessment of our internal control over financial reporting, we had identified amaterial weakness in our internal control over financial reporting as of December 31, 2010 as described below.
Previously Reported Material Weakness: The Company did not have effective controls to provide assurance as to the appropriateselection and implementation of accounting methods with respect to accounting for its legal fees incurred by its captive insurancesubsidiary for the administration of workers’ compensation claims. This material weakness resulted in the adjustment of workers’compensation claims liabilities, deferred taxes, workers’ compensation expense (which is a component of cost of revenues), and income taxexpense. The restatement of certain periods of the Company’s consolidated financial statements is included in our Annual Report on Form10-K for the year ended December 31, 2010 and in Item 1 of Part I of this report.
As a result of the material weakness in internal control over financial reporting described above, management concluded that theCompany’s internal control over financial reporting was not effective as of December 31, 2010 based on the criteria in Internal Control —Integrated Framework issued by the Committee of Sponsoring Organizations of the Treadway Commission.
For additional information regarding the restatements of certain of the Company’s historical financial results and the materialweakness identified by management, see “Item 9A. Controls and Procedures” in the Company’s Annual Report on Form 10-K for the yearended December 31, 2010, filed on April 1, 2011 with the Securities and Exchange Commission.
Changes in Internal Control Over Financial ReportingThere have been no changes in the Company’s internal control over financial reporting that occurred during the Company’s most
recent fiscal quarter that has materially affected, or is reasonably likely to materially affect, the Company’s internal control over financialreporting, except for the remediation steps to address the material weakness in its internal control over financial reporting described above.Specifically, the following steps are being implemented:
• Management has formalized the Company’s process for reviewing, approving and updating its accounting policies;
• Management has formalized the Company’s process for reviewing and establishing appropriate accounting policies when
forming a new subsidiary; and
• Management has implemented steps to improve the industry specific accounting knowledge of the Company’s accounting
personnel.
- 28 -

Item 4. Controls and Procedures (Continued) Changes in Internal Control Over Financial Reporting (Continued)
Under the direction of the Audit Committee, management will continue to review and make any changes it deems necessary to theoverall design of the Company’s internal control over financial reporting, including implementing improvements in policies andprocedures.
We are committed to a strong internal control environment, and believe that, when fully implemented, these remediation actions willrepresent significant improvements in the Company’s accounting function. The Company anticipates that it will complete its testing of theadditional internal control processes designed to remediate this material weakness prior to the end of 2011. We will continue to assess theeffectiveness of our remediation efforts in connection with management’s future evaluations of internal control over financial reporting.
- 29 -

Part II – Other Information
Item 1A. Risk FactorsThere have been no material changes in our risk factors from those disclosed in our 2010 Annual Report on Form 10-K.
Item 2. Unregistered Sales of Equity Securities and Use of Proceeds
The following table summarizes information related to stock repurchases during the quarter ended June 30, 2011.
Month
TotalNumber of
SharesRepurchased
Average PricePaid
Per Share
Total Number ofShares Repurchased
as Part of PubliclyAnnounced Plan (1)
Maximum Number ofShares that May Yet
Be RepurchasedUnder the Plan (1)
April 0 $ 0 0 1,543,600May 0 0 0 1,543,600June 61,398 14.13 61,398 1,482,200
Total 61,398 61,398
(1) In November 2006, the Board adopted a stock repurchase program and authorized the repurchase of up to 500,000 shares of the
Company’s stock from time to time in open market purchases. In November 2007, the Board approved an increase in the authorizedshares to be repurchased up to 1.0 million shares. In October 2008, the Board approved a second increase in the authorized shares to berepurchased up to 3.0 million shares.
Item 6. Exhibits
The exhibits filed with this report are listed in the Exhibit Index following the signature page of this report.
- 30 -

SIGNATURES
Pursuant to the requirements of the Securities Exchange Act of 1934, the Registrant has duly caused this report to be signed on itsbehalf by the undersigned thereunto duly authorized.
BARRETT BUSINESS SERVICES, INC.(Registrant)
Date: August 9, 2011 /s/ James D. Miller James D. Miller Vice President-Finance, Treasurer and Secretary (Principal Financial and Accounting Officer)
- 31 -

EXHIBIT INDEX Exhibit
31.1 Certification of the Chief Executive Officer under Rule 13a-14(a).
31.2 Certification of the Chief Financial Officer under Rule 13a-14(a).
32 Certification pursuant to 18 U.S.C. Section 1350.
101. INS XBRL Instance Document *
101. SCH XBRL Taxonomy Extension Schema Document *
101. CAL XBRL Taxonomy Extension Calculation Linkbase Document *
101. LAB XBRL Taxonomy Extension Label Linkbase Document *
101. PRE XBRL Taxonomy Extension Presentation Linkbase Document * * Pursuant to Rule 406T of Regulation S-T, these interactive data files are deemed not filed or part of a registration statement or prospectus
for purposes of Sections 11 or 12 of the Securities Act of 1933, as amended, or Section 18 of the Securities Exchange Act of 1934, asamended, and otherwise are not subject to liability under those sections.
- 32 -
Certification of the Chief Executive Officer under Rule 13a-14(a)EXHIBIT 31.1
I, Michael L. Elich, certify that:
1. I have reviewed this Quarterly Report on Form 10-Q of Barrett Business Services, Inc.;
2. Based on my knowledge, this quarterly report does not contain any untrue statement of a material fact or omit to state a material
fact necessary to make the statements made, in light of the circumstances under which such statements were made, not misleadingwith respect to the period covered by this quarterly report;
3. Based on my knowledge, the financial statements, and other financial information included in this quarterly report, fairly present
in all material respects the financial condition, results of operations and cash flows of the Registrant as of, and for, the periodspresented in this report;
4. The Registrant’s other certifying officer and I are responsible for establishing and maintaining disclosure controls and procedures
(as defined in Exchange Act Rules 13a-15(e) and 15d-15(e)) and internal control over financial reporting (as defined in ExchangeAct Rules 13a-15(f) and 15d-15(f)) for the Registrant and have:
a. designed such disclosure controls and procedures, or caused such disclosure controls and procedures to be designed under
our supervision, to ensure that material information relating to the Registrant, including its consolidated subsidiaries, ismade known to us by others within those entities, particularly during the period in which this report is being prepared;
b. designed such internal control over financial reporting, or caused such internal control over financial reporting to be
designed under our supervision, to provide reasonable assurance regarding the reliability of financial reporting and thepreparation of financial statements for external purposes in accordance with generally accepted accounting principles;
c. evaluated the effectiveness of the Registrant’s disclosure controls and procedures and presented in this report our
conclusions about the effectiveness of the disclosure controls and procedures, as of the end of the period covered by thisreport, based on such evaluation; and
d. disclosed in this report any change in the Registrant’s internal control over financial reporting that occurred during theRegistrant’s most-recent fiscal quarter (the registrant’s fourth fiscal quarter in the case of an annual report) that hasmaterially affected, or is reasonably likely to materially affect, the Registrant’s internal control over financial reporting;and
5. The Registrant’s other certifying officer and I have disclosed, based on our most recent evaluation of internal control over
financial reporting, to the Registrant’s auditors and the audit committee of the Registrant’s board of directors (or personsperforming the equivalent functions):
a. all significant deficiencies and material weaknesses in the design or operation of internal control over financial reporting
which are reasonably likely to adversely affect the Registrant’s ability to record, process, summarize and report financialinformation; and
b. any fraud, whether or not material, that involves management or other employees who have a significant role in the
Registrant’s internal control over financial reporting. Date: August 9, 2011 /s/ Michael L. Elich
Michael L. Elich Chief Executive Officer
Certification of the Chief Financial Officer under Rule 13a-14(a)EXHIBIT 31.2
I, James D. Miller, certify that:
1. I have reviewed this Quarterly Report on Form 10-Q of Barrett Business Services, Inc.;
2. Based on my knowledge, this quarterly report does not contain any untrue statement of a material fact or omit to state a material
fact necessary to make the statements made, in light of the circumstances under which such statements were made, not misleadingwith respect to the period covered by this quarterly report;
3. Based on my knowledge, the financial statements, and other financial information included in this quarterly report, fairly present
in all material respects the financial condition, results of operations and cash flows of the Registrant as of, and for, the periodspresented in this report;
4. The Registrant’s other certifying officer and I are responsible for establishing and maintaining disclosure controls and procedures
(as defined in Exchange Act Rules 13a-15(e) and 15d-15(e)) and internal control over financial reporting (as defined in ExchangeAct Rules 13a-15(f) and 15d-15(f)) for the Registrant and have:
a. designed such disclosure controls and procedures, or caused such disclosure controls and procedures to be designed under
our supervision, to ensure that material information relating to the Registrant, including its consolidated subsidiaries, ismade known to us by others within those entities, particularly during the period in which this report is being prepared;
b. designed such internal control over financial reporting, or caused such internal control over financial reporting to be
designed under our supervision, to provide reasonable assurance regarding the reliability of financial reporting and thepreparation of financial statements for external purposes in accordance with generally accepted accounting principles;
c. evaluated the effectiveness of the Registrant’s disclosure controls and procedures and presented in this report our
conclusions about the effectiveness of the disclosure controls and procedures, as of the end of the period covered by thisreport, based on such evaluation; and
d. disclosed in this report any change in the Registrant’s internal control over financial reporting that occurred during theRegistrant’s most-recent fiscal quarter (the registrant’s fourth fiscal quarter in the case of an annual report) that hasmaterially affected, or is reasonably likely to materially affect, the Registrant’s internal control over financial reporting;and
5. The Registrant’s other certifying officer and I have disclosed, based on our most recent evaluation of internal control over
financial reporting, to the Registrant’s auditors and the audit committee of the Registrant’s board of directors (or personsperforming the equivalent functions):
a. all significant deficiencies and material weaknesses in the design or operation of internal control over financial reporting
which are reasonably likely to adversely affect the Registrant’s ability to record, process, summarize and report financialinformation; and
b. any fraud, whether or not material, that involves management or other employees who have a significant role in the
Registrant’s internal control over financial reporting. Date: August 9, 2011 /s/ James D. Miller
James D. Miller Chief Financial Officer

EXHIBIT 32
CERTIFICATION PURSUANT TO18 U.S.C. SECTION 1350
In connection with the Quarterly Report of Barrett Business Services, Inc. (the “Company”) on Form 10-Q for the period ended June 30,2011 as filed with the Securities and Exchange Commission on the date hereof (the “Report”), the undersigned certify, pursuant to 18U.S.C. § 1350, that:
(1) The Report fully complies with the requirements of section 13(a) or 15(d) of the Securities Exchange Act of 1934; and
(2) The information contained in the Report fairly presents, in all material respects, the financial condition and results of operations ofthe Company. /s/ Michael L. Elich /s/ James D. Miller Michael L. Elich James D. Miller Chief Executive Officer Chief Financial Officer August 9, 2011 August 9, 2011
A signed original of this written statement required by Section 906 has been provided to Barrett Business Services, Inc. and will be retainedby Barrett Business Services, Inc. and furnished to the Securities and Exchange Commission or its staff upon request.