barrick gold corpd1lge852tjjqow.cloudfront.net/cik-0000756894/e451e6c0-b18d-40ec... · form 6-k...
TRANSCRIPT

BARRICK GOLD CORP
FORM 6-K(Report of Foreign Issuer)
Filed 08/03/07 for the Period Ending 08/02/07
Telephone 4163077470
CIK 0000756894Symbol ABX
SIC Code 1040 - Gold And Silver OresIndustry Gold & Silver
Sector Basic MaterialsFiscal Year 12/31
http://www.edgar-online.com© Copyright 2015, EDGAR Online, Inc. All Rights Reserved.
Distribution and use of this document restricted under EDGAR Online, Inc. Terms of Use.

FORM 6-K
BARRICK GOLD CORP
(Report of Foreign Issuer)
Filed 8/3/2007 For Period Ending 8/2/2007
Address BCE PLACE, CANADA TRUST TOWER 161 BAY STREET SUITE 3700
TORONTO ONTARIO CANA, M5J2S1
Telephone 416-307-7470
CIK 0000756894
Industry Gold & Silver
Sector Basic Materials
Fiscal Year 12/31


SECURITIES AND EXCHANGE COMMISSION Washington, DC 20549
Form 6-K
Report of Foreign Private Issuer Pursuant to Rule 13a-16 or 15d-16 of the Securities Exchange Act of 1934
BARRICK GOLD CORPORATION (Name of Registrant)
BCE Place, Canada Trust Tower Suite 3700
161 Bay Street, P.O. Box 212 Toronto, Ontario Canada M5J 2S1
(Address of Principal Executive Offices)
Indicate by check mark whether the registrant files or will file annual reports under cover of Form 20-F or Form 40-F:
Form 20-F � Form 40-F �
Indicate by check mark if the registrant is submitting the Form 6-K in paper as permitted by Regulation S-T Rule 101(b)(1): �
Indicate by check mark if the registrant is submitting the Form 6-K in paper as permitted by Regulation S-T Rule 101(b)(7): �
Indicate by check mark whether by furnishing the information contained in this Form, the registrant is also thereby furnishing the information to the Commission pursuant to Rule 12g3-2(b) under the Securities Exchange Act of 1934:
Yes � No �
If “Yes” is marked, indicate below the file number assigned to the registrant in connection with Rule 12g3-2(b): N/A
For the month of: August 2007 Commission File Number: 1-9059

INCORPORATION BY REFERENCE
The comparative unaudited interim consolidated financial statements of the Registrant and the notes thereto for the quarter ended June 30, 2007 prepared in accordance with U.S. generally accepted accounting principles, together with management’s discussion and analysis for the quarter ended June 30, 2007, (contained on pages 6 to 59 of Exhibit 99.1 of this Form 6-K Commission File No. 1-9059) furnished to the Commission August 3, 2007, are incorporated by reference into the Registrant’s registration statement on Form F-3 (No. 333-14148).
SIGNATURES
Pursuant to the requirements of the Securities Exchange Act of 1934, the registrant has duly caused this report to be signed on its behalf by the undersigned, thereunto duly authorized.
BARRICK GOLD CORPORATION Date: August 3, 2007 By: /s/ Sybil E. Veenman
Name: Sybil E. Veenman Title: Vice President, Assistant General Counsel and Secretary

EXHIBIT
Exhibit Description of Exhibit 99.1
Barrick Gold Corporation Second Quarter Report for 2007, including the Comparative Unaudited Financial Statements prepared in accordance with U.S. generally accepted accounting principles (“US GAAP”) and the notes thereto for the quarter ended June 30, 2007 and Management’s Discussion and Analysis (US GAAP) for the same period.

Exhibit 99.1
SECOND QUARTER REPORT 2007 – AUGUST 1, 2007 Based on US GAAP and expressed in US dollars
Barrick Reports Strong Q2 Earnings of $396 Million ($0.46 Per Share) Results Continue to Demonstrate Leverage to Gold Price
Highlights
Barrick Gold Corporation reported Q2 production of 1.96 million ounces of gold at total cash costs of $345 per ounce compared to 2.09 million ounces produced at total cash costs of $280 per ounce for the prior-year period.
As a result of Barrick’s decision in Q1 to fully eliminate its Corporate Gold Sales Contracts, net income was reduced by $66 million ($0.08 per share) on an after-tax basis in Q2. Consequently, the Company reported earnings of $396 million ($ 0.46 per share) and cash flow of $336 million ($0.39 per share). Operating cash flow was also impacted by the timing of a number of large tax payments during the quarter for the current and prior year.
Adjusted earnings of $462 million ($0.54 per share) compare to prior year adjusted net income of $459 million ($0.53 per share). Adjusted EBITDA of $812 million ($0.94 per share) compares to prior year adjusted EBITDA of $758 million ($ 0.88 per share).
“Our Q2 results are a clear demonstration of Barrick’s ability to deliver superior earnings and cash flow leverage in this strong gold price environment”, said Greg Wilkins, President and CEO. “The ability to capture spot prices, combined
For a full explanation of results, the Financial St atements and Management Discussion & Analysis, full -year guidance at significant mines, and mine statistics, please s ee the Company’s website, www.barrick.com .
• The Company reported second quarter earnings of $396 million ($0.46 per share) and operating cash flow of $336 million ($0.39 per share), including an after-tax charge of $66 million for elimination of the remaining 0.5 million ounces of Corporate Gold Sales Contracts in April. Excluding this impact, adjusted earnings were $462 million ($0.54 per share) 1 and adjusted operating cash flow was $408 million ($0.47 per share) 1 . Barrick is now selling all of its production from existing mines at prevailing market prices.
• Operating cash flow for the quarter was further impacted by the timing of a number of large tax payments for the current and prior year. Adjusted EBITDA was $812 million ($0.94 per share) 1 , a 7% increase over the prior year period.
• Gold production in the second quarter was 1.96 million ounces at total cash costs of $345 per ounce 2 , and copper production was 101 million pounds at total cash costs of $0.77 per pound. Barrick remains on track with its 2007 full year guidance of producing 8.1 to 8.4 million ounces of gold at total cash costs of $335 to $350 per ounce and 400 million pounds of copper at total cash costs of about $0.90 per pound.
• A construction decision has been made on the Buzwagi project in Tanzania following approval by the Tanzanian government of the Environmental Impact Assessment in May. Buzwagi is expected to produce 250,000-260,000 ounces in the first five years at total cash costs of $270-$280 per ounce after a two year construction period. Significant progress was made during the quarter on Barrick’s extensive project pipeline.
1 Net income, earnings per share, operating cash flow, operating cash flow per share, EBITDA and EBITDA per share, each excluding the impact of the elimination of the Corporate Gold Sales Contracts, are non-GAAP financial measures. For further information on these performance measures, see page 29-31 of the Company’s MD&A.
2 Total cash costs per ounce/pound is defined as cost of sales divided by ounces of gold sold or pounds of copper sold. Total cash costs per ounce/pound exclude amortization expense and inventory purchase accounting adjustments. For further information on this operating performance measure see pages 32 to 34 of the Company’s MD&A.
BARRICK SECOND QUARTER 2007 PRESS RELEASE

with our tight focus on cost control, is generating strong margins.” The Company remains positive on the outlook for the gold market, which continues to be underpinned by supportive supply/demand fundamentals.
PRODUCTION AND COSTS
In Q2 2007, Barrick produced 1.96 million ounces of gold at total cash costs of $345 per ounce, highlighted by continued strong performance from our New Generation of Mines, particularly at Lagunas Norte. The realized gold price was $624 per ounce 3 , 62% higher than the first quarter, including the impact of delivering into the hedge position in the first and second quarters. Barrick’s operating mines are now fully unhedged and the Company is selling all of its production at spot prices.
The Company also produced 101 million pounds of copper at total cash costs of $0.77 per pound during Q2 2007 versus 100 million pounds at total cash costs of $0.76 per pound in the prior year quarter. The average realized price for copper sales in Q2 2007 was $3.43 per pound 3 .
Due to mine sequencing this year, mainly at Goldstrike and Veladero, average processed grades are about 12% below reserve grade year-to-date, and this effect is anticipated to continue for the balance of the year, representing one of the major factors in the increase in 2007 cash costs over 2006. Over the next few years, the Company expects a trend back towards reserve grade to help mitigate other cash cost pressures.
The South American business unit generated another quarter of strong results, producing 0.46 million ounces of gold at total cash costs of $214 per ounce, including 0.29 million ounces from the Lagunas Norte mine in Peru at total cash costs of $91 per ounce. Year-to-date operating performance at Lagunas Norte has exceeded expectations; however, mining is expected to occur in lower grade areas of the pit in the second half, resulting in expected higher cash costs. Increased waste stripping at Veladero resulted in the processing of lower grade stockpiles, and production was also impacted by adverse winter weather conditions, which resulted in fewer tonnes placed on the pad. The Zaldívar mine in Chile continued to provide strong cash flow, producing 78 million pounds of copper at total cash costs of $0.67 per pound.
The North American business unit contributed 0.83 million ounces at total cash costs of $352 per ounce. The Goldstrike complex produced 0.44 million ounces at cash costs of $352 as mine sequencing accessed higher grade areas of the open pit and the underground operation returned to near expected levels after a transition to zone mining earlier in the year. The Company expects to process lower grade stockpiles at Goldstrike in the latter half of the year as the open pit begins a high waste stripping phase. The new Ruby Hill mine continued its smooth start-up, producing 38,000 ounces at total cash costs of $169 per ounce. Production from the Cortez JV was above plan on higher leached tons, while total cash costs were under plan at $337 per ounce. The Turquoise Ridge mine began obtaining electric power from Barrick’s Western 102 plant on April 1, reducing its power costs in Q2.
The Australia-Pacific business unit produced 0.51 million ounces at $452 per ounce. Cash costs in this region were negatively impacted by the strength in the Australian dollar; however, the Company has fully hedged this currency for the balance of the year. The average hedged rate for this period of 0.75 is significantly below the current exchange rate. The region was also affected by a ground movement in February at the Kanowna underground which affected sequencing and grades in the current quarter, a slower than anticipated conversion to underground operations at Granny Smith from equipment delays and manpower shortages, and an 11 day interruption at Porgera from storm damage to three power transmission towers. Throughput at Porgera was also affected by residual power restrictions from damage to the Hides power station in December 2006. The Cowal mill was modified during the quarter to treat harder sulphide ore, resulting in lower recoveries. Performance from the Australia-Pacific unit is
3 Realized gold and copper prices represent revenues under US GAAP, adjusted for unrealized gains and losses on non-hedge gold and copper derivatives. For further information on this performance measure see page 31 of the Company’s MD&A.
BARRICK SECOND QUARTER 2007 2 PRESS RELEASE
expected to improve in the second half with ramped up underground mining at Granny Smith, improved mill throughput at Cowal, completion of the West Wall cutback at Porgera and resolution of power issues that caused production interruptions in Papua New Guinea.
Production from the African business unit was 0.15 million ounces at total cash costs of $401 per ounce, reflecting continued effects of heavy rainfall in Tanzania in late 2006 and early 2007 that caused pit wall instability at North Mara and Tulawaka, and delayed commissioning of the CIL plant at Bulyanhulu (expected in Q3). Underground mining is expected to begin at Tulawaka in the third quarter, further extending the mine life, and a stronger second half is expected from North Mara with access to higher grade areas. In the longer term, lower cost hydro power is expected to reduce energy costs at North Mara once the mine site has access to national power.
PROJECTS UPDATE At Cortez Hills, $31 million (100% basis) was spent in Q2 on procurement of open pit mining equipment, construction of the cross-valley dewatering pipeline and development of the twin declines, which have progressed to 3,995 meters. Advanced engineering and procurement activities are more than 80% complete. Completion of the Environmental Impact Statement is expected later this year, with a Record of Decision targeted in the first half of 2008, followed by a 15-month construction period.
At Pueblo Viejo, a new discovery was made during the quarter at Monte Oculto. In addition, $20 million (100% basis) was spent in Q2 to advance project design and engineering, exploration, community development programs and evaluation of electric power sources. Work continues on recovering zinc contained within the gold reserves. Condemnation drilling has been completed under the proposed plant area. Discussions with the Dominican government are ongoing regarding the government’s relocation action plan, power, and water treatment.
At Pascua-Lama, work continues to conclude agreements with the governments of Chile and Argentina to resolve fiscal matters and cross-border approvals, and submission of documentation has begun to obtain required administrative and sectoral permits. A construction start is tied to the finalization of these outstanding agreements and approvals, the timing of which remains uncertain and beyond our control. Environmental approval for up to a 34MW power plant in Chile has been received; engineering and contract development is proceeding and is expected to be supplemented with a 20MW wind farm for which the environmental review is in process.
A construction decision has been made on the Buzwagi project in Tanzania following government approval of the EIA in May. Detailed engineering is on schedule and is approximately 30% complete. Procurement activities for mining equipment, crushers and process equipment are proceeding and contract negotiations are underway for earthworks, transport and logistics, steel fabrication and concrete placement. After a two-year construction period, Buzwagi is expected to produce 250,000-260,000 ounces at total cash costs of $270-$280 per ounce in the first five years.
At the Donlin Creek project in Alaska, the feasibility study is progressing on schedule to be completed by November 2007. A total of 80,000 meters of core drilling is planned for 2007, of which approximately 36,500 meters was completed in the first half.
At the Kabanga JV in Tanzania, operator Xstrata is advancing a pre-feasibility study for completion by year end, with a 140,000 meter infill and exploration drill program approximately 50% complete and on plan. Mini-pilot plant testing has produced very encouraging preliminary results and additional testing is planned. A full feasibility study is expected to be completed in 2008.
A pre-feasibility study is well advanced at the near surface Sedibelo platinum project on the western limb of the Bushveld complex in South Africa and is expected to be completed by year end.
BARRICK SECOND QUARTER 2007 3 PRESS RELEASE

EXPLORATION UPDATE 4
Barrick’s 2007 exploration program is weighted towards resource additions and conversion at and around the mine sites while still maintaining a balanced portfolio in order to generate quality projects for the future.
At Cortez, 11 rigs were active and drilling continued on the Lower Zone, where an in fill and extensional drill program is underway to upgrade the current mineral inventory to a resource by year end. Results to date have confirmed the continuity and grade of mineralization and the 3,000 foot long zone remains open to the south and northwest. Planning has begun for underground drilling to commence in Q4. In addition, drill programs were underway to test other targets on the extensive Cortez property.
At Pueblo Viejo, 5 drill rigs were active and programs to test for extensions of mineralization were recently completed in the Monte Negro and Moore pit areas. At Monte Negro, a new zone of mineralization (Monte Oculto) was discovered northeast of the pit area in Q2. The mineralized body has been tested by 20 drill holes over an area of 500 x 300 meters. The Monte Oculto zone is deeper, open to the east and does not appear to connect with the Monte Negro orebody. An 11,000 meter follow up drill program is planned to further evaluate the extent of this mineralization. At West Moore, a 17,000 meter drill program has extended mineralization west of the pit and geological modeling is in progress.
A scoping study at Reko Diq and a resource update for the Western Porphyries are on schedule for completion in Q4 2007, and ongoing metallurgical test work has yielded promising recoveries. Definition drilling with 4 rigs is expected to upgrade the copper-gold resource at the Western Porphyries deposits by year end. The 69,000 meter program planned for 2007 is more than 80% complete and continues to confirm expected grades and continuity, and results from two deep test holes extend mineralization at depth. Greenfields exploration continues to demonstrate the district potential of the region.
CORPORATE DEVELOPMENT The agreement to acquire an additional 20 per cent interest in the Porgera mine in Papua New Guinea from Emperor Mines Limited for $250 million in cash is expected to close in Q3. Barrick is entitled to the production and the economic benefit of the acquired interest from the effective date of April 1, 2007.
The Company sold its entire 13.6 million share position in NovaGold and approximately 14.1 million shares or 75% of Gold Fields shares acquired from the sale of the 50% interest in South Deep during the quarter for an after-tax gain of $30 million ($ 0.03 per share).
CORPORATE SOCIAL RESPONSIBILITY Barrick plans to invest approximately $68 million in projects that will harness the advantages of clean energy and enhance existing power infrastructure. In Chile, the Company has submitted a proposal to build a $40 million, 20 megawatt state-of-the-art wind farm, located in the Punta Colorada area in the north. The project will help offset a fuel shortage and is consistent with the Chilean government’s efforts to promote the development of renewable energy sources.
“The Punta Colorada wind farm project is an investment in the power of innovation, and is an energy initiative that reduces greenhouse gases while improving the efficiency of our mines,” said Greg Wilkins.
In Tanzania, Barrick is financing a $28 million hydro-electric project to bring power to parts of the remote Mara region where the Company’s North Mara mine is located. The project is a partnership between Barrick and the Tanzanian government, and is in line with the government’s plan to bring electricity to 25 per cent of the population by 2010.
The Company is pleased to announce it has joined the Global Business Coalition (GBC) on HIV/AIDS, TB and Malaria, an alliance of 220 international companies leading the private sector
4 Barrick’s exploration programs are designed and conducted under the supervision of Robert Krcmarov, Vice President, Exploration of Barrick. For information on the geology, exploration activities generally, and drilling and analysis procedures on Barrick’s material properties, see Barrick’s most recent Annual Information Form/Form 40-F on file with Canadian provincial securities regulatory authorities and the US Securities and Exchange Commission.
BARRICK SECOND QUARTER 2007 4 PRESS RELEASE

fight against these three epidemics, and has implemented a range of multifaceted HIV/AIDS, TB and Malaria programs tailored to address local needs and priorities.
FINANCIAL POSITION At June 30, 2007, Barrick continued to have the industry’s strongest credit rating, with a cash balance of $2.6 billion and net debt of $0.6 billion. During the quarter, the Company repaid $649 million of maturing debt from existing cash balances and proceeds from the sale of investments. This strong liquidity enables the Company to fund its project pipeline without the need for equity dilution.
OUTLOOK The Company maintains its full year production guidance of 8.1 — 8.4 million ounces of gold and 400 million pounds of copper and total cash costs of $335 — $350 per ounce for gold and $0.90 per pound for copper. Second half cash costs for gold are expected to be higher than for Q2 due to the planned mix of production, including waste-stripping at Goldstrike and Veladero, and lower grades at Lagunas Norte from mine sequencing. Waste stripping is expected to end in Q3 at Veladero, which will contribute to Q4 being a stronger production quarter with lower cash costs than Q3.
Barrick now expects its 2007 exploration expense to be about $185 million, project development expense to be about $230 million, capex in the range of $1,100-$1,500 million and its tax rate to be about 27%. Second half project development and exploration expenses are expected to be weighted in the third quarter.
* * * * *
Barrick’s vision is to be the world’s best gold company by finding, acquiring, developing and producing quality reserves in a safe, profitable and socially responsible manner. Barrick’s shares are traded on the Toronto and New York stock exchanges.
BARRICK SECOND QUARTER 2007 5 PRESS RELEASE

Key Statistics
Three months ended Six months ended (in United States dollars) June 30, June 30, (Unaudited) 2007 2006 2007 2006
Operating Results Gold production (thousands of ounces) 1 1,957 2,085 3,986 4,041 Gold sold (thousands of ounces) 1 2,006 1,998 4,127 3,938 Per ounce data
Average spot gold price $ 667 $ 627 $ 658 $ 590 Average realized gold price 5 624 603 502 562 Total cash costs 2 345 280 329 282 Amortization 3 98 73 90 78 Total production costs 443 353 419 360
Copper production (millions of pounds) 101 100 201 172 Copper sold (millions of pounds) 106 98 197 177 Per pound data
Average spot copper price $ 3.47 $ 3.27 $ 3.07 $ 2.75 Average realized copper price 6 3.43 3.41 3.13 2.92 Total cash costs 2 0.77 0.76 0.79 0.76 Amortization 3 0.28 0.25 0.32 0.47 Total production costs 1.05 1.01 1.11 1.23
Financial Results (millions) Sales $ 1,642 $ 1,532 $ 2,731 $ 2,720 Net income 396 459 237 683 Operating cash flow 336 658 499 1,043 Per Share Data (dollars)
Net income (basic) 0.46 0.53 0.27 0.83 Net income (diluted) 0.45 0.53 0.27 0.82 Operating cash flow (basic) 0.39 0.76 0.58 1.27 Operating cash flow (diluted) 0.38 0.75 0.57 1.25
Weighted average basic common shares (millions) 865 863 865 820
Weighted average diluted common shares (millions) 4 877 878 877 835
As at As at June 30, December 31, 2007 2006
Financial Position (millions) Cash and equivalents $ 2,584 $ 3,043 Non-cash working capital 1,032 764 Long-term debt 3,181 3,244 Shareholders’ equity 14,330 14,199
1 Includes equity gold ounces in Tulawaka for 2006 and 2007 and South Deep for 2006 only. Production also includes equity gold ounces in Highland Gold Gold production also includes an additional 20% share of production from the Porgera mine from April 1, 2007 onwards.
2 Represents equity cost of goods sold plus royalties, production taxes and accretion expense, less by-product revenues, divided by equity ounces of gold sold or pounds of copper sold. For further information on this performance measure, refer to pages 32 to 34. Excludes amortization and inventory purchase accounting adjustments.
3 Represents equity amortization expense and inventory purchase accounting adjustments at the Company’s producing mines divided by equity ounces of gold sold or pounds of copper sold.
4 Fully diluted, includes dilutive effect of stock options and convertible debt.
5 Calculated as total gold sales divided by total ounces sold.
6 Realized prices represents gold and copper revenues under US GAAP, adjusted for unrealized gains and losses on non-hedge derivatives. For further information on this performance measure, refer to page 31.
BARRICK SECOND QUARTER 2007 6 SUMMARY INFORMATION
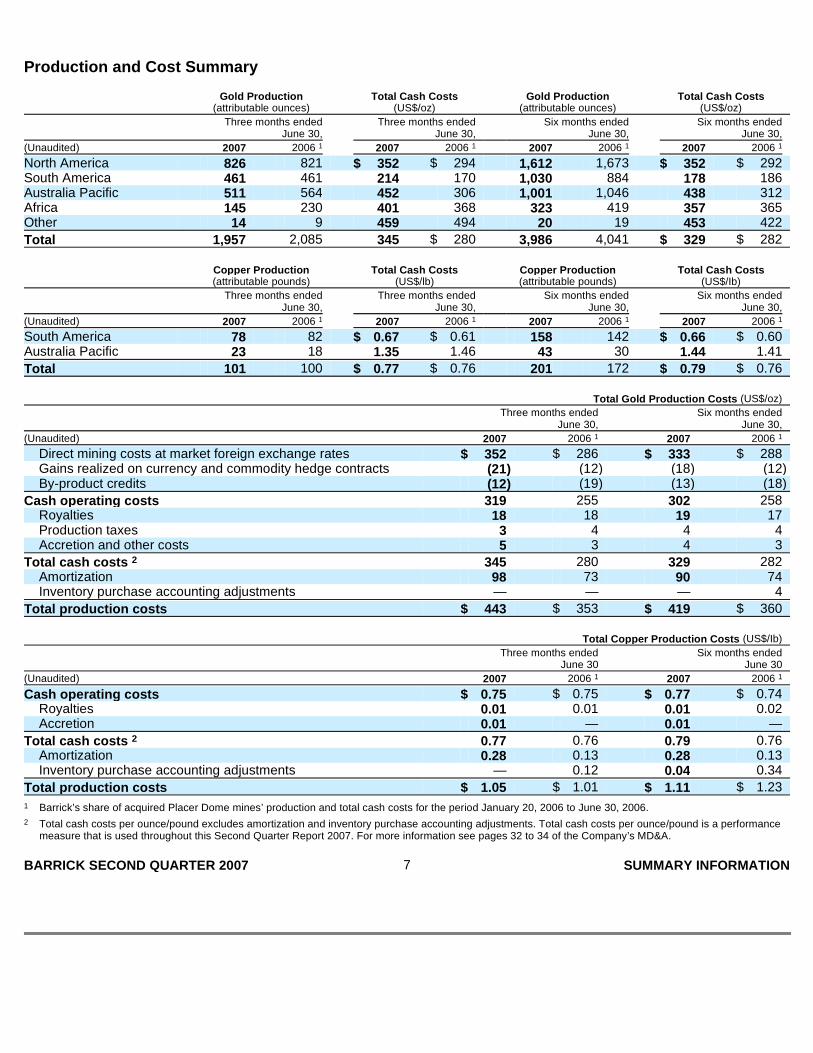
Production and Cost Summary
Gold Production Total Cash Costs Gold Production Total Cash Costs (attributable ounces) (US$/oz) (attributable ounces) (US$/oz)
Three months ended Three months ended Six months ended Six months ended June 30, June 30, June 30, June 30,
(Unaudited) 2007 2006 1 2007 2006 1 2007 2006 1 2007 2006 1
North America 826 821 $ 352 $ 294 1,612 1,673 $ 352 $ 292 South America 461 461 214 170 1,030 884 178 186 Australia Pacific 511 564 452 306 1,001 1,046 438 312 Africa 145 230 401 368 323 419 357 365 Other 14 9 459 494 20 19 453 422
Total 1,957 2,085 345 $ 280 3,986 4,041 $ 329 $ 282
Copper Production Total Cash Costs Copper Production Total Cash Costs (attributable pounds) (US$/lb) (attributable pounds) (US$/Ib)
Three months ended Three months ended Six months ended Six months ended June 30, June 30, June 30, June 30,
(Unaudited) 2007 2006 1 2007 2006 1 2007 2006 1 2007 2006 1
South America 78 82 $ 0.67 $ 0.61 158 142 $ 0.66 $ 0.60 Australia Pacific 23 18 1.35 1.46 43 30 1.44 1.41
Total 101 100 $ 0.77 $ 0.76 201 172 $ 0.79 $ 0.76
Total Gold Production Costs (US$/oz)
Three months ended Six months ended June 30, June 30,
(Unaudited) 2007 2006 1 2007 2006 1
Direct mining costs at market foreign exchange rates $ 352 $ 286 $ 333 $ 288 Gains realized on currency and commodity hedge contracts (21 ) (12 ) (18 ) (12 ) By-product credits (12 ) (19 ) (13 ) (18 )
Cash operating costs 319 255 302 258 Royalties 18 18 19 17 Production taxes 3 4 4 4 Accretion and other costs 5 3 4 3
Total cash costs 2 345 280 329 282 Amortization 98 73 90 74 Inventory purchase accounting adjustments — — — 4
Total production costs $ 443 $ 353 $ 419 $ 360
Total Copper Production Costs (US$/Ib)
Three months ended Six months ended June 30 June 30
(Unaudited) 2007 2006 1 2007 2006 1
Cash operating costs $ 0.75 $ 0.75 $ 0.77 $ 0.74 Royalties 0.01 0.01 0.01 0.02 Accretion 0.01 — 0.01 —
Total cash costs 2 0.77 0.76 0.79 0.76 Amortization 0.28 0.13 0.28 0.13 Inventory purchase accounting adjustments — 0.12 0.04 0.34
Total production costs $ 1.05 $ 1.01 $ 1.11 $ 1.23
1 Barrick’s share of acquired Placer Dome mines’ production and total cash costs for the period January 20, 2006 to June 30, 2006.
2 Total cash costs per ounce/pound excludes amortization and inventory purchase accounting adjustments. Total cash costs per ounce/pound is a performance measure that is used throughout this Second Quarter Report 2007. For more information see pages 32 to 34 of the Company’s MD&A.
BARRICK SECOND QUARTER 2007 7 SUMMARY INFORMATION

MANAGEMENT’S DISCUSSION AND ANALYSIS (“MD&A”)
This portion of the Quarterly Report provides MD&A of the financial condition and results of operations to enable a reader to assess material changes in financial condition and results of operations as at and for the three and six month periods ended June 30, 2007, in comparison to the corresponding prior-year period. This MD&A, which has been prepared as of August 1, 2007, is intended to supplement and complement the unaudited interim consolidated Financial Statements and notes thereto, prepared in accordance with US generally accepted accounting principles (“US GAAP”), for the three and six month periods ended June 30, 2007 (collectively, the “Financial Statements”), which are included in this Quarterly Report on pages 35 to 58. You are encouraged to review the Financial Statements in conjunction with your review of this MD&A. This MD&A should be read in conjunction with both the annual audited consolidated Financial Statements for the three years ended December 31, 2006, the related annual MD&A included in the 2006 Annual Report, and the most recent Form 40-F/Annual Information Form on file with the US Securities and Exchange Commission and Canadian provincial securities regulatory authorities. Certain notes to the Financial Statements are specifically referred to in this MD&A and such notes are incorporated by reference herein. All dollar amounts in this MD&A are in millions of US dollars, unless otherwise specified.
For the purposes of preparing our MD&A, we consider the materiality of information. Information is considered material if: (i) such information results in, or would reasonably be expected to result in, a significant change in the market price or value of our shares; or (ii) there is a substantial likelihood that a reasonable investor would consider it important in making an investment decision; or (iii) if it would significantly alter the total mix of information available to investors. We evaluate materiality with reference to all relevant circumstances, including potential market sensitivity.
CONTENTS
EXECUTIVE OVERVIEW
Net income for second quarter 2007 was $396 million, $63 million lower than the prior year period, and includes a $66 million reduction due to the elimination of Corporate Gold Sales Contracts. Adjusted net income 1 of $462 million in second quarter 2007 was slightly higher than the prior year period, as higher realized gold prices 2 were partly offset by higher total cash costs per ounce 3 higher amortization expense on finalization of the Placer Dome purchase price allocation at the end of 2006, and higher project development expense due to activity at our pipeline of projects.
In second quarter 2007, we produced 1.96 million ounces of gold, for a total of 3.99 million ounces in the six months ended June 30, 2007. Gold production for the second quarter 2007 was slightly lower than the same prior year period with lower production from Australia Pacific and Africa due to certain factors that have largely deferred production. In Australia, delays in the conversion of Granny Smith from open pit to underground mining has led to the temporary processing of lower-grade ore stockpiles, and ground movement at Kanowna caused a temporary disruption to production in second quarter 2007. In Africa, pit wall instability at North Mara due to heavy rainfall late in 2006 and early 2007 caused a change in the mine plan for 2007, with lower average ore grades to be mined until the end of third quarter 2007; at Bulyanhulu lower equipment availability and throughput is affecting production levels; and the sale of South Deep occurred at the end of 2006. For the six months ended June 30, 2007, we sold 4.13 million ounces compared to 3.94 million in the prior year period. In first quarter 2007, gold sales were higher than production, largely due to clearance of a small backlog in finished product inventory during first quarter 2007. Production and gold sales volumes were similar in second quarter 2007.
In second quarter 2007, total cash costs of $345 per ounce was 23% higher than the same prior year period mainly due to the planned processing of lower average ore grades at various mines in 2007. Although total cash costs continue to be affected by high prices for certain input commodities and labor, we have had some success
Executive Overview 8 Significant Acquisitions and Divestitures 12 Key Economic Trends 12 Consolidated Gold and Copper Production, Sales and Costs 13 Results of Operating Segments 13 Other Costs and Expenses 19 Liquidity and Capital Resources 24
Cash Flow 24 Liquidity 25
Financial Position 26 Gold Sales Contracts 26 Critical Accounting Policies and Estimates 26 Operating Performance Measures 29 Cautionary Statement on Forward-Looking Information 34
1 Excludes the impact of deliveries into Corporate Gold Sales Contracts. Adjusted net income is an operating performance measure with no standardized meaning under GAAP. For further information, please see page 29.
2 Realized prices exclude unrealized non-hedge derivative gains and losses. Realized prices are a performance measure that are used throughout this MD&A. For more information, please see page 31.

3 Total cash costs per ounce/pound/ton statistics exclude amortization and inventory purchase accounting adjustments. Total cash costs per ounce/pound/ton are an operating performance measure that is used throughout this MD&A. For more information, please see pages 32 to 34.
BARRICK SECOND QUARTER 2007 8 MANAGEMENT’S DISCUSSION AND ANALYSIS
in containing total cash cost per ton mined through managing costs and productivity improvements at our mines. Total cash costs are expected to be higher in the second half of 2007 when compared to second quarter 2007 primarily because Goldstrike expects to process more low-grade ore stockpile material during the latter part of 2007 as the open pit begins a high waste stripping phase, and Lagunas Norte expects to sequence through lower-grade ore zones. We expect Company total gold production and total cash costs for the full-year to be in line with our original guidance range. The principal factors impacting ongoing production and total cash cost trends are the lower production levels at Granny Smith, North Mara and Bulyanhulu. Together with production variances, the increase in the Australia dollar relative to the US dollar and the impact of higher hedge rates in 2007 compared to the same prior year period affected total cash costs for the Australia Pacific region. This caused total cash costs for the region to increase about $29 per ounce for the first half of 2007 when compared to the previous year. For the full-year, any further weaknesses of the US dollar should not impact Australian total cash costs because we have now fully hedged this currency exposure. The impact on full year guidance of the appreciation of the Australian dollar in the first half of the year is about $4 per ounce for the region and $1 per ounce for the Company as a whole.
Due to mine sequencing, we expect total cash costs to increase above the level of second quarter cash costs in the second half of the year. At Goldstrike, we expect to work through a high waste stripping phase in the open pit with concurrent processing of low-grade stockpiled ore. At Lagunas Norte, ore grades are expected to be lower as mining transitions through lower-grade areas of the ore body. At Veladero, high waste stripping activities are expected to continue, and at the end of the third quarter, we expect higher-grade ore should be accessible. At Porgera, North Mara and Plutonic, we expect to see improved performances in the second half of the year as the mines access higher-grade ore, but likely not until the fourth quarter. There is some risk that gold production will be towards the low end of our range of full-year guidance and that total cash costs will be towards the high end of our range of full-year guidance depending on the degree of performance improvements at Veladero, Porgera, North Mara and Plutonic in the fourth quarter.
Copper production in second quarter 2007 was unchanged from the prior year period, with similar total cash costs per pound year on year, mainly due to better ore grades at Osborne. We expect our full-year copper production and total cash costs to be in line with our original full-year guidance.
In second quarter 2007, realized gold prices were lower than prevailing spot prices due to the delivery of the remaining 0.5 million ounces of production into our Corporate Gold Sales Contracts. The delivery into our Corporate Gold Sales Contracts resulted in a pre-tax reduction to our revenues and operating cash flow, when compared to the prevailing spot price, of $72 million for the second quarter 2007 ($66 million post-tax) and $636 million for the six months ended June 30, 2007 ($623 million post-tax). As announced on May 1, 2007, gold from our operating mines has been completely unhedged since that date and we are selling our current gold production at prevailing market prices.
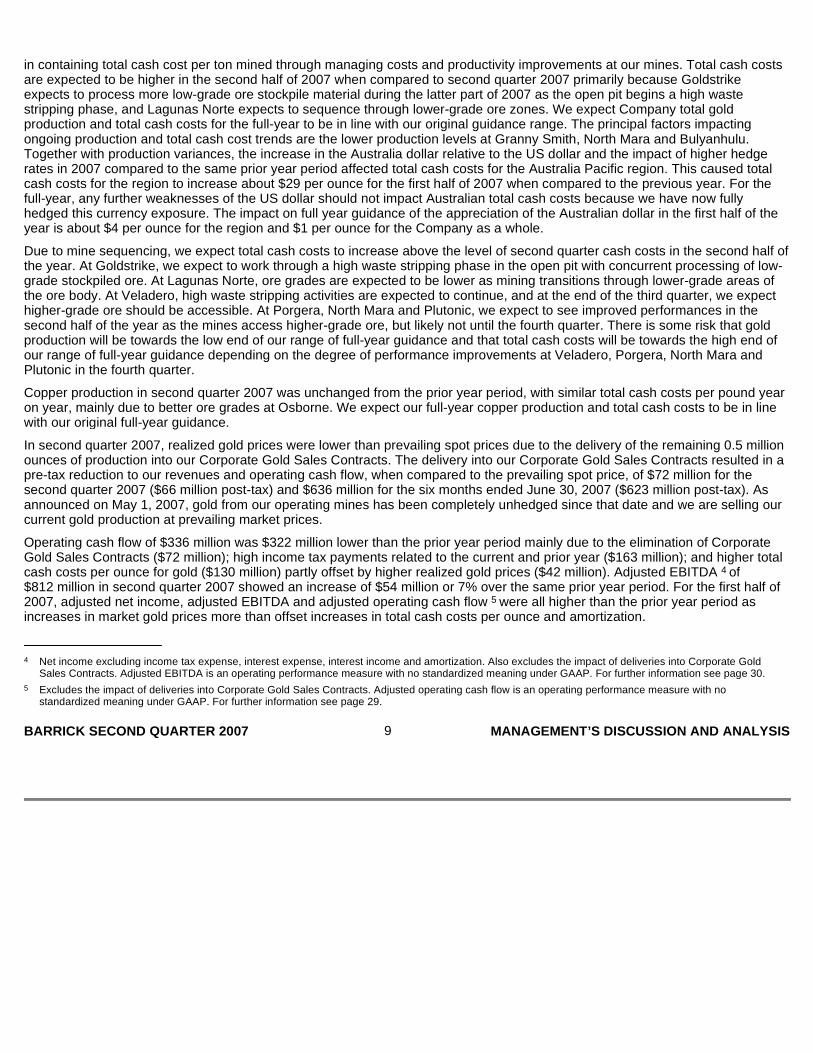
Operating cash flow of $336 million was $322 million lower than the prior year period mainly due to the elimination of Corporate Gold Sales Contracts ($72 million); high income tax payments related to the current and prior year ($163 million); and higher total cash costs per ounce for gold ($130 million) partly offset by higher realized gold prices ($42 million). Adjusted EBITDA 4 of $812 million in second quarter 2007 showed an increase of $54 million or 7% over the same prior year period. For the first half of 2007, adjusted net income, adjusted EBITDA and adjusted operating cash flow 5 were all higher than the prior year period as increases in market gold prices more than offset increases in total cash costs per ounce and amortization.
4 Net income excluding income tax expense, interest expense, interest income and amortization. Also excludes the impact of deliveries into Corporate Gold Sales Contracts. Adjusted EBITDA is an operating performance measure with no standardized meaning under GAAP. For further information see page 30.
5 Excludes the impact of deliveries into Corporate Gold Sales Contracts. Adjusted operating cash flow is an operating performance measure with no standardized meaning under GAAP. For further information see page 29.
BARRICK SECOND QUARTER 2007 9 MANAGEMENT’S DISCUSSION AND ANALYSIS

Results Overview
($ millions, except per share, per ounce/pound data in dollars)
Full Year 2007 Outlook For the year ended December 31 ($ millions except as otherwise Latest Original indicated) 2007E 2007E
Gold Production (millions of ounces) 8.1-8.4 8.1-8.4 Total cash costs ($ per ounce) $ 335-$350 $ 335-$350 Amortization ($ per ounce) $ 95 $ 95
Copper Production (millions of pounds) 400 400 Total cash costs ($ per pound) $ 0.90 $ 0.90 Amortization ($ per pound) $ 0.30 $ 0.30
Corporate administration expense $ 140 $ 140 Exploration expense 1 $ 185 $ 170 Project development expense 2 $ 230 $ 190 Other operating expenses $ 130 $ 115 Interest income 3 $ 140 $ 130 Interest expense 4 $ 105 $ 95 $ 1,100- $ 1,100- Capital expenditures 5 $ 1,500 $ 1,800 Tax rate 6 27 % 30 %
1 Increase in 2007 Outlook reflects our newly identified exploration targets.
2 Increase mainly reflects expensing costs at Pueblo Viejo in second and third quarter 2007. Approximately two-thirds of project development expense in the second half of 2007 should occur in third quarter 2007.
3 Higher interest income outlook for 2007 mainly reflects expected higher average cash balances.
4 Net of amounts capitalized of $100 million. Interest capitalized is expected to be lower for the full year due to changes in the timing of capital expenditures on the projects qualifying for interest capitalization.
5 Lower full year outlook for capital expenditures is mainly due to the timing of expenditures at Pueblo Viejo and Pascua-Lama.
6 Represents the underlying effective tax rate excluding the effect of delivering into gold sales contracts in a low tax rate jurisdiction at prices below prevailing market prices, tax rate changes and net currency translation gains on deferred tax balances. The effective tax rate for the full year is expected to be approximately 45% when the $623 million opportunity cost of delivering into gold sales contracts in a low tax-rate jurisdiction is included.
Three months ended June 30 Six months ended June 30 Gold Copper Gold Copper 2007 2006 2007 2006 2007 2006 2007 2006
Production (‘000s oz/millions lbs) 1 1,957 2,085 101 100 3,986 4,041 201 172
Sales 2 ‘000s oz/millions lbs 2,006 1,998 106 98 4,127 3,938 197 177 $ millions $ 1,264 $ 1,199 $ 378 $ 333 $ 2,090 $ 2,211 $ 641 $ 509
Market price 3 667 627 3.47 3.27 658 590 3.07 2.75 Realized price 3,4 624 603 3.43 3.41 502 562 3.13 2.92 Total cash costs 1,3,5 345 280 0.77 0.76 329 282 0.79 0.76 Amortization 3 98 73 0.28 0.25 90 78 0.32 0.47
Total production costs 1,2,3 $ 443 $ 353 $ 1.05 $ 1.01 $ 419 $ 360 $ 1.11 $ 1.23
BARRICK SECOND QUARTER 2007 10 MANAGEMENT’S DISCUSSION AND ANALYSIS

Key Factors Affecting Earnings
Three months ended June 30 Six months ended June 30 2007 2006 2007 2006
Net income $ 396 $ 459 $ 237 $ 683 Net income per share
Basic 0.46 0.53 0.27 0.83 Diluted 0.45 0.53 0.27 0.82
Adjusted net income 6 462 459 860 723 Adjusted net income per share 6, 7 0.54 0.53 0.99 0.88 Adjusted EBITDA 8 812 758 1,569 1,219 Adjusted EBITDA per share 7, 8 0.94 0.88 1.82 1.49 Dividend per share 0.15 0.11 0.15 0.11 Cash inflow (outflow) from continuing operations
Operating activities 336 658 499 1,043 Investing activities 251 (323 ) (19 ) (740 ) Financing activities (966 ) (1,776 ) (944 ) (1,526 )
Adjusted operating cash flow 9 408 658 1,135 1,083 Adjusted operating cash flow per share 7, 9 $ 0.47 $ 0.76 $ 1.32 $ 1.32
1 Gold production and total cash cost per ounce/pound/ton statistics reflect our equity share of production, including our equity share of production from the South Deep mine in 2006. Gold production also includes an additional 20% share of production from the Porgera mine from April 1, 2007 onwards (see page 12).
2 Gold sales ($ millions) exclude the results of discontinued operations. Gold sales (‘000s oz/millions lbs) exclude the results of discontinued operations and reflect our equity share of sales.
3 Per ounce/pound weighted average.
4 Realized prices exclude unrealized non-hedge derivative gains and losses, and are a performance measure that is used throughout this MD&A. For more information see page 32.
5 Total cash costs per ounce/pound/ton statistics exclude amortization and inventory purchase accounting adjustments. Total cash costs per ounce/pound/ton are an operating performance measure that is used throughout this MD&A. For more information see pages 32 to 34.
6 Excluding the impact of deliveries into Corporate Gold Sales Contracts. Adjusted net income and adjusted net income per share are operating performance measures with no standardized meaning under GAAP. For further information, please see page 29.
7 Calculated using net income and weighted average number of shares outstanding under the Basic method of earnings per share.
8 Net income excluding income tax expense, interest expense, interest income and amortization. Also excludes the impact of deliveries into Corporate Gold Sales Contracts. Adjusted EBITDA and adjusted EBITDA per share are operating performance measures with no standardized meaning under GAAP. For further information see page 30.
9 Excluding the impact of deliveries into Corporate Gold Sales Contracts. Adjusted operating cash flow and adjusted operating cash flow per share are performance measures with no standardized meaning under GAAP. For further information see page 29.
Increase (decrease) Year to date 2007 vs. ($ millions) Refer to page Q2 2007 vs. Q2 2006 Year to date 2006
Net income - 2006 $ 459 $ 683 Increase (decrease)
Higher (lower) realized gold prices 1 9 42 (248 ) Higher sales volumes gold 2 8 2 53 Higher total cash costs-gold 9 (130 ) (194 ) Higher realized copper prices 9 3 41 Higher sales volumes copper 2 9 22 44 Higher amortization expense 20 (71 ) (114 ) Higher exploration and project development expense 19 (33 ) (48 ) Lower (higher) income tax expense 3 22 32 (15 ) Special items 1,4 12 61 62 Other 9 (27 )
Net income - 2007 $ 396 $ 237
1 Our realized gold price was reduced by deliveries into Corporate Gold Sales Contracts of $72 million in second quarter 2007 and $636 million for the six months ended June 30, 2007. Had it not been for these items, our realized price would have been approximately $660 per ounce or $36 per ounce higher in second quarter 2007 and approximately $656 or $154 per ounce higher the six months ended June 30, 2007. The impact of deliveries into Corporate Gold Sales Contracts has been excluded from the special items line on this table.
2 Impact of changing sales volumes on margin between selling prices, total cash costs and amortization, but excluding inventory purchase accounting adjustments.
3 Excluding the impact of the tax effects of special items.
4 Special items are presented on a post-tax basis. See page 12 for a description of the special items. BARRICK SECOND QUARTER 2007 11 MANAGEMENT’S DISCUSSION AND ANALYSIS


Special Items — Effect on Earnings Increase (Decrea se)
SIGNIFICANT ACQUISITIONS AND DIVESTITURES
Acquisition of 20% interest in Porgera In April 2007, we signed an agreement to purchase Emperor Mines Limited’s 20% interest in the Porgera mine that will increase our undivided interest in Porgera from 75% to 95%. The Government of Papua New Guinea holds the remaining 5% undivided interest in Porgera. On closing we will pay $250 million in cash plus an adjustment amount. We presently expect to close the transaction in third quarter 2007. We are currently in discussions regarding the possible sale of up to a 5% interest to our joint venture partner, Mineral Resources Enga Limited, for the proportionate acquisition cost paid by Barrick.
Sale of Paddington Operations In April 2007, we entered into an agreement to sell the Paddington operations in Australia to Norton Goldfields Limited, under which we are entitled to receive cash proceeds of approximately $37 million and rehabilitation bonds of approximately $13 million. The Paddington operations, which form part of the Kanowna mine in Australia, were previously subject to a sale agreement which was terminated after the purchaser was unable to complete the transaction.
KEY ECONOMIC TRENDS
Gold, Copper and Silver Prices In second quarter 2007, gold prices remained robust ranging from $642 to $691 per ounce with an average market price of $667 per ounce. The primary economic influences include global mine supply and demand, oil prices, trade deficits, the weakness of the US dollar and US dollar interest rates. The performance of the US dollar against major currencies has been a significant factor in recent movements in gold prices. If the US dollar continues to weaken, this should support appreciation in gold prices. Demand for gold remains strong, both for jewelry and as an investment in response to global economic and political uncertainty. We believe that economic conditions in support of a higher gold price remain favorable.
Copper prices rose over 25% in second quarter 2007, mainly due to concerns that the physical supply may lag behind the demand in China and the possibility that the labor disputes at various copper mines in Chile, Indonesia, Mexico and Peru will hamper production in the second half of 2007. Copper prices ranged from $3.19 to $3.80 per pound during the quarter, closing at $3.48 per pound at June 3, 2007. During second quarter 2007, we established a series of copper hedges for 191 million pounds or 45% (excluding the copper-linked notes) of our production over the next twelve months. These hedges are in addition to the 220 million pounds of copper repayable under the copper-linked notes and, net of the premium paid, allow us to participate in copper prices up to $3.77 per pound, while maintaining a floor price of $3.03 per pound.
Silver prices traded in a range of $12.26 to $14.09 per ounce in second quarter 2007, closing at $12.54 per ounce at June 30, 2007. Silver price trends were similar to gold for most of second quarter 2007. We believe that silver prices should remain at strong levels for the
Three months ended June 30 Six months ended June 30 Pre-Tax Post-Tax Pre-Tax Post-Tax ($ millions) Page 2007 2006 2007 2006 2007 2006 2007 2006
Impact of deliveries into gold sales contracts 9 $ (72 ) $ — $ (66 ) $ — $ (636 ) $ (40 ) $ (623 ) $ (40 )
Unrealized non-hedge derivative gains (losses) 1 31 18 (14 ) 12 (9 ) 29 (21 ) 19 (13 )
Inventory purchase accounting adjustments 32 — (13 ) — (10 ) (8 ) (74 ) (7 ) (58 )
Equity loss in Highland Gold 2 — — — — (20 ) — (20 ) —
Gains on sales of Gold Fields and NovaGold shares 22 44 — 30 — 44 — 30 —
Deferred tax credits 3 22 — — — — — — — 31
Total $ (10 ) $ (27 ) $ (24 ) $ (19 ) $ (591 ) $ (135 ) $ (601 ) $ (80 )
1 Relates to gains and losses on our gold and copper derivatives. For more information see page 31.
2 The equity loss in Highland reflects an impairment charge resulting from damages caused by the fire in the underground part of the Central Shaft at Highland’s Darasun mine, which occurred in 2006.
3 Due to changes in tax law / status.
BARRICK SECOND QUARTER 2007 12 MANAGEMENT’S DISCUSSION AND ANALYSIS

foreseeable future as industrial and investment demand remains robust.
Currency Exchange Rates A weaker US dollar would cause any costs reported in US dollars that are not protected by currency hedges, to increase. In second quarter 2007 the Canadian dollar traded at 30-year highs due to stronger than expected economic growth and continued merger and acquisition activity. The Australian dollar also appreciated in second quarter 2007, mainly due to strong economic data and the market expectation for higher interest rates in Australia in 2007. We do not expect further appreciation of either the Australian and Canadian dollars to impact earnings significantly as we added to our currency hedge position in the first half of 2007 and we are fully hedged for both currencies for the remainder of 2007. The average hedged rate for the Australian dollar relative to the US dollar during this period is 0.75 cents, which is below the recent market exchange rate. In second quarter 2007, we also added hedges the equivalent of $30 million in Chilean pesos covering approximately 80% of our peso exposure in 2007. Beyond 2007, for Australian and Canadian dollar expenditures, we are 78% and 93% hedged, respectively, through 2009.
Other Commodities and Consumables The mining industry continues to experience high prices for many commodities and consumables used in the production of gold and copper, as well as, in some cases, constraints on supply. Oil prices have risen significantly since the beginning of the year, currently trading at 2007 highs at more than $70 per barrel. To help mitigate rising oil prices and control the cost of fuel consumption, we have a fuel hedge position equivalent to 4.1 million barrels of oil at an average price of $62 per barrel, primarily designated for our Nevada based mines. This fuel hedge position represents about half of our total estimated consumption for the remainder of 2007 and 15-20% of our total estimated consumption in each of the following six years.
US Dollar Interest Rates Volatility in interest rates mainly affects interest receipts on our cash balances ($2.6 billion at June 30, 2007), and interest payments on variable-rate debt (approximately $0.95 billion at June 30, 2007). The relative amounts of variable-rate financial assets and liabilities may change in the future, depending upon the amount of operating cash flow we generate, as well as amounts invested in capital expenditures.
CONSOLIDATED GOLD AND COPPER PRODUCTION, SALES AND COSTS
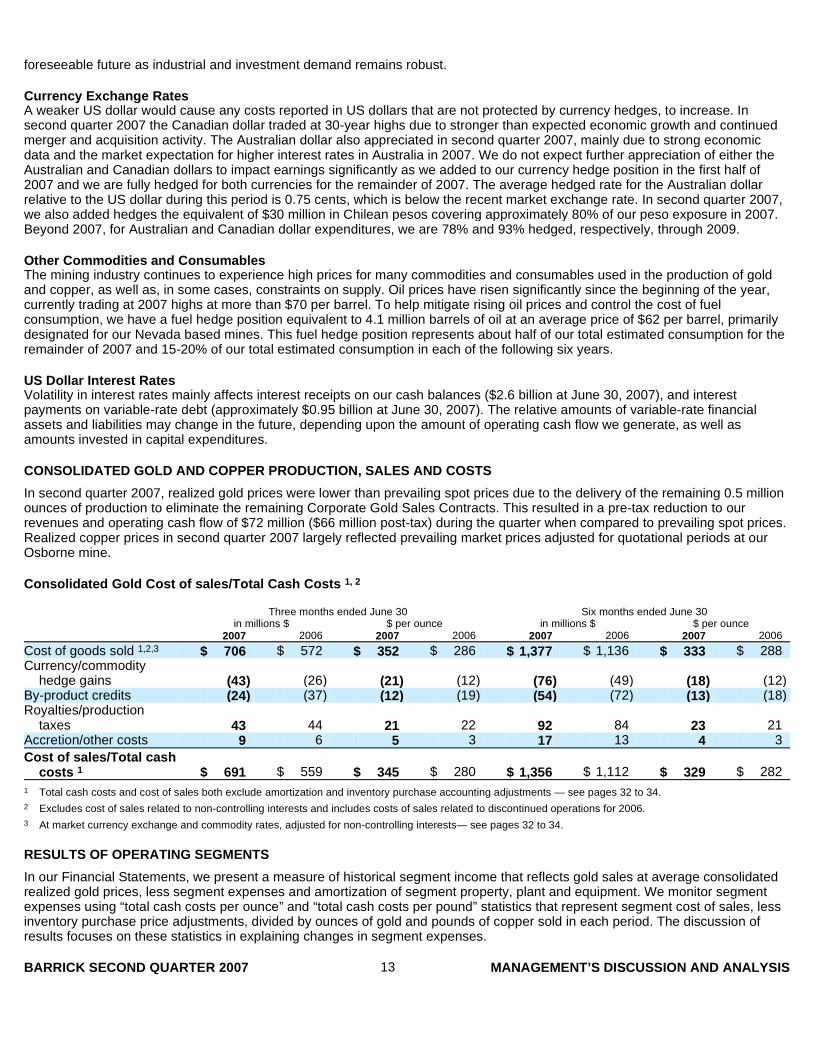
In second quarter 2007, realized gold prices were lower than prevailing spot prices due to the delivery of the remaining 0.5 million ounces of production to eliminate the remaining Corporate Gold Sales Contracts. This resulted in a pre-tax reduction to our revenues and operating cash flow of $72 million ($66 million post-tax) during the quarter when compared to prevailing spot prices. Realized copper prices in second quarter 2007 largely reflected prevailing market prices adjusted for quotational periods at our Osborne mine.
Consolidated Gold Cost of sales/Total Cash Costs 1, 2
RESULTS OF OPERATING SEGMENTS
In our Financial Statements, we present a measure of historical segment income that reflects gold sales at average consolidated realized gold prices, less segment expenses and amortization of segment property, plant and equipment. We monitor segment expenses using “total cash costs per ounce” and “total cash costs per pound” statistics that represent segment cost of sales, less inventory purchase price adjustments, divided by ounces of gold and pounds of copper sold in each period. The discussion of results focuses on these statistics in explaining changes in segment expenses.
Three months ended June 30 Six months ended June 30 in millions $ $ per ounce in millions $ $ per ounce 2007 2006 2007 2006 2007 2006 2007 2006
Cost of goods sold 1,2,3 $ 706 $ 572 $ 352 $ 286 $ 1,377 $ 1,136 $ 333 $ 288 Currency/commodity
hedge gains (43 ) (26 ) (21 ) (12 ) (76 ) (49 ) (18 ) (12 ) By-product credits (24 ) (37 ) (12 ) (19 ) (54 ) (72 ) (13 ) (18 ) Royalties/production
taxes 43 44 21 22 92 84 23 21 Accretion/other costs 9 6 5 3 17 13 4 3
Cost of sales/Total cash costs 1 $ 691 $ 559 $ 345 $ 280 $ 1,356 $ 1,112 $ 329 $ 282
1 Total cash costs and cost of sales both exclude amortization and inventory purchase accounting adjustments — see pages 32 to 34.
2 Excludes cost of sales related to non-controlling interests and includes costs of sales related to discontinued operations for 2006.
3 At market currency exchange and commodity rates, adjusted for non-controlling interests— see pages 32 to 34.
BARRICK SECOND QUARTER 2007 13 MANAGEMENT’S DISCUSSION AND ANALYSIS

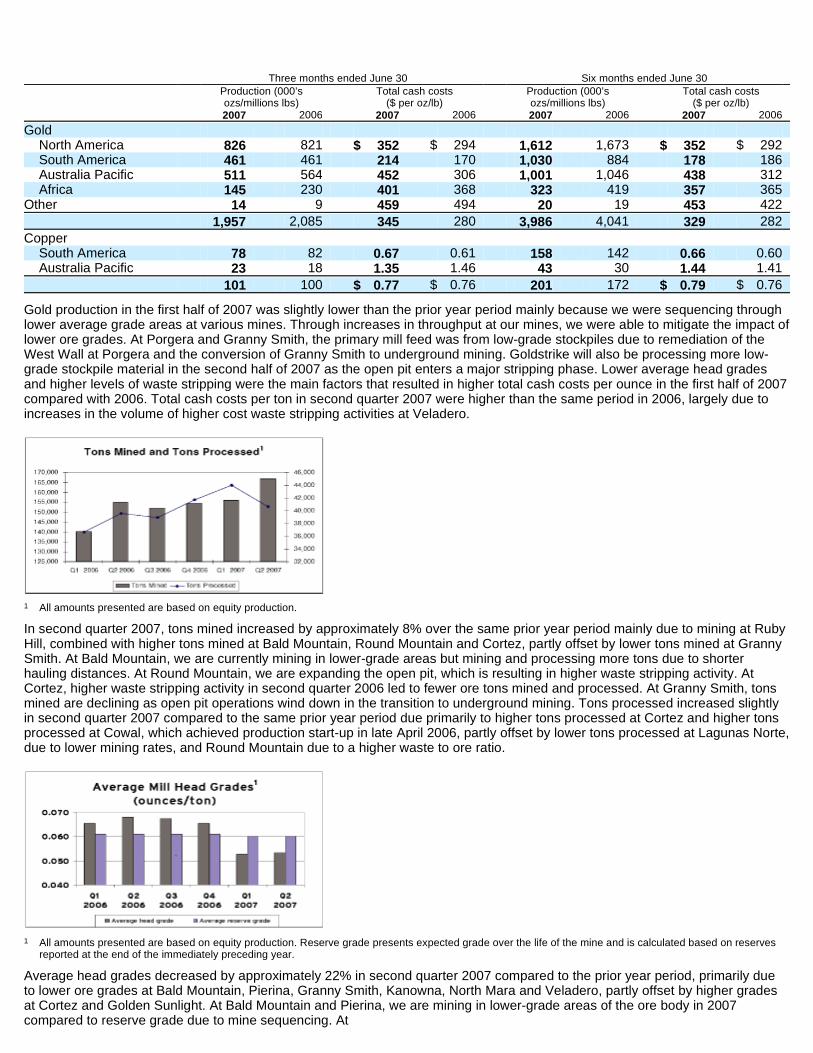
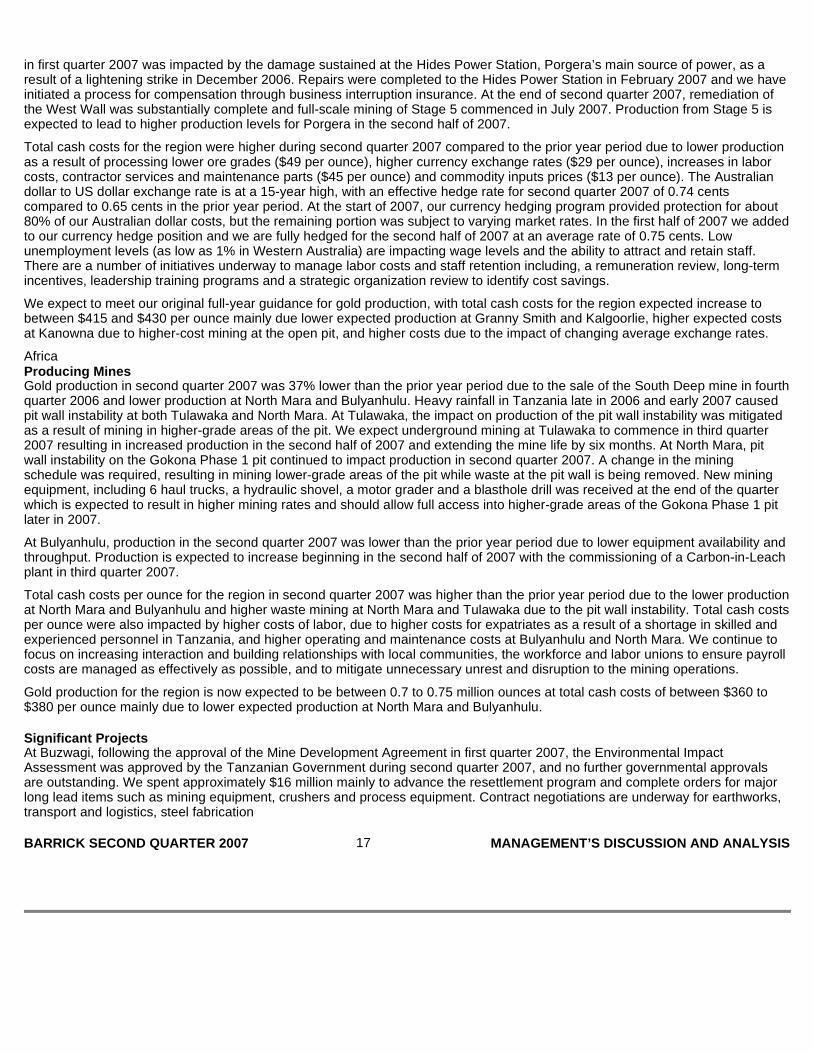
Gold production in the first half of 2007 was slightly lower than the prior year period mainly because we were sequencing through lower average grade areas at various mines. Through increases in throughput at our mines, we were able to mitigate the impact of lower ore grades. At Porgera and Granny Smith, the primary mill feed was from low-grade stockpiles due to remediation of the West Wall at Porgera and the conversion of Granny Smith to underground mining. Goldstrike will also be processing more low-grade stockpile material in the second half of 2007 as the open pit enters a major stripping phase. Lower average head grades and higher levels of waste stripping were the main factors that resulted in higher total cash costs per ounce in the first half of 2007 compared with 2006. Total cash costs per ton in second quarter 2007 were higher than the same period in 2006, largely due to increases in the volume of higher cost waste stripping activities at Veladero.
In second quarter 2007, tons mined increased by approximately 8% over the same prior year period mainly due to mining at Ruby Hill, combined with higher tons mined at Bald Mountain, Round Mountain and Cortez, partly offset by lower tons mined at Granny Smith. At Bald Mountain, we are currently mining in lower-grade areas but mining and processing more tons due to shorter hauling distances. At Round Mountain, we are expanding the open pit, which is resulting in higher waste stripping activity. At Cortez, higher waste stripping activity in second quarter 2006 led to fewer ore tons mined and processed. At Granny Smith, tons mined are declining as open pit operations wind down in the transition to underground mining. Tons processed increased slightly in second quarter 2007 compared to the same prior year period due primarily to higher tons processed at Cortez and higher tons processed at Cowal, which achieved production start-up in late April 2006, partly offset by lower tons processed at Lagunas Norte, due to lower mining rates, and Round Mountain due to a higher waste to ore ratio.
Average head grades decreased by approximately 22% in second quarter 2007 compared to the prior year period, primarily due to lower ore grades at Bald Mountain, Pierina, Granny Smith, Kanowna, North Mara and Veladero, partly offset by higher grades at Cortez and Golden Sunlight. At Bald Mountain and Pierina, we are mining in lower-grade areas of the ore body in 2007 compared to reserve grade due to mine sequencing. At
Three months ended June 30 Six months ended June 30 Production (000’s Total cash costs Production (000’s Total cash costs ozs/millions lbs) ($ per oz/lb) ozs/millions lbs) ($ per oz/lb) 2007 2006 2007 2006 2007 2006 2007 2006
Gold North America 826 821 $ 352 $ 294 1,612 1,673 $ 352 $ 292 South America 461 461 214 170 1,030 884 178 186 Australia Pacific 511 564 452 306 1,001 1,046 438 312 Africa 145 230 401 368 323 419 357 365
Other 14 9 459 494 20 19 453 422
1,957 2,085 345 280 3,986 4,041 329 282
Copper South America 78 82 0.67 0.61 158 142 0.66 0.60 Australia Pacific 23 18 1.35 1.46 43 30 1.44 1.41
101 100 $ 0.77 $ 0.76 201 172 $ 0.79 $ 0.76
1 All amounts presented are based on equity production.
1 All amounts presented are based on equity production. Reserve grade presents expected grade over the life of the mine and is calculated based on reserves reported at the end of the immediately preceding year.

BARRICK SECOND QUARTER 2007 14 MANAGEMENT’S DISCUSSION AND ANALYSIS

Kanowna, ground movement in the underground impacted the mining schedule, resulting in ore being sourced from lower-grade areas during second quarter 2007. At North Mara, pit wall instability, as a result of heavy rainfall, has limited access to higher-grade areas of the mine, but additional mining equipment has been secured and mining rates are expected to increase later in 2007, resulting in access to higher grade areas. At Veladero, ore grades are expected to increase later in the year with a ramp up of mining in the Filo Federico pit. At Cortez and Golden Sunlight, we are mining in higher-grade areas of the pit.
Over the past two years, we have had some success in containing total cash costs per ton mined. Increases in total cash costs on a per ounce basis are mainly due to lower average head grades and mining of more waste at various mines. Higher costs for labor and input commodities have impacted total cash costs but have been mitigated by our cost containment programs. Total cash costs per ton mined in second quarter 2007 were higher than the same period in 2006, largely due to higher volumes of waste stripping activities at Veladero and higher costs for labor and input commodities, particularly in North America and Australia Pacific. At Veladero, we entered production in the Filo Federico pit in second quarter 2007, and we began to expense costs for waste stripping activities in cost of sales.
Operating Segments — Gold
North America Producing Mines Gold production in second quarter 2007 was slightly higher than the prior year period due to higher production at Cortez, Golden Sunlight and the Goldstrike open pit, partly offset by lower production at Bald Mountain, Goldstrike underground and Eskay Creek. Gold production was also positively impacted by the start-up of the Ruby Hill mine in first quarter 2007. At Cortez, higher production was due to mining in areas of the pit that are yielding better ore grades and more ore tons than the prior year period. At Golden Sunlight, access to higher grade areas of the pit has resulted in higher production. At the Goldstrike open pit, higher-grade areas of the pit were mined in second quarter 2007 compared to the prior year period due to mine sequencing. At Bald Mountain, lower production in second quarter 2007 was due to mining in lower-grade areas of the mine and lower equipment availability. At Eskay Creek, fewer tons at lower ore grades were mined compared to the prior year period as the mine approaches the end of operations. At the Goldstrike underground, tons mined decreased during the early part of the year as a result of a transition to zone mining, but production increased to near expected levels by the end of second quarter 2007.
Total cash costs are higher than the prior year period reflecting the decline in ore grade and high volume of waste stripping at various mines. Total cash costs per ounce in second quarter 2007 were also affected by higher labor and maintenance costs ($16 per ounce), higher prices and consumption of input commodities used in the production process ($10 per ounce), and start-up costs at our new Ruby Hill mine ($7 per ounce). The type of ore processed at the Goldstrike Autoclave requires more reagents such as propane and acid needed to achieve optimal efficiency. This resulted in higher total cash costs of $15 per ounce for Goldstrike during the quarter when compared to the same prior year period. The Turquoise Ridge mine began obtaining its electric power from our Western 102 power plant on April 1, 2007, resulting in estimated savings of $4 per ounce at Turquoise Ridge for the second quarter.
We continue to expect the region to meet its original full-year 2007 guidance for gold production and total cash costs.
Significant Projects At the Cortez Hills project in Nevada (60% owned), we spent approximately $31 million in second quarter 2007 (100% basis) for the procurement of open-pit mining equipment, construction of the cross-valley dewatering pipeline system, and completion of an additional 627 meters of the underground exploration decline for a total of 3,995 meters completed to date. Environmental Impact Statement approval continues to be targeted for 2008 followed by a 15-month construction period.
At the Donlin Creek project in Alaska (30% owned with a right to earn-in up to 70%), we spent $29 million (100% basis) in second quarter 2007 to advance the feasibility study, which we are on track to complete by November 2007. Geotechnical core drilling in the mine, tailings and plant sites was completed ahead of schedule in first quarter 2007, and significant progress has been made on
1 All amounts presented are based on equity production.
BARRICK SECOND QUARTER 2007 15 MANAGEMENT’S DISCUSSION AND ANALYSIS


additional infill core drilling in second quarter 2007. A total of up to 80,000 meters of drilling is planned for 2007, of which approximately 36,500 meters was completed in the first half of the year. Government and local community relations continue to be a focal point as the project moves forward.
At the Pueblo Viejo project in the Dominican Republic (60% owned), we spent approximately $20 million (100% basis) in second quarter 2007 on advancement of project design and engineering, exploration programs, community development programs, and evaluation of electric power sources. Research into the technical and economical feasibility of recovering zinc continues. Condemnation drilling has been completed under the proposed plant area. Discussions with the Dominican government are ongoing regarding the government’s relocation action plan, power, and ARD water treatment.
South America Producing Mines Gold production in second quarter 2007 was comparable to the same prior year period as higher production at Lagunas Norte was offset by lower production at Pierina, with mining of deeper, lower-grade areas of the ore body, and lower production at Veladero, primarily due to processing of lower-grade ore. At Lagunas Norte, we produced 11% more gold in second quarter 2007 compared to the same prior year period due to higher quantities of material placed on the leach pad during first quarter 2007, partly offset by lower ore grades. Production is expected to increase at Veladero in fourth quarter 2007 with availability of higher-grade ore from the Filo Federico and Amable pits.
Total cash costs per ounce increased by 26% in second quarter 2007 over the prior year period, largely due to: higher costs at Veladero, as mining transitioned to lower grade ore in the Filo Federico pit beginning in April 2007 and we began expensing post-development waste stripping costs, higher labor and maintenance costs ($13 per ounce); and higher costs for consumables, particularly fuel costs in Argentina ($4 per ounce). In the second half of 2007 we expect similar levels of production with lower production at Lagunas Norte as a result of processing lower ore grades, offset by higher production at Pierina and Veladero due to better ore grades. Total cash costs are expected to increase with the changing mix of production.
Gold production guidance for the region for the full-year is now expected to be between 1.95 to 2.5 million ounces at total cash costs of between $210 to $225 per ounce.
Significant Projects At the Pascua-Lama project, approximately $18 million was spent in second quarter 2007 as we continued to develop detailed engineering plans and have begun submission of documentation to obtain the administrative and sectoral approvals and permits that is required prior to initiating construction in either country. In addition, the governments of Chile and Argentina must resolve certain remaining fiscal matters, including taxation, relating to the bi-national project. The timing of receipt of approvals for permitting and licensing, cross-border approvals, fiscal matters and royalty items are largely beyond our control. Environmental approval for up to 34 megawatt power plant in Chile has been approved. Engineering and contract development is proceeding and is expected to be supplemented with a 20 megawatt wind farm for which the environmental review is in process.
Australia Pacific Producing Mines Gold production in second quarter 2007 was lower than the prior year period mainly due to lower production at Granny Smith and Kanowna, partly offset by higher production at Cowal, which commenced production in late April 2006. At Granny Smith, production from the underground increased by 37% from first quarter 2007, but processing of lower-grade stockpiles is continuing until full-scale underground mining is achieved. At Kanowna, ground movement, which occurred in February 2007 prevented mining in higher-grade areas of the underground in second quarter 2007. Lower-grade ore from the open pit was utilized to replace the shortfall in underground production in the mill while mine plans were rescheduled. At Cowal, we completed a conversion of the mill to treat harder sulphide ore which impacted recovery rates during second quarter 2007, but recovery rates should increase in the second half of 2007 with performance improvements.
At Kalgoorlie, first quarter 2007 production was impacted by lower mining rates from low shovel availability which led to the processing of more low-grade stockpiled ore. In second quarter 2007, mining rates and shovel availability increased with the implementation of improvement programs, leading to higher production.
At Porgera, production for second quarter 2007 includes the additional 20% interest we are entitled to receive as part of our agreement with Emperor Mines Limited. A power-line failure caused by severe weather impacted production for approximately 11 days during the quarter. Production in the second quarter was also impacted by a land owner dispute for approximately 8 days. Production
BARRICK SECOND QUARTER 2007 16 MANAGEMENT’S DISCUSSION AND ANALYSIS
in first quarter 2007 was impacted by the damage sustained at the Hides Power Station, Porgera’s main source of power, as a result of a lightening strike in December 2006. Repairs were completed to the Hides Power Station in February 2007 and we have initiated a process for compensation through business interruption insurance. At the end of second quarter 2007, remediation of the West Wall was substantially complete and full-scale mining of Stage 5 commenced in July 2007. Production from Stage 5 is expected to lead to higher production levels for Porgera in the second half of 2007.
Total cash costs for the region were higher during second quarter 2007 compared to the prior year period due to lower production as a result of processing lower ore grades ($49 per ounce), higher currency exchange rates ($29 per ounce), increases in labor costs, contractor services and maintenance parts ($45 per ounce) and commodity inputs prices ($13 per ounce). The Australian dollar to US dollar exchange rate is at a 15-year high, with an effective hedge rate for second quarter 2007 of 0.74 cents compared to 0.65 cents in the prior year period. At the start of 2007, our currency hedging program provided protection for about 80% of our Australian dollar costs, but the remaining portion was subject to varying market rates. In the first half of 2007 we added to our currency hedge position and we are fully hedged for the second half of 2007 at an average rate of 0.75 cents. Low unemployment levels (as low as 1% in Western Australia) are impacting wage levels and the ability to attract and retain staff. There are a number of initiatives underway to manage labor costs and staff retention including, a remuneration review, long-term incentives, leadership training programs and a strategic organization review to identify cost savings.
We expect to meet our original full-year guidance for gold production, with total cash costs for the region expected increase to between $415 and $430 per ounce mainly due lower expected production at Granny Smith and Kalgoorlie, higher expected costs at Kanowna due to higher-cost mining at the open pit, and higher costs due to the impact of changing average exchange rates.
Africa Producing Mines Gold production in second quarter 2007 was 37% lower than the prior year period due to the sale of the South Deep mine in fourth quarter 2006 and lower production at North Mara and Bulyanhulu. Heavy rainfall in Tanzania late in 2006 and early 2007 caused pit wall instability at both Tulawaka and North Mara. At Tulawaka, the impact on production of the pit wall instability was mitigated as a result of mining in higher-grade areas of the pit. We expect underground mining at Tulawaka to commence in third quarter 2007 resulting in increased production in the second half of 2007 and extending the mine life by six months. At North Mara, pit wall instability on the Gokona Phase 1 pit continued to impact production in second quarter 2007. A change in the mining schedule was required, resulting in mining lower-grade areas of the pit while waste at the pit wall is being removed. New mining equipment, including 6 haul trucks, a hydraulic shovel, a motor grader and a blasthole drill was received at the end of the quarter which is expected to result in higher mining rates and should allow full access into higher-grade areas of the Gokona Phase 1 pit later in 2007.
At Bulyanhulu, production in the second quarter 2007 was lower than the prior year period due to lower equipment availability and throughput. Production is expected to increase beginning in the second half of 2007 with the commissioning of a Carbon-in-Leach plant in third quarter 2007.
Total cash costs per ounce for the region in second quarter 2007 was higher than the prior year period due to the lower production at North Mara and Bulyanhulu and higher waste mining at North Mara and Tulawaka due to the pit wall instability. Total cash costs per ounce were also impacted by higher costs of labor, due to higher costs for expatriates as a result of a shortage in skilled and experienced personnel in Tanzania, and higher operating and maintenance costs at Bulyanhulu and North Mara. We continue to focus on increasing interaction and building relationships with local communities, the workforce and labor unions to ensure payroll costs are managed as effectively as possible, and to mitigate unnecessary unrest and disruption to the mining operations.
Gold production for the region is now expected to be between 0.7 to 0.75 million ounces at total cash costs of between $360 to $380 per ounce mainly due to lower expected production at North Mara and Bulyanhulu.
Significant Projects At Buzwagi, following the approval of the Mine Development Agreement in first quarter 2007, the Environmental Impact Assessment was approved by the Tanzanian Government during second quarter 2007, and no further governmental approvals are outstanding. We spent approximately $16 million mainly to advance the resettlement program and complete orders for major long lead items such as mining equipment, crushers and process equipment. Contract negotiations are underway for earthworks, transport and logistics, steel fabrication
BARRICK SECOND QUARTER 2007 17 MANAGEMENT’S DISCUSSION AND ANALYSIS

and concrete placement. Once the resettlement program is complete the project will enter into the construction phase. Buzwagi is expected to produce 250,000-260,000 ounces at total cash costs of $270-$280 per ounce in the first five years of operation.
Operating Segments — Copper
Copper production at the Zaldivar copper mine in second quarter 2007 was slightly lower than the same prior year period due to lower ore grades, partly offset by higher tons processed. In second quarter 2006, lower tons were processed as a result of temporarily lower conveyor capacity at the crusher. Total cash costs per pound were higher than 2006 due to higher prices paid for input commodities and consumables used in the production process, such as fuel, tires and sulphuric acid.
At the Osborne copper mine, production in second quarter 2007 was higher than the same prior year period due to mining in higher grade areas of the underground combined with increased mill feed as open pit ore is sourced from the Trekalano open pit. At the end of first quarter 2007, the paste-fill plant, which had been completed during the quarter, required substantial repairs due to scouring of the paste pipe. This work was carried out during the quarter and the paste-fill will increase access to the underground mine. Total cash costs per pound in second quarter 2007 was lower than the same prior year period due to higher production and sales volumes, partly offset by higher prices for labor and input commodities caused by the continuing mining industry boom.
Other Significant Projects At the Sedibelo platinum project in South Africa, a pre-feasibility study commenced in 2006. Acceptance of the Mining Rights application was received from the Department of Minerals and Energy (DME) in April 2007. This acceptance signifies the start of the approval process during which technical, environmental and social issues are presented to the DME over a period extending into 2008. The target for the completion of the pre-feasibility study remains unchanged and is scheduled for the second half of 2007.
At the Kabanga joint venture, between Xstrata Plc (“Xstrata”) and Barrick, Xstrata is obligated to fund the initial $145 million, of which over $69 million has been funded to date. Thereafter, Xstrata and Barrick will fund equally project expenditures in accordance with approved budgets. In second quarter 2007, a total of ten drill rigs completed 34,810 meters of geological drilling against a plan of 36,130 meters. At June 30, 2007, a total of 69,492 meters of geological drilling was completed versus a plan of 69,195 meters. The Pre- Feasibility Study drill program of 140,000, meters is 50% complete and on plan.
At the Fedorova palladium and platinum project in Russia, where we own a 50% interest with an earn-in right to 79%, second quarter 2007 activities consisted of $4 million in spending towards exploration drilling, assaying of samples and infill drilling. The Fedorova West reserves/resources report is under review by the Russian State Reserves Committee (GKZ). The plenary meeting of GKZ to approve the reserve/resources is scheduled for mid-September 2007. Feasibility study of the project, in compliance with Russian standards, is due to be completed at the end of 2007. The infill drilling program for 2007 has been completed, with 44,471 meters having been drilled against a plan of 43,000 meters. In-pit geotechnical drilling and large diameter (PQ) drilling for the variability test program is in progress. A geotechnical study of the infrastructure, tailings facilities storage, waste rock dump and camp areas is also underway.
At Reko Diq, in Pakistan, the drill program continued in second quarter 2007 with 71,500 meters planned to upgrade the resource at the Western Porphyries in 2007. Over 51,828 meters have been drilled to date, and results continue to confirm and in some cases exceed the expected grade and continuity of the copper-gold mineralization.
BARRICK SECOND QUARTER 2007 18 MANAGEMENT’S DISCUSSION AND ANALYSIS

OTHER COSTS AND EXPENSES
Exploration Expense
Project Development Expense
Three months Six months ended ended June 30 June 30 ($ millions) 2007 2006 2007 2006 Comments on variances
Exploration
North America $ 20 $ 13 $ 34 $ 22 Higher expenditures in second quarter 2007 at Pueblo Viejo ($4 million), Cortez ($2 million), Bald Mountain ($3 million) and Turquoise Ridqe alonq the Getchell Trend ($2 million), partly offset by lower expenditures at Goldstrike ($2 million), Round Mountain ($1 million) and Dee joint venture ($1 million).
South America 9 6 13 13 Higher expenditures in second quarter 2007 at Lagunas Norte ($1 million), Veladero ($1 million), partly offset by lower greenfield exploration in Peru ($1 million).
Australia Pacific 7 11 15 23 Lower expenditures in second quarter 2007 at Kalqoorlie ($2 million) and Cowal ($1 million), combined with lower expenditures in Papua New Guinea ($1 million), partly offset by higher expenditures at Kanowna ($1 million). Lower expenditures for the six months ended June 30, 2007 in Papua New Guinea ($6 million), Plutonic ($2 million) and Cowal ($1 million), partly offset by higher expenditures in 2007 at Kanowna ($2 million).
Africa
4
9
6
12
Lower expenditures in 2007 at Nyanzaga ($3 million - three months ended June 30; $5 million - six months ended June 30). Both the three and six month periods ended June 30, 2006 included expenditures at South Deep totaling $1 million.
Other — 5 2 7 Lower expenditures in Russia and Central Asia in 2007 due to transfer of other exploration properties in those regions to Highland Gold Mining PLC (“Highland”) in fourth quarter 2006 in return for a higher ownership interest in Highland.
Total $ 40 $ 44 $ 70 $ 77
Three months Six months ended June 30 ended June 30 ($ millions) 2007 2006 2007 2006 Comments on variances
Mine development $ 54 $ 22 $ 80 $ 33 Higher expenditures in second quarter 2007 at Pueblo Viejo ($11 million), Donlin Creek ($8 million), Fedorova ($4 million) and Sedibelo ($3 million) to advance feasibility studies.
Non-capitalizable project costs
6 4 12 6 Higher costs in 2007 at Buzwagi (second quarter 2007: $2 million; six months ended June 30, 2007: $5 million).
Business development/other
5 2 10 8
Total $ 65 $ 28 $ 102 $ 47
BARRICK SECOND QUARTER 2007 19 MANAGEMENT’S DISCUSSION AND ANALYSIS
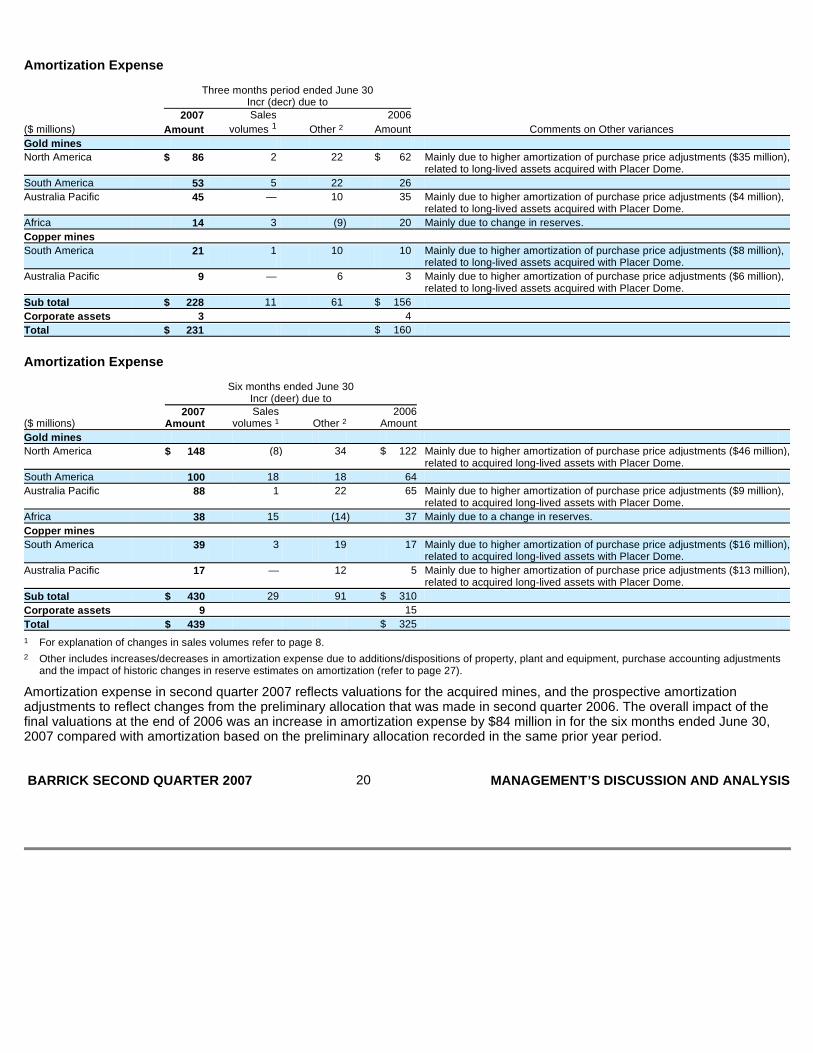
Amortization Expense
Amortization Expense
Amortization expense in second quarter 2007 reflects valuations for the acquired mines, and the prospective amortization adjustments to reflect changes from the preliminary allocation that was made in second quarter 2006. The overall impact of the final valuations at the end of 2006 was an increase in amortization expense by $84 million in for the six months ended June 30, 2007 compared with amortization based on the preliminary allocation recorded in the same prior year period.
Three months period ended June 30 Incr (decr) due to 2007 Sales 2006 ($ millions) Amount volumes 1 Other 2 Amount Comments on Other variances
Gold mines
North America $ 86 2 22 $ 62 Mainly due to higher amortization of purchase price adjustments ($35 million), related to long-lived assets acquired with Placer Dome.
South America 53 5 22 26
Australia Pacific 45 — 10 35 Mainly due to higher amortization of purchase price adjustments ($4 million), related to long-lived assets acquired with Placer Dome.
Africa 14 3 (9 ) 20 Mainly due to change in reserves.
Copper mines
South America 21 1 10 10 Mainly due to higher amortization of purchase price adjustments ($8 million), related to long-lived assets acquired with Placer Dome.
Australia Pacific 9 — 6 3 Mainly due to higher amortization of purchase price adjustments ($6 million), related to long-lived assets acquired with Placer Dome.
Sub total $ 228 11 61 $ 156
Corporate assets 3 4
Total $ 231 $ 160
Six months ended June 30 Incr (deer) due to 2007 Sales 2006 ($ millions) Amount volumes 1 Other 2 Amount
Gold mines
North America $ 148 (8 ) 34 $ 122 Mainly due to higher amortization of purchase price adjustments ($46 million), related to acquired long-lived assets with Placer Dome.
South America 100 18 18 64
Australia Pacific 88 1 22 65 Mainly due to higher amortization of purchase price adjustments ($9 million), related to acquired long-lived assets with Placer Dome.
Africa 38 15 (14 ) 37 Mainly due to a change in reserves.
Copper mines
South America 39 3 19 17 Mainly due to higher amortization of purchase price adjustments ($16 million), related to acquired long-lived assets with Placer Dome.
Australia Pacific 17 — 12 5 Mainly due to higher amortization of purchase price adjustments ($13 million), related to acquired long-lived assets with Placer Dome.
Sub total $ 430 29 91 $ 310
Corporate assets 9 15
Total $ 439 $ 325
1 For explanation of changes in sales volumes refer to page 8.
2 Other includes increases/decreases in amortization expense due to additions/dispositions of property, plant and equipment, purchase accounting adjustments and the impact of historic changes in reserve estimates on amortization (refer to page 27).
BARRICK SECOND QUARTER 2007 20 MANAGEMENT’S DISCUSSION AND ANALYSIS
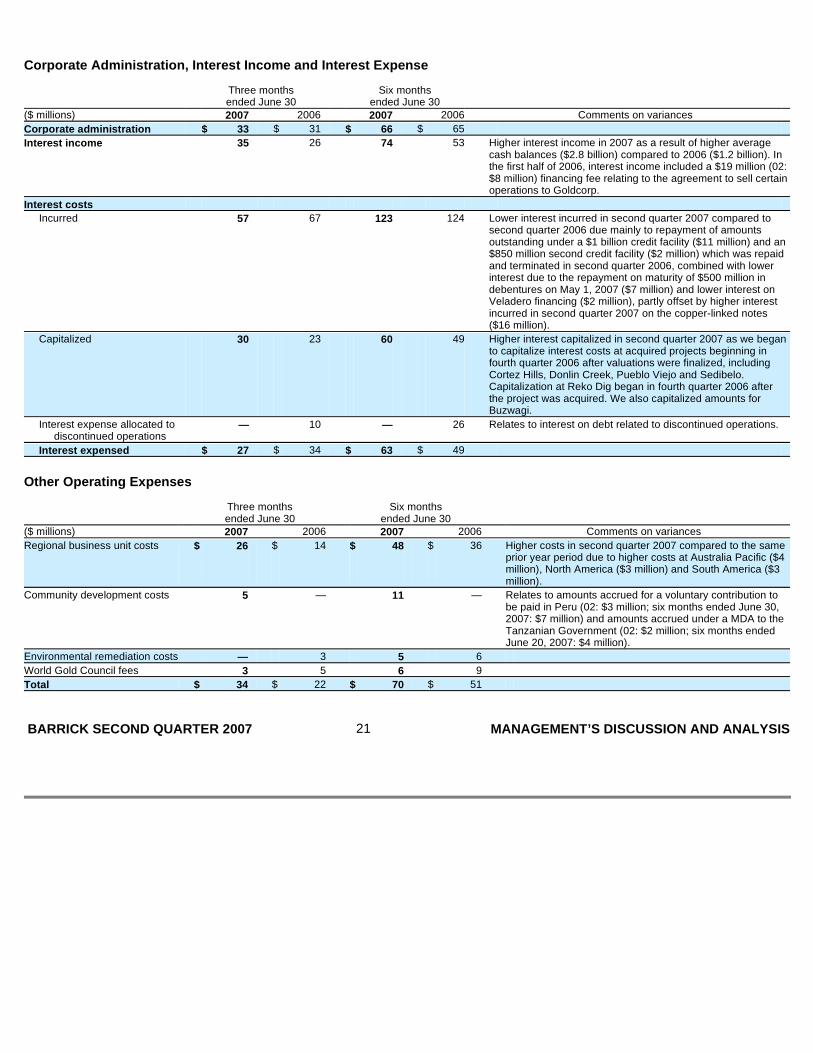
Corporate Administration, Interest Income and Inter est Expense
Other Operating Expenses
Three months Six months ended June 30 ended June 30 ($ millions) 2007 2006 2007 2006 Comments on variances
Corporate administration $ 33 $ 31 $ 66 $ 65
Interest income 35 26 74 53 Higher interest income in 2007 as a result of higher average cash balances ($2.8 billion) compared to 2006 ($1.2 billion). In the first half of 2006, interest income included a $19 million (02: $8 million) financing fee relating to the agreement to sell certain operations to Goldcorp.
Interest costs
Incurred 57 67 123 124 Lower interest incurred in second quarter 2007 compared to second quarter 2006 due mainly to repayment of amounts outstanding under a $1 billion credit facility ($11 million) and an $850 million second credit facility ($2 million) which was repaid and terminated in second quarter 2006, combined with lower interest due to the repayment on maturity of $500 million in debentures on May 1, 2007 ($7 million) and lower interest on Veladero financing ($2 million), partly offset by higher interest incurred in second quarter 2007 on the copper-linked notes ($16 million).
Capitalized 30 23 60 49 Higher interest capitalized in second quarter 2007 as we began to capitalize interest costs at acquired projects beginning in fourth quarter 2006 after valuations were finalized, including Cortez Hills, Donlin Creek, Pueblo Viejo and Sedibelo. Capitalization at Reko Dig began in fourth quarter 2006 after the project was acquired. We also capitalized amounts for Buzwagi.
Interest expense allocated to discontinued operations
— 10 — 26 Relates to interest on debt related to discontinued operations.
Interest expensed $ 27 $ 34 $ 63 $ 49
Three months Six months ended June 30 ended June 30 ($ millions) 2007 2006 2007 2006 Comments on variances
Regional business unit costs $ 26 $ 14 $ 48 $ 36 Higher costs in second quarter 2007 compared to the same prior year period due to higher costs at Australia Pacific ($4 million), North America ($3 million) and South America ($3 million).
Community development costs 5 — 11 — Relates to amounts accrued for a voluntary contribution to be paid in Peru (02: $3 million; six months ended June 30, 2007: $7 million) and amounts accrued under a MDA to the Tanzanian Government (02: $2 million; six months ended June 20, 2007: $4 million).
Environmental remediation costs — 3 5 6
World Gold Council fees 3 5 6 9
Total $ 34 $ 22 $ 70 $ 51
BARRICK SECOND QUARTER 2007 21 MANAGEMENT’S DISCUSSION AND ANALYSIS
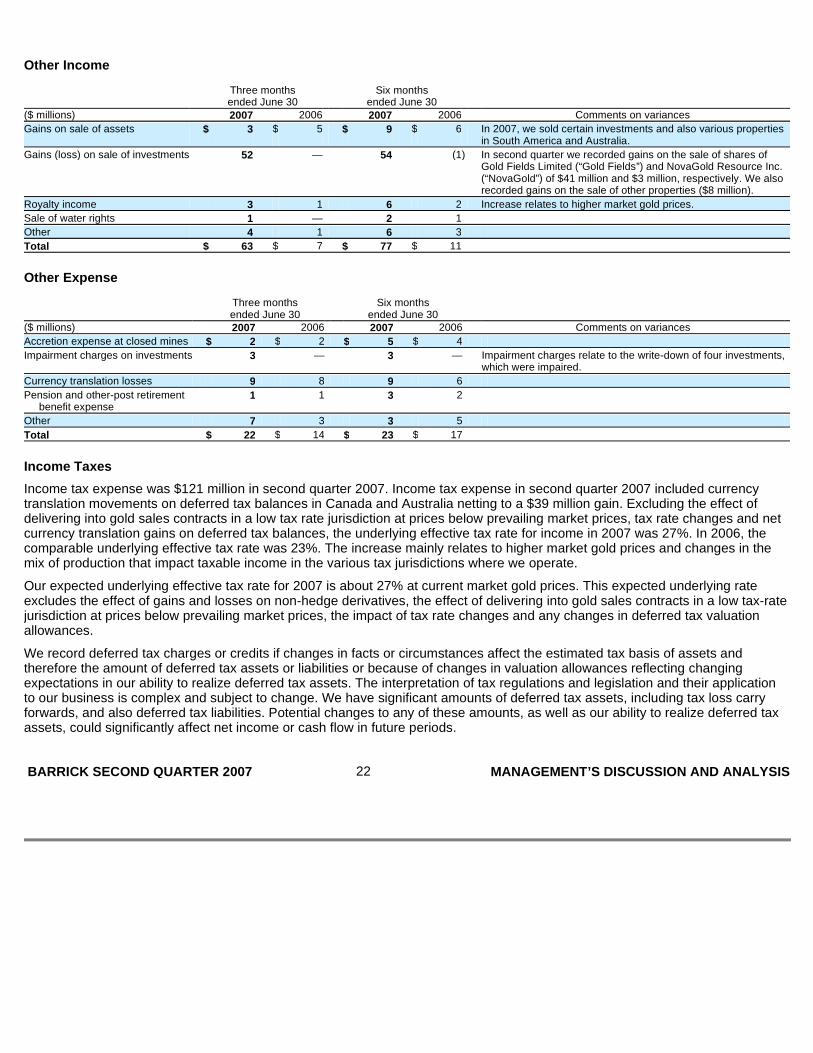
Other Income
Other Expense
Income Taxes
Income tax expense was $121 million in second quarter 2007. Income tax expense in second quarter 2007 included currency translation movements on deferred tax balances in Canada and Australia netting to a $39 million gain. Excluding the effect of delivering into gold sales contracts in a low tax rate jurisdiction at prices below prevailing market prices, tax rate changes and net currency translation gains on deferred tax balances, the underlying effective tax rate for income in 2007 was 27%. In 2006, the comparable underlying effective tax rate was 23%. The increase mainly relates to higher market gold prices and changes in the mix of production that impact taxable income in the various tax jurisdictions where we operate.
Our expected underlying effective tax rate for 2007 is about 27% at current market gold prices. This expected underlying rate excludes the effect of gains and losses on non-hedge derivatives, the effect of delivering into gold sales contracts in a low tax-rate jurisdiction at prices below prevailing market prices, the impact of tax rate changes and any changes in deferred tax valuation allowances.
We record deferred tax charges or credits if changes in facts or circumstances affect the estimated tax basis of assets and therefore the amount of deferred tax assets or liabilities or because of changes in valuation allowances reflecting changing expectations in our ability to realize deferred tax assets. The interpretation of tax regulations and legislation and their application to our business is complex and subject to change. We have significant amounts of deferred tax assets, including tax loss carry forwards, and also deferred tax liabilities. Potential changes to any of these amounts, as well as our ability to realize deferred tax assets, could significantly affect net income or cash flow in future periods.
Three months Six months ended June 30 ended June 30 ($ millions) 2007 2006 2007 2006 Comments on variances
Gains on sale of assets $ 3 $ 5 $ 9 $ 6 In 2007, we sold certain investments and also various properties in South America and Australia.
Gains (loss) on sale of investments 52 — 54 (1 ) In second quarter we recorded gains on the sale of shares of Gold Fields Limited (“Gold Fields”) and NovaGold Resource Inc. (“NovaGold”) of $41 million and $3 million, respectively. We also recorded gains on the sale of other properties ($8 million).
Royalty income 3 1 6 2 Increase relates to higher market gold prices.
Sale of water rights 1 — 2 1
Other 4 1 6 3
Total $ 63 $ 7 $ 77 $ 11
Three months Six months ended June 30 ended June 30 ($ millions) 2007 2006 2007 2006 Comments on variances
Accretion expense at closed mines $ 2 $ 2 $ 5 $ 4
Impairment charges on investments 3 — 3 — Impairment charges relate to the write-down of four investments, which were impaired.
Currency translation losses 9 8 9 6
Pension and other-post retirement benefit expense
1 1 3 2
Other 7 3 3 5
Total $ 22 $ 14 $ 23 $ 17
BARRICK SECOND QUARTER 2007 22 MANAGEMENT’S DISCUSSION AND ANALYSIS

Quarterly Information ($ millions, except where indicated)
Our financial results for the last six quarters reflect rising spot gold prices with a corresponding rise in prices realized from gold sales, partly offset by higher total cash costs, amortization and project development expense in 2007. In fourth quarter 2006, sales and operating cash flow were reduced by $327 million ($312 million post-tax) as a result of the deliveries into Corporate Gold Sales Contracts, and a post-tax gain of $288 million was recorded on the sale of the South Deep mine. In both first and second quarter 2007, we delivered gold into Corporate Gold Sales Contracts, reducing post-tax sales and cash flow by $557 million and $66 million respectively. Operating cash flow on a quarterly basis is affected by the timing of income tax and interest payments. Income tax payments mainly occur in the first half of each year, while interest payments are highest in the second and fourth quarters of the year for debt with semi-annual interest schedules. Adjusted EBITDA trends help to illustrate trends excluding the timing of income tax and interest payments.
2007 2006 Q2 Q1 Q4 Q3 Q2 Q1
Sales 1,2 $ 1,642 $ 1,089 $ 1,351 $ 1,568 $ 1,532 $ 1,188 Net income (loss) 396 (159 ) 418 405 459 224 Net income (loss) per share — basic (dollars) 0.46 (0.18 ) 0.48 0.47 0.53 0.29 Net income (loss) per share — diluted (dollars) 0.45 (0.18 ) 0.48 0.46 0.53 0.29 Adjusted net income 462 398 730 405 459 264 Adjusted net income per share 3 (dollars) 0.54 0.46 0.84 0.47 0.53 0.34 Adjusted EBITDA 812 757 1,035 719 758 461 Adjusted EBITDA per share 3 (dollars) 0.94 0.87 1.20 0.83 0.88 0.59 Adjusted operating cash flow 408 727 664 805 658 425 Adjusted operating cash flow per share 3 (dollars) $ 0.47 $ 0.84 $ 0.77 $ 0.93 $ 0.76 $ 0.55
1 Prior period Sales figures were adjusted for the impact of a change in classification of non-hedge derivative gains and losses. See page 28 for details.
2 Adjusted for the impact of reclassifying sales from our South Deep mine to discontinued operations in third quarter 2006.
3 Calculated using net income and weighted average number of shares outstanding under the Basic method of earnings per share.
BARRICK SECOND QUARTER 2007 23 MANAGEMENT’S DISCUSSION AND ANALYSIS

LIQUIDITY AND CAPITAL RESOURCES
Cash Flow
Key Factors Affecting Operating Cash Flow
Three months ended June 30 Six months ended June 30 Impact on Impact on comparative comparative operating operating cash ($ millions) 2007 2006 cash flows 2007 2006 flows Comments on variances
Gold sales volumes (‘000s oz) 2,006 1,998 $ 2 4,127 3,938 $ 53 See page 8.
Realized gold prices 1 ($/oz) 624 603 42 502 562 (248 ) See page 9.
Total cash costs gold ($/oz) 345 280 (130 ) 329 282 (194 ) See page 9.
Copper sales volumes (millions lbs) 106 98 22 197 177 44 See page 9.
Realized copper prices ($/lbs) 3.43 3.41 3 3.13 2.92 41 See page 9.
Total cash costs copper ($/lbs) 0.77 0.76 1 0.79 0.76 (6 ) See page 9.
Sub-total (60 ) (310 )
Other inflows (outflows)
Higher expenses 2 172 125 (47 ) 308 240 (68 ) See pages 19 to 22.
Non-cash working capital (150 ) (49 ) (101 ) (74 ) (67 ) (7 )
Interest charges (38 ) (22 ) (16 ) 2 27 (25 ) See page 21.
Higher interest income 35 26 9 74 53 21 See page 21.
Taxes paid 219 56 (163 ) 348 92 (256 ) In second quarter 2007, mainly due to payments in Chile ($141 million) and Peru ($56 million).
Effect of other factors 56 101
Total $ (322 ) $ (544 )
1 Realized gold prices for 2007 were reduced by the impact of deliveries into Corporate Gold Sales Contracts of $564 million on the first quarter and $72 million in the second quarter.
2 Includes corporate administration, exploration, project development, and other operating expenses. BARRICK SECOND QUARTER 2007 24 MANAGEMENT’S DISCUSSION AND ANALYSIS
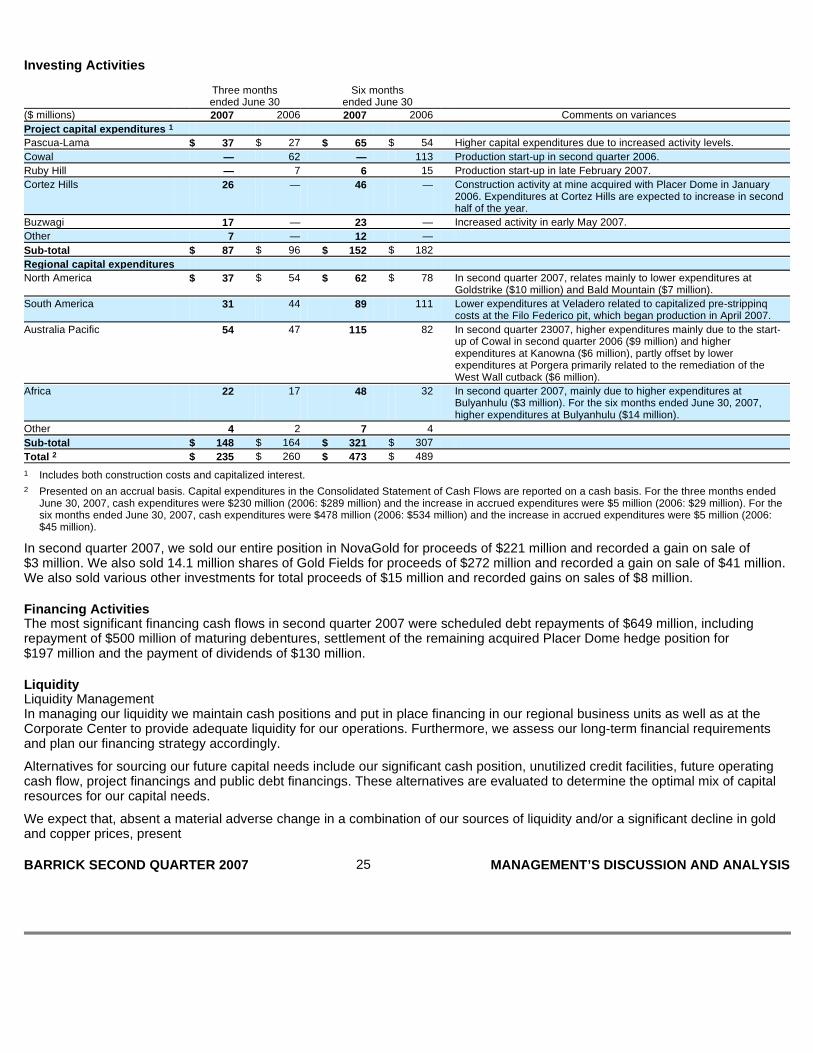
Investing Activities
In second quarter 2007, we sold our entire position in NovaGold for proceeds of $221 million and recorded a gain on sale of $3 million. We also sold 14.1 million shares of Gold Fields for proceeds of $272 million and recorded a gain on sale of $41 million. We also sold various other investments for total proceeds of $15 million and recorded gains on sales of $8 million.
Financing Activities The most significant financing cash flows in second quarter 2007 were scheduled debt repayments of $649 million, including repayment of $500 million of maturing debentures, settlement of the remaining acquired Placer Dome hedge position for $197 million and the payment of dividends of $130 million.
Liquidity Liquidity Management In managing our liquidity we maintain cash positions and put in place financing in our regional business units as well as at the Corporate Center to provide adequate liquidity for our operations. Furthermore, we assess our long-term financial requirements and plan our financing strategy accordingly.
Alternatives for sourcing our future capital needs include our significant cash position, unutilized credit facilities, future operating cash flow, project financings and public debt financings. These alternatives are evaluated to determine the optimal mix of capital resources for our capital needs.
We expect that, absent a material adverse change in a combination of our sources of liquidity and/or a significant decline in gold and copper prices, present
Three months Six months ended June 30 ended June 30 ($ millions) 2007 2006 2007 2006 Comments on variances
Project capital expenditures 1
Pascua-Lama $ 37 $ 27 $ 65 $ 54 Higher capital expenditures due to increased activity levels.
Cowal — 62 — 113 Production start-up in second quarter 2006.
Ruby Hill — 7 6 15 Production start-up in late February 2007.
Cortez Hills 26 — 46 — Construction activity at mine acquired with Placer Dome in January 2006. Expenditures at Cortez Hills are expected to increase in second half of the year.
Buzwagi 17 — 23 — Increased activity in early May 2007.
Other 7 — 12 —
Sub-total $ 87 $ 96 $ 152 $ 182
Regional capital expenditures
North America $ 37 $ 54 $ 62 $ 78 In second quarter 2007, relates mainly to lower expenditures at Goldstrike ($10 million) and Bald Mountain ($7 million).
South America 31 44 89 111 Lower expenditures at Veladero related to capitalized pre-strippinq costs at the Filo Federico pit, which began production in April 2007.
Australia Pacific 54 47 115 82 In second quarter 23007, higher expenditures mainly due to the start-up of Cowal in second quarter 2006 ($9 million) and higher expenditures at Kanowna ($6 million), partly offset by lower expenditures at Porgera primarily related to the remediation of the West Wall cutback ($6 million).
Africa 22 17 48 32 In second quarter 2007, mainly due to higher expenditures at Bulyanhulu ($3 million). For the six months ended June 30, 2007, higher expenditures at Bulyanhulu ($14 million).
Other 4 2 7 4
Sub-total $ 148 $ 164 $ 321 $ 307
Total 2 $ 235 $ 260 $ 473 $ 489
1 Includes both construction costs and capitalized interest.
2 Presented on an accrual basis. Capital expenditures in the Consolidated Statement of Cash Flows are reported on a cash basis. For the three months ended June 30, 2007, cash expenditures were $230 million (2006: $289 million) and the increase in accrued expenditures were $5 million (2006: $29 million). For the six months ended June 30, 2007, cash expenditures were $478 million (2006: $534 million) and the increase in accrued expenditures were $5 million (2006: $45 million).
BARRICK SECOND QUARTER 2007 25 MANAGEMENT’S DISCUSSION AND ANALYSIS
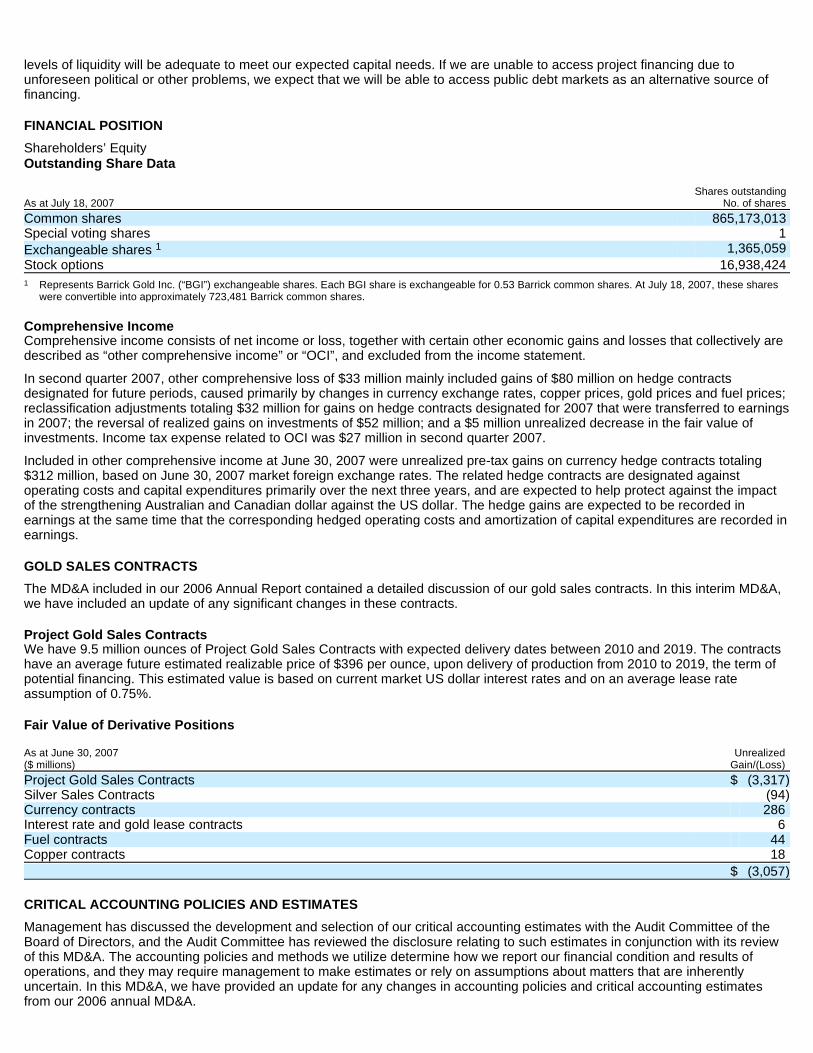
levels of liquidity will be adequate to meet our expected capital needs. If we are unable to access project financing due to unforeseen political or other problems, we expect that we will be able to access public debt markets as an alternative source of financing.
FINANCIAL POSITION
Shareholders’ Equity Outstanding Share Data
Comprehensive Income Comprehensive income consists of net income or loss, together with certain other economic gains and losses that collectively are described as “other comprehensive income” or “OCI”, and excluded from the income statement.
In second quarter 2007, other comprehensive loss of $33 million mainly included gains of $80 million on hedge contracts designated for future periods, caused primarily by changes in currency exchange rates, copper prices, gold prices and fuel prices; reclassification adjustments totaling $32 million for gains on hedge contracts designated for 2007 that were transferred to earnings in 2007; the reversal of realized gains on investments of $52 million; and a $5 million unrealized decrease in the fair value of investments. Income tax expense related to OCI was $27 million in second quarter 2007.
Included in other comprehensive income at June 30, 2007 were unrealized pre-tax gains on currency hedge contracts totaling $312 million, based on June 30, 2007 market foreign exchange rates. The related hedge contracts are designated against operating costs and capital expenditures primarily over the next three years, and are expected to help protect against the impact of the strengthening Australian and Canadian dollar against the US dollar. The hedge gains are expected to be recorded in earnings at the same time that the corresponding hedged operating costs and amortization of capital expenditures are recorded in earnings.
GOLD SALES CONTRACTS
The MD&A included in our 2006 Annual Report contained a detailed discussion of our gold sales contracts. In this interim MD&A, we have included an update of any significant changes in these contracts.
Project Gold Sales Contracts We have 9.5 million ounces of Project Gold Sales Contracts with expected delivery dates between 2010 and 2019. The contracts have an average future estimated realizable price of $396 per ounce, upon delivery of production from 2010 to 2019, the term of potential financing. This estimated value is based on current market US dollar interest rates and on an average lease rate assumption of 0.75%.
Fair Value of Derivative Positions
CRITICAL ACCOUNTING POLICIES AND ESTIMATES
Management has discussed the development and selection of our critical accounting estimates with the Audit Committee of the Board of Directors, and the Audit Committee has reviewed the disclosure relating to such estimates in conjunction with its review of this MD&A. The accounting policies and methods we utilize determine how we report our financial condition and results of operations, and they may require management to make estimates or rely on assumptions about matters that are inherently uncertain. In this MD&A, we have provided an update for any changes in accounting policies and critical accounting estimates from our 2006 annual MD&A.
Shares outstanding As at July 18, 2007 No. of shares
Common shares 865,173,013 Special voting shares 1 Exchangeable shares 1 1,365,059 Stock options 16,938,424
1 Represents Barrick Gold Inc. (“BGI”) exchangeable shares. Each BGI share is exchangeable for 0.53 Barrick common shares. At July 18, 2007, these shares were convertible into approximately 723,481 Barrick common shares.
As at June 30, 2007 Unrealized ($ millions) Gain/(Loss)
Project Gold Sales Contracts $ (3,317 ) Silver Sales Contracts (94 ) Currency contracts 286 Interest rate and gold lease contracts 6 Fuel contracts 44 Copper contracts 18
$ (3,057 )

Critical Accounting Estimates and Judgments Allocation of Goodwill to Reporting Units, Assessment of Goodwill Impairment and Determination of Fair Value We allocate goodwill arising from business combinations to reporting units acquired by preparing estimates of the fair value of the entire reporting unit and comparing this amount to the fair value of assets and liabilities (including intangibles) in the reporting unit. The difference represents the amount of goodwill allocated to each reporting unit.
In 2006 we determined that goodwill should be allocated to reporting units that would either represent components (individual mineral properties) or aggregations of components up to a regional business
BARRICK SECOND QUARTER 2007 26 MANAGEMENT’S DISCUSSION AND ANALYSIS

unit level. As at December 31, 2006, the process of determining the appropriate level to allocate goodwill was ongoing. In fourth quarter 2006, we completed impairment tests of goodwill assuming both no aggregation of mineral properties, and aggregation of mineral properties up to the regional business unit level and determined that there was no impairment at that date under either scenario.
We believe that goodwill arises from our ability to sustain and/or grow our business through our regional business structure, and the value of unique synergies that can be realized from managing a portfolio of mines and mineral properties, rather than from the individual mines. Notwithstanding this fact, at this time we have allocated to goodwill to individual mineral properties. Future impairment testing will be completed at that level.
Goodwill was allocated to acquired mineral properties considering the values of mineral properties exclusive of synergies between Barrick and Placer Dome. In addition, synergy values were allocated to all mineral properties, both existing and acquired, to reflect the estimated impact of the acquisition on the combined companies. Allocating goodwill to individual mineral properties, which by their very nature have a limited useful life, will result in future goodwill impairment charges by the end of the mine life. The timing and amount of future goodwill impairment charges is difficult to determine and will be dependent on a multitude of factors that impact valuations of mineral properties, including changes in observed market multiples for valuation purposes, changes in geo-political risk and country specific discount rates, changes in market gold prices and total cash costs, success in finding new reserves, future exploration potential and future capital requirements.
Gold mining companies typically trade at a market capitalization that is based on a multiple of net asset value determined using a discounted cash flow valuation approach. We estimate the fair value of a reporting unit based on the net present value of its projected future cash flows (“NAV”) and then applying a NAV multiple based on observable trading multiples for comparable public gold mining companies. The process for determining these fair values is subjective and requires management to make estimates and assumptions including, but not limited to, projected future sales and operating expenses, capital expenditures, useful lives of individual mineral properties, discount rates and NAV multiples. Barrick engaged an independent third-party valuator to assist with the determination of fair values for the initial purchase price allocation and subsequent goodwill impairment tests. The projected future sales, operating expenses, capital investment and estimated life for each individual mineral property is based on internal Life of Mine plans prepared for each property that we update in the fourth quarter of each fiscal year. Discount rates are based on a country level real weighted average cost of capital. For individual mineral properties, the NAV multiple considers the median and/or average of observed multiples for comparable public gold companies with operations in similar geographic areas. For mineral properties, with lives of five years or less, the NAV multiple considers the lower end of observed market multiples. These estimates and assumptions are subject to change in the future due to uncertain competitive and market conditions or changes in business strategies. Based on gold mineral reserves at December 31, 2006, our Golden Sunlight, Eskay Creek, Henty, Pierina and Tulawaka mines have a life of up to three years remaining. Due to the short life of these mines, there is a greater likelihood of a near term goodwill impairment occurring. Aggregate goodwill for these mineral properties is $138 million.
Reserve Estimates Used to Measure Amortization of Property, Plant and Equipment
Impact of Historic Changes in Reserve Estimates on Amortization
Fair Value of Asset Retirement Obligations (“AROs”) At our operating mines, we continued to record AROs based on proper closure of the mine. It is reasonably possible that circumstances could arise during or by the end of the mine life that will require material revisions to AROs. In particular, the extent of water treatment can have a material effect on the fair value of AROs. The expected water quality at the end of the mine life, which is the primary driver of the extent of water treatment,
Reserves Amortization increase (decrease) (millions oz/pounds) increase Periods ended June 30, 2007 ($ millions) (decrease) Three months Six Months
Gold North America 2 5.0 $ (4 ) $ (1 ) Australia Pacific 3.5 (13 ) (21 ) Africa 0.5 (8 ) (13 ) South America 0.1 (17 ) (24 )
Total Gold 9.1 (42 ) (59 )
Copper Australia Pacific 89 (2 ) (3 ) South America 255 — —
Total Copper 344 $ (2 ) $ (3 )
1 Each year we update our reserve estimates as at the end of the year as part of our normal business cycle. Reserve changes presented were calculated as at the end of 2006 and are in millions of contained ounces/pounds.
2 Decrease in reserves at certain mines had a greater impact on amortization for the current period than did increases in reserves at other mine sites within the region.
BARRICK SECOND QUARTER 2007 27 MANAGEMENT’S DISCUSSION AND ANALYSIS


can change significantly over the life of a mine. The period of time over which we have assumed that water quality monitoring and treatment will be required has a significant impact on AROs at closed mines. The amount of AROs recorded reflects the expected cost, taking into account the probability of particular scenarios. In the first quarter 2007, we recorded an adjustment of $29 million for a change in estimate of the ARO at our Hemlo property following receipt of an updated closure study for the property. This adjustment was recorded with a corresponding adjustment to property, plant and equipment.
Accounting Policy Changes FASB Interpretation No. 48, Accounting for Uncertainty in Income Taxes-an interpretation of FASB Statement No. 109 (“FIN 48”) In June 2006, the Financial Accounting Standards Board (FASB) issued FIN 48, to create a single model to address accounting for uncertainty in tax positions. FIN 48 clarifies the accounting for income taxes, by prescribing a minimum recognition threshold a tax position is required to meet before being recognized in the financial statements. FIN 48 also provides guidance on de-recognition, measurement, classification, interest and penalties, accounting in interim periods, disclosure and transition. FIN 48 is effective for fiscal years beginning after December 15, 2006.
We adopted the provisions of FIN 48 on January 1, 2007. As a result of the implementation of FIN 48, an adjustment to the liability for unrecognized tax benefits was not required; consequently there was no cumulative effect adjustment to the January 1, 2007 balance of retained earnings. The total amount of the liability for unrecognized tax benefits as of January 1, 2007 is $20 million. The full amount of the liability for unrecognized tax benefits, if recognized in a future period, would affect the effective tax rate. The total amount of interest and penalties, included above, as of the date of adoption was $1 million, which had previously been recorded as tax reserve items under FAS 5, Accounting for Contingencies. We expect the amount of unrecognized tax benefits to decrease within 12 months of the reporting date by approximately $3 to $5 million, related primarily to expected settlement and payment of Canadian mining tax assessments. There were no material changes to the liability for unrecognized tax benefits in the first or second quarter.
We file income tax returns in Canada and several foreign jurisdictions. We are no longer subject to income tax audits by taxing authorities in the following jurisdictions: Canada, Argentina, and Papua New Guinea prior to 2002; United States prior to 2003; Peru and Chile prior to 2004. For other foreign jurisdictions, including Australia and Tanzania, all years remain subject to tax authority examination.
FSP No. AUG AIR - 1 - Accounting for Planned Major Maintenance Activities (“FSP AIR-1”) On January 1, 2007, we adopted FSP AIR-1 which amends guidance from the AICPA Industry Audit Guide, Audits of Airlines (“Airline Guide”) with respect to planned major maintenance activities and makes this guidance applicable to entities in all industries. Of the three methods of accounting for planned major maintenance allowed by FSP AIR-1, we have adopted the built-in overhaul method. The built-in overhaul method is based on segregation of plant and equipment costs into those that should be depreciated over the useful life of the asset and those that require overhaul at periodic intervals. Thus, the estimated cost of the overhaul component included in the purchase price of an asset is set up separately from the cost of the asset and is amortized to the date of the initial overhaul. The cost of the initial overhaul is then capitalized and amortized to the next overhaul, at which time the process is repeated. We have applied the provisions of FSP AIR-1. We adopted FSP AIR-1 on January 1, 2007. The implementation of this standard did not have a material impact on our Financial Statements.
Financial Statement Presentation of Non-Hedge Derivative Gains and Losses In first quarter 2007, we made a change in the way we present the gains or losses related to non-hedge derivative contracts. Beginning in first quarter 2007, we recorded changes in the fair value of these derivative contracts in the income statement line item associated with the intended purpose of the instrument. Prior to this change, we recorded the change in fair value of all non-hedge derivative gains and losses as a component of other income, with the exception of changes in the fair value embedded derivatives implicit in our concentrate sales contracts, which were recorded as a component of revenue. For more information on this change in presentation, please see Note 2 to the Financial Statements.
Future Accounting Policy Changes FAS 157 Fair Value Measurements In September 2006, the FASB issued FAS 157 which provides enhanced guidance for using fair value to measure assets and liabilities. FAS 157 is meant to remedy the diversity and inconsistency within generally accepted accounting principles in measuring fair value. FAS 157 applies whenever other standards require (or permit) assets or liabilities to be measured at fair value.
BARRICK SECOND QUARTER 2007 28 MANAGEMENT’S DISCUSSION AND ANALYSIS
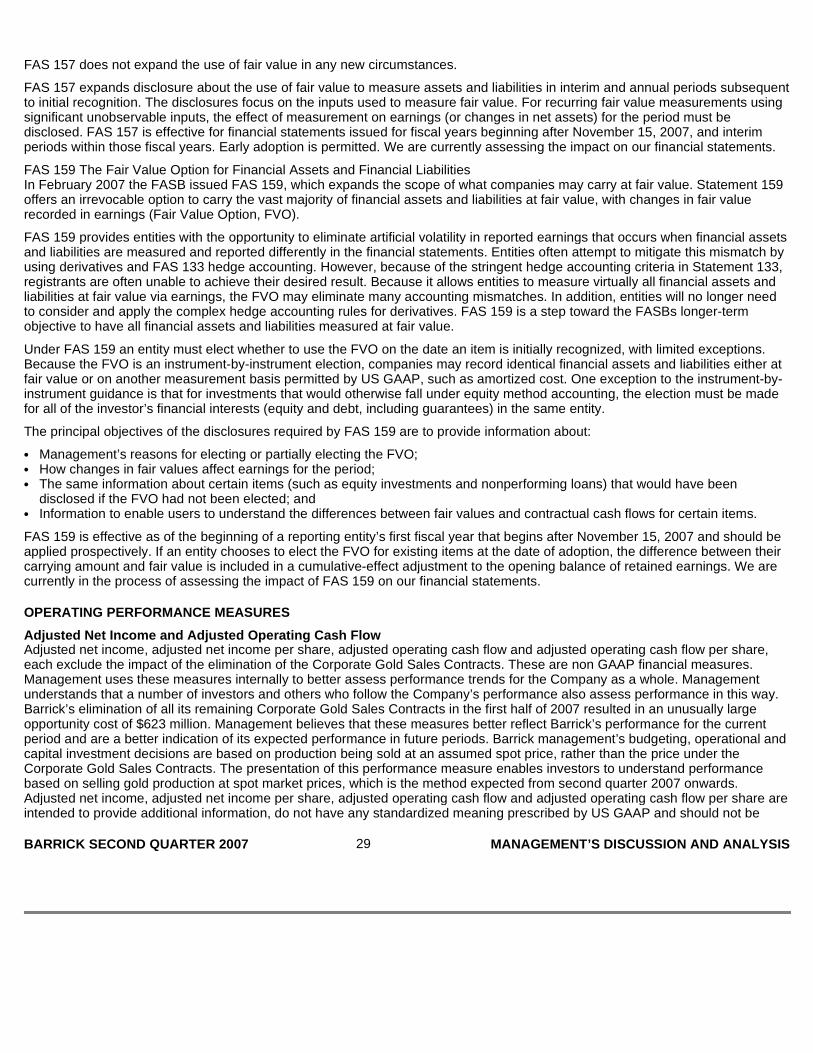
FAS 157 does not expand the use of fair value in any new circumstances.
FAS 157 expands disclosure about the use of fair value to measure assets and liabilities in interim and annual periods subsequent to initial recognition. The disclosures focus on the inputs used to measure fair value. For recurring fair value measurements using significant unobservable inputs, the effect of measurement on earnings (or changes in net assets) for the period must be disclosed. FAS 157 is effective for financial statements issued for fiscal years beginning after November 15, 2007, and interim periods within those fiscal years. Early adoption is permitted. We are currently assessing the impact on our financial statements.
FAS 159 The Fair Value Option for Financial Assets and Financial Liabilities In February 2007 the FASB issued FAS 159, which expands the scope of what companies may carry at fair value. Statement 159 offers an irrevocable option to carry the vast majority of financial assets and liabilities at fair value, with changes in fair value recorded in earnings (Fair Value Option, FVO).
FAS 159 provides entities with the opportunity to eliminate artificial volatility in reported earnings that occurs when financial assets and liabilities are measured and reported differently in the financial statements. Entities often attempt to mitigate this mismatch by using derivatives and FAS 133 hedge accounting. However, because of the stringent hedge accounting criteria in Statement 133, registrants are often unable to achieve their desired result. Because it allows entities to measure virtually all financial assets and liabilities at fair value via earnings, the FVO may eliminate many accounting mismatches. In addition, entities will no longer need to consider and apply the complex hedge accounting rules for derivatives. FAS 159 is a step toward the FASBs longer-term objective to have all financial assets and liabilities measured at fair value.
Under FAS 159 an entity must elect whether to use the FVO on the date an item is initially recognized, with limited exceptions. Because the FVO is an instrument-by-instrument election, companies may record identical financial assets and liabilities either at fair value or on another measurement basis permitted by US GAAP, such as amortized cost. One exception to the instrument-by-instrument guidance is that for investments that would otherwise fall under equity method accounting, the election must be made for all of the investor’s financial interests (equity and debt, including guarantees) in the same entity.
The principal objectives of the disclosures required by FAS 159 are to provide information about:
FAS 159 is effective as of the beginning of a reporting entity’s first fiscal year that begins after November 15, 2007 and should be applied prospectively. If an entity chooses to elect the FVO for existing items at the date of adoption, the difference between their carrying amount and fair value is included in a cumulative-effect adjustment to the opening balance of retained earnings. We are currently in the process of assessing the impact of FAS 159 on our financial statements.
OPERATING PERFORMANCE MEASURES
Adjusted Net Income and Adjusted Operating Cash Flo w Adjusted net income, adjusted net income per share, adjusted operating cash flow and adjusted operating cash flow per share, each exclude the impact of the elimination of the Corporate Gold Sales Contracts. These are non GAAP financial measures. Management uses these measures internally to better assess performance trends for the Company as a whole. Management understands that a number of investors and others who follow the Company’s performance also assess performance in this way. Barrick’s elimination of all its remaining Corporate Gold Sales Contracts in the first half of 2007 resulted in an unusually large opportunity cost of $623 million. Management believes that these measures better reflect Barrick’s performance for the current period and are a better indication of its expected performance in future periods. Barrick management’s budgeting, operational and capital investment decisions are based on production being sold at an assumed spot price, rather than the price under the Corporate Gold Sales Contracts. The presentation of this performance measure enables investors to understand performance based on selling gold production at spot market prices, which is the method expected from second quarter 2007 onwards. Adjusted net income, adjusted net income per share, adjusted operating cash flow and adjusted operating cash flow per share are intended to provide additional information, do not have any standardized meaning prescribed by US GAAP and should not be
• Management’s reasons for electing or partially electing the FVO; • How changes in fair values affect earnings for the period; • The same information about certain items (such as equity investments and nonperforming loans) that would have been
disclosed if the FVO had not been elected; and • Information to enable users to understand the differences between fair values and contractual cash flows for certain items.
BARRICK SECOND QUARTER 2007 29 MANAGEMENT’S DISCUSSION AND ANALYSIS
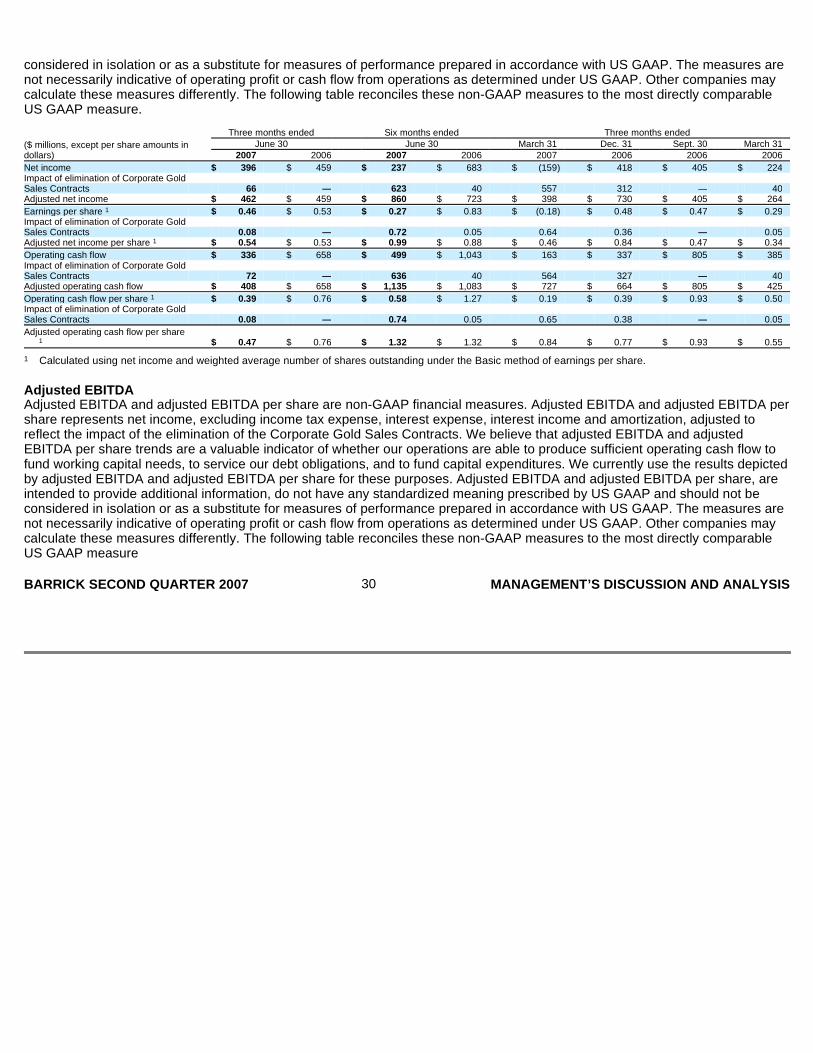
considered in isolation or as a substitute for measures of performance prepared in accordance with US GAAP. The measures are not necessarily indicative of operating profit or cash flow from operations as determined under US GAAP. Other companies may calculate these measures differently. The following table reconciles these non-GAAP measures to the most directly comparable US GAAP measure.
Adjusted EBITDA Adjusted EBITDA and adjusted EBITDA per share are non-GAAP financial measures. Adjusted EBITDA and adjusted EBITDA per share represents net income, excluding income tax expense, interest expense, interest income and amortization, adjusted to reflect the impact of the elimination of the Corporate Gold Sales Contracts. We believe that adjusted EBITDA and adjusted EBITDA per share trends are a valuable indicator of whether our operations are able to produce sufficient operating cash flow to fund working capital needs, to service our debt obligations, and to fund capital expenditures. We currently use the results depicted by adjusted EBITDA and adjusted EBITDA per share for these purposes. Adjusted EBITDA and adjusted EBITDA per share, are intended to provide additional information, do not have any standardized meaning prescribed by US GAAP and should not be considered in isolation or as a substitute for measures of performance prepared in accordance with US GAAP. The measures are not necessarily indicative of operating profit or cash flow from operations as determined under US GAAP. Other companies may calculate these measures differently. The following table reconciles these non-GAAP measures to the most directly comparable US GAAP measure
Three months ended Six months ended Three months ended ($ millions, except per share amounts in June 30 June 30 March 31 Dec. 31 Sept. 30 March 31 dollars) 2007 2006 2007 2006 2007 2006 2006 2006
Net income $ 396 $ 459 $ 237 $ 683 $ (159 ) $ 418 $ 405 $ 224 Impact of elimination of Corporate Gold Sales Contracts 66 — 623 40 557 312 — 40 Adjusted net income $ 462 $ 459 $ 860 $ 723 $ 398 $ 730 $ 405 $ 264
Earnings per share 1 $ 0.46 $ 0.53 $ 0.27 $ 0.83 $ (0.18 ) $ 0.48 $ 0.47 $ 0.29 Impact of elimination of Corporate Gold Sales Contracts 0.08 — 0.72 0.05 0.64 0.36 — 0.05 Adjusted net income per share 1 $ 0.54 $ 0.53 $ 0.99 $ 0.88 $ 0.46 $ 0.84 $ 0.47 $ 0.34
Operating cash flow $ 336 $ 658 $ 499 $ 1,043 $ 163 $ 337 $ 805 $ 385 Impact of elimination of Corporate Gold Sales Contracts 72 — 636 40 564 327 — 40 Adjusted operating cash flow $ 408 $ 658 $ 1,135 $ 1,083 $ 727 $ 664 $ 805 $ 425
Operating cash flow per share 1 $ 0.39 $ 0.76 $ 0.58 $ 1.27 $ 0.19 $ 0.39 $ 0.93 $ 0.50 Impact of elimination of Corporate Gold Sales Contracts 0.08 — 0.74 0.05 0.65 0.38 — 0.05
Adjusted operating cash flow per share 1 $ 0.47 $ 0.76 $ 1.32 $ 1.32 $ 0.84 $ 0.77 $ 0.93 $ 0.55
1 Calculated using net income and weighted average number of shares outstanding under the Basic method of earnings per share.
BARRICK SECOND QUARTER 2007 30 MANAGEMENT’S DISCUSSION AND ANALYSIS

Realized Prices Management uses a performance measure internally that represents revenues under US GAAP, adjusted for unrealized gains and losses on non-hedge derivatives. The use of this measure is intended to enable management to better understand the price realized each period for gold and copper sales. Management believes that this measure better reflects Barrick’s performance in each period and is a better indication of its expected performance in future periods. Changes in the unrealized mark to market value of non-hedge gold and copper derivatives occur each period due to changes in market factors such as spot and forward gold and copper prices. The exclusion of such unrealized mark to market gains and losses from the presentation of this performance measure enables investors to understand performance based on the realized proceeds of selling gold and copper production. Management includes such unrealized mark to market gains and losses in a list of “special items” that have affected its results. These gains and losses relate to derivative instruments that mature in future periods, at which time the gains and losses will become realized. The amounts of these gains and losses reflect fair values based on market valuation assumptions at the end of each period and do not necessarily represent the amounts that will become realized on maturity. Barrick’s realized price statistics, excluding unrealized mark to market value of non hedge gold and copper derivatives are intended to provide additional information, do not have any standardized meaning prescribed by US GAAP and should not be considered in isolation or as a substitute for measures of performance prepared in accordance with US GAAP. The measures are not necessarily indicative of operating profit or cash flow from operations as determined under US GAAP. Other companies may calculate these measures differently. The following table reconciles these non-GAAP measures to the most directly comparable US GAAP measure.
Three months ended Six months ended Three months ended June 30 June 30 March 31, Dec. 31, Sept. 30, March 31, ($ millions, except per share amounts in dollars) 2007 2006 2007 2006 2007 2006 2006 2006
Net income $ 396 $ 459 $ 237 $ 683 $ (159 ) $ 418 $ 405 $ 224 Income taxes 121 131 268 175 147 66 107 44 Interest expense 27 34 63 49 36 32 39 15 Interest income (35 ) (26 ) (74 ) (53 ) (39 ) (31 ) (18 ) (27 ) Amortization 231 160 439 325 208 223 186 165
$ 740 $ 758 $ 933 $ 1,179 $ 193 $ 708 $ 719 $ 421 Impact of elimination of Corporate Gold Sales
Contracts 72 — 636 40 564 327 — 40 Adjusted EBITDA 812 758 1,569 1,219 757 1,035 719 461 Adjusted EBITDA per share 1 $ 0.94 $ 0.88 $ 1.82 $ 1.49 $ 0.87 $ 1.20 $ 0.83 $ 0.59
1 Calculated using net income and weighted average number of shares outstanding under the Basic method of earnings per share.
BARRICK SECOND QUARTER 2007 31 MANAGEMENT’S DISCUSSION AND ANALYSIS
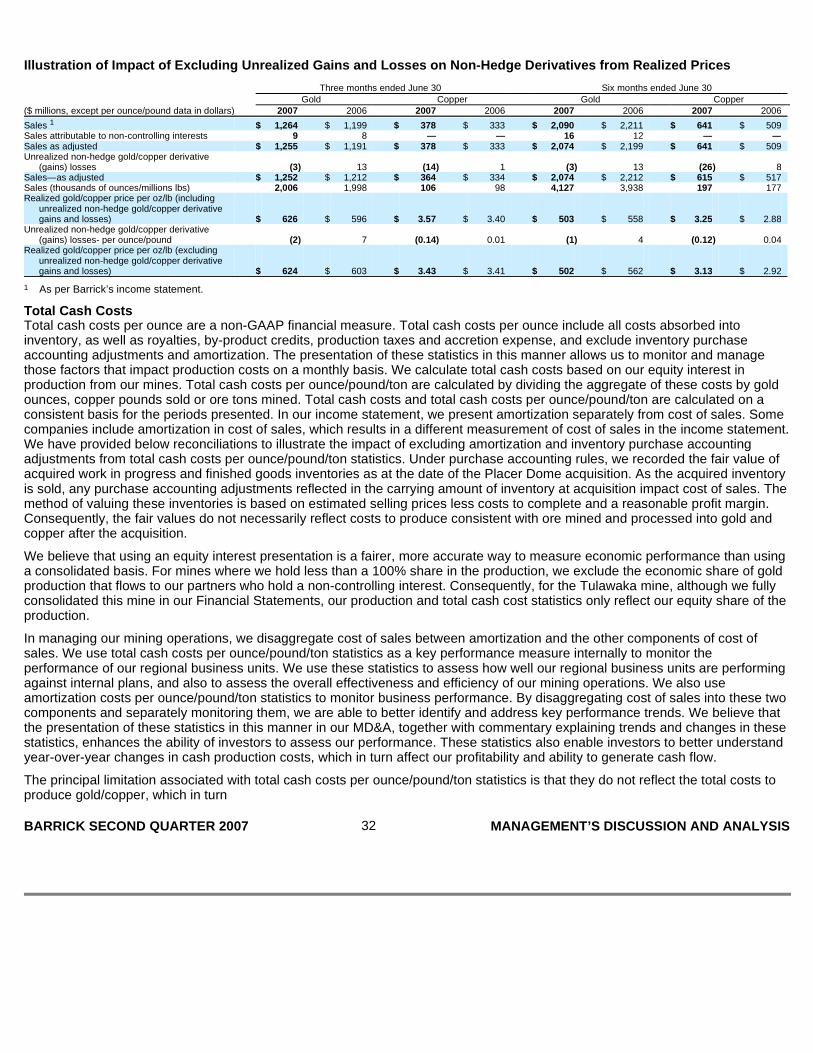
Illustration of Impact of Excluding Unrealized Gain s and Losses on Non-Hedge Derivatives from Realized Prices
Total Cash Costs Total cash costs per ounce are a non-GAAP financial measure. Total cash costs per ounce include all costs absorbed into inventory, as well as royalties, by-product credits, production taxes and accretion expense, and exclude inventory purchase accounting adjustments and amortization. The presentation of these statistics in this manner allows us to monitor and manage those factors that impact production costs on a monthly basis. We calculate total cash costs based on our equity interest in production from our mines. Total cash costs per ounce/pound/ton are calculated by dividing the aggregate of these costs by gold ounces, copper pounds sold or ore tons mined. Total cash costs and total cash costs per ounce/pound/ton are calculated on a consistent basis for the periods presented. In our income statement, we present amortization separately from cost of sales. Some companies include amortization in cost of sales, which results in a different measurement of cost of sales in the income statement. We have provided below reconciliations to illustrate the impact of excluding amortization and inventory purchase accounting adjustments from total cash costs per ounce/pound/ton statistics. Under purchase accounting rules, we recorded the fair value of acquired work in progress and finished goods inventories as at the date of the Placer Dome acquisition. As the acquired inventory is sold, any purchase accounting adjustments reflected in the carrying amount of inventory at acquisition impact cost of sales. The method of valuing these inventories is based on estimated selling prices less costs to complete and a reasonable profit margin. Consequently, the fair values do not necessarily reflect costs to produce consistent with ore mined and processed into gold and copper after the acquisition.
We believe that using an equity interest presentation is a fairer, more accurate way to measure economic performance than using a consolidated basis. For mines where we hold less than a 100% share in the production, we exclude the economic share of gold production that flows to our partners who hold a non-controlling interest. Consequently, for the Tulawaka mine, although we fully consolidated this mine in our Financial Statements, our production and total cash cost statistics only reflect our equity share of the production.
In managing our mining operations, we disaggregate cost of sales between amortization and the other components of cost of sales. We use total cash costs per ounce/pound/ton statistics as a key performance measure internally to monitor the performance of our regional business units. We use these statistics to assess how well our regional business units are performing against internal plans, and also to assess the overall effectiveness and efficiency of our mining operations. We also use amortization costs per ounce/pound/ton statistics to monitor business performance. By disaggregating cost of sales into these two components and separately monitoring them, we are able to better identify and address key performance trends. We believe that the presentation of these statistics in this manner in our MD&A, together with commentary explaining trends and changes in these statistics, enhances the ability of investors to assess our performance. These statistics also enable investors to better understand year-over-year changes in cash production costs, which in turn affect our profitability and ability to generate cash flow.
The principal limitation associated with total cash costs per ounce/pound/ton statistics is that they do not reflect the total costs to produce gold/copper, which in turn
Three months ended June 30 Six months ended June 30 Gold Copper Gold Copper ($ millions, except per ounce/pound data in dollars) 2007 2006 2007 2006 2007 2006 2007 2006
Sales 1 $ 1,264 $ 1,199 $ 378 $ 333 $ 2,090 $ 2,211 $ 641 $ 509 Sales attributable to non-controlling interests 9 8 — — 16 12 — — Sales as adjusted $ 1,255 $ 1,191 $ 378 $ 333 $ 2,074 $ 2,199 $ 641 $ 509 Unrealized non-hedge gold/copper derivative
(gains) losses (3 ) 13 (14 ) 1 (3 ) 13 (26 ) 8 Sales—as adjusted $ 1,252 $ 1,212 $ 364 $ 334 $ 2,074 $ 2,212 $ 615 $ 517 Sales (thousands of ounces/millions lbs) 2,006 1,998 106 98 4,127 3,938 197 177 Realized gold/copper price per oz/lb (including
unrealized non-hedge gold/copper derivative gains and losses) $ 626 $ 596 $ 3.57 $ 3.40 $ 503 $ 558 $ 3.25 $ 2.88
Unrealized non-hedge gold/copper derivative (gains) losses- per ounce/pound (2 ) 7 (0.14 ) 0.01 (1 ) 4 (0.12 ) 0.04
Realized gold/copper price per oz/lb (excluding unrealized non-hedge gold/copper derivative gains and losses) $ 624 $ 603 $ 3.43 $ 3.41 $ 502 $ 562 $ 3.13 $ 2.92
1 As per Barrick’s income statement.
BARRICK SECOND QUARTER 2007 32 MANAGEMENT’S DISCUSSION AND ANALYSIS
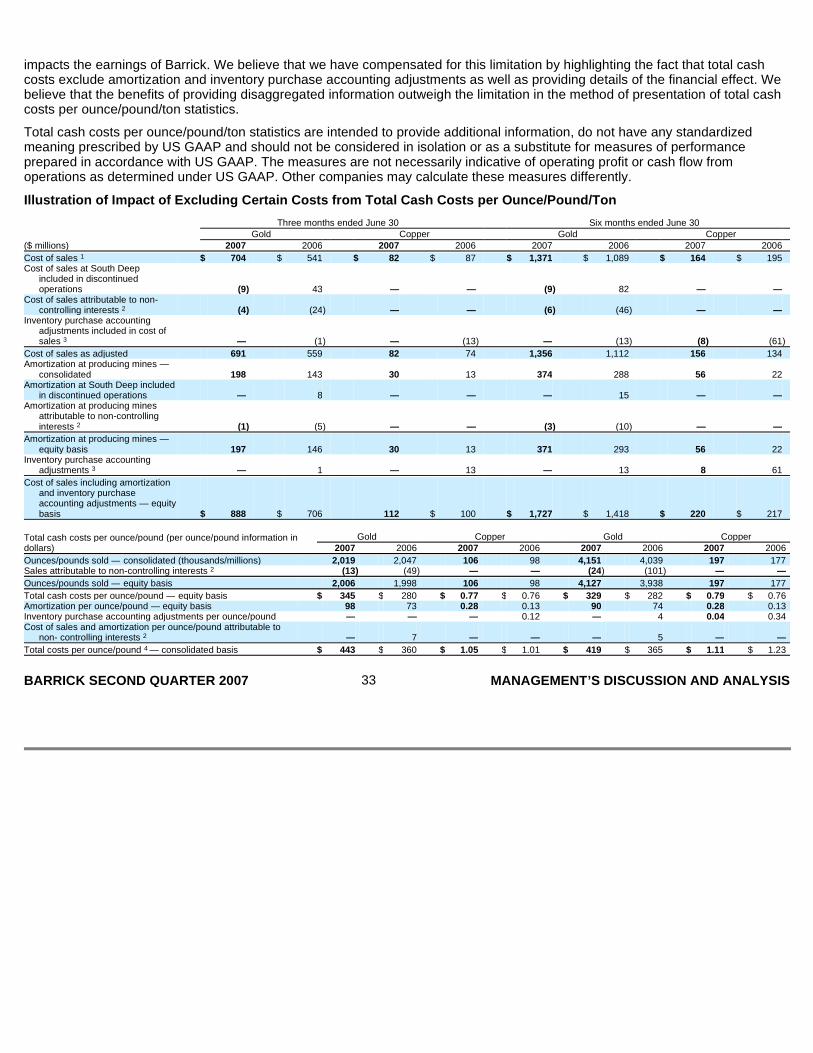
impacts the earnings of Barrick. We believe that we have compensated for this limitation by highlighting the fact that total cash costs exclude amortization and inventory purchase accounting adjustments as well as providing details of the financial effect. We believe that the benefits of providing disaggregated information outweigh the limitation in the method of presentation of total cash costs per ounce/pound/ton statistics.
Total cash costs per ounce/pound/ton statistics are intended to provide additional information, do not have any standardized meaning prescribed by US GAAP and should not be considered in isolation or as a substitute for measures of performance prepared in accordance with US GAAP. The measures are not necessarily indicative of operating profit or cash flow from operations as determined under US GAAP. Other companies may calculate these measures differently.
Illustration of Impact of Excluding Certain Costs f rom Total Cash Costs per Ounce/Pound/Ton
Three months ended June 30 Six months ended June 30 Gold Copper Gold Copper ($ millions) 2007 2006 2007 2006 2007 2006 2007 2006
Cost of sales 1 $ 704 $ 541 $ 82 $ 87 $ 1,371 $ 1,089 $ 164 $ 195 Cost of sales at South Deep
included in discontinued operations (9 ) 43 — — (9 ) 82 — —
Cost of sales attributable to non-controlling interests 2 (4 ) (24 ) — — (6 ) (46 ) — —
Inventory purchase accounting adjustments included in cost of sales 3 — (1 ) — (13 ) — (13 ) (8 ) (61 )
Cost of sales as adjusted 691 559 82 74 1,356 1,112 156 134 Amortization at producing mines —
consolidated 198 143 30 13 374 288 56 22 Amortization at South Deep included
in discontinued operations — 8 — — — 15 — — Amortization at producing mines
attributable to non-controlling interests 2 (1 ) (5 ) — — (3 ) (10 ) — —
Amortization at producing mines — equity basis 197 146 30 13 371 293 56 22
Inventory purchase accounting adjustments 3 — 1 — 13 — 13 8 61
Cost of sales including amortization and inventory purchase accounting adjustments — equity basis $ 888 $ 706 112 $ 100 $ 1,727 $ 1,418 $ 220 $ 217
Total cash costs per ounce/pound (per ounce/pound information in Gold Copper Gold Copper dollars) 2007 2006 2007 2006 2007 2006 2007 2006
Ounces/pounds sold — consolidated (thousands/millions) 2,019 2,047 106 98 4,151 4,039 197 177 Sales attributable to non-controlling interests 2 (13 ) (49 ) — — (24 ) (101 ) — —
Ounces/pounds sold — equity basis 2,006 1,998 106 98 4,127 3,938 197 177
Total cash costs per ounce/pound — equity basis $ 345 $ 280 $ 0.77 $ 0.76 $ 329 $ 282 $ 0.79 $ 0.76 Amortization per ounce/pound — equity basis 98 73 0.28 0.13 90 74 0.28 0.13 Inventory purchase accounting adjustments per ounce/pound — — — 0.12 — 4 0.04 0.34 Cost of sales and amortization per ounce/pound attributable to
non- controlling interests 2 — 7 — — — 5 — —
Total costs per ounce/pound 4 — consolidated basis $ 443 $ 360 $ 1.05 $ 1.01 $ 419 $ 365 $ 1.11 $ 1.23
BARRICK SECOND QUARTER 2007 33 MANAGEMENT’S DISCUSSION AND ANALYSIS
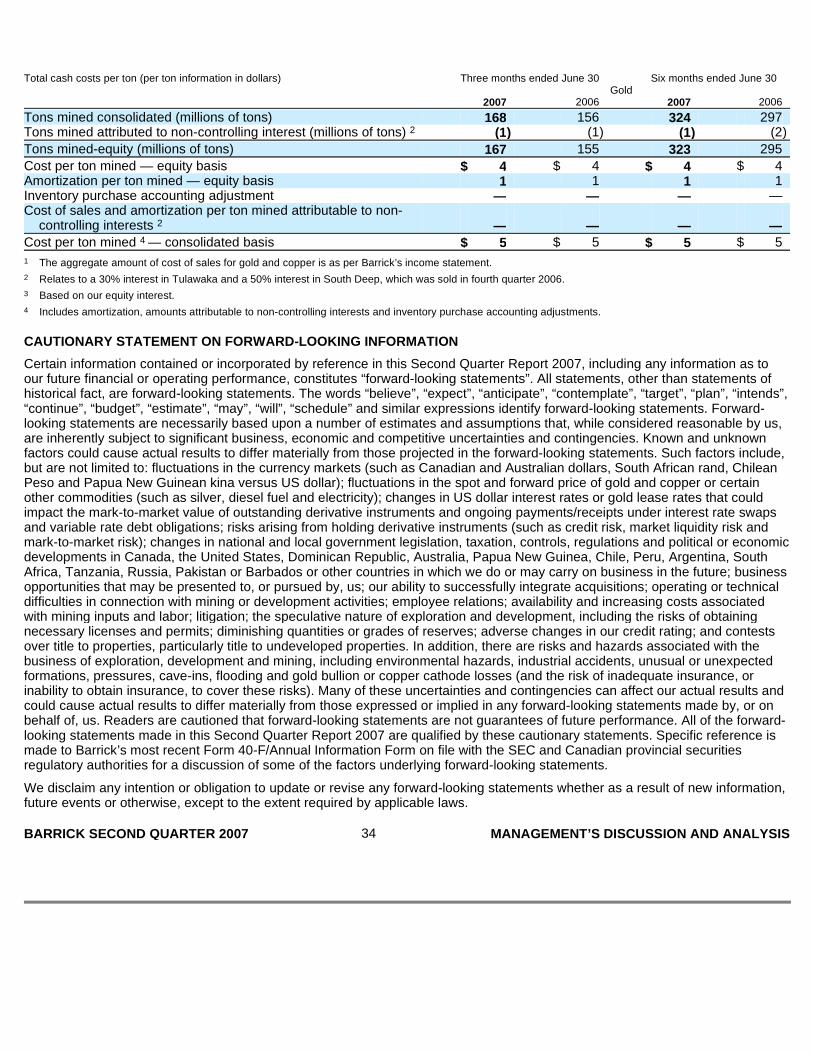
CAUTIONARY STATEMENT ON FORWARD-LOOKING INFORMATION
Certain information contained or incorporated by reference in this Second Quarter Report 2007, including any information as to our future financial or operating performance, constitutes “forward-looking statements”. All statements, other than statements of historical fact, are forward-looking statements. The words “believe”, “expect”, “anticipate”, “contemplate”, “target”, “plan”, “intends”, “continue”, “budget”, “estimate”, “may”, “will”, “schedule” and similar expressions identify forward-looking statements. Forward-looking statements are necessarily based upon a number of estimates and assumptions that, while considered reasonable by us, are inherently subject to significant business, economic and competitive uncertainties and contingencies. Known and unknown factors could cause actual results to differ materially from those projected in the forward-looking statements. Such factors include, but are not limited to: fluctuations in the currency markets (such as Canadian and Australian dollars, South African rand, Chilean Peso and Papua New Guinean kina versus US dollar); fluctuations in the spot and forward price of gold and copper or certain other commodities (such as silver, diesel fuel and electricity); changes in US dollar interest rates or gold lease rates that could impact the mark-to-market value of outstanding derivative instruments and ongoing payments/receipts under interest rate swaps and variable rate debt obligations; risks arising from holding derivative instruments (such as credit risk, market liquidity risk and mark-to-market risk); changes in national and local government legislation, taxation, controls, regulations and political or economic developments in Canada, the United States, Dominican Republic, Australia, Papua New Guinea, Chile, Peru, Argentina, South Africa, Tanzania, Russia, Pakistan or Barbados or other countries in which we do or may carry on business in the future; business opportunities that may be presented to, or pursued by, us; our ability to successfully integrate acquisitions; operating or technical difficulties in connection with mining or development activities; employee relations; availability and increasing costs associated with mining inputs and labor; litigation; the speculative nature of exploration and development, including the risks of obtaining necessary licenses and permits; diminishing quantities or grades of reserves; adverse changes in our credit rating; and contests over title to properties, particularly title to undeveloped properties. In addition, there are risks and hazards associated with the business of exploration, development and mining, including environmental hazards, industrial accidents, unusual or unexpected formations, pressures, cave-ins, flooding and gold bullion or copper cathode losses (and the risk of inadequate insurance, or inability to obtain insurance, to cover these risks). Many of these uncertainties and contingencies can affect our actual results and could cause actual results to differ materially from those expressed or implied in any forward-looking statements made by, or on behalf of, us. Readers are cautioned that forward-looking statements are not guarantees of future performance. All of the forward-looking statements made in this Second Quarter Report 2007 are qualified by these cautionary statements. Specific reference is made to Barrick’s most recent Form 40-F/Annual Information Form on file with the SEC and Canadian provincial securities regulatory authorities for a discussion of some of the factors underlying forward-looking statements.
We disclaim any intention or obligation to update or revise any forward-looking statements whether as a result of new information, future events or otherwise, except to the extent required by applicable laws.
Total cash costs per ton (per ton information in dollars) Three months ended June 30 Six months ended June 30 Gold 2007 2006 2007 2006
Tons mined consolidated (millions of tons) 168 156 324 297 Tons mined attributed to non-controlling interest (millions of tons) 2 (1 ) (1 ) (1 ) (2 )
Tons mined-equity (millions of tons) 167 155 323 295
Cost per ton mined — equity basis $ 4 $ 4 $ 4 $ 4 Amortization per ton mined — equity basis 1 1 1 1 Inventory purchase accounting adjustment — — — — Cost of sales and amortization per ton mined attributable to non-
controlling interests 2 — — — —
Cost per ton mined 4 — consolidated basis $ 5 $ 5 $ 5 $ 5
1 The aggregate amount of cost of sales for gold and copper is as per Barrick’s income statement.
2 Relates to a 30% interest in Tulawaka and a 50% interest in South Deep, which was sold in fourth quarter 2006.
3 Based on our equity interest.
4 Includes amortization, amounts attributable to non-controlling interests and inventory purchase accounting adjustments.
BARRICK SECOND QUARTER 2007 34 MANAGEMENT’S DISCUSSION AND ANALYSIS

Consolidated Statements of Income
The accompanying notes are an integral part of these unaudited interim consolidated financial statements.
Barrick Gold Corporation Three months ended Six months ended (in millions of United States dollars, except per share data) (Unaudited) June 30, June 30, 2007 2006 2007 2006
Sales (notes 4 and 5) $ 1,642 $ 1,532 $ 2,731 $ 2,720 Costs and expenses Cost of sales (note 6) 1 786 628 1,535 1,284 Amortization (note 4) 231 160 439 325 Corporate administration 33 31 66 65 Exploration 40 44 70 77 Project development expense (note 13) 65 28 102 47 Other operating expenses (note 7A) 34 22 70 51
1,189 913 2,282 1,849
Other (income) expense Interest income (35 ) (26 ) (74 ) (53 ) Interest expense (note 158) 27 34 63 49 Other income (note 7B) (63 ) (7 ) (77 ) (11 ) Other expense (note 7 C) 22 14 23 17
(49 ) 15 (65 ) 2
Income from continuing operations before income tax es and other items 502 604 514 869
Income tax expense (note 8) (121 ) (131 ) (268 ) (175 ) Non-controlling interests (note 2B) 11 (8 ) 8 (3 ) Loss from equity accounted investees (note 11) (5 ) (2 ) (26 ) (2 )
Income from continuing operations 387 463 228 689 Discontinued operations
Gain (loss) from discontinued operations (note 3D) 9 (5 ) 9 (6 ) Income tax recovery — 1 — —
Net income for the period $ 396 $ 459 $ 237 $ 683
Earnings per share data (note 9): Income from continuing operations
Basic $ 0.45 $ 0.54 $ 0.26 $ 0.84 Diluted $ 0.44 $ 0.53 $ 0.26 $ 0.83
Net income Basic $ 0.46 $ 0.53 $ 0.27 $ 0.83 Diluted $ 0.45 $ 0.53 $ 0.27 $ 0.82
1 Exclusive of amortization (note 4).
BARRICK SECOND QUARTER 2007 35 FINANCIAL STATEMENTS

Consolidated Statements of Cash Flow
The accompanying notes are an integral part of these unaudited interim consolidated financial statements.
Barrick Gold Corporation Three months ended Six months ended (in millions of United States dollars) (Unaudited) June 30, June 30, 2007 2006 2007 2006
OPERATING ACTIVITIES Net income for the period $ 396 $ 459 $ 237 $ 683 Amortization (note 4) 231 160 439 325 Income tax expense (note 8) 121 131 268 175 (Gain) loss on sale of investments (note 7B) (52 ) — (54 ) 1 Income taxes paid (219 ) (56 ) (348 ) (92 ) Other items (note 10) (141 ) (36 ) (43 ) (49 )
Net cash provided by operating activities 336 658 499 1,043
INVESTING ACTIVITIES Property, plant and equipment
Capital expenditures (note 4) (230 ) (289 ) (478 ) (534 ) Sales proceeds 4 2 10 3
Acquisition of Placer Dome, net of cash acquired of $1,102 — — — (160 ) Available-for-sale securities
Purchases — (21 ) (4 ) (26 ) Sales proceeds 508 15 511 19
Loans issued to joint venture partners (note 13A) (31 ) — (31 ) — Non-hedge derivative copper option premiums — — (23 ) — Other investing activities — (30 ) (4 ) (42 )
Net cash provided by (used in) investing activities 251 (323 ) (19 ) (740 )
FINANCING ACTIVITIES Capital stock
Proceeds on exercise of stock options 10 23 41 50 Long-term debt
Proceeds — 51 — 1,092 Repayments (649 ) (872 ) (658 ) (874 )
Dividends (130 ) (96 ) (130 ) (96 ) Settlement of derivative instruments acquired in Placer Dome
acquisition (197 ) (880 ) (197 ) (1,694 ) Other financing activities — (2 ) — (4 )
Net cash (used in) financing activities (966 ) (1,776 ) (944 ) (1,526 )
CASH FLOWS OF DISCONTINUED OPERATIONS Operating activities — 6 — 22 Other investing activities — (18 ) — (43 ) Proceeds on sale of operations to Goldcorp — 1,641 — 1,641 Financing activities — — — (1 )
— 1,629 — 1,619
Effect of exchange rate changes on cash and equival ents 4 (3 ) 5 (3 )
Net increase (decrease) in cash and equivalents (375 ) 185 (459 ) 393 Cash and equivalents at beginning of period 2,959 1,245 3,043 1,037
Cash and equivalents at end of period $ 2,584 $ 1,430 $ 2,584 $ 1,430
BARRICK SECOND QUARTER 2007 36 FINANCIAL STATEMENTS
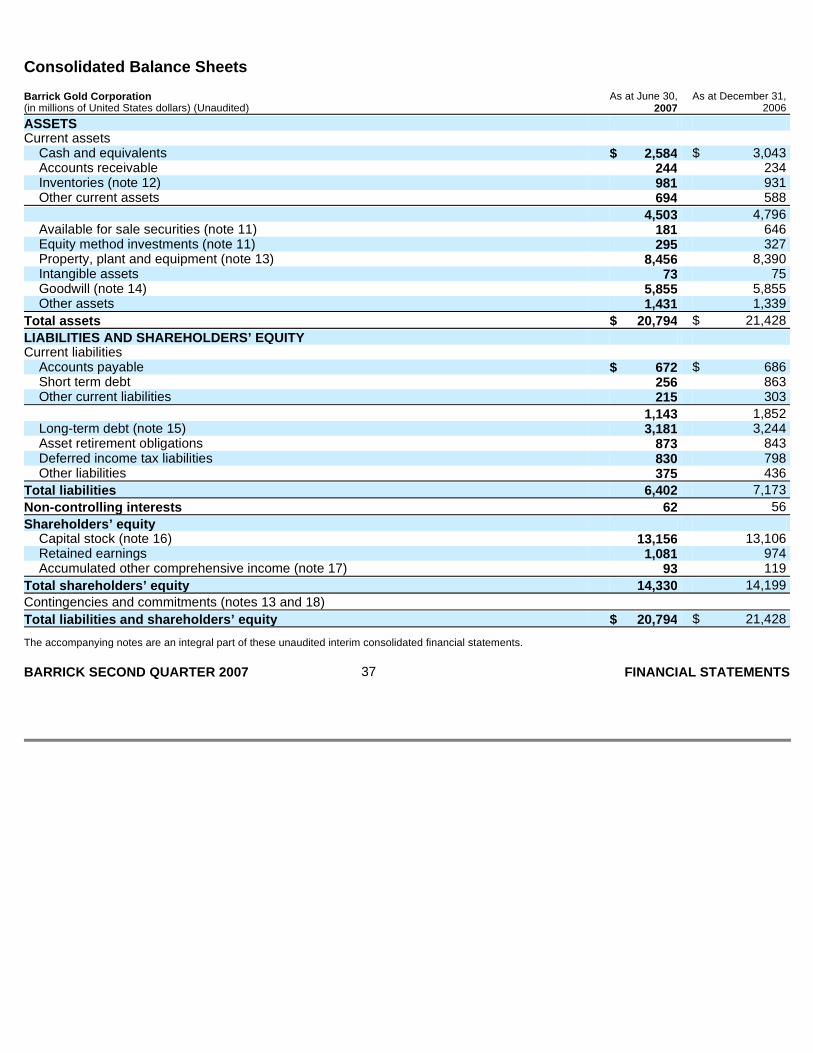
Consolidated Balance Sheets
The accompanying notes are an integral part of these unaudited interim consolidated financial statements.
Barrick Gold Corporation As at June 30, As at December 31, (in millions of United States dollars) (Unaudited) 2007 2006
ASSETS Current assets
Cash and equivalents $ 2,584 $ 3,043 Accounts receivable 244 234 Inventories (note 12) 981 931 Other current assets 694 588
4,503 4,796 Available for sale securities (note 11) 181 646 Equity method investments (note 11) 295 327 Property, plant and equipment (note 13) 8,456 8,390 Intangible assets 73 75 Goodwill (note 14) 5,855 5,855 Other assets 1,431 1,339
Total assets $ 20,794 $ 21,428
LIABILITIES AND SHAREHOLDERS ’ EQUITY Current liabilities
Accounts payable $ 672 $ 686 Short term debt 256 863 Other current liabilities 215 303
1,143 1,852 Long-term debt (note 15) 3,181 3,244 Asset retirement obligations 873 843 Deferred income tax liabilities 830 798 Other liabilities 375 436
Total liabilities 6,402 7,173
Non-controlling interests 62 56
Shareholders ’ equity Capital stock (note 16) 13,156 13,106 Retained earnings 1,081 974 Accumulated other comprehensive income (note 17) 93 119
Total shareholders ’ equity 14,330 14,199
Contingencies and commitments (notes 13 and 18)
Total liabilities and shareholders ’ equity $ 20,794 $ 21,428
BARRICK SECOND QUARTER 2007 37 FINANCIAL STATEMENTS
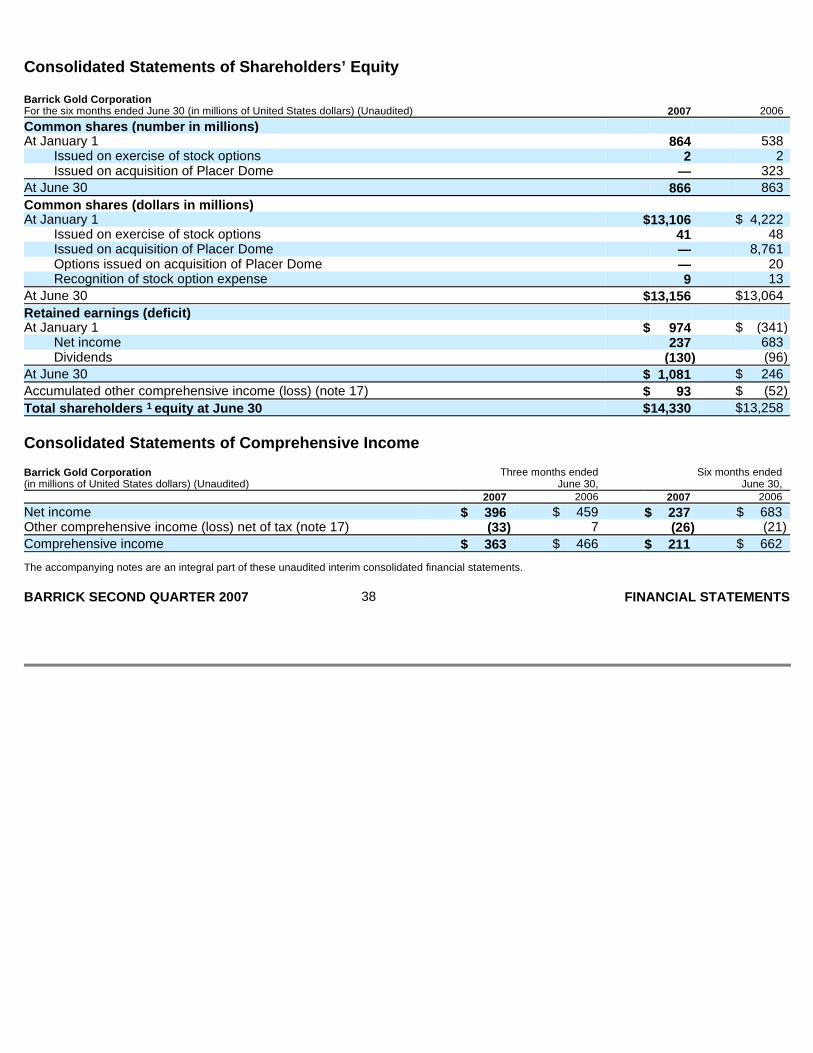
Consolidated Statements of Shareholders’ Equity
Consolidated Statements of Comprehensive Income
The accompanying notes are an integral part of these unaudited interim consolidated financial statements.
Barrick Gold Corporation For the six months ended June 30 (in millions of United States dollars) (Unaudited) 2007 2006
Common shares (number in millions) At January 1 864 538
Issued on exercise of stock options 2 2 Issued on acquisition of Placer Dome — 323
At June 30 866 863
Common shares (dollars in millions) At January 1 $ 13,106 $ 4,222
Issued on exercise of stock options 41 48 Issued on acquisition of Placer Dome — 8,761 Options issued on acquisition of Placer Dome — 20 Recognition of stock option expense 9 13
At June 30 $ 13,156 $ 13,064
Retained earnings (deficit) At January 1 $ 974 $ (341 )
Net income 237 683 Dividends (130 ) (96 )
At June 30 $ 1,081 $ 246
Accumulated other comprehensive income (loss) (note 17) $ 93 $ (52 )
Total shareholders 1 equity at June 30 $ 14,330 $ 13,258
Barrick Gold Corporation Three months ended Six months ended (in millions of United States dollars) (Unaudited) June 30, June 30, 2007 2006 2007 2006
Net income $ 396 $ 459 $ 237 $ 683 Other comprehensive income (loss) net of tax (note 17) (33 ) 7 (26 ) (21 )
Comprehensive income $ 363 $ 466 $ 211 $ 662
BARRICK SECOND QUARTER 2007 38 FINANCIAL STATEMENTS

NOTES TO CONSOLIDATED FINANCIAL STATEMENTS
Barrick Gold Corporation. Tabular dollar amounts in millions of United States dollars, unless otherwise shown. References to C$, A$, ZAR, EUR and CLP are to Canadian dollars, Australian dollars, South African Rands, Euros and Chilean Pesos respectively.
1 > NATURE OF OPERATIONS Barrick Gold Corporation (“Barrick” or the “Company”) principally engages in the production and sale of gold, as well as related activities such as exploration and mine development. We also produce some copper and hold interests in a platinum group metals development project and a nickel development project, both located in Africa and a platinum project located in Russia. Our mining operations are concentrated in our four regional business units: North America, South America, Africa and Australia Pacific. We sell our gold and copper production into the world market.
2 > SIGNIFICANT ACCOUNTING POLICIES A Basis of Preparation These financial statements have been prepared under United States generally accepted accounting principles (“US GAAP”). In 2006, we amended the classification of certain expense items on the face of our income statement to provide enhanced disclosure of significant business activities and reflect the increasing significance of amounts spent on those activities. To ensure comparability of financial information, certain previously reported prior-year comparatives amounts have been reclassified to conform with the presentation adopted at the end of 2006. Prior-year comparatives have also been reclassified to reflect the sale of the South Deep mine at January 1, 2006 and changes in the financial statement presentation of non-hedge derivatives gains and losses.
B Non-controlling interests
C Use of Estimates The preparation of these financial statements requires us to make estimates and assumptions. The most significant ones are: quantities of proven and probable gold and copper reserves; the value of mineralized material beyond proven and probable reserves; future costs and expenses to produce proven and probable reserves; future commodity prices and foreign currency exchange rates; the future cost of asset retirement obligations; amounts of contingencies; and the fair value of acquired assets and liabilities including pre-acquisition contingencies. Using these and other estimates and assumptions, we make various decisions in preparing the financial statements including:
As the estimation process is inherently uncertain, actual future outcomes could differ from present estimates and assumptions, potentially having material future effects on our financial statements.
Significant Changes in Estimates
Three month period Six month period ended June 30 ended June 30 2007 2006 2007 2006
Pueblo Viejo $ 14 $ — $ 14 $ — Tulawaka (3 ) (3 ) (6 ) (3 ) Other — (5 ) — —
$ 11 $ (8 ) $ 8 $ (3 )
� The treatment of mine development costs as either an asset or an expense;
� whether long-lived assets are impaired, and if so, estimates of the fair value of those assets and any corresponding impairment charge;
� our ability to realize deferred income tax assets;
� the useful lives of long-lived assets and the measurement of amortization;
� the fair value of asset retirement obligations;
� the likelihood of loss contingencies occurring and the amount of any potential loss;
� whether investments are impaired;
� the amount of income tax expense;
� allocations of the purchase price in business combinations to assets and liabilities acquired;
� the valuation of reporting units used in the initial allocation of goodwill and subsequent goodwill impairment tests;
� transfer of value beyond proven and probable reserves to amortized assets, and
� amount of uncertain tax positions calculated under FIN 48, Accounting for Uncertainty in Income Taxes.

Gold and Copper Mineral Reserves At the end of each fiscal year, as part of our annual business cycle, we prepare estimates of proven and probable gold and copper mineral reserves for each mineral property. We prospectively revise calculations of amortization of property, plant and equipment. The effect of changes in reserve estimates on amortization expense for the three months ended June 30, 2007 was a decrease of $44 million (2006: $2 million increase) and for the six months ended June 30, 2007 was a decrease of $62 million (2006: $5 million decrease). The effect of the allocation of value beyond proven and probable
BARRICK SECOND QUARTER 2007
39
NOTES TO FINANCIAL STATEMENTS (UNAUDITED)
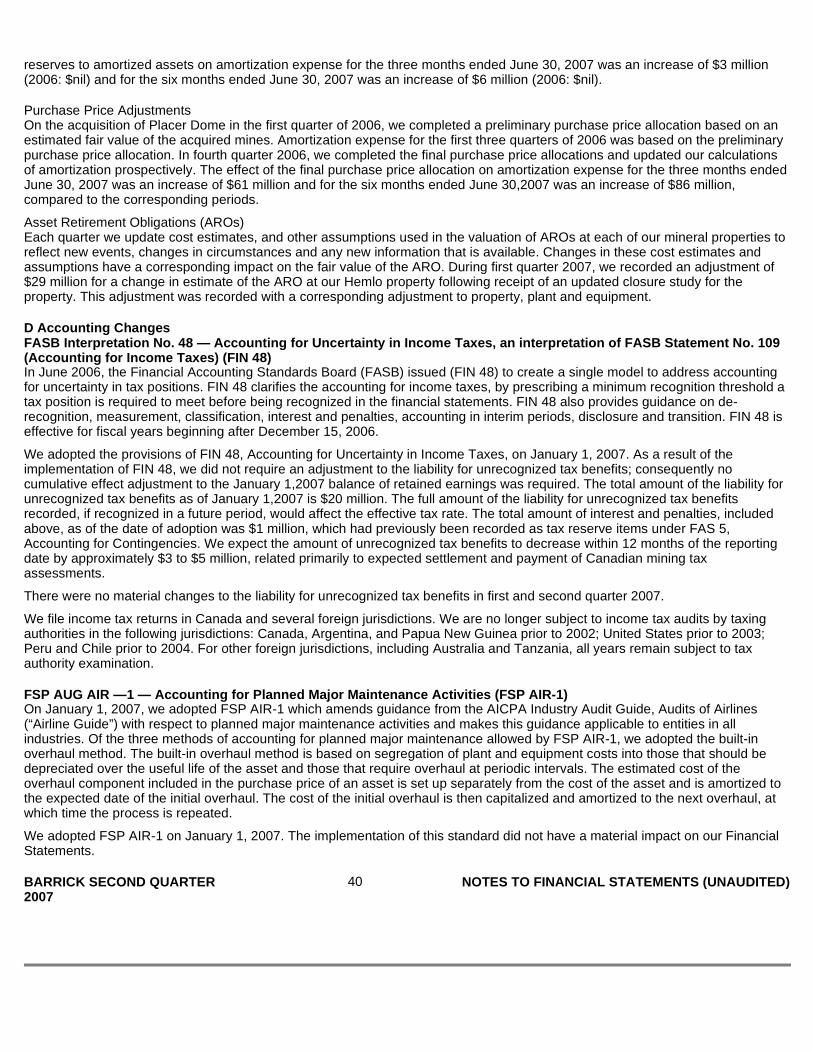
reserves to amortized assets on amortization expense for the three months ended June 30, 2007 was an increase of $3 million (2006: $nil) and for the six months ended June 30, 2007 was an increase of $6 million (2006: $nil).
Purchase Price Adjustments On the acquisition of Placer Dome in the first quarter of 2006, we completed a preliminary purchase price allocation based on an estimated fair value of the acquired mines. Amortization expense for the first three quarters of 2006 was based on the preliminary purchase price allocation. In fourth quarter 2006, we completed the final purchase price allocations and updated our calculations of amortization prospectively. The effect of the final purchase price allocation on amortization expense for the three months ended June 30, 2007 was an increase of $61 million and for the six months ended June 30,2007 was an increase of $86 million, compared to the corresponding periods.
Asset Retirement Obligations (AROs) Each quarter we update cost estimates, and other assumptions used in the valuation of AROs at each of our mineral properties to reflect new events, changes in circumstances and any new information that is available. Changes in these cost estimates and assumptions have a corresponding impact on the fair value of the ARO. During first quarter 2007, we recorded an adjustment of $29 million for a change in estimate of the ARO at our Hemlo property following receipt of an updated closure study for the property. This adjustment was recorded with a corresponding adjustment to property, plant and equipment.
D Accounting Changes FASB Interpretation No. 48 — Accounting for Uncerta inty in Income Taxes, an interpretation of FASB Sta tement No. 109 (Accounting for Income Taxes) (FIN 48) In June 2006, the Financial Accounting Standards Board (FASB) issued (FIN 48) to create a single model to address accounting for uncertainty in tax positions. FIN 48 clarifies the accounting for income taxes, by prescribing a minimum recognition threshold a tax position is required to meet before being recognized in the financial statements. FIN 48 also provides guidance on de-recognition, measurement, classification, interest and penalties, accounting in interim periods, disclosure and transition. FIN 48 is effective for fiscal years beginning after December 15, 2006.
We adopted the provisions of FIN 48, Accounting for Uncertainty in Income Taxes, on January 1, 2007. As a result of the implementation of FIN 48, we did not require an adjustment to the liability for unrecognized tax benefits; consequently no cumulative effect adjustment to the January 1,2007 balance of retained earnings was required. The total amount of the liability for unrecognized tax benefits as of January 1,2007 is $20 million. The full amount of the liability for unrecognized tax benefits recorded, if recognized in a future period, would affect the effective tax rate. The total amount of interest and penalties, included above, as of the date of adoption was $1 million, which had previously been recorded as tax reserve items under FAS 5, Accounting for Contingencies. We expect the amount of unrecognized tax benefits to decrease within 12 months of the reporting date by approximately $3 to $5 million, related primarily to expected settlement and payment of Canadian mining tax assessments.
There were no material changes to the liability for unrecognized tax benefits in first and second quarter 2007.
We file income tax returns in Canada and several foreign jurisdictions. We are no longer subject to income tax audits by taxing authorities in the following jurisdictions: Canada, Argentina, and Papua New Guinea prior to 2002; United States prior to 2003; Peru and Chile prior to 2004. For other foreign jurisdictions, including Australia and Tanzania, all years remain subject to tax authority examination.
FSP AUG AIR —1 — Accounting for Planned Major Maint enance Activities (FSP AIR-1) On January 1, 2007, we adopted FSP AIR-1 which amends guidance from the AICPA Industry Audit Guide, Audits of Airlines (“Airline Guide”) with respect to planned major maintenance activities and makes this guidance applicable to entities in all industries. Of the three methods of accounting for planned major maintenance allowed by FSP AIR-1, we adopted the built-in overhaul method. The built-in overhaul method is based on segregation of plant and equipment costs into those that should be depreciated over the useful life of the asset and those that require overhaul at periodic intervals. The estimated cost of the overhaul component included in the purchase price of an asset is set up separately from the cost of the asset and is amortized to the expected date of the initial overhaul. The cost of the initial overhaul is then capitalized and amortized to the next overhaul, at which time the process is repeated.
We adopted FSP AIR-1 on January 1, 2007. The implementation of this standard did not have a material impact on our Financial Statements.
BARRICK SECOND QUARTER 2007
40
NOTES TO FINANCIAL STATEMENTS (UNAUDITED)

Changes in Financial Statement Presentation — Non-h edge Derivative Gains and Losses In first quarter 2007, we made a change to our accounting policy regarding financial statement classification of changes in the fair value of non-hedge derivative contracts. Prior to this change, we recorded the change in fair value of all non-hedge derivative gains and losses as a component of other income, with the exception of changes in the fair value embedded derivatives implicit in our concentrate sales contracts, which were recorded as a component of revenue.
Beginning in first quarter 2007, we recorded the changes in fair value of derivatives that do not qualify for hedge accounting treatment under FAS 133 in a manner consistent with the intended purpose of the instrument. The changes in fair value of non-hedge gold and copper derivative instruments are recorded in revenue. The changes in fair value of non-hedge silver and fuel derivative contracts are recorded in cost of sales. The changes in fair value of non-hedge interest rate swaps are recorded in interest income or interest expense, depending on the intended purpose of the swap. The changes in fair value of share purchase warrants are recorded in other income.
The retroactive impact of this change in accounting policy for the three months ended June 30,2006 is as follows: gold revenue is increased by $30 million, copper revenue is decreased by $10 million, cost of sales is decreased by $2 million, other operating expense is decreased by $4 million, interest expense is increased by $2 million, interest income is increased by $2 million, and other income is decreased by $22 million. For the six months ended June 30, 2006: gold revenue is increased by $20 million, copper revenue is decreased by $17 million, cost of sales is increased by $1 million, interest expense is decreased by $1 million, interest income is increased by $3 million and other income is decreased by $1 million.
E Accounting Developments FASB Statement No. 159 — The Fair Value Option for Financial Assets and Financial Liabilities (FAS 159 ) In February 2007 the FASB issued FAS 159, which offers an irrevocable option to carry the eligible financial assets and liabilities at fair value, with the election to be made on an instrument by instrument basis, with changes in fair value recorded in earnings (Fair Value Option, FVO).
FAS 159 permits entities to choose to measure many financial instruments and certain other items at fair value. The objective is to improve financial reporting by providing entities with the opportunity to mitigate volatility in reported earnings caused by measuring related assets and liabilities differently without having to apply complex hedge accounting provisions. This Statement is expected to expand the use of fair value measurement, which is consistent with the Board’s long-term measurement objectives for accounting for financial instruments.
Under FAS 159 an entity must elect whether to use the FVO on the date an item is initially recognized, with limited exceptions. Because the FVO is an instrument-by-instrument election, companies may record identical financial assets and liabilities either at fair value or on another measurement basis permitted by US GAAP, such as amortized cost. One exception to the instrument-by-instrument guidance is that for investments that would otherwise fall under equity method accounting, the election must be made for all of the investor’s financial interests (equity and debt, including guarantees) in the same entity.
The principal objectives of the disclosures required by FAS 159 are to provide information about:
FAS 159 is effective as of the beginning of a reporting entity’s first fiscal year that begins after November 15, 2007 and should be applied prospectively. If an entity chooses to elect the FVO for existing items at the date of adoption, the difference between their carrying amount and fair value is included in a cumulative-effect adjustment to the opening balance of retained earnings. We are currently in the process of assessing which of our financial assets and liabilities we will carry at fair value and record mark-to-market adjustments to earnings.
FAS 157, Fair Value Measurements In September 2006, the FASB issued FAS 157 that provides enhanced guidance for using fair value to measure assets and liabilities. FAS 157 is meant to ensure that the measurement of fair value is more comparable and consistent, and improve disclosure about fair value measures. As a result of FAS 157 there is now a common definition of fair value to be used throughout US GAAP. FAS 157 applies whenever US GAAP requires (or permits) measurement of assets or
� Management’s reasons for electing or partially electing the FVO
� How changes in fair values affect earnings for the period
� The same information about certain items (such as equity investments and nonperforming loans) that would have been disclosed if the FVO had not been elected
� Information to enable users to understand the differences between fair values and contractual cash flows for certain items.
BARRICK SECOND QUARTER 2007
41
NOTES TO FINANCIAL STATEMENTS (UNAUDITED)

liabilities at fair value. FAS 157 does not address when the use of fair value measurements is required.
FAS 157 defines fair value as “the price that would be received to sell an asset or paid to transfer a liability in an orderly transaction between market participants at the measurement date.” This definition of fair value retains the exchange-price notion contained (either explicitly or implicitly) in many earlier US GAAP definitions of fair value. However, FAS 157 clarifies that the basis for a fair value measure is the price at which a company would sell or otherwise dispose of its assets or pay to settle a liability (i.e., an exit price), not the market price at which a company acquires its assets or assumes a liability (i.e., not an entry price). The exit price concept is based on current expectations about the future inflows associated with the asset and the future outflows associated with the liability from the perspective of market participants. Under FAS 157, a fair value measure should reflect all of the assumptions that market participants would use in pricing the asset or liability including, for example, an adjustment for risk inherent in a particular valuation technique used to measure fair value.
In measuring fair value for a financial statement item, FAS 157 gives the highest priority to quoted prices in active markets. However, FAS 157 also permits the use of unobservable inputs for situations in which there is little, if any, market activity for the asset or liability being measured. Whether there is significant market activity or not, the objective is a market-based measure, rather than an entity-specific measure. FAS 157 also provides guidance on the effect of changes in credit risk on a fair value measure; investment blocks; and restricted securities.
FAS 157 expands disclosure about the use of fair value to measure assets and liabilities. FAS 157 requires disclosures intended to provide information about (1) the extent to which companies measure assets and liabilities at fair value, (2) the methods and assumptions used to measure fair value, and (3) the effect of fair value measures on earnings. FAS 157 is effective for financial statements issued for fiscal years beginning after November 15, 2007. Early adoption is permitted. We are currently assessing the impact of FAS 157 on our financial statements.
3 > ACQUISITIONS AND DIVESTITURES A Acquisition of Pioneer Metals Inc. (“Pioneer”) In third quarter 2006, we acquired control of Pioneer through the acquisition of 59.2 million shares, representing approximately 91% of the outstanding shares of Pioneer, for cash consideration of $53 million. Pioneer has a portfolio of exploration properties and interests, including the Grace property which is adjacent to NovaGold Resources Inc.’s Galore Creek project. In March 2007, we acquired all of the remaining outstanding shares of Pioneer for cash consideration of $6 million, $4 million of which was classified under Other investing activities in our Consolidated Statements of Cash Flow. We have allocated the purchase cost to cash and property, plant and equipment.
B Sale of Paddington Operations In April 2007, we entered into an agreement to sell the Paddington operations in Australia to Norton Goldfields Limited, under which we are entitled to receive cash proceeds of approximately $37 million as weill as replacement of rehabilitation bonds of approximately $13 million. We now expect to close the sale in third quarter 2007. This purchaser had provided a non-refundable deposit of $4 million which is included within Other Current Liabilities.
The Paddington operations, which form part of the Kanowna mine acquired in the acquisition of Placer Dome, consist of the Paddington mill and certain land tenements in the area near the mill. The Paddington operations were previously subject to a sale agreement which was terminated after the purchaser was unable to complete the transaction.
C Porgera In April 2007, we entered into an agreement with Emperor Mines Limited to purchase Emperor’s 20% interest in the Porgera mine in Papua New Guinea, for cash consideration of $250 million plus an adjustment on closing. Barrick’s undivided interest in Porgera will increase from 75% to 95% on completion of this transaction.
From April 1 onwards, we are funding Emperor’s share of development costs and in return we are entitled to Emperor’s share of production. The net amount we receive in relation to Emperor’s share of production will be recorded as an adjustment to the purchase price once the transaction closes. We presently expect to close the transaction in third quarter 2007.
The Government of Papua New Guinea holds the remaining 5% undivided interest in Porgera. We have entered into a call option deed regarding the possible sale of up to a 5% interest to the Government of Papua New Guinea, for the proportionate acquisition cost paid by Barrick.
BARRICK SECOND QUARTER 2007
42
NOTES TO FINANCIAL STATEMENTS (UNAUDITED)

D Discontinued Operations On December 1, 2006, we sold our 50% interest in the South Deep mine in South Africa to Gold Fields Limited (“Gold Fields”). In second quarter 2006, a loaded skip and 6.7 kilometers of rope fell 1.6 kilometers down the South Deep mine’s Twin Shaft complex during routine maintenance, causing extensive damage but no injuries. Repair costs for assets that were damaged were expensed as incurred. We were insured for property
damage and a portion of business interruption losses. In fourth quarter 2006 we recorded insurance recoveries of $12 million related to this incident. In second quarter 2007, a final settlement was reached with Gold Fields on the allocation of insurance proceeds and, as a result, we recorded further proceeds of $9 million within income from discontinued operations.
4 > SEGMENT INFORMATION
Income Statement Information
1 Segment income (loss) represents segment sales, less cost of sales and amortization.
Sales Segment expenses Segment income 1 For the three months ended June 30 2007 2006 2007 2006 2007 2006
Gold North America $ 533 $ 548 $ 306 $ 264 $ 141 $ 222 South America 319 239 108 68 158 145 Australia Pacific 305 316 218 157 43 124 Africa 107 96 72 53 20 23
Copper South America 326 286 62 61 243 215 Australia Pacific 52 47 20 25 23 19
$ 1,642 $ 1,532 $ 786 $ 628 $ 628 $ 748
Sales Segment expenses Segment income (loss) 1 For the six months ended June 30 2007 2006 2007 2006 2007 2006
Gold North America $ 845 $ 997 $ 587 $ 512 $ 110 $ 363 South America 531 458 189 152 242 242 Australia Pacific 515 578 445 318 (18 ) 195 Africa 199 178 150 107 11 34
Copper South America 542 428 118 140 385 271 Australia Pacific 99 81 46 55 36 21
$ 2,731 $ 2,720 $ 1,535 $ 1,284 $ 766 $ 1,126
Exploration 1 Regional business unit costs 1 For the three months ended June 30 2007 2006 2007 2006
North America $ 20 $ 13 $ 8 $ 5 South America 9 6 6 3 Australia Pacific 7 11 8 3 Africa 4 9 4 3 Other expense outside reportable segments — 5 — —
$ 40 $ 44 $ 26 $ 14
BARRICK SECOND QUARTER 2007
43
NOTES TO FINANCIAL STATEMENTS (UNAUDITED)

Reconciliation of Segment Income
Asset Information
Exploration 1 Regional business unit costs 1 For the six months ended June 30 2007 2006 2007 2006
North America $ 34 $ 22 $ 14 $ 11 South America 13 13 12 7 Australia Pacific 15 23 17 13 Africa 6 12 5 5 Other expense outside reportable segments 2 7 — —
$ 70 $ 77 $ 48 $ 36
1 Exploration and regional business unit costs are excluded from the measure of segment income but are reported separately by operating segment to the Chief Operating Decision Maker.
Three month period ended Six month period ended June 30 June 30 2007 2006 2007 2006
Segment income $ 628 $ 748 $ 766 $ 1,126 Amortization of corporate assets (3 ) (4 ) (9 ) (15 ) Exploration (40 ) (44 ) (70 ) (77 ) Project development expense (65 ) (28 ) (102 ) (47 ) Corporate administration (33 ) (31 ) (66 ) (65 ) Other operating expenses (34 ) (22 ) (70 ) (51 ) Interest income 35 26 74 53 Interest expense (27 ) (34 ) (63 ) (49 ) Other income 63 7 77 11 Other expense (22 ) (14 ) (23 ) (17 )
Income from continuing operations before income taxes and other items $ 502 $ 604 $ 514 $ 869
Amortization Segment capital expenditures 1 For the three months ended June 30 2007 2006 2007 2006
Gold North America $ 86 $ 62 $ 66 $ 61 South America 53 26 60 65 Australia Pacific 45 35 55 106 Africa 14 20 41 17
Copper South America 21 10 8 6 Australia Pacific 9 3 1 3
Segment total 228 156 231 258 Other items not allocated to segments 3 4 4 2
Enterprise total $ 231 $ 160 $ 235 $ 260
BARRICK SECOND QUARTER 2007 44 NOTES TO FINANCIAL STATEMENTS (UNAUDITED)
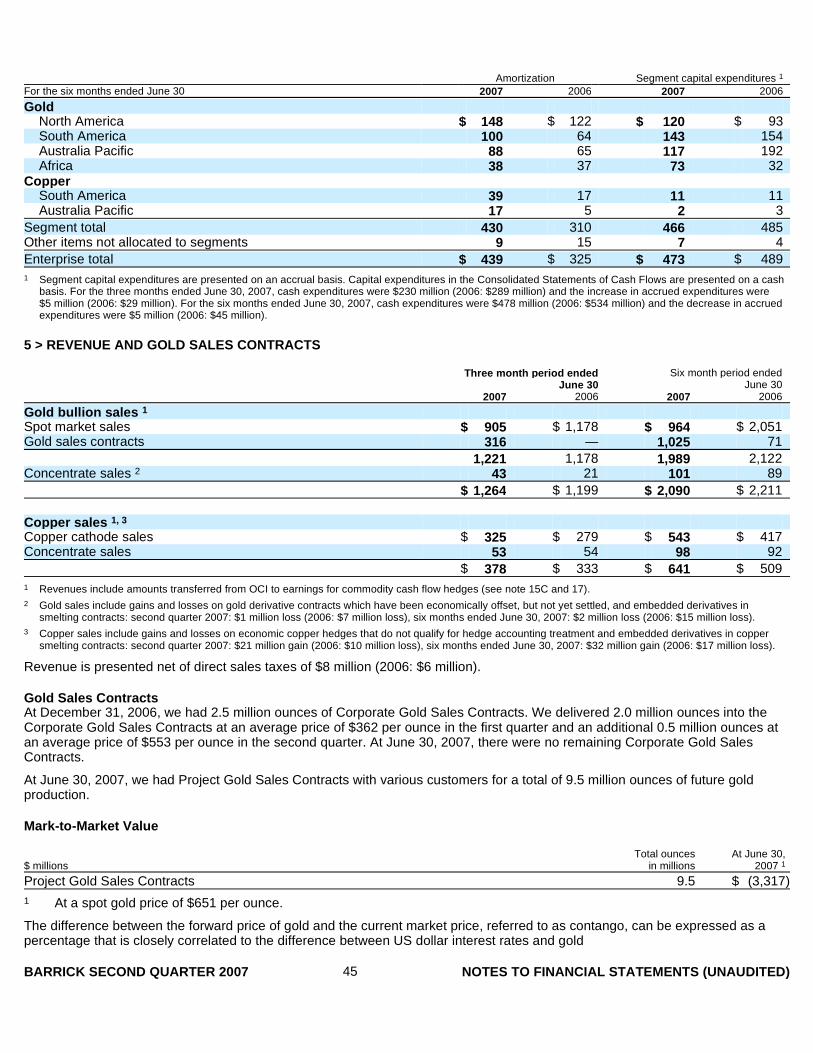
5 > REVENUE AND GOLD SALES CONTRACTS
Revenue is presented net of direct sales taxes of $8 million (2006: $6 million).
Gold Sales Contracts At December 31, 2006, we had 2.5 million ounces of Corporate Gold Sales Contracts. We delivered 2.0 million ounces into the Corporate Gold Sales Contracts at an average price of $362 per ounce in the first quarter and an additional 0.5 million ounces at an average price of $553 per ounce in the second quarter. At June 30, 2007, there were no remaining Corporate Gold Sales Contracts.
At June 30, 2007, we had Project Gold Sales Contracts with various customers for a total of 9.5 million ounces of future gold production.
Mark-to-Market Value
The difference between the forward price of gold and the current market price, referred to as contango, can be expressed as a percentage that is closely correlated to the difference between US dollar interest rates and gold
Amortization Segment capital expenditures 1 For the six months ended June 30 2007 2006 2007 2006
Gold North America $ 148 $ 122 $ 120 $ 93 South America 100 64 143 154 Australia Pacific 88 65 117 192 Africa 38 37 73 32
Copper South America 39 17 11 11 Australia Pacific 17 5 2 3
Segment total 430 310 466 485 Other items not allocated to segments 9 15 7 4
Enterprise total $ 439 $ 325 $ 473 $ 489
1 Segment capital expenditures are presented on an accrual basis. Capital expenditures in the Consolidated Statements of Cash Flows are presented on a cash basis. For the three months ended June 30, 2007, cash expenditures were $230 million (2006: $289 million) and the increase in accrued expenditures were $5 million (2006: $29 million). For the six months ended June 30, 2007, cash expenditures were $478 million (2006: $534 million) and the decrease in accrued expenditures were $5 million (2006: $45 million).
Three month period ended Six month period ended June 30 June 30 2007 2006 2007 2006
Gold bullion sales 1 Spot market sales $ 905 $ 1,178 $ 964 $ 2,051 Gold sales contracts 316 — 1,025 71
1,221 1,178 1,989 2,122 Concentrate sales 2 43 21 101 89
$ 1,264 $ 1,199 $ 2,090 $ 2,211
Copper sales 1, 3 Copper cathode sales $ 325 $ 279 $ 543 $ 417 Concentrate sales 53 54 98 92
$ 378 $ 333 $ 641 $ 509
1 Revenues include amounts transferred from OCI to earnings for commodity cash flow hedges (see note 15C and 17).
2 Gold sales include gains and losses on gold derivative contracts which have been economically offset, but not yet settled, and embedded derivatives in smelting contracts: second quarter 2007: $1 million loss (2006: $7 million loss), six months ended June 30, 2007: $2 million loss (2006: $15 million loss).
3 Copper sales include gains and losses on economic copper hedges that do not qualify for hedge accounting treatment and embedded derivatives in copper smelting contracts: second quarter 2007: $21 million gain (2006: $10 million loss), six months ended June 30, 2007: $32 million gain (2006: $17 million loss).
Total ounces At June 30, $ millions in millions 2007 1
Project Gold Sales Contracts 9.5 $ (3,317 )
1 At a spot gold price of $651 per ounce.
BARRICK SECOND QUARTER 2007 45 NOTES TO FINANCIAL STATEMENTS (UNAUDITED)


lease rates. Historically short-term gold lease rates have generally been lower than longer-term rates. We have historically used gold lease rate swaps to achieve a more economically optimal term structure for gold lease rates implicit in contango. During second quarter, we terminated 1.4 million ounces of the remaining fixed-rate swaps. Lease rate swaps are classified as non-hedge derivatives (note 15C) and had a positive fair value of $23 million at June 30, 2007 on a notional balance of 1.0 million ounces of fixed-rate swaps (no floating ounces). Changes in the fair value of these lease rate swaps are recorded in current period interest income.
6 > COST OF SALES
7 > OTHER (INCOME) EXPENSE
A Other Operating Expenses
B Other Income
Three month period ended June 30 Six month period ended June 30 Gold Copper Gold Copper 2007 2006 2007 2006 2007 2006 2007 2006
Cost of goods sold 1 $ 685 $ 534 $ 81 $ 87 $ 1,333 $ 1,077 $ 162 $ 194 By-product revenues 2,3 (24 (37 ) (1 ) (1 ) (54 ) (72 ) (1 ) (1 ) Royalty expense 37 37 2 1 77 69 3 2 Mining production taxes 6 7 — — 15 15 — —
$ 704 $ 541 $ 82 $ 87 $ 1,371 $ 1,089 $ 164 $ 195
1 Cost of goods sold includes accretion expense at producing mines of $10 million (2006: $7 million) in the three months ended June 30, 2007 and $19 million (2006: $13 million) in the six months ended June 30, 2007. Cost of goods sold includes charges to reduce the cost of inventory to net realizable value as follows: $3 million for the three months ended June 30, 2007 (2006: $nil) and $4 million for the six months ended June 30, 2007 (2006: $nil). The cost of inventory sold in the period reflects all components capitalized to inventory, except that, for presentation purposes, the component of inventory cost relating to amortization of property, plant and equipment is classified in the income statement under “amortization”. Some companies present this amount under “cost of sales”. The amount presented in amortization rather than cost of sales was $228 million in the three months ended June 30, 2007 (2006: $156 million) and $430 million in the six months ended June 30, 2007 (2006: $310 million).
2 We use silver sales contracts to sell a portion of silver produced as a by-product. Silver sales contracts have similar delivery terms and pricing mechanisms as gold sales contracts. At June 30, 2007, we had silver contracts for 18.9 million ounces over periods of primarily up to 10 years. The mark-to-market on silver sales contracts at June 30, 2007 was negative $94 million (2006: negative $75 million).
3 Silver by-product credits include gains and losses on economic silver hedges that do not qualify for hedge accounting treatment: second quarter 2007: $nil (2006: $nil) and six months ended June 30, 2007: $nil (2006: ($5) million).
Three month period ended Six month period ended June 30 June 30 2007 2006 2007 2006
Regional business unit costs 1 $ 26 $ 14 $ 48 $ 36 Community development costs 2 5 — 11 — Environmental remediation costs — 3 5 6 World Gold Council fees 3 5 6 9
$ 34 $ 22 $ 70 $ 51
1 Relates to costs incurred at regional business unit offices.
2 In 2007, amounts relate to community programs in Peru, Tanzania and Papua New Guinea.
Three month period ended Six month period ended June 30 June 30 2007 2006 2007 2006
Gains on sale of assets 1 $ 3 $ 5 $ 9 $ 6 Gain (loss) on sale of investments (note 11) 52 — 54 (1 ) Royalty income 3 1 6 2 Sale of water rights 1 — 2 1 Other 4 1 6 3
$ 63 $ 7 $ 77 $ 11
1 In 2007, we sold certain properties in South America and Australia. In 2006, we sold certain properties in Canada and Chile. BARRICK SECOND QUARTER 2007 46 NOTES TO FINANCIAL STATEMENTS (UNAUDITED)
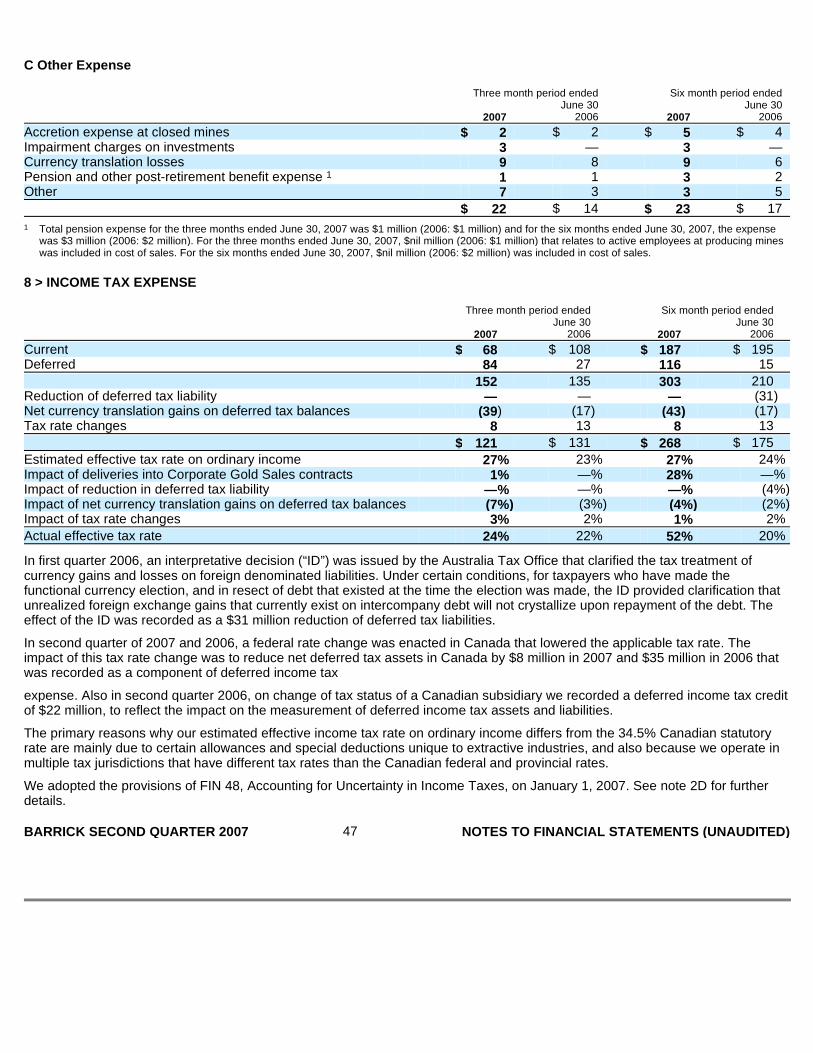
C Other Expense
8 > INCOME TAX EXPENSE
In first quarter 2006, an interpretative decision (“ID”) was issued by the Australia Tax Office that clarified the tax treatment of currency gains and losses on foreign denominated liabilities. Under certain conditions, for taxpayers who have made the functional currency election, and in resect of debt that existed at the time the election was made, the ID provided clarification that unrealized foreign exchange gains that currently exist on intercompany debt will not crystallize upon repayment of the debt. The effect of the ID was recorded as a $31 million reduction of deferred tax liabilities.
In second quarter of 2007 and 2006, a federal rate change was enacted in Canada that lowered the applicable tax rate. The impact of this tax rate change was to reduce net deferred tax assets in Canada by $8 million in 2007 and $35 million in 2006 that was recorded as a component of deferred income tax
expense. Also in second quarter 2006, on change of tax status of a Canadian subsidiary we recorded a deferred income tax credit of $22 million, to reflect the impact on the measurement of deferred income tax assets and liabilities.
The primary reasons why our estimated effective income tax rate on ordinary income differs from the 34.5% Canadian statutory rate are mainly due to certain allowances and special deductions unique to extractive industries, and also because we operate in multiple tax jurisdictions that have different tax rates than the Canadian federal and provincial rates.
We adopted the provisions of FIN 48, Accounting for Uncertainty in Income Taxes, on January 1, 2007. See note 2D for further details.
Three month period ended Six month period ended June 30 June 30 2007 2006 2007 2006
Accretion expense at closed mines $ 2 $ 2 $ 5 $ 4 Impairment charges on investments 3 — 3 — Currency translation losses 9 8 9 6 Pension and other post-retirement benefit expense 1 1 1 3 2 Other 7 3 3 5
$ 22 $ 14 $ 23 $ 17
1 Total pension expense for the three months ended June 30, 2007 was $1 million (2006: $1 million) and for the six months ended June 30, 2007, the expense was $3 million (2006: $2 million). For the three months ended June 30, 2007, $nil million (2006: $1 million) that relates to active employees at producing mines was included in cost of sales. For the six months ended June 30, 2007, $nil million (2006: $2 million) was included in cost of sales.
Three month period ended Six month period ended June 30 June 30 2007 2006 2007 2006
Current $ 68 $ 108 $ 187 $ 195 Deferred 84 27 116 15
152 135 303 210 Reduction of deferred tax liability — — — (31 ) Net currency translation gains on deferred tax balances (39 ) (17 ) (43 ) (17 ) Tax rate changes 8 13 8 13
$ 121 $ 131 $ 268 $ 175
Estimated effective tax rate on ordinary income 27 % 23 % 27 % 24 % Impact of deliveries into Corporate Gold Sales contracts 1 % —% 28 % —% Impact of reduction in deferred tax liability —% —% —% (4 %) Impact of net currency translation gains on deferred tax balances (7 %) (3 %) (4 %) (2 %) Impact of tax rate changes 3 % 2 % 1 % 2 %
Actual effective tax rate 24 % 22 % 52 % 20 %
BARRICK SECOND QUARTER 2007 47 NOTES TO FINANCIAL STATEMENTS (UNAUDITED)
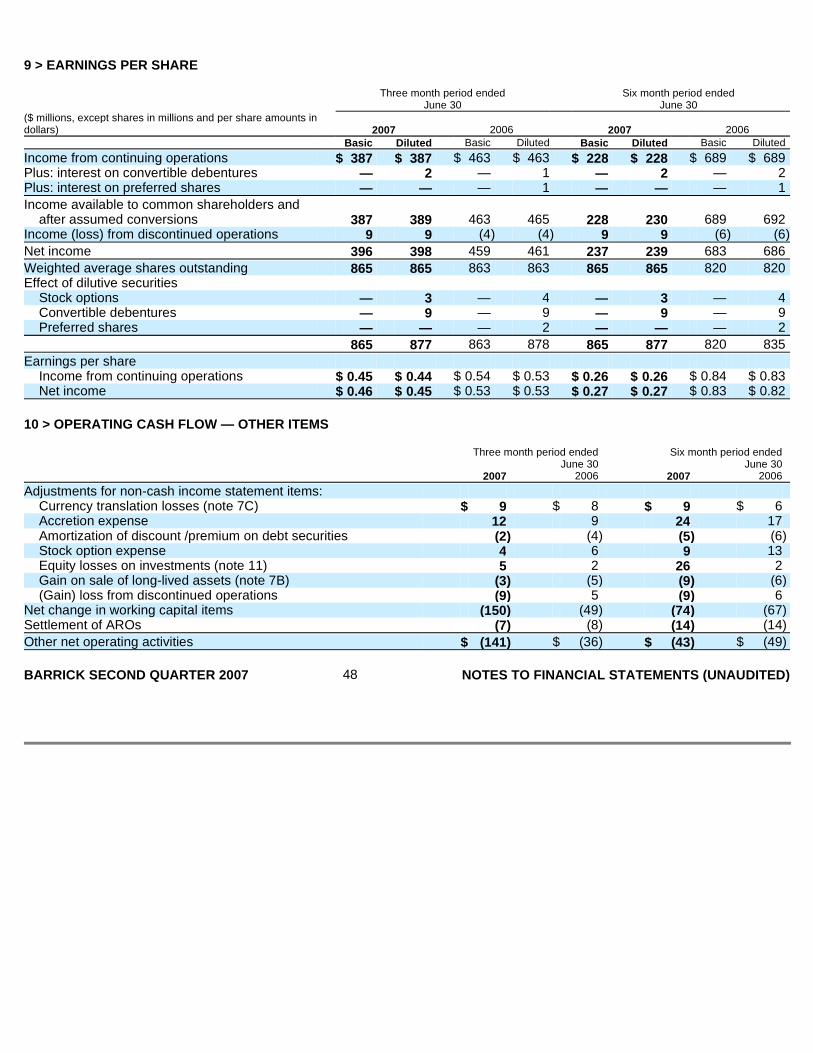
9 > EARNINGS PER SHARE
10 > OPERATING CASH FLOW — OTHER ITEMS
Three month period ended Six month period ended June 30 June 30 ($ millions, except shares in millions and per share amounts in dollars) 2007 2006 2007 2006 Basic Diluted Basic Diluted Basic Diluted Basic Diluted
Income from continuing operations $ 387 $ 387 $ 463 $ 463 $ 228 $ 228 $ 689 $ 689 Plus: interest on convertible debentures — 2 — 1 — 2 — 2 Plus: interest on preferred shares — — — 1 — — — 1
Income available to common shareholders and after assumed conversions 387 389 463 465 228 230 689 692
Income (loss) from discontinued operations 9 9 (4 ) (4 ) 9 9 (6 ) (6 )
Net income 396 398 459 461 237 239 683 686
Weighted average shares outstanding 865 865 863 863 865 865 820 820 Effect of dilutive securities
Stock options — 3 — 4 — 3 — 4 Convertible debentures — 9 — 9 — 9 — 9 Preferred shares — — — 2 — — — 2
865 877 863 878 865 877 820 835
Earnings per share Income from continuing operations $ 0.45 $ 0.44 $ 0.54 $ 0.53 $ 0.26 $ 0.26 $ 0.84 $ 0.83 Net income $ 0.46 $ 0.45 $ 0.53 $ 0.53 $ 0.27 $ 0.27 $ 0.83 $ 0.82
Three month period ended Six month period ended June 30 June 30 2007 2006 2007 2006
Adjustments for non-cash income statement items: Currency translation losses (note 7C) $ 9 $ 8 $ 9 $ 6 Accretion expense 12 9 24 17 Amortization of discount /premium on debt securities (2 ) (4 ) (5 ) (6 ) Stock option expense 4 6 9 13 Equity losses on investments (note 11) 5 2 26 2 Gain on sale of long-lived assets (note 7B) (3 ) (5 ) (9 ) (6 ) (Gain) loss from discontinued operations (9 ) 5 (9 ) 6
Net change in working capital items (150 ) (49 ) (74 ) (67 ) Settlement of AROs (7 ) (8 ) (14 ) (14 )
Other net operating activities $ (141 ) $ (36 ) $ (43 ) $ (49 )
BARRICK SECOND QUARTER 2007 48 NOTES TO FINANCIAL STATEMENTS (UNAUDITED)

11 > INVESTMENTS Available-for-sale Securities
Gold Fields Limited (“Gold Fields”) The investment in Gold Fields was acquired on December 1, 2006, as partial consideration for the sale of our interest in South Dee and was recorded net of an initial liquidity discount of $48 million to reflect a 120-day restriction on our ability to trade the shares. During the quarter, we sold 14.1 million shares of Gold Fields for proceeds of $272 million. We recorded gains of $41 million on these sales.
In determining whether the loss on Gold Fields was “other-than-temporary”, we considered that the securities have been in a loss position for a short period of time, our outlook for senior gold producers and a subsequent recovery of the share rice since June 30, 2007 above cost. We concluded that the impairment at June 30, 2007 was not “other-than-temporary”.
Nova Gold Resources Inc. (“NovaGold”) During the quarter, we sold our entire investment in NovaGold for proceeds of $221 million. We recorded a gain of $3 million on this sale.
Diamondex Resources Limited (“Diamondex”) On May 17 and June 14, 2007, we did not exercise warrants to purchase a total of 11,111,111 Diamondex shares, which subsequently expired. As a result, we concluded that our remaining investment in Diamondex no longer qualified for equity method accounting. The conversion to the Available-for-Sale Securities requires the investment to be recorded at fair value with unrealized gains and losses recorded in other comprehensive income. At June 30, 2007, we determined that our investment in Diamondex was “other than temporarily” impaired by $2 million, due to a sustained decline in fair value of the common shares relative to their carrying amount.
Gains (Losses) on Investments Recorded in Earnings
Equity Method Investments
At Jun.30 At Dec.31 2007 2006 Gains Gains Fair (losses) Fair (losses) value in OCI value in OCI
Securities in an unrealized gain position Benefit plans: 1
Fixed-income securities $ 5 $ — $ 5 $ — Equity securities 15 2 16 2
Other investments: Diamondex 2 4 — — — NovaGold — — 231 13 Other equity securities 72 38 65 32
96 40 317 47 Securities in an unrealized loss position
Celtic 12 — 12 1 Gold Fields 72 (3 ) 314 6 Other equity securities 3 1 — 3 (1 )
$ 181 $ 37 $ 646 $ 53
1 Under various benefit plans for certain former Homestake executives, a portfolio of marketable fixed-income and equity securities are held in a rabbi trust that is used to fund obligations under the plans.
2 Investment in Diamondex was accounted for under the equity method prior to May 17, 2007.
3 Other equity securities in a loss position consist of investments in various junior mining companies.
Three month period Six month period ended June 30 ended June 30 2007 2006 2007 2006
Gains (losses) realized on sales $ 52 $ — $ 54 $ (1 ) Impairment charges (3 ) — (3 ) —
Cash proceeds from sales $ 508 $ 15 $ 511 $ 19
At Jun.30 At Dec.31 2007 2006 Fair Carrying Fair Carrying value 1 amount value 1 amount
Highland $ 172 $ 175 $ 207 $ 199 Diamondex n/a n/a 5 5
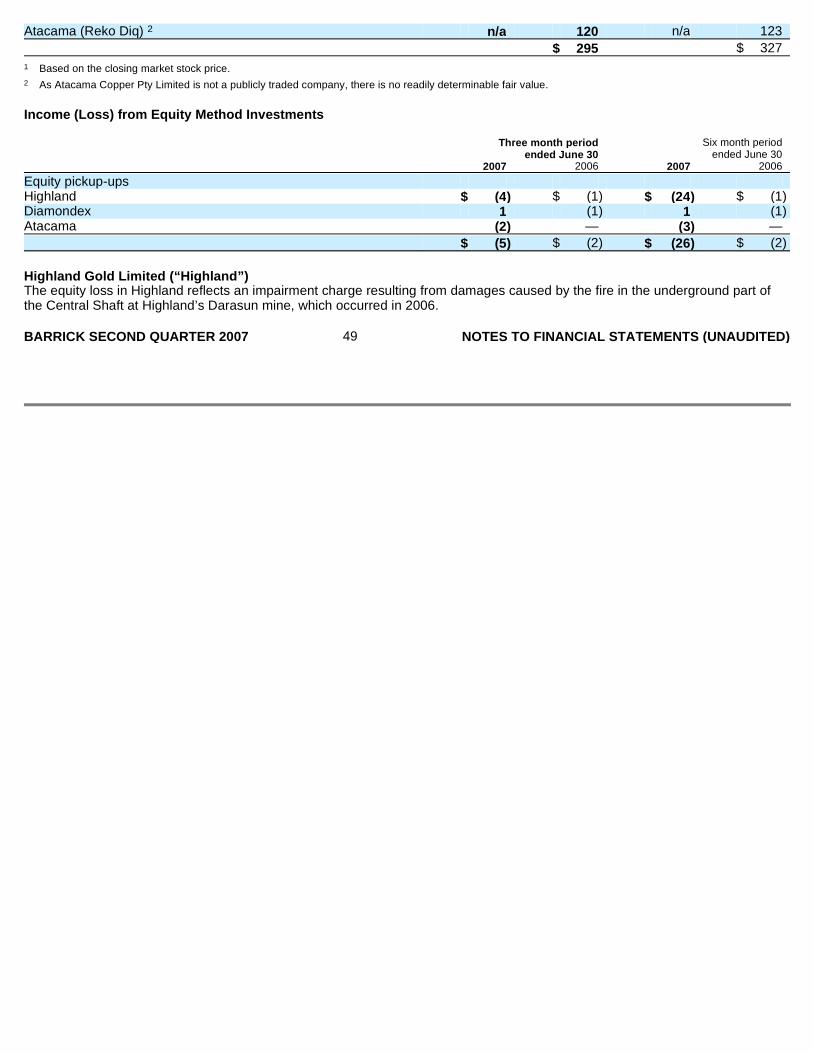
Income (Loss) from Equity Method Investments
Highland Gold Limited (“Highland”) The equity loss in Highland reflects an impairment charge resulting from damages caused by the fire in the underground part of the Central Shaft at Highland’s Darasun mine, which occurred in 2006.
Atacama (Reko Diq) 2 n/a 120 n/a 123
$ 295 $ 327
1 Based on the closing market stock price.
2 As Atacama Copper Pty Limited is not a publicly traded company, there is no readily determinable fair value.
Three month period Six month period ended June 30 ended June 30 2007 2006 2007 2006
Equity pickup-ups Highland $ (4 ) $ (1 ) $ (24 ) $ (1 ) Diamondex 1 (1 ) 1 (1 ) Atacama (2 ) — (3 ) —
$ (5 ) $ (2 ) $ (26 ) $ (2 )
BARRICK SECOND QUARTER 2007 49 NOTES TO FINANCIAL STATEMENTS (UNAUDITED)
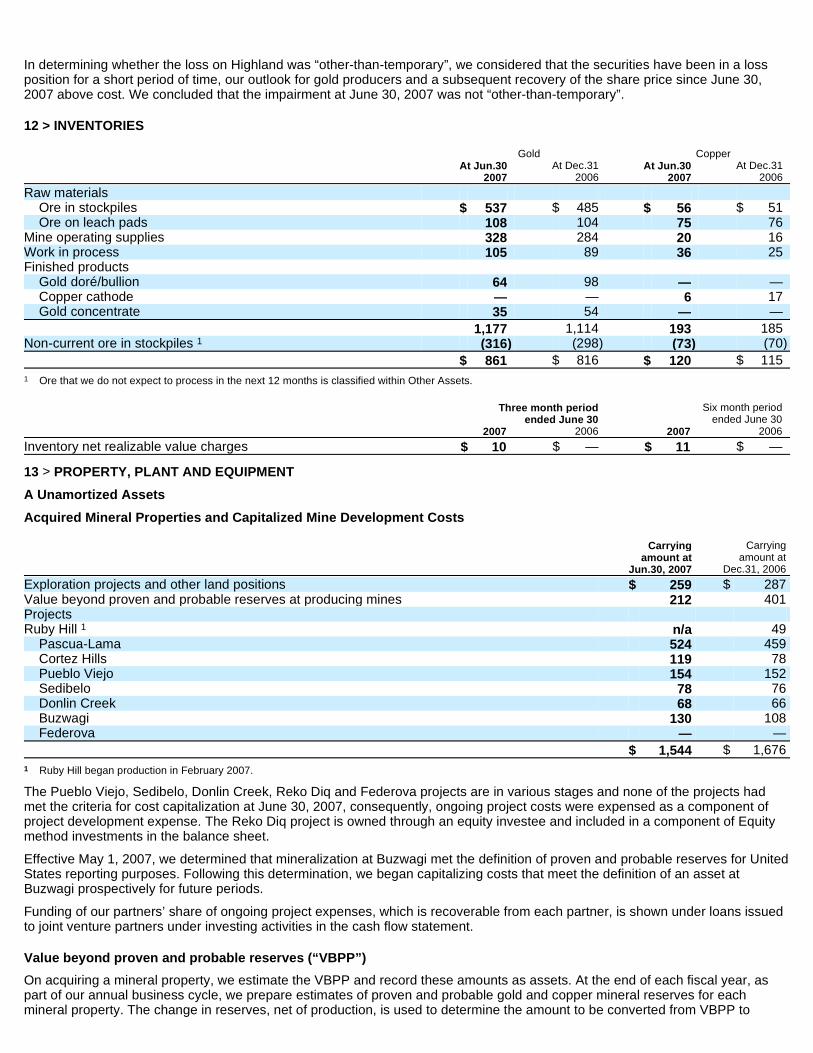
In determining whether the loss on Highland was “other-than-temporary”, we considered that the securities have been in a loss position for a short period of time, our outlook for gold producers and a subsequent recovery of the share price since June 30, 2007 above cost. We concluded that the impairment at June 30, 2007 was not “other-than-temporary”.
12 > INVENTORIES
13 > PROPERTY, PLANT AND EQUIPMENT
A Unamortized Assets
Acquired Mineral Properties and Capitalized Mine De velopment Costs
The Pueblo Viejo, Sedibelo, Donlin Creek, Reko Diq and Federova projects are in various stages and none of the projects had met the criteria for cost capitalization at June 30, 2007, consequently, ongoing project costs were expensed as a component of project development expense. The Reko Diq project is owned through an equity investee and included in a component of Equity method investments in the balance sheet.
Effective May 1, 2007, we determined that mineralization at Buzwagi met the definition of proven and probable reserves for United States reporting purposes. Following this determination, we began capitalizing costs that meet the definition of an asset at Buzwagi prospectively for future periods.
Funding of our partners’ share of ongoing project expenses, which is recoverable from each partner, is shown under loans issued to joint venture partners under investing activities in the cash flow statement.
Value beyond proven and probable reserves (“VBPP”)
On acquiring a mineral property, we estimate the VBPP and record these amounts as assets. At the end of each fiscal year, as part of our annual business cycle, we prepare estimates of proven and probable gold and copper mineral reserves for each mineral property. The change in reserves, net of production, is used to determine the amount to be converted from VBPP to
Gold Copper At Jun.30 At Dec.31 At Jun.30 At Dec.31 2007 2006 2007 2006
Raw materials Ore in stockpiles $ 537 $ 485 $ 56 $ 51 Ore on leach pads 108 104 75 76
Mine operating supplies 328 284 20 16 Work in process 105 89 36 25 Finished products
Gold doré/bullion 64 98 — — Copper cathode — — 6 17 Gold concentrate 35 54 — —
1,177 1,114 193 185 Non-current ore in stockpiles 1 (316 ) (298 ) (73 ) (70 )
$ 861 $ 816 $ 120 $ 115
1 Ore that we do not expect to process in the next 12 months is classified within Other Assets. Three month period Six month period ended June 30 ended June 30 2007 2006 2007 2006
Inventory net realizable value charges $ 10 $ — $ 11 $ —
Carrying Carrying amount at amount at Jun.30, 2007 Dec.31, 2006
Exploration projects and other land positions $ 259 $ 287 Value beyond proven and probable reserves at producing mines 212 401 Projects Ruby Hill 1 n/a 49
Pascua-Lama 524 459 Cortez Hills 119 78 Pueblo Viejo 154 152 Sedibelo 78 76 Donlin Creek 68 66 Buzwagi 130 108 Federova — —
$ 1,544 $ 1,676
1 Ruby Hill began production in February 2007.

amortized assets. For the six months ended June 30,
BARRICK SECOND QUARTER 2007 50 NOTES TO FINANCIAL STATEMENTS (UNAUDITED)
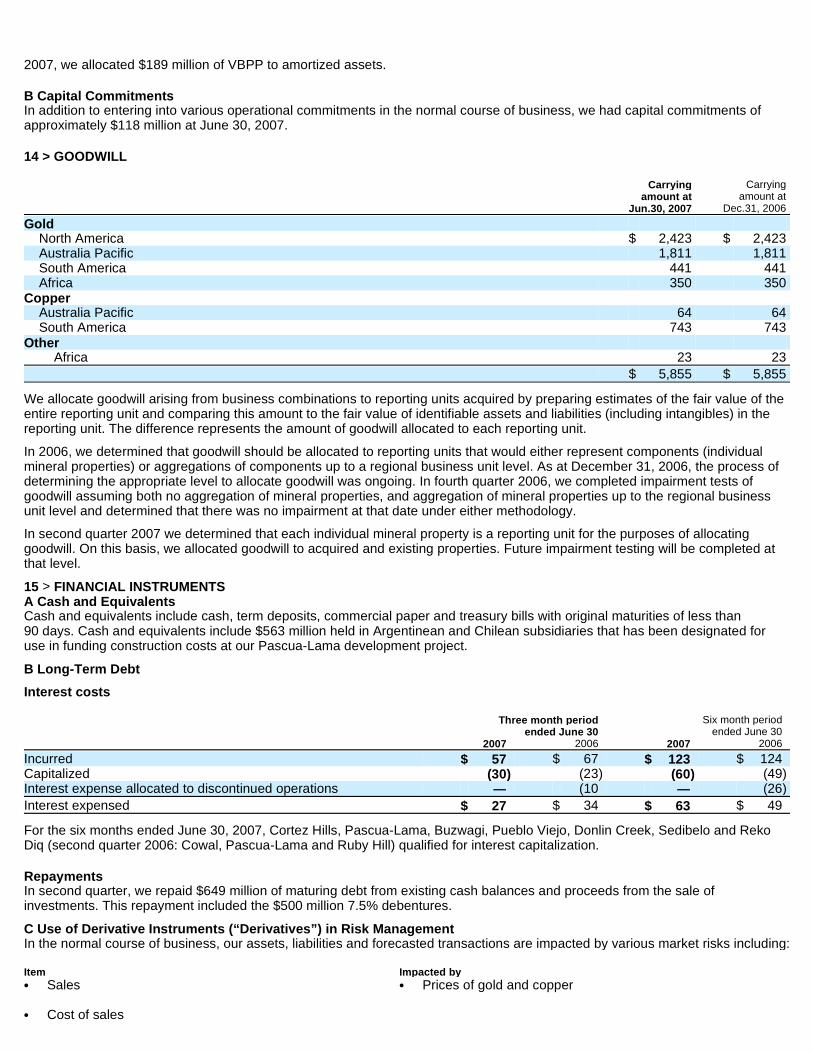
2007, we allocated $189 million of VBPP to amortized assets.
B Capital Commitments In addition to entering into various operational commitments in the normal course of business, we had capital commitments of approximately $118 million at June 30, 2007.
14 > GOODWILL
We allocate goodwill arising from business combinations to reporting units acquired by preparing estimates of the fair value of the entire reporting unit and comparing this amount to the fair value of identifiable assets and liabilities (including intangibles) in the reporting unit. The difference represents the amount of goodwill allocated to each reporting unit.
In 2006, we determined that goodwill should be allocated to reporting units that would either represent components (individual mineral properties) or aggregations of components up to a regional business unit level. As at December 31, 2006, the process of determining the appropriate level to allocate goodwill was ongoing. In fourth quarter 2006, we completed impairment tests of goodwill assuming both no aggregation of mineral properties, and aggregation of mineral properties up to the regional business unit level and determined that there was no impairment at that date under either methodology.
In second quarter 2007 we determined that each individual mineral property is a reporting unit for the purposes of allocating goodwill. On this basis, we allocated goodwill to acquired and existing properties. Future impairment testing will be completed at that level.
15 > FINANCIAL INSTRUMENTS A Cash and Equivalents Cash and equivalents include cash, term deposits, commercial paper and treasury bills with original maturities of less than 90 days. Cash and equivalents include $563 million held in Argentinean and Chilean subsidiaries that has been designated for use in funding construction costs at our Pascua-Lama development project.
B Long-Term Debt
Interest costs
For the six months ended June 30, 2007, Cortez Hills, Pascua-Lama, Buzwagi, Pueblo Viejo, Donlin Creek, Sedibelo and Reko Diq (second quarter 2006: Cowal, Pascua-Lama and Ruby Hill) qualified for interest capitalization.
Repayments In second quarter, we repaid $649 million of maturing debt from existing cash balances and proceeds from the sale of investments. This repayment included the $500 million 7.5% debentures.
C Use of Derivative Instruments (“Derivatives”) in Risk Management In the normal course of business, our assets, liabilities and forecasted transactions are impacted by various market risks including:
Carrying Carrying amount at amount at Jun.30, 2007 Dec.31, 2006
Gold North America $ 2,423 $ 2,423 Australia Pacific 1,811 1,811 South America 441 441 Africa 350 350
Copper Australia Pacific 64 64 South America 743 743
Other Africa 23 23
$ 5,855 $ 5,855
Three month period Six month period ended June 30 ended June 30 2007 2006 2007 2006
Incurred $ 57 $ 67 $ 123 $ 124 Capitalized (30 ) (23 ) (60 ) (49 ) Interest expense allocated to discontinued operations — (10 — (26 )
Interest expensed $ 27 $ 34 $ 63 $ 49
Item Impacted by • Sales • Prices of gold and copper • Cost of sales

o Consumption of diesel fuel and propane • Prices of diesel fuel, propane and natural gas
o Local currency denominated expenditures • Currency exchange rates–US dollar versus A$, C$ and CLP
• Administration, exploration and business development
costs in local currencies • Currency exchange rates–US dollar versus A$, C$ and ZAR
• Capital expenditures in local currencies • Currency exchange rates–US dollar versus A$, C$ and CLP • Interest earned on cash • US dollar interest rates • Fair value of fixed-rate debt • US dollar interest rates BARRICK SECOND QUARTER 2007 51 NOTES TO FINANCIAL STATEMENTS (UNAUDITED)

Under our risk management policy, we seek to mitigate the impact of these market risks to provide certainty for a portion of our revenues and to control costs and enable us to plan our business with greater certainty. The timeframe and manner in which we manage these risks varies for each item based upon our assessment of the risk and available alternatives for mitigating risk. For these Particular risks, we believe that derivatives are an effective means of managing risk.
The primary objective of the hedging elements of our derivative positions is that changes in the values of hedged items are offset by changes in the values of derivatives. Most of the derivatives we use meet the FAS 133 hedge effectiveness criteria and are designated in a hedge accounting relationship. Some of the derivative positions are effective in achieving our risk management objectives but they do not meet the strict FAS 133 hedge effectiveness criteria, and they are classified as “non-hedge derivatives”. The change in fair value of these non-hedge derivatives are currently recorded in earnings, in a manner consistent with the derivative positions’ intended use.
The changes in fair value of non-hedge gold and copper derivative instruments are recorded in revenue. The changes in fair value of non-hedge silver and fuel derivative contracts are recorded in cost of sales. The changes in fair value of non-hedge foreign exchange derivative instruments are recorded in other operating expenses.
The changes in value of non-hedge interest rate swaps are recorded in interest income or interest expense, depending on the intended purpose of the swap. The changes in fair value of share purchase warrants are recorded in other income.
Summary of Derivatives at Jun.30, 2007 1
US Dollar Interest Rate Contracts Receive-fixed swaps totaling $300 million have been designated in first quarter 2007 against the 5 3 / 4 % and 6.35% debentures, included in long-term debt, as a hedge of the variability in the fair value of the debentures caused by changes in LIBOR. For these hedges, prospective hedge effectiveness is assessed by comparing the effects of theoretical shifts in forward interest rates on the fair value of both the debt and the swaps. The retrospective assessment involves comparing the effect of changes in the underlying interest rate (i.e., LIBOR) on both the debt and the swaps.
In the second quarter, receive-fixed swaps totaling $500 million expired. These swaps were set up as fair value
Notional Amount by Term to Accounting Classification by Fair Maturity Notional Amount value Within 1 1 to 5 Over 5 Cash flow Fair value Non- year years years Total hedge hedge Hedge
US dollar interest rate contracts Receive-fixed swaps (millions) $ — $ 75 $ 300 $ 375 $ — $ 300 $ 75 $ (8 ) Pay-fixed swaps (millions) — (125 ) — (125 ) — — (125 ) (9 )
Net notional position $ — $ (50 ) $ 300 $ 250 $ — $ 300 $ (50 ) $ (17 )
Currency contracts C$:US$ contracts (C$ millions) C $ 239 C $ 183 C $ — C $ 422 C $ 422 C $ — C $ -2 $ 44 A$:US$ contracts (A$ millions) A $ 1,089 A $ 1,886 A $ — A $ 2,975 A $ 2,968 A $ — A $ 7 242 EUR:US$ contracts ( € million) € 2 € — € — € 2 € — € — € 2 — CLP:US$ Contracts (CLP billions) CLP18 CLP— CLP— CLP18 CLP18 CLP— CLP— $ —
Commodity contracts Copper call option spread contracts
(millions of pounds) 116 105 — 221 $ — $ — $ 221 $ 47 Copper sold forward contracts
(millions of pounds) 116 120 — 236 236 — — (32 ) Copper collar contracts (millions of
pounds) 191 — — 191 147 — 44 3 Diesel forward contracts (thousands
of barrels) 1,229 2,167 680 4,076 3,854 — 222 43 Propane bought forward contracts
(millions of gallons) 9 — — 9 9 — — 1 Natural gas bought forward contracts
(millions of Btu) 1 — — 1 1 — — —
1 Excludes gold sales contracts (see note 5), gold lease rate swaps (see note 5), Celtic Resources & Midway Gold share purchase warrants.
BARRICK SECOND QUARTER 2007 52 NOTES TO FINANCIAL STATEMENTS (UNAUDITED)
hedges of the $500 million 7.5% debentures which matured on May 1, 2007.
Changes in fair value of the swaps, together with changes in fair value of the debentures caused by changes in LIBOR are recorded in earnings each period. Also, as interest payments on the debentures are recorded in earnings, an amount equal to the net of the fixed-rate interest receivable and the variable-rate interest payable is recorded in earnings as a component of interest costs.
Non-hedge Contracts We use gold lease rate swaps as described in note 5. The valuation of gold lease rate swaps is impacted by market US dollar interest rates. Changes in fair value of gold lease rate swaps are recorded in current period interest income. Our non-hedge pay-fixed swap position mitigates the impact of changes in US dollar interest rates on the valuation of gold lease rate swaps. Changes in fair value of these pay-fixed interest rate swaps are recorded in current period interest income.
Currency Contracts Cash Flow Hedges Currency contracts totaling C$422 million, A$2,968 million and CLP 18 billion have been designated against forecasted local currency denominated expenditures as a hedge of the variability of the US dollar amount of those expenditures caused by changes in currency exchange rates over the next four years. Hedged items are identified as the first stated quantity of dollars of forecasted expenditures in a future month. For a C$422 million and A$2,905 and CLP 13 billion portion of the contracts, we have concluded that the hedges are 100% effective under FAS 133 because the critical terms (including notional amount and maturity date) of the hedged items and currency contracts are the same. For the remaining A$63 million and CLP 5 million portions, prospective and retrospective hedge effectiveness is assessed using the hypothetical derivative method under FAS 133. The prospective test involves comparing the effect of a theoretical shift in forward exchange rates on the fair value of both the actual and hypothetical derivative. The retrospective test involves comparing the effect of historic changes in exchange rates each period on the fair value of both the actual and hypothetical derivative using a dollar offset approach. The effective portion of changes in fair value of the currency contracts is recorded in OCI until the forecasted expenditure impacts earnings. For expenditures capitalized to the cost of inventory, this is upon sale of inventory, and for capital expenditures, this is when amortization of the capital assets is recorded in earnings.
Commodity Contracts Cash Flow Hedges Commodity contracts totaling 3.9 million barrels of diesel fuel and 8.5 million gallons of propane have been designated against forecasted purchases of the commodities for expected consumption at our mining operations. The contracts act as a hedge of the impact of variability in market prices on the cost of future commodity purchases over the next seven years. Hedged items are identified as the first stated quantity in millions of barrels/gallons of forecasted purchases in a future month. Prospective and retrospective hedge effectiveness is assessed using the hypothetical derivative method under FAS 133. The prospective test is based on regression analysis of the month-on-month change in fair value of both the actual derivative and a hypothetical derivative caused by actual historic changes in commodity prices over the last three years. The retrospective test involves comparing the effect of historic changes in commodity prices each period on the fair value of both the actual and hypothetical derivative using a dollar offset approach. The effective portion of changes in fair value of the commodity contracts is recorded in OCI until the forecasted transaction impacts earnings. The cost of commodity consumption is capitalized to the cost of inventory, and therefore this is upon the sale of inventory.
The terms of a series of copper-linked notes result in an embedded fixed-price forward copper sales contract that meets the definition of a derivative and must be separately accounted for. The resulting copper derivative has been designated against future copper sales as a cash flow hedge of the variability in market prices on those future sales. Hedged items are identified as the first stated quantity of pounds of forecasted sales in a future month. During the quarter, we entered into a series of copper collar contracts that provide us with a floor price for our future copper sales, while lacing a cap price on those future sales for 147 million pounds of copper over the next 12 months. Hedged items are identified as the first stated quantity of pounds of forecasted sales in a future month, after the previously hedged quantity of sales has occurred.
Prospective hedge effectiveness is assessed using a dollar offset method. The prospective assessment involves comparing the effect of theoretical shifts in forward copper prices on the fair value of both the actual hedging derivative and a hypothetical derivative. The retrospective assessment involves comparing the effect of historic changes in copper prices each period on the fair value of both the actual and hypothetical derivative using a dollar offset approach. The effective portion of
BARRICK SECOND QUARTER 2007 53 NOTES TO FINANCIAL STATEMENTS (UNAUDITED)
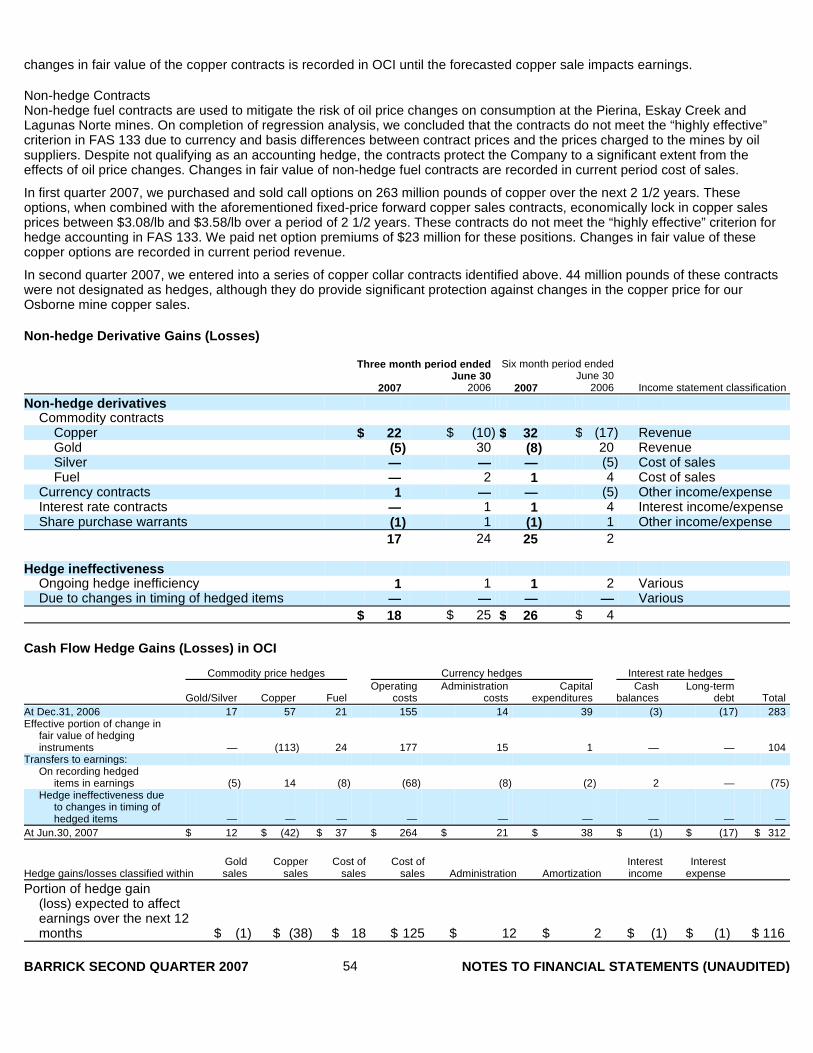
changes in fair value of the copper contracts is recorded in OCI until the forecasted copper sale impacts earnings.
Non-hedge Contracts Non-hedge fuel contracts are used to mitigate the risk of oil price changes on consumption at the Pierina, Eskay Creek and Lagunas Norte mines. On completion of regression analysis, we concluded that the contracts do not meet the “highly effective” criterion in FAS 133 due to currency and basis differences between contract prices and the prices charged to the mines by oil suppliers. Despite not qualifying as an accounting hedge, the contracts protect the Company to a significant extent from the effects of oil price changes. Changes in fair value of non-hedge fuel contracts are recorded in current period cost of sales.
In first quarter 2007, we purchased and sold call options on 263 million pounds of copper over the next 2 1/2 years. These options, when combined with the aforementioned fixed-price forward copper sales contracts, economically lock in copper sales prices between $3.08/lb and $3.58/lb over a period of 2 1/2 years. These contracts do not meet the “highly effective” criterion for hedge accounting in FAS 133. We paid net option premiums of $23 million for these positions. Changes in fair value of these copper options are recorded in current period revenue.
In second quarter 2007, we entered into a series of copper collar contracts identified above. 44 million pounds of these contracts were not designated as hedges, although they do provide significant protection against changes in the copper price for our Osborne mine copper sales.
Non-hedge Derivative Gains (Losses)
Cash Flow Hedge Gains (Losses) in OCI
Three month period ended Six month period ended June 30 June 30 2007 2006 2007 2006 Income statement classification
Non-hedge derivatives Commodity contracts
Copper $ 22 $ (10 ) $ 32 $ (17 ) Revenue Gold (5 ) 30 (8 ) 20 Revenue Silver — — — (5 ) Cost of sales Fuel — 2 1 4 Cost of sales
Currency contracts 1 — — (5 ) Other income/expense Interest rate contracts — 1 1 4 Interest income/expense Share purchase warrants (1 ) 1 (1 ) 1 Other income/expense
17 24 25 2 Hedge ineffectiveness
Ongoing hedge inefficiency 1 1 1 2 Various Due to changes in timing of hedged items — — — — Various
$ 18 $ 25 $ 26 $ 4
Commodity price hedges Currency hedges Interest rate hedges Operating Administration Capital Cash Long-term Gold/Silver Copper Fuel costs costs expenditures balances debt Total
At Dec.31, 2006 17 57 21 155 14 39 (3 ) (17 ) 283 Effective portion of change in
fair value of hedging instruments — (113 ) 24 177 15 1 — — 104
Transfers to earnings: On recording hedged
items in earnings (5 ) 14 (8 ) (68 ) (8 ) (2 ) 2 — (75 ) Hedge ineffectiveness due
to changes in timing of hedged items — — — — — — — — —
At Jun.30, 2007 $ 12 $ (42 ) $ 37 $ 264 $ 21 $ 38 $ (1 ) $ (17 ) $ 312
Gold Copper Cost of Cost of Interest Interest Hedge gains/losses classified within sales sales sales sales Administration Amortization income expense
Portion of hedge gain (loss) expected to affect earnings over the next 12 months $ (1 ) $ (38 ) $ 18 $ 125 $ 12 $ 2 $ (1 ) $ (1 ) $ 116
BARRICK SECOND QUARTER 2007 54 NOTES TO FINANCIAL STATEMENTS (UNAUDITED)


16 > CAPITAL STOCK Exchangeable Shares In connection with a 1998 acquisition, Barrick Gold Inc. (“BGI”), issued 11.1 million BGI exchangeable shares, which are each exchangeable for 0.53 of a Barrick common share at any time at the option of the holder, and have essentially the same voting, dividend (payable in Canadian dollars), and other rights as 0.53 of a Barrick common share. BGI is a subsidiary that holds our interest in the Hemlo and Eskay Creek Mines.
At June 30, 2007, 1.4 million BGI exchangeable shares were outstanding, which are equivalent to 0.7 million Barrick common shares (2006 — 0.7 million common shares), and are reflected in the number of common shares outstanding. We have the right to require the exchange of each outstanding BGI exchangeable share for 0.53 of a Barrick common share. While there are exchangeable shares outstanding, we are required to present summary consolidated financial information relating to BGI.
Summarized Financial Information for BGI
1 On determining that certain forecasted capital expenditures were no longer likely to occur within two months of the originally specified time frame.
2 Based on the fair value of hedge contracts at June 30, 2007.
Three month period Six month period ended June 30 ended June 30 2007 2006 2007 2006
Total revenues and other income $ 38 $ 97 $ 81 $ 144 Less: costs and expenses (45 ) (38 ) (92 ) (80 )
Income (loss) before taxes $ (7 ) $ 59 $ (11 ) $ 64
Net income (loss) $ (6 ) $ 56 $ (9 ) $ 59
At Jun.30 At Dec.31 2007 2006
Assets Current assets $ 135 $ 128 Non-current assets 61 50
$ 196 $ 178
Liabilities and shareholders’ equity Other current liabilities 21 25 Current taxes payable 1 16 Intercompany notes payable 415 387 Other long-term liabilities 110 80 Deferred income tax liabilities (19 ) (15 ) Deficit (332 ) (315 )
$ 196 $ 178
BARRICK SECOND QUARTER 2007 55 NOTES TO FINANCIAL STATEMENTS (UNAUDITED)
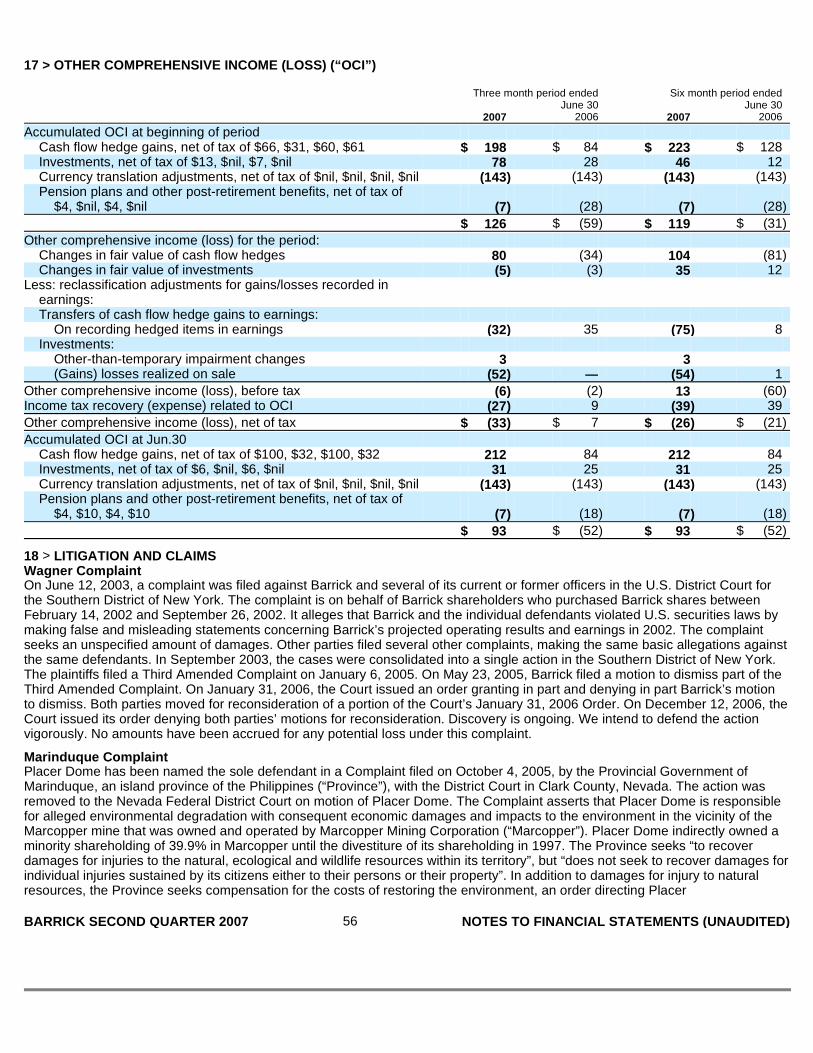
17 > OTHER COMPREHENSIVE INCOME (LOSS) (“OCI”)
18 > LITIGATION AND CLAIMS Wagner Complaint On June 12, 2003, a complaint was filed against Barrick and several of its current or former officers in the U.S. District Court for the Southern District of New York. The complaint is on behalf of Barrick shareholders who purchased Barrick shares between February 14, 2002 and September 26, 2002. It alleges that Barrick and the individual defendants violated U.S. securities laws by making false and misleading statements concerning Barrick’s projected operating results and earnings in 2002. The complaint seeks an unspecified amount of damages. Other parties filed several other complaints, making the same basic allegations against the same defendants. In September 2003, the cases were consolidated into a single action in the Southern District of New York. The plaintiffs filed a Third Amended Complaint on January 6, 2005. On May 23, 2005, Barrick filed a motion to dismiss part of the Third Amended Complaint. On January 31, 2006, the Court issued an order granting in part and denying in part Barrick’s motion to dismiss. Both parties moved for reconsideration of a portion of the Court’s January 31, 2006 Order. On December 12, 2006, the Court issued its order denying both parties’ motions for reconsideration. Discovery is ongoing. We intend to defend the action vigorously. No amounts have been accrued for any potential loss under this complaint.
Marinduque Complaint Placer Dome has been named the sole defendant in a Complaint filed on October 4, 2005, by the Provincial Government of Marinduque, an island province of the Philippines (“Province”), with the District Court in Clark County, Nevada. The action was removed to the Nevada Federal District Court on motion of Placer Dome. The Complaint asserts that Placer Dome is responsible for alleged environmental degradation with consequent economic damages and impacts to the environment in the vicinity of the Marcopper mine that was owned and operated by Marcopper Mining Corporation (“Marcopper”). Placer Dome indirectly owned a minority shareholding of 39.9% in Marcopper until the divestiture of its shareholding in 1997. The Province seeks “to recover damages for injuries to the natural, ecological and wildlife resources within its territory”, but “does not seek to recover damages for individual injuries sustained by its citizens either to their persons or their property”. In addition to damages for injury to natural resources, the Province seeks compensation for the costs of restoring the environment, an order directing Placer
Three month period ended Six month period ended June 30 June 30 2007 2006 2007 2006
Accumulated OCI at beginning of period Cash flow hedge gains, net of tax of $66, $31, $60, $61 $ 198 $ 84 $ 223 $ 128 Investments, net of tax of $13, $nil, $7, $nil 78 28 46 12 Currency translation adjustments, net of tax of $nil, $nil, $nil, $nil (143 ) (143 ) (143 ) (143 ) Pension plans and other post-retirement benefits, net of tax of
$4, $nil, $4, $nil (7 ) (28 ) (7 ) (28 )
$ 126 $ (59 ) $ 119 $ (31 )
Other comprehensive income (loss) for the period: Changes in fair value of cash flow hedges 80 (34 ) 104 (81 ) Changes in fair value of investments (5 ) (3 ) 35 12
Less: reclassification adjustments for gains/losses recorded in earnings: Transfers of cash flow hedge gains to earnings:
On recording hedged items in earnings (32 ) 35 (75 ) 8 Investments:
Other-than-temporary impairment changes 3 3 (Gains) losses realized on sale (52 ) — (54 ) 1
Other comprehensive income (loss), before tax (6 ) (2 ) 13 (60 ) Income tax recovery (expense) related to OCI (27 ) 9 (39 ) 39
Other comprehensive income (loss), net of tax $ (33 ) $ 7 $ (26 ) $ (21 )
Accumulated OCI at Jun.30 Cash flow hedge gains, net of tax of $100, $32, $100, $32 212 84 212 84 Investments, net of tax of $6, $nil, $6, $nil 31 25 31 25 Currency translation adjustments, net of tax of $nil, $nil, $nil, $nil (143 ) (143 ) (143 ) (143 ) Pension plans and other post-retirement benefits, net of tax of
$4, $10, $4, $10 (7 ) (18 ) (7 ) (18 )
$ 93 $ (52 ) $ 93 $ (52 )
BARRICK SECOND QUARTER 2007 56 NOTES TO FINANCIAL STATEMENTS (UNAUDITED)

Dome to undertake and complete “the remediation, environmental cleanup, and balancing of the ecology of the affected areas,” and payment of the costs of environmental monitoring. The Complaint addresses the discharge of mine tailings into Calancan Bay, the 1993 Maguila-guila dam breach, the 1996 Boac river tailings spill, and alleged past and continuing damage from acid rock drainage.
At the time of the amalgamation of Placer Dome and Barrick Gold Corporation, a variety of motions were ending before the District Court, including motions to dismiss the action for lack of personal jurisdiction and for forum non conveniens (improper choice of forum). However, on June 29, 2006, the Province filed a Motion to join Barrick Gold Corporation as an additional named Defendant and for leave to file a Third Amended Complaint. The Court granted that motion on March 2, 2007. On March 6, 2007, the Court issued an order setting a briefing schedule on the Company’s motion to dismiss on grounds of forum non conveniens. Briefing was completed on May 21, 2007, and on June 7, 2007, the Court issued an order granting the Company’s motion to dismiss. On June 25, 2007, the Province filed a motion requesting the Court to reconsider its Order dismissing the action. The Company has opposed the motion for reconsideration, but the briefing is not yet completed. Although the motion to reconsider is still pending, on July 6, 2007, the Province filed a Notice of Appeal to the Ninth Circuit from the Order on the motion to dismiss, subject to the outcome of the motion for reconsideration. We will challenge the claims of the Province on various grounds and otherwise vigorously defend the action. No amounts have been accrued for any potential loss under this complaint.
Calancan Bay (Philippines) Complaint On July 23, 2004, a complaint was filed against Marcopper and Placer Dome Inc. (“PDI”) in the Regional Trial Court of Boac, on the Philippine island of Marinduque, on behalf of a putative class of fishermen who reside in the communities around Calancan Bay, in northern Marinduque. The complaint alleges injuries to health and economic damages to the local fisheries resulting from the disposal of mine tailings from the Marcopper mine. The total amount of damages claimed is approximately US$900 million.
On October 16, 2006, the court granted the plaintiffs’ application for indigent status, allowing the case to proceed without payment of filing fees. On January 17, 2007, the Court issued a summons to Marcopper and PDI. To date, we are unaware of any attempts to serve the summons on PDI, nor do we believe that PDI is properly amenable to service in the Philippines. If service is attempted, the Company intends to defend the action vigorously. No amounts have been accrued for any potential loss under this complaint.
Pakistani Constitutional Litigation On November 28, 2006, a Constitutional Petition was filed in the High Court of Balochistan by three Pakistan citizens against: Barrick, the governments of Balochistan and Pakistan, the Balochistan Development Authority (“BDA”), Tethyan Copper Company (“TCC”), Antofagasta Plc (“Antofagasta”), Muslim Lakhani and BHP (Pakistan) Pvt Limited (“BHP”).
The Petition alleged, among other things, that the entry by the BDA into the 1993 Joint Venture Agreement (“JVA”) with BHP to facilitate the exploration of the Reko Diq area and the grant of related exploration licenses were illegal and that the subsequent transfer of the interests of BHP in the JVA and the licenses to TCC was also illegal and should therefore be set aside. Barrick currently indirectly holds 50% of the shares of TCC, with Antofagasta indirectly holding the other 50%.
On June 26, 2007, the High Court of Balochistan dismissed the Petition against Barrick and the other respondents in its entirety.
NovaGold Litigation On August 24, 2006, during the pendency of Barrick’s unsolicited bid for NovaGold Resources Inc., NovaGold filed a complaint against Barrick in the United States District Court for the District of Alaska. The complaint was amended on several occasions with the most recent amendment having been filed in January 2007. The complaint, as amended, sought a declaration that Barrick will be unable to satisfy the requirements of the Mining Venture Agreement between NovaGold and Barrick which would allow Barrick to increase its interest in the Donlin Creek joint venture from 30% to 70%. NovaGold also asserted that Barrick breached its fiduciary and contractual duties to NovaGold, including its duty of good faith and fair dealing, by misusing confidential information of NovaGold regarding NovaGold’s Galore Creek project in British Columbia. NovaGold sought declaratory relief, an injunction and an unspecified amount of damages. Barrick’s Motion to Dismiss NovaGold’s amended complaint was heard on February 9, 2007.0n July 17, 2007 the Court issued its order granting the Motion to Dismiss with resect to all claims.
On August 11, 2006, NovaGold filed a complaint against Barrick in the Supreme Court of British Columbia. The complaint asserts that in the course of discussions with NovaGold of a potential joint venture for the development of the Galore Creek project, Barrick misused confidential information of NovaGold regarding that project to, among other things, wrongfully acquire Pioneer Metals, a company that holds mining claims adjacent to NovaGold’s project. NovaGold asserts that
BARRICK SECOND QUARTER 2007 57 NOTES TO FINANCIAL STATEMENTS (UNAUDITED)

Barrick breached fiduciary duties owed to NovaGold, intentionally and wrongfully interfered with NovaGold’s interests and has been unjustly enriched. NovaGold seeks a constructive trust over the shares in Pioneer acquired by Barrick and an accounting for any profits of Barrick’s conduct, as well as an unspecified amount of damages. To date, NovaGold has taken no substantive action to pursue this complaint.
Barrick intends to vigorously defend both of the NovaGold complaints. No amounts have been accrued for any potential loss under these complaints.
BARRICK SECOND QUARTER 2007 58 NOTES TO FINANCIAL STATEMENTS (UNAUDITED)

CAUTIONARY STATEMENT ON FORWARD-LOOKING INFORMATION
Certain information included in this Second Quarter 2007 Report, including any information as to our future financial or operating performance and other statements that express management’s expectations or estimates of future performance, constitute “forward-looking statements”. The words “expect”, “will”, “intend”, “estimate” and similar expressions identify forward-looking statements. Forward-looking statements are necessarily based upon a number of estimates and assumptions that, while considered reasonable by management, are inherently subject to significant business, economic and competitive uncertainties and contingencies. The Company cautions the reader that such forward-looking statements involve known and unknown risks, uncertainties and other factors that may cause the actual financial results, performance or achievements of Barrick to be materially different from the Company’s estimated future results, performance or achievements expressed or implied by those forward-looking statements and the forward-looking statements are not guarantees of future performance. These risks, uncertainties and other factors include, but are not limited to: changes in the worldwide price of gold, copper or certain other commodities (such as silver, fuel and electricity) and other currencies; changes in U.S. dollar interest rates or gold lease rates; risks arising from holding derivative instruments; ability to successfully integrate acquired assets; legislative, political or economic developments in the jurisdictions in which the Company carries on business; operating or technical difficulties in connection with mining or development activities; employee relations; availability and increasing costs associated with mining inputs and labor; the speculative nature of exploration and development, including the risks of diminishing quantities or grades of reserves, adverse changes in our credit rating, contests over title to properties, particularly title to undeveloped properties; and the risks involved in the exploration, development and mining business. These factors are discussed in greater detail in the Company’s most recent Form 40-F/Annual Information Form on file with the US Securities and Exchange Commission and Canadian provincial securities regulatory authorities. The Company disclaims any intention or obligation to update or revise any forward-looking statements whether as a result of new information, future events or otherwise, except as required by applicable law.
CORPORATE OFFICE TRANSFER AGENTS AND REGISTRARS Barrick Gold Corporation CIBC Mellon Trust Company BCE Place, TD Canada Trust Tower, Suite 3700 P.O. Box 7010, Adelaide Street Postal Station 161 Bay Street, P.O. Box 212 Toronto, Ontario M5C 2W9 Toronto, Canada M5J 2S1 Tel: (416) 643-5500 Tel: (416) 861-9911 Fax: (416) 861-0727 Toll-free throughout North America: 1-800-387-0825 Toll-free within Canada and United States: 1-800-720-7415 Fax: (416) 643-5501 Email: [email protected] Email: [email protected] Website: www.barrick.com Website: www.cibcmellon.com SHARES LISTED Mellon Investor Services, L.L.C. ABX — The Toronto Stock Exchange 480 Washington Blvd. – 27th Floor The New York Stock Exchange Jersey City, NJ 07310 Tel: (201) 680-4971 Fax: (201) 680-4665 Email: [email protected] Website: www.mellon-investor.com INVESTOR CONTACT MEDIA CONTACT Deni Nicoski Vincent Borg Vice President, Investor Relations Senior Vice President, Corporate Communications Tel: (416) 307-7410 Tel: (416) 307-7477 Email: [email protected] Email: [email protected]