barrier analysis as a tool for behavior change in
TRANSCRIPT

i
Barrier Analysis as a Tool for Behavior Change in Agriculture: A Case Study of the Adoption of Water Harvesting and Erosion Control
Techniques in Kolda, Senegal
Gwen Stacy
Submitted in partial fulfillment of the requirements for the degree of:
Master of Forest Resources
University of Washington
2016
Committee:
Ivan Eastin
Patrick Tobin
Indroneil Gangduly
Program Authorized to Offer Degree:
School of Environmental and Forest Sciences

ii
Abstract
I used Barrier Analysis data from a group of rural Senegalese farmers describing barriers and motivators of constructing berms on erosion prone land to test the implications of a modified behavior change model for use in natural resource management. This model, known as the Design for Behavior Change Framework has had documented successes in health and nutrition based projects; however, its effectiveness in practices relating to natural resource management and agriculture are relatively unknown. The United State Peace Corps as well as several non-governmental and governmental organizations, including the United States Agency for International Development, Project Concern International, Save the Children, Mercy Corps, World Vision, and World Relief are training volunteers and development workers in the use of this model. In this case study, I explored the effectiveness of the Design for Behavior Change Framework for agriculture based practices. I also examined several other factors involved in the adoption of earthworks technologies that are used by agriculture Peace Corps Volunteers within the Southern region of Kolda, Senegal. Results indicated that: (i) a lack of knowledge about earthworks technologies is a significant barrier to the adoption of earthworks berms; (ii) priority groups and study areas may need to be limited within a single village as determinants can vary greatly, even within villages with similar demographics; and (iii) Barrier Analysis may be useful for extension agents working in natural resource management as a follow-up tool if there are low adoption rates after an initial training has been conducted.

iii
Acknowledgements
Thanks to Ivan Eastin, Patrick Tobin, and Indroneil Ganguly for their support and guidance
throughout the process of conducting this case study. Thanks also to my leaders from Peace
Corps Senegal, Vanessa Dickey, Massaly Famara, Arfang Sedio, Yousapha Boye, Cheriff Djitte,
and Samba Kande, without whom I would not have had so many opportunities to participate in
sustainable agriculture and earthworks events within Senegal. Thanks to Cheriff Djitte and
Oumar Diamanka for their patience with translating, and Oumar for being such a generous host.
Thank you to Amanda Landry, Brad Berry, and Jacob Watson, for embarking on an
unforgettable 8-day journey around the Fuladu, and to Tom Barnes, Morgan Brown, Jennifer
Cobb, Alicia Gorina, Danny Lindstrom, Barbara Michel, Nathan Rehr, and Elizabeth Smith for
their service as enumerators. Thank you to my UW Peace Corps Master’s International Cohort:
Bear Dolbear, Alia Kroos, Maggie Wilder, and Mikhael Kazzi, for keeping it real. A huge thanks
to Yousapha Boye for his dedication within the agriculture extension service, and for Missy Ore,
who first introduced me to the people of Saaré Sara. One million thanks to my husband and
partner, Aaron Robson, for following me on this crazy journey and for never tiring of the words
behavior change. Lastly, I want to give a big thanks to the people of Saaré Sara and Yassirba for
their generous hospitality during my stay in Senegal.

iv
Contents
List of Figures ................................................................................................................................ vi
List of Tables ................................................................................................................................ vii
INTRODUCTION .......................................................................................................................... 1
1. SENEGAL BACKGROUND .................................................................................................. 4
Ecology and Climate in Senegal ................................................................................................. 6
Agriculture in Senegal ............................................................................................................... 12
United States Peace Corps Sustainable Agriculture Extension Program .................................. 14
Study Area ................................................................................................................................. 15
2. BEHAVIOR CHANGE ......................................................................................................... 17
Behavior Change in Agriculture ............................................................................................... 19
The Design for Behavior Change Framework .......................................................................... 21
Design for Behavior Change Framework Background ......................................................... 22
Barrier Analysis......................................................................................................................... 23
Framework Outline ................................................................................................................... 25
Peace Corps Approach to Behavior Change ............................................................................. 34
3. EARTHWORKS TECHNOLOGIES .................................................................................... 36
Berms and Swales ..................................................................................................................... 37
Check Dams .............................................................................................................................. 39
Boomerang Berms (Half-moon berms) ..................................................................................... 40
Terraced Gardens ...................................................................................................................... 41
5. METHODOLOGY ................................................................................................................ 44
Saaré Sara .................................................................................................................................. 45
Surrounding Sites ...................................................................................................................... 46
Fodé Bayo .............................................................................................................................. 47
Sinthian Siring and Sinthian Mamadou Giro ........................................................................ 48
Saaré Goundo Yaro ............................................................................................................... 49
Data Collection .......................................................................................................................... 49

v
6. DATA ANALYSIS ............................................................................................................... 52
7. RESULTS & DISCUSSION ................................................................................................. 55
Perceived Self Efficacy ............................................................................................................. 57
Cues for Action ......................................................................................................................... 58
Perceived Susceptibility ............................................................................................................ 59
Perceived Action Efficacy ......................................................................................................... 60
Activities ................................................................................................................................... 60
Activity Follow-up .................................................................................................................... 63
8. CONCLUSIONS & RECOMMENDATIONS ..................................................................... 65
Increasing Knowledge, Skills and Ability of Earthworks Technologies .................................. 66
Barrier Analysis as a tool for Peace Corps Volunteers ............................................................. 67
Additional Determinants ........................................................................................................... 70
Recommendations and Future Research Opportunities ............................................................ 70
Limitations of Research & Researcher Bias ............................................................................. 71
Literature Cited ............................................................................................................................. 73
Appendix ....................................................................................................................................... 76
Appendix 1: Barrier Analysis Survey ....................................................................................... 76
Appendix 2: Completed DBC Framework ................................................................................ 81
Appendix 3: Barrier Analysis Results ....................................................................................... 82
Appendix 4: Activity Plan ......................................................................................................... 86
Appendix 5: Session Plan .......................................................................................................... 92

vi
List of Figures
Figure 1.1: Senegal Map ................................................................................................................ 4 Figure 1.2: Map of Senegal depicting administrative regions ...................................................... 5 Figure 1.3: Map of the 13 ecoregions of Senegal .......................................................................... 8 Figure 1.4: Map of the Kolda Region depicting regional, departmental, and district capitals .... 16 Figure 2.1: Transmission-persuasion model…………………………………...…………….… 19 Figure 2.2: Barrier Analysis Comparison sites…………………………………………….…....21 Figure 3.1: Contour berm............................................................................................................. 38 Figure 3.2: Check dam ................................................................................................................. 39 Figure 3.3: Boomerang berm ....................................................................................................... 40 Figure 3.4: Gardening terraces..................................................................................................... 41 Figure 5.1: Map depicting research sites…..................................................................................49 Figure 5.2: Log berms in 2013 to combat village erosion………………………………………50 Figure 8.1: Training participants learning how to find the contour of the land…………..……..64

vii
List of Tables
Table 2.1: Foundation of Barrier Analysis................................................................................... 25 Table 2.2: The Design for Behavior Change Framework ............................................................ 26 Table 2.3: Formulation of Behavior Statement ............................................................................ 27 Table 2.4: Priority and Influencing Groups ................................................................................. 28 Table 2.5: Twelve Determinants of Behavior .............................................................................. 30 Table 2.6: Formulation of Bridge to Activity .............................................................................. 31 Table 2.7: Example of Completed Design for Behavior Change Framework ............................. 33 Table 6.1: Equations used by the Barrier Analysis ...................................................................... 53 Table 7.1: Results of Barrier Analysis ......................................................................................... 56
1
INTRODUCTION
In the past few years, nongovernmental organizations (NGOs) have substantially
increased their use of formative research to inform behavior change strategy designs. This trend
is in part due to the increased number of people trained to use the Designing for Behavior
Change Framework (DBCF), which requires that some form of qualitative research be conducted
to design the most appropriate activities to increase quality of life. The DCBF promotes using the
rapid assessment tool of Barrier Analysis Survey to understand the key determinants of a priority
group to adopting a specific behavior of practice.
Behavior Change methodology in health and nutrition work is widely documented
(DiClemente, Salazar, & Crosby, 2013; Routledge Communication Series, 2002; Sorensen et al.,
1998); however, much less is reported on behavior change strategies in agriculture and natural
resource management (Davis, 2009). Little has been documented on the effectiveness of adapting
health based behavior change models to agricultural practices (Davis, 2009). Although several
unpublished case studies using the DBCF in agricultural based projects suggest that behavior
change methodologies may have some application in natural resource management (Davis,
2009), further studies are still needed to determine the validity of these claims.
In this case study I explored the use of the DBCF as a behavior change tool for extension
workers to change community behaviors related to the adoption of new and improved
agricultural related technologies and practices. Specifically, I examined behaviors and practices
related to the adoption of earthworks (water harvesting and erosion control) techniques in the
Casamance region of southern Senegal.
Soil and land degradation in Senegal is a complex problem with multiple social,
economic, political, and environmental causes and effects. In many areas within the country,

2
land productivity is threatened by the effects of erosion and subsequent water and soil nutrient
loss during heavy rainy season flooding. For many Senegalese, whose livelihoods depend on the
land, any amount of soil or crop loss can have devastating consequences. Farmers who lose
crops, land, and productivity due to erosion and flooding are subject to decreased household
nutrition, poverty, and are subject to increased incentives to emigrate (USAID, 2010; Edame,
Anam, Fonta, & Duru, 2011; Tappan, Sall, Wood, & Cushing, 2004)
In the southern region of Senegal, where heavy seasonal rains lead to flooding and soil
erosion on sloped land, I witnessed villages that had lost entire community gardens and continue
to experience ever-widening erosion channels through agricultural fields. Research has shown
that farmers cultivating on erosion prone land can protect their fields from erosion by using a
variety of mechanical or biological measures. Peace Corps Volunteers trained in sustainable
agriculture seek to expand the use of biological water harvesting and erosion earthworks
techniques through the use of: (1) contour berms, (2) check dams, (3) terraced gardens, and (4)
half-moon berms. Benefits of using earthworks techniques include increased water retention,
increased capture of organic matter, decreased topsoil and fertilizer runoff, and decreased erosion
channels. Despite these benefits, many farmers in the Casamance region, who are largely
unfamiliar with agricultural practices (Tappan et al., 2004), have not adopted earthworks
techniques.
In January 2014 Peace Corps Senegal sponsored a 2-week behavior change Summit
aimed at promoting behavior change in the health and agriculture sectors. The summit introduced
volunteers to the DBCF. The DBCF focuses on a single behavior or practice and compares the
reasons for completing or not completing that practice between doers and non-doers. Each reason
is categorized into one of 12 determinants. By identifying and understanding the specific

3
determinant that influences action or non-action, activities can be designed to encourage the
adoption of the targeted technology.
During my first year in the Peace Corps, the community in which I served lost its
communal garden due to flooding. Neighboring villages also reported collapsed wells, erosion
channels, and even a casualty who was swept away in an erosion channel during a storm. These
communities had adopted very few earthworks strategies despite the substantial erosion threat. In
response to this situation, I resolved to conduct a case study using the DCBF, with the objective
of identifying the barriers and motivators that influenced the adoption of earthwork technologies.
To accomplish this goal, I needed to adopt a traditional health sector behavior change tool to an
agricultural-based problem.
I compared the determinants between doers, (i.e., those in the region who had adopted
earthworks technologies), and non-doers (i.e., those in the regions who had not adopted
earthworks technologies). Due to the constraints of the DBCF I focused exclusively on
investigating the construction of earthwork berms on erosion prone land.
The specific objectives of my case study were to use data collected through Barrier
Analysis surveys at several farming communities in the Kolda region to: (1) identify the factors
that motivated and restricted the adoption of earthworks technologies and (2) evaluate the use of
Barrier Analysis as a tool for Peace Corps Volunteers and development workers working in
Natural Resource Management. An improved understanding of these factors will enhance
agriculture extension strategies, whether conducted by Peace Corps Volunteers or other
development agencies, by providing insights that can improve the adoption and diffusion of
effective agricultural extension practices.

4
1. SENEGAL BACKGROUND
Senegal is located in the westernmost portion of West Africa (Figure 1.1). It is bordered
by Mauritania in the north, Mali to the east, Guinea to the southeast, Guinea-Bissau to the
southwest and The Gambia, which separates Senegal's southern region of Casamance from the
rest of the country. Senegal covers a land area of almost 197,000 km2 (roughly the size of South
Dakota) and has an estimated population of about 15 million, 42 percent of whom live in rural
areas (CIA , 2016). In 1990, 65% of Senegal’s total land area was covered in forest; by 2005 that
figure had fallen to 45%. The deforestation rate is currently about 0.5% per year. Consumption
of charcoal and firewood for domestic energy and clearing forestland for cultivation, often using
slash-and-burn techniques, has caused substantial deforestation. (World Bank, 2006; FAO, 2005)
Figure 1.2: Senegal is a country located in the westernmost portion of West Africa (SAO, 2016)
5
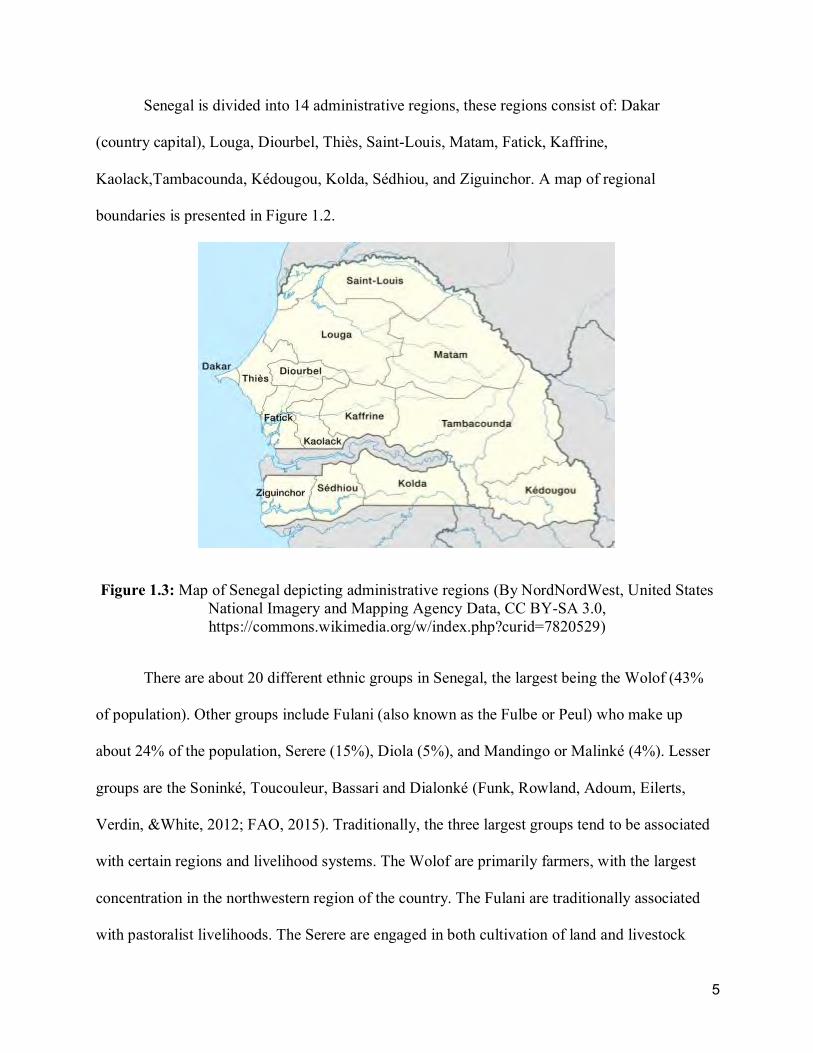
Senegal is divided into 14 administrative regions, these regions consist of: Dakar
(country capital), Louga, Diourbel, Thiès, Saint-Louis, Matam, Fatick, Kaffrine,
Kaolack,Tambacounda, Kédougou, Kolda, Sédhiou, and Ziguinchor. A map of regional
boundaries is presented in Figure 1.2.
Figure 1.3: Map of Senegal depicting administrative regions (By NordNordWest, United States National Imagery and Mapping Agency Data, CC BY-SA 3.0, https://commons.wikimedia.org/w/index.php?curid=7820529)
There are about 20 different ethnic groups in Senegal, the largest being the Wolof (43%
of population). Other groups include Fulani (also known as the Fulbe or Peul) who make up
about 24% of the population, Serere (15%), Diola (5%), and Mandingo or Malinké (4%). Lesser
groups are the Soninké, Toucouleur, Bassari and Dialonké (Funk, Rowland, Adoum, Eilerts,
Verdin, &White, 2012; FAO, 2015). Traditionally, the three largest groups tend to be associated
with certain regions and livelihood systems. The Wolof are primarily farmers, with the largest
concentration in the northwestern region of the country. The Fulani are traditionally associated
with pastoralist livelihoods. The Serere are engaged in both cultivation of land and livestock
6
production and are concentrated in the Peanut Belt. Migration among areas and between groups
has become more fluid as the populations have responded to economic, social, and political
changes. In the northern region of the country, rural livelihoods that were traditionally centered
on pastoralism have become more sedentary as a result of the creation of boreholes providing
reliable water sources for watering livestock and irrigating crops.
French is the official language, although Wolof is more commonly spoken, with an
additional 38 other languages spoken throughout the country. Senegal is a religiously tolerant
secular state with Islam as the predominant religion in the country (95.4%); Christian (4.2%) and
animists (0.4%) make up the rest of the country (CIA , 2016; Monkam, 2011; EIO , 2005; Bruce,
1998; Freudenberger & Freudenberger, 1993).
Ecology and Climate of Senegal
Senegal has a broadly tropical climate and receives most of its rain between June and
September. Rainfall totals of more than 500 millimeters during the rainy season typically provide
enough water for crops and livestock throughout the year; however, recent declining rainfall
trends threaten food security for the entire country (Funk et al., 2012; USAID, 2006; Tappan et
al., 2004).
Senegal experienced four major droughts during the 20th century, including the 1910-
1914 drought (Aubréville, 1949), the 1942- 1949 drought, the 1968-1973 drought, and the 1982-
1984 drought; these droughts have placed a considerable strain on Senegal’s agricultural
production (Tappan et al., 1992; Tucker & Nicholson, 1999; USGS, 2000). These droughts are
one the leading forces behind the changes in local landscapes and farming systems across
Senegal as rainfall continues to decrease across the country (Tappan et al., 1992). For example,

7
between 1965 and 1990, rainfall decreased by about 200 millimeters per year countrywide (Funk
et al., 2012, USAID, 2006; Tappan et al., 2004, Hulme, Doherty, Ngara, & Lister, 2001).
Another result of the prolonged drought has been the reduction of Senegal’s already limited
groundwater and surface water resources, which has severely affected agricultural production
and threatened the health of rural inhabitants (Hulme et al., 2001). Water tables have dropped an
average of 50 centimeters per year in many regions of the country, while traditional flood plains
and marsh areas have remained dry (Funk et al., 2012). Drought, in addition to deforestation for
agricultural expansion and fuelwood, have also severely impacted natural resources in Senegal
resulting in dramatic reductions in plant cover, biological diversity, and land productivity.
Salinization has also become a serious problem in some areas especially in agricultural
ecoregions that border the ocean and estuaries (Tappan et al., 2004).
Within Senegal there are several ecoregion stratifications. One commonly used
classification lists 13 agricultural ecoregions that are generally considered to be relatively
homogeneous in natural and socio-economic landscapes (Tappan et al., 2004). A map of these
ecorregions is presented in Figure 1.3.

8
Figure 1.4: Map of the 13 ecoregions of Senegal (Tappan et al., 2004)
The 13 agricultural ecoregions (from Tappan et al., 2004) include the following:
1. West Central Agricultural Ecoregion (Peanut Basin): This ecoregion is located in
the western and central part of the country. This is where the majority of the
peanut crop is grown in Senegal as well as other crops such as millet, sorghum,
and corn. Most of this region is rain-fed but some irrigated production does occur.
The Peanut Basin is an agro-silvicultural system where crops and trees are
combined on the landscape. Some nomadic herders exist in the area but not as
extensively as in other regions (e.g., the Ferlo).

9
2. Senegal River Valley: This zone incorporates the very northern part of the
country. The Senegal River Valley is the fertile zone that buffers the Senegal
River from the Ferlo. This area has many irrigation projects and engages heavily
in orchards, rice, and sugar production.
3. Northern Sandy Pastoral Ecoregion (The Ferlo): This region has a short, irregular
rainy season, and is generally too dry for crop production. The region is primarily
used for grazing and offers open grasslands with scattered shrubs and trees but
with a relatively limited diversity of woody plants. The acacia genus is prolific in
this region.
4. Ferruginous Pastoral Ecoregion: This area is sometimes grouped with the Ferlo
and is located in the Northeastern part of the country. This area is used mainly by
nomadic herders during the rainy season. This is a silvo-pastoral land use system
in which trees are incorporated into the landscape and the livestock feed off of the
grasses and trees.
5. Southern Sandy Pastoral Ecoregion: This area is considered part of Senegal’s
extensive silvo-pastoral region, with more reliable and more productive
grasslands than the ecoregions to the north and east. A considerably deeper water
table distinguishes this area from the southern peanut basin, making the area less
workable for crop production.
6. Niayes/Great Coast Ecoregion: This region begins in the Dakar area and runs up
the coast buffering the Peanut Basin from the Atlantic Ocean. Wetlands, sand
dunes, and some grasslands define this small and over-worked region. The area is

10
important for fishing, vegetable growing, and some livestock production. It
produces nearly 80% of vegetables grown in Senegal (Tappan et al., 2004).
7. Saloum Agricultural Ecoregion: This region is often considered part of the Peanut
Basin, but can be slightly differentiated by higher rainfall and plant diversity,
including substantial woodland species. Recent increases in agricultural activity
are swiftly changing this woodland zone and tree cover has fallen from 40-70% to
10-20% in the last 70 years (Tappan et al., 2004).
8. Agricultural Expansion Ecoregion: This area was once defined by wooded
savannas with deep, sandy to loamy soils; however, agricultural expansion has
largely transformed this region into a degraded shrub and tree savanna. This area
has higher rainfall than the Peanut Basin and as soil fertility continues to dwindle
in other over-worked areas, this region has become increasingly important for
crop production.
9. Eastern Transition Ecoregion: This area shares many of the same characteristics
as the Agricultural Expansion Region but has not faced as an extreme agricultural
takeover due to its further proximity from high density areas, although cotton and
peanut production are increasing. This area has become Senegal’s primary source
for fuelwood and has shown rapid declines in woody cover over the last 50 years
(Tappan et al., 2004).
10. Shield Ecoregion: This zone is located in the southeastern corner of the country,
and is sometimes known as the agro-silvo-pastoral zone. This eco-region is
characterized by crop production, livestock, and forest and plantation land.
Parklands also exist here, which promote livestock and agricultural production.

11
This region normally receives the most rain and has the greatest variation in
elevation in the country.
11. Casamance: The Casamance river valley receives more rainfall than much of the
country and is an ideal growing climate for rice and fruit trees. Currently 80% of
the mangos produced in Senegal come from the Casamance (Tappan et al., 2004).
While the growing climate is also suitable for many vegetables, vegetable
production is low due to the unfamiliarity with agricultural practices in the local
population. However, agricultural production has been boosted in recent years by
the expansion of cotton production in the Kolda Region and rice cultivation in the
Anambe Basin (Tappan et al., 2004). Farmers often face erosion and flooding
problems during the rainy season.
12. The Estuaries: This region, composed of tidal wetlands, hosts dense mangrove
forests and brackish water. Over the last 40 years, it is believed that the mangrove
forests have declined due to increases in salinity and acidity as a result of reduced
precipitation (Tappan et al., 2004). These coastal wetlands have been traditionally
important for maintaining wildlife.
13. Dakar Region: This region covers a very small land area and is primarily urban. It
is the most populated region in Senegal.

12
Agriculture in Senegal
Although about 70% of the population is employed in the agricultural sector, only 17.5%
of Senegal’s GDP is from agriculture (2013) (FAO, 2015). Food staples—millet, sorghum,
maize, and rice—are grown for domestic consumption, and cotton and groundnut are grown for
both consumption and export. Crop production is mainly dependent on seasonal rainfall and is
highly susceptible to drought and damage from pests. As low rainfall, desertification, and
intensive land use continue to threaten some areas of the country, agricultural production is
expanding into new areas, further depleting those areas of standing biomass.
The northern part of Senegal is characterized by high rainfall variability and extensive
cattle herding that is relatively more important than crop production (Tappan et al., 2004). This
region is the one most affected by drought, and its population is often exposed to food insecurity
(Tappan et al., 2004; Funk et al., 2012;). The southern part of Senegal is dominated by natural
woodlands with relatively high plant production and woody biomass (Lawesson, 1995).
Although heavy rainfall is beneficial for this region's rice and fruit production, flooding can have
devastating consequences as erosion channels threaten field crop production and wash away vital
topsoil.
Soils in Senegal are extremely diverse, and include silt rich flood plains along the banks
of the Senegal River in the North, a sandy peanut basin in central Senegal, and heavier clay and
rocky soils in the East and South. Despite the differing soil textures, soil in Senegal tends to be
extremely low in organic matter. The following poor agricultural practices compound these
issues:

13
1. Crops are not rotated in fields and fields are not left fallow.
2. Crop residues are not left in the fields or composted; rather, they are burned to
clear fields, or used for fuel, roofing materials, or livestock fodder.
3. Little organic matter is incorporated into the soil due to the lack of trees in or
adjacent to agriculture fields. The trees and leaf litter that do exist are often
browsed by animals or burned.
4. Low levels of standing biomass to bind topsoil together results in topsoil loss
during the first heavy rains.
5. Rubbish piles of peanut shells and millet chaff are not incorporated into organic
compost. Rather, they are frequently mixed with garbage to produce a compost
that is often contaminated with toxic, inorganic material.
6. Livestock manure is not incorporated into compost, but is applied directly to
growing areas which can lead to nitrogen burn or be subject to water runoff
during heavy storms.
7. Peanut production exposes the soil, making it susceptible to photo-degradation,
desiccation, and wind erosion. (Tappan et al., 2004; Parton, Tappan, Ojima, &
Tschakert, 2004)
A wide variety of soil improvement and soil conservation practices can help bring the soil
organic matter content up to a level sufficient for agricultural production, including earthworks
technologies applied in areas prone to erosion (Tschakerta et al., 2004).

14
United States Peace Corps Sustainable Agriculture Extension Program
The Peace Corps began its collaboration with Senegal in 1963 as part of an education
initiative aimed at increasing literacy rates across the country. Since then, more than 2,500
Volunteers have worked in Senegal in various fields of social and economic development. In the
late 1980s, Peace Corps Senegal changed its program into sector-specific areas corresponding to
Senegal's development priorities. Peace Corps Senegal now works in health, agriculture, small
enterprise development, and agroforestry (Peace Corps Senegal, 2013).
The Peace Corps established an agriculture program in Senegal in 1988. The agriculture
program was developed as an extension of the United States Agency for International
Development’s (USAID) African Food Security Initiative, whose community development
activities eventually focused into sectoral projects, including public health and agriculture. The
agriculture program originally consisted of two projects: sustainable agriculture and rice culture
extension. However, in 1997 the projects were integrated into one program to better address the
needs of the local population since farmers' extension needs encompass both rice and field crops.
Sustainable Agriculture Volunteers work with local farmers to increase agricultural production
and income in rural areas across the country. Volunteers also work to introduce appropriate seed
varieties and improved cultivation techniques (Peace Corps Senegal, 2013).
In 2009, Peace Corps Senegal entered into a four-year program with USAID to enhance
food security across Senegal. The program provides Peace Corps Volunteers and their
communities with resources far beyond what was available in the past, including access to more
funding and resources to facilitate monitoring efforts and project evaluation. In 2011 the program
was extended through July 2017 (USAID, 2016; Feed the Future, 2016).

15
The increased emphasis on monitoring and evaluating projects has demanded higher
accountability within Peace Corps Senegal to ensure that projects are meeting established goals
regarding individual community needs. Consequently, Peace Corps Senegal had followed the
lead of other development organizations in incorporating behavior change methodology into
their standard practices. Volunteers in all sectors are now required to complete at least 6 hours of
behavior change training, during which they are trained in Participatory Analysis of Community
Assets, the DBCF, and Barrier Analysis. These efforts help to train volunteers to better engage
with communities, to understand the barriers and motivators that influence the adoption of new
practices, and provide tools to assist volunteers in developing more appropriate and effective
training activities that lead to increased rates of adoption.
Study Area
The study areas for this project are located in the southern region of Kolda (Figure 1.4).
This region is part of the Casamance agricultural zone and has the largest amount of annual
rainfall. Elevation changes in this region make it unique to most agricultural land in Senegal.
Because of these land grade changes, land is susceptible to soil erosion and topsoil loss and
farmers must manage their land differently than farmers in other regions. Most of the country’s
mangoes and cashew nuts come from this region; however, recent land use trends suggest that
this region is being rapidly converted into farmland. As new farmers deforest land and cultivate
fields for farming, topsoil loss is becoming more problematic. Many of these new farmers are
using unsustainable cultivating technologies, such as not rotating crops, inappropriate use of
pesticides and fertilizers, and not planting on contour. These practices result in high topsoil
erosion during early season rains. As the topsoil runs-off, deep erosion channels are carved
through fields carrying fertilizers and vital nutrients into local streams. In addition, the deep

16
erosion channels increase the difficulty in cultivating these fields in the future as subsequent
heavy rainy deepen and enlarge the erosion channels.
Figure 1.5: Map of the Kolda Region depicting regional, departmental, and district capitals (adapted from AUSenegal, 2010)

17
2. BEHAVIOR CHANGE
Historically, development workers have struggled to identify the most effective strategies
to persuade people to adopt new behaviors and in turn improve their quality of life. Research has
helped development workers identify behaviors that address problems in several important areas,
including health, malnutrition, and food security and as a result, there has been substantial
progress made in addressing these problems (Routledge Communication Series, 2002; Sorensen
et al., 1998; Aubel, Toure, & Diagne, 2004). However, although progress has been made to
promote knowledge regarding key behaviors that can improve quality of life (hand washing,
drinking potable water, using a latrine, breastfeeding, vaccinating) we now know that knowledge
alone does not guarantee behavior change. Many workers and volunteers have spent considerable
time and resources developing training workshops that provide individuals with information
about improved behaviors (such as handwashing), only to find alarmingly low adoption rates of
the beneficial behavior in follow-up studies (Kittle, 2013; Davis, 2009; Aubel et al., 2004; Allen,
2001). Most development workers now agree that directive methods involving straight delivery
of information to individuals can contribute to improvements in the knowledge of practices,
although these methods are not always an effective way to bring about actual changes in
practices (Aubel et al., 2004).
The vast majority of these behavior change programs are grounded in the transmission-
persuasion model of education communication (Waisbord, 2001). This model (Figure 2.1) has
been widely supported by North American and international development agencies and has been
incorporated into various strategies that have been widely-used over the past 15 years (Waisbord,
2001; Aubel et al., 2004). In the transmission-persuasion model, succinct messages are
developed that are intended to persuade people to adopt expert-proposed health/nutrition

18
behaviors. The approach is essentially top-down and one way, involving audiences, target
groups, and message delivery (Thomas, 1994). However, programs using this top-down
approach have “seldom been effective in the long term” in promoting changes in nutrition
practices, largely because the intended beneficiaries do not see the new ideas or services as
fulfilling their own aspirations and wellbeing, additionally many proposed practices do not
consider limiting regional, cultural, or religious factors that may discourage intended
beneficiaries from adoption (Allen, 2001).
Alternative approaches to the transmission-persuasion model are now being developed
based on results of successful health programs. These approaches now use participatory,
dialogical methods based upon constructivist learning through which community members are
challenged to integrate ‘‘traditional’’ and biomedical concepts of health/illness. These programs
have had success promoting improved maternal and child nutrition practices and other health
related behaviors (Aubel et al., 2004); however, little has been documented regarding their
Persuasive Message
Received by audience
Results in Change in Behavior
Influence flows in one direction only
Figure 2.1: Transmission-persuasion model. Information flows in one direction only. The intended beneficiary hears a persuasive and educational message promoting the desired behavior and is
expected to adopt new behavior.

19
effectiveness in promoting behavior changes in agriculture and natural resource management
(Davis, 2009).
Behavior Change in Agriculture
In the absence of well-established practices involving the behavior change methodology
for agriculture and natural resource management, development workers interested in assessing
farmer’s behaviors generally develop their own methods for understanding community problems
and practices. Most rely on some form of the transmission-persuasion model to deliver
information, but based on current understanding of the limitations of that model, it is likely that
these practices could be improved upon. Though little has been documented regarding the
effectiveness of translating health-based behavior change models to agriculture-based practices,
the underlying principles have been successfully applied in other fields both abroad and
domestically, including the Baltimore City Government to look at the use of trashcans (Davis,
2009). This suggests that adapting the model to agriculture projects could yield better results
than current best practices. Indeed, several unpublished case studies released by the CORE
Group1, using the DBCF in agriculture based projects supported this conclusion.
In Guatemala, staff from Catholic Relief Services working in two culturally similar
provinces, San Marcos and Baja Verapaz, were developing a project to increase key soil
conservation practices. Staff in San Marcos received the DBCF and Barrier Analysis training;
however, staff in Baja Verapaz did not. Both sites were working toward promoting soil
conservation practices, and used the same monitoring system. The staff in San Marcos
1 The CORE Group is a coalition of non-profit global health organizations with the goal of increasing technical excellence in integrated, community-based global health programming. www.coregroup.org

20
implemented a behavior change strategy using the DBCF and conducted a shorter version of the
Barrier Analysis survey looking at the specific behavior of planting live barriers, which was
identified as the practice with the lowest adoption rate. In the comparison area, Baja Verapaz
determined a strategy to promote soil conservation practices based on past experiences and used
no additional formative research to determine a training plan. After conducting a Barrier
Analysis in San Marcos, staff found that: (1) Most farmers, doers and non-doers, fully
understood the benefits of the practice, (2) doers worked together to plant the barriers, and (3)
doers liked the practice because they did not lose plantings due to drought. Based on these
results, staff in San Marcos focused on organizing farmers to work together on each other’s land
during the off-season to plant the barriers. Additionally, staff helped farmers organize to discuss
additional ways to minimize loss during drought. As a result of the training, San Marcos saw
significant increases in the amount of hectares planted with live barriers compared to the sites in
Baja Verapz, which saw declines in the amount of hectares planted with live barriers (Figure 2.2;
Davis, 2012). This study shows that Barrier Analysis survey may have some usefulness for
natural resource management; however, further independent studies are needed to test this
assumption.

21
Figure 2.2: Comparison of two sites in Guatemala working to increase planting live barriers. San Marcos used results from Barrier Analysis to inform their training plan (Davis, 2012).
The Design for Behavior Change Framework
The DBCF is a 5-part matrix that helps behavior change workers to organize existing
information and gather the new information needed to design more effective behavior change
strategies. The DBCF was developed by the CORE Group Social and Behavioral Change
Working Group as a means to design behavior change strategies in any sector. The framework
was originally designed to target health and nutrition based problems. In 2013 it was modified by
members of the Food Security and Nutrition Network Social and Behavioral Change Task Force
to target additional sectors (Food Security and Nutrition Network Social and Behavioral Change
Task Force, 2013). The modified approach is currently being used by many NGOs to promote
the adoption of health related behaviors. However, its effectiveness as a tool for promoting the
adoption of new agricultural practices is relatively undocumented.
342
1770
990
744
0
200
400
600
800
1000
1200
1400
1600
1800
2000
2009 2010
Num
ber o
f Hec
tare
s pla
nted
with
live
ba
rrie
rs
San Marcos
Baja Verapaz

22
The DBCF relies on conducting a Barrier Analysis consisting of “doers” and “non-doers”
to identify key motivators and barriers related to the adoption of a specific behavior. Motivators
and barriers are categorized under 1 of 12 possible determinants.
Design for Behavior Change Framework Background
In 2000, the Social and Behavior Change Working Group set out to identify tools and to
offer capacity-building opportunities that would enable private voluntary organization staff to
incorporate the best of behavioral science into their program plans (Food Security and Nutrition
Network Social and Behavioral Change Task Force, 2013). One of the most useful and
comprehensive tools was determined to be the Academy for Educational Development’s
BEHAVE Framework, a strategic planning tool for managers of behavior change programs that
allows them to decide what data is needed at each step in a project and to focus on the target
group’s point of view.
The Social and Behavior Change Working Group teamed with the Academy for
Educational Development’s CHANGE Project, a project created to pursue behavior change
curriculum, to offer several brief sessions explaining different aspects of behavior change during
the CORE Group annual meetings. Intensive training on the BEHAVE Framework with CORE
Group members began in 2002 (Food Security and Nutrition Network Social and Behavioral
Change Task Force, 2013).
Over the next several years, personnel from the Social and Behavior Change Working
Group and the Academy for Educational Development’s CHANGE Project team collaborated to
conduct and adapt the workshop for field and headquarters staff to help them develop more
effective behavior change strategies for child survival and health programs. In 2006, the Social

23
and Behavior Change Working Group started a process of reviewing experiences with the
training and updated the curriculum (Food Security and Nutrition Network Social and Behavioral
Change Task Force, 2013). In 2009, a new version named, The Designing for Behavior Change
Framework, was designed that added more case studies, stories and examples; clarified the
difference between determinants and key factors; incorporated the Barrier Analysis approach;
added a half-day of field work using formative research; and provided guidelines for selecting
appropriate activities (Food Security and Nutrition Network Social and Behavioral Change Task
Force, 2013). The curriculum was further adapted following regional workshops in Mali, the
United States, as well as in a number of other country workshops. In 2013 a new version of the
DBCF was adopted for food security field-based staff (Food Security and Nutrition Network
Social and Behavioral Change Task Force, 2013).
The key to the effectiveness of this behavior change approach is the Barrier Analysis
research that is conducted as part of the third component of the framework. This third component
requires the development worker to open a dialogue with the target audience through a short
questionnaire to identify which of the twelve determinants of behavior change are key to
changing the behavior.
Barrier Analysis
Barrier Analysis is a rapid assessment tool used to quickly and easily identify behavioral
determinants associated with a particular behavior (e.g.: constructing berms on erosion prone
land) so that extension agents can develop more effective behavior change communication
messages and activities. Individuals doing a behavior (doers) are compared with individuals who
are not (non-doers) so that the most important behavioral determinants can be identified.

24
The methodology was developed out of the need for a standardized tool to discover
determinants of key behaviors promoted in health projects and nutrition programs in developing
countries. The tool was developed by Tom Davis, Director of Health Programs for Food for the
Hungry, in 1990 (Davis, 2009). Since then, the methodology has been disseminated by the
CORE Social and Behavior Change Working Group to be included in the DBCF, and has been
used by many private voluntary organizations, researchers, and graduate students both abroad
and domestically.
Barrier Analysis was designed using two main theories from the scientific literature on
behavior change: (1) Health Belief Model and (2) Theory of Reasoned Action. The Health Belief
Model focuses on six determinants of behavior, (i) perceived susceptibility, (ii) perceived
severity, (iii) perceived benefits (positive outcomes), (iv) perceived barriers (negative outcome),
(v) cues for action, and (vi) self-efficacy. The Theory of Reasoned Actions (Table 2.1) suggests a
person’s behavior is determined by a person's “subjective norm”. Subjective norm is defined as a
person’s “perception that most people who are important to him/her think that he should or
should not perform the behavior in question. In Barrier Analysis this is called perceived social
acceptability/norms. Field studies conducted by Food for the Hungry suggested perceived divine
will as an additional determinant to behavior deriving from the importance of people's religious
beliefs in determining behavior (Davis, 2009).

25
Table 2.1: Foundation of Barrier Analysis based on two main theories of Behavior Change, and development observations (Davis, 2009)
Modifications were later made to the methodology to include the Academy for
Educational Development’s doer/non-doer analysis tool in order to compare the responses of
people who do the behavior (doers) to those who do not (non-doers). Barrier Analysis now
includes the doer/non-doer analysis however Barrier Analysis additionally includes other
determinants not included in doer/non-doer analysis (Davis, 2009).
Framework Outline
The DBCF 5-part matrix is designed to help behavior change workers organize existing
information and gather the new information needed to design more effective behavior change
strategies (Table 2.2). The 5-parts of the framework include:
1. Defining the behavior 2. Describing the priority group 3. Conducting a Barrier Analysis and identifying determinants 5. Creating bridges to activities 6. Designing and implementing activities
1. Health Belief Model i. Perceived Susceptibility
ii. Perceived Severity iii. Perceived Benefits (Positive outcomes) iv. Perceived barriers (Negative outcome) v. Cues for Action
vi. Self-Efficacy
2. Theory of Reasoned Action Suggests a person’s behavior is determined by their “subjective norm”.
3. Further studies i. Perceived Divine Will
26
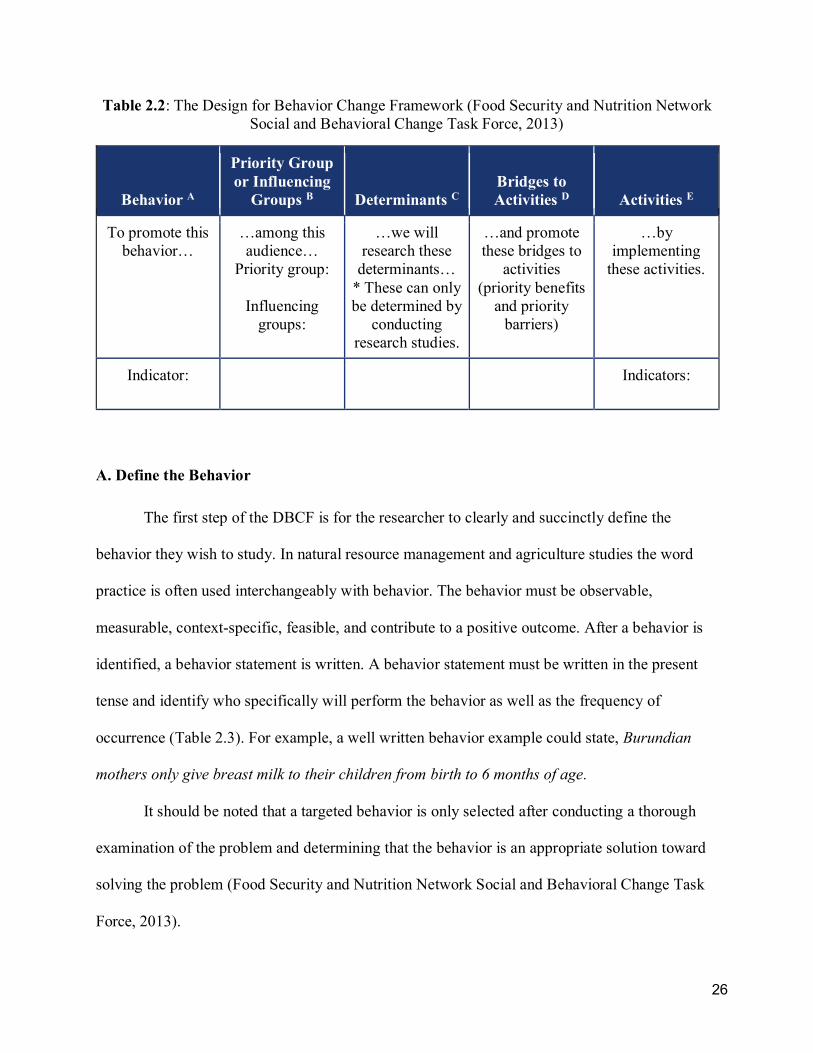
Table 2.2: The Design for Behavior Change Framework (Food Security and Nutrition Network Social and Behavioral Change Task Force, 2013)
Behavior A
Priority Group or Influencing
Groups B Determinants C Bridges to Activities D Activities E
To promote this behavior…
…among this audience…
Priority group:
Influencing groups:
…we will research these
determinants… * These can only be determined by
conducting research studies.
…and promote these bridges to
activities (priority benefits
and priority barriers)
…by implementing
these activities.
Indicator: Indicators:
A. Define the Behavior
The first step of the DBCF is for the researcher to clearly and succinctly define the
behavior they wish to study. In natural resource management and agriculture studies the word
practice is often used interchangeably with behavior. The behavior must be observable,
measurable, context-specific, feasible, and contribute to a positive outcome. After a behavior is
identified, a behavior statement is written. A behavior statement must be written in the present
tense and identify who specifically will perform the behavior as well as the frequency of
occurrence (Table 2.3). For example, a well written behavior example could state, Burundian
mothers only give breast milk to their children from birth to 6 months of age.
It should be noted that a targeted behavior is only selected after conducting a thorough
examination of the problem and determining that the behavior is an appropriate solution toward
solving the problem (Food Security and Nutrition Network Social and Behavioral Change Task
Force, 2013).

27
Table 2.3: Formulation of Behavior Statement
In a DBC Framework the behavior is formulated as:
1. Audience 2. Action verb in present tense 3. The details (frequency, quantity duration…)
Burundian mothers only give breast milk to their children from birth to 6 months of age.
B. Describe the Priority Group and Influencing Groups
The second step of the DBCF is for the researcher to describe in detail the priority group.
The priority group is made up of the individuals responsible for performing the behavior. Using
Burundian mothers from the example above, an example description might include: Burundian
mothers with children 0–6 months of age, live in a rural setting, are illiterate, attend church on
Sunday mornings, are busy with household chores during the day, and want to be perceived as
good mothers and wives.
The influencing group is the group that most directly influences the actions of the priority
group with regard to the behavior. The influencing group can only be described after they are
identified by conducting research among the priority group. In the example above, a Barrier
Analysis survey might reveal that grandmothers are an influencing group. If an influencing group
is uncovered, corresponding activities are created specifically for this group.
The information used to describe the priority and influencing groups help in the design of
future activities. The type of information collected on the Priority and Influencing Groups is
presented in Table 2.4.

28
Table 2.4: Information collected on the priority and influencing group (Food Security and Nutrition Network Social and Behavioral Change Task Force, 2013)
Priority and Influencing Group Descriptions:
Burundian mothers with children 0–6 months of age
1. Demographic features (age, income, residence, skill set, language, education level)
a. Live in rural setting b. Majority are illiterate
2. Daily routines (how they spend their day)
a. Go to church on Sunday morning b. Are busy with daily household chores
3. Common desires (healthy families, steady income)
a. Want to be perceived as good mothers and wives 4. Things that prevent Priority Group from practicing the behavior (how does this factor
relate to influencing group?)
a. After 3 months, they think they do not have enough milk to breastfeed 5. Current knowledge, beliefs and practices regarding the behavior (unaware of behavior,
inconsistently practicing behavior)
a. Exclusively breastfeed until 4 months, but give other foods at that time 6. Readiness of most group members to adopt the new behavior (stage of change) (how is
this evaluated? Is it objective or subjective?)
a. Majority are in partial action stage 7. Influencing Group (after Barrier Analysis and only if applicable)
a. Mothers-in-law, grandmothers

29
C. Barrier Analysis and Determinants
After researchers have identified a target behavior and specified the priority group, a
Barrier Analysis survey is conducted to identify the barriers and motivators for performing the
selected behavior/practice.
A Barrier Analysis is a survey of “doers” and “non-doers”. A recommended minimum
sample size is 45 doers and 45 non-doers (i.e., a 90-person survey) and is based on the results
from using a sample size calculator in case-control type studies with a P value of 0.25, a relative
risk of 3.0, an alpha error rate of 5% (i.e., D = 0.05, the probability of a type I error, or false
positive), and a power of 0.80 (i.e., E = 0.20, the probability of a type II error, or false negative).
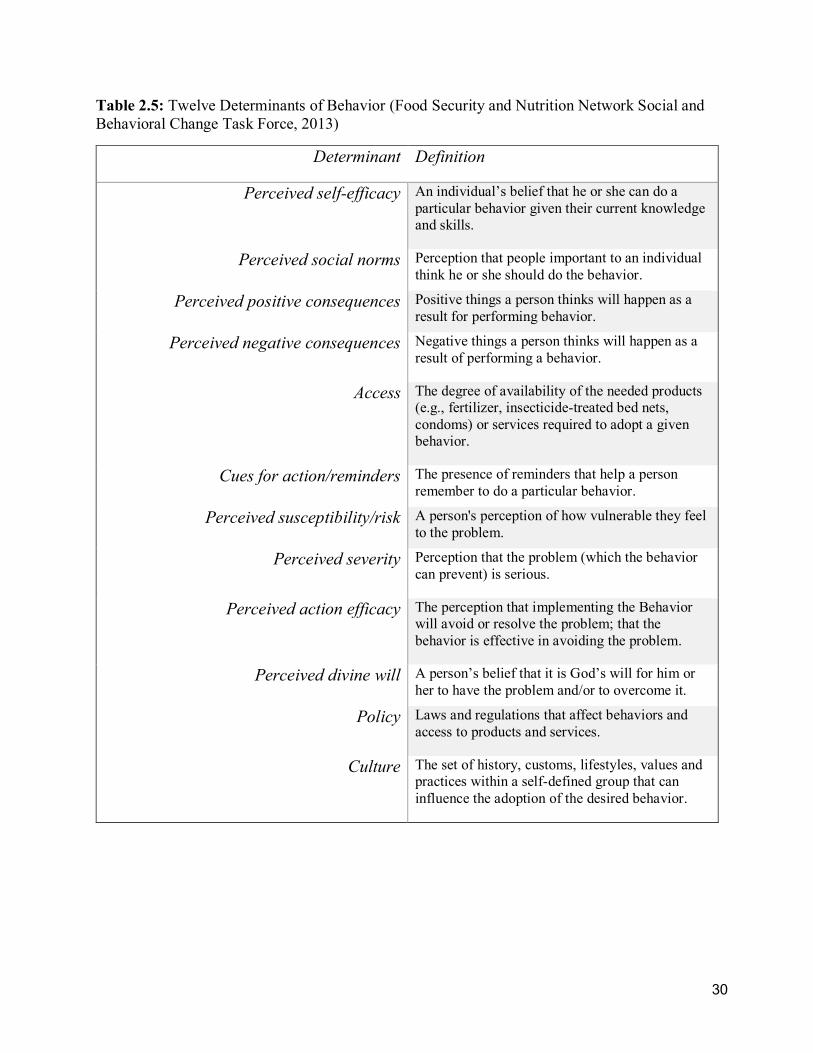
The motivators and barriers identified in the survey are categorized under 1 of 12 possible
determinants (Table 2.5). These determinants represent an individual's perceptions, feelings, and
beliefs and determine why an individual will choose to adopt or deny a specific behavior. In the
above example, a Barrier Analysis might reveal that mothers have: (1) Perceived negative
consequences: Mothers don’t know the relationship between exclusive breastfeeding and
malnutrition. (2) Perceived divine will: Mothers question whether their religious leaders/
traditions support this behavior (3) Perceived social norms: Mothers believe that their mothers or
mothers-in-laws, do not approve of exclusive breastfeeding.
30
Table 2.5: Twelve Determinants of Behavior (Food Security and Nutrition Network Social and Behavioral Change Task Force, 2013)
Determinant Definition
Perceived self-efficacy An individual’s belief that he or she can do a particular behavior given their current knowledge and skills.
Perceived social norms Perception that people important to an individual think he or she should do the behavior.
Perceived positive consequences Positive things a person thinks will happen as a result for performing behavior.
Perceived negative consequences Negative things a person thinks will happen as a result of performing a behavior.
Access The degree of availability of the needed products (e.g., fertilizer, insecticide-treated bed nets, condoms) or services required to adopt a given behavior.
Cues for action/reminders The presence of reminders that help a person remember to do a particular behavior.
Perceived susceptibility/risk A person's perception of how vulnerable they feel to the problem.
Perceived severity Perception that the problem (which the behavior can prevent) is serious.
Perceived action efficacy The perception that implementing the Behavior will avoid or resolve the problem; that the behavior is effective in avoiding the problem.
Perceived divine will A person’s belief that it is God’s will for him or her to have the problem and/or to overcome it.
Policy Laws and regulations that affect behaviors and access to products and services.
Culture The set of history, customs, lifestyles, values and practices within a self-defined group that can influence the adoption of the desired behavior.

31
D. Create Bridges to Activities
After identifying determinants, a bridge to activity is written that describes the specific
direction a determinant will take (i.e., to increase, decrease, reinforce, or promote the perception
that….). A bridge to activity provides a specific description of a planned change for each
determinant that is found to be significant (Table 2.6). This helps researchers identify goals that
need to be achieved in the following activities. In the above example, a bridge to activity for
perceived social norms might read: Increase the perception that grandmothers approve of
exclusive breastfeeding. Once the bridge is created, activities can be designed that focus
exclusively on the determinant in question. A bridge to activity for perceived divine will might
read: Increase the perception that religious leaders approve of exclusive breastfeeding and that
their religious tradition is supportive of exclusive breastfeeding.
Table 2.6: Formulation of bridge to activity (Food Security and Nutrition Network Social and Behavioral Change Task Force, 2013)
Bridge to Activity:
To (increase, decrease, reinforce, or promote) the perception/ability that/to: ___________
1. Increase the perception that a child who is not exclusively breastfed can become malnourished.
2. Increase the perception that religious leaders approve of EBF and that their religious tradition is supportive of
EBF.
3. Increase the perception that grandmothers approve of EBF.

32
E. Design and Implement Activities
After bridges to activities have been written, activities are designed specifically for the
priority group or influencing group to achieve the outcome listed by each bridge to activity.
There are three main criteria that activities must meet to ensure the highest level of adoption of a
targeted behavior (Food Security and Nutrition Network Social and Behavioral Change Task
Force, 2013):
1. Feasibility: the activity is capable of being implemented within the ecological and
geographical context by most of the people in the priority group.
2. Receptivity of the Priority Group: the activity is deemed to be appropriate within the
cultural and social context.
3. Relevance to the Bridges to Activities: the activity directly addresses the bridges to
activities.
For the above bridge to activity, “Increase the perception that grandmothers approve of
EBF,” a corresponding activity might be to include grandmothers when teaching mothers of
young children about EBF, or to provide grandmothers with separate training that highlights the
importance of exclusive breastfeeding. An example of a completed DBCF is presented in Table
2.7.

33
Table 2.7: Example of Completed DBCF (Food Security and Nutrition Network Social and Behavioral Change Task Force, 2013)
Behavior
Priority Group or Influencing
Groups Determinants Bridges To Activities Activities
Burundian mothers only give breast
milk to their children
from birth to 6 months of
age.
Priority Group: Burundian mothers with children 0–6
months of age -Live in rural setting
-Majority are illiterate -Go to church on Sunday morning
-Are busy with daily household chores
- Want to be perceived as good mothers and
wives - After 3 months, they think they do not have
enough milk to breastfeed
-Exclusively breastfeed until 4
months, but give other foods at that time -Majority are in
partial action stage
Influencing Groups: -Mothers-in-law
1. Perceived negative
consequences: - Mothers don’t
know the relationship
between EBF and malnutrition
2. Perceived divine will:
-Mothers question whether their
religious leaders/ traditions support
this behavior
3. Perceived social norms:
- Mothers believe that their mothers, mothers-in-law do
not approve of EBF)
1. Increase the perception that a child who is not
exclusively breastfed can
become malnourished.
2. Increase the perception that
religious leaders approve of EBF
and that their religious
tradition is supportive of
EBF.
3. Increase the perception that grandmothers
approve of EBF.
1. Record stories about mothers with children with good health/weight who do
EBF and believe in EBF. Play the testimonials on EBF at
meetings in the community/ health facilities.
2. In household meetings, use
growth charts to show the difference between several children growing well who
are exclusively breastfeeding and contrast them to other
children who are losing weight who are not EBF.
3. Give religious leaders
sermon guides on EBF and train them in their use.
4. Have Care Group
Volunteers (CGVs) include grandmothers when teaching mothers of young children
about EBF.
Outcome Indicator: Percentage of targeted mothers who only give breast milk to
their infants from birth to 6 months of age
Process Indicators: -Number of women who heard testimonials
-Number of pastors trained - Number of CGV and household visits that
included the mother/grandmother -Number of mothers trained to comfort a crying
child

34
Peace Corps Approach to Behavior Change
In 2013 the Peace Corps Senegal training program included as many as 6 training hours
dedicated to behavior change curriculum for all health sector volunteers. This curriculum
included learning participatory and dialogical methods aimed at developing a better
understanding of volunteer communities and their needs. All health volunteers were required,
within their first several months in site, to perform a baseline survey of their community to better
understand the needs of their community.
Agriculture and agroforestry volunteers received 2 hours of behavior change training.
The first hour introduced volunteers to key terms, and volunteers completed an activity designed
to help them understand that an individual's knowledge and beliefs do not always result in a
corresponding action. The second hour discussed the importance of truly understanding
volunteer communities. Although most volunteers found these sessions to be interesting, they
struggled to relate the concepts to their agriculture-based projects. The lack of agriculture-
specific examples in the literature meant that it was difficult for the curriculum design team to
properly address these concerns and adapt the training sessions for agriculture and agroforestry
volunteers.
In January 2014 Peace Corps Senegal invited Behavior Change consultant Bonnie Kittle
(Behavior Change Strategy Design Consultant, Winchester, Virginia) to host a 2-week long
behavior change seminar to train a small group of volunteers in the DBCF. The DBCF
curriculum is a six-day intensive training designed to provide development workers with a clear
and concise procedure for promoting targeted behavior change in their communities.
During the first week of the seminar, volunteers learn behavior change theory and are
introduced to the DBCF. The second week is designated for volunteers and their local host to

35
work together to design a behavior change strategy that is relevant to their community. During
this portion of the training, volunteers and community members worked side-by-side to
understand the DBCF, develop a behavior change strategy, and develop and translate Barrier
Analysis surveys designed to understand the determinants to change that exist within their
specific community.
At the conclusion of the seminar, the volunteers and their community counterparts were
expected to return to their respective communities and complete a Barrier Analysis survey on the
behavior of their choosing. The results of the surveys would be presented at a follow-up seminar
in August. Based on the feedback generated during the August meetings, Peace Corps Senegal
expected that they would decide whether or not to implement the DBCF into its Pre-Service and
In-Service training curriculums. Doing this would increase the behavior change training to a
minimum of 6 hours for all volunteers.

36
3. EARTHWORKS TECHNOLOGIES
In Senegal, many soils are poor due to the continual loss of topsoil from wind and water
erosion as well as poor agricultural practices (Tappan et al., 2004). If these effects can be
mitigated using low budget earthworks techniques, soil can be passively restored over time
instead of relying on relatively labor intensive techniques such as composting and the addition of
soil amendments. The easiest and most effective way to stabilize and build soil, as well as catch
and absorb rain water, is through the installation of earthworks (Baptista et al., 2012).
Earthworks are permeable mounds or depressions that work to capture water and
windblown organic matter to stabilize soils within a particular watershed. In many areas of West
Africa, earthworks projects have proven to be an effective way of keeping soil in place and
sinking water into the landscape. Additionally, they are easily adapted to fit differing landscapes
and ecology. For example, some Mauritanian farmers make brush fences across small drainage
ways which collect windblown sand and form a sand dune across the drain. During the rainy
season, the dam captures runoff from infrequent rains (Tabor, 1995). Farmers in Burkina Faso,
Mali, and Niger have constructed rock berms along the contour to slow rainfall runoff and allow
more water to infiltrate the soil around their crops (Tabor, 1995).
In addition to soil stabilization, earthworks technologies also have beneficial effects on
crop yields, thus improving the quality of life of farmers in the area. In Enadoujoum, Niger, a
Swiss Aid project constructed a series of large check-dams to stop gully erosion from a 4-meter
deep incised channel of a major drainage way. The check-dams significantly reduced the size of
the channel, increasing beneficial flooding along the drainage way. The supplemental irrigation
of the fields resulted in the largest harvest in village memory (Tabor, 1995). During the 1980s,
the government of Niger, with US Agency for International Development funding were able to

37
quantify an increase in grain and biomass yields under differing plant spacing regimes by using
earthworks technologies on crusted soils throughout the Sahel (Tabor, 1995).
In Cape Verde, located off the coast of Senegal, soil and water conservation strategies
have been a priority of the governments agricultural policies for the last half century (Baptista et
al., 2012). The governments of Cape Verde have implemented numerous earthworks techniques,
including terraces, boomerang berms, and check-dams (Baptista et al., 2012). These soil and
water conservation techniques have contributed to the improvement of the economic and
environmental conditions of the landscape and have increased crop production and
consequentially improved the quality of life for individuals in this area (Baptista et al., 2012).
A description of the primary earthworks technologies extended by Sustainable
Agriculture Peace Corps Volunteers in Senegal is presented below. In my study, I used a Barrier
Analysis to examine the practice of constructing berms on erosion prone land in the Kolda region
of Senegal, and conducted follow-up activities and trainings on the use of additional earthwork
technologies (check dams, boomerang berms, and terraced gardens).
Berms and Swales
Berms and swales are the most common types of earthworks used in Senegal. A berm is a
long low mound of earth established along the contour of unlevelled ground to slow, spread, and
sink water as it moves across the landscape (Figure 3.1). Berms are often reinforced with
vegetation during the rainy season. A swale is a long, shallow trench often dug on the upslope
portion of land to retain water and debris; however, many Senegalese farmers are opposed to
adding swales in their fields because they fear it will decrease viable farm land. To use Barrier
Analysis data for this study, I omitted the necessity of constructing swales with berms in order to
obtain a sample size of 45 doers.

38
Figure 3.1: Contour berm showing collection of debris after heavy rain.

39
Check Dams
A check dam is a low, earthen dam built inside an erosion track perpendicular to the
direction of flow. Check dams are not designed to capture and hold all water that flows into its
catchment area. Rather, they are designed to slow the flow of water within an erosion channel
and allow excess water to leave while remaining inside the original flow track. Check dams can
be reinforced by planting thick rooted vegetation such as Vetiver grass or bamboo to prevent
dam breaches or blow outs. Some communities in Senegal have adapted this technique by using
logs or rocks (Figure 3.2).
Figure 3.2: Check dams constructed of rock

40
Boomerang Berms (Half-moon berms)
A boomerang berm is a semi-circle or half-moon shaped berm that is placed around an
established tree. The purpose of a boomerang berm is to capture water specifically within the
root zone of a single planting. Boomerang berms can be established in series so that the overflow
from one boomerang berm descends into the catchment area of a downslope boomerang berm
(Figure 3.3). Water and beneficial debris flowing down-slope are collected in the berm and
provide the tree with extra water and organic matter longer into the year.
Figure 3.3: Established boomerang berm showing water retention after rain.

41
Terraced Gardens
Terraces are flat shelves of soil built parallel to the contour of a slope with a berm placed
along the down-slope edge. Terraces are used on sloped land where growing space is limited and
intensive cultivation of annual crops is desired. Terraces are the most vulnerable of all of the
earthworks to water erosion and blow-outs (Figure 3.4).
Figure 3.4: Newly constructed gardening terraces on slope

42
4. RESEARCH OBJECTIVE
As a sustainable agriculture volunteer in the Peace Corps (Sept 2013- June 2016), I
frequently saw low adoption rates after training large groups of individuals in a new technology
or practice. Like others in my position, I sought creative ways to overcome this issue, including
informally addressing behavioral barriers, but I lacked a rigorous method of determining the best
course of action, and results were consequently inconsistent. Peace Corps Senegal’s response to
this ongoing issue was to adapt some of the behavior change tools given to health volunteers for
use by agriculture and agroforestry volunteers. Although all incoming agriculture and
agroforestry volunteers were trained in the DBCF, including Barrier Analysis beginning in
September 2015, agriculture volunteers voiced several concerns to this approach. For example,
one criticism was that the DBCF does not provide new insights or information, and it requires a
substantial investment of time and effort with potentially little return. Furthermore, to generate
meaningful conclusions, the framework requires a sample size that is difficult to obtain for
agriculture volunteers (45 doers and 45 non-doers of a practice), given the new and relatively
unpracticed nature of the behaviors in question. Many agriculture and agroforestry volunteers in
Senegal remain skeptical of its use and application to their work in the field, and resist accepting
its usefulness as an effective tool. Although many agriculture and agroforestry volunteers
concede that behavior change theory can be useful in some areas, they insist that the DBCF is not
an acceptable tool for their work. Based on these concerns and the continued efforts of Peace
Corps Senegal and other NGOs working in natural resource management to apply the DBCF to
agriculture based problems, more information on the use and effectiveness of the framework for
natural resource management is needed.

43
In this case study I explore the use of the DBCF as a behavior change tool for Peace
Corps Volunteers in the agriculture program to change community behaviors related to the
adoption of new and improved agricultural related technologies and practices. The DBCF has the
potential to be an important tool for Peace Corps agriculture and agroforestry volunteers and
development workers working in the field to effect lasting changes in their communities.
Specifically, I examined behaviors and practices related to the adoption of earthworks (water
harvesting and erosion control) techniques in the Casamance region of southern Senegal.

44
5. METHODOLOGY
In January 2014, in an effort to address its need for better project design tools, Peace
Corps Senegal hosted a 2-week long Behavior Change Summit to introduce the DBCF. After
attending the summit with my counterpart, Oumar Diamanka, we returned to our village, Saaré
Sara, ready to implement a new behavior change strategy and test the use of DBCF on an
agriculture related project. Having witnessed the heavy flooding during the previous farming
season, Oumar believed the most needed intervention was water harvesting and erosion control
for farmers with fields located on erosion prone land.
I began preliminary research by visiting surrounding villages and talking with community
members about their experiences with flooding, erosion, and various earthworks techniques that
had been previously used to address erosion problems. I also discussed the issue with nearby
Peace Corps Volunteers. Many farmers in nearby villages reported having problems with erosion
and flooding during the rainy season. One village had an erosion channel so deep that it
collapsed a nearby well and threatened the sustainability of the entire village. By implementing a
series of contour berms and check-dams this village was able to successfully offset the effects of
the erosion channel. Other villages used berms and swales to slow, spread, and sink water. After
discussing erosion with farmers in several villages it became evident that berming was the
technique most used by farmers in the area to prevent erosion.
Due to the structure of the DBCF, Barrier Analysis is limited to evaluating one practice
or technique at a time. Because each technology within the earthworks category is considered a
separate and unique behavior (berms, dams, and terraces), I had to narrow the focus of my study.
After discussions with behavior change consultant Bonnie Kittle (Behavior Change Strategy
Design Consultant, Winchester, Virginia) and Barrier Analysis creator Tom Davis (MPH, Dir.

45
Health Programs, Food for the Hungry), I chose berm systems used to control erosion as my
practiced behavior. This would give me results reflecting the general determinants of earthworks
technologies, since all of the desired technologies build on the berm foundation, without
overstepping the one practice limitation of the Barrier Analysis. Additionally, after working with
several translators, I found that it was difficult to find local vocabulary that reflected the subtle
differences between each type of technology, which further supported my decision to use a
general description of the technology. To help overcome the language limitation, pictures of
berms were used during the interview process to help ensure participant understanding.
Saaré Sara
During my initial Peace Corps assignment, I lived in the village of Saaré Sara within the
Kolda region (Figure 5.1). Saaré Sara is a community of about 500 people spread over 45-50
compounds. This number fluctuates throughout the year as students, seasonal workers, and
visitors come and go. The community is located 20 km east of the Kolda regional capital, in the
rural community of Bagadadji along the Route National Highway. Between Saaré Sara and
Kolda is the Foret de Mahone, a protected area with few villages. Most people in the area rely on
subsistence farming for a living. There are a few entrepreneurs in the village who have opened
breakfast stands and small convenience stores, although most of those individuals still do some
kind of agriculture during the rainy season. Common field crops grown in this area include rice,
peanuts, millet, corn and sorghum. Many women are involved in small-scale vegetable
gardening. There is also a fair amount of fruit trees, predominantly mango and cashew trees,
along with orange, lemon, grapefruit, and papaya trees.

46
Shortly after I arrived, I began working with women in the seasonal gardens as well as
farmers who worked larger open fields. During most of the cool season (December-May)
gardening took place in a seasonal river, on top of exposed land. Women frequently waded
across low areas of standing water to access their plots and watered their gardens directly from
the river. Most fields in the community showed some sign of erosion. Many had small erosion
channels through the land and others had low depressions where water frequently pooled. In May
of 2014, a heavy early season rain flooded the women's’ garden, resulting in the complete loss of
the harvest. Subsequent heavy showers in June washed away seeds and vital topsoil, and
exacerbated existing erosion channels in fields.
Surrounding Sites
Several surrounding villages (Figure 5.1) were targeted for surveys and subsequent
activities and Peace Corps Volunteers in those areas were trained in the DBCF and on how to
conduct Barrier Analysis surveys. During my initial research I talked with several volunteers in
nearby villages that faced similar erosion problems. I selected these additional sites to test the
usefulness and applicability of the DBCF process, and monitored them for the duration of my
service to evaluate the longer-term results of the use of berms to prevent erosion. The villages,
all similar in size and demographics, are described below.

47
Figure 5.1: Map depicting research sites. Left to right: Saaré Goundo Yaro, Saaré Sara, Sinthian Siring, Fodé Bayo (Google maps, adapted by author)
Fodé Bayo
Fodé Bayo is a Mandinka village of approximately 200 people in the Rural Community
of Diallambere in the Kolda Region. Women practice community gardening and men farm in
large open fields. Heavy rains often wash away vital topsoil and fertilizer and many farmers do
not practice any form of contour planting despite having been trained in previous years.

48
Sinthian Siring and Sinthian Mamadou Giro
Sinthian Siring and Sinthian Mamadou Giro are two small adjacent villages, less than
1km apart, of approximately 200 individuals each in the Rural Community of Diallambere in the
Kolda Region. In 2010 the Sinthian Siring community faced major erosion issues that impacted
soil fertility, village paths, the community well, and overall village viability. In 2012, a local
Peace Corps Volunteer assisted the village in implementing several earthwork technologies in a
small portion of the village. In 2013 the village decided to adapt and multiply the local check
dam technology that had proven to be successful in preventing erosion during the 2012 rainy
season. This construction consisted of placing a log perpendicular to an erosion channel and
reinforcing the structure with soil, rocks, termite mounds, and bamboo stakes. A total of 70 dams
were built throughout the village (Figure 5.2).
Figure 5.2: Community members in Sinthian Siring construct log berms in 2013 to combat village erosion (Photo credit: Peace Corps Senegal).

49
Saaré Goundo Yaro
Saaré Goundo Yaro is a small Pulaar village of approximately 300 individuals in the rural
community of Saaré Bidjii. The village sits 7 km northwest of the Kolda regional capital. Many
women participate in community gardening. In the late 1990s a local NGO established a large
community garden; however, by 2013, the garden was falling into disrepair and showing signs of
erosion. In 2014, a Peace Corps Volunteer placed in the village worked with community leaders
to restore the garden and plant several trees in hopes that they would help stabilize soil and
reduce ongoing erosion issue.
Data Collection
I began my preliminary research in late January 2014 with the intention of collecting
survey responses in February and coding and analyzing responses by early March. This allowed
time to design and implement activities based on the results of the surveys in April and May.
April and May were chosen as the target dates for building earthworks projects because they are
the last months before the heavy rains arrive. The heavy rains make the soil water-logged and
difficult to work with and once the rains arrive it is too late for many erosion interventions to be
effective. After implementing activities based on the results for the Barrier Analysis, follow-up
visits were scheduled throughout the rainy season to monitor adoption or the techniques.
The bulk of my data collection involved conducting 90 Barrier Analysis surveys within
the Kolda region. Based on the recommendations of the DBCF, a team was assembled to
implement the surveys to minimize interviewer fatigue and enhance the recall of each survey by
the individual enumerator. The DBCF methodology discourages individuals from conducting
Barrier Analysis surveys alone, as the tool is designed as a rapid assessment tool for

50
organizations to quickly gather data on targeted behavior, with a recommended group size of 15-
20 data collectors.
Before conducting the surveys, I applied for and received a category two exemption from
the University of Washington Human Subjects Division to conduct this study (Exemption
#49079). In accordance with this exemption, individual names and the precise locations of each
interview participant were kept confidential during and after the interview process. Following the
completion of the interviews, all identifying information was destroyed to ensure participant
anonymity.
Peace Corps Volunteers in their second year of service were trained on survey protocol
and each person conducted no more than 10 surveys within their village. Only volunteers whose
villages fit within the priority group description and which were subject to soil erosion were
included as survey sites. Volunteers were encouraged to work with and train community
counterparts to assist in data collection, as per the guidelines outlined in the DBCF.
A Barrier Analysis is similar to a case-control study, so it was not necessary to have as
rigorous a sampling method or to use population-based sampling. However, for results to be
representative of most of the people in the area, the Barrier Analysis curriculum recommends
drawing respondents from different communities, as long as all participants fit the priority group
description.
Criterion sampling was used to qualify interview participants; each participant was
required to be 18 years of age or older, each must manage erosion prone farmland within the
study areas, and each had to give informed consent to participate in the interviews. Interviews
were semi-structured, included open and closed ended questions, and lasted between 15-25
minutes in length. The interviews included 3 screening questions to qualify individuals for the

51
survey as well as categorize each participant as either a doer or non-doer of the target behavior.
Doers and non-doers each received slightly different versions of the survey (see Appendix 1 for
the complete interview guide).
Interpreters assisted in translating some of the interviews during the interview process
and were all native speakers of the languages used in the study areas. Prior to working with the
interpreters, the volunteers and I reviewed each question within the interview guide to clarify
what was being asked and to ensure that the interpreter understood the questions. We deviated
from the interview guide when we needed explanations to clarify questions or responses during
the interview process. A technology vocabulary sheet in the local language was also developed
and included with the surveys to assist volunteers with specific technical language.
Project building activities based on the results of the Barrier Analysis took place at
nearby villages that had experienced erosion problems. Villages were selected based on their
erosion control needs and their stated interest in participating in a barrier control training. Two
follow-up visits to assess villager’s adoption of the barrier control techniques were scheduled
throughout the rainy season. Visits included informal interviews and participant observations.
The analysis and results of the evaluation of the DBCF and Barrier Analysis tool were also
informed by extensive participant-observations made throughout my service as a Peace Corps
Volunteer and as a resident living within the study areas.
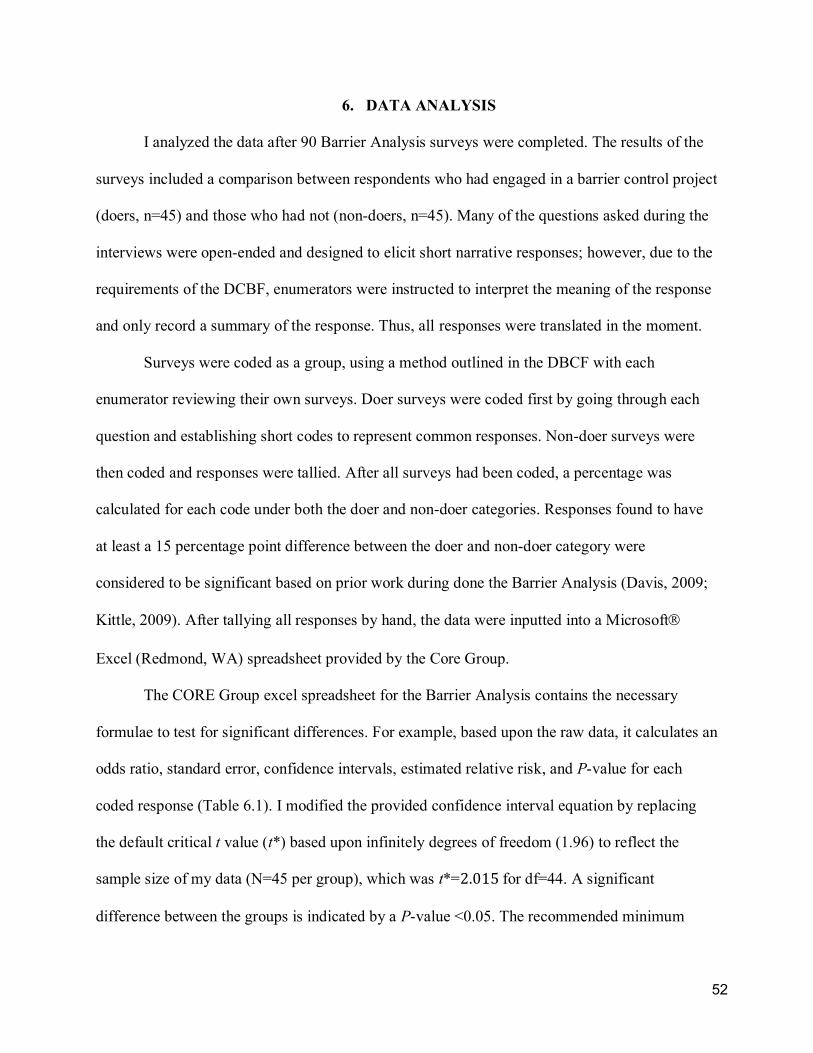
52
6. DATA ANALYSIS
I analyzed the data after 90 Barrier Analysis surveys were completed. The results of the
surveys included a comparison between respondents who had engaged in a barrier control project
(doers, n=45) and those who had not (non-doers, n=45). Many of the questions asked during the
interviews were open-ended and designed to elicit short narrative responses; however, due to the
requirements of the DCBF, enumerators were instructed to interpret the meaning of the response
and only record a summary of the response. Thus, all responses were translated in the moment.
Surveys were coded as a group, using a method outlined in the DBCF with each
enumerator reviewing their own surveys. Doer surveys were coded first by going through each
question and establishing short codes to represent common responses. Non-doer surveys were
then coded and responses were tallied. After all surveys had been coded, a percentage was
calculated for each code under both the doer and non-doer categories. Responses found to have
at least a 15 percentage point difference between the doer and non-doer category were
considered to be significant based on prior work during done the Barrier Analysis (Davis, 2009;
Kittle, 2009). After tallying all responses by hand, the data were inputted into a Microsoft�
Excel (Redmond, WA) spreadsheet provided by the Core Group.
The CORE Group excel spreadsheet for the Barrier Analysis contains the necessary
formulae to test for significant differences. For example, based upon the raw data, it calculates an
odds ratio, standard error, confidence intervals, estimated relative risk, and P-value for each
coded response (Table 6.1). I modified the provided confidence interval equation by replacing
the default critical t value (t*) based upon infinitely degrees of freedom (1.96) to reflect the
sample size of my data (N=45 per group), which was t*=2.015 for df=44. A significant
difference between the groups is indicated by a P-value <0.05. The recommended minimum

53
sample size of 45 doers and 45 non-doers (i.e., a 90-person survey) is based on the results from
using a sample size calculator in case-control type studies with a P-value of 0.25, a relative risk
of 3.0, an alpha error rate of 5% and a power of 0.8. A power of 0.8 is based on an assumption of
a standardized distribution and variance developed by Tom Davis using studies examining
community health and nutrition behaviors across several continents.
Table 6.1: Equations used by the Barrier Analysis Microsoft� Excel Spreadsheet1
Odds Ratio (𝐷𝑒×𝑁𝑛)(𝐷𝑛×𝑁𝑒)
Standard Error √1𝐷𝑒
+1𝑁𝑒
+1𝐷𝑛
+1𝑁𝑛
Confidence Intervals 𝑒ln(𝑂𝑅)±(1.96)(𝑆𝐸)
Estimated Relative Risk
(𝐸 ⋅ 𝐷𝑒45 )( 1
𝐸 ⋅ 𝐷𝑒45 + (1 − 𝐸)𝑁𝑒45
)
(𝐸 ⋅ 𝐷𝑛45 )( 1
𝐸 ⋅ 𝐷𝑛45 + (1 − 𝐸)𝑁𝑛45
)
P-value ( 𝑛𝐶𝑥)( 𝑁−𝑘𝐶𝑛−𝑥)
𝑁𝐶𝑛
1De = Number of doers who gave response (e.g.: number of doers who noted that a lack
of tools made constructing earthworks difficult) ; Dn = Number of doers who did not give

54
response (e.g.: number doers who did not mention a lack of tools during the same question); Ne =
Number of non-doers who gave response (e.g.: number of non-doers who noted that a lack of
tools made construction difficult); Nn = Number of non-doers who did not give response (e.g.:
number of non-doers who did not note that a lack of tools made construction difficult during the
same question); E = estimated prevalence of the behavior (Barrier Analysis Guide suggests using
10% if unknown); k = total success in sample (ex. Total Doers and Non-doers who answered,
“Yes”); x = successes in sample (ex. Doers who said, “Yes” or Non-doers who said, “Yes”); N =
total sample size = 90; n = group sample size (doers or non-doers)= 45.
The estimated relative risk provides a measure for determining how likely one group is
compared to the other to provide a given response and represents the likelihood that one group
will give a particular response relative to the other group. When the doers are the more likely
group to provide an answer, the estimated relative risk value can be read directly from the table.
When the non-doers are the more likely group, the estimated relative risk shown in the table is
less than one and must be transformed using the reciprocal function (1/#) to give the likelihood
estimate. Estimated relative risk is used instead of odds ratio to provide this likelihood in order to
take into account the prevalence of the behavior, which is estimated at 10%. This will give more
conservative estimates of association (Davis, 2013).

55
7. RESULTS & DISCUSSION
The completed DBCF and details of statistical analysis are presented in Appendices 2 and
3, respectively. Results from the Barrier Analysis indicate that perceived self-efficacy, cues for
actions, perceived susceptibility and perceived action efficacy all influence the adoption of
earthworks technologies (berm construction) for farmers farming on erosion prone land in the
Kolda Region study area. The results of the Barrier Analysis are presented in Table 7.1, which
highlights the statistically significant findings.
There are a number of responses with no significant difference between doers and non-
doers. For example, most determinants were perceived to present no barrier to adoption of
earthworks technologies. Also, most farmers do not suggest any potential negative consequences
of the technique, and both doers and non-doers agree on many of the positive benefits to
constructing berms on their land, including an increase in crop yields and a decreases in the loss
of inputs such as fertilizer. Furthermore, the respondents do not implicate social norms, cultural
norms, policies, or divine will as representing problems for using earthworks technologies.
Additionally, these results indicate that farmers are almost unanimously aware of the problem of
erosion as well its severity.

56
Table 7.1: Results of Barrier Analysis. Statistically significant results are bolded.
Determinants/Codes Doers Non-doers Estimated Relative Risk P-value Likelihood
Self-Efficacy: Do you have the knowledge, skills, or abilities to construct berms in your field?
Yes 42 27 8.11 0.000 Doers are 8.1 times more likely to believe they have the knowledge skills and abilities to construct berms
Possibly 1 3 0.34 0.308
No 3 15 0.16 0.001 Non-doers are 6.2 times more likely to believe they lack the knowledge skills and abilities to construct berms
Self - Efficacy: What makes it easier to construct berms?
Having access to tools 35 37 0.780 0.396
Having Access to natural resources 10 6 1.723 0.204
Knowledge of how to construct berms 2 9 0.206 0.025 Non-doers are 4.9 times more likely to
give this response Self - Efficacy: Makes it Difficult:
Not having access to tools 27 29 0.844 0.414
Construction is a lot of work 13 10 1.369 0.315
Lack of skills and knowledge 1 11 0.080 0.002 Non-doers are 12.6 times more likely to give this response
Susceptibility- How likely is it that you will get erosion channels in your field?
Very likely 20 32 0.369 0.009 Non-doers are2.7 times more likely to give this response
Somewhat likely 13 10 1.369 0.315
Not likely at all 12 3 3.832 0.011 Doers are 3.8 times more likely to give this response
Action Efficacy - How likely is it that if you construct berms, your will still have erosion problems?
Very likely 4 9 0.419 0.115
Somewhat likely 8 13 0.562 0.159
Not likely at all 33 23 2.406 0.025 Doers are 2.4 times more likely to give this response
Cues for Action (How difficult is it to remember how to construct berms)
Very difficult 14 8 1.911 0.110
Somewhat difficult 11 6 1.916 0.141
Not difficult at all 20 31 0.404 0.016 Non-doers are 2.5 times more likely to give this response
57
Perceived Self Efficacy
The results from the Barrier Analysis suggest that non-doers were 6.2 times more likely
than doers to believe they lacked the knowledge, skills, or ability to construct berms (P <0.001).
Doers were 8.1 times more likely than non-doers to believe they possessed the knowledge, skills
and abilities to construct berms. Additionally, non-doers were 12.9 times more likely than doers
(P <0.002) to report that a lack of knowledge skills and abilities to construct berms was the
primary difficulty in berm construction.
Both doers and non-doers reported that having access to tools made berm construction
easier, and conversely lack of tools made construction more difficult; however, the lack of tools
did not prove to be a significant determinant since both doers and non-doers identified it
similarly. This presumes that although it is a challenge, doers are easily able to overcome the
obstacle, eliminating it as a significant determinant.
These results suggest that perceived self-efficacy is a considerable barrier for the
construction and adoption of earthworks technologies. Many non-doer farmers interviewed
agreed that although they were familiar with berms and had seen them in other farmer’s fields,
they did not know how to construct the berms themselves. Although berm construction might be
seen as a relatively easy task, the idea that farmers thought they lacked the skills to construct a
berm might be explained by the common thought in Senegal that there are generally two ways to
construct something, a fast and easy way, and a correct and difficult way; the latter being
generally costly and provided by a development organization. Additionally, although earthworks
technologies are not new in Senegal, many farmers in the Casamance region are new to farming
and unfamiliar with sustainable farming practices (Tappan et al., 2004). This may have
contributed to farmers perceiving that they lacked the knowledge, skills, and abilities to construct

58
earthworks berms the “correct” way. To overcome this determinant, efforts should be made to
increase the knowledge, skills and ability of non-doers to construct berms. In order to develop an
appropriate activity for this determinant, the following bridge to activity was formulated:
Bridge to Activity: Increase the capacity of farmers to construct berms.
To increase the capacity of farmers to construct berms I designed an activity focused on
training farmers on earthworks technologies. The training taught farmers how to identify
susceptible areas on the land, how to find the contour of their land, how to evaluate erosion
problems and generate a project plan, and how to construct each of the four types of earthworks
mentioned above. The training series spent two days in each village for a total of 8 days. At each
village, community members with erosion prone land were invited to participate in a two-day
long training at which hands-on training was provided to create earthworks demonstrations in
critical parts of the village. Two community leaders from each village were invited to attend the
entire training with the intention of training these individuals to later teach earthworks
techniques. Community leaders were responsible for leading the trainings at the last village.
Cues for Action
Non-doers were 2.5 times more likely than doers to report that remembering how to
construct berms is not difficult. However, since non-doers also report that they lack the
knowledge, skills and abilities to construct berms, this result is considered to be only an
assumption of the non-doer priority group, and not a significant determinant of behavior. This
determinant was classified as non-actionable.

59
Perceived Susceptibility
This determinant focuses primary on the perceptions of the problem of erosion. Non-
doers were 2.7 times more likely than doers to believe that is was very likely for them to
experience erosion in the next year and doers were 3.8 times more likely than non-doers to
believe that they were not susceptible to erosion damage for the following year. This can be
attributed to the idea that since doers are constructing berms, they do not feel at risk of severe
erosion damage. Many farmers who constructed berms agreed that they know they will not have
further erosion problems because they have berms in their fields and have seen them work
effectively. Although this is indicated as a motivator for constructing berms, little practical
knowledge is gained through this determinant since non-doers already perceive themselves as
susceptible to erosion. One farmers reported, “Yes, these (erosion) channels are a very big
problem, you can see one even in my home, right over there.” This indicates that a lack of
perceived risk regarding erosion is not a barrier to berm adoption, but that a high perception of
risk may work as a motivator to berm adoption. The key to this determinant is to help non-doers
believe that they will no longer be as susceptible to erosion if they use earthworks techniques on
their land.
Bridge to activity: Increase the perceptions that farmers using earthworks techniques are
less susceptible to losing land due to erosion.

60
Perceived Action Efficacy
Doers were 2.4 times more likely than non-doers to report that they were not as likely to
lose farmland to erosion if they constructed berms. This means that doers were more likely to
believe that berms were a good solution to the problem of erosion and believed the berms would
protect them from losing land due to erosion in the future. This can be attributed to the idea that
doers are well aware of the effectiveness of berm construction because they currently use them in
their fields. Many doers said that they know berms work because they have used them in their
fields and have seen the results. Non-doers showed no significant results indicating that they
perceived berms to be an effective or ineffective means of preventing erosion, this may be due to
an overall lack of knowledge of berms, or just a general indifference to the effectiveness of
berms. Although this is indicated as a motivator of constructing berms, little practical knowledge
is gained through this determinant since non-doers did not indicate they perceived berms as
ineffective for mitigating erosion, however non-doers would benefit from an increased
perception that constructing berms is an effective way to prevent erosion in the future since doers
are clearly motivated by this belief.
Bridge to activity: Increase the perception that constructing berms is an effective way to
prevent erosion.
Activities
After developing a bridge to activity for all of the identified significant determinants, a
series of activities were designed to increase the capacity of farmers to construct berms, increase
their perceived severity of erosion, and reinforce the perceived efficacy of berms as a tool for

61
erosion control. In a team of four volunteers, we organized an 8-day training tour of the Kolda
region. We visited four villages with varying degrees of erosion damage. In each village we
worked with community members to assess the land and trained individuals on how to perform
earthworks construction. We constructed several earthworks demonstration projects in prominent
sites around the village and community members took turns leading the group (Figure 7.1).
These projects not only served as hands-on teaching tools, but also provided a long term visual
demonstration of the effectiveness of earthworks technologies in reducing or eliminating erosion.
Additionally, as part of the training, community members were shown existing successful
earthworks projects in nearby villages and listened to testimonies from farmers who had used the
earthworks technologies successfully. Small scale demonstrations were also created to show the
effects of topsoil loss on sloped land, especially when plowed against the contour. Farmers
responded positively to a demonstration in which two large halved barrels filled with soil were
used to represent farmers’ fields. Each barrel was propped on several bricks on one side to
illustrate a considerable slope and grooves in the soil were made to illustrate plow lines. One
barrel used lines flowing in the direction of the slope (up and down), and the other barrel used
lines indicating plowing along the slope (side-to-side). Notches were cut-out of the down-slope
side of each barrel and a jar was placed at the opening. Participants then used a watering can on
each barrel to represent rain. Participants could easily watch the water begin to pool and run
down the slope, collecting in the jars at the bottom. As each barrel became saturated with water,
participants could easily see how freely the water ran off the demonstration with the plow lines
that followed the slope. At the end of the demonstration participants were asked to identify
which field lost the most water and all participants could easily see that the plow lines going
down the slope had collected the most water. Additionally, participants were asked to identify

62
which field lost the most topsoil. Participants were easily able to compare the two jars and see
that the land that had been plowed downslope had lost the most soil. We then asked participants
which was a better way to plant and every participant agreed that it was better to plant along the
contour.
Additionally, two village leaders from each community were selected to attend the entire
training and travel to all four villages with the purpose of becoming earthworks experts. These
village leaders helped facilitate each training and they were expected to lead subsequent trainings
in their own village at the conclusion of the community workshops. Approximately 20 to 50
participants were trained in each village (a full activity description is presented in Appendix 4,
and session plans are presented in Appendix 5).
Figure 7.1: Training participants learning how to find the contour of the land by using a locally made A-frame.

63
Activity Follow-up
Observations from two follow-up visits conducted in July and September of 2015
revealed that of the four villages trained in the barrier technologies, only one village had fully
adopted the technology and applied it in other areas of the village. This village was Sinthian
Mamadou Giring. Community members had constructed a series over 60 check dams since the
initial training. Community members from Saaré Sara had zero adoption, although community
leaders indicated that they were hoping to implement the techniques in the following years.
Community members from Saaré Goundo Yaro and Fodé Bayo also had not adopted the barrier
technology and they also indicated that they hoped to implement the technologies in the near
future. Subsequent follow-ups in May 2016 revealed that these three villages still had not
constructed any new earthworks projects and the previous earthworks completed during the
training events had not been maintained and were no longer visible, although there was some
evidence of their effectiveness. This suggests that there may be unresolved determinants that
were not uncovered during the Barrier Analysis or that the training events did not satisfactorily
satisfy the identified determinants. Additional follow-up interviews of activity participants may
shine light on reasons for low adoption.
Other Factors Influencing the Adoption & Practice of Earthworks Technologies
Although all individuals interviewed fit within the specified priority group, and the
villages selected shared common erosion problems and demographics it became clear during
training and subsequent follow-up visits that the villages had vastly different social systems and
unique challenges. The village of Sinthian Mamadou Giring exhibited a collaborative work style
and had a strong-willed and community-minded chief. Additionally, this village was closest to
64
Sinthian Siring (1 km), which had the clearest example of severe erosion as well as the best
demonstration of effective earthworks construction. This village witnessed their widening
erosion problem on a daily basis and were intensely aware of the severity of the problem, having
witnessed Sinthian Siring’s devastation for years. Additionally, this village had on-going proof
of the effectiveness of Sinthian Siring’s berms and likely witnessed the transformation first hand
over a period of two years.
Conversely, the village of Saaré Sara exhibited a much more individualistic work style
and had a non-involved village chief. Community members did not often work together to
complete large projects, and large field and garden projects were generally completed by
members of the same household and close neighbors. This was also very similar to the situation
in Saaré Goundo Yaro. Community members of Fodé Bayo often did work together to complete
large tasks, and confirmed that they would like to complete more berms one day; however; many
community members failed to see their erosion problems as needing immediate action and did
not see an urgent necessity to complete the berms anytime soon, despite results indicating that
non-doers were very aware of their erosion risk.

65
8. CONCLUSIONS & RECOMMENDATIONS
In this paper I used data collected from a Barrier Analysis to describe barriers and
motivators of constructing erosion control berms, and to test the implications of a behavior
change model modified for use in natural resource management. My primary conclusions are as
follows. First, perceived self-efficacy (lack of skills, knowledge, and abilities) to construct berms
is a significant barrier to the adoption of earthworks technologies. Efforts to increase water
harvesting and erosion control technologies should work to increase knowledge and practices of
berm construction by conducting trainings for trainers within the community.
Second, Barrier Analysis can be a useful and informative tool for Peace Corps Volunteers
and development workers working in natural resource management; however, many workers in
this field will already expect self-efficacy to be a significant determinant in any new technology.
Thus, the results from my assessment underscore the importance of self-efficacy in natural
resource based problems. I recommend that Barrier Analysis survey be used as a tool to evaluate
reasons for low-adoption rates only after the completion of an initial training event addressing
self-efficacy barriers.
Third, individual village dynamics and social norms may play a larger role in the
adoption of practices than what the results from the DBCF and Barrier Analysis would otherwise
indicate. For this reason, it is recommended that workers wishing to use Barrier Analysis surveys
to examine technology adoption, 1) conduct Barrier Analysis within single villages to reduce the
effect of social and demographic factors on results and 2) identify leaders within the community
that have considerable influence over other community members to be involved in training
efforts.

66
Increasing Knowledge, Skills and Ability of Earthworks Technologies
Although results were gathered by interviewing farmers in different villages across the
Kolda region, observations and informal conversations can support the notion that a lack of
skills, knowledge and abilities to implement earthworks technologies is a significant
determinant. Additionally, since most agriculture Peace Corps Volunteers work to extend new
technologies, it can be assumed that a lack of skills and knowledge on the part of local villagers
will be a determinant in most agriculture based projects. Indeed, in Sinthian Mamadou Giro, it
can be assumed that the lack of skills was the dominant factor that prevented community
members from managing their erosion problems. A Barrier Analysis of this village alone may
have suggested that the only determinant to action was perceived self-efficacy, since villagers
were clearly aware of the severity of erosion, the susceptibility of their landscapes to erosion,
and the effectiveness of creating berms to mitigate erosion due to their proximity to Sinthian
Siring, which had successfully implemented berms. Once community members were trained,
they no longer lacked the knowledge, skills, and abilities to implement berms and set out to
construct berms across the village.
Individuals whose farms suffer from erosion may be unaware of earthworks technologies,
especially if none exist in their village. In these cases, extension workers should increase
villager’s exposure to earthworks technologies and continue to provide trainings while
encouraging pilot farmers to install demonstration barriers on their farms. In doing so,
earthworks technologies can be more widely known and understood.

67
Barrier Analysis as a tool for Peace Corps Volunteers
The DBCF has the potential to be an important tool for Peace Corps Volunteers and
development workers in natural resource management efforts to make lasting changes in their
communities. However, to be used effectively, it is important that implementers fully understand
not only the problem they are attempting to solve, but also viable and site appropriate solutions
to the problem. This speaks to the importance of conducting preliminary research to understand
the priority group before conducting a Barrier Analysis. Additionally, although a Barrier
Analysis can be a useful tool for understanding barriers and motivators of change, Peace Corps
Volunteers should understand the amount of time and energy it takes to perform such an in-depth
study and should first explore other options for understanding the specific needs and challenges
of their community. Since Peace Corps agriculture volunteers are generally introducing new
technologies and practices with relatively few doers, it can be assumed that lack of self-efficacy
will be a determinant to performing the behavior. Therefore, a more appropriate application of
this model would be to use it as a follow-up tool if low-adoption rates exist after an initial
training event.
Barrier Analysis may not be an appropriate tool for all volunteers in highly rural sites.
Volunteers working in small or remote sites may find it difficult to implement the DBCF since
village populations may be too small to find 45-doers within the priority group. The
recommended group size for conducting such a project is suggested at 15-20 interviewers (Kittle,
2013). This makes the DBCF ideal for groups of volunteers working within the same region who
are interested in the same problem. However, even villages within close proximity of each other
can have vastly different environments and unique challenges unknown to volunteers, making
defining the priority group a difficult task.

68
Additionally, some villages operate individualistically while others are highly organized
by village chiefs who dictate work and village projects. Although two villages with similar
demographics may share the same problem, a village with a highly organized chief and group
work ethic is likely to have a very different outcome than a village in which individuals seldom
come together for the common goal. This kind of information is not addressed in the Barrier
Analysis standard survey, even though a social norms question does try to address such factors.
For this reason, in can be incredibly difficult for groups of volunteers to conduct a Barrier
Analysis on a targeted priority group, since conditions within each village tend to be highly
diverse.
Conversely, a volunteer targeting a highly specific priority group within a single village
may have a hard time finding the recommended sample size of 45 doers and 45 non-doers,
especially those working in small, remote villages. This would require volunteers to either work
outside of their own village or dilute the desired behavior to include more individuals as doers.
Both of these solutions would require the volunteer to extrapolate results from the Barrier
Analysis surveys, which potentially decreases the accuracy of the true determinants of the
desired behavior.
While the Barrier Analysis data did uncover new information about the priority group, I
would still recommend the review of the survey itself when used in problems based in natural
resource management to better capture the main constructs of the researcher. Additionally, while
many behaviors in public health and nutrition focus on the individual, it is possible that
behaviors in natural resource management, especially in rural villages, focus on group behaviors.
A further investigation about the normative beliefs, the influencing groups, and motivation to
comply with group work behavior in many agricultural practices may improve our understanding

69
of the subjective norms of natural resource management. As this Barrier Analysis approach
focuses on intra and interpersonal levels (priority group and influencing group), theories and
models emphasizing community levels are necessary to develop and implement a more
comprehensive program addressing behavior change in natural resource management. If natural
resource management behaviors are found to be dependent on societal norms and group
behavior, then Barrier Analysis will prove to have limited practical value for the behaviors
studied. Existing health models of behavior change agree with the premise that group behavior
change needs different and multi-faceted interventions (Janz, 2002). When the behavior of large
groups is the target, interventions at societal levels (social networks, work organizations, public
policy) along with interventions at the individual level will likely prove more effective than
single-level interventions (Janz, 2002).
Lastly, the Barrier Analysis methodology recommends a sample size of 45 doers and 45
non-doers to generate the best results (Kittle, 2013). This is based on the results of using a
sample size calculator for case-control type studies with a P-value of 0.05, a relative risk of 3.0,
and alpha of 0.05, and a power of 0.8. The Barrier Analysis framework also assumes a similar
distribution and equal variance among the sampled populations. Additional studies using larger
sample sizes are needed to test this assumption for problems based in natural resource
management given that the underlying assumptions of similar distributions and equal variance
have not been investigated when the Barrier Analysis framework is applied to natural resource
management. This may also vary for groups in rural versus urban settings. Based on the current
recommended sample size of 45 doers and 45 non-doers, Barrier Analysis may be more
appropriate for Peace Corps Volunteers living in more urban settings that have a sufficient
population size from which to sample.

70
Additional Determinants
With the exception of Sinthian Mamadou Giro, all villages failed to implement
earthworks technologies before the next rainy season. The exact reasons for why three of the
villages failed to adopt the behavior are unclear, however, it can be assumed that these villages
may have had additional determinants that were uncovered or diluted in the Barrier Analysis
data. This may suggest a need to conduct Barrier Analysis surveys within a single village, since
conditions across villages may be too subtle for outsiders to detect. Additionally, the comparison
between Sinthian Mamadou Giro and other villages may reveal the importance of deeply
ingrained social norms and community behaviors in the adoption of behavior. This community
mentality may be so deeply ingrained that participants are unconsciously aware of the behavior
and therefore unable to discuss it under the social norms question in the Barrier Analysis. Lastly,
Mamadou Giro was in close proximity to existing earthworks demonstrations from previous
years, which may have increased the village’s motivation to construct berms, since they were
able to see the efficacy of berms over a period of a couple years. This may highlight the
importance of time needed to consider the adoption of the behavior.
Recommendations and Future Research Opportunities
To increase knowledge of the effectiveness of applying the DBCF to natural resource
problems or to the adoption of earthworks technologies, extension agents should focus their
research efforts on the following two areas: 1) Barrier Analysis studies focused within a single
village. More research is needed to test the effectiveness of the DBCF when conducted within a
single village. Although Barrier Analysis results are meant to be used to draw broad conclusions
across a priority group in a region, Peace Corps Volunteers and workers in natural resource

71
management may find results more meaningful when the analysis is conducted at the village
level. DBCF is also more appropriate for Peace Corps Volunteers who generally only work in 1-
3 sites of close proximity as opposed to development organizations that target entire regions. 2)
The role of village leaders and communal work groups in adopting new behaviors. Although
the DBCF tries to take into account the social norms of doers and non-doers, some village
dynamics may be too subtle for participants to be aware of, thereby making it difficult to include
in the Barrier Analysis. More research should be done to investigate additional ways to assess the
importance of group work ethics in promoting the adoption of new technologies or ideas in
natural resource management as well as alternative methods for quantifying this information in
the Barrier Analysis survey.
Limitations of Research & Researcher Bias
Although all interviewers used translators and were second year volunteers who
possessed a strong command of the local language, it is possible that subtle cultural information
could have been lost or misinterpreted during the interview process. Additionally, English
language versions of the Barrier Analysis survey articulate precise language that distinguishes
among several future and conditional tenses that at times were either difficult or impossible to
translate to the local language. It is possible that these problems resulted in a lack of
understanding by research participants and an inability to grasp the nuances between questions
asked in the Barrier Analysis survey. Interviews were not recorded and coding was done based
on volunteer notes following the completion of all surveys. This required each volunteer to
interpret their field notes and decipher the meaning of each response. Interviewers relied on
statements from participants rather than observations to determine if the subject was a doer or

72
non-doer of the behavior; thus, the process of classifying doers and non-doers is subject to
potential error. Additionally, the presence of Peace Corps Volunteers as foreigners may have
affected the responses from interview participants. There is also a tendency in Senegalese culture
for respondents to answer questions based on what the participants think the researcher/
development workers want to hear. This is often because responses that indicate that there is a
great need for aid are often rewarded with development projects, or responses that indicate
positive behavior are seen more favorably by development workers.

73
Literature Cited
Allen, L. &. (2001). What works? A review of the efficacy and effectiveness of nutrition
interventions. Asian Development Bank, United Nations Administrative Committee on Coordination, Subcommittee on Nutrition with Asian Development Bank, Manila.
Aubel, J., Toure, I., & Diagne, M. (2004). Senegalese grandmothers promote improved maternal and child practices: the guardians of tradition are not averse to change. Social Science and Medicine, 50, 945-959.
Aubréville, A. (1949). Climats, forêts, et désertification de l’Afrique tropical. Société d’Editions Géographiques.
AUSenegal. (2010). Retrieved from www.au-senegal.com Baptista, I., Ferreira, A. D., Tavares, J., Querido, A. L., Reis, A. E., Geissen, V., . . . Varela, A.
(2012, April). Soil and Water conservation strategies and impact on sustainable livelihood in Cape Verde- A case study of Ribeira Seca watershed. Instituto Nacional de Investigacao e desenvolvimento Agrario (p. 6481). Vienna: EGU General Assembly.
Bruce, J. W. (1998). Country profiles of land tenure : Africa, 1996. Senegal. University of Wisconsin-Madison, Land Tenure Center. Land Tenure Center, University of Wisconsin-Madison.
CIA . (2016, October). The World Factbook. Retrieved from Central Intelligence Agency: https://www.cia.gov/library/publications/the-world-factbook/geos/sg.html
Davis, T. (2009, November). FH Tools for PM2A Projects. (U. P. Food for the Hungry, Producer) Retrieved from http://caregroupinfo.org/vids/bavid/player.html
Davis, T. (2012, July 2). Evidence for Barrier Analysis/ Doer-NonDoer Studies. (Caregroups, Producer) Retrieved December 2016, from http://caregroups.info/vids/BAEvid/story.html
Davis, T. (2013). Explanation for Using the Barrier Analysis Excel Calculation Sheet. Retrieved December 2, 2016, from fsnnetwork: http://www.fsnnetwork.org/document/explanation-using-barrier-analysis-excel-calculation-sheet
DiClemente, R., Salazar, L., & Crosby, R. (2013). Health Behavior Theory for Public Health (illustrated ed.). Jones & Bartlett Publishers.
Edame, G. E., Anam, B. E., Fonta, W., & Duru, E. (2011, December). Climate Change, Food Security and Agricultural Productivity in Africa: Issues and policy directions. International Journal of Humanities and Social Science, 1(21), 205-223.
EIO. Economic Intelligence Unit. (2005). Senegal: Country Profile. Retrieved from London: Economic Intelligence Unit: www.eiu.com
FAO. Food and Agriculture Organization of the United Nations. (2015). COUNTRY FACT SHEET ON FOOD AND AGRICULTURE POLICY TRENDS. FAPDA - Food and Agriculture Policy Decision Analysis.
Feed the Future. (2016, March 29). Peace Corps. Retrieved from Feed the Future: http://www.feedthefuture.gov/institutional-sponsor/peace-corps

74
Food Security and Nutrition Network Social and Behavioral Change Task Force. (2013). Designing for Behavior Change For Agriculture, Natural Resource Management, Health, and Nutrition. Washington, DC: Technicaland Operational Performance Support (TOPS) Programs.
Freudenberger, M., & Freudenberger, K. S. (1993). Pastoralism in Peril: Pressures on Grazing Land in Senegal. Drylands Programme. IIED.
Funk, C., Rowland, J., Adoum, A., Eilerts, G., Verdin, J., & White, L. (2012). A Climate Trend Analysis of Senegal. U.S. Geological Survey Fact Sheet 2012-3123.
Glanz, K., & Bishop, D. B. (2010). The Role of Behavioral Science Theory in Development and Implementation of Public Health Interventions. (J. Fielding, R. Brownson, & L. Green, Eds.) Annual Review of Public Health, 31.
Hulme, M., Doherty, R., Ngara, T. N., & Lister, D. (2001). African climate change 1900-2100. Climate Research, 145-168.
Janz, N. K. (2002). The Health Belief Model. (B. R. In K. Glanz, Ed.) Health Behavior and Health Education: Theory, Research, and Practice 3rd Edition, 45-66.
Kittle, B. (2013). A Practical Guide to Conducting a Barrier Analysis. New York: Helen Keller International.
Lawesson, J. (1995). Studies of Woody Flora and Vegetation in Sengal. Opera Botnica, 125, 172.
Monkam, N. (2011). Property Taxation in Senegal: Legislation and Practice. Journal of Property Tax Assessment & Administration, 8(3), 41-60. Retrieved from https://www.shareweb.ch/site/DDLGN/Documents/Property-Taxation-in-Senegal%20Legislation%20and%20Practice_Monkam%20(2011c).pdf
Parton, W., Tappan, G., Ojima, D., & Tschakert, P. (2004). Ecological impact of historical and future land-use patterns in Senegal. Journal or Arid Environments, 59, 605–623.
Peace Corps Senegal. (2013, June). Welcome Manual . Retrieved December 2, 2016, from http://files.peacecorps.gov/manuals/welcomebooks/snwb685.pdf
Routledge Communication Series. (2002). Public Health Communication: Evidence for Behavior Change. (R. Hornic, Ed.) Routledge.
SAO. (2016, July 18). Senegal. Retrieved from South African History Online: sahistory.org.za/places/senegal
Sorensen, G., Stoddard, A., Hunt, M. K., Hebert, J., Ockene, J. K., Avrunin, J. S., . . . Hammond., a. S. (1998, November). The effects of a health promotion-health protection intervention on behavior change: the WellWorks Study. American Journal of Public Health, 88(11), 1685-1690.
Tabor, J. A. (1995, May). Improving Crop Yields in the Sahel by mean of water-harvesting. Journal of Arid Environments, 30(1), 83-106.
Tappan, G. D. (1992). Monitoring Rangeland Dynamics in Senegal with Advanced Very High Resolution Radiometer Data. Geocarto International, 1, 87-98.

75
Tappan, G., Sall, M., Wood, E., & Cushing, M. (2004). Ecoregions and Land Cover Trends in Senegal. Journal of Arid Environments, 59(3), 427-462.
Thomas, P. (1994). Participatory development communication: Philosophical premises,. Participatory communication: Working for Change and developement, 49-59.
Tschakerta, P., Khoumab, M., & Sènec, M. (2004). Biophysical potential for soil carbon sequestration in agricultural systems of the Old Peanut Basin of Senegal. Journal of Arid Environments, 59(3), 511-533.
Tucker, C., & Nicholson, S. (1999). Variations in the Size of the Sahara Desert from 1980 to 1997. Ambio, 28(7), 587-591.
USAID. (2006). USAID/Senegal Strategy Statement 2005. Retrieved from United States Agency for International Development: Annex 2. http://www. encapafrica.org/documents/biofor/Senegal_strategy05%20Annex%202.doc
USAID. (2010). Property Rights and Resource Governance: Senegal. United States Agency for International Development, USAID Land Tenure. USAID.
USAID. (2016). U.S Government Global Food Security Strategy. (U. Government, Producer) Retrieved from https://www.usaid.gov/sites/default/files/documents/1867/USG-Global-Food-Security-Strategy-2016.pdf
USGS. (2000). Monitoring Drought and Land Degradation in Senegal's Ecoregions. Retrieved December 2, 2016, from USGS.gov: http://lca.usgs.gov/lca/biodiversity_senegal/docs/chap7-drought-update%20V2%202-04-10.pdf
Waisbord, S. (2001). Family tree of theories, methodologies and strategies in development communication: Convergence and differences. New York: Rockfeller Foundation.
World Bank. (2006). Republic of Senegal: Joint IDA-IMF Staff Advisory Note of the Second Poverty Reduction Strategy Paper.

76
Appendix
Appendix 1: Barrier Analysis Survey
Group: ❑ Doer ❑ Non-Doer
Barrier Analysis Questionnaire: Berms for use with farmers at risk of losing land to erosion
Behavior Statement
Targeted farmers with erosion and/or water control issues construct
berms on the at-risk areas of their land. Demographic Data Interviewer’s Name: __________________Questionnaire No.: _____Date: ___/___/___ Community: _____________ Scripted Introduction: Hi, my name is_________; and I am part of a study team looking into erosion control practices. The study includes a discussion of this issue and will take about 15 minutes. I would like to hear your views on this topic. You are not obliged to participate in the study and no services will be withheld if you decide not to. Likewise, if you chose to be interviewed you will not receive any gifts, special services or remuneration. Everything we discuss will be held in strict confidence and will not be shared with anyone else. Would you like to participate in the study? [ If not, thank them for their time.] Section A - Doer/Non-doer Screening Questions
1. Are you a farmer? ❑ A. Yes ❑ B. No → End interview and look for another respondent ❑ C. Don’t Know / Won’t say → End interview and look for another respondent
2. Does any part of your land suffer from erosion or water control issues? ❑ A. Yes ❑ B. No → end interview and look for another respondent ❑ C. Do not know / no response → End interview and look for another respondent
3. Have you done any work in the past year to control the erosion issues on your land?
❑ A. Yes ❑ B. No → Mark as Non-doer and go to Section B ❑ C. Do not know / no response → End interview and look for another respondent

77
4. Please describe to me what you have done to control the erosion or water run off problems on your land.
A. Berm B. Any other than berm. Mark as Non-doer and go to Section B ❑ C. Do not know / no response → End interview and look for another respondent
DOER /NON-DOER CLASSIFICATION TABLE DOER
(all of the following) Non-Doer
(any ONE of the following) Do Not Interview
(any ONE of the following) Question 1 = A Question 1 = B or C Question 2 = A Question 2 = B or C Question 3 = A Question 3 = B Question 3 = C Question 4 = A Question 4 = B Question 4 = C
Group: ❑ Doer ❑ Non-doer
Section B – Research Questions Behavior Explanation (as needed) In the following questions I am going to be talking about contour berms. By this I mean this (show a picture of contour berms) (Perceived Self-efficacy)
1. Doers and Non-doers: With your present knowledge, money, and skills do you think that you could construct berms on the part of the land that suffers from erosion or water run-off? ❑ a. Yes ❑ b. Possibly ❑ c. No ❑ d. Don’t Know
(Perceived Self-efficacy) 2a. Doers: What makes it easier for you to construct berms on the part of the land that suffers from erosion or water run-off? 2b. Non-doers: What would make it easier for you to construct berms on the part of the land that suffers from erosion or water run-off? (Write all responses below. Probe with “What else?”)
(Perceived Self-efficacy)
3a. Doers: What makes it difficult for you to construct berms on the part of the land that suffers from erosion or water run-off? 3b. Non-doers: What would make it difficult for you to construct berms on the part of the land that suffers from erosion or water run-off?

78
(Write all responses below. Probe with “What else?”) (Perceived Positive Consequences)
4a. Doers: What are the advantages of constructing berms on the part of the land that suffers from erosion or water run-off? 4b. Non-doers: What would be the advantages of constructing berms on the part of the land that suffers from erosion or water run-off? (Write all responses below. Probe with “What else?”)
(Perceived Negative Consequences)
5a. Doers: What are the disadvantages of constructing berms on the part of the land that suffers from erosion or water run-off? 5b. Non-doers: What would be the disadvantages of constructing berms on the part of the land that suffers from erosion or water run-off? (Write all responses below. Probe with “What else?”)
(Perceived Social Norms )
6a. Doers: Do most of the people that you know approve of you constructing berms on the part of the land that suffers from erosion or water run-off? 6b. Non-doers: Would most of the people that you know approve of you constructing berms on the part of the land that suffers from erosion or water run-off? ❑ a. Yes ❑ b. Possibly ❑ c. No ❑ d. Don’t Know / Won’t say
(Perceived Social Norms ) 7a. Doers: Who are the people that approve of you constructing berms on the part of the land that suffers from erosion or water run-off? 7b. Non-doers: Who are the people that would approve of you constructing berms on the part of the land that suffers from erosion or water run-off? (Write all responses below. Probe with “Who else?”)
(Perceived Social Norms )
8a. Doers: Who are the people that disapprove of you constructing berms on the part of the land that suffers from erosion or water run-off? 8b. Non-doers: Who are the people that would disapprove of you constructing berms on the part of the land that suffers from erosion or water run-off? (Write all responses below. Probe with “Who else?”)

79
(Perceived Access) 9a. Doers: How difficult is it to get the materials you need to construct berms on the part of the land that suffers from erosion or water run-off? Would you say it’s very difficult, somewhat difficult or not difficult at all? 9b. Non-doers: How difficult would it be to get the materials you need to construct berms on the part of the land that suffers from erosion or water run-off? Would you say it’s very difficult, somewhat difficult or not difficult at all? ❑ a. Very difficult ❑ b. Somewhat difficult ❑ c. Not difficult at all.
(Perceived Cues for Action / Reminders) 10a. Doers: How difficult is it to remember how to construct berms on the part of the land that suffers from erosion or water run-off? Very difficult, somewhat difficult, or not difficult at all? 10b. Non-doers: How difficult do you think it would be to remember how to constructing berms on the part of the land that suffers from erosion or water run-off? Very difficult, somewhat difficult, or not difficult at all? ❑ a. Very difficult ❑ b. Somewhat difficult ❑ c. Not difficult at all. ❑ d. Don’t Know / Won’t say
(Perceived Susceptibility / Perceived Risk)
11. Doers and Non-doers: How likely is it that you will lose farming land due to erosion or water run-off issues in the next year? Would you say it’s very likely, somewhat likely or not likely at all? ❑ a. Very likely ❑ b. Somewhat likely ❑ c. Not likely at all
(Perceived Severity)
12. Doers and Non-doers: How serious would it be if you had less land to farm? Would you say it’s very serious, somewhat serious, or not serious at all? ❑ a. Very serious ❑ b. Somewhat serious ❑ c. Not serious at all ❑ d. Don’t Know / Won’t say

80
(Action Efficacy) 13. Doers and Non-doers How likely is it that you would lose farming land if you constructed berms on the part of the land that suffers from erosion or water run-off? Would you say it’s very likely, somewhat likely or not likely at all? ❑ a. Very likely ❑ b. Somewhat likely ❑ c. Not likely at all
(Perception of Divine Will)2
14. Doers and Non-doers: Do you think that God causes land erosion? ❑ a. Yes ❑ b. Maybe ❑ c. No
(Policy)
15. Doers and Non-doers: Are there any community laws or rules in place that make it more likely that you construct berms on the part of the land that suffers from erosion or water run-off? ❑ a. Yes ❑ b. Maybe ❑ c. No
(Culture) 16. Doers and Non-doers: Are there any cultural rules or taboos against constructing berms on the part of the land that suffers from erosion or water run-off? ❑ a. Yes ❑ b. Maybe ❑ c. No
Now I am going to ask you a question totally unrelated to the topic we’ve been discussing. (Question on Universal Motivators)
17. Doers and Non-doers: What is the one thing you desire most in life? THANK THE RESPONDENT FOR HIS OR HER TIME!
2 and/or – Do you think it’s God’s Will that you (or your child or whoever the problem effects) gets [put the problem/illness here]?

81
Appendix 2: Completed DBCF

82
Appendix 3: Barrier Analysis Results
Determinants Doers: +Exp.
(A)
Non-doers: +Exp.
(B)
Doers: -Exp. (C)
Non-doers: -Exp. (D)
Doers %
Non-doers
% Diff. Odds
Ratio SE Confidence Interval
Estim. Relative
Risk p-
value Doer
Statement Non-doer Statement
Lower Limit
Upper Limit
1. Self-Efficacy : Can you do the behavior?
Yes 42 27 3 18 93% 60% 33% 9.33 0.67 2.51 34.74 8.11 0.000
Doers are 8.1 times
more likely to give this response
than NonDoers.
Possibly 1 3 44 42 2% 7% -4% 0.32 1.17 0.03 3.18 0.34 0.308
No 3 15 42 30 7% 33% -27% 0.14 0.68 0.04 0.54 0.16 0.001
NonDoers are 6.2 more
likely to give this response
than Doers.
Don't know 0 0 45 45 0% 0% 0% ##### 1.000
2. Self - Efficacy : What makes it easier?
Having access to tool 35 37 10 8 78% 82% -4% 0.76 0.53 0.27 2.14 0.780 0.396
Having Access to natural resources
10 6 35 39 22% 13% 9% 1.86 0.57 0.61 5.64 1.723 0.204
Knowledge of how to construct berms
2 9 43 36 4% 20% -16% 0.19 0.81 0.04 0.92 0.206 0.025
NonDoers are 4.9 more
likely to give this response
than Doers.
3. Self - Efficacy: Makes it Difficult:
Not having access to tools 27 29 18 16 60% 64% -4% 0.83 0.44 0.35 1.94 0.844 0.414
Construction is a lot of work 13 10 32 35 29% 22% 7% 1.42 0.49 0.55 3.69 1.369 0.315
Lack of skills and knowledge 1 11 44 34 2% 24% -
22% 0.07 1.07 0.01 0.57 0.080 0.002
NonDoers are 12.6
more likely to give this response
than Doers.
4. Positive Consequences: What are the advantages?

83
Prevention of loss of inputs 16 16 29 29 36% 36% 0% 1.00 0.44 0.42 2.37 1.000 0.587
Prevention of loss of soil 21 16 24 29 47% 36% 11% 1.59 0.43 0.68 3.70 1.511 0.196
Increase in yields 16 12 29 33 36% 27% 9% 1.52 0.46 0.62 3.73 1.451 0.247
5. Negative Consequences: What are the disadvantages?
Nothing 43 45 2 0 96% 100% -4% 0.00 ##### 0.096 0.247
6. Social Norms: Do most people approve?
Yes 44 43 1 2 98% 96% 2% 2.05 1.24 0.18 23.41 1.940 0.500
Possibly 0 2 45 43 0% 4% -4% 0.00 ##### 0.000 0.247
No 1 0 44 45 2% 0% 2% ##### 10.205 0.500
Don't know 0 0 45 45 0% 0% 0% ##### 1.000
7. Social Norms: Who approves?
Farmers, Workers, Growers
14 20 31 25 31% 44% -13% 0.56 0.44 0.24 1.34 0.596 0.138
Family 7 5 38 40 16% 11% 4% 1.47 0.63 0.43 5.04 1.410 0.379
8. Social Norms: Who disapproves
No one 45 44 0 1 100% 98% 2% ##### 0.500
9. Access - how difficult is it to get what you get what you need to do the behavior?
Very difficult 33 37 12 8 73% 82% -9% 0.59 0.52 0.22 1.63 0.631 0.224
Somewhat difficult 9 6 36 39 20% 13% 7% 1.63 0.58 0.53 5.02 1.536 0.286
Not difficult at all 3 2 42 43 7% 4% 2% 1.54 0.94 0.24 9.66 1.459 0.500
10. Reminders - how difficult is it to remember?
Very difficult 14 8 31 37 31% 18% 13% 2.09 0.51 0.78 5.63 1.911 0.110
Somewhat difficult 11 6 34 39 24% 13% 11% 2.10 0.56 0.70 6.29 1.916 0.141
Not difficult at all 20 31 25 14 44% 69% -
24% 0.36 0.44 0.15 0.86 0.404 0.016
NonDoers are 2.5 more
likely to give this response
than Doers.
11. Risk- How likely to get the problem?
Very likely 20 32 25 13 44% 71% -27% 0.33 0.45 0.14 0.78 0.369 0.009
Non-doers are2.7 times more
likely to give this response

84
Somewhat likely 13 10 32 35 29% 22% 7% 1.42 0.49 0.55 3.69 1.369 0.315
Not likely at all 12 3 33 42 27% 7% 20% 5.09 0.69 1.33 19.54 3.832 0.011
Doers are 3.8 times
more likely to give this response
than NonDoers.
12. Severity - How serious is the problem?
Very serious 37 39 8 6 82% 87% -4% 0.71 0.59 0.23 2.25 0.739 0.386
Somewhat serious 6 5 39 40 13% 11% 2% 1.23 0.65 0.35 4.37 1.204 0.500
Not serious at all 2 1 43 44 4% 2% 2% 2.05 1.24 0.18 23.41 1.856 0.500
13. Action Efficacy - if you do the behavior will you still have the problem
Very likely 4 9 41 36 9% 20% -11% 0.39 0.64 0.11 1.38 0.419 0.115
Somewhat likely 8 13 37 32 18% 29% -11% 0.53 0.51 0.20 1.45 0.562 0.159
Not likely at all 33 23 12 22 73% 51% 22% 2.63 0.45 1.09 6.36 2.406 0.025
Doers are 2.4 times
more likely to give this response
than NonDoers.
14. Divine Will - does God approve of you doing the behavior?
Yes 25 30 20 15 56% 67% -11% 0.63 0.44 0.27 1.47 0.657 0.194
No 19 14 26 31 42% 31% 11% 1.62 0.44 0.68 3.84 1.537 0.191
Won't say/doesn't know 1 1 44 44 2% 2% 0% 1.00 1.43 0.06 16.50 1.000 0.753
15. Policy - Any community laws/regulations that make is less likely you will do the behavior?
Yes 2 5 43 40 4% 11% -7% 0.37 0.87 0.07 2.03 0.399 0.217
No 39 39 6 6 87% 87% 0% 1.00 0.62 0.30 3.37 1.000 0.621
Don't know/won't say 4 1 41 44 9% 2% 7% 4.29 1.14 0.46 40.01 3.280 0.180
16. Culture - Any cultural rules/taboos against the behavior?
Yes 3 5 42 40 7% 11% -4% 0.57 0.76 0.13 2.55 0.598 0.357
No 38 39 7 6 84% 87% -2% 0.84 0.60 0.26 2.71 0.851 0.500
Don't know/won't say 4 3 41 42 9% 7% 2% 1.37 0.79 0.29 6.48 1.319 0.500
17. Universal Motivators - What do you desire most in life?
Money 13 17 32 28 29% 38% -9% 0.67 0.45 0.28 1.62 0.695 0.251
Health 14 20 31 25 31% 44% -13% 0.56 0.44 0.24 1.34 0.596 0.138
Food 3 6 42 39 7% 13% -7% 0.46 0.74 0.11 1.98 0.492 0.242

85
Livestock 2 0 43 45 4% 0% 4% ##### 10.419 0.247
Peace 6 1 39 44 13% 2% 11% 6.77 1.10 0.78 58.73 4.462 0.055
Good farming 5 2 40 43 11% 4% 7% 2.69 0.87 0.49 14.64 2.321 0.217
Religion 0 3 45 42 0% 7% -7% 0.00 ##### 0.000 0.121
Knowledge 0 3 45 42 0% 7% -7% 0.00 ##### 0.000 0.121

86
Appendix 4: Activity Plan
Water Harvesting and Erosion Control Earthworks Training of Trainers Tour
I. What and Why Earthworks are a set of land soft-scaping techniques which aim to slow, spread, and sink water on an agricultural landscape. These principles can drastically improve soil fertility, greatly improving food, economic, and health security. Although there are many forms of water harvesting and erosion control earthworks, the techniques and approach taught in this training are specifically designed from results of a barrier analysis survey identifying barriers and motivators to berm adoption. The goal of this training is to increase self-efficacy (knowledge, skills, and abilities) to construct berms, increase perceived action efficacy of berms (berms will work to solve erosion problems) and increase perceived susceptibility of erosion problems. The techniques taught in this training include contour berms, boomerang berms, check dams, and terraced garden beds, as well as appropriate stabilization techniques such as spillways, endcaps, and the inclusion of appropriate agroforestry techniques. This tour will train selected work partners to bring these techniques back to their communities where they will be able to create demonstration sites in their own fields and work as extension agents within the community. What is unique about this training model is that work partners will go on the entire tour and will execute, practice, design, and teach these techniques several times to solidify skills and confidence. II. Who 3-5 PCVs: PCVs within the same region who see a need in their community can decide together to conduct this tour. The attending work partner and work site must be located in the PCVs community, as follow-up is integral and commitment and accesses to the site is necessary. PCVs are responsible for;
x Site and work partner selection: Each PCV will select one or two work partners to attend the entire tour. One of those work partners must provide a space to be turned into a demo site during the training. The site may be privately owned, or serve as a community agricultural space, but must have a full time attendant to maintain the demonstrations after implementation. Each PCV/work partner team will host the whole group for 2 nights and 2 days in their community, arrange meals and sleeping quarters, and encourage others in the community to attend the training in their location.
x Grant and funds management: writing the grant, receiving the money, allotting the funds as needed to other parties[U1] . Coordinating supplemental trainings: During the tour supplemental training will be provided to the work partners on travel days (see Sample Schedule Section III). These should be pertinent to the site and pre-arranged by PCVs in the area (see section IV Supplemental Trainings).
x Follow up: Demo sites will need physical maintenance with the rains, stabilizing plants will need to be cultivated on the structures, and PCV should be sure the structures are being utilized correctly but work partners and groups for the greatest possible impact.

87
PTA and PCVL: One PTA or APCD will deliver the actual training on the work days, but will also attend the entire tour. They are required to execute this project. PTA and PCVL are responsible for:
x Technical knowledge: They will be the actual tech trainers and bring the knowledge of how-to create earthworks from necessary knowledge for site selection to teaching work partners. This lesson plan is available separately see SessionPlan_Earthworks.doc
x Delivery of training: PTA and PCVL will run the show during the tour but attending PCVs and work partners will jump in as they become more knowledgeable and comfortable with the techniques along the way.
x Support PCVs with logistical planning: PTA and PCVL should assist on all parts of the planning process of needed, from answering PCVs questions on site selection and grant writing to helping arrange any materials PCVs may need to borrow from Peace Corps (i.e.: tools, mosquito nets, sleeping mats).
Work Partners: These are the selected work partners whose work spaces will be turned into a demo site and who will be trained as facilitators of earthworks techniques. Work Partners and responsible for:
x Committing to entire tour: work partners must travel to every work site in order to solidify knowledge transfer and be fair to other work partners involved. They cannot just have the free labor at their site and then not help and learn at other sites.
x Become part of the teaching process: As the tour goes on, by the second or third site, work partners should be helping fellow attendees at the site implement techniques.
· Prepare to be a trainer in their community: Work partners should not just use these skills in their own personal field, but take the opportunity of this training to learn how to spread this to others in their community. Other people involved along the way: · Other PCVs local to the work sites: PCVs in the area of the work site who are not the main group should be invited to the work day and they must bring a work partner. PCVs will have to provide lunch for them with grant funds and if necessary lodging (who will need lodging and meals should be determine before writing the grant so they can be included in the budget) . This way the training reaches beyond the few work partners travelling the whole way. Those who are attending the whole our will have a chance to start teaching these skills to other community members who have not previously been exposed in a real work setting. These other PCVs are asked to mobilize the community to attend work days as well. These PCVs can be responsible for the supplemental trainings if they want (see section Supplemental Trainings). · Other community members/groups local to the work sites: These are other people invited to learn on the individual work days but not attending the whole tour. PCVs provide lunch for them with grant funds and if necessary lodging. · Families hosting and preparing food for travelling work partners, PCVs, and PC Staff: In general the PCVs host family will house and feed the entire group but hotel accommodations may be necessary. Also, if a site permits that meals can be purchased at a restaurant this may be easier/more economical.

88
III. Where · Site selection will be done by PCVs who see a need in their community along with the PTA and PCVL who deem it a good place to conduct such training. · Since this is a tour it is necessary that the group be able to easily travel from site to site without too much trouble. It will be the job of the PCV to arrange travel methods and write them into the grant. · If possible the tour should be comprised of varying types of work settings; at least one of each garden, orchard, and field. If possible the tour should be set to go in escalating difficulty of intervention at each site so work partners and PCVs can build their knowledge as they go. · PCV needs to be sure the owner/group that uses the land to be worked on understands what will happen there and is willing to maintain it (at least one work partner who has stock in the land MUST attend the whole tour). IV.When Month: This tour can occur any time of year but special attention needs to be paid to possible conflicts like religious events, difficult travel times, busy work times for farmers, etc. It is recoomeneded to complete this activity series prior to the rainy season. PCVs will have to speak with PTAs and PCVLs about when the best time to conduct the training will be. Some soils may be too hard to work in until after the rains have started so it can only occur in the rainy season, while this may not be a limitation in other places. If the site is in a field crop space being cropped this training can only be held in the dry season
Days 1-3-5-7
8am Breakfast
9am-2pm Travel: Participating PCVs and work partners travel to host location
2pm Lunch
4-7pm PCVs, PTA, and PCVL visit work site. Assessment and planning of work day.
4-7pm Supplemental training for work partners.*
7-10pm Dinner and socializing with work partners and hose site community
Days 2-4-6-8
7am Breakfast
8am-11:30am
All community members, work partners, PCVs, and PTA and PCVL at work site. Training in earthworks technology.
11:30am-12:00
Pause Cafe

89
12:00-2:30pm
Resume work activities
2:30pm-4:00p
Lunch and rest at work site
4:00p-6:00pm
Complete earthworks installation, wrap-up discussion. (Day 8: Go Home!)
8pm Dinner (Day 2,4 and 6) Days: There will need to be two days per work site which includes one for travel and supplemental trainings and one for the earthworks training and work day. Sample Schedule IV: Supplemental Trainings* During the down time on days 1,3, 5, and 7 for work partners a supplemental training should be held for them which is prearranged based on the needs of the site/community. The sites should be visited by as many involved PCVs as possible during the planning stages to determine what this supplemental training should be. It can be from any sector and be conducted by any PCV involved, another one from the region, or a local Senegalese educator who wants to help out. The training should be engaging and fun, as this tour is hard work and this is just a chance to take advantage of a teaching opportunity, not more tedious work. One of these days should be dedicated to a session on community building, leadership, and skills to teach others as this is a training of trainers. There will be session plans available for any of these possible lessons which a PCV can follow and implement. Possible supplemental trainings by theme: Gardening: Advanced Gardening Techniques, Mulching, Inter-cropping, Composting, Organic Fertilizers, Moringa Beds, IPM, Chemical Fertilizers, Best Practices, Vegetable Breeding, etc. Agroforestry: Farmer Managed Natural Regeneration, Fruit Tree Pruning, Forestry Species Pruning, Live Fencing, Nursery Production, Fuel and Fodder Wood Production, etc. Field Interventions: Conservation Agriculture (zai, holes, ripper, residue retention), Biochar, Contour Plowing, Improved Seed Varieties, Seed Storage and Selection, Alley Cropping, FMNR, etc. Health: Medicinal Plant Production, Moringa Nutrition, neem soap/lotion creation, etc CED: Agribusiness, Leadership, Community Development, Best Game

90
V. How Much Sample Budget Item Description Budget
Category Unit Cost CFA Quantity Total Cost
Lodging (separate line for each site)
IN KIND 4000 # of work partners spending night
# of work partners x number of nights x 4000
Breakfast Travel/per diem
10,000 # of days of tour
# of days x 10, 000
Lunch Travel/per diem
50,000 # of days of tour
# of days x 50,000
Dinner Travel/per diem
35,000 #of days of tour # of days x 50,000
Labor of cooking lunch and Dinner
IN KIND 5,000 2 x # of days of tour
2 x #of days x 5,000
Travel Travel/per diem
PCVs must determine this after sites are chosen
Have one person responsible for budget from start to finish including writing, allocating fund and collection of receipts for completion report. If in-kind donations are required for the grant you can include budget lines for tools, cooking labor, and lodging at host houses. Grants for trainings may not require an in-kind donation so check with your grants coordinator or APCD when writing the grant. Work partners WILL NOT be paid a per diem for this training, they must be committed to learn and teach without that sort of motivation. VI. Do’s for Conducting Your Own Earthworks Tour Do’s for Preparation: · Do have one person be the main grant writer for organizational reasons but have whole group give input through the main writer. · Do choose sites which work partners are invested in. Do have at least 4 sites if possible with different settings included; orchard, garden, field. Do choose work partners who will attend entire tour, bring the knowledge back to the community, are physically able to do the labor required, and who are outgoing. · Do visit each site with PCVs, PTA, or PCVL (if possible) to check out the land, plan supplemental trainings, and assess the difficulty level of the work technically so tour can be in order of least difficult site to most (this will usually mean starting in a garden or orchard and ending in a field crop space).

91
· Do plan travel, lodging, and food logistics as perfectly and precisely as possible (sleeping mats, mosquito nets, special needs, water, etc). On work days, lunch should be out ON TIME (2:30) or it will interrupt the schedule. Also DO include a pause café at 11:30am so everyone can refuel and work until lunch. Do eat at restaurants if possible/if it is more economical. · Do include your PTA and PCVL in the planning process. · Do invite other PCVs and community members to the work days. · Do mobilize community beforehand and warn them they will NEED to bring their own shovel, hand hoe, OR pick. · Do plan for separate lodging chambers for men and women. Do’s for During Tour: · Do begin and end all sessions on time as the work days are necessarily long. · Do have entire community bring their own tools and have PCVs bring work partners. · Do reinforce the work partners’ role as community educators as the tour happens. · Do support hosting PCV at their site and in their home during lodging and meal planning times. · All PCVs present should have clear roles during work days so there is not loitering and chatting while others are training/working. These roles include photographer, name and info recorder, map drawer, note taker, translator, etc. · Do spend quality time with work partners after scheduled activities are done. Show your appreciation for their hard work with certificates and a small party at the end of the tour. Do’s for Follow-Up Activity: · Do have a meeting with all PCVs right after the tour is finished to go over what went well, what didn’t, etc and update this On-Demand document. At this meeting schedule all follow up activity necessary on a calendar including, if necessary, what and when to start tree nurseries, when to out plant grasses, and what could/should be seeded into earthworks structures. · Do plan to visit the work sites often to do physical maintenance of structures and plant any necessary stabilizing plants into the structures on time. · Do utilize the training sites as community teaching tools. · Do write and update a case study on the project. · Do remain in touch with other work partners and PCVs about how their sites are doing. · Do submit completion report promptly.
[U1]Give specific examples

92
Appendix 5: Session Plan
Session Plan Outline
Performance Goals These sessions include demonstrations, testimonials, and hands-on technical training to combat barriers of earthworks adoption. The goal of this session is to train volunteers in landscaping techniques designed to harvest rainwater and minimize erosion and soil loss on moderately sloped land. These techniques can be integrated into a wide variety of garden, field, and agroforestry systems.
Performance Objectives By the end of these session trainees will be able to:
x Build and use an A-Frame x Build and use a Slope-Finder x Mark Contour/ Define Slope x Assess landscape and plan appropriate earthworks x Install contour berms and swales x Install boomerang berms and swales x Install diversion swales x Install Terraces x Install Infiltration Basins x Install End Caps and Spillways where appropriate using locally available materials
Asses finished earthworks and plan for future plantings
Equipment, Materials, and Tools m = meter; WL = Wheelbarrow Load
Description: Quantity: Quantity: Number:
Shovel - Round 1 per 2 trainees Small Hoe 1 per 2 t
Shovel - Square 1 per 2 trainees Rope 20m
Pick 1 per 2 trainees Machete 2 - 3
Large Hoe 1 per 2 trainees Mason Level 2 - 3
Rake 1 per 2 trainees Watering Can 5 - 10
Strait Sticks (1.5m) 15 Cord 20m

93
Special Materials 1. Local Language facilitator/ Technical trainer
Required Trainer Readings
1. Rainwater Harvesting for Drylands Vol. II by Brad Lancaster 2. Agrodok 13 – Water Harvesting and Soil Moisture Retention www.agromisa.org
1. PowerPoint_WaterHarvestingAndErosionControl 2. HandOut_WaterHarvestingAndErosionControl
Trainer Preparation 1. Locate a training site with ample sloped land that has between a 4:1 and 2:1
slope (run:rise) 2. Make an example A-Frame 3. Make an example Slope-Finder 4. At least one day before the scheduled session, go to the site and make a small
demo of the following earthworks: a. Standard Berm and Swale b. Boomerang Berm and Swale c. Basin d. Diversion Swale e. Terrace
5. Make sure to include: 1. 1 overflow made of stone or brick 2. 1 overflow made of sticks 3. 1 end cap made of stone or brick
On the morning before the session begins, gather all necessary tools and materials
Lesson Plan Outline
1. Show trainees the demo earthworks, and explain what each one is, how it functions, and when it is appropriate to install it. 30min 2. Tour community fields and point out erosion channels and topsoil loss in various stages. Reinforce that everybody has signs of erosion and is therefore susceptible. (30 mins) 3. If site has particular erosion problem have owner of the field share a testimonial explain the problem and how it developed (20 mins) 4. If site has used earthworks be sure to spend a lot of time examining the site and have the owner give a testimonial of its effectiveness. (Action Efficacy) (30mins)

94
5. Show trainees the example A-Frame, and Slope-Finder, teach them how they are used and how to make each. 30min 6. Divide the group into smaller groups of 4-5 7. Have each group make an A-Frame 30min 8. Once the tools have been made, bring the groups back together, and have them discuss how best to use the training site to demonstrate the following earthworks 40min a) Standard Berm and Swale b) Boomerang Berm and Swale c) Check-dam d) Terrace 9. Once a plan has been made have them explain it for trainer approval 10. If the plan is well thought out, have them break back into groups 11. One group should take Berms and Swales, one should take Diversion Swales, and one should take Terraces. (If there are more than 3 groups, have one take Basins, and another take Boomerang Berms. If there are only three groups, have them all make a Basin or two once the other earthworks have been finished) 12. Have them rotate through every 40 minutes for 4 rotations. 2hrs 40min 13. Once all earthworks have been completed install spillways and end caps where appropriate 30min 13. Wrap up the session with a discussion of earthwork maintenance and possible planting schemes. 30min Repeat lesson plan at each site adapting plan to fit needs of site