barriers to adopting activity-based costing systems (abc
TRANSCRIPT

Technological University Dublin Technological University Dublin
ARROW@TU Dublin ARROW@TU Dublin
Doctoral Business
2008-01-01
Barriers to Adopting Activity-based Costing Systems (ABC): an Barriers to Adopting Activity-based Costing Systems (ABC): an
Empirical Investigation Using Cluster Analysis Empirical Investigation Using Cluster Analysis
Fawzi Abdalla Abusalama Technological University Dublin
Follow this and additional works at: https://arrow.tudublin.ie/busdoc
Part of the Business Commons
Recommended Citation Recommended Citation Abusalama, F. (2008) Barriers to Adopting Activity-based Costing Systems (ABC): an Empirical Investigation Using Cluster Analysis, Doctoral Thesis. Technological University Dublin. doi:10.21427/D7701R
This Theses, Ph.D is brought to you for free and open access by the Business at ARROW@TU Dublin. It has been accepted for inclusion in Doctoral by an authorized administrator of ARROW@TU Dublin. For more information, please contact [email protected], [email protected].
This work is licensed under a Creative Commons Attribution-Noncommercial-Share Alike 4.0 License

Barriers to Adopting Activity-Based Costing Systems (ABC)
An Empirical Investigation using Cluster Analysis
Fawzi Abdalla Abusalama BSc in Cost Acc & MSc in Acc
A Thesis Submitted in fulfillment of the Requirements for the degree of Doctor of Philosophy
Dublin Institute of Technology
Supervisor: Dr. Tadhg Barrett
School of Accounting and Finance Faculty of Business
December 2008

ii
ABSTRACT This research seeks to establish why ABC adoption rates are low given the claimed
benefits of the system. The view is taken that there are likely to be two sets of interacting
variables influencing ABC adoption, contingent variables and the company’s ability or
willingness to address implementation barriers.
The contingency approach is a recent and important development in ABC research. From
the perspective that there is no one universally appropriate MAS system, but that the
appropriateness of any system is dependent on the factors facing the firm, it can be
argued that ABC system adoption and success will depend upon specific contingent
factors such as product diversity, cost structure, firm size, competition, and business unit
culture. A contingency model of ABC adoption has been developed in order to examine
and investigate the reasons why the take up or adoption of ABC systems remains low.
This model seeks to incorporate contingency theory relating to a set of variables which
will be identified from the literature as likely to be influential in ABC adoption.
The view is taken that such contingency variables will not of themselves explain ABC
adoption rates, rather such contingency factors may be viewed as rendering ABC suitable
or otherwise for adoption by companies but that there are also implementation issues
which influence adoption. The implementation factors can be classified based upon a
review of the literature into three main types Behavioural, Systems and Technical.
This study seeks to establish which of these three sets of factors constitutes the dominant
barriers to ABC implementation. Based upon the contingency model, companies are
classified into groups, each group having a different “profile” with regard to the
individually established contingent variables. Thus, one such group will have a “good
match” with the contingent variables and another will have a “poor match”, e.g. if “size”
is found to be a contingent variable, one group will comprise the larger firms, and another
group will comprise the smaller firms, with a number of intermediate groups. The
grouping is based on all established contingent variables. Each such group is subdividing
into ABC adoption or non-adoption, and the reasons for non-adoption establish for each
such group.

iii
A mail questionnaire survey was considered an appropriate method for this study. The
survey undertaken comprised all firms listed in Business and Finance (2004) Irelands
Top 1000 Companies (the total number of companies included in the list were only 925
companies). 218 questionnaires were returned, generates a 23.6% response rate. The
quantitative data were processed using a SPSS program, leading to appropriate
descriptive and inferential statistical analysis, including frequencies, means, standard
deviations, chi-square, t-test, Mann-Whitney and ANOVA tests. Cluster analysis was
used to profile the companies according to the individually significant contingent factors.
Seven contingent variables were identified from the literature, six of which were found to
be statistically significantly associated with ABC adoption. Companies were “clustered”
using these variables into three groups, and reasons for non-adoption were identified.
Based upon an analysis of the given reasons for non-adoption, Technical Issues were
dominant amongst these companies in the cluster which profile most closely matches the
contingent factors.
The findings suggest that in the adoption of ABC, two distinct sets of variables are at
work. The ‘Contingent Variables’ which likely render it appropriate or useful for the
company to adopt ABC, and the company’s ability, or willingness to address the
‘Barriers’ and difficulties associated with ABC adoption. The results show a strong
significant association between contingent variables and the adoption of ABC.
The results suggest that the contingent variables alone may not of themselves adequately
explain the actual take up of ABC systems. Moreover, it suggests that two companies
which have similar profiles with regard to contingent variables (with higher overheads,
more product diversity etc.) may yet reach different decision with regards to ABC
adoption, due to their differing abilities or willingness to address and overcome the issues
relating to ABC implementation, the results completely support this suggestion. The
results also show that ‘Technical Issues’ are the most common factor militating against
ABC adoption within companies who are rejecting and actively considering its adoption
within the cluster whose profile most closely matches the prime factors.

iv
DECLARATION I certify that this thesis which I now submit for examination for the award of Doctor of
Philosophy, is entirely my own work and has not been taken from the work of others save
and to the extent that such work has been cited and acknowledged within the text of my
work.
The thesis was prepared according to the regulations for postgraduate study by research
of the Dublin Institute of Technology and has not been submitted in whole or in part for
an award in any other institute or university.
The work reported on in this thesis conforms to the principles and requirements of the
institute’s guidelines for ethics in research.
The institute has permission to keep, to lend or to copy this thesis in whole or in part, on
condition that any such use of the material of the thesis be duly acknowledged.
Signature ___________________________________ Date _______________

v
To my great parents,
my lovely wife ‘Rasha’
and my beloved kids
Mohamed, Mumin and Maria

vi
ACKNOWLEDGMENTS Above all, I thank my God for everything he has given me and helping me in all stages of
my education.
The writing of this thesis has been assisted by the generous help of many people, among
whom I would like to thank especially:
First and foremost, I am indebted to my principal supervisor, Dr Tadhg Barrett, who has
been very supportive at all stages of this work. I wish to express my utmost gratitude to
him for his invaluable advice and patience in reading, correcting and commenting on the
drafts of the thesis, and more importantly, for his generosity which I have received
throughout my entire doctoral program. His kindness and spiritual support has made me
feel more confident during the study period. Without his generous assistance and
encouragement, this work could never have been completed.
I am especially grateful to Mr. Noel O’Brien, for his helpful comments, observations and
suggestions. I appreciate his reading, guidance and comments on this thesis.
A special thanks goes to Dr. Joseph Coughlan and Dr. Katrina Lawlor for their valuable
information, comments and useful feedback during the annual evaluations.
I would like to thank Dr. Pamela Sharkey-Scott, the internal reader for her great
observations, suggestions and perceptive advices.
I wish to express my appreciation to Dr. Malcolm Mitchell for his fantastic comments
and information on research methodology and statistical techniques adopted in this study.
I wish to express my thanks to Dr. Joe Condon, statistical advice unit at DIT for his
challenging comments on the analysis techniques used in this study.
I have also been lucky in the friendships I made with my other postgraduates at DIT,
most specially, Norah Campbell, Aidan Kelly, Kevina Cody and Daire Hooper. In

vii
addition, I would like to express my thanks to Ms. Anne Morgan, school secretary for her
great help in typing and organizing the questionnaire and other administration issues.
I am particularly indebted to my parents Mr. Abdalla Abusalama and Mrs. Aisha Mouner.
I wish to give my heartily thanks to them for their continuous support and encouragement
throughout my studies and my entire life, even though the value of my appreciation
cannot compare with everything they have done for me. This dissertation is lovingly
dedicated to them. Also, I would like to thank my brothers and sisters for their support
and encouragement.
My final and very special thanks and loves are directed to my lovely wife Mrs. Rasha
Eladouli for her unconditional love, care, and great support. In fact, no words can
describe how much I am indebted to her.
1
Table of Contents ABSTRACT………………………………………………………………………..…….ii ACKNOWLEDGMENTS….…………………………………….………………..…….vi CHAPTER 1: INTRODUCTION ................................................................................................................... 8 1.1 Background............................................................................................................................................... 8 1.2 Justification for the Research.................................................................................................................... 9 1.3 Aims of the research ............................................................................................................................... 10 1.4 Research questions.................................................................................................................................. 12 1.5 Research Methods................................................................................................................................... 13 1.5.1 Literature review.................................................................................................................................. 13 1.5.2 Data Collection .................................................................................................................................... 13 1.5.3 Data analysis ........................................................................................................................................ 14 1.6 Organisation of the study ........................................................................................................................ 14 CHAPTER 2: ACTIVITY-BASED COSTING (ABC): REVIEW AND APPLICATION.......................... 18 2.1 Introduction............................................................................................................................................. 18 2.2 Traditional Costing Systems (TCS): Treatment of overheads ................................................................ 19 2.2.1 Purposes of cost allocation................................................................................................................... 19 2.2.2 Predetermined overhead rates .............................................................................................................. 19 2.2.3 The Two-Stage Allocation Process in Traditional Costing Systems.................................................... 20 2.2.4 Limitations of Traditional Cost Systems.............................................................................................. 22 2.3 Development and Evolution of Activity-Based Costing (ABC) ............................................................. 27 2.3.1 The Two-Stage Allocation Process in ABC......................................................................................... 29 2.3.2 The Effect of product Volume and Size on reported product cost ....................................................... 35 2.3.3 The Benefits of ABC ........................................................................................................................... 45 2.4 Summary and Conclusion ....................................................................................................................... 48 CHAPTER 3: EMPIRICAL FINDINGS TO ABC IMPLEMENTATION .................................................. 51 3.1 Introduction............................................................................................................................................. 51 3.2 Surveys conducted on the implementation of ABC systems .................................................................. 52 3.3 Case Studies on the implementation of ABC.......................................................................................... 63 3.4 Summary and Conclusion ....................................................................................................................... 69 CHAPTER 4: TECHNICAL ISSUES IN THE IMPLEMENTATION OF ABC SYSTEMS...................... 75 4.1 Introduction............................................................................................................................................. 75 4.2 Steps in designing and implementing ABC systems............................................................................... 75 4.2.1 Selecting specific objectives of the ABC system................................................................................. 77 4.2.2 Developing the ABC team ................................................................................................................... 78 4.2.3 Organisational issues ........................................................................................................................... 79 4.2.4 Defining the major activities in an organisation .................................................................................. 80 4.2.4.1 The major approaches to identifying activities ................................................................................. 81 4.2.4.1.1 Activity Dictionary ........................................................................................................................ 81 4.2.4.1.2 Functional decomposition .............................................................................................................. 81 4.2.4.2 Grouping and aggregating activities ................................................................................................. 83 4.2.4.2.1 The activity centre.......................................................................................................................... 83 4.2.4.2.2 Activity Hierarchy ......................................................................................................................... 84 4.2.4.2.3 Business process ............................................................................................................................ 87 4.2.5 Assigning costs to each activity ........................................................................................................... 88 4.2.6 Determining Secondary Activity Drivers............................................................................................. 90 4.2.6.1 Types of activity cost drivers ............................................................................................................ 92 4.2.6.2 The optimal cost driver selection ...................................................................................................... 93 4.2.7 Assigning the cost of activities to cost objects..................................................................................... 95 4.3 Summary and Conclusion ....................................................................................................................... 97

2
CHAPTER 5: CONTINGENCY THEORY AND MANAGEMENT ACCOUNTING SYSTEMS......... 102 5.1 Introduction:.......................................................................................................................................... 102 5.2 An overview of contingency theory of Management Accounting ........................................................ 103 5.3 The nature of the contingent variables .................................................................................................. 116 5.3.1 The external environment .................................................................................................................. 116 5.3.2 Organisational structure and cultural factors ..................................................................................... 122 5.3.3 Technology ........................................................................................................................................ 127 5.3.4 Competitive strategy .......................................................................................................................... 130 5.3.5 Organisational Size ............................................................................................................................ 131 5.4 Summary and Conclusion ..................................................................................................................... 134 CHAPTER 6: A MODEL OF ABC ADOPTION....................................................................................... 136 6.1 Introduction........................................................................................................................................... 136 6.2. Potential Contingent Factors................................................................................................................ 137 6.2.1 Company Sector................................................................................................................................. 137 6.2.2 Firm Size............................................................................................................................................ 138 6.2.3 Nationality ......................................................................................................................................... 142 6.2.4 Type of Competition .......................................................................................................................... 144 6.2.5 Product Diversity ............................................................................................................................... 147 6.2.6 Cost structure (Level of Overhead).................................................................................................... 152 6.2.7 Business Unit Culture ........................................................................................................................ 155 6.3. Developing the Research Model .......................................................................................................... 157 6.4. Summary and Conclusion .................................................................................................................... 162 CHAPTER 7: RESEARCH METHODOLOGY......................................................................................... 164 7.1 Introduction........................................................................................................................................... 164 7.2 Unique features of this research............................................................................................................ 165 7.3 Research Philosophy and Paradigms .................................................................................................... 166 7.4 Research Questions............................................................................................................................... 169 7.5 Research Hypotheses: ........................................................................................................................... 170 7.5.1 Contingency factors hypotheses:........................................................................................................ 171 7.5.2 Technical issues hypotheses............................................................................................................... 175 7.6 Data Collection ..................................................................................................................................... 178 7.6.1 Rules on Ethics and Confidentiality................................................................................................... 180 7.6.2 Research design and variables ........................................................................................................... 181 7.6.3 Questionnaire, problems of data collection, and response rate .......................................................... 186 7.6.3.1 Problems of data collection............................................................................................................. 186 7.6.3.1.1 Missing data ................................................................................................................................. 186 7.6.3.2 Response rate and a comparison with the previous research .......................................................... 188 7.6.3.3 Reliability, Validity and Non-response Bias Analysis .................................................................... 189 7.7 Statistical analysis techniques ............................................................................................................... 192 7.7.1 Univariate analysis............................................................................................................................. 192 7.7.2 Bivariate Analysis .............................................................................................................................. 193 7.7.2.1 Parametric tests ............................................................................................................................... 193 7.7.2.1.1 The independent t-test (2-sample t-test):...................................................................................... 193 7.7.2.1.2 Analysis of variance (ANOVA):.................................................................................................. 194 7.7.2.2 Non-parametric tests: ...................................................................................................................... 195 7.7.2.2.1 Mann-Whitney U tests: ................................................................................................................ 196 7.7.2.2.2 Kruskal-Wallis: ............................................................................................................................ 196 7.7.2.2.3 Assumptions underlying the Mann-Whitney U test and Kruskal-Wallis: .................................... 196 7.7.2.2.4 Chi-square: ................................................................................................................................... 197 7.7.2.2.5 Crosstabulations (Contingency tables):........................................................................................ 197 7.7.3 Cluster analysis method ..................................................................................................................... 198 7.7.3.1 K-means cluster analysis:................................................................................................................ 200 7.7.3.1.1 Assumptions of the K-means Cluster Analysis:........................................................................... 200 7.8 Summary and Conclusion ..................................................................................................................... 201

3
CHAPTER 8: RESULTS, FINDINGS AND DISCUSSION: DESCRIPTIVE ANALYSIS ..................... 203 8.1 Introduction........................................................................................................................................... 203 8.2 Responses to questions asked of all Responding Companies ............................................................... 203 8.2.1 Organisational and Environment Characteristics ............................................................................... 204 8.2.1.1 Industrial Sector .............................................................................................................................. 204 8.2.1.2 Firm Size......................................................................................................................................... 205 8.2.1.2.1 Number of Employees ................................................................................................................. 205 8.2.1.2.2 Annual Turnover .......................................................................................................................... 205 8.2.1.3 Nationality of ownership................................................................................................................. 206 8.2.1.4 Marketing Strategy.......................................................................................................................... 207 8.2.1.5 Product diversity ............................................................................................................................. 208 8.2.1.6 Use of Accounting and Management techniques ............................................................................ 209 8.2.1.7 Objectives of overhead allocation................................................................................................... 210 8.2.1.8 Cost structure .................................................................................................................................. 211 8.2.1.9 Expectation of changes in overhead costs....................................................................................... 212 8.2.1.10 Business unit culture ..................................................................................................................... 213 8.2.2 Activity-Based Costing system (ABC) .............................................................................................. 216 8.2.2.1 Knowledge of ABC......................................................................................................................... 216 8.2.2.2 Initial source of knowledge of ABC ............................................................................................... 216 8.2.2.3 Level of ABC adoption ................................................................................................................... 217 8.3 Responses to questions asked of adopting companies .......................................................................... 218 8.3.1 First ABC introduced ......................................................................................................................... 218 8.3.2 Initiators of ABC................................................................................................................................ 218 8.3.3 ABC introduction strategy ................................................................................................................. 219 8.3.4 Involvement with ABC implementation ............................................................................................ 220 8.3.5 Reasons for ABC adoption ................................................................................................................ 220 8.3.6 Success of ABC implementation ....................................................................................................... 221 8.3.7 Importance of ABC implementation.................................................................................................. 222 8.3.8 Difficulties encountered..................................................................................................................... 224 8.4 Responses to questions asked of companies currently considering ABC adoption .............................. 225 8.4.1 Factors militating against ABC adoption........................................................................................... 225 8.5 Responses to questions asked of companies who have rejected ABC .................................................. 226 8.6 Responses to questions asked of companies which had not considered ABC adoption........................ 227 8.6.1 Reasons for not considering ABC...................................................................................................... 227 8.6.2 Currently used basis for overhead allocation ..................................................................................... 228 8.6.3 Satisfaction with the current cost system ........................................................................................... 229 8.6.4 ABC future anticipation ..................................................................................................................... 229 8.7 Summary and Conclusion ..................................................................................................................... 230 CHAPTER 9: BIVARIATE STATISTICAL ANALYSIS ......................................................................... 236 9.1 Introduction........................................................................................................................................... 236 9.2 Crosstabulations and Chi-square results: .............................................................................................. 236 9.2.1 Industrial Sector and ABC adoption .................................................................................................. 237 9.2.2 Firm size and ABC adoption.............................................................................................................. 238 9.2.2.1 Number of employees ..................................................................................................................... 238 9.2.2.2 Annual turnover .............................................................................................................................. 240 9.2.3 Nationality of ownership and ABC adoption..................................................................................... 241 9.2.4 Public/Private Status and ABC adoption ........................................................................................... 242 9.2.5 Marketing Strategies and ABC adoption ........................................................................................... 243 9.2.5.1 Price ................................................................................................................................................ 243 9.2.5.2 Quality ............................................................................................................................................ 245 9.2.6 Product Diversity and ABC adoption ................................................................................................ 246 9.2.7 Cost Structure (Overhead) and ABC adoption................................................................................... 247 9.2.8 Expectation of overheads and ABC adoption status: ......................................................................... 248 9.2.9 Business Unit Culture and ABC adoption.......................................................................................... 249

4
9.2.9.1. Innovation ...................................................................................................................................... 250 9.2.9.2 Outcome orientation........................................................................................................................ 251 9.3 Mann-Whitney U tests: ......................................................................................................................... 253 9.4 Summary and Conclusion: .................................................................................................................... 255 CHAPTER 10: CLUSTER ANALYSIS..................................................................................................... 261 10.1 Introduction......................................................................................................................................... 261 10.2 Cluster analysis method ...................................................................................................................... 261 10.2.2 K-means Cluster Analysis:............................................................................................................... 263 10.3 K-means Cluster Analysis Results ...................................................................................................... 264 10.3.1 Number of clusters and Cluster centres............................................................................................ 264 10.3.2 Clusters and ABC adoption status.................................................................................................... 269 10.3.3 Characteristics of the clusters........................................................................................................... 269 10.3.3.1 Type 1 companies (Cluster 1) ....................................................................................................... 270 10.3.3.2 Type 2 companies (Cluster 2) ....................................................................................................... 275 10.3.3.3 Type 3 companies (Cluster 3) ....................................................................................................... 279 10.3.3.4 A comparison between the clusters and non ABC adopters.......................................................... 282 10.3.3.4.1 ABC under Consideration Companies ....................................................................................... 283 10.3.3.4.2 ABC Rejecters Companies......................................................................................................... 284 10.3.3.4.3 ABC Not-considering Companies.............................................................................................. 285 10.4 Summary and Conclusion ................................................................................................................... 287 CHAPTER 11: EVALUATION OF THE RESEARCH MODEL.............................................................. 289 11.1 Introduction......................................................................................................................................... 289 11.2 Research Model .................................................................................................................................. 289 11.3 Relationship of contingency variables and ABC adoption.................................................................. 291 11.3.1 Company sector ............................................................................................................................... 291 11.3.2 Firm size .......................................................................................................................................... 292 11.3.3 Nationality ....................................................................................................................................... 293 11.3.4 Product diversity .............................................................................................................................. 294 11.3.5 Competition ..................................................................................................................................... 294 11.3.6 Cost structure (level of overheads) .................................................................................................. 295 11.3.7 Business unit culture ........................................................................................................................ 296 11.4 Technical issues and ABC adoption ................................................................................................... 297 11.5 Summary and conclusion .................................................................................................................... 303 CHAPTER 12: CONCLUSIONS, CONTRIBUTIONS, AND FUTURE RESEARCH............................. 305 12.1 Introduction......................................................................................................................................... 305 12.2 Concluding the research questions...................................................................................................... 306 12.3 Theoretical and Methodological contributions ................................................................................... 309 12.3.1 Dual Influences ................................................................................................................................ 309 12.3.2 Classification of the potential Barriers to ABC implementation...................................................... 310 12.3.3 Identification of Contingent Factors ................................................................................................ 310 12.3.4 Use of Cluster Analysis / Profiling of Companies ........................................................................... 311 12.3.5 Identification of Implementation Barriers........................................................................................ 312 12.4 Suggestions for Future Research......................................................................................................... 313 12.5 Closing Remarks................................................................................................................................. 314 13. BIBLIOGRAPHY................................................................................................................................. 316 Appendix A................................................................................................................................................. 331

5
List of Figures
Figure 2.1: Two-stage process for TCS ......................................................................................... 21 Figure 2.2: Variable costing system............................................................................................... 24 Figure 2.3: A comparison between TCS & ABC systems............................................................. 29 Figure 2.4: Manufacturing cost hierarchy...................................................................................... 30 Figure 2.5: Two stage-allocation process for ABC........................................................................ 32 Figure 2.6: Decomposition of indirect cost into activities ............................................................. 33 Figure 2.7: Characteristics of products .......................................................................................... 36 Figure 2.8: Product costing data for company A ........................................................................... 37 Figure 2.9: Product costing data for company B ........................................................................... 40 Figure 2.10: Product costing data for company C ......................................................................... 42 Figure 2.11: Product costing data for company D ......................................................................... 43 Figure 2.12: Product costing data for company E.......................................................................... 44 Figure 2.13: Direct and indirect costs ............................................................................................ 48 Figure 3.1: Barriers and difficulties classification......................................................................... 73 Figure 4.1: Basic building blocks of the ABC system................................................................... 76 Figure 4.2: Functional decomposition ........................................................................................... 82 Figure 4.3: The activity centre....................................................................................................... 83 Figure 4.4: Activity hierarchy........................................................................................................ 85 Figure 4.5: Cost drivers and cost driver rates at Hierarchy Manufacturing Co…………………..86 Figure 4.6: Two-stage allocation for ABC system ........................................................................ 89 Figure 4.7: First stage ABC allocation .......................................................................................... 89 Figure 4.8: Designing the optimal ABC system ............................................................................ 94 Figure 4.9:Technical steps in ABC implementation...................................................................... 98 Figure 5.1: A contingency model of perceived usefulness of MAS ............................................ 107 Figure 5.2: A functionalist contingency model............................................................................ 114 Figure 5.3: Multiple contingencies model ................................................................................... 114 Figure 5.4: Structure of organization model ................................................................................ 123 Figure 6.1: Basic contingency model of ABC adoption .............................................................. 158 Figure 6.2: contingency factors and ABC difficulties ................................................................. 159 Figure 6.3: Contingency, ABC difficulties & implementation status.......................................... 160 Figure 6.4: A contingency model of ABC adoption .................................................................... 161 Figure 7.1: Four paradigms for the analysis of social theory....................................................... 167 Figure 7.2: Statistical analysis techniques ................................................................................... 192 Figure 11.1: A contingency model of ABC adoption .................................................................. 290

6
List of Tables Table 3.1: Use of ABC by US & Dutch firms .............................................................................................. 55 Table 3.2: Benefits perceived by ABC adopters ........................................................................................... 62 Table 3.3 The overall rates of ABC adoption ............................................................................................... 70 Table 3.4: Benefits and advantages of ABC systems.................................................................................... 71 Table 3.5: Main difficulties encountered during ABC implementation........................................................ 72 Table 5.1: Contingent variables included in studies of structural features.................................................. 104 Table 5.2: Major contingent studies (four levels) ....................................................................................... 112 Table 7.1: Features of the research paradigms............................................................................................ 167 Table 7.2: The differences between the four research paradigms ............................................................... 168 Table 7.3: The relationship between questions and hypothesis .................................................................. 183 Table 7.4: Variables determined in the questionnaire................................................................................. 184 Table 7.5: A comparison of Irish surveys regarding ABC systems ............................................................ 188 Table 7.6: Reliability statistics.................................................................................................................... 189 Table 7.7: Test of non-response bias .......................................................................................................... 191 Table 8.1: Industrial sector ......................................................................................................................... 204 Table 8.2: Number of employees................................................................................................................ 205 Table 8.3: Annual turnover ......................................................................................................................... 206 Table 8.4: Company nationality and nature ................................................................................................ 206 Table 8.5: Marketing strategy ..................................................................................................................... 207 Table 8.6: Marketing strategy analysis ....................................................................................................... 207 Table 8.7: Number of products ................................................................................................................... 208 Table 8.8: Cost management techniques..................................................................................................... 209 Table 8.9: Importance of various objectives in allocating overhead costs.................................................. 211 Table 8.10: Objectives in allocating overhead costs ................................................................................... 211 Table 8.11: Cost structure ........................................................................................................................... 212 Table 8.12: Expected change in proportion of overhead costs.................................................................... 213 Table 8.13: Business unit culture ................................................................................................................ 214 Table 8.14: Business unit culture (Innovation) ........................................................................................... 215 Table 8.15: Business unit culture (outcome orientation.............................................................................. 215 Table 8.16: ABC knowledge....................................................................................................................... 216 Table 8.17: ABC first learn......................................................................................................................... 217 Table 8.18: ABC adoption rates.................................................................................................................. 217 Table 8.19: ABC adoption rates.................................................................................................................. 218 Table 8.20: ABC first introduced................................................................................................................ 218 Table 8.21: Initiators of ABC adoption ...................................................................................................... 219 Table 8.22: Introduction strategy ................................................................................................................ 219 Table 8.23: Involvement in ABC implementation ...................................................................................... 220 Table 8.24: Reasons for ABC adoption ...................................................................................................... 221 Table 8.25: ABC applications (Success)..................................................................................................... 222 Table 8.26: ABC applications (importance) ............................................................................................... 223 Table 8.27: Difficulties of ABC implementation........................................................................................ 224 Table 8.28: Factors against adoption of ABC............................................................................................. 225 Table 8.29: Reasons for rejecting ABC ...................................................................................................... 226 Table 8.30: Reasons for not considering ABC............................................................................................ 228 Table 8.31: Basis in cost allocation ............................................................................................................ 228 Table 8.32: Satisfaction with the current cost system................................................................................. 229 Table 8.33: ABC future anticipation........................................................................................................... 229 Table 9.1: Industry sectors and levels of ABC adoption............................................................................. 237 Table 9.2: Chi-square tests for industry sectors .......................................................................................... 238 Table 9.3: Size categories and levels of ABC adoption.............................................................................. 239 Table 9.4: Chi-square tests for size categories............................................................................................ 239 Table 9.5: Annual turnover categories and levels of ABC adoption........................................................... 240 Table 9.6: Chi-square tests for annual turnover .......................................................................................... 241

7
Table 9.7: Nationality categories and levels of ABC adoption................................................................... 241 Table 9.8: Chi-square tests for nationality .................................................................................................. 242 Table 9.9: Company status categories and levels of ABC adoption ........................................................... 242 Table 9.10: Chi-square tests for company status categories ....................................................................... 243 Table 9.11: Price category and levels of ABC adoption ............................................................................. 244 Table 9.12: Chi-square test for price category ............................................................................................ 244 Table 9.13: Quality category and levels of ABC adoption ......................................................................... 245 Table 9.14: Chi-square tests for quality category ....................................................................................... 246 Table 9.15: Product diversity category and levels of ABC adoption.......................................................... 246 Table 9.16: Chi-square tests for product diversity ...................................................................................... 247 Table 9.17: Overheads category and levels of ABC adoption .................................................................... 247 Table 9.18: Chi-square tests for overheads category .................................................................................. 248 Table 9.19: Expectation of overheads and ABC adoption status ................................................................ 249 Table 9.20:Chi-square tests for overhead expectation ................................................................................ 249 Table 9.21: Innovation category and levels of ABC adoption .................................................................... 250 Table 9.22: Chi-square tests for innovation ................................................................................................ 251 Table 9.23: Orientation category and levels of ABC adoption ................................................................... 252 Table 9.24: Chi-square tests for outcome orientation ................................................................................. 252 Table 9.25: Results of Man-Whitney for adopters and non-adopters ......................................................... 254 Table 9.26: Descriptive statistics for contingency variables and ABC adoption ........................................ 254 Table 9.27: Summary of results of all statistical analysis ........................................................................... 255 Table 10.1: Agglomeration Schedual (Hierarchcal clustering)................................................................... 267 Table 10.2-5-8: Number of cases in each cluster ........................................................................................ 267 Table 10.3-6-9: Initial cluster centres ......................................................................................................... 267 Table 10.4-7-10: Final cluster centres......................................................................................................... 268 Table 10.11: Clusters and ABC adoption status ......................................................................................... 269 Table 10.12: Descriptive statistics for cluster 1 .......................................................................................... 270 Table 10.13: ABC adoption status in cluster 1............................................................................................ 271 Table 10.14: ABC first introduced.............................................................................................................. 271 Table 10.15: Factors against adoption of ABC........................................................................................... 272 Table 10.16: Reasons for rejecting ABC .................................................................................................... 273 Table 10.17: Reasons for not considering ABC.......................................................................................... 274 Table 10.18: Descriptive statistics for cluster 2 .......................................................................................... 275 Table 10.19: ABC adoption status .............................................................................................................. 276 Table 10.20: Factors against adoption of ABC........................................................................................... 276 Table 10.21: Reasons for rejecting ABC .................................................................................................... 277 Table 10.22: Reasons for not considering ABC.......................................................................................... 278 Table 10.23: Descriptive statistics for cluster 3 .......................................................................................... 279 Table 10.24: ABC adoption status .............................................................................................................. 280 Table 10.25: Factors against adoption of ABC........................................................................................... 280 Table 10.26: Reasons for rejecting ABC .................................................................................................... 281 Table 10.27: Reasons for not considering ABC.......................................................................................... 282 Table 10.28: Under consideration companies ............................................................................................. 283 Table 10.29: ABC rejecters companies....................................................................................................... 284 Table 10.30: Reasons for not considering ABC.......................................................................................... 285 Table 11.1: Summary of results of bivariate analysis ................................................................................. 291 Table 11.2: Clusters and ABC adoption status ........................................................................................... 297 Table 11.3: Descriptive statistics of the clusters ......................................................................................... 298 Table 11.4: ABC adoption status among clusters ....................................................................................... 299 Table 11.5: ABC Rejecters companies ....................................................................................................... 300 Table 11.6: Under consideration companies ............................................................................................... 302

8
CHAPTER 1: INTRODUCTION 1.1 Background
In the costing of products or services, the appropriate treatment of ‘overhead’ or indirect
costs has posed particular challenges. The traditional absorption costing system deals
with these costs by a two stage process of allocation or apportionment to cost centres,
from where they are charged to (or absorbed by) the product or service. This second stage
utilizes an ‘absorption base’ which is common to all products or services being costed
and which is usually a measure of the volume of activity utilized by the product or
service, for example, direct labour hours or machine hours, but other such bases may also
be used, for example, direct labour cost or direct material cost. This approach results in
the product or service being charged with the overhead costs in proportion with their
utilization of the chosen absorption base.
Activity-Based Costing (ABC) is an alternative to the traditional treatment of overhead
costs. ABC recognizes that many overhead costs vary in proportion to changes in
activities, rather than the measure of production volume utilized as the absorption base in
the traditional system. By identifying the “activities” that cause costs to change and thus
assigning costs to products on the basis of the “cost driver” usage, it is claimed that ABC
can more accurately measure the resources consumed by products. This cause and effect
relationship provides a superior way of determining relevant costs. Furthermore, it is
claimed (Drury, 2001) that ABC can be used for a range of cost management applications
such as value chain analysis, customer profitability analysis, and business process
management.

9
In general, the management accounting literature has provided four genres of ABC
research: consulting, basic, critical and contingency research (Otley, 1980; Young and
Selto, 1991; Lukka and Granlund, 2002). It can be argued that the genre of contingency
research is the most recent and important development in the ABC literature. However,
contingency-based research has been given little attention particularly in Ireland.
Therefore, this research develops a new and complex contingency model of ABC in order
to examine and investigate the relationship between the adoption of ABC systems,
Technical Issues and contingency factors within Irish companies.
1.2 Justification for the Research
Despite its high profile, the published evidence on ABC implementation indicates that
there is a fairly low rate of implementation (Innes and Mitchell 1991, 1995; Clarke 1992,
1997; Bjornenak 1997; Chenhall and Langfield-Smith 1998; Pohlen and Londe 1998;
Groot 1999; Innes et al. 2000; Drury and Lamminmaki 2001; Pierce and Brown 2004;
Cohen et al. 2005; Sartorius et al. 2007).
Various possible reasons have been suggested for this relatively low adoption rate, which
include the following: Technical Variables such as identifying and aggregating activities,
assigning resources to activities, selecting cost drivers (Innes and Mitchell 1990, 1992,
1993, 1995, 1998; Clarke et al. 1999; Groot, 1999; Innes et al. 2000; Chongruksut 2002;
Pierce and Brown 2004; and Cohen et al. 2005, Sartorius et al. 2007), Behavioural and
Organisational variables such as internal resistance, lack of top management support,
human resource availability, lack of knowledge, and an expressed satisfaction with
current systems (O’Dea and Clarke 1994; Anderson 1995; Shields 1995; Clarke et al.
1999; Innes et al. 2000; Chongruksut 2002; Pierce and Brown 2004; and Cohen et al.

10
2005), and Systems Issues, such as data collection difficulties, inadequate computer
software, amount of work and time needed (Clarke et al. 1999; Innes et al. 2000; and
Pierce and Brown 2004).
ABC implementation has already been investigated in some countries. The literature
shows examples of successful ABC implementation in countries such as Ireland (Clark et
al. 1999; Pierce and Brown 2004), UK (Innes and Mitchell 1991, 1995; and Innes et al.
2000), USA (Anderson 1995; Pohlen and Londe, 1998; Groot 1999), Australia (Booth
and Giacobbe, 1997, Nguyen and Brooks 1997; Chenhall and Smith 1998), New Zealand
(Cotton et al, 2003) and Canada (Eden et al. 2004). While there is evidence which
suggests that behavioural factors are critical to the successful implementation of a new
cost management system (Anderson 1995; Shields 1995), there has been no empirical
investigation indicating the impact of technical issues on the successful implementation
of ABC. Such technical issues include (i) identifying the major activities (ii) creating a
cost pool for each major activity (iii) determining the cost driver for each activity, and
(iv) assigning the cost of activities to cost objects.
This study will explore how these issues influence Irish companies together with the
impact of contingency factors on the implementation of ABC systems. The focus of this
research is to investigate the extent of the impact of these technical issues on companies
when implementing ABC.
1.3 Aims of the research
The aim of this research is to develop a model of ABC adoption. This model will seek to
incorporate contingency theory relating to a set of variables which will be identified from

11
the literature as likely to be influential in ABC adoption. However, such contingency
variables will not of themselves fully explain the issues. Rather, such factors are viewed
as rendering ABC “suitable” or otherwise for adoption by companies. The view is taken
that in addition to such factors there are also implementation issues which influence
adaptation. These implementation factors can be classified, based on a review of the
literature, into three main types - Behavioural, Systems and Technical.
While significant consideration of the behavioural issues relating to ABC implementation
has been given in the literature, it has been suggested that technical issues should be
further investigated, As Anderson et al (2002, p.195) explicitly state: “an aspect of ABC
implementation that researchers have neglected is the process of designing the ABC
model – i.e. the resources, activities and cost drivers that are the ‘economic map’ of the
organisation”.
This research seeks to establish whether or not such technical issues are significant to the
adoption of ABC. The model developed will seek to investigate the relationship between
the implementation of ABC, the contingent factors influencing such adoption, and the
significant technical issues which may act as barrier to such implementation.
It is expected that to achieve this aim an investigation of the following matters will be
necessary:
(i) The current state of ABC adoption rates among Irish companies.
(ii) The perceived level of usage and success across a range of specified applications.
(iii) The main reasons and difficulties for the implementation, rejection, consideration
and non-consideration of ABC in organisations.
(iv) The nature/role of contingency theory in management accounting and its impact on
12
the decisions on the implementation of ABC systems in Ireland.
(v) The technical issues that have been addressed by those companies which have
successfully implemented ABC systems.
1.4 Research questions
This research attempts to answer two main interrelated questions:
1. Is the adoption of ABC by Irish companies associated with firm-specific characteristics, namely industry sector, firm size, nationality, product diversity, type of competition, cost structure and business unit culture?
The above question seeks to test those factors which the literature suggests likely
influence the adoption of ABC systems i.e. companies which have a particular
‘profile’ relating to contingency factors are more likely to find ABC useful and
therefore, more likely to adopt it than companies which have an alternative
‘profile’.
2. What is the extent of the technical difficulties encountered during the implementation of ABC system?
The technical difficulties focused upon are those identified by the literature review:
(i) Identifying the major activities that take place in an organisation
(ii) Assigning resources to those activities
(iii) Aggregating activities to create cost pools/ activity centres
(iv) Determining the cost drivers for each activity
(v) Assigning the cost of activities to cost objects
A group of null hypotheses are proposed to answer each of the above two questions.
For each contingent variable, at least one or more hypotheses are tested.

13
1.5 Research Methods
This study will proceed in the following three stages:
1.5.1 Literature review
The literature relating to ABC systems with respect to its benefits, problems,
implementation, success and satisfaction, as well as adoption rates and status will be
reviewed. A comprehensive review of contingency theory in management accounting will
follow. The literature review will continue to inform issues throughout the project.
1.5.2 Data Collection
The survey undertaken comprised all firms listed in Business and Finance (2004)
Irelands Top 1000 Companies (the total number of companies listed were only 925). The
main reasons for choosing companies listed in Business and Finance Ireland are that they
are the top firms, and contact details are readily available. Moreover the top 1000 were
used in previous Irish surveys, and this will allow valid comparisons between the results.
The questionnaire used in this study, comprising 12 pages, was pretested to ensure the
suitability of the questions and to eliminate ambiguities. The questionnaire was sent with
a cover letter and a reply envelope. The cover letter was addressed to the
accounting/finance manger of each company as the person considered most likely to
understand the cost accounting systems and assumed to be the key person responsible for
decisions regarding ABC in the firm. A follow-up questionnaire was posted,
approximately five weeks after the first mail-out.

14
1.5.3 Data analysis
Quantitative data will be processed using a SPSS program, leading to appropriate
descriptive and inferential statistical analysis, including frequencies, means, standard
deviations, chi-square, t-test, Mann-Whitney and ANOVA tests. Cluster analysis will be
used to profile the companies according to the individually significant contingent factors.
1.6 Organisation of the study An overview of the remaining 10 chapters is provided below:
1.6.1 Chapter 2: ABC Introduction
In order to provide essential background to the following chapters, this chapter aims to
provide basic background material on the traditional and ABC systems. It will review the
nature of both systems, and will discuss the different approaches adapted by ABC and
TCS to the treatment of overhead costs, comparing both systems using Cooper’s (1988a)
examples.
1.6.2 Chapter 3: Empirical Findings Relating to ABC Implementation
This chapter reviews and analyses the findings of a number of studies regarding the
adoption of ABC systems in different countries. This chapter will review these studies
chronologically and will report ABC adoption rates, the benefits of adoption and the
difficulties of implementing the system. Information in this chapter will be used in
developing the research hypotheses in chapter 7.
1.6.3 Chapter 4: Technical issues in the Implementation of ABC System
The purpose of this chapter is to review the structured approach to ABC implementation,
which can be broken down into two major segments. The first segment covers design
choices that should be made before beginning implementation. Those choices define the

15
characteristics of the system that will emerge. The second major segment covers the steps
taken to implement an ABC system successfully. These steps help determine the actual
design of the system and how readily it will be accepted by staff. Given the purpose of
this chapter, it is intended to be predominantly descriptive rather than analytical.
1.6.4 Chapter 5: Contingency Theory and Management Accounting Design
This chapter aims to review the contingency theory of management accounting, providing
illustrations of the relationships between the contingent factors and the features of
management accounting systems. This chapter provides an essential background for
chapter 6 in developing the research model.
1.6.5 Chapter 6: A Model of ABC Adoption
This chapter reviews a series of contingent factors that may affect the decision to
implement ABC systems within Irish firms. It considers the evidence supporting such
variables, and based upon this consideration a “basic” contingency model of ABC
adoption is developed. This basic model is then extended to include the barriers and
difficulties to ABC adoption, which have been previously identified in Chapters 3. In this
chapter, seven contingency variables concerning the implementation of ABC systems are
developed.
1.6.6 Chapter 7: Research Methodology
The aim of this chapter is twofold: firstly to provide an overview of the research
philosophy and paradigms, research questions and research hypotheses that will be tested
in this study. This will be achieved by supporting each hypothesis with arguments that are
based upon the literature on the implementation of ABC and the literature on contingency
theory in management accounting.

16
The second aim is to give a detailed overview of several methodological issues related to
the analysis utilized in this research. This will include an introduction to the data
resources used, the study sample, the process of data collection, and an introduction to the
different statistical methods implemented. This chapter provides an essential introduction
for the following three chapters, 8, 9 and 10.
1.6.7 Chapter 8: Results, Findings and Discussion: Descriptive analysis
This chapter provides an initial analysis of the questionnaire data and presents the
univariable analysis of the data collected from each question of the survey. These results
are presented, question by question, in the sequence in which the questions appeared in
the questionnaire. The results are laid out under the headings of (i) responses to questions
asked of all companies, (ii) responses to questions by adopting companies, (iii) responses
to questions by companies currently considering ABC adoption, (iv) responses to
questions by companies who have rejected ABC and (v) responses to questions by
companies which have not considered ABC adoption.
1.6.8 Chapter 9: Bivariate Statistical Analysis
This chapter presents and discusses the results of the bivariable analysis of the underlying
relationships between independent variables (industrial sector, size, nationality, type of
competition, product diversity, cost structure, overhead expectation and business unit
culture) and levels of ABC adoption (implemented, under consideration, rejected and no
consideration).
Cross tabulations or contingency tables, Chi-square and Mann-Whitney will be used to
explore the relationships among these variables, and to identify whether there are any

17
statistically significant relationships between the contingent variables and the adoption of
ABC systems.
1.6.9 Chapter 10: Cluster Analysis
This chapter presents the findings of cluster analysis technique, which sorts cases
(companies) into groups, or clusters. A cluster is a group of relatively homogeneous cases
or observations, so that the degree of association is strong between companies of the
same cluster and weak between companies of different clusters. The statistical procedure
for identifying clusters will be achieved use SPSS software, and the Euclidean technique
will be used. Three clusters will be utilized in this study, each cluster describes, in terms
of the data collected, the characteristics of companies (size, number of products, cost
structure, marketing strategy and business unit culture) using descriptive statistics.
Moreover, an association between these clusters and ABC adoption status is provided.
1.6.10 Chapter 11: Evaluation of the Research Model
This chapter presents the results of the analysis conducted in previous chapters 8, 9 and
10, and shows how these results support the theoretical model developed in chapter 6 and
how they support each of the thirteen hypotheses posed in chapter 7. The chapter also has
sought to answer the two interrelated questions posed in chapter 7.
1.6.11 Chapter 12: Summary, Conclusion and Suggestions for Further Research
This chapter is designed to present conclusions and highlights the contributions of the
study, starting with a summary of the research questions. The chapter then discusses the
theoretical and methodological contributions of the research. Moreover, it suggests
potential avenues for further research. Finally, the closing remarks of the research are
summarised.

18
CHAPTER 2: ACTIVITY-BASED COSTING (ABC): REVIEW AND APPLICATION 2.1 Introduction Activity-Based Costing (ABC) is a method of cost analysis which, it is claimed,
constitutes a reliable system of providing accurate cost information (Cooper and Kaplan
1987, 1988a, 1988b; Cooper 1988a, 1988b, 1989; Turney 1996; Drury 2000, 2004).
Cooper and Kaplan (1991) argue that ABC offers a solution to the shortcomings
associated with traditional costing systems (TCS).
This chapter discusses the different approaches adopted by ABC and TCS to the
treatment of overhead costs, the limitations of the traditional system, and the claimed
advantages and benefits of ABC. Moreover, a comparison of both systems will be
illustrated by using Cooper’s (1988a) examples.
The rest of the chapter is organised as follows: Section 2.2 examines traditional costing
systems and the two stages allocation processes, moreover it considers the limitation of
the traditional systems. Section 2.3 introduces ABC as the key alternative to traditional
systems, illustrates the two-stage allocation process, examines the effect of varying
product volume and size on reported product cost and outlines the claimed benefits of
ABC system. The last section 2.4 summarises and concludes the chapter.

19
2.2 Traditional Costing Systems (TCS): Treatment of overheads
Volume-based systems (VBC), also known as conventional or traditional costing systems
(TCS), use measures of output volume (such as the number of output units, machine
hours, material costs, direct labour hours and direct labour cost) as the bases to allocate
(i.e. to assign a whole item of cost or of revenue, to a single cost unit, centre account or
time period, CIMA) indirect costs to cost objects (Johnson and Kaplan 1987; Cooper and
Kaplan 1988a). This section will outline the philosophy of the two-stage allocation
process used by traditional costing systems.
2.2.1 Purposes of cost allocation
It has been argued (Andersen 1995; Cooper and Kaplan 1998; Drury 2004) that cost
allocations are needed to value inventory for external reporting purposes, for planning
and monitoring the cost of activities and processes, and for various short term and long
term strategic decisions. Some examples include decisions to "make or buy" sub-
components and services, how to price products and services, when to add or discontinue
various products and services and when to expand or contract the size of a segment of the
company. Horngren et al. (2003) argue that cost allocations are also needed to support a
price when "cost-plus" pricing is used, as in government contracting, and in situations
where costs must be justified before reimbursement can be obtained.
2.2.2 Predetermined overhead rates
Hansen and Mowen (2000) state that since there are many types of manufacturing costs
that fall into the indirect category, (i.e., common or shared costs that cannot easily be
allocated to any particular product or job) some methods are needed to allocate or

20
apportion (i.e. to spread revenues or costs over two or more cost units, centers, accounts
or time periods, this may also be referred to as ‘indirect allocation’ CIMA-1996) these
costs to the products manufactured. A predetermined overhead rate (a means of
attributing overhead to a product or service, based for example on direct labour hours,
direct labour cost or machine hours, CIMA-1996) provides a way to accomplish this
system requirement.
2.2.3 The Two-Stage Allocation Process in Traditional Costing Systems Drury (2004) states that in order to establish departmental or cost centre overhead rates a
two-stage allocation procedure is required. Stage one is to assign overheads initially to
cost centres (departments), and in stage two allocate cost centre overheads to cost objects
(e.g. products) using second stage allocation bases.
Horngren et al. (2003) argue that applying the two-stage allocation process requires the
following four steps; assigning all manufacturing overheads to production and service
cost centres, reallocating the costs assigned to service cost centres to production cost
centres, computing separate overhead rates for each production cost centre and finally
assigning cost centre overheads to products or other chosen cost objects. Thus, steps one
and two comprise stage one and steps three and four relate to the second stage of the two-
stage allocation process.
Drury (2000) provides an illustration of the two-stage process for traditional costing
systems shown below:

21
Figure 2.1: Two-stage process for TCS
Direct costs
Source: Drury (2000:p.339).
The above figure shows the two stages allocation process under the traditional systems.
In the first stage, overheads are allocated or apportioned to cost centers (production and
service departments) based on the first stage allocation bases such as; floor area, number
of employees, book value of items of plant and machinery, labour hours, machine hours.
In addition, those overheads which are allocated or apportioned to service departments
must be reapportioned to production departments. In general, there are three methods for
reallocating service department costs to production departments, these include: the direct
method, the step-down or sequential method and the reciprocal method (Drury 2004).
Each method includes developing a set of equations to represent the relationships
involved and then solving the equations to generate the desired cost allocations. The
equations may be developed for each approach using the proportions of service that each
department uses, or using charging rates for each service department (Drury 2004).
Overhead cost accounts (For each individual category of expenses e.g. property taxes, depreciation etc)
Cost Centre
1 (normally
departments)
Cost objects (products, services and customers)
First stage allocations
Second stage allocations (Direct labour or Machine hours)
……
Cost Centre
2 (normally
departments)
Cost Centre
N (normally
departments)

22
In the second stage, the overhead costs which have been allocated and reallocated to the
cost centres (production departments) will be absorbed to cost objects (productions,
services, and customers) using a selected allocation bases. Most allocation bases relate to
the amount of time products spend in each production centre i.e. direct labour hours or
machine hours (Drury 2000). A conceptual view of the idea is presented in Exhibit 2.1
above. Usually, only one overhead rate is developed for each production department,
although the basis for these rates may differ between departments. The various producing
departments might use direct labour hours, or machine hours, as an allocation basis in the
second stage allocation process. In this approach, the allocation bases are almost always
related to production volume. Hansen and Mowen (2000) argue that the traditional
approach will provide accurate product costs if each production department produces (or
partially produces) a single product, or a few similar products, that consume all indirect
resources within a department in the same proportion and in proportion to the allocation
basis used. Hansen and Mowen (2000) state that for the system to be accurate, if Product
X consumes 20% of one indirect resource within a department, it must consume 20% of
all of the indirect resources within the department and the allocation basis must reflect
this percentage. Otherwise a single departmental rate will not provide accurate product
costs.
2.2.4 Limitations of Traditional Cost Systems
During the 1980s, critical attention focused on the limitations of TCS (Cooper and
Kaplan, 1991). Cooper and Kaplan (1987) argue that the major limitations of TCS arise
from the use of volume related bases in the second allocation stage, to assign costs from
cost centres to products. They state that this procedure may have been adequate decades
23
ago when direct labour was the principal value-adding activity in the material conversion
process.
That the criticism of TCS distorting product costs arose only during the mid-1980s was
not by chance, but because significant changes in production technology then made
costing distortion unavoidable in TCS. TCS was developed in the 1920s (Johnson and
Kaplan, 1987) when manufacturing companies were almost 99% labour intensive (Kidd,
1994) and production processes were very simple. As a result, most, if not all,
manufacturing overheads were structured with overtime premium, night premium,
worker’s compensation insurance such as disability insurance, payroll taxes and holiday
and vacation wages, all of these costs are associated with, or rather “incurred by”, direct
labour (Johnson and Kaplan, 1987). Therefore, a product consuming more direct labour
would incur proportionately more overheads. Because of a high correlation between
direct labour and manufacturing overheads, the all-in-one rate technique based on direct
labour of TCS achieved costing accuracy for these companies at that time. In a mass
production environment where production was at full capacity, production processes were
relatively simple and TCS made up the most sizable portion of manufacturing overheads.
Thus the correlation between resource consumption and production volume was very
high, as a result of that TCS provides inaccurate product costs because labour hours were
no longer the key variables (Johnson and Kaplan, 1987).
An alternative approach used in the traditional system, is provided by Variable or
Marginal costing, which overcame the arbitrary nature of allocation in the case of fixed
costs. Such a system concentrates on variable manufacturing costs, which are assigned to

24
products and included in the inventory valuation. Marginal costing is a costing method
that includes only variable manufacturing costs – direct material, direct labour, and
variable manufacturing overhead – in the cost of a unit of product, where on the other
hand fixed overhead costs are assigned to the period in which they are incurred .
Drury (2000) provides an illustration of the way marginal costing systems treat these
costs.
Figure 2.2: Variable costing system
Source: Drury (2000:p.356).
The above figure shows that variable costs – material, labour and variable manufacturing
overheads only –are included in the cost of a unit of product, and in the valuation of
finished goods stock. In contrast, fixed manufacturing overheads are treated as expenses
in the current period.
Cost
Non-manufacturing costs
Manufacturing costs
Material Labour Overhead
Variable overhead
Fixed overhead
Work in progress stock
Finished goods stock
Profit and Loss account

25
Cooper and Kaplan (1987) argue that the traditional academic recommendation in favour
of marginal costing may have made sense when variable costs (labour, material and some
overhead) were a relatively high proportion of total manufactured cost, and when product
diversity was sufficiently small. However, these conditions are no longer typical of many
of today’s organisations. Increasingly, overhead (most of it considered “fixed”) is
becoming a larger share of total manufacturing costs. Cooper and Kaplan (1987: 214)
conclude that “even if direct or marginal costing were once a useful recommendation to
management, it is likely that direct costing, even if correctly implemented, is not a
solution – and is perhaps a major problem – for product costing in the contemporary
manufacturing environment”.
Cooper (1987) argues that cost accounting has undergone few innovations. Practitioners
have developed an “if it ain’t broke, don’t fix it” mentality, and academics have paid little
attention to cost accounting. The major changes that had occurred – the increased use of
machine hour and material dollar costing – unfortunately did little to overcome the
limitations of the existing cost system designs. Cooper (1988a) states that traditional cost
systems do a poor job of attributing the expenses of the support resources to the
production. The product costs produced by such allocations as direct labour, materials
purchases, or unit produced are distorted because products do not consume most support
resources in proportion to their production volumes. Cooper (1987) adds that the
distortions in traditional costing systems are most severe in companies producing a
diverse product mix in the form of size or volume. Moreover, he argues that as overhead
has grown and new technologies have come, it goes without saying that assigning

26
overheads based on only 5 - 15% (the proportion of labour hours) of total costs is highly
risky.
Drury (2004) argues that today product lines and marketing channels have proliferated
due to the fact that companies produce a wide range of products. As a result, Cooper and
Kaplan (1988) state that direct labour represents a small fraction of corporate costs, while
expenses covering factory support operations, marketing, distribution, engineering, and
other overhead functions have exploded. Therefore, overhead allocations using a
declining direct labour base cannot be justified, particularly when information processing
costs are no longer a barrier to introducing more sophisticated cost systems (Drury 1996).
Cooper (1988b) identifies a number of factors that cause the distortions, resulting from
the use of traditional costing systems. These include production volume diversity, size
diversity, complexity diversity, material diversity and set-up diversity.
Mishra and Vaysman (2001) reason that while traditional costing systems are much less
expensive to implement, such systems can introduce considerable distortions in product
costing. They state that the product-mix, pricing, cost control, and other decisions made
by managers using these distorted cost numbers can then lead to severe long-run losses.
As a result, managers are encouraged to use the new approach to avoid such sub-optimal
decisions. When the correlation between manufacturing overheads consumption and
direct labour consumption declines, products with high direct labour content will not
necessarily incur proportionately more machine-related overheads or more material-
related overheads.
In fact, it is not possible for systems which use a single absorption/allocation base to
yield accurate cost information because no single factor can explain the variation and
27
consumption of the total overheads. In the hope of achieving “reliable” allocation of
manufacturing overheads, ABC emerged. ABC would seem to present an opportunity to
provide a better decision-making base for managers.
2.3 Development and Evolution of Activity-Based Costing (ABC)
Activity-Based Costing (ABC), Variance Analysis (VA) and Return on Investment (ROI)
are described by Johnson (1990) as the three most important management accounting
theories and innovations in the 20th century. ABC has enjoyed a decade of high profile
and asserted increasing popularity (Mitchell, 1994) to a large extent through the work of
Cooper and Kaplan. In the early 1980s, challenges to the ways in which cost information
was calculated and used were beginning to occur (Hicks, 1999). In 1988 Cooper and
Kaplan developed an alternative approach for assigning overheads to products and
computing product costs. Ning (2005) argues that the development and promotion of this
new approach to cost information have been stimulated and largely influenced by the
work of Cooper (1988a, 1988b), Johnson and Kaplan (1987), and Cooper and Kaplan
(1988a), as well as organisations like ‘Computer-Aided Manufacturing-International
(CAM-I)’ 1 , Institute of Management Accountants (IMA) and The Society of
Management Accountants of Canada (SMAC). These efforts have resulted in the
development of a body of knowledge that has come to be known as Activity-Based
Costing, or simply ABC (Hicks, 1999). Interest in ABC has developed as a solution to the
obsolescence and limitations of TCS. During the 1980s many companies began to realize
the adverse consequences of allowing their TCS to generate inaccurate costing
information (Cokins, 1999). Especially during the late 1980s, TCS practices were widely
1 CMA-I later was known as ‘Consortium for Advanced Manufacturing, International’.

28
recognized by academics to be unlikely to provide useful information for management
(Kaplan, 1984; Kennedy and Graves, 2001). While many lamented that costing practices
were lagging behind the contemporary manufacturing environment (Kaplan, 1984;
Johnson & Kaplan, 1987; Dunk, 1989), some claimed that TCS should be eliminated (e.g.
Kaplan, 1990). ABC is a management accounting process that allocates resource costs to
products or customers based on those activities which are the factors causing work and
incurring cost, used by the products or customers (O’Guin 1991; Turney 1996; Kaplan
and Atkinson 1998). ABC is generally a method of allocating indirect costs to cost
objects. Its counterpart is TCS. ABC differs from TCS by using “activities” as the
intermediary of allocation, i.e. the medium through which indirect costs are allocated to
cost objects. ABC is now used not only for production overheads cost allocation but also
for the allocation of non-production costs for purposes such as profitability analysis
(Turney 1996).
In fact, the use of ABC for management purposes has become so important and effective
that two other systems derived from ABC philosophy have been established, they are
Activity-Based Management (ABM) and Activity-Based Budgeting (ABB), (Cooper and
Kaplan 1998). Ning (2005) argues that the reason TCS became less useful in the 1980s
was that significant changes incurred in manufacturers’ product markets, production
technologies, and demand for control since the 1960s. During the 1980s, the situation of
the three systems became significantly different from what they had been the 1960s.
Changes in production technologies and demand for control were mainly caused by the
change in product market, which occurred since the 1960s and peaked in the 1980s. The

29
shift from TCS to ABC was a response to the changes in product market, production
technology, and demand for control (Ning, 2005).
2.3.1 The Two-Stage Allocation Process in ABC
Before providing an illustration of the two-stage allocation process for ABC, a general
comparison between ABC and TCS will be provided. Figure 2.3 below compares TCS
with ABC system. Both methods have differences not only in the nature of allocation
bases, but also in the number of allocation bases utilised to allocate costs in the second
stage. The TCS employs one of three commonly allocation bases, direct labour hours,
machine hours and material dollars, whereas ABC typically utilises multiple allocation
bases, such as set-up hours, number of times ordered, number of times handled and other
transaction-related bases (Cooper 1988a). Consequently, product costs based on ABC
system are claimed to have more accuracy than those of the TCS (Kaplan 1988; Cooper
1988b; Dugdale 1990; Innes and Mitchell 1991; Morrow 1992; Turney 1996; Krumwiede
and Roth 1997).
Figure 2.3: A comparison between TCS & ABC systems
Source: Cooper et al. (1992: p.9-10)
First First stage stage Second Second stage stage The TCS system The ABC system
Resources
Cost pools
Units of output
Resources
Activities
Units of output

30
Cooper et al. (1992) argue that ABC system comprises four basic steps: identifying
activities, assigning indirect costs to activities, identifying outputs and linking activity
costs to outputs. These basic steps can be combined into two stage process:
The first stage assigns all indirect costs to the activities in activity centres based on the
resources driver. At this stage (stage one) a cost hierarchy technique is utilized to
segregate the indirect costs into four categories (Cooper and Kaplan 1991; Cooper et al.
1992; Kock 1995, Horngren et al. 1997) as following:
Figure 2.4: Manufacturing cost hierarchy
The above diagram shows four manufacturing cost categories:
1. Unit-level activities: Costs are assigned to activities that act on each individual
unit of product or service, such as direct labour or materials.
2. Batch-level activities: Costs are assigned to activities associated with a group of
units of products, such as set-up costs, material movements or purchase orders.
Source: Horngren et al. (1997: p.150)
Output-Unit Level Costs
Batch-Level Costs
Product Sustaining Costs
Facility Sustaining Costs
Total Manufacturing Costs

31
3. Product –sustaining activities: Costs are allocated to activities which are
performed to support a specific product or service, such as process engineering,
product specifications or engineering change notices.
4. Facility-sustaining activities: Costs viewed as period costs, are assigned to
activities underpinning the organisation as a whole. Most of these activities are
administrative, and include things as diverse as plant management, security, taxes,
building and grounds maintenance, heating and lighting. Given that the facility-
sustaining activities are not based on product-related characteristics (product
quality, product complexity, product flexibility or production volume), Cooper
and Kaplan (1991), O’Guin (1991) and Adler (1999) argue that such activities
should not be viewed as part of a product basis.
In the second stage of the ABC process, indirect costs are assigned from activities to
products based on the products’ demand for these activities during the production
process. Cooper (1988b) states that ABC uses many second-stage bases to allocate costs
to the products; some of these bases are used to trace inputs whose consumption varies
directly with the number of items produced, while others are used to trace inputs whose
consumption does not vary with quantity. Therefore, ABC systems utilise a greater
number and variety of second stage cost drivers than used in traditional costing system.
Drury (2000) illustrates the two-stage allocation process for ABC as following:

32
Figure 2.5: Two stage-allocation process for ABC
Direct Costs
Source: Drury (2000: p.339).
The above exhibit shows the two-stage allocation process for ABC system, the first stage
focuses on determining the costs of activities within an organization. This stage of the
assignment process splits apart dissimilar resources, activities, and products within an
organization. Resource drivers trace the consumption of resources by activities, the work
performed in the company.
The second stage allocates activity costs to the products consuming the work performed,
by combining the costs of performing specific activities into cost centers at the activity
level. Activity drivers trace the activity costs to the products, or cost objects, consuming
the work performed in the organization.
Overhead cost accounts (For each individual category of expenses e.g. property taxes, depreciation etc)
Activity Cost centre
N
Activity Cost centre
2
Activity Cost centre
1
Cost objects (products, services and customers)
First stage Allocations (resource cost drivers)
Second stage allocations (Activity cost drivers)
……

33
Kaplan and Atkinson (1998) describe the procedures of using the two-stage allocation for
ABC as being quite simple to illustrate and even to implement in practice. Further, they
provide an example to demonstrate how a single resource category – indirect labour –
may be decomposed into six different performed activities and then, linked, via
appropriate activity cost drivers, to cost objects such as products, services and customers.
This is illustrated in the following exhibit 2.6:
Figure 2.6: Decomposition of indirect cost into activities
… … … …
Source: Kaplan and Atkinson (1998: p.210).
The above exhibit shows the structure of an ABC system for factory operations. At first
stage, the ABC system appears quite similar to the traditional cost system described in the
Indirect Labour
Prepare Tooling
Set-up
Machines
Maintain Machines
Move
Materials
Inspect
Incoming Materials
No. of Receipts (uncertified Materials)
No. of Moves (or No. of Set-ups)
Maintenance Hours
Set-up Hours
No. of Set-ups
$/Receipts $/Moves $/Maintenance Hour
$/Set-up Hour
$/Set-up
Resource
“Resource Drivers”
Activity
“Activity Cost Driver”
Product/ Services/ Customers

34
first section of this chapter. But the underlying structure and concept are very different.
At the heart of all ABC systems lie two critical assumptions. First, resources are
consumed only by the performance of activities, and second, activities are performed to
produce outputs. Cooper and Kaplan (1998) state that these are robust assumptions, the
first one is violated only by resources that decay over time so that no activity can be
traced to the consumption of the depleting resource. However, by including time-based
depreciation in the ABC system, this limitation can be overcome. The second assumption
is violated when resources are supplied but not used; that is by supplying committed
resources in excess of actual demands (Cooper and Kaplan, 1998).
Innes and Mitchell (1993) view ABC as a system that overcomes some of the systematic
inaccuracies of the existing cost systems and promoted it as a considerable improvement
on what had gone before. They also argue that ABC has provided a basic methodology
which permits cost information to be attached not simply to the product as the cost object
but also to the customer. Activity-based costing systems have become the accepted
remedy for the significant limitations of traditional cost accounting systems (Mishra and
Vaysman 2001).
Mishra and Vaysman (2001) argue that the information derived from ABC can empower
managers to make better operating decisions.
Cooper and Kaplan (1988a) describe ABC as a system that can paint a picture of product
costs radically different from data generated by traditional systems. These differences
arise because of the systems more sophisticated approach to attributing factory overhead,

35
corporate overhead, and other organisational resources, first to activities and then to the
products that create demand for these indirect resources.
Euske and Alan (2007) provide an enhanced model of the ABC Cross that presents a
more robust representation of the interaction of process and costing that is the core of
ABC and most other cost-measurement systems. Euske and Alan argue that the ABC
Cross based on the CAM-I, has come to exemplify the decision by management
accountants in the latter part of the last century to address the mismatch of cost and
management accounting systems with production systems. Euske and Alan (2007)
developed the more complex model by addressing issues of simplification that helped
make the original ABC cross useful, these models includes; upside-down model, end-to-
end process, bidirectional data and decision flows and capacity measurement model, all
of the above models would help both process and functional managers across the
organisation. They conclude that if the models are a subset of an integrated ABC models,
the related decisions will have a higher probability of working in concert.
2.3.2 The Effect of product Volume and Size on reported product cost
In 1988, Cooper explored the effect of diverse volume and size of products on reported
product costs by comparing the TCS with the ABC system. He found that the former,
which is based on volume of product-unit, distorts product costs, where product diversity
in the form of size or volume exists. Cooper also explored the ability of volume-based
and activity-based cost systems to assign product costs precisely when the numbers of
products manufactured are different. He found that the traditional cost system could not
generate such accurate unit costs when products differ by volume since it overlooks the

36
difference in input consumption of overhead resources. In his examination of the ability
of both systems to assign product costs when products have diversity of size, Cooper
argues that “a simple volume-related allocation base cannot capture the complexity of the
relationship between volume and lot or order size” (p.46). The product costs reported by
the ABC system are more accurate than those by the TCS in many situations, including
diversity of product size or volume. Cooper (1988a) illustrates a simple ABC system by a
series of examples to explain and clarify the effect of varying product volume and size on
reported product costs by traditional systems and ABC.
For example, Company A manufactures four products: P1, P2, P3 and P4. All are
manufactured on the same equipment and using similar processes. The characteristics of
each product are summarised in figure 2.7 below.
Figure 2.7: Characteristics of products
Source: Cooper (1988: p.46)
Source: Cooper (1988a): p.46)
Company A allocates costs to the products by means of direct labour hours. The quantity
and dollar value of each input by product, as well as the allocation of overhead costs by
both the traditional cost system and ABC, are presented in Figure 2.8 below.
Product quantity Material Direct labour Machine per year $ per unit hours per unit hours per unit P1 10 6 0.5 0.5 P2 100 6 0.5 0.5 P3 10 18 1.5 1.5 P4 100 18 1.5 1.5 Size of product Small Large
Volume Low P1 P3
High P2 P4

37
Figure 2.8: Product costing data for company A
Annual input consumption patterns and Dollar value by product Product Material Direct Machine No. of No. of No. of No. of Total ($) labour hours times orders times part overhead hours set up handled numbers costs P1 60 5 5 1 1 1 1 P2 600 50 50 3 3 3 1 P3 180 15 15 1 1 1 1 P4 1800 150 150 3 3 3 1 Units Consumed 2,640 220 220 8 8 8 4 Dollar Value ($) 264 2,200 3,300 960 1,000 200 2,000 $ 9,924 Overhead Costs Reported by Volume-Based Cost System Overhead consumption Reported overhead costs Intensity Direct Overhead Reported Labour traced unit cost Dollar value $9.924.00 Consumption intensity $ 45.11 - Units consumed 220 Direct labour hours Consumption intensity that P1 consumes 5 per direct labour hour $ 45.11 Costs traced (P1) $ 225.55 $ 22.55 Direct labour hours that P2 consumes 50 Costs traced (P2) $ 2,255.50 $ 22.55 Direct labour hours that P3 consumes 15 Costs traced (P3) $ 676.65 $ 67.66 Direct labour hours that P4 consumes 150 Costs traced (P4) $ 6,766.50 $ 67.66 Overhead Costs Reported by an ABC System Direct labour No. of times No. of part Hours set up numbers Total $ 5,764.00 $ 2,160 $ 2,000 Units consumed 220 8 4 Consumption intensity $ 26.20 $ 270 $ 500 Reported Overhead Costs Direct No. of time No. of part Overhead Reported Difference labour set up numbers traced unit cost from existing (%) Cons Intensities $ 26.20 $ 270 $ 500 - - - Product P1 consumes 5 1 1 Costs traced $ 131.00 $ 270 $ 500 $ 901 $ 90.10 299.55 Product P2 consumes 50 3 1 Costs traced $ 1,310.00 $ 810 $ 500 $ 2,620 $ 26.20 16.18 Product P3 consumes 15 1 1 Cost traced $ 393.00 $ 270 $ 500 $ 1,163 $ 116.30 71.88 Product P4 consumes 150 3 1 Costs traced $ 3,930.00 $ 810 $ 500 $ 5,240 $ 52.40 - 22.55 Source: Cooper (1988a: p.46-47)

38
Figure 2.8 above shows that the unit costs of large products (P3 and P4) in the Volume-
based cost system are three times higher than those of small products (P1 and P2). This is
due to the fact that the large products consume three times the number of direct labour
hours as the small products. The unit costs of same size products (the small products P1
and P2 and the large products: P3 and P4) are the same. This is because they consume the
same number of direct labour hours. In fact, the numbers of P2 and P4 (the high-volume
products) produced are ten times those of P1 and P3 (the low-volume products). In this
scenario, a low-volume product manufactured once a year is ordered and handled once
and a high-volume product produced three times a year is ordered and handled three
times. Therefore, the same unit cost of products in the similar sizes and varying volumes
by volume-related allocation base are misrepresented (Cooper 1988a). Moreover, exhibit
2.8 reports the overhead costs handled by the ABC system. When cost drivers, including
the number of set-ups, orders, and time handled, are perfectly correlated, the cost of these
activities can be collected in a single cost pool (Cooper 1988a). Volume-related costs,
consisting of material costs, direct labour costs and machine-related costs, are still
assigned to products by using direct labour hours. Thus, the unit costs of products
reported by the ABC system differ from those by the volume-based cost system.
Cooper (1988a) explores the ability of volume-based and ABC systems to assign product
costs precisely when the numbers of products manufactured are different. He finds that
the volume-based cost system could not generate accurate unit costs when products differ
by volume since this system overlooks the differences in input consumption of overhead
resources. He supports his argument by providing an example of Company B which
produces two small products (P1 and P2). P1 is a low-volume product and P2 is a high-

39
volume product. Both are manufactured on the same equipment and by similar processes.
The quantity and dollar value of the input by product, as well as the allocation of
overhead costs reported by both the traditional cost system and the ABC, are presented in
figure 2.9 below.

40
Figure 2.9: Product costing data for company B
Annual input consumption patterns and Dollar value by product Product Material Direct Machine No. of No. of No. of No. of Total ($) labour hours times orders times part overhead hours set up handled numbers costs P1 60 5 5 1 1 1 1 P2 600 50 50 3 3 3 1 Units Consumed 660 55 55 4 4 4 2 Dollar Value ($) 66 550 825 480 500 100 1000 $ 3,521 Overhead Costs Reported by Volume-Based Cost System Overhead consumption Reported overhead costs Intensity Direct Overhead Reported Labour traced unit cost Dollar value $3,521.00 Consumption intensity $ 64.02 - Units consumed 55 Direct labour hours Consumption intensity that P1 consumes 5 per direct labour hour $ 64.02 Costs traced (P1) $ 320.10 $ 32.01 Direct labour hours that P2 consumes 50 Costs traced (P2) $ 3,201.00 $ 32.01 Overhead Costs Reported by an ABC System Overhead consumption intensities Direct labour No. of times No. of part Hours set up numbers Total $ 1,441.00 $ 1,080 $ 1,000 Units consumed 55 4 2 Consumption intensity $ 26.20 $ 270 $ 500 Reported Overhead Costs Direct No. of time No. of part Overhead Reported Difference labour set up numbers traced unit cost from existing (%) Cons Intensities $ 26.20 $ 270 $ 500 - - - Product P1 consumes 5 1 1 Costs traced $ 131.00 $ 270 $ 500 $ 901 $ 90.10 181.48 Product P2 consumes 50 3 1 Costs traced $ 1,310.00 $ 810 $ 500 $ 2,620 $ 26.20 -18.15 Source: Cooper (1988a: p.49)

41
Company C produces two large products, P3 and P4, P3 is produced in low volume while
P4 is produced in high volume. Figure 2.10 below shows the details on product costing
data for company C. The three companies (A, B and C) produce the same products using
the same manufacturing process. The unit costs of companies B and C reported by
volume-based system differ from those of company A, whereas the unit costs of all
companies (A, B and C) by the ABC systems are the same. A comparison of product
costing data of all three companies shows that the ABC system is able to accurately trace
overhead costs when products are manufactured in varying volumes.
Cooper (1988a) examines the ability of both systems to assign overheads when products
contain diversity in size. Figure 2.11 below presents the details on product costing data
for company D, which produces two products (P1 and P3) in low volume. P1 is a small
product while P3 is a large product. Both are manufactured on the same equipment using
similar processes. Exhibit 2.12 shows the details on product costing data for Company E,
which manufactures two products (P2 and P4) in high volume. P2 is a small product
whereas P4 is a large product. All three companies (A, D and E) manufacture the same
products using the same manufacturing processes in the same volume.
Similar to companies B and C, the unit costs of companies(D and E) reported by the
volume-based system differ from those of Company (A) while the ABC system reports
the same product costs of all three companies (A, D and E).
Cooper (1988a) concludes that a simple volume-related allocation base cannot capture the
complexity of the relationship between volume and lot or order size. The product costs
reported by the ABC system are more accurate than those by the traditional volume-based
system in many situations, including diversity of product volume or size.

42
Figure 2.10: Product costing data for company C
Annual input consumption patterns and Dollar value by product Product Material Direct Machine No. of No. of No. of No. of Total ($) labour hours times orders times part overhead hours set up handled numbers costs P3 180 15 15 1 1 1 1 P4 1,800 150 150 3 3 3 1 Units Consumed 1,980 165 165 4 4 4 2 Dollar Value ($) 198 1,650 2,475 480 500 100 1000 $ 6,403 Overhead Costs Reported by Volume-Based Cost System Overhead consumption Reported overhead costs Intensity Direct Overhead Reported Labour traced unit cost Dollar value $6,403.00 Consumption intensity $ 38.81 - Units consumed 165 Direct labour hours Consumption intensity that P3 consumes 15 per direct labour hour $ 38.81 Costs traced (P3) $ 582.15 $ 58.21 Direct labour hours that P4 consumes 150 Costs traced (P4) $ 5,821.15 $ 58.21 Overhead Costs Reported by an ABC System Overhead consumption intensities Direct labour No. of times No. of part Hours set up numbers Total $ 4,323.00 $ 1,080 $ 1,000 Units consumed 165 4 2 Consumption intensity $ 26.20 $ 270 $ 500 Reported Overhead Costs Direct No. of time No. of part Overhead Reported Difference labour set up numbers traced unit cost from existing (%) Cons Intensities $ 26.20 $ 270 $ 500 - - - Product P3 consumes 15 1 1 Costs traced $ 393.00 $ 270 $ 500 $ 1,163 $ 116.30 99.80 Product P4 consumes 150 3 1 Costs traced $ 3,930.00 $ 810 $ 500 $ 5,240 $ 52.40 -9.98 Source: Cooper (1988a: p.50)

43
Figure 2.11: Product costing data for company D
Annual input consumption patterns and Dollar value by product Product Material Direct Machine No. of No. of No. of No. of Total ($) labour hours times orders times part overhead hours set up handled numbers costs P1 60 5 5 1 1 1 1 P3 180 15 15 1 1 1 1 Units Consumed 240 20 20 2 2 2 2 Dollar Value ($) 24 200 300 240 250 50 1,000 $ 2,064 Overhead Costs Reported by Volume-Based Cost System Overhead consumption Reported overhead costs Intensity Direct Overhead Reported Labour traced unit cost Dollar value $2,064.00 Consumption intensity $ 103.20 - Units consumed 20 Direct labour hours Consumption intensity that P1 consumes 5 per direct labour hour $ 103.20 Costs traced (P1) $ 516.00 $ 51.60 Direct labour hours that P3 consumes 15 Costs traced (P3) $ 1,548.00 $ 154.80 Overhead Costs Reported by an ABC System Overhead consumption intensities Direct labour No. of times No. of part Hours set up numbers Total $ 524.00 $ 540 $ 1,000 Units consumed 20 2 2 Consumption intensity $ 26.20 $ 270 $ 500 Reported Overhead Costs Direct No. of time No. of part Overhead Reported Difference labour set up numbers traced unit cost from existing (%) Cons Intensities $ 26.20 $ 270 $ 500 - - - Product P1 consumes 5 1 1 Costs traced $ 131.00 $ 270 $ 500 $ 901 $ 90.10 74.61 Product P3 consumes 15 1 1 Costs traced $ 393.00 $ 270 $ 500 $ 1,163 $ 116.30 -24.87 Source: Cooper (1988a: p.52)

44
Figure 2.12: Product costing data for company E
Annual input consumption patterns and Dollar value by product Product Material Direct Machine No. of No. of No. of No. of Total ($) labour hours times orders times part overhead hours set up handled numbers costs P3 600 50 50 3 3 3 1 P4 1,800 150 150 3 3 3 1 Units Consumed 2,400 200 200 6 6 6 2 Dollar Value ($) 240 2,000 3,000 720 750 150 1000 $ 7,860 Overhead Costs Reported by Volume-Based Cost System Overhead consumption Reported overhead costs Intensity Direct Overhead Reported Labour traced unit cost Dollar value $7,860.00 Consumption intensity $ 39.30 - Units consumed 200 Direct labour hours Consumption intensity that P2 consumes 50 per direct labour hour $ 39.30 Costs traced (P2) $ 1,965.00 $ 19.65 Direct labour hours that P4 consumes 150 Costs traced (P4) $ 5,895.00 $ 58.95 Overhead Costs Reported by an ABC System Overhead consumption intensities Direct labour No. of times No. of part Hours set up numbers Total $ 5,240.00 $ 1,620 $ 1,000 Units consumed 200 6 2 Consumption intensity $ 26.20 $ 270 $ 500 Reported Overhead Costs Direct No. of time No. of part Overhead Reported Difference labour set up numbers traced unit cost from existing (%) Cons Intensities $ 26.20 $ 270 $ 500 - - - Product P2 consumes 50 3 1 Costs traced $ 1,310.00 $ 810 $ 500 $ 2,620 $ 26.20 33.33 Product P4 consumes 150 3 1 Costs traced $ 3,930.00 $ 810 $ 500 $ 5,240 $ 52.40 -11.11 Source: Cooper (1988a: p.53)

45
2.3.3 The Benefits of ABC
It is claimed that ABC provides many significant benefits over traditional costing
systems, such as enhanced product cost accuracy, more comprehensive cost information
for performance measurement, more pertinent data for management decision-making,
increased potential for sensitivity analysis, and a model for value-adding organisational
transactions and activities (Bhimani and Pigott 1992; Chung et al. 1997).
Clarke et al. (1999), whose study concentrated on ABC in Irish manufacturing
companies, found that respondents were more satisfied on every dimension of ABC than
they anticipated. 54% of respondents perceived more accurate product costing would
result from ABC, while 46% of respondents perceived that ABC would lead to improved
cost control and management. The study also outlines many other benefits of using ABC
including improved insight into cost causation and behaviour, better performance
measures, more accurate customer profitability analysis and positive behavioural impact
on employees.
Innes and Mitchell (1991), Shim and Stagliano (1997), Booth and Giacobbe (1997) and
Chung et al. (1997), argue that ABC is a significant source of information for decision-
making about product costs and product-line profitability. Kaplan (1990) and Johnson
and Kaplan (1987) also claim that accurate product costs are critical to pricing decisions,
new product introductions, decisions to drop out-of-date products as well as decisions on
how to respond to the products of competitors correctly and on time. This is because
product costs identify causes of resource consumption and ways of saving resources,
especially at the product and process design stage (Morrow 1992).
46
Innes and Mitchell (1991) argue that ABC provides more relevant product costs leading
to more accurate costs reflecting total overhead costs associated with the product. They
also indicate that ABC is providing better product and pricing strategies through the
availability of more realistic information on product profitability.
It is also claimed that ABC information is useful for managers in the processes of
budgeting and performance measurement, (Kaplan, 1990; O’Guin, 1991, and Innes and
Mitchell, 1995, 1998). Activity-Based Budgeting (ABB) has been developed from the
basic framework of ABC (Brimson and Foster, 1991). Morrow (1992) adds that ABB
provides links between the activities, the organisational actions and the resources
consumed.
Mitchell (1994) states that at the stage of actually setting budgets, an ABC framework has
several benefits such as, the availability of measures of activity outputs (cost driver
volumes) provides an indication of service level volumes, thus providing a starting point
for negotiations on the resource requirements of each activity. Furthermore, variance
information will be produced for each activity which locates over and under spends
firmly in the region where responsibility and cause should be identifiable.
Several studies (Innes and Mitchell 1995; Bailey 1991; Nicholls 1992; Adler et al. 2000;
Sartorius et al. 2007) report that the key areas of ABC benefits are cost control and cost
reduction, as well as improved profitability. Turney (1996) argues that in cost-reduction
analysis, ABC does not decrease cost, but that cost can only be diminished by changing
the activities performed and by redeploying the redundant resources, such as reducing the

47
time to set up a machine or removing unnecessary activities. Cost analysis of ABC leads
to operational improvement opportunities and increased profitability (Kaplan 1992).
ABC helps management to view the organisation by understanding the activities, their
cost and how they link together to form a simple chain of value-creating activities for a
business (Morrow and Ashworth, 1994). Principally, Porter’s work (1985) identifies the
value chain, which is the linked set of value-creating activities from raw material
sourcing to the final product or service being delivered to the customer. Horngren (1995)
argues that ABC has emphasized that product costs are affected by all activities in the
value chain, not just by manufacturing activities alone. Therefore, costs are incomplete
measures of produce costs for decision-making.

48
2.4 Summary and Conclusion This chapter illustrates the traditional costing systems (TCS) and Activity-Based Costing
systems (ABC) by explaining the two stage allocation processes for allocating overheads
to cost objects. The chapter shows that two sets of production costs are at work, direct
costs which can be specifically and exclusively identified with a given cost object, hence
they can be accurately traced to cost objects. Indirect and support costs which cannot be
directly traced to a cost object, therefore assigned to cost objects using cost allocations.
The following chart illustrates the different between direct and indirect costs and their
linkage to the cost objects.
Figure 2.13: Direct and indirect costs Cost tracing Cost allocations
The chapter also shows that both TCS and ABC systems have similar frameworks but
they have differences in the allocation of indirect costs. Under TCS the indirect and
support costs are allocated to production and service departments and then reallocated the
cost of service departments to production departments. The second stage is to calculate
the overhead absorption rate by using a few bases that are proportional to the volume of
product-units produced such as labour and machine hours.
Direct costs
Indirect costs
TCS systems
ABC systems
Costs objects

49
In ABC, activities are the focus of the costing process. Indirect costs are allocated from
activities to products based on the products demands for these activities during the
production process. The allocation bases used in ABC are thus measures of the activities
performed. These might include such activities as set-up time or number of times
handled. Not only is the nature of allocation base used by ABC different but the number
of allocation bases used to assign costs in the second stage is also different. Where a
traditional system may use up to three second stage allocation bases (direct labour hours,
machine hours and value materials used are the most common) an ABC makes use of
many bases including such bases as set-ups, items ordered, number of times moved,
amongst others.
Three major differences between ABC and TCS have been identified by a number of
authors e.g. (Cooper 1988a, 1988b, Kaplan 1990, Drury 1996, 2000 and Hicks 1999),
these are (1) In traditional costing systems, it is assumed that cost objects consume
resources, whereas in ABC it is assumed that cost objects consume activities, (2)
traditional costing systems employ volume – related allocation bases, while ABC uses
‘drivers’ at various levels, and (3) a traditional costing system is structure-oriented,
whereas ABC is process-oriented.
The chapter also covers the examples of Cooper (1988a) and reports the effect of diverse
volume and size of products on reported product costs by comparing the TCS with the
ABC system. The results indicate that TCS distorts product costs, where product diversity
in the form of size or volume exists, and that TCS could not generate accurate unit costs

50
when products differ by volume since it overlooks the difference in input consumption of
overhead resources.
Even though ABC systems seem to be superior to traditional costing systems in terms of
accuracy of cost measurement they might be costly to implement and operate. However,
ABC has attracted a considerable amount of interest because it provides not only a basis
for calculating more accurate product costs, but also a mechanism for managing costs.
In the following chapter, the empirical studies related to ABC implementation are briefly
reviewed first to show the ABC adoption status, the benefits of ABC and the barriers to
adopting ABC.

51
CHAPTER 3: EMPIRICAL FINDINGS TO ABC IMPLEMENTATION
3.1 Introduction Chapter 2 has considered the different approaches adopted by ABC and TCS to the
treatment of overhead costs, the limitations of the traditional system, and the claimed
advantages and benefits of ABC.
The essence of the ABC paradox is that if ABC has demonstrated benefits, why then, is it
not actually employed by a gradually increasing number of companies? (Innes et al.
2000). A plethora of parameters have been tested in the literature in order to explain this
paradox (Cobb et al., 1992; Shields 1995; Bjornenak 1997; Foster and Swenson 1997,
McGowan and Klammer 1997; Friedman and Lyne 1999; Anderson and Young 1999;
Brown et al., 2004, Sartorius et al. 2007).
This chapter presents an analysis of the results of a number of studies regarding the
implementation of ABC systems in different countries. The chapter will review these
studies chronologically and report the ABC adoption rates, the benefits and the
difficulties of implementing the system.
The organisation of the rest of the chapter is as follows: section 3.2 reviews a number of
questionnaire surveys on the implementation of ABC systems. Section 3.3 presents a
number of case studies on the implementation of ABC, and the last section contains the
conclusion of the chapter.

52
3.2 Surveys conducted on the implementation of ABC systems This section reviews chronologically the surveys conducted in a number of countries on
the implementation of ABC systems. The findings of these surveys will be presented
under three main headings - where possible - the adoption rates of ABC, the benefits
derived from the implementation of ABC and finally the reasons and difficulties of not
implementing the system.
Innes and Mitchell (1995) used the results of a 1994 survey of ABC in the U.K’s’ largest
1000 companies. The survey was based on a postal questionnaire to those companies
listed in the Times 1000 (1994), and sent to the top 1000 non-financial companies plus
the top 60 financial companies and mutuals (investment management firms were
excluded). A 33.2% usable response rate was achieved. In relation to the ABC adoption
rates, the findings reported that 21% of respondents were using ABC, 29.6% were
considering ABC adoption, 13.3% had rejected ABC after assessment and 36.1% were
not considering the adoption of ABC. Regarding the benefits and the applications of
ABC, the results indicate that ABC had a positive impact which covers all of the core
management accounting areas of stock valuation, decision making, control and
performance measurement and assessment. In addition, cost reduction and cost control
applications of ABC had proved to be particularly popular among U.K’s ABC adopters.
With respect to the reasons and difficulties for not adopting and implementing the
system, the study did not examine or investigate these factors.
Bjornenak (1997) conducted a questionnaire survey on the diffusion of ABC in Norway.
The questionnaires were sent to 132 large Norwegian manufacturing companies. A
53
response rate of 57% (75 companies) acceptable questionnaires was achieved. In total, 30
companies (40%) had adopted the system, 23 companies (31%) were classified as non-
adopters, and 22 companies (29%) were classified as being without ABC knowledge. The
study examines the variables that influence the adoption of the ABC systems, and the
results indicate that a range of variables relating to cost structure, competition, and
product diversity were associated with ABC adoption, whereas firm size did not
significantly discriminate between adopters and non-adopters.
Nguyen and Brooks (1997) conducted a survey in the State of Victoria in Australia. The
questionnaires were sent to 350 Australian manufacturing companies and resulted in 120
useable responses which represent a response rate of 34%. The results report that only
12.5% (15 companies) had adopted ABC, 2.5% (3 companies) rejected the
implementation of the ABC, 8.3% (10 companies) indicated that they intended to adopt
ABC in the future, and the remaining 76.7% (92 companies) did not plan to implement
ABC. The findings of the study show significant differences between companies adopting
ABC and those not adopting ABC in relation to production complexity, firm size and
level of competitive intensity, while no significant differences in relation to the
proportion of overhead costs in total manufacturing costs and product diversity were
found.
Clarke et al. (1999) report the results of a 1995 survey which was based on a mailed
questionnaire. The mail questionnaire was sent to the 511 manufacturing firms in the
Business & Finance (1995) listing of Irelands’ Top 1000 companies. The questionnaire
was addressed to the chief management accountant in each company. A total of 204
(40%) usable responses were included in the analysis. In relation to the ABC

54
implementation rate, the findings were that 12% (24 companies) were using ABC, 20%
(42 companies) were currently assessing ABC, 13% (26 companies) had rejected ABC,
and 55% (112 companies) had not considered ABC. The study also reports the perceived
benefits of ABC. In general, more accurate cost information for product costing and
pricing, improved cost control and management, and improved insight into cost causation
and behaviour were the main perceived benefits of ABC. Furthermore, the findings
indicate other benefits such as, better performance measures, more accurate customer
profitability analysis, and positive, behavioural impact on employees. Regarding the
difficulties and problems with implementing ABC, the study reports that difficulties in
assigning costs to activities, difficulties in identifying and selecting cost drivers,
inadequate computer software, and difficulties in defining distinct activities were the
most common perceived problems when adopting and implementing ABC among Irish
manufacturing companies, followed by lack of adequate resources, difficulties in selling
the concept of ABC to managers, and lack of internal expertise.
Groot (1999) reports the results of two similar surveys, the first survey was conducted in
1994 among 564 food manufacturers, retailers, distributors and brokers in the United
States. The survey was designed to identify the number of companies using ABC and to
investigate the experiences they had in using ABC systems. In this survey, 96 usable
responses (17%) were obtained. The second survey was conducted in 1995 among 480
food manufacturers and retailers in the Netherlands. In this survey, 117 (24.4%) usable
responses were obtained from companies representing all food sectors in the Netherlands.
Since the U.S survey had already been designed and conducted, the Dutch survey was
developed to address most of the questions in the U.S questionnaire. In relation to the

55
percentage of ABC users, the results of both surveys indicate that the implementation rate
in the Dutch and in the U.S sample was less than 20% in each case. Table 3.1 below
shows more details as following:
Table 3.1: Use of ABC by US & Dutch firms
U.S. FIRMS DUTCH FIRMS CATEGORIES N % N %
Currently using ABC Conducting a pilot study Planning a pilot study Decided not to use ABC Total
17 14 42 23 96
17.7% 14.6% 43.8% 23.9% 100.0%
14 4 25 74 117
12.0% 3.4% 21.4% 63.2% 100.0%
Source: Tom Groot (1999:54).
The above table shows that the percentages of ABC users in the two countries (U.S and
Dutch) do not differ significantly (18% to 12% respectively). However, a significant
difference does exist in the number of companies which decided not to use ABC, the
findings show that 63% of Dutch firms decided not to use ABC, as compared to 24% in
the U.S. sample. Regarding the benefits derived from the use of ABC information by U.S
and Dutch food companies, the findings indicate that the most important purposes for
which ABC information is used lies in calculating the product profit margin, in
improving production processes, and in evaluating the performance of production units.
Less important purposes concern decisions on sales price, product mix and client mix.
U.S. companies made similar use of ABC information as did Dutch firms. In relation to
the reasons given by Dutch and American food producers for not using ABC, the results
indicate that selecting cost drivers and identifying activities were the main issues
encountered during the implementation of the ABC, followed by unfamiliarity with ABC,
lack of time and other high priorities.
56
Cinquini et al. (1999) conducted an empirical survey of cost accounting practices in a
sample of large and medium size firms in Italy. The questionnaire was sent to 1194
Italian companies, which were selected from a CD-ROM company information database
of the Italian National Association of Chambers of Commerce. The questionnaire was
addressed to the controller in each company. A total of 132 (11.6%) usable responses
were included in the analysis of the study. Regarding the adoption rate of ABC, the
findings indicate that 10% of the companies in the sample had already implemented
ABC, 47% of respondents claimed that they had never considered the adoption of ABC.
The findings also reveal that 27% of respondents had a favourable position toward ABC
or assert to having the intention to implement the system. The remaining respondents
(16%) had made the decision not to introduce ABC. The study neither reviews the
benefits of implementing ABC, nor examines the difficulties of adopting the system.
Innes and Mitchell (2000) report the results of a 1999 survey which mirrored the design
of the 1994 study reported in Innes and Mitchell (1995). The survey sought to determine
and assess the nature and significance of changes during the 5 years period in ABC
adoption rates and patterns of use in the U.K. The questionnaire was sent to the top 1000
U.K’s’ companies. A usable response rate of 22.9% was achieved. In relation to the
adoption rate, the findings reveal that the proportion of ABC users and those currently
considering its use had fallen to 17.5% and 20.3% respectively from 21.0% and 29.5% in
1994. Moreover, the results report a slightly higher proportion claiming to have rejected
ABC after assessment (15.3% as against 13.3% in the 1994 survey). In addition, an
increase in the rate of those companies which had not considered the adoption of ABC
accrued in 1999 (46.9% compared with 36.1% in 1994). With respect to the ABC
57
benefits, the findings indicate that the major perceived benefits included improvement in
product cost/profitability information, better cost control information, knowledge of
customer profitability, superior decision-making information and improvements in
performance measurements. Regarding the reasons and difficulties of those respondents
not currently using ABC, the results were divided into three groups. The first group
includes those who rejected ABC after assessment (n=27), the respondents justified their
explicit rejection of ABC on the basis of its administrative and technical complexity and
its need for new systems continuously generating activity data. Other reasons included
small product line variety, and low overhead costs. The second group consists of those
who where still considering ABC (n=36). Their views on factors constraining ABC
adoption were primarily based on the costly demands that ABC development would place
on staff and other resources. In addition, the results indicate that the need to address
difficult technical issues, such as the identification of cost drivers, and the need to
provide accurate cost apportionment, and behavioural problems, such as changing well-
established practice and employee suspicion about the motives for using ABC were the
main problems of the system. The last group includes those who had not considered ABC
(n=83). The most common reasons given for not considering ABC were its lack of
relevance/suitability to the respondents’ business, the existence of a cost management
system that operated satisfactorily, and the lack of top management support.
Chongruksut (2002) conducted a mail questionnaire survey among firms listed on the
Stock Exchange of Thailand (SET) that operate in the Bangkok region. One of the aims
of this study is to examine the adoption of ABC by firms based in Thailand, and to
investigate the benefits, reasons and difficulties for not adopting ABC systems. A total of
58
292 questionnaires were sent to the accounting/finance managers. 101 questionnaires
were usable and represent a response rate of around 35%. In relation to the ABC adoption
rate, the findings indicate that 11.9% (12 firms) had already adopted the ABC, 2% had
rejected adoption, and around 23% of respondents were intending to adopt ABC. The
highest percentages of the responses 63% (64 firms) had no plans to adopt ABC and
some of them had no knowledge of ABC. Regarding the benefits of ABC
implementation, the results of the study indicate that ABC provides more accurate
product/service costs, improves cost control, provides better performance measurement
and encouragement of commitment to quality and continual improvement. In addition,
ABC increases the effectiveness of budgeting by identifying the cost performance
relationship of different service levels, provides assistance in cost reduction efforts, and
better overhead cost allocation. With respect to the reasons for not adopting ABC, the
results of the study were divided into three categories. The first relates to inherent
difficulties with ABC which includes, time consumption, difficulties in selecting cost
drivers and appropriate software, lack of expertise to implement ABC and that it was
costly to switch to ABC. The second category related to the firm’s characteristics and
business environment, such as higher priorities of other changes or projects, lack of
internal resources and top management support, less complexity in products, and no
intensity of competition. The last category of the reasons related to the confidence in the
existing cost system, such as satisfied with the current system, no significant problems
with the current system and ambiguity of ABC benefits in literature.
Cotton et al. (2003) conducted an exact replica survey of that used by Innes et al. (2000)
on the usage of ABC in New Zealand (NZ). The target population consisted of Chartered
59
Accountants (CAs) who were Corporate Sector members of the Institute of Chartered
Accountants in NZ (ICANZ), and who were in active employment in commercial firms,
local government organisations and state owned enterprises. The questionnaire was sent
by mail to a target population of 748 firms and resulted in a response rate of
approximately 40%. Regarding ABC implementation rates, the findings reveal that 20.3%
of respondent firms were implementing ABC, but fewer companies in NZ compare with
the UK were considering using ABC (11.1%), and fewer companies in NZ had rejected
the system after assessment (10.8%). The remaining companies (57.8%) were not
considering the adoption of ABC. In relation to the purposes and benefits to which ABC
had been applied, the findings indicate that these purposes include inventory valuation,
product or servicing pricing, production or service output decisions, cost reduction and
cost management, budgeting, new product or service design, customer profitability
analysis, activity performance measurement and improvement. The study did not
investigate the reasons and difficulties of the implementation of the ABC.
Pierce and Brown (2004) conducted a survey of large manufacturing, service and
financial sector organisations to investigate the implementation state of ABC systems in
Ireland. The questionnaire was designed using a series of questions taken directly from
Innes et al. (2000), and was sent by post to a named individual in each company,
identified from professional accounting institutes’ listings as holding a position as head of
management accounting, head of finance or chief executive. The total response rate of the
study was 23.2%, out of 550 questionnaires sent. The results show higher implementation
rates than previously reported in Ireland. Around 28% of respondent companies were
implementing ABC systems, 52.4% of respondent companies were not considering the

60
implementation of the system, 9% of respondent companies were still considering it and
10.7% had rejected the implementation of the ABC. In relation to the benefits and
satisfactions of ABC systems, the findings report that ABC provides more in-depth
analysis, value adding decisions, and efficiency value-based reporting. Furthermore, ABC
provides more accurate product cost, improved product profitability, and evaluation of
capital investment. The findings also indicate that ABC would be used to understand cost
drivers, to impact and influence product cost through design, and to facilitate pricing
strategy and product line performance on profitability and efficiency. Regarding the
difficulties and reasons for not implementing the ABC systems, the results of Pierce and
Brown (2004) have been divided into three categories, the first category relates to factors
which inhibit the implementation of the system, these include lack of support, experience,
training and resources; also cost, complexity, and timelines of ABC information. Lack of
software support, human resource availability, and perceived complexity were also
factors which inhibit ABC implementation. The second category related to reasons for
rejecting the system these include, no significant difference in the product costs compared
with the traditional systems thus current system was seen as a better management tool,
and lack of relevance to the business. The findings also indicate that there is difficulty in
establishing the key cost drivers, and difficulty in justifying implementation because of
indeterminate benefits. The last category related to reasons for never considering the
system. These include satisfaction with current system, lack of knowledge and
experience, manufacturing process is simple, small size of organization, and ABC is not
relevant to the nature of the business.

61
Manalo (2004) conducted a telephone survey among the Top 500 Corporations (The
Fookien Times Philippine Yearbook, 2001) in the Philippines. The findings indicate that
around 17% (i.e., 83 firms) are implementing ABC, 55% (275 firms) are still using
traditional costing systems, and the rest of the total sample 28% (142 firms) are still
considering ABC implementation. The findings also reveal some reasons for ABC’s low
implementation, these were: lack of knowledge of ABC, employee resistance and the
organisational changes seemed essential to the use of ABC.
Cohen et al., (2005) conducted a questionnaire survey during 2003 on a sample of 177
leading Greek companies. The study aimed to examine the adoption rate of ABC by
Greek companies that belong to all three sectors of the Greek economy, i.e.
manufacturing, retail and services, as well as investigating the reasons that influence a
company’s decision to change its current management accounting system.
A total of 88 completed questionnaires were received and analysed, which represent a
response rate of 49.7%. In relation to the ABC adoption rates, 40.9% (36 firms) of
respondents have already implemented ABC, while 59.1% (52 firms) were non-ABC
adopters. Of the non-adopter, 31.9% (28 firms) had rejected ABC, 13.6% (12 firms) were
considering the implementation of ABC, and 13.6% (12 firms) were not considering
ABC implementation.
With respect to ABC implementation benefits, the findings grouped the benefits into six
categories: Cost Accounting, cost Management, Performance Measurement, Decision-
Making, General Management and Relationships Management. These benefits categories
as well as the parameters they consist of are shown in table 3.2 below listed in order of
perceived importance.

62
Table 3.2: Benefits perceived by ABC adopters Cost accounting: Calculation of actual total product cost Identification of activity cost Cost accounting system update in order to be more accurate More accurate indirect cost allocation to products Cost management: Identification of the factors that are responsible for cost creation Overhead decrease More realistic budget preparation Cost reduction Performance measurement: Analysis and control of product profitability Improvement of departments’ performance measurement Improvement of activities’ management efficiency Decision making: Improvement of the decision making process in relation to product cost Adjust pricing policy as to apply to increase product mix complexity Abolition of ‘loss making’ products Changes of product mix in order to better suit customer needs General management: Improvements of products’ quality Improvement of outsourcing decision procedures Attainment of synergies with total quality systems Relations management: Improvements of customers’ management efficiency Motivation of personnel that deals with cost accounting Identification of ‘loss making’ customers Identification of ‘loss making’ suppliers Source: Cohen et al., (2005:12).
Regarding the problems faced in implementing of ABC, the findings revealed that
activities identification, identification of the proper cost drivers, lack of top management
support, software selection, and personnel’s resistance to ABC were the main problems
with ABC implementation. Furthermore, the study reported that the reasons for not
considering ABC implementation in the future included satisfied with the existing cost

63
system, ABC implementation cost is high, top management is not interested in ABC, and
lack of resources for ABC implementation.
Sartorius et al. (2007) conducted a telephonic and an e-mail survey of listed South
African companies on the Johannesburg Securities Exchange (JSE). A quantitative
methodology was adopted in their study to evaluate the extent of ABC implementation
and to identify reasons for implementation/non-implementation, problems and critical
success factors relating to ABC implementation. The results of the study show that the
extent of ABC implementation in South Africa is low, only 11.6% of respondent
companies have implemented ABC systems. in relation to the reasons for the
implementation of ABC in South Africa, the results report that the need for accurate
costs, better cost management, understanding product/customer profitability and
budgetary purposes were the most reasons for adopting the system. Regarding the
problems and reasons for not implementing ABC, the findings report that difficulty with
identifying and defining activity and cost drivers was the most reason for not
implementing ABC. Furthermore, the results show that satisfaction with current systems,
inadequate marketing of ABC and negative publicity about ABC were other reasons for
the non adoption of ABC systems.
3.3 Case Studies on the implementation of ABC
A number of researchers (Innes and Mitchell 1990; Shields 1995; Anderson 1995;
McGowan and Klammer 1997; Krumwiede and Roth 1997,; Krumwiede 1998) have
utilized case studies to examine the implementation of ABC and to identify the factors
influencing the success of the systems. This section reviews chronologically a range of

64
case studies and interviews on the implementation of ABC systems, and presents the
main difficulties and barriers to the implementation of the system.
In a case study conducted to provide an overview of how ABC systems have been
implemented, Innes and Mitchell (1990) highlighted a number of problems with the
implementation of ABC. The cases were selected to give some diversity in terms of size,
sector, stage of implementation, and focus of application. The study found that a great
deal of work was involved with the implementation of ABC. This included interviewing
the managers in order to identify the activities, collecting the costs for activity cost pools,
determining the cost drivers and, where appropriate, linking the cost drivers to the
individual product lines.
As a result of introducing the ABC system, the companies were able to consider the
effect of product volume on product costing. For instance, the cost of a small volume
product was increased by 30% more than the cost allocated on traditional systems. The
finding also showed that those products with a lower number of components experienced
a decrease in cost at the expense of those with larger numbers of components, due to the
inherent weakness of the traditional systems. Furthermore, cost driver rates provided a
basis for a detailed cost comparison between manufacturing plants, enabling management
to make better location decisions for certain processing work. The authors also argued
that designers could also improve the design of new products or modifications to existing
products, as they have a better understanding of the characteristics of the product which
cause overhead cost.
Innes and Mitchell (1990) identified a number of similarities in the approach adopted by
the three companies examined in the implementation ABC. These included the setting up

65
of a small team to design and implement the system. In each case this team was headed
by a very senior accountant. There were on-going consultations with all the relevant
managers in the organisations. This ensured that managers had the opportunity to make
an input to the design of the system and to ensure the proposals were acceptable and
sensible. The system was kept as simple as possible by limiting the number of cost pools
and cost drivers.
A study by Cobb et al (1992) found that the major difficulties perceived by UK
companies considering the adoption of ABC were the amount of work involved in
installing the system combined with a lack of suitable accounting staff resources, lack of
computer resources, and difficulties in selecting suitable cost drivers. Regarding the
companies which had rejected ABC, Cobb et al (1992) identify the following issues:
difficulty of collecting quantitative data on cost drivers; difficulty of linking cost drivers
to individual product lines; amount of work required from the accountant; and other
higher priorities (such as survival of the firm during a recession). Furthermore, they
indicate that those companies which had adopted ABC faced some difficulties during the
initial ABC implementation stage, including: the choice of activities, the selection of cost
drivers, the uncertainty over using ABC for stock valuation for external financial
reporting, as well as linking cost drivers with individual product lines.
In Ireland, O’Dea and Clarke (1994) conducted semi-structured interviews with multi-
national firms operating in Ireland in order to establish the factors associated with the
implementation of ABC, and the difficulties that may be encountered. The results
indicate that the reasons for not considering the implementation of ABC included the
following: the small percentage of overhead costs in the cost structure, low product
66
diversity, the uncertainty as to whether ABC would have any impact on decision-making,
and the belief that existing cost systems are satisfactory for product costs and measuring
performance. In addition, the results show that among the perceived difficulties of the
implementation process were the cost of ABC implementation (time, software, and
training), selecting activities and cost drivers.
Anderson (1995) conducted a case study of General Motors and found that technological
factors impact on the success of ABC. This study developed a framework for evaluating
ABC implementation and hypotheses about factors that influence the implementation of
the system. The search for factors that influence ABC implementation success was
guided by the information technology (IT) and organisational change literatures, as well
as anecdotal evidence of factors that influence the success of ABC implementation.
Shields (1995) shows that variables influencing the success of implementing ABC
involve behavioural and organisational variables, as opposed to technical variables. These
variables comprise top management support, linkage of the ABC system to competitive
strategies, linkage of the ABC system to performance evaluation and compensation,
sufficient internal resources, training in designing and implementing ABC and non-
accounting ownership, which is the commitment of non-accountants to use ABC
information.
Norris’ (1997) results correlate with Shields’ (1995) findings in that the successful
implementation of ABC is associated more with behavioural and organisational factors
than with technical factors. Shields and McEwen (1996) found that a significant cause of
unsuccessful implementation on the part of several companies was due to an emphasis on
the architectural and software design aspects of the ABC system, which served to

67
overlook behavioural and organisational issues. Krumwiede and Roth (1997) also found
that behavioural and organisational variables, as claimed by Shields (1995), can
overcome the barriers of each stage in the implementation of ABC and when addressed
can lead to the successful implementation of ABC.
Turney (1996) states that if ABC is to be successfully implemented the initial requisite
steps include the generation of an interest in ABC at all levels of the firm, the removal of
any barriers to ABC adoption, and the development of management’s commitment to
support the implementation of ABC. The result of Norris’ (1997) study confirms that
internal commitment by individual managers to the change will influence its successful
implementation. Implementation of ABC is likely to be unsuccessful without the
commitment and sponsorship of users and senior management (Morrow 1992).
Briers and Chua (2001) claim that the implementation of ABC is contingent not only on
top management support, but also on external consultants, while several studies (Shields
1995; Shields and McEwen 1996; Roberts and Silvester 1996; McGowan and Klammer
1997, and Krumwiede 1998) contend that the most essential factors influencing
successful ABC implementation is top management support, which means the
encouragement, by senior management, of developing teams of ABC implementers.
Krumwiede (1998) studied U.S. manufacturing companies to examine how contextual
factors, such as cost distortion, size of firms, and organisational factors such as top
management support, training or non-accounting ownership, affect each stage of the ABC
implementation process. He found that different factors affected the various stages of
implementation of ABC and the degree of importance of each factor varies according to

68
the stage of implementation. For example, a company’s potential for cost distortions (a
contextual factor) is a highly important factor in its decision to adopt and implement an
ABC system, and top management support, non-accounting ownership and
implementation training (organisational factors) can lead to reaching the highest stage of
implementation of ABC. Krumwiede (1998) concludes that firms considering or
implementing ABC system should take organisational and contextual factors into
account.
Soin et al. (2002) used institutional theory to interpret the role of ABC in organisational
change. The study reports on a longitudinal empirical case study of the implementation of
ABC in the clearing department of a UK-based multinational bank. They identified
tensions between the need to establish ABC as an organisational routine, thereby ensuring
its reproduction, with the less routine but more revolutionary aspiration of ABM. Their
case suggested that the ABC team succeeded in institutionalising a version of ABC that
revealed new links between costs and products but did not transform the strategic
thinking of the bank’s senior management. Soin et al. (2002) argue that there is a need for
future longitudinal case study research on ABC, with particular emphasis on a processual
interpretation of the ABC/ABM relationship that further explores the trade-off between
strategic capability and the establishment of management accounting routines.
Kip and Augustin (2007) conducted an in-depth study of German and U.S companies to
compare the cost accounting methods. The results show that German companies
emphasize management accounting more, and U.S companies place their accounting
emphasis on financial reporting. In addition, the findings report that more German
companies than U.S companies are satisfied with their costing systems. Regarding the

69
adoption of ABC systems, the results show a small difference in the percentages of firms
that implementing ABC between the two countries.19% for German and 21% for the
American firms, the highest percentages came from non-manufacturing firms; 38% inn
the U.S and 27% inn Germany.
Abde-Alnasser and Wei Li (2008) investigate factors that led to the failure of an ABC
implementation at a major Chinese financial institution-the Bank of china. They
conducted interviews with 18 employees at one branch revealed six factors that blocked
the implementation of ABC systems. These factors are: lack of a clear business purpose
about the implementation of the system, lack of knowledge regarding ABC, difficulties in
designing the systems which includes the identifying of activities and cost drivers, lack of
participation and internal resistance to change. Abde-Alnasser and Wei Li (2008) argue
that the Bank of China decided to implement ABC systems in 2005, in order to achieve
more efficient cost control, and the bank seeks to become a listed company. The
implementation of ABC started very slow and then has ceased in most branches because
of the previous reasons.
3.4 Summary and Conclusion
The purpose of this chapter was to describe the relative ABC adoption rates, perceived
benefits and the reasons and difficulties for not adopting ABC system. The first section of
the chapter presents the results of a number of studies into the implementation of ABC
systems in different countries. Despite strong advocacy in favour of ABC systems
(Cooper 1988a, b; Cooper and Kaplan 1991, 1998) adoption rates are not overwhelming

70
(Innes et al. 2000). Survey evidence suggests that, over the past decade, there has been a
growing awareness of ABC, but overall rates of implementation have been low.
Table 3.3 below shows the overall rates of ABC adopters, rejecters, under consideration
and non-considered companies of a number of studies as following:
Table3.3 the overall rates of ABC adoption Surveys ABC
adopters Rejecters Under
consideration Never
considered Innes and Mitchell 1995 U.K
74 21.0% 47 13.3% 104 29.6% 127 36.1%
Bjornenak 1997 Norway
30 40.0%2 - - 45 60.0%
Nguyen and Brooks 1997 Australia
15 12.5% 3 2.50% 10 8.30% 92 76.7%
Clark et al. 1999 Ireland
24 11.8% 26 12.7% 42 20.6% 112 54.9%
Groot 1999 U.S
17 17.7% - 56 58.4% 23 23.9%
Groot 1999 Dutch
14 12.0% - 29 24.8% 74 63.2%
Cinquini et al. 1999 Italy
13 10.0% 21 16.0% 36 27.0% 62 47.0%
Innes and Mitchell 2000 U.K
31 17.5% 27 15.3% 36 20.3% 83 46.9%
Changruksut 2002 Thailand
12 12.0% 2 2.0% 23 23.0% 64 63.0%
Cotton et al. 2003 New Zealand
60 20.3% 32 10.8% 33 11.1% 171 57.8%
Pierce and Brown 2004 Ireland
34 27.9% 13 10.7% 11 9.0% 64 52.4%
Manalo 2004 Philippine
83 17.0% - 142 28.0% 275 55.0%
Cohen et al 2005 Greek
36 40.9% 28 31.9% 12 13.6% 12 13.6%
Sartorius et al 2007 South Africa
21 11.6% - - 160 88.4%
2 This percentage represents of companies which had adopted ABC and planned to adopt it).

71
The above table reports lower adoption rates than might be expected, despite the potential
advantages and benefits of using ABC information which have received widespread
prominence in the literature.
This chapter also analysis the advantages and benefits of using the ABC systems, derived
from the same studies mentioned above, summarised in table 3.4 below:
Table 3.4: Benefits and advantages of ABC systems
More accurate cost information for product costing and pricing
Improved cost control and performance measurement and assessment
Improved insight into cost causation and behaviour
More accurate customer profitability analysis
Assistance in cost reduction and cost control applications
Improved the calculation of the product profit margin
Improved decisions on sales price, product mix and client mix
Superior decision-making information
Better encouragement of commitment to quality and continual improvement
Increases the effectiveness of budgeting
Increase in profitability and better overhead cost allocation
Improved the inventory valuation
Improved production/service decisions
Improved new product or service design
Provides more in-depth analysis, and value adding decisions
Improved efficiency value-based reporting
Provides more accurate evaluation of capital investment
Facilitate pricing strategy and product line performance on profitability and efficiency
Improvement of the decision making process in relation to product cost
Changes of product mix in order to better suit customer needs
Improvement of outsourcing decision procedures
Motivation of personnel that deals with cost accounting
Identification of ‘loss making’ suppliers

72
While the implementation of ABC appears to result in obtaining and achieving the above
benefits, at the same time the adoption rates are low. This chapter explains the reasons for
this confliction by identifying the main difficulties which are encountered in
implementing the ABC systems.
The following table summarises the common issues that emerge from the various studies
(surveys and case studies) which have been reviewed:
Table 3.5: Main difficulties encountered during ABC implementation
Barriers and difficulties
Innes&Mitchel190,95,2000 Friedman & Lyne 1995
O’Dea Clarke., 94.Clarke 1999
Groot, 1999. Sartorius et al. 2007
Cobb, Innes & Mitchell 1992
Pierce& Brown 2004
Chongruksut 2002.
Cohen et al 2005
Identifying and aggregating activities
a a a a a a
Assigning resources to activities
a a a a a a
Selecting cost drivers a a a a a a Assigning activity costs to cost objects
a a a a a a
Internal resistance a -- a a -- -- Top management support
a a -- a a a
Uncertainty of ABC benefits
a a -- a a a
Data collection difficulties
-- -- a a a --
Suitable accounting staff, computer staff
-- a -- a -- --
Inadequate computer software
a a -- a a a
Amount of work and time needed
a a -- -- a a
Human resource availability
-- -- -- a a --
Lack of knowledge/ experience
a a a a a a
Satisfied with current a a a -- a a

73
The above table indicates that technical issues such as: defining activities, selecting cost
drivers and assigning resources and costs to activities are common difficulties
encountered during the implementation stage of ABC among the studies.
Based upon an analysis of the above table, the barriers to and difficulties of
implementation of ABC systems may be classified into three distinct strands, as
illustrated in the following chart:
Figure 3.1: Barriers and difficulties classification
Given the frequency with which technical issues have been identified as constituting
“difficulties”, it is perhaps surprising that so little empirical research has been devoted in
this area. As Anderson et al (2002, p.195) state: “an aspect of ABC implementation that
researchers have neglected is the process of designing the ABC model – i.e. the
resources, activities and cost drivers that are the ‘economic map’ of the organisation”.
Barriers and Difficulties to ABC implementation
Systems Issues Technical Issues Behavioural Issues
- Identifying activities - Aggregating activities - Assigning resources to activities - Selecting cost drivers - Assigning activities costs to cost objects
- Internal resistance - Top management support - Uncertainty of ABC benefits - Human resource availability - Lack of knowledge/ experience - Satisfied with current systems
- Data collection difficulties - Inadequate computer software - Suitable accounting staff, computer staff - Amount of work & time needed

74
By contrast, a number of studies have considered behavioural issues (Anderson 1995;
Shields 1995; McGowan and Klammer 1997; Anderson et al., 2002).
In order to more fully clarify and understand the nature of the technical difficulties, the
next chapter will review the literature relating to implementation of ABC systems, with
particular emphasis upon the technical decisions relating to identifying activities,
aggregating activities, assigning resources to activities, selecting cost drivers and
assigning activities costs to cost objects.
75
CHAPTER 4: TECHNICAL ISSUES IN THE IMPLEMENTATION OF ABC SYSTEMS 4.1 Introduction Chapter 3 established that internationally, the take up or adoption rates of ABC are
relatively low, particularly when one considers the benefits that have been claimed for the
system. In addition, chapter 3 reviewed the empirical studies relating to ABC
implementation, in order to establish the extent to which technical and other difficulties
actually play a part.
This chapter elaborates on the nature of these technical difficulties. This elaboration will
be conducted by considering the various stages, which need to be addressed during the
implementation process, and the various technical options available.
The organisation of the chapter is as follows: Section 4.2 investigates and explains the
necessary steps taken in designing and implementing an ABC system, (together with a
description of the nature of the technical issues encountered during the implementation of
an ABC system). Finally, a summary and conclusions are presented in section 4.3.
4.2 Steps in designing and implementing ABC systems
It has been argued (Cooper 1989, 1990; Scapens 1991; Cooper and Kaplan 1991, 1998;
Drury 1996, 2000; Kaplan and Atkinson 1998) that the main components of an ABC
system are: Resources, Activities and Cost Objects. Turney (1996. p96) states that the
main items, which he considers the “basic building blocks of the ABC system”, are
resources, activity, activity centre, resource driver, activity cost pool, cost element,

76
activity driver and cost object. Figure 4.1 below shows how these building blocks fit
together.
Figure 4.1: Basic building blocks of the ABC system
Source: Turney (1996: 97) From the above exhibit, it can be seen that costs flow from the resources to activities, and
then flow through to the cost object that triggers the activities. Therefore, the view which
is adopted is that activities consume resources, and cost objects consume activities.
Cooper (1988b) argues that the ABC system focuses on activities rather than products.
This helps to avoid the distortion in product costs that can arise from the use of the
traditional costing systems, and provides more information that is accurate. Drury (1996)
advises businesses to understand the factors that drive each major activity, the cost of
activities and how activities can be related to products. The art of designing an ABC
Activity & Activity Resource Cost
Activity Centre Driver Element Cost pool Activity Driver
Resources
Cost Objects

77
system can be viewed as making two separate interrelated decisions about the number of
cost drivers needed and which cost drivers to use (Cooper and Kaplan 1998).
This section will present the different steps or stages that are undergone during the design
and implementation of an ABC system. The primary focus will be on the nature of the
technical issues encountered during these stages, while acknowledging that not all issues
critical to successful implementation are of a “technical” nature.
The design process begins with a generally agreed definition of the objectives of an ABC
system and ends with the assignment of the cost of activities to objects and includes the
following stages (Cooper 1990; Cooper and Kaplan 1991; Sharman 1994; Turney 1996;
Drury 1996, 2000).
4.2.1 Selecting the specific objectives of an ABC system
4.2.2 Developing the ABC team
4.2.3 Organisational issues
4.2.4 Identifying and grouping the major activities in an organisation
4.2.5 Assigning costs to each activity
4.2.6 Determine cost drivers
4.2.7 Assigning the cost of activities to cost objects
4.2.1 Selecting specific objectives of the ABC system
Cooper (1990) argues that the complexity of an ABC system’s design appears to depend
on many factors, including management’s objectives for the cost system and the diversity
of the company’s product mix. He further comments that if a single management
objective dominates, only a few cost drivers may be required to achieve that purpose.

78
Turney (1996), Cooper (1990) and Drury (1996, 2000) suggest a list of objectives which
a company can achieve by successfully implementing an ABC system. These objectives
are:
(i) To provide information about manufacturing activities with the objective to support
and motivate waste elimination programmes
(ii) To provide information about non-manufacturing (non-value adding) activities and
cost objects (customer and distribution channels) that support cost reduction in these
areas
(iii)To provide product costs and to facilitate studies of relative product profitability
(iv) To provide information to formulate pricing strategies
(v) To provide information to guide market focus
4.2.2 Developing the ABC team
The next stage in designing an ABC system is to develop a team, which should include
members from several disciplines other than finance (Cooper 1990). Sharman (1994)
states that implementation involving a multifunctional team of experienced employees
can be highly efficient because their knowledge of the organisation and its business
already exists. The team size depends on the organisation’s size, urgency of completion
of the project and availability of staff (Turney 1996). Cooper and Kaplan (1991) identify
a minimum of four team members as follows:
(i) The team leader should be an engineer who is working in a strategic planning
group
(ii) A Company cost accountant who has had significant experience in production as
well as working knowledge of a firm’s existing accounting system
79
(iii)A production supervisor
(iv) An industrial engineer with many years of experience
Cooper (1990) argues that if someone thinks that it is an accountant’s job to deal with the
costing system then it is not possible to design a successful ABC system, because it is a
management system not a financial system. In addition, the team should have the full
support of top management, which is only possible if management is convinced that the
new system is better than the old system (Cooper 1990).
4.2.3 Organisational issues
According to Innes and Mitchell (1998), the specific nature and circumstances of the
organisation are highly related to an assessment of how suitable the adoption of an ABC
system would be. They suggest some organisational issues that should be considered in
the design of the ABC system, and should be analysed by the ABC team before
identifying the activities, such issues comprise:
(i) Number of products produced or service output
(ii) Diversity of the product lines
(iii)The significance of overheads in the cost structure
(iv) The rate of growth of overheads
(v) The existing approach to overhead absorption
(vi) The number and diversity of channels of distribution
(vii) Differences in Customer levels of service
The above issues have been investigated from a contingency theory perspective, which
suggested that the implementation of ABC (as for any management accounting system)
80
within individual firms is dependent upon, or at least associated with particular variables
of the firm (chapter 6 will discuss these issues in more details).
4.2.4 Defining the major activities in an organisation
Identification of the activities is the fundamental step of an ABC system, as it sets the
structure and scope of the system (Cooper, 1989, 1990; Cooper and Kaplan, 1991, 1998;
Drury, 1996, 2000; Kaplan and Atkinson 1998; Scapens 1991). Turney (1996) believes
that defining and describing activities is at the heart of designing an ABC system. This is
because the identification of the activities forces the accountant to determine what is
actually happening in the relevant areas of the business and ensures that the costing
system is built on reality (Innes and Mitchell, 1998).
Drury (1996) defines an activity as an event, task, or unit of work with a specified
purpose, while Ittner et al (1997) state that, the ABC literature defines an activity as any
discrete task that an organisation undertakes to make or deliver a product or service.
Cooper and Kaplan (1998:210) argue that “activities are described by verbs and
associated objects: schedule production, move materials, purchase materials, inspect
items, respond to customers, improve new products, and so on”.
Activities differ in type and location from one company to another, because of the
variations in each company’s technology, size, and its nature, while the number and type
of activities also differ according to its business approach (Turney 1996).
81
4.2.4.1 The major approaches to identifying activities
4.2.4.1.1 Activity Dictionary
Cooper and Kaplan (1998) suggest that a Standard Activity Dictionary, which lists and
defines all the major activities performed by the organisation be prepared. They believe
that such an activity dictionary provides a useful approach to identifying the activities
suitable for use in the particular application of ABC. In designing the activity dictionary,
Sharman (1994) argues that an activity dictionary is prepared by the team in advance of
interviews taking place and represents a list of all the major activities performed by the
organisation and their definitions. Cooper and Kaplan (1998) demonstrate that the
number of activities is a function of the purpose of the model, and the size and
complexity of the organisational unit being studied. Cooper and Kaplan (1998) further
add that activity dictionaries can be relatively brief, say 10-30 activities, especially where
the prime focus of the ABC system is to estimate product and customer costs. Therefore,
the activity dictionary simplifies the activity analysis process by listing the typical
activities by function or department.
4.2.4.1.2 Functional decomposition
Turney (1996) mentions the term ‘functional decomposition’ as a process by which to
identify activities. He states that “to identify activities with functional decomposition,
start with an organisation chart for the company. Then divide each box in the chart into
smaller units. This division of larger functions into smaller functions is continued until
you meet the purpose of the ABC system” (Turney 1996: 262). To illustrate how
functional decomposition works, Turney provides the example shown below in exhibit

82
4.2, which shows some proposed support-departments, including production scheduling,
receiving, and process engineering. The first step is that the activities be defined by
visiting all the departments of a company and interviewing staff members to determine
the work done in each department. The next step is to break out the activities.
Figure 4.2: Functional decomposition Plant Departments Activity Centre Source: Turney (1996: 263) Based on the above, three activities are performed in the receiving department; receiving
raw material, receiving bar stock, and receiving supplies. Turney argues that it is
important to identify each of these activities separately because the effort required to
process a receipt may vary depending on what is received. For instance, he observes that
Manufacturing support
Production Scheduling
Process Engineering
Receiving
Receiving Bar Stock
Receiving Raw Material
Receiving Bronze Valve
Bar Stock
Receiving Butterfly valve
Bar Stock
Receiving Supplies

83
there are two types of bar stock received, bronze valve bar stock and butterfly valve bar
stock.
Turney (1996) adds that there may be literally hundreds of activities in the database, and
you can easily become lost without some method of organisation. He states that the most
common approach is to group activities into activity centres (see exhibit 4.1). This section
illustrates the approaches of grouping and aggregating activities.
4.2.4.2 Grouping and aggregating activities
Cooper (1990:78) argues, “The number of actions performed is typically so vast that it is
economically unfeasible to use a different cost driver for each action”. Therefore, he
suggests that actions must be aggregated into activities, and then a single driver is used to
allocate the cost of those activities to cost objects.
This section presents the methods of aggregating activities to simplify the implementation
of ABC systems as follows:
4.2.4.2.1 The activity centre
In exhibit 4.1 mentioned earlier, Turney (1996) argues that an activity centre is a
collection of related activities, such as those in a particular department. He provides an
example of activities in an inspection activity centre as follows:
Figure 4.3: The activity centre
Source: Turney (1996: 103)
Inspection Department
Inspecting incoming material
Inspecting incoming components
Inspecting the first piece of each batch
Inspecting customer complaints

84
Based on the above figure, the activity centre directly parallels the inspection department
in scope, but contains information about the activities that would not be found in any
conventional departmental report. Turney (1996:103) argues, “This information includes
the cost of each activity, the resources used by each activity, and operational information
about activity performance”. Turney concludes that the purpose of the activity centre is to
facilitate management of function or processes. It also holds strategic and operational
information relating to the centre’s activities in one place. This information is used to
help answer the following types of questions about the work of the centre. These are:
what work is performed in the activity centre; which activities consume most of the
resources of this department; which activities contain waste and are candidates for
improvement; how does each activity meet the needs of its customer (i.e. the next
activity in the process), and what is the overall performance of the department or the
process.
4.2.4.2.2 Activity Hierarchy
Horngren et al (2003) state that an activity hierarchy categorises costs into different
activities based on the different types of cost drivers, cost-allocation bases, and different
degrees of difficulty in determining cause-and-effect relationships. Cooper and Kaplan
(1991) argue that when separating activities, a hierarchy occurs and activities are
classified into:
(i) Unit-level activities: are performed for each unit of product
(ii) Batch-level activities: undertaken every time a batch is produced
(iii) Product-sustaining activities
(iv) Facility-sustaining activities

85
Figure 4.4: Activity hierarchy
Source: Cooper and Kaplan (1991:132) Based on the above figure, unit level activities consume resources in proportion to the
number of units produced and sales volume. Figure 4.4 also shows that batch related
activities such as machine set up or material movements are performed each time a batch
of goods is produced. Product level activities are performed to allow the production and
sale of different products, e.g. product specifications expenses (bill of materials). The last
level is facility level; these costs include plant management expenses, building
maintenance and heating and lighting expenses etc. These are incurred in the support of
the whole organisation. Drury (2000) states that there would need to be a dramatic change
in activity for these costs to change, e.g. additional premises. He adds that these cost are
seen as necessary and not allocated to individual products as they are seen as irrelevant
Plant management expenses Building maintenance Heating and lighting expenses Process engineering expenses Product specifications expenses Engineering change notices Product enhancement Setups Material movements Purchase orders Inspection Direct labour Materials Machine costs Energy
Facility sustaining activities
Product sustaining activities
Batch level activities
Unit level activities

86
for the majority of decisions, as such they are deducted from the total operating margins
of all products.
Philip and Mandi (2008) argue that ABC is a complex costing system that deals with
indirect costs by constructing a hierarchy of four activity levels based on these cost
definitions. Philip and Mandi (2008) provide an example of a firm called Hierarchy
Manufacturing Co. as following:
Figure 4.5 cost drivers and cost driver rates at Hierarchy Manufacturing Co. Cost driver
(1) Cost
driver rate (2)
Product X 40,000 units (3)
Product Y 10,000 units (4)
To product X (2x3)
To product Y
(2x4) Unit-level activities Materials Pounds $5 per
pound 120,000
lbs. 70,000
lbs. $600,000 $350,0000
Labour Labour hors $1 per hour
360,000 hours
40,000 hours
4,320,000 480,000
Batch-level activities Set up # of batches $4,500
per batch 80 batches 100
batches 360,000 450,000
Inspection # of shipments
$1,000 per
shipment
300 shipments
200 shipments
300,000 200,000
Product-sustaining activities Design Engineering
hours $450 per
hour 30,000 hours
20,000 hours
1,500,000 1,000,0000
Change orders
# of change orders
$1,000 per order
60 orders 40 orders 60,000 40,000
Facility-level activities Occupancy Square feet $20 per
sq.ft 60,000 sq.
ft 100,000
sq. ft 1,200,000 2,000,000
Source: Philip and Mandi (2008:18)
The above first category consists of the unit level activities of materials and labour, each
having its own cost drivers: pounds and labour hours respectively. The second level of
activities in ABC system, known as the batch level, includes costs of activities performed

87
on batches of units produced rather than on each unit individually. Product-sustaining
activities are the third level of the hierarchy; the costs associated with these activities
serve a specific product and are concurrently direct and fixed. Finally, facility-level
activities support the entire production process, as opposed to a specific product line or
unit of product, and are both common and fixed.
4.2.4.2.3 Business process
Cooper and Kaplan (1998) argue that activities can be grouped collectively into higher-
level business processes. Cooper (1990) suggests the aggregation of many actions into
each activity. Cooper and Kaplan (1998) referred to those activities within the
procurement function, which might be too diverse for costs to be driven to products by a
single cost driver, such could involve ordering materials, scheduling delivery of
materials, receiving, inspecting, moving, storing materials and negotiating with and
selecting vendors. These activities may require a different cost driver, if they built up into
separate activities. Nevertheless, a single cost driver, like the number of purchase orders
might be selected if all the activities were aggregated together into a procurement
process. Cooper and Kaplan (1998) further added that such an aggregation would fail to
identify differences in activities required for ordering different types of materials from
different vendors and using different ordering relationships. There is also an opportunity
for managers to compare the cost of performing the same business process at different
plants or across different organisational units to identify efficient and inefficient
practices. Therefore, it is necessary during activity analysis to identify which activities
are significant and agreed on which activities can be aggregated.

88
Based on the above, it is interesting to argue that identifying activities are at the heart of
designing an ABC system. Activities are made up of the amalgamation of tasks or units
of work and can consist of many different tasks. The activities are usually identified by
carrying out an analysis of the work in an organisation through interviews and/or time in
motion exercises. Two major approaches have been reviewed to identify activities: these
are activity dictionary and functional decomposition. Initially numerous tasks can be
identified. These should be aggregated into a reasonable number of activities, otherwise
there will be a proliferation of information which is costly to manage. Three approaches
have been presented in relation to aggregating activities: these are the activity centre,
activity hierarchy and business process. The final list of activities chosen is a matter of
judgment but is likely to be based on the total cost of the activity centre and whether or
not a single driver can provide a reasonable determinant of the cost of the activity. If it is
not reasonable then it will be necessary to break the cost centre/pool down further, (Drury
2000).
4.2.5 Assigning costs to each activity
After the activities have been identified, the next step is to assign the overhead costs to
each activity using the first stage cost drivers, which link spending and expenses as
captured in the organisation’s financial, or general ledger system, to the activities
performed (Cooper 1990; Turney 1996; Cooper and Kaplan 1998; Drury 2000). Figure
4.5 below simplifies the general picture of the two-stage allocation within ABC systems.

89
Figure 4.6: Two-stage allocation for ABC system
Source: Cooper et al. (1992) The initial stage is referred to as a first-stage allocation, which assigns the costs of inputs
cost pools within each activity centre. At this stage many of the resources may easily be
directly attributable to specific activities, but some may be shared by a number of
activities (such as lighting, heating, executive salaries, and depreciation).
Figure 4.6 below illustrates the first stage of assigning overhead costs to each activity, for
example, set-up costs are directly allocated to set-up machines activity, while indirect
material cost are shared by the three activities as following.
Figure 4.7: First stage ABC allocation
…Other indirect recourses
Stage 1
…Other activities
Set-up costs
Indirect material costs
Manufacturing engineering cost
Set-up machines
Support labour
Administer parts
First stage Second stage
Resources
Activities
Units of output

90
Turney (1996) states that the primary cost drivers (resource drivers) are the links between
the resources and the activities. They are used to allocate a cost from the general ledger
and assign it to the activities. These cost drivers actually show how specific resources are
consumed by an activity. Turney (1996: p101) provides an example of two significant
resources associated with the inspection department; £100,000 in salaries and benefits
and £20,000 for supplies. Salaries and benefits are assigned to each activity based on
estimates of the effort devoted to each activity. This estimated effort is the resource driver
for salaries and benefits. Consequently, every activity should be analysed in detail to
create a list of all the primary cost drivers. For instance, if two out of ten people in the
department are found to spend 50% of their time on inspection of customer complaints,
then 10% (i.e. 2/10 multiplied by 50%) of salary and benefit cost (i.e. 10% of £100’000 =
£10,000) is traced to this activity (Turney 1996: P 101).
4.2.6 Determining Secondary Activity Drivers
Traditionally, cost systems used simple bases, such as direct labour hours, machine hours,
unit produced, or materials processed to allocate production cost centre costs to cost
objects (Cooper, 1989, 1990; Cooper and Kaplan, 1991, 1998; Drury 1996; Kaplan and
Atkinson 1998; Horngren et al, 2003). Babad and Balachandran (1993) point out that an
ABC system achieves improved accuracy in estimation of costs by using multiple cost
drivers to trace the cost of activities to the products associated with the resources
consumed by those activities.
The ABC system aims to make a more realistic allocation of overheads to objects
(Cooper and Kaplan 1988b). The key to this is the determination of the correct drivers for

91
the production process. Cooper and Kaplan (1988b) also argue that the cost driver can be
defined as the factor that generates and controls the cost of an activity; it is any factor that
could change the cost of the activity. Thus, the cost drivers provide the best explanation
of why costs in an activity cost pool change over time.
Babad and Balachandran (1993) argue that a cost driver is an event, connected with an
activity that results in the consumption of an organisation’s resources. Homburg (2001)
states that the selection of cost drivers is a major issue in designing and implementing an
ABC system. He also concludes that a high accuracy level in allocating overhead costs
often requires a high number of cost drivers, but a small number of cost drivers are
desirable to obtain acceptable information cost, and to make the ABC easier for
management to understand. Sharman (1994) believes that in reality the number of drivers
is strongly influenced by the size and complexity of the organisation; the more complex
the operation, the more likely the number of drivers will increase.
The accuracy of a product cost depends on the appropriate selection of cost drivers,
because cost of activity is an aggregation of cost of primary drivers and product cost is an
aggregation of the cost of activities (Gunasekaran et al, 1999). The selection of the cost
driver reflects a subjective trade-off between accuracy and the cost of measurement
(Cooper and Kaplan 1998). Lin et al. (2001) argue that the most relevant driver(s) can
often be determined by questioning those employees who are most familiar with the
activity to indicate which factor causes an increase or decrease in the time and effort they
spend on the activity. They also add that the cost driver should have a direct relationship
to the amount of effort required to perform the task.
92
4.2.6.1 Types of activity cost drivers
Cooper and Kaplan (1998) advice ABC system designers to choose from three different
types of activity cost drivers:
4.2.6.1.1 Transaction drivers
These kinds of drivers can be used when all outputs make essentially the same demands
on the activity. Cooper and Kaplan (1998) provide some examples, such as the number of
set-ups, number of receipts, and number of products supported, which count how often an
activity is performed.
4.2.6.1.2 Duration drivers
According to the authors, duration drivers should be used when significant variation
exists in the amount of activity required for different outputs. This type includes set-up
hours, inspection hours, and direct labour hours, which represent the amount of time
required to perform an activity. In the case of activity homogeneity, Cooper and Kaplan
(1998) suggest that duration drivers are more accurate and expensive than transaction
drivers because more information is required about resources consumption by activity.
4.2.6.1.3 Intensity drivers
Cooper and Kaplan (1998) argue that although intensity (direct charging) drivers are the
most accurate activity cost drivers they are the most expensive to implement. They also
indicate that this type of activity cost drivers should be used only when the resources
associated with performing an activity are both expensive and vary depending upon the
cost object in terms of both the quantity and price of the resources consumed.

93
Kaplan and Atkinson (1998) argue that there is a choice between the above three types of
cost driver can occur for almost any activity. For instance, in the case of sales activity, as
in the case of retaining existing customers, it could be possible to use a transaction,
duration, or an intensity driver, as following:
(i) Cost per customer (assumes that all customers cost the same)
(ii) Cost per hour (assumes that different customers use different amount of sales
resources time, but each hour of support time costs the same)
(iii) Actual cost per customer (actual or estimated time and specific resources
committed to specific customers) (Kaplan and Atkinson, 1998).
4.2.6.2 The optimal cost driver selection
The selection of cost drivers is the central innovation of ABC Systems, and is the major
issue since accuracy must be traded off against the complexity of the ABC system
(Kaplan and Atkinson, 1998, Homburg, 2001).
Drury (1996) identifies several factors influencing the selection of suitable cost drivers:
(i) It should provide a good explanation of costs in each activity cost pool
(ii) A cost driver should be easily measurable
(iii)The data should be relatively easy to obtain and be identifiable with products.
Therefore, the costs of measurement, the care to ensure that cost drivers represent a
reasonably homogeneous measure of the output for each activity, and a satisfactory
explanation of activity’s costs are factors that should be taken in consideration when
selecting cost drivers. Cooper (1990) argues that the desired accuracy plays an obvious
role in identifying the minimum number of cost drivers that an ABC system uses. That
means that the more accurate a company wants its reported costs to be, the more cost

94
drivers the company will need to achieve that accuracy. Cooper (1988b) states that simple
cost systems impose low measurement costs, but by reporting heavily distorted product
costs, they can cause managers to make poor decisions.
Kaplan and Atkinson (1998) state that the ABC system is not just complex and
expensive in performing cost allocations, but it has the ability of tracing back from any
cost task to underlying economic events. For instance, “set-up costs are assigned on the
basis of set-ups performed for individual products. Product support costs can be traced
back to work performed to maintain products in the organisation. And customer
administration costs can be traced back to handling customer orders, responding to
customer requests, and marketing existing and new products to particular customers”
Kaplan and Atkinson (1998: p110).
Kaplan and Atkinson (1998) have illustrated this issue in the following figure:
Figure 4.8: Designing the optimal ABC system
High
Total Cost
Cost Cost of Measurement Cost of Errors
Low
Low Optimal High
Cost System
Accuracy Source: Kaplan and Atkinson, (1998, p.112)

95
As shown above, the optimal cost system is that which minimises the sum of the cost of
measurement, and the cost of errors, which are associated with making poor decisions
based on inaccurate product costs.
4.2.7 Assigning the cost of activities to cost objects
Cooper (1990) coined the term “first stage cost driver” as the method of assigning costs
from a general ledger line item to an activity cost pool and “second stage cost driver” as
the method of assigning the activity cost to the cost object. Lin et al (2001) argue that a
cost driver is usually articulated on a cost per unit basis by dividing the total cost of
resources used on the activity by the number of cases performed. ABC then multiplies the
usage amount of a cost driver in performing an activity by the unit cost of the driver to
determine the total cost of that activity for an individual cost object.
Lin et al (2001) argue that some costs will trace directly from the ledger to the activity,
whereas others will require extensive interviews with employees and on-site observations
to obtain the amount of resources consumed in the activity. For instance, if one employee
is spending all of his/her time on a specific activity this makes cost tracing from the
ledger easy, whereas, another employee may spend a fraction of his/her time on a
particular activity creating a more difficult task of tracing the cost of labour to the
activity. Due to the indirect nature of the costs, this can be a difficult step in the
implementation process of the ABC system (Lin et al, 2001). In the stage of assigning the
cost of activities to objects, Cooper (1990) suggests designers to take into account the
identification of secondary cost drivers as following:

96
4.2.7.1 Identification of secondary or activity cost drivers
Turney (1996) defines activity drivers as a method for assigning the total cost of activities
to cost objects. He also argues that activity drivers “measure how often activities are
performed on each type of product or customer and the effort involved in carrying them
out” (1996: p108). Cooper (1990) states that once the cost of the resources consumed by
all the activities that are performed in each activity centre has been traced to the activity
cost pool, second-stage cost drivers can be selected. A secondary cost driver therefore, is
a measure of the frequency and intensity of the demands placed on activities by the cost
object.
A cost driver is a variable used as denominator in the rates used to apply activity costs to
product or cost objects (Innes and Mitchell 1998). The cost driver rate however, can be
calculated from:
Cost driver rate = activity cost for period / cost driver volume for period
Turney (1996) identifies some criteria, which should be considered in choosing the
secondary cost drivers: He argues that the cost driver selected should have a strong
correlation with cost level in the activity cost pool. Minimise the number of unique
drivers. Cost and complexity should be directly correlated with the number of drivers.
Select cost drivers that encourage improved performance, and select cost drivers that are
readily available and /or have a low cost of collection
Generally, the number of cost drivers to be used and the selection of the cost drivers, are
two interrelated decisions, because the type of cost drivers selected affects the number of
drivers needed to achieve a desired level of accuracy (Cooper, 1990).

97
4.3 Summary and Conclusion
This chapter has described the technical steps encountered during the design and
implementation of the ABC system. It is clear from the literature review and the case
studies presented that technical issues pose significant challenges in the implementation
of ABC. Indeed, the majority of the surveys conducted (Cobb et al. 1992; Clarke 1996;
Groot 1999; Innes and Mitchell 2000), found that the most common problems
experienced during the design and implementation stages of ABC system were as
follows:
(i) Identifying the major activities that take place in an organisation
(ii) Creating a cost centre/cost pool for each major activity
(iii)Determining the cost driver for each major activity
(iv) Assigning the cost of activities to products according to a product’s demand
(using cost drivers as a measure of demand) for activities
Based on the above explanation, a summary of the technical steps are shows in the
following chart:

98
Figure 4.9: Technical steps in ABC implementation
Source: Own
ABC emphasises the need to obtain a better understanding of the behaviour of overhead
costs, and therefore ascertains the causes that effect overheads and how they allocate or
assign to products. The literature review highlights that the basic principles of ABC are
to identify activities to calculate the cost of each activity and then to cost the product
based on the consumption of activities. Thus, identifying activities must be the first step
in designing an activity-based costing system.
This chapter has organised and discussed the major issues as following:
The major approaches to identifying activities
It was stated in this chapter that defining and describing activities are the heart of
designing an ABC system. Two approaches to identifying activities have been illustrated.
Technical steps in implementing ABC
Selecting cost drivers
Defining activities
Types of cost drivers
Grouping
activities
Identifying
activities
Assigning
costs to activity
Assigning the cost of activity to cost
object
Func
tiona
l de
com
posi
tion
Act
ivity
dic
tiona
ry
Cos
t hie
rarc
hy
Dur
atio
n dr
iver
s
Inte
nsity
driv
ers
Tran
sact
ion
driv
ers
Seco
ndar
y co
st d
river
s
Prim
ary
cost
driv
ers
Bus
ines
s pro
cess
es
Act
ivity
cen
tre
Act
ivity
hie
rarc
hy

99
The ‘Activity Dictionary’ approach lists all the major activities performed in an
organisation and provide work activity description for each. It also facilitates the activity
analysis process by listing the typical activities by function or department. Furthermore,
the activity dictionary helps companies in selecting activity measures ‘drivers’ and
provides a good guide to activity budgeting and performance measurements.
The ‘Functional Decomposition’ approach starts with dividing each box in the
organisation chart into smaller functions until it meets the purpose of the system (ABC).
Visiting and interviewing staff members are very important features of this approach, in
order to determine the work done in each department and then to break out the activity
separately. Using this approach to identify activities enables the organisation to achieve
suitable and economical activities. This approach is based upon four main rules to
identify activities; matching the level of detail to the model’s objectives, using macro
activities to summarise activities, combining insignificant activities, and more clearly
describing the activity labels.
Types of Grouping Activities, two approaches to grouping activities have been
considered - cost hierarchy and business processes. Cost hierarchy was described as a
method to classify overhead costs into different cost pools based on different types of
cost allocation bases. At this stage, the activities in various departments are listed and
analysed based on their cost variability, such as unit level activities, batch level activities,
product level activities, production sustaining level activities and corporate sustaining
activities. Cost hierarchy provides a framework for understanding cost behaviour, forms
the basis for assessing product profitability, evaluates the cost implications of proposed
managerial decisions, and designs advanced cost accounting systems. The second type of

100
grouping activities is business process; it concentrates on aggregating many actions into a
limited number of activities, by taking into account the identification of the significant
activities. The main advantage of this approach is to compare the cost of performing the
same business process at different plants or across different organisational units in order
to identify efficient and inefficient practices.
Selection of the correct cost drivers
Selecting cost drivers was identified as a second common issue in the design and
implementation of an ABC system. ABC is a unique system using multiple cost drivers to
make a more realistic allocation of overheads to products. Cost driver, has been defined
as a factor that generates and controls the cost of an activity. The relationship between the
selected cost drivers and the level of accuracy plays a major role in obtaining an
acceptable information cost through implementing ABC. Three different types of activity
cost drivers have been illustrated in section two: transaction drivers, duration drivers and
intensity drivers. A balance needs to be achieved between the accuracy of the output from
the ABC system and the costs and difficulties associated with operating a more complex
ABC system. Innes and Mitchell (1990) suggest that the activities must be reduced to
ensure a practical and cost effective ABC system is finally designed. They suggest that to
effect this reduction the accountant will need to determine:
(i) The significance of the cost of each activity listed (in order to judge if it is
material enough to justify a separate cost pool) and,
(ii) The factor or factors which influence the cost of each activity (namely the cost
driver) in order to judge whether there is homogeneity in the cost behaviour of
101
separate activities (which may be combined into one cost pool, at least for product
cost purposes).
Designing a hierarchy of drivers to indicate at which level costs are driven (e.g. unit,
batch, product and facility) facilitates an understanding of cost behaviour, which assists
cost control and modelling for decision-making.
Section 2 presents the last stage in designing the ABC system: assigning the cost of
activities to the cost object. This stage involves; calculating the activity costs by
selecting appropriate first stage cost drivers and applying them to distribute the natural
expenses to various activities undertaken. Following this, the product costs are calculated
by selecting appropriate second stage cost drivers and using them to distribute the activity
costs to various products manufactured or services produced.
In summary, the benefits of ABC can be realised if the system is implemented in a
systematic manner. The steps to be followed are objectives selecting, team building, and
designing the system. All these sub-processes take their own time, depending upon the
size and complexity of the organisation. It is also apparent that identifying the suitable
activities and selecting their correct cost drivers play crucial roles in helping an
organisation create an understanding of ABC and leading an organisation to achieve the
implementation of ABC.

102
CHAPTER 5: CONTINGENCY THEORY AND MANAGEMENT ACCOUNTING SYSTEMS 5.1 Introduction: Chapter 3 established that the take up or adoption rate of ABC is relatively low
considering the claimed benefits of the system. Chapter 4 has sought to establish and
clarify the technical difficulties involved in implementing ABC, while acknowledging
that there may also be behavioural and systems issues to be overcome during the
implementation. However, it is a fact that some companies have adopted the system while
some have not. A possible explanation for this might be provided by the adoption of a
contingency framework to examine these issues.
This chapter provides a general review of contingency theory as it has been applied to
management accounting systems design. Chapter 6 will attempt to specifically apply such
a framework to the adoption of ABC systems.
Contingency theory first became prominent as a means of explaining organisational
structure, suggesting that organisational design is contingent upon contingency factors
includes environmental uncertainty, technology and organisational size (Chenhall &
Morris, 1986; Fisher, 1995; Chenhall, 2003). Within management accounting research,
contingency theorists have been concerned with identifying the specific features of an
organisation’s context that impact on particular features of accounting system design
(Otley 1980).
In the past three decades, contingency theorists have called for more research which
examines the influence of contextual settings on the effective design of Management
Accounting Systems (MAS) (Khandwalla, 1972; Gordon and Miller, 1976; Otley, 1980;
Thomas, 1991; Fisher, 1995; Chenhall, 2003; Baird et al, 2004; Gerdin, 2005). Fisher

103
(1995) states that contingency theory has become one of the dominant paradigms for
research on management control design. The majority of empirical studies have relied on
large scale cross-sectional postal questionnaire studies to examine the relationships
between the identified contingent variables and characteristics of management accounting
information (Krumwiede, 1998).
The objective of this chapter is to review contingency theory of management accounting,
providing illustrations of the relationships between the contingent factors and the features
of management accounting systems.
This chapter is structured as follows. The next section introduces the area of contingency-
based Management Control Systems (MCS) and Management Accounting Systems
(MAS) research and provides an overview of findings over the past 30 years. The third
section examines the nature of the contingent factors such as environment, organisational
structure and culture, technology and organisational size. The last section summarises the
chapter.
5.2 An overview of contingency theory of Management Accounting A widely used definition of contingency theory as applied within management accounting
research is provided by Otley (1980: p.413), who states:
The contingency approach to management accounting is based on the premise that there is no universally appropriate accounting system which applies equally to all organisations in all circumstances. Rather, it is suggested that particular features of an appropriate accounting system will depend upon the specific circumstances in which an organization finds itself. Thus a contingency theory must identify specific aspects of an accounting system which are associated with certain defined circumstances and demonstrate an appropriate matching.
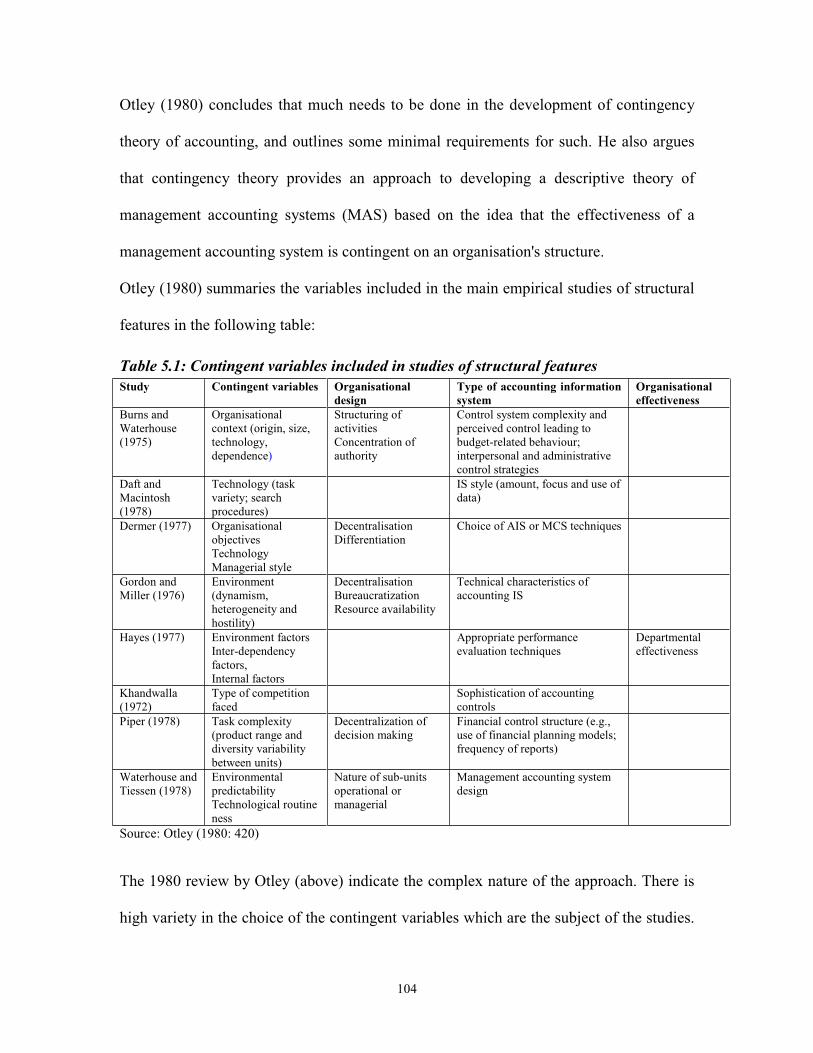
104
Otley (1980) concludes that much needs to be done in the development of contingency
theory of accounting, and outlines some minimal requirements for such. He also argues
that contingency theory provides an approach to developing a descriptive theory of
management accounting systems (MAS) based on the idea that the effectiveness of a
management accounting system is contingent on an organisation's structure.
Otley (1980) summaries the variables included in the main empirical studies of structural
features in the following table:
Table 5.1: Contingent variables included in studies of structural features Study Contingent variables Organisational
design Type of accounting information system
Organisational effectiveness
Burns and Waterhouse (1975)
Organisational context (origin, size, technology, dependence)
Structuring of activities Concentration of authority
Control system complexity and perceived control leading to budget-related behaviour; interpersonal and administrative control strategies
Daft and Macintosh (1978)
Technology (task variety; search procedures)
IS style (amount, focus and use of data)
Dermer (1977) Organisational objectives Technology Managerial style
Decentralisation Differentiation
Choice of AIS or MCS techniques
Gordon and Miller (1976)
Environment (dynamism, heterogeneity and hostility)
Decentralisation Bureaucratization Resource availability
Technical characteristics of accounting IS
Hayes (1977) Environment factors Inter-dependency factors, Internal factors
Appropriate performance evaluation techniques
Departmental effectiveness
Khandwalla (1972)
Type of competition faced
Sophistication of accounting controls
Piper (1978) Task complexity (product range and diversity variability between units)
Decentralization of decision making
Financial control structure (e.g., use of financial planning models; frequency of reports)
Waterhouse and Tiessen (1978)
Environmental predictability Technological routine ness
Nature of sub-units operational or managerial
Management accounting system design
Source: Otley (1980: 420)
The 1980 review by Otley (above) indicate the complex nature of the approach. There is
high variety in the choice of the contingent variables which are the subject of the studies.

105
Also the variables studied may either have a direct impact upon the accounting system
e.g. Hayes (1977), Khandwalla (1972) or impact the system via organisational design e.g.
Piper (1978), Waterhouse and Tiessen (1978). Likewise there are significant variations in
the particular characteristics of the accounting system which are impacted by the
contingent variables.
Merchant (1981) investigates how differences in budgeting systems related to corporate
size, diversity, and degree of decentralisation. The sample included 19 organisations in
the electronics industry and questionnaires were returned from 170 managers. Larger
firms were found to make relatively higher use of formal administrative control.
Administrative control is characterised by greater budget participation by middle and
lower management, greater importance placed on achieving budget targets, more formal
budget communication and greater budget sophistication. In addition, Merchant (1981)
found that managers self-ratings of performance were higher in larger firms which used
administrative control.
According to Tiessen and Waterhouse (1983), one popular view of contingency theory is
that the structure of an organisation depends on the company's technology and
environment; and that the effectiveness of managerial processes (including the
management accounting system), is contingent on the organisation's structure. They
argue that the location of information in relation to technology and environment has an
important influence on organisation structure. In uncertain environments with non-routine
technology, information is frequently appropriate for internal use. Conversely, where
environments are more certain, or where technology is routine, information is useful for
external use. Tiessen and Waterhouse (1983) indicate the dimensions of structure and

106
control include authority structure and activities structure, that is, rules and procedures
that determine the discretion of individuals. Authority relates to social power. In the
contingency model, decentralised authority is more appropriate where uncertain
environments or non-routine technology exist and centralised authority is more
appropriate when environments are certain.
Flamholtz (1983) examines the relationship between budgeting and controls in
organisations from a theoretical and empirical perspective. Flamholtz argues that
exercising control in organisations is significantly more complex than described in
management accounting literature. The author adds that budgeting (and other accounting
systems) are not control systems per se; but rather parts of a total organisational control
system, and concludes that firm culture is a powerful control mechanism that must be
synchronized with formal control system.
Govindarajan (1984) investigates the relationship between environmental uncertainty and
the performance appraisal system. Govindarajan argues that business units which face
higher environmental uncertainty will use a more subjective performance appraisal
system, while those facing lower environmental uncertainty will employ a more formula
based performance appraisal approach. Fifty-eight general managers in eight Fortune 500
companies were surveyed, and results strongly supported both hypotheses.
Chenhall and Morris (1986) examine the effect of structural decentralisation, perceived
environmental uncertainty, and organisational interdependence on Management
Accounting Systems (MAS) design. They use the following framework (exhibit 5.1
below) to investigate the relationship between managers’ perceptions of the usefulness of
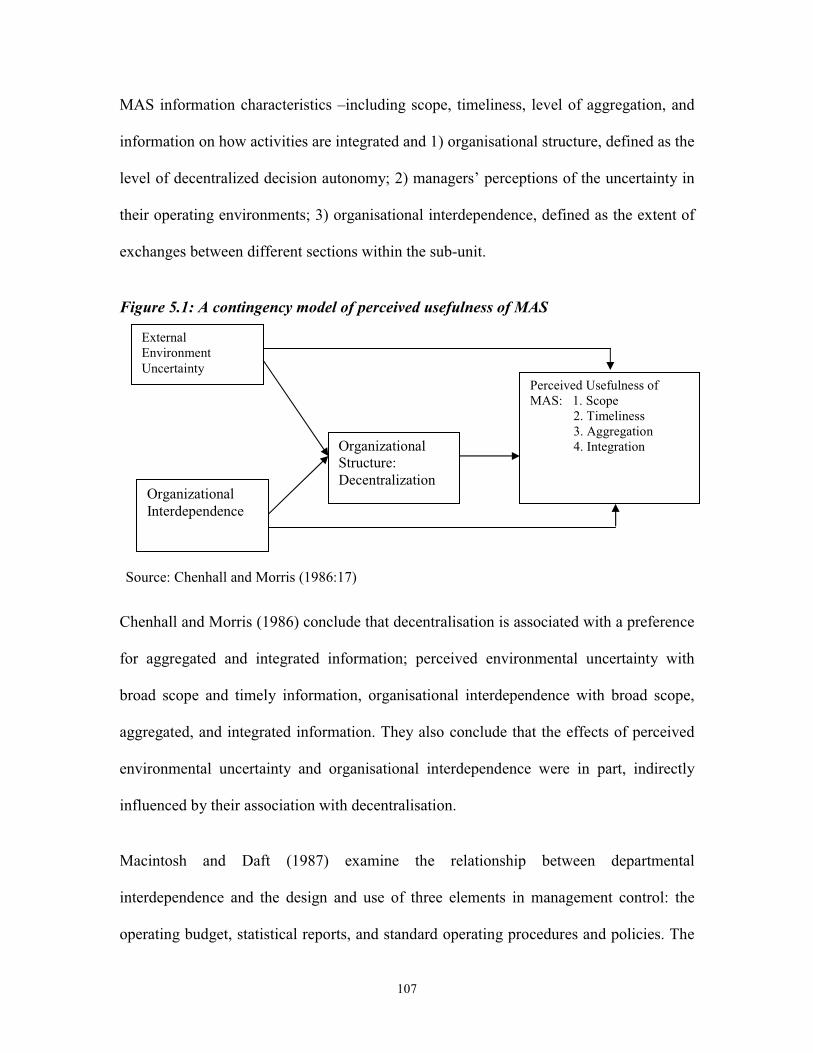
107
MAS information characteristics –including scope, timeliness, level of aggregation, and
information on how activities are integrated and 1) organisational structure, defined as the
level of decentralized decision autonomy; 2) managers’ perceptions of the uncertainty in
their operating environments; 3) organisational interdependence, defined as the extent of
exchanges between different sections within the sub-unit.
Figure 5.1: A contingency model of perceived usefulness of MAS
Source: Chenhall and Morris (1986:17)
Chenhall and Morris (1986) conclude that decentralisation is associated with a preference
for aggregated and integrated information; perceived environmental uncertainty with
broad scope and timely information, organisational interdependence with broad scope,
aggregated, and integrated information. They also conclude that the effects of perceived
environmental uncertainty and organisational interdependence were in part, indirectly
influenced by their association with decentralisation.
Macintosh and Daft (1987) examine the relationship between departmental
interdependence and the design and use of three elements in management control: the
operating budget, statistical reports, and standard operating procedures and policies. The
External Environment Uncertainty
Organizational Interdependence
Organizational Structure: Decentralization
Perceived Usefulness of MAS: 1. Scope 2. Timeliness 3. Aggregation 4. Integration

108
sample included 90 department heads from twenty organizations. The authors found that
standard operating procedures were important control tools in pooled interdependence
departments. Sequential interdependent departments emphasised operating budgets and
statistical reports. Reciprocal interdependence departments de-emphasized all three forms
of control. Macintosh and Daft argue that reciprocal interdependence may pose the
greatest challenge to formal management control systems. They speculated that
departments with reciprocal interdependence may rely on subjective control systems.
Govindarajan and Fisher (1990) investigate the relationships among control systems,
resource sharing, and competitive strategies and their interactive effects on strategic
business unit performance. Data was collected from strategic business unit managers at
24 firms on the Fortune 500 list. Empirical results supported the notion that output
control and high resources sharing were associated with higher effectiveness for low-cost
managers. Behavior control and high resource sharing were associated with higher
effectiveness for differentiation business managers. However, for differentiation strategic
business units with low resource sharing, output was associated with increased
effectiveness. They conclude that control systems are an important ingredient in strategy
implementation and should be tailored to SBU strategy.
Fisher (1995) provides an overview and synthesis of the research literature on
contingency theory and management control in complex organisations. Fisher argues that
one of the major weaknesses of contingent control research is the piecemeal way in
which it is done, adding that many studies examine only one contingent factor and one
control attribute at a time. Understanding interactions between multiple contingent and

109
control factors may be essential in determining the effectiveness of control system design.
The simplest contingency analysis attempts to correlate one contingent factor with one
control system attribute, while more complex analysis simultaneously examines multiple
contingents and control system factors. Fisher (1995) indicates that the ultimate goal of
contingent control research should be to develop and test a comprehensive model that
includes multiple control systems, multiple contingent variables, and multiple outcome
variables. Fisher (1995) takes an initial step by describing the relevant control,
contingent, and outcome variables examined in previous research and categorizing
previous studies by their level of complexity into four categories as following;
The first level of analysis examines the correlation between one contingent factor with
one control mechanism. For example, Macintosh and Daft (1987) examined the
relationship between departmental interdependence and three elements of control: the
operating budget, periodic statistical reports, and standard operating procedures. They
concluded that the role of the control system reflects a fit between the need for
information created by interdependence and the supply of information provided by the
control system. Similarly, Merchant (1985) examined control systems for discretionary
expenditures at the profit level, hypothesing that control systems would differ according
to profit centre strategy. Budget pressure was greater in rapid growth centers than in
profit centers with other strategies. High budget pressure resulted in tight income and
headcount targets in rapid growth profit centers (Merchant 1985).
The second level of analysis examines the joint effect of a contingent factor and a control
mechanism on an outcome variable. The typical outcome variable examined is unit or

110
firm performance. Only the joint effect of one contingent factor and one control
mechanism is examined; the potential interaction between multiple control systems and
contingent factors is not addressed. Some studies within this level, for example Ginzberg
(1980) suggest that the interaction of organisational factors with a firm’s control system
determines the organisational control system fit, in turn affecting organisational
performance. Ginzberg hypothesized that firms with a stable environment and a routine
technology tend to use a procedural control system for higher performance.
Govindarajan (1984) examined the effects of environmental uncertainty on the strategic
business unit. Environmental uncertainty was defined as the level of predictability in the
actions of the customers, suppliers, competitors, and regulatory groups that compose the
external environment of SBU. Govindarajan found that SBUs facing high environmental
uncertainty used a subjective performance appraisal system, whereas those facing a more
certain external environment used a formula-based evaluation approach. In addition, he
found that the matching of a highly uncertain external environment with a subjective
control system led to higher business unit performance.
At the third level of analysis, the joint linkage between multiple control mechanisms, a
contingent factor, and a firm outcome is examined (Drazin & Vande Ven 1985;
Govindarajan, 1988). Such analysis reflects the notion that there might be substitution
and complementary aspects to control system design. Control system substitution implies
the use of different control mechanisms can achieve the same desired results. On the
other hand, control systems may be used in a reinforcing way implying a complementary
relationship. Most third level research has found control to be complementary. This level

111
contrasts with the two preceding levels by examining control mechanisms as a system
rather than being independent.
The last level of analysis is a multiple-contingency approach which acknowledges that
control systems must be tailored to multiple contingent factors (Fisher & Govindarajan,
1993; Gresov, 1989). If contingency demands conflict, simultaneous tailoring of the
control system to all contingent factors in a straightforward design is not possible. The
findings of Gresov (1989) study reports that business units that faced conflicting
contingencies were less efficient than units facing nonconflicting contingencies.
Furthermore, Fisher and Govindarajan (1993) states that the incentive compensation
demands of a low cost/build strategy conflict with those of a differentiation/harvest
strategy, a conflict makes the design of a control system problematic. Fisher (1995) lists
the major contingent studies that were identified in the accounting and management
literature. The list is not exhaustive, but these studies were selected to highlight the
differences between the four levels, as shown in table 5.2 below:

112
Table 5.2: Major contingent studies (four levels)
Level 1 Study Level of analysis
& Type of Methodology
Contingent variables
Control system variables
Results
Macintosh & Daft (1987)
Department Managers – case studies in 4 companies
Department, inter-dependence
Operating budgets, Statistical reports
Sequentially interdependent departments relied more heavily on operating budgets and statistical reports than other departments.
Merchant (1985)
Profit centre managers- case study approach
Profit centre strategy
Budget pressure Rapid growth profit centers had highest level of budget pressure.
Simons (1990)
SBU managers- case study approach
Competitive strategy
Budget Tightness An SBU with a defender/low cost strategy had tight budget goals, little budget revision, and for multi-based incentive when compared with a prospector/differentiation SBU.
Rockness (1994)
R & D Supervisors- case study technique
Task characteristics
Behaviour & output control
Behaviour control was correlated with a high level of knowledge of the transformation process.
Level 2 Study Level of analysis &
Type of Methodology Contingent variables
Control system variables
Results
Ginzberg (1980)
Organisational units – quantitative data based on survey
Environment, Technology
System formality Procedural systems
Procedural control systems are more likely to succeed in firms with routine technologies and stable environments.
Govindarajan & Gupta (1985)
SBU managers – qualitative data based on case studies approach
Product life cycle
Performance appraisal system
Long-run performance measures and subjective approaches are more effective for determining in build SBUs manager compensation than in harvest SBUs.
Govindarajan (1984)
SBU manager- both quantitative and qualitative data were achieved
External environment
Performance appraisal system
A subject performance appraisal system was positively related to higher Environmental uncertainty. This match was correlated with higher performance.
Simons (1987)
SBU managers – qualitative data achieved based on a case study approach
Competitive strategy
Budget flexibility and importance
Managers of defender SBUs had static budget targets, and incentive compensation was based on achievement of budget targets. Prospector SBUs emphasized forecast data and monitoring of outputs. There was weak support that these matches resulted in higher performance.
Fisher (1994)
Departmental Units- case study approach was used to gather the data
Inter- dependency
Budget-based incentive
Interdependency between business units implies a group labor production function which defines the business units that can have the greatest impact on firm performance. Control systems should be tailored to motivate those key units.

113
Level 4 Study Level of analysis
& Type of Methodology
Contingent variables
Control system variables
Results
Gresov (1989)
SBU managers – case study approach
Task Uncertainty Dependence
Firm structure Business unit that faced conflicting contingencies were less efficient than units facing nonconflicting contingencies.
Fisher and Govindarajan (1993)
SBU managers – survey and case study approaches were used.
Porter typology and Product life
Incentive Compensation
The incentive compensation demands of a low/cost build strategy conflict with those of a differentiation/harvest. A conflict makes the design of a control system problematic.
Source: Fisher (1995: 36-38).
Level 3 Study Level of analysis
& Type of Methodology
Contingent variables
Control system variables
Results
Waterhouse & Tiessen (1978)
Subunit managers – case studies in 25 org.
Technology, Environment
System formality, Centralization
Sub-units that face a certain environment or have a routine technology use a formal centralized control system.
Merchant (1981)
Mid-level managers – case studies in 19 firms in Electron.
Size Diversification
Budget pressure Sophistication, and Formality
Increased complexity results in the budget being used administratively. There was weak support that this match resulted in higher performance.
Govindarajan & Fisher (1990)
SBU managers – the results based on a qualitative data.
Porter typology Resource sharing
Behaviour and Output control
High levels of resource sharing and output control had a positive impact on effectiveness of SBUs with a low- cost strategy.
Govindarajan (1987)
SBU managers- both qualitative and qualitative data was obtained.
Porter typology Budget evaluation Style, Decentralization, and Locus of control
The alignment of the three control system variables with competitive strategy results in increased SBC performance.
Chenhall (2003) discusses contingency theory from a functionalist perspective, where the
assumption is that management control systems (MCS) are developed or adopted to assist
in achieving desired organisational goals and outcomes. He also states that the
appropriate management accounting system is contingent on the external environment,

114
technology, organisational structure, organisational size, organisational strategy and
national culture. The figure below illustrates this functionalist perspective:
Figure 5.2: A functionalist contingency model
Adopted from Chenhall (2003)
Gerdin (2005) proposes a multiple contingencies model that examines the combined
effects of departmental interdependencies and organisation structures on Management
Accounting Systems. Exhibit 5.3 below outlines the proposed model.
Figure 5.3: Multiple contingencies model
Source: Gerdin (2005:100)
The findings provide some support for the expected relationships between departmental
interdependence, organisational structure and MAS design in manufacturing departments.
Under conditions of sequential interdependence, broad scope MASs were significantly
over-presented among lateral units. Furthermore, the proportion of Rudimentary MASs
was generally higher among simple units compared with that of the overall sample.
External environment
Technology
Organisational size
Organisational strategy
National culture
MCS Design
Organisational structure
MAS design
Departmental interdependence
Organisational structure

115
Gerdin (2005) argues that a number of findings did not confirm prior research, for
example, traditional MASs was not common among functional units experiencing
sequential interdependence. Gerdin concludes that the unexpectedly high proportion of
traditional MASs among lateral units may be the result of conflicting contingencies. That
is, reciprocal interdependence implies coordination by means of ad hoc mutual
adjustment, whereas coordination and control in larger and more complex organisations
tend to rely on sophisticated and formalized MASs.
This section has reviewed a number of contingency studies conducted during the last
three decades. Most theorists (Khandwalla, 1972; Otley, 1980; Merchant, 1981, 1985;
Tiessen and Waterhouse, 1983; Flamholtz, 1983; Chenhall and Morris, 1986, Macintosh
and Daft, 1987; Govindarajan and Fisher, 1990; Fisher, 1995; Chenhall, 2003; Gerdin,
2005) believe that there is no single optimal way to organize, and it may be a question of
fit between the organisation's structure, its size, its technology, and the requirements of its
environment. In considering management control systems research since 1980, it is
apparent that a number of key variables such as environment, technology, structure and
size have been found as descriptors of fundamental, generic elements of context. A
number of recent studies (Fisher 1995, Chenhall 2003 and Gerdin 2005) focus on
contemporary aspects of the environment, technology and structural arrangements, and
draw on the original organizational theorists to develop arguments that help explain how
the effectiveness of MCS depends on the nature of contemporary settings.

116
5.3 The nature of the contingent variables
Chenhall and Morris (1986) argue that the variables of decentralisation, perceived
environmental uncertainty, and organizational interdependence were identified as
important dimensions of context in the study of MAS design. Thomas (1991) argues that
contingency theory first became prominent as a means for explaining organisational
structure, suggesting that organisational design is contingent on environmental
uncertainty, technology and size. Chenhall (2003) indicates that researchers have
attempted to explain the effectiveness of management control systems by examining
designs that best suit the nature of the environment, technology, size, structure and
national culture.
Based on the above, this section reviews these contingent factors in more detail:
5.3.1 The external environment
One of the earliest studies in relation to the environment was conducted by Lawrence and
Lorsch (1967) who made one of the early contributions to the development of a
contingency theory of organisations. The fundamental question posed in their study is
what kind of organisation it takes to deal with different environmental conditions (p.3).
They describe the major contribution of their study as being ‘the increased understanding
of a complex set of interrelationships among internal organizational states and processes
and external environmental demands’ (p.133-134). By comparing a number of effective
organisations Lawrence and Lorsch suggest that it is possible to understand differences in
their internal states and processes by reference to differences in their external
environments. The conclusion of their study suggests a contingency theory of
organization which recognizes their systemic nature. The basic assumption underlying

117
such a theory, which the findings of their study strongly support, is that organizational
variables are in a complex interrelationship with one another and with conditions in the
environment.
Lawrence and Lorsch (1967) establish that the determinants of effective internal
organisational process are dependent (or contingent) upon variations in the environment
in which the organisation operates. They argue that ‘these outside contingencies can then
be treated as both constraints and opportunities that influence the internal structure and
processes of the organization’ (p.186). Lawrence and Lorsch (1967) also argue that
financial reports and disclosure practices can be viewed as the outcome of an internal
decision process of an entity. Therefore, a simple extension of Lawrence and Lorsch’s
conclusion suggests the possibility of viewing the choice of accounting and disclosure
practices as the result of an internal process which is influenced by outside contingencies.
This suggests that variations in the environment in which companies operate, will lead to
differing decisions as to the optimal methods of corporate reporting and levels of
disclosure.
In his study examining the effect of the external environment (competition) on
management control practices, Khandwalla (1972) outlines some of the competitive
conditions under which sophisticated management controls are more extensively utilized
and those under which they are less extensively utilized. He states that different types of
competition, for example price, marketing or product competition, had very different
impacts upon the uses made of accounting information in manufacturing firms.
Moreover, he argues that the greater the competition, the greater the need to control costs,
and to evaluate whether production, marketing, finance are operating according to

118
expectations. Khandwalla found a positive association between competition and the use
of sophisticated management controls. This implies that as competition intensifies, the
expected benefits from the application of these controls tend to outweigh their costs.
Khandwalla (1972: 282) states that the findings suggest substantial differences among the
three competitions regarding their relationship to the usage of management controls.
Price competition appears to have little, if any, impact on their usage. Distributive
competition appears to have a modest positive impact. Product competition seems to have
a much larger positive effect on their usage. Hence, designers of control systems need to
supplement their information about the extent of the general competitiveness of their
firm’s environment with information about the intensity of specific forms of competition.
Khandwalla (1972) concludes that intense price competition may not require the firm to
have a sophisticated control system, but intense product competition may. Hence the
designers of control systems need to be quit selective and know the intensity of each type
of competition faced by the firm.
Gordon and Miller (1976) identify three main environmental characteristics - dynamism,
heterogeneity and hostility - and their relationship with accounting systems. They argue
that a high level of dynamism, or rate of change, will require frequent control reports
incorporating more non-financial data to provide managers with information on
competitor actions, consumer tests, and shifting demographic factors. Financial data
alone will not provide information which is sufficiently precise to inform managers of
important trends before they become crises (Gordon and Miller, 1976). Regarding the
environment heterogeneity or the number of different product markets served, Gordon
and Miller state that as the level of environmental heterogeneity increases, the greater the

119
need there is for more decentralised accounting system with quasi-independent
responsibility centres. With respect to market hostility, Gordon and Miller (1976) argue
that hostility results from threatening actions of competitors (e.g. cut-throat competition)
or threatening shortages of scarce resources due to strikes, governmental regulations or
credit squeezes. They hypothesized that, as hostility increase, a more sophisticated
accounting information system is required incorporating non-financial information about
critical threats.
Otley (1978) studies the effects of different environments faced by unit managers within
a single firm. He concludes that senior managers were found to use budget information in
quite different ways in ‘tough’ environments compared to ‘liberal’ environments.
Whereas a rigid style of performance evaluation that emphasized the attainment of budget
targets was effective in a liberal environment, a more flexible style was required in a
tough environment.
Gordon and Narayanan (1984) drew on Khandwalla (1972) to study the relationship
between an organisation’s environment, structure and information system, and concluded
that both information systems and organisational structures are functions of the
environment. They found that organisations develop a more organic information structure
requiring more non-financial, external information when the environment was more
uncertain. They found however, after controlling for the effects of the environment, that
an organisation’s information system and structure do not appear significantly related to
each other.
Rayburn and Rayburn (1991) examine various aspects of environmental uncertainty as a
contingency variable, including unpredictability of input-output relationships. They

120
define uncertainty as a lack of information about future events, so that alternatives and
their outcomes are unpredictable. They found a high correlation between environmental
uncertainty and performance evaluation style. Their reasoning was that the greater the
environmental uncertainty, the more difficult it is to prepare satisfactory targets which
could then become the basis for performance evaluation. Their focus was on the
uncertainty arising out of the external environment and was defined to include
unpredictability in the action of customers, suppliers, competitors and regulatory group
that comprise the external setting.
Gernon and Wallace (1995, p: 57) go so far as to suggest that ‘Essentially, the
development of explanatory IAR (International Accounting Research) theories has
involved the interface between accounting and its environment’. They argue that the
influence of environmental factors upon the development of national accounting and
disclosure practices is usefully conceptualised with the aid of a contingency theory
approach. The development of a strong theoretical base for the identification and
conceptualisation of those environmental factors likely to affect accounting and
disclosure practices is a necessary precursor to the empirical investigation of their
relationship. Gernon and Wallace (1995) suggested that contingency theory offers a
systematic approach toward the conceptualisation of the national and foreign
environmental variables which may have a significant bearing on the similarities and
differences in accounting styles and practices across countries.
Chenhall (2003) argues that the external environment is a powerful contextual variable
that is at the foundation of contingency-based research. He suggests that the most widely
researched aspect of the environment is uncertainty. Distinguishing uncertainty from risk,

121
he argues that the former is concerned with situations in which probabilities can be
attached to particular events occurring, whereas uncertainty defines situations in which
probabilities cannot be attached and even the elements of the environment may not be
predictable. In his study, Chenhall suggests that the distinction between dimensions
within the external environment, such as uncertainty, hostility and complexity are
important to MCS design. He also argues that more mechanistic, formal MCSs tend to
provide incomplete information in uncertain conditions and require rapid reformulation to
cope with the unfolding unpredictability. Clear specification of the environmental
dimensions of interest is required, as different theories are required to consider the effects
of diverse dimensions. Chenhall (2003) states that there are rich research opportunities to
investigate appropriate MCS design for settings that are uncertain and also hostile and
complex.
Julie and Audrey (2007) argue that companies are faced with pressures from government,
stockholders, and the public to improve their environmental records while achieving
profitability goals to keep Wall Street happy. They also add that as environmental issues
increasingly influence corporate performance, they need to be institutionalized in
management accounting systems. Julie and Audrey (2007) state that two methods of
evaluating product mix decisions given an environmental constraint include ABC and the
Theory of Constraints (TOC). While ABC is important for understanding how
environmental spending affects product cost, it does not necessarily help in making
decisions to reduce the most environmentally damaging products from the mix.

122
From the above review regarding the external environment, it can be seen that most of the
variables within this category are concerned with the level of environment uncertainty.
Most of the studies reviewed suggest that the greater the perceived environmental
uncertainty the greater the need for more sophisticated management accounting
information system that has a broad scope such as external, nonfinancial and future
oriented information.
5.3.2 Organisational structure and cultural factors
Definitions of organizational structure are plentiful; Lawrence and Lorsch (1967) refer to
structure as the way in which the organisation is differentiated and integrated.
Differentiation is concerned with the extent to which the sub-unit managers act as quasi
entrepreneurs, while integration is defined as the extent to which the sub-units act in ways
that are consistent with organisational goals.
Pugh et al (1969) identify examples of structural mechanisms that have been used
commonly in contingency-based research, including centralization, standardization,
formalization and configuration. Further to this, Perrow (1970) identifies examples of
structure in terms of bureaucratic and non-bureaucratic approaches.
Bruns and Waterhouse (1975) state that the structure of organisations can be viewed as
contingent upon environment and organisation characteristics such as size, technology,
and dependence (the extent to which an organisation is autonomous in relationship with
other organizations) this is conceptualised as following:

123
Figure 5.4: Structure of organization model
Source: Bruns & Waterhouse (1975:181)
Figure 5.4 above illustrates two variables - control system complexity and perceived
control- which are seen as intervening to affect budget-related behaviour. This includes
the quantity of such behaviour, the kind of behaviour, and the quality and satisfaction in
terms of the extent to which the budget is seen as effective in accomplishing
organisational aims. Furthermore, Bruns and Waterhouse (1975) argue that the choice
between decentralisation with structuring and centralization is limited to some extent by
internal and external conditions faced by the organisation. A decentralized and structured
organisation operating in a stable environment seems particularly well suited to the use of
budgetary control. In a highly centralized organization, most decision-making of any
importance is taken centrally with middle managers being constrained by various rules,
procedures and policies that govern what they are able to do. Bruns and Waterhouse
(1975) conclude that large firms with sophisticated technologies that are decentralized
have been characterised by a strong emphasis on formal MCS.
Chenhall and Morris (1986) define organisational structure as the level of decentralised
decision autonomy. They argue that decentralisation provides managers with greater
responsibility over planning and control activities and greater access to information not
available to the corporate body. They contend that an appropriate structural response for
organisations facing uncertainty is to encourage managers to differentiate their segments
Organization context -Origin -Size -Technology -Dependence
Organization structure *Structuring of activities *Concentration of authority -Centralisation -Authority
Control system complexity
Perceived Control
Budget-related behaviour -Quantity -% People - % Time - Kind - Quality & satisfaction

124
with respect to the environments that their sub-units face. These managers will have more
decentralized authority to develop their own goals and management style. They conclude
that organisational interdependence is important when designing an MAS and that a
broad scope, as well as aggregated and integrated information were perceived as useful
by managers of sub-units who had interdependent operation.
Emmanuel et al (1990) argue that organisational structure is a potent form of control
because, by arranging people in a hierarchy with defined patterns of authority and
responsibility, a great deal of their behaviour can be influenced and even pre-determined.
They also add that a contingency approach to the design of control systems suggests that
the inter-relationship between organisational structure and management controls (such as
personnel selection and training) must be considered. However, different forms of
organisational structure will require different types of accounting information to be
provided to enable them to function effectively.
O’Reilly et al (1991) state that the organisational culture profile shows reasonable
reliability and convergent-discriminant validity, for instance, individuals with high needs
for achievement show a significant preference for aggressive, outcome-oriented cultures.
The results of their study also indicate that respondents with high needs for autonomy
show a preference for innovative cultures and negativity toward those characterized by an
emphasis on supportiveness and teamwork. O’Reilly et al (1991) also argue that
individual variations in preferences for different organisational cultures are associated
with interpretable differences in personality characteristics. The structure underlying
individual preferences also appears to compare to the structure underlying the culture in a
selection of firms. O’Reilly et al (1991) conclude that cultures within organisations tend

125
to be similar when the organisations are in relatively homogeneous industries and thus
have similar sizes, structures, levels of technological maturity, personnel configurations,
regulatory demands, and orientations. Conversely, firms in heterogeneous industries are
less similar.
Chenhall (2003) defines organisational structure as the formal specification of different
roles for organisational members, or tasks for groups, to ensure that the activities of the
organisation are carried out. He also adds that structural arrangements influence the
efficiency of work, the motivation of individuals, information flows and control systems
and can help shape the future of the organisation. Chenhall (2003) argues that the ways in
which MCS combine with elements of organisational structure to provide differentiation
and integration within contemporary organisational structures provide many opportunities
for worthwhile research. He concludes that large organisations with sophisticated
technologies and high diversity that have more decentralized structure are associated with
more formal traditional MCS.
Macarthur (2006) studies the influences of national culture on management accounting
practices in order to explain the differences between U.S. and German management
accounting practices. Macarthur argues that when comparing the two countries, one key
cultural difference is uncertainty avoidance. Germany is classified as exhibiting strong
uncertainty avoidance (SUA) with a low tolerance for uncertainty, while the United
States is considered to be a weak uncertainty avoidance (WUA) nation with a high
tolerance for uncertainty. Macarthur concludes that U.S. organisations should consider
management accounting models used successfully in other nations, such as Germany, and
vice versa. However, any improvements are likely to be different to some degree in

126
respective countries because of varying national cultural and other factors. He also
emphasises that national cultural factors are a part of the cost-benefit considerations that
should underlie all management accounting choices.
Henri (2006) examines the influence of organisational culture on the design and use of
one component of management control systems namely performance measurement
systems (PMS). Henri (2006) argues that culture is an omnipresent factor which affects
practically all aspects of organisational interactions, and the understanding of this
contingent factor is necessary to examine and understand PMS from a holistic
perspective. The results of the study show a greater diversity of measurement for
flexibility value firms than control value firms. Henri (2006) also concludes that top
managers of firms reflecting a flexibility-dominant paradigm tend to use more
performance measures.
The above studies suggest that the choice of structure in organizational contingency
research has focused on the appropriate fit between the levels of uncertainty in the
environment and the organization’s technology. Generally, it is believed that more
organic structures are suited to uncertain environments. As with other elements of
context, in contemporary settings, structure remains an important factor in understanding
MCA design. The findings also indicate that the notion of organizational culture has
been important in the study of organizational behaviour for the past two decades. In spite
of disagreements over some elements of definition and measurement, researchers seem to
agree that culture may be an important factor in determining how well an individual fits
an organizational context, and impacts upon MCA.

127
5.3.3 Technology Otley (1980) contends that production technology is the simplest and longest established
contingent factor used in management accounting. He refers to the work of Woodward
(1965) who distinguishes between different types of production technique (e.g. unit
production, small batch, large batch, mass production and process production) which is a
factor that has long been recognised as influencing the design of internal accounting
systems. Otley (1980) states that the nature of the production process determines the
amount of cost allocation rather than cost apportionment that takes place. In job-order
costing, the measure of production is well-defined and only limited allocation and
averaging are required because a large proportion of total costs can be directly associated
with particular jobs. In contrast, the polar extreme of process costing requires extensive
allocation and averaging because the bulk of total costs are incurred jointly by a mix of
final products. Otley concludes that production technology has as important effect on the
type of accounting information that can be provided.
Daft and Macintosh (1978) argue that organisational technology places a critical
constraint on the design of the information system, and found a strong relationship
between the technology of a work unit and the amount and type of information
participants required to perform effectively. Daft and Macintosh (1978) identify four
major categories of technology; programmable, technical-professional, craft, and
research.
Daft and Macintosh (1978) find that successful information systems vary systematically
according to the technology used, and the lesson is that each information system must
match the appropriate work unit technology. Programmable technologies have few
problems, and when problems do arise they are fairly well understood (airline reservation

128
systems and on-line banking are examples of concise information systems). They also
argue that “technical-professional technologies” are characterised by large bodies of
established knowledge. Tasks are quite well understood, and therefore an elaborate
information system -one with a broad base and which draws upon established knowledge
- is called for (accounting, engineering and law are examples of technical-professional
technology). When problems do arise within craft technologies they are handled on the
basis of experience and judgement (specialised psychiatric care unit are an example of
craft technology). Daft and Macintosh argue that diffused information system is suited to
the high uncertainty associated with research-type technologies, and that large amounts of
information of various types have to be accessible or gathered. Moreover, Foster and
Gupta (1990) found that flexible manufacturing systems were associated with
performance measures focused on time, quality, operating efficiency and flexibility. They
also state that there is a change in the costing methods such as, allocation, treatment of
costs as period and changes in the components of direct costs.
Sim and Killough (1998) investigate whether manufacturing practices and management
accounting systems interactively affect performance. The findings of the study provide
evidence that performance can result from complementarities between Total Quality
management (TQM) or Just in Time (JIT) and specific features of management
accounting systems. They find that when a mass production system exists, management
accounting systems with fixed pay and fewer customer and quality-performance goals
have the highest expected performance. In contrast, if a JIT or TQM system exists, then
the highest expected performance occurs when pay is performance contingent and more
customers or quality-related goals exist.

129
Chenhall (2003) defines technology to refer to how the organization’s work processes
operate, and he includes hardware, materials, people, software and knowledge in this
schema. He suggests three generic types of technology of importance to management
control system design: complexity, task uncertainty and interdependence. He develops
propositions concerning generic concepts of technology and MCA: (p: 140-141) “The
more technologies are characterized by standardized and automated processes, the more
formal the controls including a reliance on process control, and traditional budgets with
less budgetary slack. The more technologies are characterized by high levels of task
uncertainty the more informal the controls including: less reliance on standard operating
procedures, programmes and plans, accounting performance measures, behavior controls;
higher participation in budgeting; more personal controls, clan controls, and usefulness of
broad scope MCA. The more technologies are characterized by high levels of
interdependence, the more informal the controls including; fewer statistical operating
procedures; more statistical planning reports and informal coordination; less emphasis on
budgets and more frequent interactions between subordinates and superiors; greater
usefulness of aggregated and integrated MCA”.
Based on the above views of technology, it appears that production technology has an
important impact on the type of accounting information that should be provided for
effective performance. Moreover, the more technologies are characterized by high levels
of task uncertainty, the more informal the controls, resulting (1) in less reliance on
standard operating procedures, behavioural controls and accounting performance
measures; (2) higher participation in budgeting, and (3) grater reliance on personal
controls, and the use of broad scope management accounting control systems.
130
5.3.4 Competitive strategy Khandwalla (1972) outlines some of the competitive conditions under which
sophisticated management controls are extensively utilized and those under which they
are less extensively utilized. The study shows that different types of competition (price,
marketing, and product) may have very different impacts on the use of management
controls in manufacturing organizations. The findings report that of the three types of
competition, product competition seems to have the most impressive impact on the usage
of controls. Price competition appears to have little, if any, impact on their usage of
management accounting, while marketing or distributive competition appears to have a
modest positive impact on the use of management control systems. Moreover, the results
indicate that overall competition is related to the use of flexible budgeting and statistical
quality control of production fairly strongly. It is related less strongly (but significantly,
in a statistical sense), to the use of standard costing, internal or present value in
evaluating investments.
Drury (2000) argues that competitive strategy describes how an organisation elects to
compete in its market and tries to achieve a competitive advantage relative to its
competitors. In fact, increasing competition has led to two consequences. On the one
hand, it has led to the formation of cartels, whereby organisations have informally
cooperated to achieve greater stability in the market place. On the other hand, it has
encouraged management accounting practices such as ABC and target costing, whereby
organisations seek to reference their performance to that of their competitors (Otley,
1994).
Porter (1980) provides a classification of competitive strategy which identifies cost
leadership, differentiation, and focused competitive strategies, while Miles and Snow’s

131
(1978) classification distinguishes defenders, prospectors, analysers, and reactors
competitive strategies. Consideration of competitive strategy has, rather surprisingly, not
been prominent in studies of MCA design, despite arguments that differences in
competitive strategy should lead to differences in planning and control systems design. If
a control system is concerned with ensuring the attainment of objectives, then attention
must be paid to the nature of those objectives, which are codified in competitive strategy
(Ashton et al, 1995).
Chenhall and Langfield-Smith (1998) argue that firms were identified as emphasizing
product differentiation, low price strategies or a combination of both. They also add that
management accounting practices important in assisting managers implement
management techniques were traditional management techniques; ABC; balanced
performance measures; employee-based measures; benchmarking and strategic planning.
5.3.5 Organisational Size
Contingency theories of organizations developed by Burns and Stalker (1961), Lawrence
and Lorsch (1967), and Woodward (1965) suggest that size may affect the way
organizations design and use management accounting systems.
Khandwalla (1972) argues that large firms are more diversified in product lines,
employed mass production techniques, contain more divisions and make greater use of
sophisticated controls and environmental information gathering such as forecasting and
market research. Burns and Waterhouse (1975) identify two forms of control associated
with size: “administrative” with large firms and “personal” with small firms. They argue
that administrative control comprise more sophisticated technologies, formalized

132
operating procedures, high levels of specialists and work related rules. Managers
perceived that employees had high levels of control and had high levels of participation
in setting standards and spent more time in budgeting. They perceived budgets as limiting
innovation and flexibility in structuring organisations. Interpersonal control involved
centralized decision making, individuals saw themselves as having more interaction on
budget related matters, not having their methods of reaching budgets accepted and being
required to explain budget variances. Individuals reported satisfaction with their superior-
subordinate relationships. Bruns and Waterhouse (1975) conclude that two contextual
variables - size of organisation and technology - are significantly and positively
correlated with structuring activities. Bruns and Waterhouse (1975) argue that one
possible implication of this is that large, process dominated, technological organisations
may be not as inhumane as they have been represented in the previous literature. This is
because increased size and advanced process technology lead to or are at least correlated
with structuring of activities, and this structuring implies the distribution of authority and
an increase in perceived control as well as increased participation in planning and
feelings of involvement on the part of managers. They also argue that those who speak
against large organisational units may be ignoring the countervailing tendency of size to
lead to structuring of activities and greater job involvement.
Merchant (1981) considers size as an aspect of a multiple variable approach. He finds that
larger firms tend to make relatively high use of more formal administrative as opposed to
interpersonal controls. The results also highlight that in larger firms where there is greater
diversity and decentralization of decision making, there is greater participation in
budgeting. This is despite less personal interaction between managers, and a general

133
attitude that meeting the budget was important to managers’ career progression.
Furthermore, the results indicate that performance is highest in the larger firms when an
administrative approach to budgeting was used, in contrast to smaller firms where the
best performance was associated with a more personal approach.
Damanpour (1996) argues that size is one of the most important factors affecting the
structure and processes of an organization and both advantages and disadvantages are
associated with large size. Damanpour states that large size has been said to inhibit
innovation because large organizations are typically more formalized, managerial
behavior is more standardized, inertia is higher, and managerial commitment to
innovations is lower. Smaller organizations, on the other hand, are more innovative
because they are more flexible, have greater ability to adapt and improve, and
demonstrate less difficulty accepting and implementing change. In his conclusion,
Damanpour (1996) indicates that the effect of size as a contingency factor is applied to
the structural complexity relating to the innovation triad. The structure of most small
organizations is simple, but, as organizations expand, their structures become more
differentiated and specialized. Growth in size, especially growth from diversification,
might also make the structure more hierarchical and formalized, to enable top managers
to achieve control over diversified activities. He also adds that because bureaucratic
control negatively influences innovations, some large organizations may adopt structures
that are flexible and simple. Therefore, a greater variety of structural forms would exist
for large than for small organizations; structural complexity exhibits a limited range of
values in small organizations.

134
Hoque and James (2000) examine the relationship between organization size, product life
cycle stage, market position, balance scorecard (BSC) usage and organizational
performance. The results suggest that larger firms make more use of a BSC. In addition,
firms that have a higher proportion of new products have a greater tendency to make use
of measures related to new products. The authors infer that large firms make more use of
the measures in the questionnaire used than do small firms. They do not suggest whether
that is because large firms get more benefit from these measures, or because they can
spread the fixed cost of information systems over larger output and therefore find
additional measures more affordable.
The above review regarding organizational size suggests that growth in size has enabled
firms to improve efficiency, providing opportunities for specialization and the division of
labour. However, as an organization becomes larger the need for managers to handle
greater quantities of information increases to a point where they have to institute controls
such as rules, documentation, specialization of roles and functions, extended hierarchies
and greater decentralization. Size has also provided organizations with the resources to
expand into global operations, sometimes by ways of mergers, takeover, licensing or
other collaborative arrangements. The above review also shows that studies which have
examined size have considered its effect together with other elements of context such as
technology, product diversity and have examined an array of controls.
5.4 Summary and Conclusion This chapter reviews the finding relating to contingency theory in management
accounting for the last three decades, and the effects of contingency factors upon the
design of the system. The general argument of contingency theory is that there is no ideal

135
or universal form for an accounting information system. Rather, particular circumstances,
or contingencies, dictate the best choice of system in each particular circumstance. The
chapter shows these contingencies, which are usually classified, are the environment,
organizational structure, technology, competitive strategy, organizational size and
culture. Moreover, the chapter indicates that contingency theories of accounting are the
opposites of universal theories of accounting in that they link the effects or the optimality
of accounting systems to the environment and context in which these systems operate. In
summary of the early management accounting studies that used contingency frameworks,
Otley (1980) concludes that much needs to be done in the development of a contingency
theory of accounting, and he outlines some minimal requirements for a contingency
theory of accounting, stating that:
‘……… a contingency theory must identify specific aspects of an accounting system which are associated with certain defined circumstances and demonstrate an appropriate matching’ (1980, 413). Contingency theory suggests that the implementation of any management accounting
system within individual companies is dependent upon, or at least associated with
particular factors of the organisation. Therefore, this study will base on the perspective
that there is no one universally appropriate MAS system, but that the appropriateness of
any system is dependent on the factors facing the organisation. The following chapter
will review a series of contingent variables which potentially influence the decision of
implementing ABC system.

136
CHAPTER 6: A MODEL OF ABC ADOPTION
6.1 Introduction Chapter five has reviewed contingency theory within management accounting. An
examination of the issues relating to the adoption rates of ABC, from a Contingency
Theory perspective, would suggest that the implementation of ABC (as for any
management accounting system) within individual companies is dependent upon, or at
least associated with particular factors or variables of the firm. Thus, from the perspective
that there is no one universally appropriate MAS system, but that the appropriateness of
any system is dependent on the factors facing the firm, it can be argued that ABC is more
likely to be adopted by those firms for which it is appropriate or suitable. Critically, what
is not as yet established is the identification of the set of variables which would likely
impact upon the adoption of ABC.
Furthermore, such contingency variables will not of themselves explain ABC adoption
rates, rather such contingency factors may be viewed as rendering ABC suitable or
otherwise for adoption by companies but that there are also implementation issues which
influence adoption. The implementation factors can be classified based upon a review of
the literature into three main types Behavioural, Systems and Technical.
This chapter aims to review a series of contingent variables that might effect the decision
of the implementation of ABC systems together with a development of an ABC model of
ABC which seeks to incorporate a contingency approach.
The chapter is structured as follows. The next section reviews the potential contingent
variables and their association with the implementation of the ABC systems. Those
variables consist of; product diversity, cost structure, firm size, types of competition,

137
company sector, nationality, and business unit culture. The third section develops the
research model and the last section summarises the chapter.
6.2. Potential Contingent Factors
Based upon the literature reviewed in chapters four and five, it is possible to identify a
series of factors which potentially impact upon the adoption of ABC by individual
companies.
These factors are considered below, initially on an individual basis.
6.2.1 Company Sector
Drury (2004) argues that management control systems have been shown to differ by
industry type. He argues that firms in the manufacturing sector exercise control over their
possess via a large number of standard cost centres that rely extensively on detailed
variance analysis. In contrast, costs in non-manufacturing industries tend to be mostly of
a discretionary nature.
Innes and Mitchell (1995) examine the relationship of company sector to ABC adoption.
The results show that ABC tended to develop in a manufacturing context, but that the
extent of its adoption in the non-manufacturing sector was not significantly different from
that found among manufacturing firms. The findings show that 36 companies (48.6%) of
ABC users were manufacturing companies. 20 companies (27%) of adopters were
financial and 24.3% comprised service companies.
Clarke et al (1999) use a sample of Irish manufacturing companies to examine their
implementation of ABC. The results show that overall relatively few Irish manufacturing
companies used ABC (12%). The results also indicate that the largest percentages of
138
those implementing ABC are to be found in the drug, pharmaceutical and healthcare
industries (31%). The authors posit that 94% of the respondents from the drug,
pharmaceutical, and healthcare industry are multinational subsidiaries, a factor which
they claim is positively correlated with the decision to adopt ABC. Other types of
manufacturing activities report significantly lower adoption rates of 12% or fewer.
Innes et al (2000) found that the majority of ABC adopters are manufacturing and
financial companies, 12 companies (38.7%) of ABC adopters were manufacturing
industries, and 11 companies (35.5%) of adopters were financial companies. Service
companies represent 25.8% (8 companies) of ABC adopters.
Pierce and Brown (2004) found higher levels of ABC adoption among manufacturing
companies than in the other sectors. The results show that 64.7% of ABC adopters were
manufacturing companies, 23.5% of ABC adopters were service companies and 11.8% of
adopters were financial companies.
The majority of studies have concentrated mainly on the manufacturing and financial
sectors, or in some cases just on a single sector e.g. Clarke’s (1999) study. To date no
Irish study has included all sectors of the economy. The current study will seek to redress
this and will not focus on selected sectors.
6.2.2 Firm Size
It has been argued (Innes and Mitchell, 1995, 1998; Bjornenak, 1997; Van Nguyen and
Brooks, 1997; Krumwiede, 1998; Clarke et al, 1999) that the size of the company usually

139
explains the rate of adoption of sophisticated cost accounting systems as, in general,
larger size increases complexity and usually requires greater accounting resources.
Innes and Mitchell (1995) examine the relationship between company sizes in terms of
annual turnover and the implementation of ABC. They found that company size does
provide a statistically significant source of differentiation among ABC adopters, where a
markedly significant higher rate of adoption is apparent in the larger firms surveyed.
Bjornenak (1997) uses the number of employees as the measure of company size, finding
that the difference in size between adopters and non-adopters is strongly significant. He
concludes that the only factor described to discriminate between adopters and non-
adopters seems to be company size. Bjornenak (1997) also argues that larger firms have
larger information fields (i.e. contacts and communication channels) and the necessary
infrastructure, and are therefore more likely to adopt innovations.
Van Nguyen and Brooks (1997) test the impact of firm size and hypothesis that larger
firms are no more likely to implement ABC than smaller firms. They use two variables as
proxies for firm-size, turnover and number of employees of companies. The results
indicate that mean-values of both variables between the two groups; adopters and non-
adopters, were significantly different (t-values are 2.38 and 1.78), and the mean-values of
group 1 (ABC adopters) were all greater than those of group 2 (non-ABC adopters). This
would indicate that average firm-size of group 1 was greater than average firm-size of
group 2 at .05 level of significance. As a result, the null hypothesis cannot be accepted,
suggesting that larger firms are more likely to adopt ABC compared to smaller firms. Van
Nguyen and Brooks (1997) justify this by arguing that large firms are more likely to have

140
greater access to individuals with the knowledge to design and implement ABC systems.
In addition, as ABC implementation is costly, larger firms are more likely to obtain
economies of scale, with the cost spread across several products.
Booth and Giacobbe (1997) found a positive relationship at the initiation of interest in
ABC stage, but no relationship for the later evaluation and adoption stages. They reason
that large firms have more discretionary resources (such as personnel, computing
facilities and time), and are therefore more inclined to adopt ABC systems.
Krumwiede (1998) tests how size in terms of level of sales revenue affects ten stages of
the ABC implementation process, based on a survey of U.S. manufacturing firms. The
findings indicate that larger companies are more likely to adopt ABC than smaller
companies. Krumwiede (1998) argues that one possible explanation is that sales are
correlated with the organisational level of the reporting business unit. To test whether
ABC adoption is related to ‘pure’ size, the adoption model was applied to only the 101
business units reporting the ‘whole company’ level. Although not quite as significant
(p=.014), size is still highly related to ABC adoption for whole companies.
Cinquini et al (1999) examine firm size in terms of number of employees. Their results
show that the firm’s size does not relate to ABC adoption or consideration in a significant
way.
Clarke et al (1999) found a correlation between firm size in term of annual sales and
adoption of ABC. The results report that 18% of the firms with more than £50 million in
sales use ABC while only 4% of the firms with sales fewer than £10 million use ABC.

141
For the smaller firms (less than £10 million), the results show that 70% have not
considered ABC. Clarke et al (1999) argue that one would expect larger firms to have
adopted more sophisticated costing systems such as ABC given that larger firms have
more complex and more varied product lines.
Groot (1999) argues that the bigger the company, the more resources will be available to
develop, implement and operate ABC systems. The results examine size in terms of full-
time employed workers, and indicate that the difference between the categories “ABC-
users” and “Non-ABC users” is significant (Chi-square, p<0.05). More than half of the
non-ABC users are small companies of between 50 and 150 employees, while half of the
ABC-using companies employ more than 250 workers. Groot states that these results
confirm the hypothesis that, on average, larger companies apply ABC more frequently
than do smaller companies, when size is expressed in terms of full-time workers
employed.
Innes et al (2000) examine the influence of company size in terms of annual turnover.
The results indicate a statistically significant size effect, that larger companies are more
likely to adopt ABC.
Baird et al (2004) examine the association between business unit size in terms of number
of equivalent full-time employees in each unit, and the adoption and implementation of
ABC systems. The results indicate that there was no association between business unit
size and the ABC systems. They summarise that “while size is important generally in the
implementation of Activity Management (AM), its importance at the ABC level may be

142
less than that of other factors, particularly the factor of decision usefulness of cost
information” (Baird et al. 2004:p.394).
Pierce and Brown (2004) use two criteria for size, annual turnover and number of
employees to measure the relationship between size and ABC adoption. The results show
that companies with larger turnover are more likely to adopt ABC (Chi-square 8.104, p-
value 0.044) and that companies with larger numbers of employees are more likely to
adopt ABC (Chi-squared 7.417, p-value 0.060).
With the exception of the studies by Cinquini et al (1999) and Baird et al (2004), all other
studies have found that firm size is significantly and positively associated with ABC
adoption. The majority of the studies use a single measure of company size, but the
measure used varies between the studies e.g. level of sales revenue, number of
employees, annual turnover, and full time workers employed. It is however probable that
these various measures may be positively correlated. This is supported by the study by
Pierce and Brown (2004) which found that annual turnover and number of employees,
when tested separately, were both significantly and positively associated with ABC
adoption. This study will adopt a similar approach to that of Pierce and Brown (2004) and
measure company size both by annual turnover and number of employees.
6.2.3 Nationality
Few studies examine the impact of nationality on the implementation of ABC systems.
Peter (1998) examines the relationship between national culture and ABC systems, and
how international culture diversity could affect an ABC implementation. The data was
gathered from a field-based study of the Harris Semiconductor (HS) Company, by

143
visiting each U.S. plant and the Malaysia plant. The company has fabrication plants in
Findlay, Ohio; Mountaintop, Pennsylvania; and Palm Bay, Florida; as well as an
assembly and test facility in Kuala Lumpur. The comparisons between the national
cultures of the two countries where HS’s plants are located - the U.S. and Malaysia - are
discussed. The auther hypothesises that the level of ABC success will be greater in HS’s
Malaysia plant relative to its U.S. plants. The findings of the study show that, at a
national level, the Implementation Attitudes Questionnaire (IAQ) scores, interview
results and ABC usage data all indicate higher levels of ABC success in HS’s Malaysia
relative to its U.S. plants. At the plant level, Malaysia had higher indications of ABC
success than all three U.S. plants on at least two out of three of the measures used in the
study. The findings also show that apart from Palm Bay’s interview results, all the
findings at the plant level indicate greater ABC success in Malaysia relative to the U.S.
Clarke et al. (1999) argue that the distinction between subsidiaries of multinational firms
as compared to national firms is an important one in ABC adoption. They argue that
managers of a subsidiary of a multinational firm based in Ireland may be more aware of
and adopt new management accounting practices through communication with other
divisions and corporate headquarters, or through international transfers of personnel in
comparison to managers of solely national firms. They also state that “it is less likely that
managers of national firms are exposed to new techniques since communication and
managers are mostly, if not exclusively, in-house” (p:450). The results of their survey
indicate that a greater percentage of multinational subsidiaries (14%) use ABC than do
national firms (5%). Moreover, 70% of national firms have not considered ABC
compared to half of multinational subsidiaries in Ireland. The study also examines the

144
impact of multinational/national status and firm size in isolation, finding that national
firms, whether small or large, are far less likely to adopt ABC than multinational
subsidiaries.
Pierce and Brown (2004) found that ABC adoption rates are higher among indigenous
Irish firms than multinationals, although not significantly higher (Chi-squared 0.591, p-
value 0.442). The results show that 50% of ABC adopters were indigenous Irish firms,
whereas 44.1% of adopters were multinational firms and 5.9% represents others. These
results are in conflict with Clarke et al (1999) mentioned above.
While few studies have addressed the issue, the above studies indicate contradictory
results in relation to the nationality and ABC adoption within the Irish context. This study
will include nationality as a contingent factor, and examine the association between
nationality and ABC adoption within Irish environment.
6.2.4 Type of Competition
Cooper (1988b) argues that it is possible to define the conditions when ABC is most
likely to be justified. Specifically, he states that implementing an ABC is advisable if the
existing cost system was designed when: measurement costs were high, competition was
weak, and product diversity was low, but that now measurement costs are low,
competition is fierce, and product diversity is high. This argument, that increasing
competition will support ABC adoption is generally supported by the finding of
Khandwalla (1972) who found a positive association between intensity of competition
and used of sophisticated management control, and Gordon and Miller (1976) who argue
that treating actions by competitors require a more sophisticated accounting system.

145
Kalagnanam and Lindsay (1998) argue that currently the business environment is
characterised by intense global competition, with organisations competing not only on the
basis of price but also on quality, product flexibility, and response time. These
competitive circumstances have increasingly led organisations to focus on the
manufacturing function as being of strategic importance, providing an important source
of competitive advantage. For many organisations, this has led to the adoption of
Automated Manufacturing Environment (AME). Berliner and Brimson, (1988) state that
ATM has dramatically changed manufacturing cost-behaviour patterns. The direct labour
and inventory components of product cost are decreasing, while depreciation,
engineering, and data-processing costs are increasing. These changes have resulted in
higher overhead rates and a shrinking base of labour over which to allocate those costs.
Organisations have always had to face the problem of choosing an appropriate cost-
allocation system. However, changing cost-behaviour patterns demands that
organisations re-evaluate their allocation decisions continually (Berliner and Brimson,
1988).
Van Nguyen and Brooks (1997) develop a hypothesis regarding firms facing high level of
competition. They hypothesise that such firms are no more likely to adopt ABC than
those which operate in less competitive industries. The t-test results show that the mean-
value of ABC adopters was significantly different and greater than that of non-adopters.
The null hypothesis cannot be accepted, suggesting that companies which are exposed to
more competitive environments are more likely to adopt ABC.

146
Bjornenak (1997) uses two measures to indicate competition; the first one being the
percentage of sales being exported. This is based on an assumption that competition is
higher in the foreign markets. The other variable is the number of competitors in the
markets of the firm’s major products. This is a category variable in which the value 1
constitutes monopoly, 2 constitutes 1-3 competitors, 3 is 4-10 competitors and 4 means
more than 10 competitors. The results show that the two measures of competition used
are positively correlated (r = 0.413). Although the results are only weakly significant for
export in the non-parametric test, both variables indicate that the non-adopters of ABC
have a higher number of competitors and a higher export rate. Bjornenak indicates that
this is not consistent with an a priori assumption that higher competition means higher
adoption rates. A test was performed to ascertain whether the results can be explained by
a high representation of process industries in the group of non-adopters as these
companies normally have simpler costing problems and a higher export rate. Bjornenak
adds that the results gave the same picture after excluding these industries. The
competition variables are not strongly correlated with the other variables used in the
study.
Cinquini et al (1999) argue that firms following a differentiation/quality strategy may
further enjoy the benefits of ABC through a better comprehension of profitability and
differentiation costs. The results of the survey indicate that 23% of the Italian firms are in
price/cost competition. Of these only a small percentage were adopting or implementing
ABC (30%). They argue that this fact does not prove to be statistically significant. Even
including firms that are considering adoption of ABC does not establish a relationship
between key competitive factors and ABC that is statistically significant.

147
Based on the above, there is an apparent conflict between the empirical findings, which
are generally non supportive of an association between high levels of competition and
ABC adoption rates, and the more theory oriented work which generally is supportive of
such an association. However, the empirical findings are not extensive, nor do they
differentiate between different types of competition. Given this ambiguity, the current
study will seek to investigate the possible linkages between competition and ABC
adoption rates.
6.2.5 Product Diversity
Kaplan (1988) argues that the traditional approach to fixed overhead manufacturing
costing becomes increasingly dysfunctional when product diversity increases within the
firm. Cooper (1988a) states that increasing product diversity introduces the risk of
significant inaccuracies in product cost assignment using traditional costing approaches;
such diversity includes production volume diversity, size diversity, complexity diversity,
material diversity and set-up diversity. It is claimed that ABC avoids the deficiencies of
the traditional absorption costing methods, which use bases such as direct labour to
assign overhead costs. It is also claimed that it can provide more precise information
about the cost of the product than the traditional cost systems can, in particular when
manufacturing processes are intricate or products are produced in a diversity volumes and
sizes (Cooper and Kaplan 1988a).
Cooper (1988b) illustrates a simple activity-based costing system by a series of examples
in order to explain and clarify the effect of varying product volume and size on reported
product costs by traditional systems and activity-based costing. He refers to four products
which are produced on the same equipment and by similar processes (see chapter two for
148
more details). The products differ either by size (small and large) or by volume (low and
high) in a single production run.
The example illustrates that traditional costing systems report distorted product costs
whenever companies produce a diverse range of low-volume and high-volume product.
Furthermore, the results report how volume-based systems could overcost high-volume
products and undercost low-volume products when the costs of some product-related
activities are unrelated to volume. Cooper (1988a) concludes that traditional systems
report distorted product costs whenever companies produce a diverse range of products,
by over costing high-volume products and under costing low-volume products. ABC on
the other hand seeks to address these very issues. Cooper (1988a) concludes that product
costs reported by the ABC system are more accurate than those by the traditional volume-
based system in many situations, including diversity of product size or volume.
Bjornenak (1997) uses the number of product variants and the degree of customised
production as measures for testing product diversity as a factor related with ABC
adoption. Bjornenak (1997) divides the number of product variant into four groups based
on the log N10 value (1-10, 11-100, 101-1000, more than 1000). The results indicate that
ABC adopters have a higher number of product variants than non ABC adopters (mean-
2.667:2.348) and (median- 3:2) respectively. Furthermore, the results show that the non-
adopters make significantly more customised products than adopters; highly customised
production normally means high product diversity, especially complexity diversity,
material diversity and set-up diversity. Bjornenak (1997) concludes that ABC is adopted
by companies with a high number of semi-standardised products.

149
Van Nguyen and Brooks (1997) provide empirical evidence relating to the characteristics
of firms adopting ABC compared to those not adopting ABC. They test the hypothesis
that firms which have more production complexity are no more likely to implement ABC
than other firms. They use four variables as proxies for production diversity: the degree
of flexibility in production facilities, the frequency of changes in products and product
design, the degree of volume variation between products, and the degree of variances in
complexity between products. T-tests compared mean-values of each variable between
the two groups, and the results showed that, in all cases, means between the two groups
were not significantly different. They conclude that companies which have adopted ABC
or plan to adopt ABC possess no significant difference in terms of production diversity
compared with firms which have not adopted ABC.
Clarke et al. (1999) examine the adoption of ABC systems by Irish manufacturing
companies. In relation to product diversity, Clarke et al (1999) use product lines which
they divided in four categories or groups (single product, 2-5 products, more than 5
similar products, and more than 5 dissimilar products). The results show that firms which
produce more than five similar products tend to be more likely to use ABC than firms in
the other categories with fewer products: (17%) by comparison with the other categories
(0%, 7% and 6%) respectively .
Groot (1999) develops two hypotheses regarding production-related characteristics of
Dutch food companies using ABC and not using ABC: the first is that ABC-using
companies produce a larger number of different products than do non-ABC-using

150
companies. The second hypothesis is that ABC-using firms use more product lines and
packing lines than do firms not using ABC for the manufacture of their products.
The results of the study do not support the hypotheses; the difference between ABC-users
and non-ABC users are not significant when the number of different products is taken
into consideration. Groot (1999) argues that perhaps the number of different products is
too crude an approximation of the demand for overhead activities, and more information
is needed about the ways in which food products are produced. It is conceivable that a
highly automated production line is capable of producing a large number of different
products without incurring much overhead. In this situation, overhead activities are then
more closely linked to maintenance of the production line than to the number of different
products. More overhead costs would then be related not to the number of products but to
the number of production lines and packing lines operated. This argument is supported by
the results of the differences in the number of production and packing lines between
ABC-using food companies and non-ABC-using companies. The difference in the
number of production lines is as expected and is statistically significant: on average,
ABC-using firms operate more production lines than do firms not using ABC.
Abernethy et al (2001) use data collected from multiple sites to examine the implications
of product diversity for costing system design choices, and also to explore factors
influencing costing system design. The study is based on semi-structured interviews
within five different manufacturing firms, and it concludes that multiple products do not
in themselves generate a demand for a hierarchical-based costing system. One of the
firms (FT2) produced more than 2000 different products, and while they did not have
hierarchical cost pools, managers were satisfied with the information produced. Product

151
diversity was achieved in (FT2) through investment in advanced manufacturing
technology (AMT) that facilitated rapid product or volume changes. The authors
conclude that there is no reason to believe that the information provided by a system that
has volume-related cost drivers will be significantly distorted. It is only when product
diversity is associated with variations in the material composition, batch sizes, set-up
times and complexity of the manufacturing process that individual products will consume
disproportionate levels of overhead resources relative to their volume. It is then that the
potential for distortion becomes significant.
Brown et al (2004) examine the influence of product diversity as a technological factor
on firms’ initial interest in ABC and their decision to adopt it or not, by testing if the
higher levels of product complexity and diversity will be positively associated with the
adoption of ABC. The results indicate that product complexity and product diversity
display significant and positive association (p<0.05 level) with the implementation of
ABC systems.
Based upon the above, the balance of research evidence appears to be supportive of the
impact of product diversity upon ABC adoption. With the exception of the Van Nguyen
and Brooks (1997) study, all other studies offer support. The Abernathy el al (2001) study
suggests that the variations in material composition and manufacturing complexity
associated with product diversity provides the link to adoption. Groot (1999) shows that it
is the number of production lines which appear relevant, and the other studies likewise
offer strong support, either of a direct or indirect nature. It is also important to remember
that the methods of measuring product diversity and the categories used for grouping

152
products differ between the studies. Therefore, there is a strong evidential support that
product diversity, depending upon how it is measured, is a potential contingent factor
which impacts upon the decision of implement ABC.
6.2.6 Cost structure (Level of Overhead)
The early published literature on ABC (Cooper and Kaplan, 1988; Cooper, 1989; Drury,
2000; Mitchell, 1994) argues that as overhead becomes an ever larger component of
product cost, it compounds the problematic distortions inherent in traditional volume-
based costing systems. This literature also states that product diversity may itself ‘cause’
growth in overheads and a shift from volume-driven overhead costs (Cooper, 1988a,
1988b). The growth in overheads and their change in nature were seen to create a demand
for better information because incorrect overhead allocation had the potential to threaten
firm survival. Bjornenak (1997) argues that the importance of the allocation of these costs
is a function of the amount of overhead costs to be allocated, and that an important
argument for introducing ABC is the claimed change in cost structure in recent years.
Booth and Giacobbe (1997) found that companies with higher levels of overhead were
more likely to initiate interest in ABC. The authors did not find a relationship for the later
adoption stages of evaluation and adoption. O’Dea and Clarke (1994) on the other hand
indicate that small percentage of overhead costs in the cost structure was one of the
reasons of not implementing the ABC system.
Brown et al (2004) examine if the level of overhead is positively associated with the
decision to adopt ABC. The results of the study indicate that the level of overhead is the

153
only technological factor which has no association with the adoption of ABC (P-
value=0.130).
Clarke et al (1999) examine the relationship between manufacturing overhead as a
percentage of total cost and ABC implementation. The results show that no relationship
exists between the percentage of manufacturing overhead to total cost and ABC. The
results also indicate that of the 28 firms which report relatively substantial manufacturing
overhead costs (comprising 26-50% of total costs), only 18% have adopted ABC, and
nearly a third have not even considered ABC, while two-thirds of the firms with very
little overhead have not considered ABC (64% of 62 firms).
Groot (1999) examines the difference between ABC-users and non-ABC-users in terms
of overhead costs. The results show that there is no difference between the two groups
regarding the total overhead costs in percentage of total costs.
Van Nguyen and Brooks (1997) provide empirical evidence relating to the overhead costs
of firms adopting ABC compared to those not adopting ABC. They develop a hypothesis
which states that firms which have a greater percentage of total cost as overheads are
more likely to implement ABC than other firms. This implies that the proportion of
overheads in total manufacturing costs for companies in group 1 (those which have
adopted or intend to adopt ABC) would be greater than for companies in group 2 (those
which do not intend to adopt ABC). The T-test results indicate that the mean values of the
proportion of overheads (%) in total manufacturing costs between the two groups were
not significantly different (t-value = -.48). This would indicate that no relationship exists
between overheads and ABC adoption.

154
Bjornenak (1997) tests the argument that companies with high overhead costs compared
to total value added costs (i.e. direct labour + overhead) were among the first adopters of
ABC. The results show a weak significance in favour of the alternative hypothesis, i.e.
adopters having a different cost structure than non-adopters. Bjornenak (1997) states that
a higher percentage overhead costs for the adopters is consistent with the results found in
Langholm (1965) who studied the adoption of variable costing and found strong (-er)
statistical evidence of a link between cost structure and the adoption of variable costing.
Cinquini et al (1999) explore ‘state of the art’ management accounting practices in large
and medium size manufacturing firms in Italy. They examine if the overhead cost
structures drive firms to ABC systems. The results indicate that there is no evidence of
any significant difference in the degree of adoption of ABC between firms and a high
proportion of overhead to total cost. The results also show that the difference in the
percentage of companies adopting or considering adoption is not significant in firms with
high share of overhead from those with low share.
Based on the above, it is interesting to observe the conflict between the theoretical
literature and the results of the surveys conducted on the implementation of the ABC. The
theoretical literature (Cooper and Kaplan, 1988; Cooper, 1989; Drury, 2000; Mitchell,
1994) agrees that growth of overhead compounds the problematic distortion inherent in
TCS; therefore implementing ABC is the solution to overcome these distortions. On the
other hand, the findings of the surveys viewed above show very little evidence which is
supportive of the argument that high overheads are associated with ABC adoption, in
other words they report that there is no association between the percentage of

155
manufacturing overhead to total costs and the implementation of the system. In an
attempt to conclude this conflict, this study will include overhead proportion as a
potential contingent factor and will seek to establish if it is associated with ABC
adoption.
6.2.7 Business Unit Culture
Baird et al. (2004) examine the extent to which activity management practices are
adopted by Australian business units at each of Gosselin’s levels of Activity Analysis
(AA), Activity Cost Analysis (ACA) and Activity-Based Costing (ABC). They also
examine business unit cultural dimensions (innovation and outcome orientation) for their
association with the extent of adoption of activity management at each of Gosselin’s three
levels mentioned above. The authors argue that cultural dimensions were not chosen as a
comprehensive overview of the factors affecting adoption of activity management, but as
examples of factors that have been suggested or found to affect adoption of activity
management in general. They also indicate that the motivation for including selected
business unit cultural dimensions (innovation and outcome orientation) is twofold. First,
culture has been proposed as a factor with significant potential to affect adoption of
activity management, and second, no study to date has empirically examined the
association between culture and activity management adoption. Baird et al. (2004) have
drawn ‘innovation’ and ‘outcome orientation’ for the O’Reilly et al. (1991)
Organizational Culture Profile (OCP), stating that innovation represents a business unit’s
receptivity and adaptability to change, and its willingness to experiment, which is likely
to be associated with adoption of activity management. Citing Parker (1997, p.120), they
argue that “resistance to (innovation and) change represents one of the most profound

156
sources of potential adoption and implementation problems for new management
accounting techniques and systems such as ABC”.
The authors expected that business units with more innovative cultures will, therefore, be
more likely to experiment with new practices, such as activity management, than units
with less innovative cultures. Baird et al (2004) argue that outcome orientation refers to
the extent to which business units emphasise action and results, exhibit high expectation
for performance, and are competitive. The authors expected that business units with high
outcome orientation are likely to be attracted to practices, such as activity management,
that claim to facilitate improvements in processes and to enhance performance and
competitiveness. A survey questionnaire was mailed to the financial controllers of a
random sample of 400 Australian business units chosen from the Kompass Australia
(2001) directory. The two business unit culture dimensions, innovation and outcome
orientation were measured using the sum of the cultural value items which loaded on
those dimensions following a factor analysis of the 26-item version of the organizational
culture profile. The results show that the association between business unit culture and
the extent of adoption of AA, ACA, and ABC is significant (.000). The results also
indicate that business unit culture variables, in aggregate, are statistically significant and
larger than the amount explained by business unit size and decision usefulness of cost
information.
The authors noted that the focus of the study is on the association between each of the
separate cultural variables and the extent of adoption of activity management practices.
The results of the hierarchical regression however indicate that the cultural variables, in
aggregate, are significant in their association with extent of adoption, providing the basis

157
to examine the individual associations in the subsequent stepwise regression. Baird et al
(2004) argue that considerable support was found for the expected association between
the two business cultural dimensions and adoption of activity management at all three
levels of AA, ACA and ABC. Innovation was associated with the first two levels of AA
(p = .016) and ACA (p = .023), with more innovative business unit cultures adopting AA
and ACA to a greater extent than less innovative cultures, but not with ABC. Outcome
orientation was associated with extent of adoption at all three levels of AA (p = .045),
ACA (P = .036) and ABC (p = .009), with business unit cultures higher in outcome
orientation adopting all three levels to a greater extent than cultures lower in outcome
orientation.
The above study is the only study which examines the association between business unit
culture and adoption of activity management. The influence of business unit culture on
ABC systems appears, as of yet, and by comparison with the other variables considered
above, to be under-theorised. However, given the strength of the finding and the logic of
the supporting argument the current study will use business unit culture as a contingent
factor and examine its association with the implementation of ABC by Irish companies.
6.3. Developing the Research Model
The above review has identified seven factors, production diversity, cost structure, firm
size, types of competition, company sector, nationality and business unit culture as, at
least potentially, impacting upon the adoption of ABC. While the studies reviewed are
not unanimous in their support of the impact of the individual variables upon ABC
adoption, and while different studies of the same variable sometimes use different
operational definitions of the variables, and indeed of ABC adoption, non the less there

158
does appear to be support for a general argument that the seven identified variables
potentially impact upon ABC adoption.
Based upon the above it is possible to develop a basic contingency model of ABC
adoption, as is shown below in figure 6.1.
Figure 6.1: Basic contingency model of ABC adoption The above “Basic Model” seeks to identify those factors which, the literature suggests,
likely impact upon the adoption of ABC i.e. companies which have a particular “profile”
relating to the above factors are more likely to find ABC useful and hence to adopt the
system then companies which have alternative “profiles”. However the above model does
not encompass the findings relating to the barriers and difficulties to implementing the
ABC system. These barriers and difficulties have been considered in chapter 3, and have
been identified as technical, behavioural, and systems related.
Given the existence of such barriers and difficulties, the above “Prime Factors” alone
may not of themselves adequately explain the actual take up of ABC systems. Rather,
Prime factors - Company sector - Firm Size - Nationality - Type of competition - Product diversity - Cost structure - Business unit culture
ABC-Adopters Companies
Non-ABC Adopters Companies

159
while the “Prime Factors” may indicate the contingencies which render ABC particularly
appropriate to companies; unless the barriers and difficulties to the implementation of the
system have been overcome in some way or other, companies that would otherwise find
ABC appropriate will not have adopted it. This argument can be presented
diagrammatically as in figure 6.2 below:
Figure 6.2: contingency factors and ABC difficulties
The model suggests that in the adoption of ABC, likely two sets of variables are at work.
The “prime Factors” which likely render it appropriate or useful for the company to adopt
the system, and the company’s ability, or willingness to address and overcome the
barriers and difficulties associated with implementation. Thus the model would suggest
that two companies which have similar profiles with regard to the prime factors may yet
reach different decisions with regards to ABC adoption, due to their differing abilities or
• Technical issues • Behavioural issues • Systems issues
ABC-Adopters
Non-ABC Adopters
Prime factors - Company sector - Firm Size - Nationality - Type of competition - Product diversity - Cost structure - Business unit culture

160
willingness to address and overcome the issues relating to implementation. It would also
suggest that the non adoption of ABC may result either from a failure to overcome the
implementation issues, or alternatively the company may have a profile with regard to the
prime factors such that the system is not particular useful or appropriate to it.
The above model can be further developed by the realisation that non-adopters may be
divided into three distinct groups: companies which have rejected ABC, companies
which currently have ABC under-consideration and companies which have not
considered ABC. This is represented by figure 6.3 below
Figure 6.3: Contingency, ABC difficulties & implementation status
• Technical issues • Behavioural issues • Systems issues
ABC-Adopters Non-ABC Adopters
Rejecters Under consideration
No consideration
Prime factors - Company sector - Firm Size - Nationality - Type of competition - Product diversity - Cost structure - Business unit culture

161
Furthermore, the model can be reversed to identify the barriers and difficulties associated
with the implementation of ABC that have been overcome. This argument can be
presented diagrammatically in figure 6.4 as below.
Figure 6.4: A contingency model of ABC adoption
Adopters Rejecters Under consider
Not considered
Contingency Factors
Adoption status
Technical issues Behavioural issues Systems issues
Contingent factors
Issues encountered
Why rejected
Issues being encountered
Reasons why

162
6.4. Summary and Conclusion This chapter reviews a series of seven ‘prime’ contingent factors and their relationship
with ABC adoption. The chapter has presented these factors based on the results of a
number of surveys conducted on the adoption of ABC systems.
In relation to product diversity, the review appears to be supportive of the impact of
product diversity upon ABC adoption. There is strong evidence which argues that product
diversity, depending upon how it is measured, is a potential contingent variable which
impact upon the decision to adopt ABC system.
With respect to the manufacturing overhead costs as a contingency factor impacting the
adoption of ABC system, the findings of the surveys report a non-significant relationship
between overheads and ABC adoption, but the theoretical work is supportive of such a
relationship.
Firm size has been examined as a potential factor effecting ABC adoption, the results
indicate a significant association between firm size and ABC adoption, with the exception
of two surveys as presented above.
With regarding to competition, the results are limited and generally non supportive of the
association between competition and ABC adoption rates, despite of the supportive of the
theory oriented work of such association. Company sector has also been considered and
generally manufacturing companies are more likely to adopt ABC than those categorized
in other sectors.
Few studies examined and addressed the association between nationality and ABC
adoption within Irish firms. Those studies indicate contradictory results in relation to the
nationality and ABC adoption.

163
In relation to business unit and culture, only one study has examined the association
between business unit and culture and ABC adoption, and found strong association
between business unit culture and the extent of adoption of AA, ACA, and ABC. The
results also indicate that business unit culture variables, in aggregate, are statistically
significant and larger than the amount explained by business unit size and decision
usefulness of cost information.
Based upon a review of those contingent factors and the difficulties encountered during
the ABC implementation (see chapter 3) , a model has been developed which suggests
that in the adoption of ABC, likely two sets of variables are at work. The “Contingency
Factors” which likely render it appropriate or useful for the company to adopt the system,
and the company’s ability, or willingness to address and overcome the barriers and
difficulties associated with ABC implementation. The model has also been reversed to
identify the barriers and difficulties associated with the implementation of ABC that have
been overcome. Therefore, this research is an attempt to identify and investigate these
relationships in the implementation of ABC within Irish companies.
The next chapter will present the methodology that is employed for this research to
examine the possible linkages between the contingency factors and ABC adoption.

164
CHAPTER 7: RESEARCH METHODOLOGY
7.1 Introduction Based upon a review of the available literature relating both to the implementation of
ABC and contingency theory in management accounting, a model has been developed
which suggests that in the adoption of ABC, likely two sets of variables are at work. The
“Contingency Factors” which likely render it appropriate or useful for the company to
adopt the system, and the company’s ability, or willingness to address and overcome the
barriers and difficulties associated with ABC implementation. The model has also been
reversed to enable the barriers and difficulties associated with the implementation of
ABC to be identified. This research is an attempt to identify and investigate these
relationships in the implementation of ABC within Irish companies.
This chapter presents the methodology that is employed for this research, providing
reasons and explanation where necessary.
The organisation of the rest of the chapter is as follows. Section 7.2 identifies the unique
features of this research. Section 7.3 presents the research philosophy and paradigms.
Section 7.4 and 7.5 develops the research questions and the research hypotheses. Section
7.6 deals with the questionnaire as a research methodology and data collection. Section
7.7 develops and justifies the statistical analysis used in this study. The last section
contains the conclusion of the chapter.

165
7.2 Unique features of this research
Previous studies have been concerned to establish the levels of ABC implementation in
countries such as Ireland (Clark et al, 1999; Pierce and Brown 2004), the UK (Innes and
Mitchell, 1990, 1992, 1995, 1998; Innes et al. 2000), USA (Anderson 1995; Pohlen and
Londe, 1998; Groot 1999) Australia (Booth and Giacobbe, 1997) South Africa (Sartorius
et al. 2007). Other studies have focused on the impact of behavioural and systems factors
on the successful implementation of ABC (Anderson 1995; Shields 1995).
This study seeks to incorporate both the impact of contingency variables and technical
factors on the implementation of ABC. While previous authors, Shields and Young
(1989), Armitage and Nicholson (1993), Clarke (1997), Cobb et al (1992), Innes and
Mitchell (1990), (1995), Innes et al. (2000) have argued that technical variables are likely
to impact upon adoption, as of yet there is no published empirical evidence that
demonstrates the impact of technical variables on the successful implementation of ABC.
This study seeks to address this deficit, and to do so within the overall context of
contingency theory, since, as has been argued in the previous chapter, the model which
has been developed suggests that companies may reject ABC for a number of reasons.
These include one of which may be technical difficulties, other reasons may be that the
profile of the company vis a vis the contingent factors may be such as to render the ABC
system of little practical value to the company.
166
7.3 Research Philosophy and Paradigms
Creswell (2003) states that a research philosophy is a belief about the way in which data
relating to a phenomenon should be gathered, analysed and used. Hussey and Hussey
(1997) argue that the different types of research can be classified by: (1) the process of
the research, (2) the logic of the research, and (3) the assumptions about the nature of
social science. Research classified according to its process may be described as being
either quantitative or qualitative. Quantitative research is objective in nature and
concentrates on measuring phenomena. Therefore, quantitative research entails collecting
and analysing numerical data and applying statistical tests. On the other hand, qualitative
research is more subjective in nature and studies social and human phenomena (Hussey
and Hussey1997).
Sannders et al (2000) argue that the way in which a researcher thinks about the
development of knowledge is dominated by two views; positivism and phenomenology.
Cassell and Symon (1994) state that the positivist paradigm is based on the assumption
that there is an ‘existing truth in the world’ and that this truth can be revealed through
scientific method. Positivism is a scientific approach to research where the researcher acts
as an objective analyst. The methodology is usually highly structured to facilitate
replication and the results are quantifiable. Statistical analysis can be conducted and the
researcher is independent of the subject of the research. Because the focus of this research
is on the systematic and statistical measurement of the relationship between variables,
positivism acts as a guiding philosophy for this work.
Phenomenology on the other hand, can be seen as the research of human experiences that
are examined through the detailed descriptions of the people being studied. Creswell

167
(2003) argues that the steps for data analysis may be less structured and the outcome will
be typically made up of a descriptive narrative.
Hussey and Hussey (1997) indicate the main differences between the two paradigms;
positivistic and phenomenological as shown in table 7.1 below:
Table 7.1: Features of the research paradigms Positivistic paradigm Phenomenological paradigm Tends to produce quantitative data Tends to produce qualitative data Uses large samples Uses small samples Is concerned with hypothesis testing Is concerned with generating theories Data is highly specific and precise Data is rich and subjective The location is artificial The location is natural Reliability is high Reliability is low Validity is low Validity is high Generalises from sample to population Generalises from one setting to another Source: Hussey and Hussey (1997: 54). Burrell and Morgan (1979) argue that assumptions regarding the nature of social science
could be thought of in terms of the subjective/objective dimension, and assumptions
about the nature of society in terms of a regulation/radical change dimension, which
results a 2 x 2 matrix comprising four different research paradigms as follows:
Figure 7.1: Four paradigms for the analysis of social theory Radical Change Subjective Objective
Regulation
(Source: Burrell and Morgan 1979: 22) Burrell and Morgan (1979) also indicate that to be located in a particular paradigm is to
view the world in a particular way. The four research paradigms define four views of the
social world based on different assumptions. The four research paradigms have been
summarised by Gioia and Pitre (1990) in table 7.2 below:
Radical Humanist Radical Structuralist Interpretivist functionalist

168
Table 7.2: The differences between the four research paradigms Goals Theoretical
Concerns Theory-building Approaches
Functionalist paradigm
To search for regularities and test in order to predict and control
Relationships caution generalization,
Refinement through causal analysis.
Interpretivist paradigm
To describe and explain in order to diagnose and understand.
Social construction of reality, reification process, interpretation
Discovery through code analysis.
Radical Humanist paradigm
To describe and critique in order to change (achieve freedom through revision of consciousness)
Social construction of reality distortion interests served.
Disclosure through critical analysis.
Radical Structuralist paradigm
To identify sources of domination and persuade in order to guide revolutionary practices (achieve freedom through revision of structures)
Domination, alienation, macro forces, emancipation.
Liberation through structural analysis.
Source: Gioia and Pitre (1990). This study leans towards the contingency/functionalist (positivistic) paradigm, as it has
been argued (Gioia and Pitre, 1990) that positivistic accounting theory is being developed
and tested through observations, deduction, testing, and evaluation. Research designs are
often composed of surveys and statistical methods. Application of the contingency
approach within such a kind of research design results in detection of cause and effect
relations for description or explanatory knowledge (Hass and Kleingeld 1999).
Contingency-based studies have come to be seen as large scale, cross sectional, and
postal questionnaire based research, to examine the interaction of a certain number of
contingent variables (Chapman, 1997).

169
7.4 Research Questions
Though the reasons whether or not to adopt ABC are still not completely apparent, the
existing literature sheds some light on the problem issue, particularly highlighting
characteristics of those firms which might be suitable to ABC and those which may not
be suitable.
This study however attempts to answer two interrelated questions:
1. Is the adoption of ABC by Irish companies associated with firm-specific
characteristics, namely industry sector, firm size, nationality, product
diversity, type of competition, cost structure and business unit culture?
The above question seeks to test those factors which the literature suggests are likely to
impact upon the adoption of ABC i.e. companies which have a particular “profile”
relating to the above factors are more likely to find ABC useful and hence to adopt the
system than companies which have alternative “profiles”. However the above question
does not address the issue of the barriers and difficulties to implementing the ABC
system. These barriers and difficulties have been considered in chapter 3, and have been
identified as technical, behavioural, and systems related.
Previous studies have focused on the extent of ABC systems usage and on the
identification of the main reasons and difficulties encountered during its implementation
(Bjornenak 1997; Clarke 1997, 1999; Drury and Lamminmaki 2001; Groot 1999; Innes
and Mitchell 1990, 1995; and Innes et al. 2000). The successful implementation of ABC
has been associated with behavioural and organisational variables (Shields and Young’s
1989). Shields (1995) argues that behavioural and organisational variables create

170
opportunities for employees in an organisation to learn about ABC and encourage the
employees to change their behaviours in accordance with the concept of ABC.
However, there is evidence (Armitage and Nicholson 1993; Clarke 1997; Cobb et al
1992; Innes and Mitchell 1990, 1992, 1998) that there are specific technical issues which
might impact upon ABC implementations. It is on such technical issues that this research
will focus. Consequently, the second research questions became defined as:
2. What is the extent of the technical difficulties encountered during the
implementation of ABC system?
The technical difficulties focused upon are those identified in the literature review i.e.
(i) Identifying the major activities that take place in an organisation
(ii) Assigning resources to those activities
(iii) Aggregating activities to create cost pools/ activity centres
(iv) Determining the cost drivers for each activity
(v) Assigning the cost of activities to cost objects
7.5 Research Hypotheses:
This study may be considered as comprising two distinct stages: firstly, developing a
contingency model which seeks to establish the factors associated with ABC adoption.
Secondly, establishing whether or not “technical issues” pose barriers to the
implementation of ABC. Therefore, the following hypotheses seek to test and examine
these first and second stages.

171
7.5.1 Contingency factors hypotheses:
7.5.1.1 Company sector Some studies (Innes and Mitchell 1995; Innes et al. 2000; Clarke et al 1999 and Pierce
and Brown 2004) have tested and examined the relationship of company sector to ABC
adoption. As the findings of the above studies were different, this study seeks to test if the
company sector plays any significant in the implementation of the ABC systems by
testing the following hypothesis:
H1: Manufacturing companies are more likely to adopt ABC than companies within other sectors.
7.5.1.2 Firm size
It has been argued (Innes and Mitchell, 1995, 1998; Bjornenak, 1997; Van Nguyen and
Brooks, 1997; Krumwiede, 1998; Clarke et al, 1999) that the company size is usually a
factor in the rate of adoption of sophisticated cost accounting systems. In general, bigger
size increases complexity, usually requiring greater accounting resources. The majority of
surveys conducted on ABC have examined the impact of size on the implementation of
ABC system. The findings differ from one study to another. In the studies by Innes and
Mitchell (1995), Bjornenak (1997), Boot and Giacobbe (1997), Krumwiede (1998),
Clarke et al (1999), Groot (1999), and Pierce and Brown (2004) which examine the
relationship between company size (number of employees and annual turnover) and the
implementation of ABC, the findings are that company size does provide a statistically
significant source of differentiation among ABC adopters; a markedly significant higher
rate of adoption is apparent in the larger firms surveyed. On the other hand, some
research (Van Nguyen and Brooks, 1997; Cinquini et al, 1999; and Baird et al, 2004)

172
indicates that a firm’s size does not drive ABC adoption, and that no association between
business unit size and ABC systems exists. This argument leads us to examine and test
the following hypothesis:
H2: Larger companies are more likely to adopt ABC than smaller companies.
7.5.1.3 Nationality
Nationality has been examined to measure its association with the implementation of
ABC system. Clarke et al (1999) and Pierce and Brown (2004) have examined the impact
of multinational/national status on the implementation of ABC. The results were
contradictory as mentioned in chapter 6. The current study seeks to examine this issue via
the following hypothesis:
H3: Multinational companies are more likely to adopt an ABC system than national companies. 7.5.1.4 Competition
Bjornenak (1997) argues that competition affects the value of ABC through increasing
the costs caused by errors in the traditional costing systems. Cooper (1988b) indicates
that competition generally increases the cost of errors because there is a greater chance
that a competitor will take advantage of any errors made. However, it is not known
whether this argument applies to Irish firms. This study will test this argument by means
of the following hypothesis:
H4: Firms which face high level of competition are more likely to adopt ABC than those which face less competitive.

173
7.5.1.5 Product diversity
According to Cooper (1988a) traditional systems report distorted product costs whenever
companies produce a diverse range of products, by over-costing high-volume products
and under-costing low-volume products, whereas ABC under-costs high-volume products
and over-costs low-volume products. Therefore, the product costs reported by the ABC
system are more accurate than those by the traditional volume-based system in many
situations, including diversity of product size or volume (Cooper 1988a).
Product diversity has been examined by (Bjornenak 1997; Clarke et al 1999; Van Nguyen
and Brooks 1997; Groot 1999; Abernethy et al 2001; Brown et al 2004)3. In summary the
findings appear to be supportive of the impact of product diversity upon ABC adoption.
The current study adopts the position that product diversity is a significant factor in the
adoption of ABC systems. This will be tested by the following hypothesis:
H5: Firms which have more production diversity are more likely to adopt ABC than firms which have less production diversity. 7.5.1.6 Cost structure
Regarding the cost structure of companies, studies by (Booth and Giacobbe 1987; Brown
et al 2004; Bjornenak 1997; Clarke et al 1999; Groot 1999; Van Nguyen and Brooks
1997 and Cinquini et al 1999) examined the impact of overheads on the implementation
of ABC system. The results are ambiguous, as Booth and Giacobbe (1997) found a
positive association between the implementation of ABC and the percentage of overheads
while others indicate that no relationship exists between the implementation of ABC and
3 See chapter (6) for more details on the findings of these studies regarding product diversity and ABC.

174
level of overheads. This study therefore seeks to test this factor and its impact upon the
implementation of ABC system by posing the following hypothesis:
H6: Firms which have a greater percentage of total cost as overheads are more likely to implement ABC than other firms. 7.5.1.7 Business unit culture
Based on the literature (O’Reilly et al 1991, Baird et al 2004, Macarthur 2006, and Henri
2006), culture has been proposed as a factor with significant potential to affect adoption
of activity management. One study by Baird et al. (2004) examines the extent to which
activity management practices are adopted by Australian business units at each of
Gosselin’s levels of activity analysis, activity cost analysis and activity-based costing.
They also examine the cultural dimensions (innovation and outcome orientation) of the
business units for the extent of adoption of activity management at each of Gosselin’s
three levels mentioned above. The current study examines the impact of business unit
culture on the adoption of ABC by Irish firms, utilising to the following hypothesis:
H7: Business units which have a culture of innovation and outcome orientation will be more likely to adopt ABC. The above review has identified seven hypothesized variables/factors based on the
contingency model developed in chapter (6). While the studies reviewed are not
unanimous in their support of the impact of the individual variables upon ABC adoption,
and while different studies of the same variable sometimes use different operational
definitions of the variables, and indeed of ABC adoption, nonetheless there does appear
to be support for a general argument that the seven identified variables potentially impact
upon ABC adoption. This study seeks to test the relationship of those variables with
implementation of ABC systems.
175
7.5.2 Technical issues hypotheses
The above hypnotized contingency factors alone may not of themselves adequately
explain the full reasons for ABC adoption rates. The barriers to implementation,
identified in the model developed in chapter 6, likely also influence the adoption rate.
The model suggests that two companies which have similar profiles with regard to the
prime factors may yet reach different decisions with regards to ABC adoption, due to
their differing abilities or willingness to address and overcome the issues relating to
implementation. It would also suggest that the non adoption of ABC may result either
from a failure to overcome the implementation issues, or alternatively the company may
have a profile with regard to the prime factors such that the system is not particular useful
or appropriate. Therefore to test the extended model, the following sets of hypotheses
seek to establish whether or not technical difficulties pose barriers to the implementation
of ABC systems.
The seven ‘prime’ factors identified above will be individually tested to establish there
relationship with ABC adoption. Should such relationships exist, it is then possible to
produce a ‘profile’ of adopting companies e.g. adopting companies may be (relative to
non adopting companies) larger with higher overheads, more product diversity etc. Once
such a ‘profile’ is developed, it is then possible to “cluster” or group the companies based
on their profiles. Once clustered it is anticipated that there will be significant differences
in ABC adoption rates between the clusters (since after all they are clustered on the prime
factors associated with adoption). However, if adoption is also influenced by barriers,
within such clusters there will be differences in ABC adoption status.
The validity of the above argument will be tested by the following hypothesis:

176
When companies are clustered on the basis of their prime factor profiles:
H8: There will be significant differences in the ABC adoption status between clusters. H9: There will be differences in ABC adoption status within each cluster.
It will be recalled that the model developed in the previous chapter (figure 6.4)
differentiated “non adopting companies” into three categories, those who have rejected
ABC after consideration, those who are currently considering ABC and those who have
not considered ABC. Within each “cluster” of companies there will likely be each of
these three types of non adopting companies.
The pivotal point of the adoption model developed in the previous chapter is that it is the
combined effects of the primary contingent factors and the barriers to implementation,
which results in adoption or non adoption. Therefore, the model suggests that even within
the cluster which has an overall profile most closely aligned with the contingent factors
associated with adoption, there will be some companies which have rejected ABC.
Within the cluster with a profile which least matches the prime factors we would expect
rejection. However, the reasons for rejection will (the model suggest) differ, the ‘closely
aligned’ cluster will likely have “barriers” as the reasons for rejection, while the cluster
which is least aligned, will likely perceive the system to be of little usefulness to these i.e.
not appropriate to the information needs of the companies within that cluster.
This argument will be tested by the following hypothesis:
H10: There will be significant differences in the reasons for rejection of ABC, between clusters. If the above argument, that within the ‘closely aligned’ cluster the reasons for rejection
relate to barriers to implementation, it provides the opportunity to establish which of the
three types of barriers i.e. Behavioural, Systems or Technical, is the dominante reason for

177
such rejection. While there is support in the literature for all three types of barriers, it has
been previously argued here that technical difficulties dominate.
This argument can now be tested by the following hypothesis:
H11: Technical issues will be the most common cause for rejection of ABC within the cluster whose profile most closely matches the prime factors.
The same general argument as given above relating to companies which have rejected
ABC can also be sustained for companies which are actively considering ABC adoption
within each cluster there will likely be such companies. However, the factors mitigating
against adoption will (the model suggest) differ between clusters. The cluster of
companies whose profile is most closely aligned with the prime factors will, the model
suggest, find ‘barriers’ to be the major mitigating factor, while the least aligned cluster
will likely find that the overall system may just be unsuitable to those company.
This argument can be tested via the following hypothesis:
H12: There will be significant differences in the factors mitigating against ABC adoption (within companies who are actively considering its adoption) between clusters.
If indeed the argument developed previously regarding the likely dominance of technical
issues amongst the barriers to implementation is correct, then the following hypothesis
will held up:
H13: Technical issues will be the most common factor mitigating against ABC adoption (within companies who are actively considering its adoption) within the cluster whose profile most closely matches the prime factors.

178
7.6 Data Collection
Data Collection may be conducted in a variety of ways and from various sources, each
data collection method having advantages and disadvantages. Sekaran (2000) argues that
although personal interviews or face-to-face interviews have the advantages of flexibility
in adapting and clarifying the questions, they have time, cost and geographical
limitations. On the other hand, he states that a mail questionnaire survey is best suited for
collection of a substantial amount of information at a reasonable cost from large number
of people in a wide geographical area.
Several studies in the literature of ABC have used the mail questionnaire survey method
for such reasons. For example, Shields (1995), who studied firms degree of success with
ABC and the variables associated with ABC success, conducted a mail survey in
gathering data, reasoning that it is a cost-effective method and suitable for analysing a
large sample of firms’ which have had experience with ABC. Several researchers in the
area chose a mail survey to collect data to identify the most important areas of application
of ABC information among ABC adopters (Innes and Mitchell 1990, 1995; Bjornenak
1997; Groot 1999; Clarke 1997, Clarke et al. 2000; Innes et al. 2000; and Drury and
Lamminmaki 2001).
Furthermore, a mail questionnaire survey exerts less pressure on the respondent to
provide an immediate answer and provide a comfortable feeling of anonymity (Gosselin
1997). Mail questionnaire survey was considered an appropriate method for this research
for the following reasons:
(i) There is evidence that most contingency-based studies have used cross-sectional
survey methods (Chenhall 2003).

179
(ii) Unlike interviews, a mail questionnaire focuses on facts rather than on personal
opinions. It also places less pressure on an immediate response and provides the
respondents with a feeling of anonymity (Gosselin 1997).
The survey comprised all firms listed on Business and Finance (2004) Irelands Top 1000
companies (only 925 companies listed and sent for the survey). The main reasons for
choosing companies listed on Business and Finance Irelands Top 1000 firms were that
contact details were readily available, and that this sample frame was used in previous
Irish surveys, which allows comparisons between the results to be validly made. The
choice of the sample frame does however limit the applicability of the finding, since
those will relate only to ‘top’ companies i.e. those with relatively high turnover and
capitalisation.
The questionnaire used in this study, comprising 12 pages, was pretested to ensure the
suitability of the questions and to eliminate ambiguities. The objectives of the pretest
were to establish the reliability of the survey instrument (the questionnaire) and the
effectiveness of the data collection methodology in generating responses. To confirm
clarity and validity of this questionnaire, it was pre-tested by eight academic staff in the
school of Accounting and Finance, DIT. This confirmed that the estimate of the time
required was reasonable and that the questions were suitable for the intended audience.
Sekaran (2000) suggests that sending follow-up letters, providing the respondent with
self-addressed, stamped return envelopes and keeping the questionnaire brief are useful
ways to improve the rate of response to mail questionnaires. Accordingly, the
questionnaire in this study was sent with a covering letter and a reply envelope. The
covering letter was addressed to the accounting/finance manger of each company, who
180
was considered to be most likely to understand the cost accounting systems and whom it
was assumed to be the key person responsible for decisions regarding ABC in the firm.
The questionnaire was resent, approximately five weeks after the first mail-out with a
second covering letter.
7.6.1 Rules on Ethics and Confidentiality
Before conducting the questionnaire survey, an information sheet, stating that the
research was being conducted in cooperation with the Dublin Institute of Technology and
the school of Accounting and Finance, was prepared in order to explain the purpose of
the study and the ethical rules pertaining to this research. This was attached to each
questionnaire and sent to participants (see Appendix A). The participants were informed
that under the ethical code, they were participating voluntarily and no risks, such as
psychological, moral, legal or other risks, would occur to them.
For administrative purposes, the questionnaires were coded. The codes were exercised for
follow-up procedures. Access to the codes was restricted to the researcher. Completed
questionnaires of the survey are kept in a secure place at Dublin Institute of Technology
under the researcher’s control and are available only to the researcher and supervisors. In
addition, the results are reported only in aggregate form so as to prevent the identification
of individual responses from the participants.

181
7.6.2 Research design and variables
7.6.2.1 Research Design
The research questionnaire (see Appendix A) comprises two types of questions:
Likert-types: this method is widely used in social science research to indicate the
strength of agreement or disagreement (Jackson 1995) and is here employed to measure
attitudinal issues, for example, asking the respondents to rate the level of success of the
ABC system in relation to specific areas of application (Q.21). Current thinking suggests
that 5- to 7-point scales are adequate for the majority of surveys that use ordered
responses (Fink, 1995). All the Likert-questions were recorded on a 5-point type scale.
Multiple-choice: multiple-choice answers are those where the respondents is asked a
closed question and selects his or her answer from a list of predetermined responses or
categories (Hussey and Hussey 1997). This type was chosen because the study requires
specific information needing yes or no responses, or an answer from one of four, five or
six choices. However, some questions have the space for the respondent to add any
answer not listed.
In general, most of the questions were designed as a closed from, which is considered to
be more efficient and reliable than open questions for obtaining information from
respondents (Fink 1995). Closed questions are, however more difficult to design than
open ones because the answers or response choices should be known in advance. But the
results lend themselves more readily to statistical analysis and interpretation, and this is
particularly important in large surveys, because of the number of responses and
respondents. Furthermore, because the respondent expectations are more clearly spelled

182
out in closed questions, the answers have a better chance of being more reliable or
consistent over time (Fink 1995).
Some questionnaire items were developed from existing studies (O’Reilly et al, 1991;
Anderson & Young, 1999; Clarke et al, 1999; Innes, et al, 2000; Pierce & Brown 2004)
as they had been shown to be reliable. Other questions were developed to suit the
particularities of this study.
The written questionnaire (a copy of which is provided in appendix A) consists of 29
questions and was divided into two main sections, comprising 12 pages. The first section
aimed to examine company characteristics. Therefore, questions 1-12 seek general
information about the company such as its industry group, firm size, organizational
structure, cost structure, and business unit culture. These questions relate to the link
between contingency factors and its predisposition of ABC adoption.
The second section was designed to examine the adoption statues of ABC amongst the
participants. This section (questions 13-29) relates to knowledge of ABC, status of ABC
adoption and was requested of all respondents, involvement in the implementation of
ABC, reasons for adopting ABC, the level of ABC success and importance, problems of
ABC implementation, reasons for not adopting, rejecting and not considering of ABC.
Questions 13-14 relate to the awareness of participants regarding ABC. Question 15 is
intended to measure the degree of ABC adoption. Question 16-17 relate to the firm’s
initiation of ABC. Question 18 is to identify the stages of the ABC implementation by
adopters or users. Question 19 is adapted from Pierce and Brown (2004), and seeks to
indicate the involvement of each of the categories in implementing their ABC system.
Question 20 relates to the reasons for adopting ABC. Questions 21-22 based on Pierce

183
and Brown (2004), relate to the level of success and importance of implementation of
ABC for specified purposes on a 5-point scale ranging from 1=low to 5=high. Question
23 seeks to identify the extent of technical difficulties encountered in implementing ABC.
Questions 24-26 are to be answered by non-adopters of ABC, the purpose of these
questions being to investigate the reasons for not adopting ABC.
As further justification for the questions asked, the relationship of each question to the
above hypotheses is set out in table 7.3 below.
Table 7.3: The relationship between questions and hypothesis Hypothesis Questions and variables in the questionnaire relating to the hypotheses
1 Q15 (The adoption of ABC) Q1 (Company sector)
2 Q15 (The adoption of ABC) Q2+3 (Firm sizes)
3 Q15 (The adoption of ABC) Q4 (Nationality)
4 Q15 (The adoption of ABC) Q6 (Type of competition)
5 Q15 (The adoption of ABC) Q7 (Number of products provided )
6 Q15 (The adoption of ABC) Q10 (Cost structure)
7 Q15 (The adoption of ABC) Q12 (Business unit culture)
8+9 Q15 (The adoption of ABC) Q 1+2+3+4+6+7+10+12 (Contingency factors)
10+11 Q 25 (Reasons for ABC rejection)
12+13 Q 24 (Factors militating against ABC adoption)

184
7.6.2.2 Research variables Several variables were determined as options for the respondents in the questionnaires.
These variables can be classified into five categories: company characteristics, company
environment, ABC implementation, reasons for not adopting ABC and future plan
regarding ABC implementation. The first two categories were designed to seek general
information about respondents and their firms. Hence, these variables applied to all
respondents, table 7.4 below shows these variables in more details.
Table 7.4: Variables determined in the questionnaire Category Variables Determined in the Questionnaire Question 1 2 3
Variables determined for all respondents Company characteristics 1.1 Industry group 1.2 Firm size 1.3 Nationality and Company status Company environment 2.1 Production and product characteristics 2.2 Accounting systems, cost structure, 2.3 Business unit culture ABC implementation 3.1 Knowledge of ABC 3.2 Status of ABC adoption
1 2-3 4-5 6-7 8-11, 27-28 12 13-14 15
Variables determined for ABC adopters 4.1 ABC first introduced 4.2 ABC initiation 3.3 Involvement in the implementation of ABC 3.4 Reasons for adopting ABC 3.5 The level of ABC success 3.6 The level of importance to the application of ABC 3.7 Problems of ABC implementation
16 17-18 19 20 21 22 23
4 5
Variables determined for non-adopters Reasons for not adopting ABC 4.1 Currently considering the adoption of ABC 4.2 Considered and rejected ABC adoption 4.3 Never considered the adoption of ABC Future plans about ABC
24 25 26 29
185
The first category is associated with industry group, firm size, and organisational
structure, while the second category consists of variables relevant to production and
product/service characteristics (such as degree of diversity of product/services, and types
of products/services competition), cost structure (such as the firm’s type of cost
management techniques, objectives in allocating overhead costs, and bases to allocate
overhead costs) and business unit culture (such as innovation and outcome orientation).
The purpose of the third category was to uncover data about the implementation of ABC.
Therefore the questions in this section were employed for those who have implemented
ABC systems. In fact, there is some confusion between adoption of an ABC idea and
implementation of it. Bjornenak (1997) states that ‘If ABC is adopted as an idea, but not
implemented, it still may affect the way of thinking in a company’. The number of
adopters of the idea will be significantly greater than the number of firms implementing
ABC. Bjornenak (1997) points out that the number of adopters depends on the definition
of adoption. In this study, adopters are defined as firms that have already implemented or
are currently implementing ABC. The third category includes variables involving
experiences with ABC implementation (such as knowledge and learning about ABC, the
status of ABC adoption, and the beginning year to implement ABC), involvement in the
implementation of ABC, as well as the reasons for adopting ABC. In addition, this
category includes variables involving the level of importance and success to the
application of ABC, and the problems of ABC implementation.
The fourth category relates to those firms who have rejected or not considered the
implementation of ABC systems. These questions applied to three different groups those
186
currently considering the adoption of ABC, those which had considered and rejected
ABC adoption, and those which had never considered the adoption of ABC.
7.6.3 Questionnaire, problems of data collection, and response rate The questionnaire was developed during July 2004-February 2005 and involved a study
of the literature and the pre-testing of the questionnaire in order to ensure that the final
version was not misunderstood and was manageable length.
Bourque and Fielder (1995) suggest that mail questionnaire should be no longer than 12
pages; in general between 4 and 12 pages. The questionnaire employed in this study
includes of 12 pages. The questionnaire was sent at the beginning of March 2005. To
increase the response rate, a reminder was mailed four weeks after the first mail out. The
questionnaire with a reminder letter (see Appendix A) and a return envelope were
included in the reminder mail out. By the end of May 2005, 218 questionnaires were
returned (23.6%, 218/925).
7.6.3.1 Problems of data collection
In this study, missing data was the major issues occurred in data collecting, outlined as
follows:
7.6.3.1.1 Missing data
In total, 218 questionnaires (23.6%) were returned, a total of 51 responses were unusable
or contained uncompleted responses as follows:
- 16 questionnaires (1.7%) were unusable responses, given the fact that they did not
answer and complete some questions in the questionnaire. For instance, four respondents
did not answer section 1 question 2 and 3, relating the number of employees and the
187
annual turnover. Some questions in section 1 – question 6 and question 9 relating to the
marketing strategy and objectives in allocating overhead were also left uncompleted by
some respondents. Five respondents did not understand and complete question 10 relating
the cost structure. Some respondents claimed that their firms consisted only of retail
trade, not manufacturers. In section 2, some respondents answered question 15, but did
not answer the questions which followed. For example, two respondents claimed that
their ABC is currently under consideration, but neither answered question 24 nor question
27 and 28. Additionally, three respondents did not answer question 15 and left the rest of
the questionnaire empty.
- 35 questionnaires (3.8%) were returned completely unanswered, with the following
reasons provided:
- Company policy that we do not complete questionnaire (3 respondents)
- We do not use ABC to any great extent (7 respondents)
- No interest in completing a questionnaire regarding ABC (4 respondents)
- Unable to complete the questionnaire due to business travel and commitments (1
respondent)
- We are not in position to complete it, because most of the cost related decisions and
budget setting takes place at our head office out of Ireland (2 respondents)
- The area of ABC is not particularly relevant to us (8 respondents)
- Do not have time to participate (4 respondents)
- The company has not used ABC for some time (5 respondents)
- The questionnaire is too long (1 respondent).

188
7.6.3.2 Response rate and a comparison with the previous research
Table 7.5 below shows the major surveys conducted in Ireland since 1992 relating to
ABC systems. Excluding the current study, these comprise three studies, Clarke, 1992
and 1995, and Pierce and Brown 2002. The first two studies (1992, 1995) were focused
on manufacturing firms, and were addressed to financial controllers and chief
management accountants. The sample size was 320 and 511 respondents respectively,
and the response rate was around 40% in both studies. The third study by Pierce and
Brown (2002) extends the area of the target sample, and includes both manufacturing and
finance firms, using a sample of 550 companies; they achieved a response rate of 23%.
Comparison with the three previous studies, this study is the most comprehensive in the
target respondents. It targets different industrial sectors (manufacturing, financial, and
service firms), and targeted a large number of companies (925 companies) shown below:
Table 7.5: A comparison of Irish surveys regarding ABC systems Clarke, P
1992 Clarke, P
1995 Pierce and Brown
2002 This study
2005 Target from Irish Mfg firms Irish Mfg firms Irish Mfg and
finance companies Irish Mfg and financial services companies
Drawn from Irish Business (1991) Top 750 Irish companies
Business and Finance (1995) Irelands Top 1000 Companies
The 2001 Business & Finance listing of top Irish companies
Business and Finance (2004) Irelands Top 1000 Companies
Addressed to Financial Controllers
Chief Management Accountant
Head of finance Chief executive
Financial controllers Management Accountants Cost Accountants Financial Accountants
Numbers sent 320 511 550 925
Useable response
129 204 122 167
Unusable response
- - 11 16
Non-response sheet
- - 13 35
Response rate 40.3% 40% 23.2% 19.1 %

189
7.6.3.3 Reliability, Validity and Non-response Bias Analysis
Reliability of the multi-item measurement scale in the survey is estimated by using
Cronbach's alpha, the most common method accepted by researchers (Francis 2001).
Field (2005) argues that Cronbach’s α assesses the reliability of a rating summarizing a
group of test or survey answers which measure some underlying factor (e.g., some
attribute of the test-taker). A score is computed from each test item and the overall rating,
called a 'scale' is defined by the sum of these scores over all the test items. Then
reliability is defined to be the square of the correlation between the measured scale and
the underlying factor the scale was supposed to measure. Table 7.6 below shows the
Cronbach’s α coefficient for each key variable used in the statistical analysis. The table
also presents the descriptive statistics in terms of mean scores and actual range. The
findings below indicate overall reliability of all key variables because the values exceed
conventional levels of acceptability (Francis 2001).
Table 7.6: Reliability statistics
Variables Mean Actual Range Alpha Cronbach*
- Innovation - Outcome orientation
3.006 4.240
2.874-3.138 4.120-4.359
.797
.846
* The conventional values = 0.7 It has been argued (Bourque and Fielder 1995; Sekaran (2000)) that when conducting
mail surveys, two potential barriers are expected to occur: low response rate and non-
response bias. In order to increase the response rate, a reminder was mailed four weeks
after the first mail out.

190
In relation to the non-response bias, it is recommended to test the sample against
responses to see if the sample has a different mix of some variables. Table 7.7 below
reports the frequency and the percentages of the industry group as follows:
Table 7.7 Test of non-response bias (industry sector) Industry group Frequency Percentage
Business services
Manufacturing
Transport & distribution
Retail trade
Financial services
Exporter
Importer
198
368
49
69
149
35
57
21.4
39.8
5.3
7.5
16.1
3.8
6.1
Total 925 100.0
Venkatraman (1989) argues that in order to assess response bias, a research precedent is
to compare the profiles of early and late respondents. Therefore, the first 25 responses
received were compared to the last 25 responses. A chi-square test was conducted to see
if there was any response bias between business units that answered early and business
units that answered late. No evidence of significant response bias was found.
Table 7.8 below shows that there are no differences between the characteristics of
companies in the first and the second groups because all significance values are above the
alpha level of 0.05. Therefore, evidence of non-response bias was not found and it is
expected that 167 respondents in this study can be representative of the whole selected
sample.

191
Table 7.8: Test of non-response bias
Variables N Mean Standard Deviation
Significance*
Industry group - first group - second group
25 25
1.857 1.865
.779 .711
0.098
Number of employees - first group - second group
25 25
1.528 1.732
.590 .700
0.088
Annual turnover - first group - second group
25 25
2.163 2.111
.725 .698
0.071
Nationality - first group - second group
25 25
1.538 1.301
.500 .462
0.058
Marketing strategy/ price - first group - second group
25 25
2.413 2.539
.677 .590
0.074
Marketing strategy/ quality - first group - second group
25 25
2.500 2.523
.574 .618
0.077
Marketing strategy/ Promo. Act - first group - second group
25 25
1.442 1.571
.620 .711
0.089
Number of products - first group - second group
25 25
2.038 2.047
.858 .811
0.076
Cost structure - first group - second group
25 25
2.692 2.746
.776 .739
0.093
Innovation - first group - second group
25 25
3.788 3.777
.941
1.038
0.130
Outcome orientation - first group - second group
25 25
4.211 3.968
.820 .782
0.098
* At the 0.05 level of significance.

192
7.7 Statistical analysis techniques
Statistical analysis may be divided into three main types: univariate analysis, bivariate
analysis and multivariate analysis. The following figure provides clear details of the
design of the statistical analysis in this research.
Figure 7.2: Statistical analysis techniques
Developed by researcher 7.7.1 Univariate analysis
Univariate analysis is concerned with examining one single variable. Bryman and Cramer
(2001, p5) define univariate analysis as “the various ways of analysing and presenting the
information relating to a single variable”. Univariate analysis mainly presents information
about frequency distribution, central tendency and dispersion.
The nature of univariate analysis is based upon the nature of a variable. Frequency
distributions, measures of dispersion and measures used to analyse nominal variables, for
example, are not suitable in the case of variables of an interval nature (continuous) such
as leverage and total assets (Babbie et al, 2003, p76). Therefore, in order to make use of
these useful statistical tools, such as frequency distribution, the continuous variables
Statistical measurements
Univariate analysis
Descriptive statistics
Frequency distribution
Bivariate analysis
Crosstabulations
Chi-square
Multivariate analysis
Cluster analysis
T-test, Mann-Whitney and ANOVA

193
should be analysed in categorical form (Bryman and Cramer 2001). However, in order to
enrich the findings of this research, these variables should be analysed again in their form
as continuous variables. Some descriptive statistics such mean, standard deviation,
minimum and maximum are the type of univariate analysis that may be applied to
continuous variables (Bryman and Cramer, 2001).
7.7.2 Bivariate Analysis
The statistical tools that can be used to analyse differences and associations namely
significance tests (can be classified as univariable and bivariable analysis4) are employed
to find differences between ABC adopters, rejecters, considering and not considering
across the different variables (contingency variables).
These comprise the statistical techniques which make assumptions concerning the nature
of the populations from which the observations or data were drawn (Siegel, 1996).
In order to establish the various hypotheses relating to the contingent variables, it is
necessary to compare the responses to various relevant question of adopting companies
with those of non adopting companies. The tests which were performed to achieve this
were of the following kinds, and were chosen as being appropriate.
7.7.2.1 Parametric tests
7.7.2.1.1 The independent t-test (2-sample t-test):
This test is in general a parametric test employed to examine whether two means are
significantly different from one another. There are three types of t-test: the single t-test,
4 There is no real consensus on how to classify these tests. Whereas t-test, Mann-Whitney, and ANOVA and Kruskal-Wallis can be classified as univariable analysis because they analyse difference between groups in terms of a single variable, Chi-square and Crosstabulations can be classified as bivariable analysis because they study the relationship between two variables.

194
the independent t-test and the paired t-test (Brace et al, 2003). As in this research there
are more than one group and these groups are independent of each other, the independent
t-test is considered to be the appropriate choice. This test draws differences between the
ABC adopters group and non ABC adopters. In the case with four groups of firms
(implemented, rejected, still considered, and not considered), the independent t-test, can
still be used. However, this requires running the test more than once (once between every
two groups). A more efficient procedure than this is to run ANOVA (Brace et al 2003).
7.7.2.1.2 Analysis of variance (ANOVA):
ANOVA is considered an extension of the t-test that allows the comparison of the means
of more than two groups. ANOVA shows us whether the scores of independent groups
vary significantly across these groups (Bryman and Cramer 2001).
However, a disadvantage of ANOVA is that it does not show us whether the ABC
adopters group is significantly different from the rejecters group, whether the adopters are
significantly different from those still considering the system, or whether rejecters group
is significantly different from not-considered group. This drawback can be overcome by
Tukey post-Hoc multiple comparisons procedure. This procedure will show whether there
is any significant difference between each pair of groups on all the parametric variables.
7.7.2.1.3 Assumptions of the Independent t-test and ANOVA:
The following are the assumptions on which Student’s t-test and ANOVA are based, with
a summary of their implications for the data set of the current work (Hosmer and
Lemeshow 2000):

195
(i) The dependant variables should be of interval or ratio scale. Variable of interval
scale are: employees number, turnover, product diversity and management
ownership (before being transformed into a binary variable).
(ii) The variables are normally distributed.
(iii)The samples variances are all equal. Levene’s test is run to check this assumption.
In SPSS, this test can be run as an option under both ANOVA and the
Independent t-test. For the Independent t-test, SPSS provide results under two
conditions: equal variances assumed and equal variances not assumed.
Finally, even if the assumptions for these tests are not fully met, their results can be used
to compare with those of non-parametric tests (Bryman and Cramer 2001). Furthermore,
Hosmer and Lemeshow (2000) suggest that the results of the t-test can be used to indicate
which variables qualify for inclusion in the multivariable models.
7.7.2.2 Non-parametric tests:
Non-parametric tests do not require assumptions to be made about the shape of the
underlying distribution (Bryman and Cramer 2001). Non-parametric or distribution-free
tests do not depend on assumptions about the particular form of the distribution of the
sampled populations and are not based on strict assumptions (Bryman and Cramer, 2001;
Siegel and Castellan, 1988).
For the purposes of this research, the need for this type of test applies to all the
continuous variables except for industrial sector and company’s status, which are the only
normally distributed variables.

196
7.7.2.2.1 Mann-Whitney U tests:
For two independent samples, this test is the most commonly used alternative to the
independent-samples t-test (Norusis, 2000). This test is employed to compare the two
groups ABC adopters and Non-adopters.
7.7.2.2.2 Kruskal-Wallis:
In the case where there are three groups or more such as is the case with having adopters,
rejecters and not considered, the Kruskal-Wallis test is the right choice (Norusis, 2000).
This non-parametric test is the alternative to one-way analysis of variance (ANOVA).
7.7.2.2.3 Assumptions underlying the Mann-Whitney U test and Kruskal-
Wallis:
In fact there is no absolute agreement between statisticians on the assumptions underlying
non-parametric tests. Brace et al (2003) and Hart (2001) agree that these tests can be run
when data are of interval or ratio scale, but with serious violation to the assumptions of
parametric tests such as ANOVA or the Independent t-test (normality and equality of
variances). Norusis (2000), on the other hand, emphasizes the assumption that samples
tested be similar in shape. Although there is not any particular test to check such
assumption, the SPSS 11.0 guide suggests that this can be achieved using “Explore”.
Therefore, histograms with normal curve for all the variables in the different groups were
plotted and compared. This comparison was mainly based on eyeball inspection5. The
researcher did not see any significant differences which might cause concern.
5 This was based on personal communication with a number of statisticians via email.

197
7.7.2.2.4 Chi-square:
The chi-square test may be employed to reveal the significance of differences between
two or more independent samples. According to Siegel (1996), the measurement of the
data analysed by this test “may be as weak as nominal or categorical scaling”. Chi-Square
can be also used for a combination between nominal and ordinal variables. It is described
as “the most widely used test of significance, which estimates the probability that the
association between variables is a result of random chance or sampling error by
comparing the actual or observed distribution or responses we would expect if there were
absolutely no association between two variables” (Babbie et al. 2003, p.305). For the
purpose of this study, chi-square is employed to investigate the association between the
choices of ABC adoption as a dependent variable and each of the independent variables
(contingent variables).
7.7.2.2.5 Crosstabulations (Contingency tables):
It is necessary to explain contingency tables within the explanation of the chi-square test,
because they are the bases for calculating the chi-square statistic (Siegel 1996).
Babbie et al (2003, p.137) define a crosstabulation as “a matrix that shows the
distribution of one variable for each category of a second variable”. Contingency tables
should be prepared in order to calculate the chi-square statistic. However, it is not the sole
function of these tables. Crosstabulations or contingency tables can be used to explore the
relationship between two variables. They can give you an approximate idea of whether
there is an association between two variables or how strong this association is. On the
other hand, the direction of such a relationship cannot be determined through contingency
tables unless both variables are ordinal.

198
7.7.2.2.6 Assumptions for Chi-square
The most commonly known assumptions for Chi-square test in the literature (Siegel
1996) are:
(i) The data are assumed to be a random sample.
(ii) In the contingency tables, the expected frequencies for each category should be at
least 1.
(iii) No more than 20% of the categories should have expected frequencies of less
than 5. Statisticians suggest that when the contingency tables have 20% of its cells
with expected frequencies of less than five or when any of the cells has an expected
frequency less than one (zero cell), that the resulting test statistic may be magnified
and will lead to inappropriate conclusions (Siegel 1996). For such violation, chi-
square corrected for continuity (Yates’ correction) can be used; nevertheless, this
correction is valid only for 22× tables.
7.7.3 Cluster analysis method
Everett, et al., (2001) define cluster analysis as a technique for categorizing observations
into groups such that observations in each group are similar to each other while
observation in one group should be different from those of other groups or, alternatively
stated, cluster analysis seeks to identify a set of groups which both minimize within-
group variation and maximize between-group variation. Hair et al (1998) state that cluster
analysis is an objective methodology for quantifying the structural characteristics of a set
of observations. Aldenderfer and Blashfield (1984) argue that cluster analysis is a
199
multivariate statistical procedure that starts with a data set containing information about a
sample of entities and attempts to reorganise these entities into homogeneous groups.
Hair et al (1998) indicate that cluster analysis usually involves two steps. The first is the
measurement of some form of similarity or association between the entities to determine
how many groups exist in the sample. The second step is to profile the variables to
determine their composition. Aldenderfer and Blashfield (1984) argue that most of the
varied uses of cluster analysis can be subsumed under four principal objectives: (i)
development of a typology or classification, (ii) investigation of useful conceptual
schemes for grouping entities, (iii) hypothesis generation through data exploration, and
(iv) hypothesis testing, or the attempt to determine if types defined through other
procedures are in fact present in a data set.
Chenhall and Langfield-Smith (1998) argue that critical issue in cluster analysis is
determining the optimal number of clusters. While there are formal decision rules to
guide this process, heuristics are commonly used.
SPSS offers several methods for forming clusters. Hierarchical clustering which allows
users to select a definition of distance, then select a linking method of forming clusters,
then determine how many clusters best suit the data (Sharma 1996). In k-means
clustering the researcher specifies the number of clusters in advance, and then calculates
how to assign cases to the K clusters. K-means clustering is much less computer-
intensive and is therefore sometimes preferred when datasets are large .Finally, two-step
clustering creates pre-clusters, and then it clusters the pre-clusters.
As in this study, there are a large number of cases with eight different variables to be
examined; therefore, the K-means is appropriate.

200
7.7.3.1 K-means cluster analysis:
K-means cluster analysis uses Euclidean distance which is the most common distance
measure (Hair et al, 1998). The researcher must specify in advance the desired number of
clusters, K. Initial cluster centres are chosen in a first pass of the data, and then each
additional iteration of the group’s observations is based on the nearest Euclidean distance
to the mean of the cluster. Cluster centres change at each pass. The process continues
until cluster means do not shift more than a given cut-off value or the iteration limit is
reached (Corter 1996).
Cluster centres are the average value on all clustering variables of each cluster's
members. The "Initial cluster centres," in spite of its title, gives the average value of each
variable for each cluster for the k well-spaced cases which SPSS selects for initialization
purposes when no initial file is supplied. The "final cluster centres" table in the SPSS
output gives the same thing for the last iteration step. The "iteration history" table shows
the change in cluster centres when the usual iterative approach is taken. When the change
drops below a specified cut off, the iterative process stops and cases are assigned to
clusters according to which cluster centre they are nearest.
7.7.3.1.1 Assumptions of the K-means Cluster Analysis:
(i) Large datasets are possible with K-means clustering, unlike hierarchical clustering,
because K-means clustering does not require prior computation of a proximity matrix of
the distance/similarity of every case with every other case (Hair et al, 1998).
(ii) Normally in K-means clustering, a given case may be assigned to a cluster, and then
reassigned to a different cluster as the algorithm unfolds. However, in agglomerative K-

201
means clustering, the solution is constrained to force a given case to remain in its initial
cluster.
(iii) Data are interval in level or are true dichotomies for k-means clustering, though two-
step clustering can handle categorical data.
(iv) K-means cluster analysis is very sensitive to outliers. It is common to remove outliers
before conducting k-means cluster analysis. In the SPSS Options button dialog for this
type of cluster analysis, one can select "Outlier Treatment" to have outlier cases
automatically segregated into their own cluster.
(v) K-means cluster analysis usually generates different solutions, depending on the
sequence of observations in the dataset. Randomization of cases is recommended.
7.8 Summary and Conclusion
This chapter has addressed a number of issues relating to the choice of research
methodology adopted within this study. The overall purpose of the methodology is to test
the model, developed in Chapter 6, using an appropriate approach. In this chapter it has
been argued that the unique dimension of the study is that it addresses the likely
interaction between the contingent variables, which likely predispose companies to adopt
or reject ABC, and the difficulties of actual implementation. It is this interaction which, it
is argued, will better explain the actual take up of ABC.
The research philosophy is generally contingency/functional leaning and utilises
observation, deduction, testing and evaluation. Data collection is by means of postal
questionnaire. The survey was conducted amongst the companies comprising Business
and Finance Top 1000 Companies. The response rates for the survey were 19.1% .

202
The questionnaire comprised 12 questions and statistical analysis including parametric
and non parametric tests will be used to establish whether or not the seven hypothised
contingent factors are individually significantly related to ABC adoption. Should this, the
first stage of the model be validated, Cluster Analysis will be utilised to profile the
companies according to the individually significant contingent variables. Within each
cluster it is hypnotised that there will be companies which have, and companies which
have not implemented ABC. For each such cluster the reasons for non implementation
will be established. It is hypnotised that the reasons for rejection will differ between
clusters and that Technical Issues will be a significant reason amongst those companies
within the cluster which most closely matches the contingent variable model. Differences
between the reasons will be tested.
The next three chapters will present the statistical results and findings.

203
CHAPTER 8: RESULTS, FINDINGS AND DISCUSSION: DESCRIPTIVE ANALYSIS
8.1 Introduction
Chapter 7 has addressed a number of issues relating to the choice of research
methodology adopted within this research, the research philosophy and paradigms.
Moreover, it developed the research questions and the research hypotheses and developed
and justified the statistical analysis which will be used in this study.
This chapter presents the univariable analysis of the data collected from each question of
the survey. These results are presented, question by question, in the sequence in which
the questions appeared in the questionnaire.
The results are presented under the main headings as following: 8.2 Responses to
questions asked of all companies. 8.3 Responses to questions asked of adopting
companies. 8.4 Responses to questions asked of companies currently considering ABC
adoption. 8.5 Responses to questions asked of companies who have rejected ABC. 8.6
Responses to questions asked of companies which had not considered ABC adoption
8.2 Responses to questions asked of all Responding Companies
This section relates to questions asked of all responding companies. Univariable analysis
such as frequencies, percentages, means, standard deviations, ranges, and model value
will be used to present the results. These questions relate to the Organisational and
Environment Characteristics (industrial sectors, size, nationality of ownership, marketing
strategy, product diversity, management techniques, objectives of overhead allocation,
cost structure, expected change in overhead proportion, and business unit culture) and

204
ABC Systems (knowledge of ABC, initiate source of ABC knowledge and level of
adoption) as per sections 1 and 2 of the questionnaire.
8.2.1 Organisational and Environment Characteristics
8.2.1.1 Industrial Sector
Respondents were asked to indicate the industrial sector in which their companies
primarily operate. Table 8.1 below presents the responses by industry sector. All sectors
were represented. The manufacturing sector constituted the largest percentage of
respondents (44.3%), followed by Business Services (19.2%) and Financial Services
(13.8%). Exporter and Importer respondent companies constituted by 1.8% and 4.8%
respectively of all replies.
Table 8.1: Industrial sector Industry group Frequency Percentage
Business services
Manufacturing
Transport & distribution
Retail trade
Financial services
Exporter
Importer
32
74
13
14
23
3
8
19.2
44.3
7.8
8.4
13.8
1.8
4.8
Total 167 100.0
Note: Data drawn from question 1 (industry group).
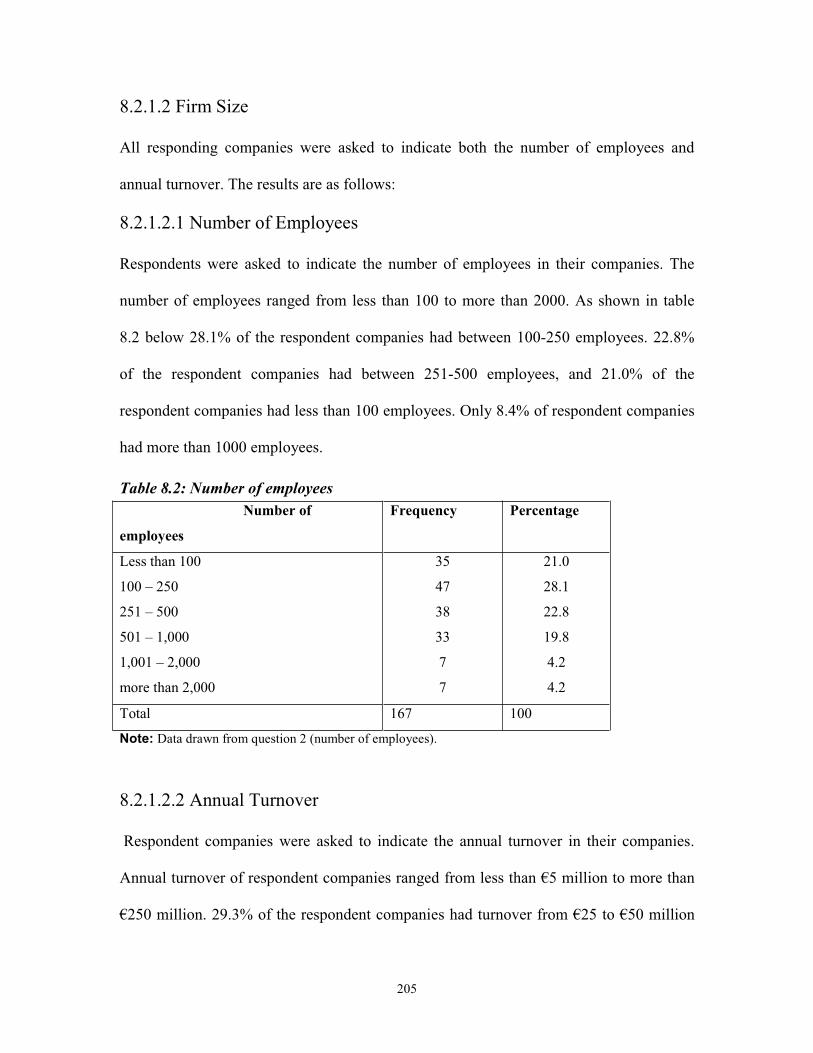
205
8.2.1.2 Firm Size
All responding companies were asked to indicate both the number of employees and
annual turnover. The results are as follows:
8.2.1.2.1 Number of Employees
Respondents were asked to indicate the number of employees in their companies. The
number of employees ranged from less than 100 to more than 2000. As shown in table
8.2 below 28.1% of the respondent companies had between 100-250 employees. 22.8%
of the respondent companies had between 251-500 employees, and 21.0% of the
respondent companies had less than 100 employees. Only 8.4% of respondent companies
had more than 1000 employees.
Table 8.2: Number of employees Number of
employees
Frequency Percentage
Less than 100
100 – 250
251 – 500
501 – 1,000
1,001 – 2,000
more than 2,000
35
47
38
33
7
7
21.0
28.1
22.8
19.8
4.2
4.2
Total 167 100
Note: Data drawn from question 2 (number of employees). 8.2.1.2.2 Annual Turnover
Respondent companies were asked to indicate the annual turnover in their companies.
Annual turnover of respondent companies ranged from less than €5 million to more than
€250 million. 29.3% of the respondent companies had turnover from €25 to €50 million

206
20.4% of the respondent companies had an annual turnover of €100 to €250 million, and
1.8% of the respondent companies had turnover of less than €5 million. Table 8.3
provides more details on annual turnover.
Table 8.3: Annual turnover Annual turnover Frequency Percentage
Less than €5 million
Between €5 to €25 million
Between €25 to €50 million
Between €50 to €100 million
Between €100 to €250 million
More than €250 million
3
29
49
32
34
20
1.8
17.4
29.3
19.1
20.4
12.0
Total 167 100.0
Note: Data drawn from question 3.
8.2.1.3 Nationality of ownership Table 8.4 shows the Nationality and Public/Private status of respondents. Nationality
relates to the two categories of Irish and Non-Irish companies. The results indicate that
55.1% of respondent companies were wholly Irish-owned companies, whereas 44.9%
were not wholly Irish-owned companies. Private companies represent 67.7% of
respondents by comparison with 32.3% of respondents who indicated they were public
companies.
Table 8.4: Company nationality and nature Features Frequency Percentage Company nationality Irish company Non-Irish company
92 75
55.1 44.9
Company nature Public Private
54
113
32.3 67.7
Note: Data drawn from questions 4, 5.
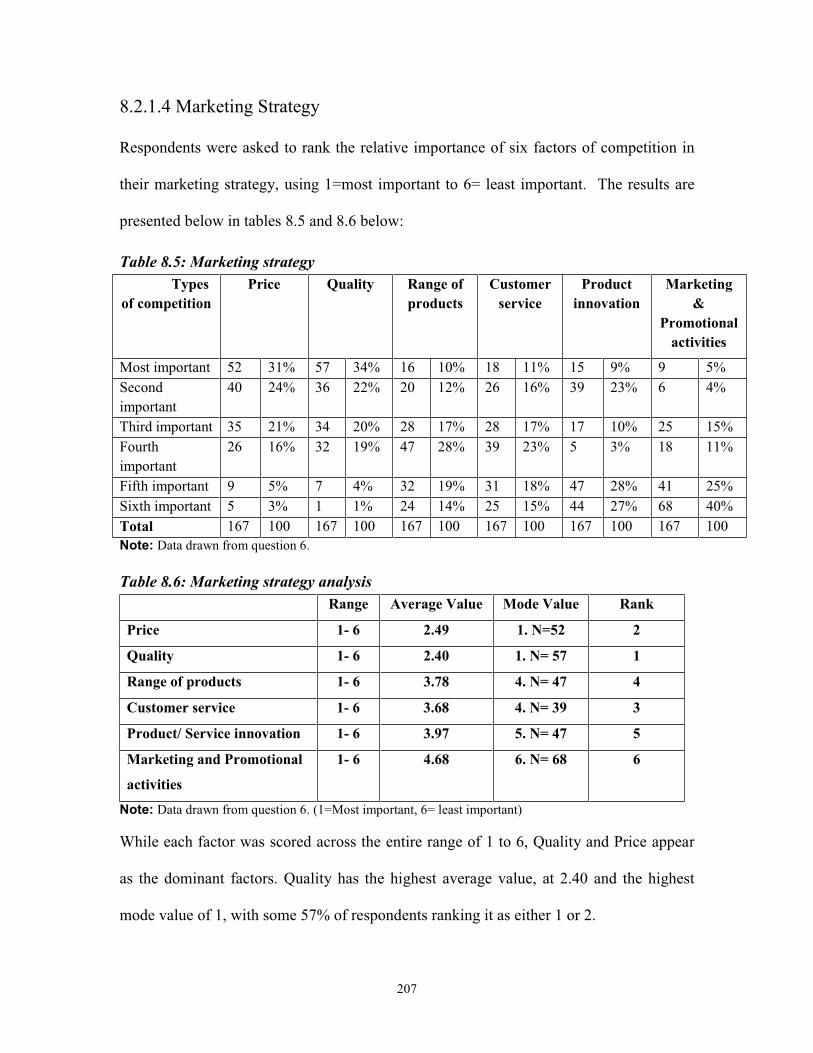
207
8.2.1.4 Marketing Strategy
Respondents were asked to rank the relative importance of six factors of competition in
their marketing strategy, using 1=most important to 6= least important. The results are
presented below in tables 8.5 and 8.6 below:
Table 8.5: Marketing strategy Types of competition
Price Quality Range of products
Customer service
Product innovation
Marketing &
Promotional activities
Most important 52 31% 57 34% 16 10% 18 11% 15 9% 9 5% Second important
40 24% 36 22% 20 12% 26 16% 39 23% 6 4%
Third important 35 21% 34 20% 28 17% 28 17% 17 10% 25 15% Fourth important
26 16% 32 19% 47 28% 39 23% 5 3% 18 11%
Fifth important 9 5% 7 4% 32 19% 31 18% 47 28% 41 25% Sixth important 5 3% 1 1% 24 14% 25 15% 44 27% 68 40% Total 167 100 167 100 167 100 167 100 167 100 167 100 Note: Data drawn from question 6.
Table 8.6: Marketing strategy analysis Range Average Value Mode Value Rank
Price 1- 6 2.49 1. N=52 2
Quality 1- 6 2.40 1. N= 57 1
Range of products 1- 6 3.78 4. N= 47 4
Customer service 1- 6 3.68 4. N= 39 3
Product/ Service innovation 1- 6 3.97 5. N= 47 5
Marketing and Promotional
activities
1- 6 4.68 6. N= 68 6
Note: Data drawn from question 6. (1=Most important, 6= least important) While each factor was scored across the entire range of 1 to 6, Quality and Price appear
as the dominant factors. Quality has the highest average value, at 2.40 and the highest
mode value of 1, with some 57% of respondents ranking it as either 1 or 2.

208
Price as an important factor in marketing strategy closely follows Quality in order of
importance, with an average value of 2.49 and a model value of 1. Some 55% of
respondents ranked Price as either the most important or second most important factor in
their marketing strategy. The mode values for all other factors are all in the lower half of
the scale, with Marketing and Promotional Activities having a mode value of 6 = least
important.
There is however evidence of diversity in the responses, with each factor being scored, by
different respondents, over the entire scale.
8.2.1.5 Product diversity
In terms of number of products/services, respondents were asked to indicate the number
of products or services they provided. The question provided for six levels of number of
products/services (single product/service, 1-10, 11-50, 51-100, 101-1000 and more than
1000). As shown in table 8.7 below, all levels of product diversity are represented in the
responses. The results appear almost binomial with high frequencies for product ranges of
between 1 and 10, (22.8% of respondents) and of between 101 and 1000, (23.3% of
respondents).
Table 8.7: Number of products Number of products/services Frequency percentage - single product/service - 1-10 - 11-50 - 51-100 - 101-1000 - more than 1000
17 39 31 17 39 23
10.2 23.5 18.7 10.3 23.5 13.8
Note: Data drawn from question 7.

209
8.2.1.6 Use of Accounting and Management techniques
Respondents were also asked to indicate the Accounting and Management techniques
utilised within their companies. The question provided a list of accounting and
management techniques which might be used.
Budgeting was reported as being used by over eighty percent (87.4%) of all respondents.
Standard costing was used by over sixty percent (61.1%) of respondents. Return on
investment (ROI) was used by over one-half (53.3%) of respondents. The rest of
techniques were used by under one-half of respondents, as shown in table 8.8. For
example, payback period, net present value and job costing were used by 47.3%, 34.1%
and 27.5% respectively. ABC was used by 26.3% of all respondents. Whereas, Balance
Scorecard (BCS), Process Costing, Target Cost Planning and Cost-Volume Analysis are
utilised by 16.8%, 16.8%, 13.8% and 13.2% of respondents respectively.
Table 8.8: Cost management techniques Accounting and Management techniques Frequency Percentage - Budgeting - Standard Costing - Return On Investment (ROI) - Payback Period - Net Present Value (NPV) - Job Costing - Activity-Based Costing (ABC) - Process Costing - Balance Scorecard (BCS) - Target Cost Planning - Cost-Volume-Profit analysis (CVP) - Quality Cost Analysis (COQ) - Activity-Based Management (ABM) - Activity Cost Analysis (ACA)
146 102 89 79 57 46 44 28 28 23 22 9 7 4
87.4 61.1 53.3 47.3 34.1 27.5 26.3 16.8 16.8 13.8 13.2 5.4 4.2 2.4
Note: Data drawn from question 8 (cost management techniques).

210
8.2.1.7 Objectives of overhead allocation
Respondents were asked to indicate the importance of a range of objectives in allocating
overhead costs, on a 5-point Likert-scale, ranging from 1= not important to 5=critically
important. As shown in tables 8.9 and 8.10 below, Product/Service Pricing was rated,
overall, as the most important objective in the allocation of overhead, with an average
value of 3.74 and a mode value of 4 (N=70). Cost Control was ranked, overall as the
second most important objective with an average value of 3.68 and a mode value of 4
(N=54).. External Reporting and Production/Service Planning were ‘medium important’
as objectives in allocating overheads, the average values were 2.78 and 2.88 respectively
and mode values of 3 (N=46 and 53). Departments Evaluation and Managers’
Performance Evaluation were, overall, ‘very important’ objectives in allocating
overheads with an average value of 3.14 and 3.17 and a mode value of 4 (N= 57 and 58)
respectively. Control of cost incidence was rated, overall, as the third most important
objective with an average value of 3.25 and a mode value of 4 (N=52).

211
Table 8.9: Importance of various objectives in allocating overhead costs Factors in allocating overhead
Not important
Little importance
Medium importance
Very important
Critically important
Total
Product/service cost control
12 7.7%
10 6.5%
36 23.3%
54 34.8%
43 27.7%
155 100.0%
Product/service pricing
11 7.1%
7 4.5%
30 19.4%
70 45.2%
37 23.8%
155 100.0%
External reporting 23 14.7%
42 26.9%
46 29.5%
36 23.1%
9 5.8%
156 100.0%
Production/service planning
17 11.0%
38 24.7%
53 34.5%
38 24.6%
8 5.2%
154 100.0%
Departments evaluation
14 8.9%
27 17.4%
48 30.8%
57 36.5%
10 6.4%
156 100.0%
Managers’ performance evalua
15 9.5%
31 19.8%
38 24.3%
58 36.9%
15 9.5%
157 100.0%
Control of cost incidence
14 8.9%
25 15.9%
46 29.4%
52 33.1%
20 12.7%
157 100.0%
Note: Data drawn from question 9 (factors in allocating overhead costs).
Table 8.10: Objectives in allocating overhead costs Range Average Value Mode Value
Product/service cost control 1- 5 3.68 4. N=54
Product/service pricing 1- 5 3.74 4. N= 70
External reporting 1- 5 2.78 3. N= 46
Production/service planning 1- 5 2.88 3. N= 53
Departments evaluation 1- 5 3.14 4. N= 57
Managers’ performance evaluation 1- 5 3.17 4. N=58
Control of cost incidence 1-5 3.25 4.N = 52
Note: Data drawn from question 9. (1=Not important, 5=Critically important) 8.2.1.8 Cost structure
Respondents were asked to indicate the approximate percentage of their total costs by
each of the three categories: direct material, direct labour and production/service
overhead. The results are presented in table 8.11:

212
Table 8.11: Cost structure Statistics Direct material
% Direct labour
% Overheads
%
Mean Median Mode Std. Deviation Range Minimum Maximum
42.14 40.00 45.00 16.76 75.00 10.00 85.00
30.06 30.00 20.00 13.42 63.00 10 73.00
27.78 25.00 20.00 12.42 60.00 5.00 65.00
Note: Data drawn from question 10. As can be seen from table 8.11 above, the reported cost structure varies between firms.
Direct material was the highest cost element, with a mean value of 42.14%, median value
of 40% and mode value of 45%, it also recorded the highest range of 75% (Max 85% and
Min 10%). Direct labour was the second highest cost element, with a mean value of
30.06%, median 30% and mode value of 20%. The range was 63% between the
maximum and minimum range of 73% and 10%. The lowest cost element was
Production/Service overheads, with an average value of 27.78%, median value of 25%
and mode value of 20%, the range was 60%.
The high variation in cost structure as evidence by the very high range of the responses in
each of the three categories of cost may be attributed to the difference in industry
characteristics, and the degree of automation.
8.2.1.9 Expectation of changes in overhead costs
Respondents were asked to indicate their expectation of variation in the proportion of
production/service overhead costs to total costs over the next five years. 37.7% of
respondents indicated that they expected their proportion of overhead costs to total
product/service cost would be stable. 31.7% of respondent companies expected that their
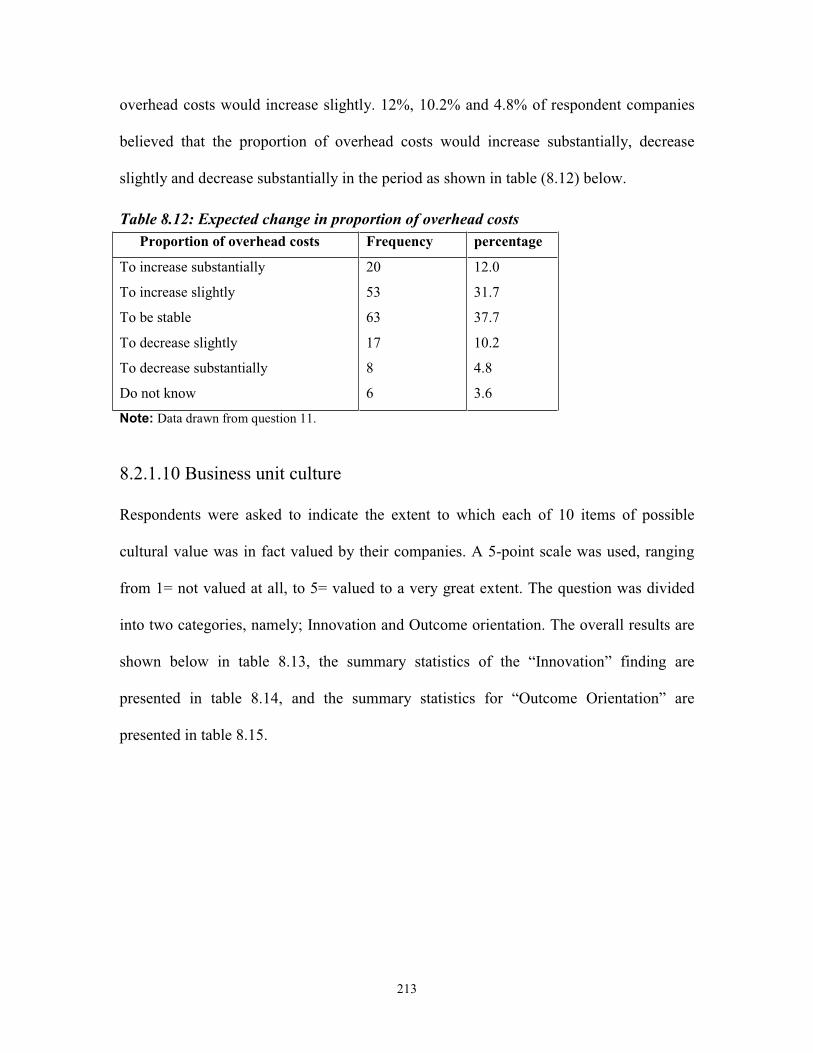
213
overhead costs would increase slightly. 12%, 10.2% and 4.8% of respondent companies
believed that the proportion of overhead costs would increase substantially, decrease
slightly and decrease substantially in the period as shown in table (8.12) below.
Table 8.12: Expected change in proportion of overhead costs Proportion of overhead costs Frequency percentage
To increase substantially
To increase slightly
To be stable
To decrease slightly
To decrease substantially
Do not know
20
53
63
17
8
6
12.0
31.7
37.7
10.2
4.8
3.6
Note: Data drawn from question 11. 8.2.1.10 Business unit culture
Respondents were asked to indicate the extent to which each of 10 items of possible
cultural value was in fact valued by their companies. A 5-point scale was used, ranging
from 1= not valued at all, to 5= valued to a very great extent. The question was divided
into two categories, namely; Innovation and Outcome orientation. The overall results are
shown below in table 8.13, the summary statistics of the “Innovation” finding are
presented in table 8.14, and the summary statistics for “Outcome Orientation” are
presented in table 8.15.

214
Table 8.13: Business unit culture Business unit culture Not
valued Little
valued Medium valued
Very valued
Valued to a very great extent
Total
Innovation A willingness to experiment
6 3.6%
34 20.4%
71 42.5%
43 25.7%
13 7.5%
167 100.0%
Not being constrained by many rules
11 6.6%
42 25.1%
74 44.3%
37 22.2%
3 1.8%
167 100.0%
Being quick to take advantages of opportunities
3 1.8%
8 4.8%
33 19.9%
75 45.2%
47 28.3%
166 100.0%
Being innovative 4 2.4%
13 7.8%
38 22.8%
72 43.1%
40 24.0%
167 100.0%
Risk taking 9 5.4%
51 30.5%
69 41.3%
34 20.4%
4 2.4%
167 100.0%
Outcome orientation Being competitive 1
0.6% 4
2.4% 18
10.8% 55
32.9% 89
53.3% 167
100.0% Being achievement oriented
1 0.6%
4 2.4%
28 16.8%
75 44.9%
59 35.3%
167 100.0%
Having high expectation for performance
1 0.6%
3 1.8%
31 18.6%
71 42.5%
61 36.5%
167 100.0%
Being results oriented 1 0.6%
7 4.2%
32 19.2%
56 33.5%
71 42.5%
167 100.0%
Being action oriented 1 0.6%
13 7.8%
50 29.9%
61 36.5%
42 25.1%
167 100.0%
Note: Data drawn from question 12. 1= not valued at all. 5= valued to a very great extent As can be seen from table 8.13, all questions were scored across the full range of possible
answers, indicating high diversity in the responses. In general, the mode scores of the 5
questions relating to “Innovation” indicate that the factors are of “medium value” or
“very valued”. The 5 factors relating to “Outcome orientation” are more highly valued,
with “very valued” and “valued to a very great extent” being the mode responses.

215
Table 8.14: Business unit culture (Innovation) Innovation Range Mean value Mode value Rank Being quick to take advantage of opportunities
1-5 3.93 4. N= 75 1
Being innovative 1-5 3.78 4. N= 72 2 Willing to experiment 1-5 3.14 3. N= 71 3 Not being constrained by many rules 1-5 2.87 3. N= 74 4 Risk taking 1-5 2.84 3. N= 69 5 1= not valued at all. 5= valued to a very great extent Table 8.14 above shows the mean scores and the mode values for each item that loaded
on this dimension, the highest mean score and mode value was reported on ‘being quick
to take advantage of opportunities’ (mean value of 3.93 and mode value of 4: 75). ‘Being
innovative’ ranked second by mean score =3.78 and a mode value of (4: 72 company). In
contrast ‘Not being constrained by many rules’ and ‘Risk taking’ ranked as the latest
valued items in innovation, the mean scores respectively (2.87 and 2.84) and the mode
value recorded 3 (N=74 and 69 respectively).
Table 8.15: Business unit culture (outcome orientation Out come orientation Range Mean value Mode value rank
Being competitive 1-5 4.36 5. N= 89 1
Being results oriented 1-5 4.13 5. N= 71 2
Having high expectations for performance 1-5 4.13 4. N= 71 3
Being achievement oriented 1-5 4.12 4. N= 75 4
Being action oriented 1-5 3.78 4. N= 61 5
1= not valued at all. 5= valued to a very great extent The results show higher scores among the factors of outcome orientation than for the
innovation factors. The highest factor in this dimension was ‘Being competitive’ (mean
score = 4.36 and mode value of 5: 89 company). ‘Being action oriented’ was the lowest
scored factor in this group with a mean score of 3.78 and mode value 4.
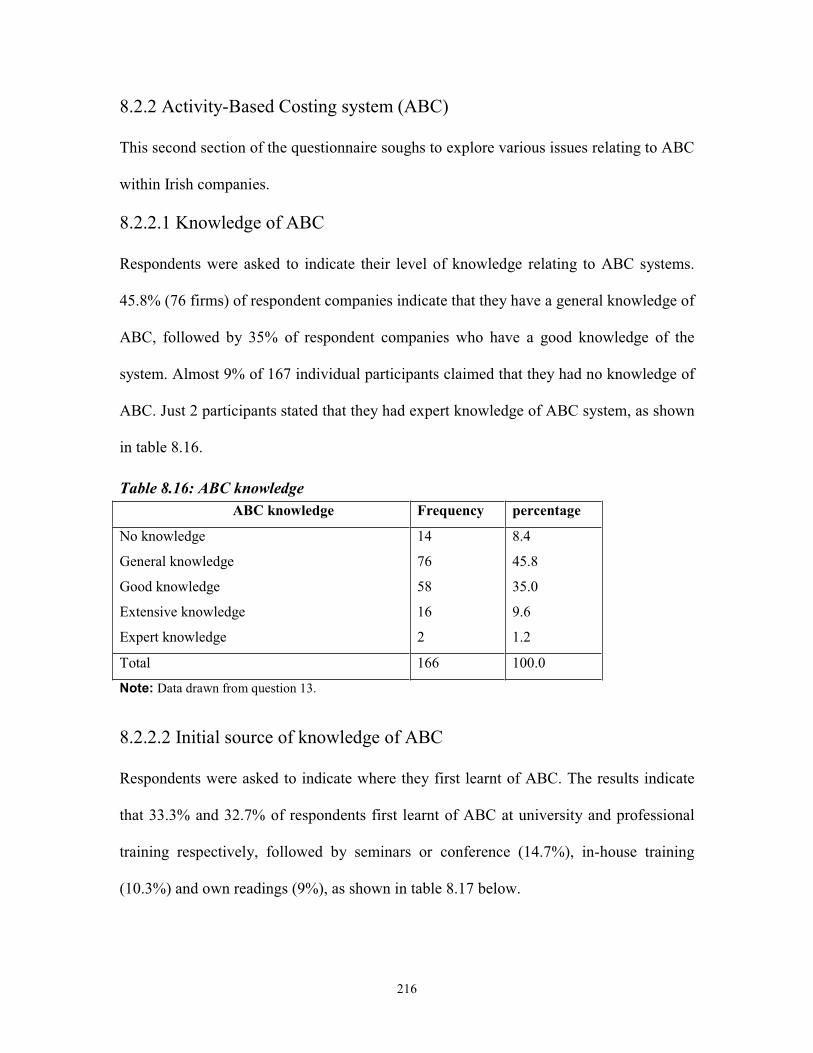
216
8.2.2 Activity-Based Costing system (ABC)
This second section of the questionnaire soughs to explore various issues relating to ABC
within Irish companies.
8.2.2.1 Knowledge of ABC
Respondents were asked to indicate their level of knowledge relating to ABC systems.
45.8% (76 firms) of respondent companies indicate that they have a general knowledge of
ABC, followed by 35% of respondent companies who have a good knowledge of the
system. Almost 9% of 167 individual participants claimed that they had no knowledge of
ABC. Just 2 participants stated that they had expert knowledge of ABC system, as shown
in table 8.16.
Table 8.16: ABC knowledge ABC knowledge Frequency percentage
No knowledge
General knowledge
Good knowledge
Extensive knowledge
Expert knowledge
14
76
58
16
2
8.4
45.8
35.0
9.6
1.2
Total 166 100.0
Note: Data drawn from question 13. 8.2.2.2 Initial source of knowledge of ABC
Respondents were asked to indicate where they first learnt of ABC. The results indicate
that 33.3% and 32.7% of respondents first learnt of ABC at university and professional
training respectively, followed by seminars or conference (14.7%), in-house training
(10.3%) and own readings (9%), as shown in table 8.17 below.
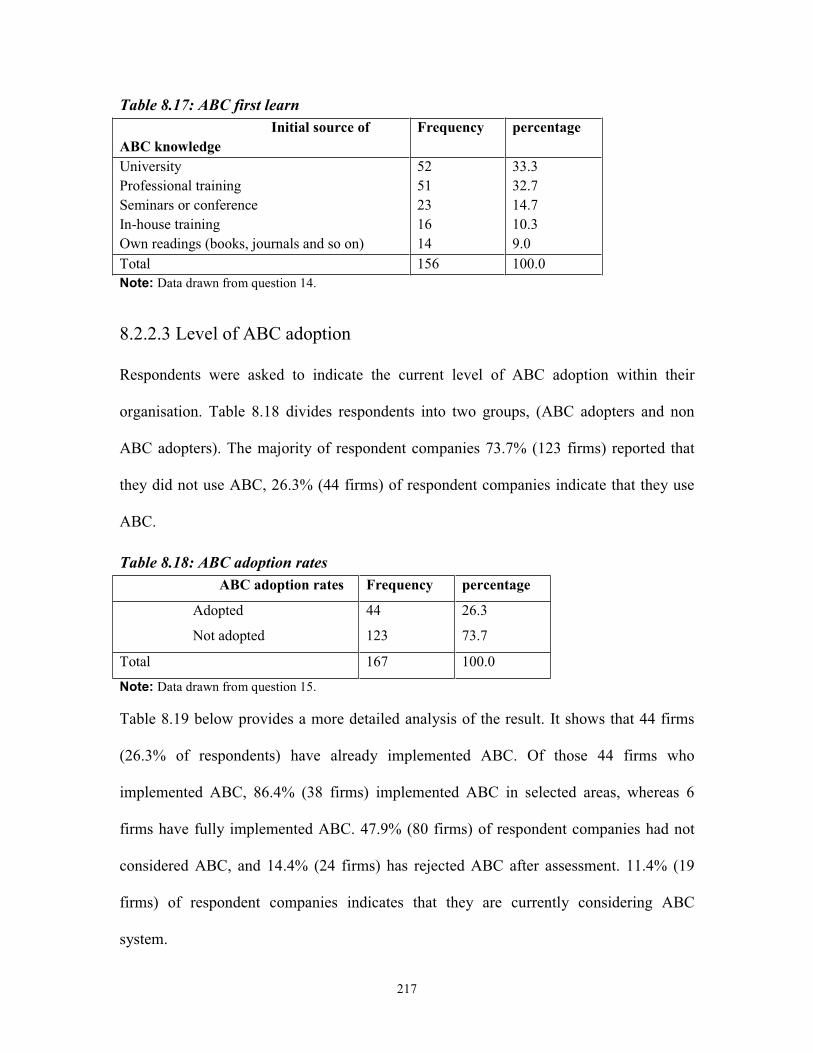
217
Table 8.17: ABC first learn Initial source of ABC knowledge
Frequency percentage
University Professional training Seminars or conference In-house training Own readings (books, journals and so on)
52 51 23 16 14
33.3 32.7 14.7 10.3 9.0
Total 156 100.0 Note: Data drawn from question 14.
8.2.2.3 Level of ABC adoption
Respondents were asked to indicate the current level of ABC adoption within their
organisation. Table 8.18 divides respondents into two groups, (ABC adopters and non
ABC adopters). The majority of respondent companies 73.7% (123 firms) reported that
they did not use ABC, 26.3% (44 firms) of respondent companies indicate that they use
ABC.
Table 8.18: ABC adoption rates ABC adoption rates Frequency percentage
Adopted
Not adopted
44
123
26.3
73.7
Total 167 100.0
Note: Data drawn from question 15. Table 8.19 below provides a more detailed analysis of the result. It shows that 44 firms
(26.3% of respondents) have already implemented ABC. Of those 44 firms who
implemented ABC, 86.4% (38 firms) implemented ABC in selected areas, whereas 6
firms have fully implemented ABC. 47.9% (80 firms) of respondent companies had not
considered ABC, and 14.4% (24 firms) has rejected ABC after assessment. 11.4% (19
firms) of respondent companies indicates that they are currently considering ABC
system.

218
Table 8.19: ABC adoption rates ABC adoption rates Frequency percentage
Full implementation
Implemented in selected areas
Currently under consideration
Rejected ABC after assessment
No consideration of ABC to date
6
38
19
24
80
3.6%
22.7%
11.4%
14.4%
47.9%
Total 167 100.0
Note: Data drawn from question 15. 8.3 Responses to questions asked of adopting companies
8.3.1 First ABC introduced
Respondents were asked to indicate when ABC was first introduced in their companies.
Of the 44 firms which have implemented ABC, 6 firms (13.6%) implemented the system
before 1995, and 14 firms (31.8%) of ABC adopters implemented the system between
1995 to 1999. More than a half (54.6%) of ABC adopters implemented the system during
the last five years.
Table 8.20: ABC first introduced ABC first introduced Frequency percentage
Before 1995
1995-1999
2000 to date
6
14
24
13.6
31.8
54.6
Total 44 100.0
Note: Data drawn from question 16. 8.3.2 Initiators of ABC
Respondents were asked to indicate who initiated the adoption of ABC. The results are
presented in table 8.21 below which indicates that 56.8% of ABC adopters reported that
ABC adoption was initiated in their firms by senior management, followed by

219
accounting/finance managers (38.6%). Production managers and research and
development personnel each constitute just 2.3% of the responses. Furthermore, the
results reported no initiation by Marketing Managers, Customer Service Managers and
Information Systems personnel.
Table 8.21: Initiators of ABC adoption Initiated of ABC adoption Frequency percentage Senior management Accounting/Finance managers Production managers Research & development personnel Marketing managers Customer service managers Information systems personnel
25 17 1 1 0 0 0
56.8 38.6 2.3 2.3 0 0 0
Total 44 100.0 Note: Data drawn from question 17.
8.3.3 ABC introduction strategy
Adopting companies were asked to indicate if they initially introduced ABC across the
whole organisation or in selected areas. Table 8.22 below shows that the majority of
implementers (81.8%) introduced ABC in selected areas, whereas (18.2%) introduced
ABC across the whole organisation.
Table 8.22: Introduction strategy Introduction strategy Frequency percentage
Across the whole organisation
In selected areas
8
36
18.2
81.8
Total 44 100.0

220
8.3.4 Involvement with ABC implementation
Respondents were asked to identify how much involvement each of a variety of parties
had in implementing ABC. As reported in table 8.23, in-house accountants were the most
highly involved parties in implementing ABC (mean scores = 4.45) and had the highest
mode (5: 25 firms). Some other parties had a mean score above the mid range of the scale
used. For example Senior Executives, Production Personnel and Information System
Personnel and External Consultants (mean scores = 2.95, 2.88, 2.86 and 2.53
respectively). Table 8.23 reports these results in more details.
Table 8.23: Involvement in ABC implementation N Range Mean Mode
value In-house accountants Senior executives Production personnel Information system personnel External consultants Sales/marketing personnel Purchasing/procurement personnel Distribution personnel Research & development personnel
44 43 43 44 43 42 43 42 43
1-5 1-5 1-5 1-5 1-5 1-5 1-5 1-5 1-5
4.45 2.95 2.88 2.86 2.53 2.38 2.35 2.29 2.07
5.N=25 3. N=23 3.N=20 3.N=21 3.N=19 3.N=15 3.N=21 3.N=21 3.N=20
Note: Data drawn from question 19. (5-point scale where 1= low involvement and 5= high involvement).
8.3.5 Reasons for ABC adoption
The adopters of ABC (44 firms) were asked in question 20 to rate the importance of six
factors in their decision to adopt ABC using a five-point scale where 1 represented ‘not
important’ and 5 represented ‘critically important’. Table 8.24 below shows the results.
ABC users indicated that inability of the traditional cost systems to provide relevant cost
information (mean scores = 4.40, mode=5) was the most highly ranked reason in their
decision to adopt ABC. The results also show that increased competition (mean scores =

221
3.59, mode=4), increased range of product/service (mean scores = 3.53, mode = 4) and
increased overhead (mean scores = 3.52, mode = 4) were also highly ranked reasons for
adopting ABC, as shown in table 8.24.
Table 8.24: Reasons for ABC adoption Importance in ABC decisions N Range Mean Mode SD
- Inability of the traditional systems
to provide relevant cost information
- Increasing competition
- Increasing range of product/service
- Increasing overhead
- Increasing regulatory environment
44
44
43
44
43
1-5
1-5
1-5
1-5
1-5
4.40
3.59
3.53
3.52
2.49
5. N=24
4. N=22
4. N=19
4. N=25
2. N=12
0.84
0.99
1.09
1.02
1.12
Note: Data drawn from question 20. (5-point scale where 1= not important & 5=critically important). 8.3.6 Success of ABC implementation
Respondents were asked to give their opinions on the level of success they ascribed to the
ABC system in relation to each of 19 specified areas of application, on a 5-point scale
ranging from 1= low success level to 5= high success level.
Table 8.25 below shows that each of the areas received scores across the full range of
possible responses, indicating highly different “success” scores across the responding
companies. In general, “Pricing” was the area of application with the highest mean score
(4.17), followed by “Budgeting”, (mean score 4). Both have high and equal mode values
of 4. “Cost Reduction”, “Customer Profitability Analysis” and “Performance Measures”
also in general, score highly, with model values of 3 and mean values in excess of the
midpoint of the range.

222
Table 8.25: ABC applications (Success) N Range Mean Mode SD
Product/service pricing
Budgeting
Cost reduction
Customer profitability analysis
Performance measurement
Forecasting
Output decisions
Cost modelling
Strategic planning
Process/operating management
Value added analysis
New product/service design
Outsourcing decisions
Restructuring decisions
Capital investment decisions
Stock valuation
Quality initiative
Reward system
JIT/speed initiative
42
43
43
41
42
43
41
42
43
41
42
40
42
43
40
41
40
41
39
1-5
1-5
1-5
1-5
1-5
1-5
1-5
1-5
1-5
1-5
1-5
1-5
1-5
1-5
1-5
1-5
1-5
1-5
1-5
4.17
4.00
3.49
3.47
3.45
3.37
3.19
3.10
3.02
2.80
2.76
2.75
2.71
2.65
2.60
2.37
2.35
2.17
1.72
4. N=23
4. N=29
4. N=18
4. N=19
4. N=18
3. N=19
3. N=12
3. N=15
3. N=13
3. N=15
3.N=13
3. N=15
3. N=14
3. N=16
2. N=14
2. N=19
2. N=13
2. N=18
1. N=17
0.66
0.72
0.94
1.21
1.17
1.00
1.17
1.12
1.10
0.95
1.14
1.13
1.22
1.11
1.05
1.18
1.07
1.02
0.82
Note: Data drawn from question 21. (5-point scale where 1= low success, importance & 5= high success, importance). 8.3.7 Importance of ABC implementation
Respondents were asked to give their opinions on the degree of importance they ascribed
to the ABC system in relation to each of 19 specified areas of application, on a 5-point
scale ranging from 1= low importance level to 5= high importance level
Table 8.26 below indicates that each of the areas of application received scores over the
full range of possible responses, indicating high differences between the companies in tier
rating of the importance of ABC to the particular application.

223
In general, the five areas of “Product and Service Pricing”, “Budgeting”, “Cost
Reduction”, “Performance Measurement” and “Customer Profitability Analysis” received
high rankings, as was the case with “Success”.
Table 8.26: ABC applications (importance) N Range Mean Mode SD
Product/service pricing
Budgeting
Cost reduction
Performance measurement
Customer profitability analysis
Output decisions
Cost modelling
Forecasting
Process/operating management
Strategic planning
New product/service design
Value added analysis
Outsourcing decisions
Restructuring decisions
Capital investment decisions
Stock valuation
Quality initiative
Reward system
JIT/speed initiative
42
43
42
41
41
41
42
42
41
42
41
42
43
43
40
42
40
41
40
1-5
1-5
1-5
1-5
1-5
1-5
1-5
1-5
1-5
1-5
1-5
1-5
1-5
1-5
1-5
1-5
1-5
1-5
1-5
4.60
4.33
4.07
3.90
3.68
3.54
3.43
3.40
3.12
3.09
3.09
3.07
2.93
2.77
2.75
2.62
2.40
2.34
1.90
5. N=28
5. N=19
4. N=19
5. N=16
4. N=21
3. N=13
3. N=22
3. N=20
3. N=15
3. N=21
3. N=22
3. N=18
3. N=17
3. N=18
3. N=20
3. N=12
2. N=14
2. N=18
2. N=17
0.63
0.68
0.95
1.26
1.11
1.21
0.94
0.94
1.07
1.00
0.99
1.05
1.18
1.09
1.03
1.32
1.01
1.04
0.81
Note: Data drawn from question, 22. (5-point scale where 1= low success, importance & 5= high success, importance).

224
8.3.8 Difficulties encountered
Respondents who have already implemented ABC (44 firms) were asked to indicate the
extent of the difficulties encountered in 5 areas in designing and implementing their ABC
system. The level of difficulty encountered was ranked on a five-point scale (1= very
easy and 5= very difficult). Table 8.27 summarises the findings.
Table 8.27: Difficulties of ABC implementation Difficulties in implementing ABC N Range Mean Mode SD
- In selecting cost drivers
- In designing the system
- In assigning activity’s costs to cost
objects
- In defining activities
- In assigning resources to activities
44
44
44
44
44
1-5
1-5
1-5
1-5
1-5
4.18
4.02
3.86
3.75
3.59
5. N=22
4. N=16
4. N=16
4. N=19
4. N=18
0.97
0.85
0.88
0.89
0.84
Note: Data drawn from question 23. (5-point scale where 1= very easy & 5= very difficult). As shown above, selection of cost drivers was generally scored as being the most difficult
area with a mean score of 4.18 out of 5 and a model score of 5 out of 5.
The second highest scored difficulty was ‘Designing the system’ with a mean score of
4.02 and with a model score of 4 out of 5. Moreover, the remaining technical difficulties
such as assigning activity’s cost to cost objects, identifying activities and assigning
resources to activities were all scored as being as ‘quite difficult’ (mean scores= 3.86 ,
3.75 and 3.59) respectively.

225
8.4 Responses to questions asked of companies currently considering ABC
adoption
8.4.1 Factors militating against ABC adoption
Companies currently considering the adoption of ABC (19 firms) were asked to identify
factors militating against its adoption, by ticking a range of possible factors, the results
are presented in table 8.28 below. Difficulty in selecting cost drivers and difficulty in
defining activities were both ranked as the most common difficulties (73.7% and 68.4%
respectively), followed by high costs of ABC implementation, uncertainty of ABC
benefits, difficulty in assigning resources to activities and data collection
difficulties(63.2%, 63.2%, 57.9% and 52.6%) respectively.
The bottom half of table 8.28 shows the least important reasons, such as internal
resistance, higher priority of other changes/projects, lack of top management support and
inadequate computer software by (26%, 26%, 21% and 21% respectively).
Table 8.28: Factors against adoption of ABC Factors Frequency percentage
- Difficulty in selecting cost drivers
- Difficulty in defining activities
- High costs of ABC implementation
- Uncertainty of ABC benefits
- Difficulty in assigning resources to activities
- Data collection difficulties
- Difficulty in assigning activity’s costs to cost objects
- internal resistance
- A higher priority of other changes/projects
- Lack of top management support
- Inadequate computer software
- Other reasons
14
13
12
12
11
10
8
5
5
4
4
0
73.7
68.4
63.2
63.2
57.9
52.6
42.1
26.3
26.3
21.0
21.0
0
Note: Data drawn from question 24 (multiple responses).

226
8.5 Responses to questions asked of companies who have rejected ABC The 24 companies which had rejected ABC were asked to identify the reasons why they
had rejected. As shown in table 8.29 below, technical difficulties were most commonly
reported as reasons for their rejection of the system. For example, 83 % of rejecting
companies (24 companies) indicate difficulty in selecting cost drivers as a reason for
rejecting ABC. In addition, difficulty in defining activities and in assigning the cost of
activities to cost object were reported as reasons for rejecting ABC in 75.0% and 70.8%
respectively. Data collection difficulties and high costs of ABC implementation were
both stated as reasons by 62.5% of responses of firms which had rejected ABC.
Table 8.29: Reasons for rejecting ABC Factors Frequency percentage
- Difficulty in selecting cost drivers
- Difficulty in defining activities
- Difficulty in assigning activity’s costs to cost objects
- Data collection difficulties
- High costs of ABC implementation
- Difficulty in assigning resources to activities
- Satisfied with current system
- ABC is not relevant to our business
- Uncertainty of ABC benefits
- Inadequate computer software
- Internal resistance
- Small percentage of overhead costs
- Lack of top management support
- A higher priority of other changes/projects
- Manufacturing process is simple, easy to track costs
- The number of products/service is low
- Lack of knowledge regarding ABC
- Other reasons
20
18
17
15
15
13
12
10
9
7
6
6
6
5
4
3
0
0
83.3
75.0
70.8
62.5
62.5
54.2
50.0
41.7
37.5
29.2
25.0
25.0
25.0
20.8
16.7
12.5
0
0
Note: Data drawn from question 25 (multiple responses).

227
Behavioural and System’s reasons are also indicated in table 8.29. 12 firms which had
rejected ABC indicate that they were satisfied with their current system and 10 firms
indicated that ABC was not relevant to their business. Uncertainty of ABC benefits,
inadequate computer software and internal resistance were indicated as reasons for
rejection by some companies that rejected ABC.
Finally, the least cited reasons for rejecting ABC include Internal resistance (25%), Small
percentage of overhead costs (25%), Lack of top management support (25%), a higher
priority of other projects (20.8%), manufacturing process is simple (16.7%), and the
number of products/service is low (12.5%). Lack of knowledge regarding ABC was not
mentioned by any rejected companies
8.6 Responses to questions asked of companies which had not considered
ABC adoption
8.6.1 Reasons for not considering ABC
Companies which had not considered the adoption of ABC (80 firms) were asked to
indicate the possible reasons for their decision. Table 8.30 below reports the results.
‘Small percentage of overhead costs’ was the most frequent reason given for not
considering ABC adoption by (95% of respondent companies), followed by ‘small
number of products/ services’ (86.3%). 66 companies indicate that they are satisfied with
their current system, and 61 companies indicated that ABC was not relevant to our
business.

228
Table 8.30: Reasons for not considering ABC Factors Frequency percentage
- Small percentage of overhead costs
- The number of products/service is low
- Satisfied with current system
- ABC is not relevant to our business
- Manufacturing process is simple, easy to track costs
- Lack of knowledge regarding ABC
76
69
66
61
54
48
95.0
86.3
82.5
76.3
67.5
60.0
Note: Data drawn from question 26 (multiple responses).
8.6.2 Currently used basis for overhead allocation
In allocating overhead costs to cost objects, respondents who did not adopt ABC were
asked to indicate the current bases used to allocate overheads to cost objects. The most
common base was direct labour hours reported by 79.7% of respondent companies.
Machine hours were used by 59.3% of respondent companies. Units of products and
direct material costs were used by 31.7% and 22.8 respectively of respondent companies,
as shown in table 8.31.
Table 8.31: Basis in cost allocation Basis in Cost Allocation Frequency percentage
- Direct labour hours
- Machine hours
- Units of products
- Direct materials costs
- Other
98
73
39
28
0
79.7
59.3
31.7
22.8
0
Note: Data drawn from question 27 (basis in cost allocation).

229
8.6.3 Satisfaction with the current cost system
All respondents were asked to indicate their satisfaction with the current overhead cost
allocation. 46.7% of respondent companies were reasonably satisfied with their systems.
13.2% of respondent companies claimed that their systems needed improvements. 10.8%
of respondent companies indicated that they were very satisfied with their current system.
1.8% of respondents were dissatisfied with the current overhead allocation system as
showed in table 8.32 below.
Table 8.32: Satisfaction with the current cost system Satisfaction status Frequency percentage
Very satisfied
Reasonably satisfied
Needs improvements
dissatisfied
18
78
22
3
10.8
46.7
13.2
1.8
Note: Data drawn from question 28.
8.6.4 ABC future anticipation
Respondents (non-adopters) were asked to indicate whether they anticipated that their
company would adopt ABC in the next five years. Table 8.33 below shows that 11.5%
anticipated expect that ABC would be implemented. 66.5% expected to not implement
the system, (22%) do not know if they are going to implement the system or not.
Table 8.33: ABC future anticipation Future anticipation Frequency percentage
Yes
No
I do not know
14
81
27
11.5%
66.5%
22%
Note: Data drawn from question 29.
230
8.7 Summary and Conclusion
This chapter reports the findings of a survey of ABC used in Irish companies. The
questionnaire used in this study, consists of 29 questions and was divided into two main
sections (see chapter 7 for more details). The first section aimed to examine company
characteristics, whereas the second section was designed to examine the adoption statues
of ABC amongst the participants. Moreover, the results are presented, question by
question, in the sequence in which the questions appeared in the questionnaire. The
results of the survey outline a general picture for the Irish companies.
The manufacturing sector constituted the largest percentage of respondents, followed by
Business Services and Financial Services. Exporter and Importer respondent companies
constituted the smallest percentage of respondents as presented in table 8.1.
Number of employees and annual turnover have been used and examined in the survey as
variables for analysing the firm sizes. The results show that the most frequent number of
employees ranged between 100-250 employees, followed by the range between 251-500
employees, and the range between 501-1000. A small percentage of respondents
companies are in the range of more than 1000 employees as reported in table 8.2. Annual
turnover ranged from less than €5 million to more than €250 million. The largest
percentage of the respondent companies had turnover from €25 to €50 million followed
by the range from €100 to €250 million, and the smallest percentage of the respondent
companies had turnover of less than €5 million, see table 8.3 for more details.
The findings show the Nationality and Public/Private status of respondents. Nationality
relates to the two categories of Irish and Non-Irish companies. The results indicate that
55.1% of respondent companies were wholly Irish-owned companies, whereas 44.9%

231
were not wholly Irish-owned companies. Private companies present a large percentage of
respondents by comparison with public companies.
Six factors of competition have been examined in relation to the marketing strategy of
among the Irish companies. Quality and Price appear as the dominant and the most
important factors in their marketing strategy. The mode values for all other factors
(customer service, range of products, product/service innovation and marketing activities)
are all the lower half of the scale. There is however evidence of diversity in the
responses, with each factor being scored, by different respondents, over the entire scale,
tables 8.5 and 8.6 reported the analysis for more details.
Regarding production diversity, the results appear almost binomial with high frequencies
for product ranges of between 1 and 10, and of between 101 and 1000 products (table
8.7).
In relation to the management accounting techniques utilised within Irish companies, the
results reveal that Budgeting was reported as being used by over eighty percent of all
respondents. Standard costing was used by over sixty percent of respondents. Return on
investment (ROI) was used by over one-half of respondents. The rest of techniques were
used by under one-half of respondents (table 8.8).
Respondents were asked to indicate the importance of a range of objectives in allocating
overhead costs. Product/Service Pricing was rated, overall, as the most important
objective in the allocation of overhead, cost Control was ranked, overall as the second
most important objective. External Reporting and Production/Service Planning were
‘medium important’ as objectives in allocating overheads, Departments Evaluation and
Managers’ Performance Evaluation were overall, ‘very important’ objectives in

232
allocating overheads. Control of cost incidence was rated, overall, as the third most
important objective (Tables 8.9 and 8.10).
It is interesting to note that cost structure varies between firms, the main reason that a
different industrial sectors included in the sample. Direct material was the highest cost
element, direct labour was the second highest cost element, and the lowest cost element
was Production/Service overheads (table 8.11). The high variation in cost structure as
evidence by the very high range of the responses in each of the three categories of cost
may be attributed to the difference in industry characteristics, and the degree of
automation. Furthermore, respondents were asked to indicate their expectation of
variation in the proportion of production/service overhead costs to total costs over the
next five years. The highest percentage of respondents indicated that they expected their
proportion of overhead costs to total product/service cost would be stable (Table 8.12).
The findings indicate the extent to which each of the chosen items of possible cultural
value was in fact valued by their companies. The question was divided into two
categories, namely; Innovation and Outcome orientation. Tables (8.13, 8.14, and 8.15)
show the overall results which based on the mean scores and the mode values for each
item that loaded on this dimension. In general, the mode scores of the 5 questions relating
to “Innovation” indicate that the factors are of “medium value” or “very valued”. The 5
factors relating to “Outcome orientation” are more highly valued, with “very valued” and
“valued to a very great extent” being the mode responses.
The second section of the survey reports the results of various issues relating to ABC
within Irish companies. Respondents were asked to indicate their level of knowledge
relating to ABC systems. The highest percentage of respondent companies indicates that

233
they have a general knowledge of ABC, followed by companies who have a good
knowledge of the system (table 8.16). The results also indicate that 33.3% and 32.7% of
respondents first learnt of ABC at university and professional training respectively,
followed by seminars or conference (14.7%), in-house training (10.3%) and own readings
(9%), as shown in table 8.17.
The implementation rate of ABC has been examined, the highest percentage of
respondent companies 73.7% reported that they did not use ABC, while 26.3% of
respondent companies indicate that they use ABC. The results also reveal a more detailed
analysis regarding the ABC adopters and non-adopters. It shows that 44 firms have
already implemented ABC, 38 firms implemented ABC in selected areas, whereas 6
firms have fully implemented ABC. 80 firms of respondent companies had not
considered ABC, and 24 firms have rejected ABC after assessment. 19 firms of
respondent companies indicate that they are currently considering ABC system (table
8.18, 8.19).
In relation to the involvement with the ABC implementation, the results reveal that in-
house accountants was the most highly involved parties in implementing of ABC, the
rest of the parties had a mean score above the mid range of the scale used, such as Senior
Executives, Production Personnel and Information System Personnel and External
Consultants (table 8.23).
Reasons for ABC adoption were examined, the results show that inability of the
traditional cost systems to provide relevant cost was the most highly ranked reason in
their decision to adopt ABC. The results also show that increased competition, increased
234
range of product/service and increased overhead were also highly ranked reasons for
adopting ABC, (table 8.24).
Respondents were asked to give their opinions on the level of success and on importance
they ascribed to the ABC system in relation to each of 19 specified areas of application.
In general, Pricing was the area of application with the highest success and importance
application, followed by Budgeting. Cost Reduction, Customer Profitability Analysis and
Performance Measures also in general, score highly in both questions (table 8.25, 8.26).
Regarding the difficulties of ABC implementation, the results reveal that selection of cost
drivers was generally scored as being the most difficult area, followed by the difficulty of
designing the system. Moreover, the remaining technical difficulties such as assigning
activity’s cost to cost objects, identifying activities and assigning resources to activities
were all scored as being ‘quite difficult’ (table 8.27).
In relation to the factors militating against ABC adoption, the findings report that
difficulty in selecting cost drivers and difficulty in defining activities were both ranked as
the most common difficulties, followed by high costs of ABC implementation,
uncertainty of ABC benefits, difficulty in assigning resources to activities and data
collection difficulties. The bottom of the table shows the least important reasons, such as
internal resistance, higher priority of other changes/projects, lack of top management
support and inadequate computer software (table 8.28).
Reasons for rejecting ABC reveal that technical difficulties were most commonly
reported reasons for their rejection of the system. Behavioural and System’s reasons are
also indicated as the least cited reasons for rejecting ABC include Internal resistance,
Small percentage of overhead costs, Lack of top management support, a higher priority of

235
other projects, manufacturing process is simple, and the number of products/service is
low, Lack of knowledge regarding ABC was not mentioned by any rejected companies
(table 8.29).
Reasons for not considering ABC report that small percentage of overhead costs was the
most frequent reason given for not considering ABC adoption, followed by small number
of products/ services, satisfied with their current system, and ABC was not relevant to our
business (table 8.30).
In relation to the current bases used to allocate overheads to cost objects, the results
indicate that the most common base was direct labour hours, followed by machine hours,
units of products and direct material costs (table 8.31).
Regarding the Satisfaction with the current cost system, the highest percentage of
respondent companies was reasonably satisfied with their systems, followed by those
who claimed that their systems needed improvements, very satisfied with their current
system and dissatisfied with the current overhead allocation system (table 8.32).
For the ABC future anticipation, the highest percentage expected to not implement the
system, comparison with those who anticipated that ABC would be implemented (8.33).
As this chapter is concerned with examining one single variable, the next chapter will
analyse differences and associations namely significance tests to find differences between
ABC adopters, rejecters, considering and not considering across the different variables
(contingency variables).

236
CHAPTER 9: BIVARIATE STATISTICAL ANALYSIS
9.1 Introduction This chapter presents and discusses the results of the bivariable analysis of the underlying
relationships between independent variables (industrial sector, size, nationality, type of
competition, product diversity, cost structure, overhead expectation and business unit
culture) and levels of ABC adoption (implemented, under consideration, rejected and no
consideration).
Crosstabulations or contingency tables and Mann-Whitney will be used to explore the
relationships among these variables. This will provide an approximate idea of whether
there is an association between these variables and how strong this association may be.
The rest of the chapter is organised as follows. Section 9.2 outlines the results of the chi-
square test. Section 9.3 describes the results of the Mann-Whitney technique which
undertaken to test the differences between the variables. The last section contains the
main conclusion.
9.2 Crosstabulations and Chi-square results: Crosstabulations (contingency tables) were initially employed to examine the relationship
between the four levels of ABC adoption and each hypothesized contingent variable
separately. This relationship was examined by establishing the distribution of each
independent variable separately over the four groups of firms (implemented, under
consideration, rejected, and no consideration). If the distribution of the independent
variable across the four groups of firms is equal, or near equal, then the hypnotized
relationship does not exist. Where there is a difference in the distribution of the variable
across the groups, then the larger the difference the stronger is the association between

237
the independent variable and the grouping, as is pointed out by Babbie et al. (2003). This
relationship may be tested by means of a chi-squared test. In the analysis which follows, a
95% confidence level was used in establishing the existence of the relationship.
As part of the crosstabs procedures SPSS produces a 6table that includes the chi-square
statistics and its significant value.
9.2.1 Industrial Sector and ABC adoption The initial crosstabulation of the four levels of ABC adoption and seven industrial
sectors, as used in the questionnaire, resulted in a 28 cell matrix (4 by 7). A number of the
cells in this matrix had zero observations. As is emphasized by Menard (2001) and Siegel
and Castellan (1988), such zero cells distort the Chi-Square value. The initial table was
therefore collapsed by combining the results of the four sectors, Transport and
Distribution, Retail Trade, Exporter, and Importer, into one classification, entitled
“Other”. This resulted in table 9.1, shown below.
Table 9.1: Industry sectors and levels of ABC adoption Group Business
service Manufacturing Financial
service Others Total
Implemented 4
12.5% 25
33.8% 9
39.1% 6
15.8% 44
26.3% Under
consideration 2
6.3% 5
6.8% 5
21.7% 7
18.4% 19
11.4% Rejected 8
25.0% 7
9.4% 2
8.8% 7
18.4% 24
14.4% No
consideration 18
56.2% 37
50.0% 7
30.4% 18
47.4% 80
47.9% Total 32
100.0% 74
100.0% 23
100.0% 38
100.0% 167
100.0%
6 The basic rule of thumb is that with 2X2 contingency tables no expected values should be below 5. In larger tables the rule is that all expected values should be greater than 1 and no more than 20% of expected counts should be less than 5 (Siegel and Castellan 1988).
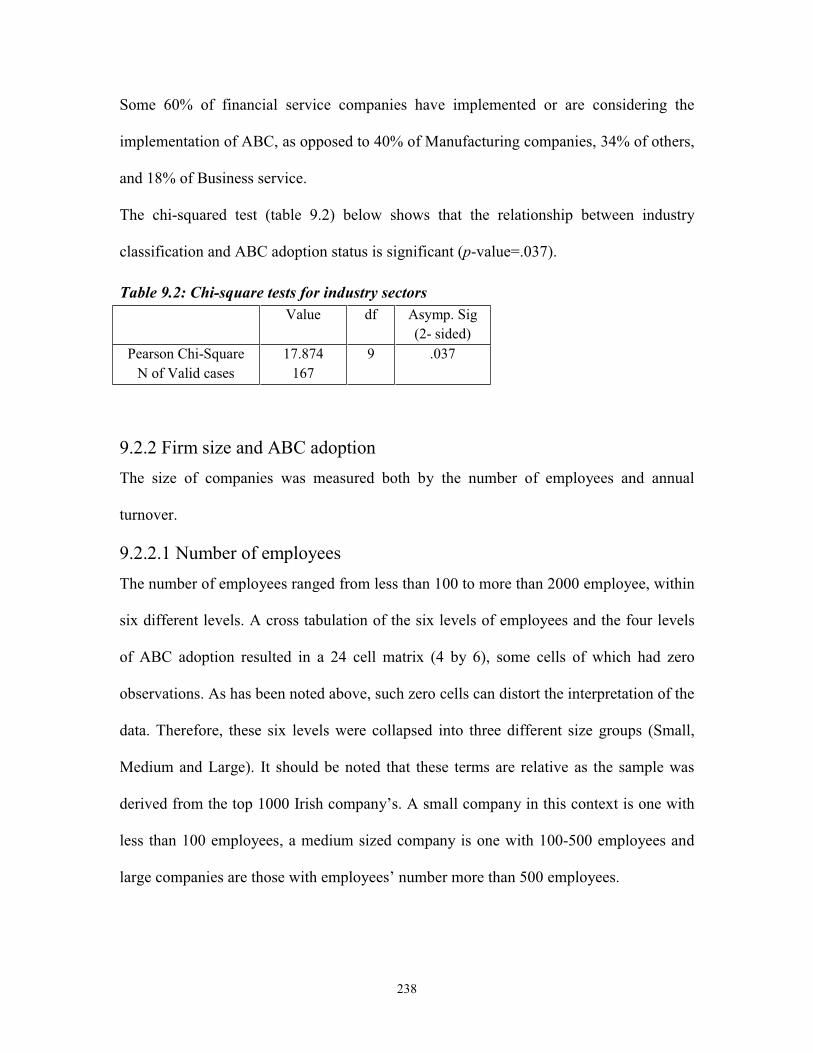
238
Some 60% of financial service companies have implemented or are considering the
implementation of ABC, as opposed to 40% of Manufacturing companies, 34% of others,
and 18% of Business service.
The chi-squared test (table 9.2) below shows that the relationship between industry
classification and ABC adoption status is significant (p-value=.037).
Table 9.2: Chi-square tests for industry sectors Value df Asymp. Sig
(2- sided) Pearson Chi-Square
N of Valid cases 17.874
167 9 .037
9.2.2 Firm size and ABC adoption The size of companies was measured both by the number of employees and annual
turnover.
9.2.2.1 Number of employees The number of employees ranged from less than 100 to more than 2000 employee, within
six different levels. A cross tabulation of the six levels of employees and the four levels
of ABC adoption resulted in a 24 cell matrix (4 by 6), some cells of which had zero
observations. As has been noted above, such zero cells can distort the interpretation of the
data. Therefore, these six levels were collapsed into three different size groups (Small,
Medium and Large). It should be noted that these terms are relative as the sample was
derived from the top 1000 Irish company’s. A small company in this context is one with
less than 100 employees, a medium sized company is one with 100-500 employees and
large companies are those with employees’ number more than 500 employees.

239
Table 9.3 below indicates that the proportional distribution of the different size categories
is very different across the four categories of ABC adoption status. The largest proportion
of ABC implementers are classified as “Large”, around 49% of large sized companies
have implemented ABC, as opposed to around 6% of small sized companies. Likewise
80% of small sized companies have not considered ABC implementation, as opposed to
23% of large sized companies. In effect, “Small” companies have lower levels of
implementation and higher levels of “no consideration” than the other sized companies.
Table 9.3: Size categories and levels of ABC adoption Group Small
<100 Medium 100-500
Large >500
Total
Implemented 2 5.7%
19 22.3%
23 48.9%
44 26.3%
Under consideration
3 8.6%
11 12.9%
5 10.6%
19 11.4%
Rejected 2 5.7%
14 16.5%
8 17.1%
24 14.4%
No consideration
28 80.0%
41 48.3%
11 23.4%
80 47.9%
Total 35 100.0%
85 100.0%
47 100.0%
167 100.0%
The chi-squared test (31.453) shows that the relationship between number of employees
and ABC adoption status is a very significant (p-value=.000), as shown in table 9.4
below.
Table 9.4: Chi-square tests for size categories Value df Asymp. Sig
(2- sided) Pearson Chi-Square
N of Valid cases 31.453
167 6 .000
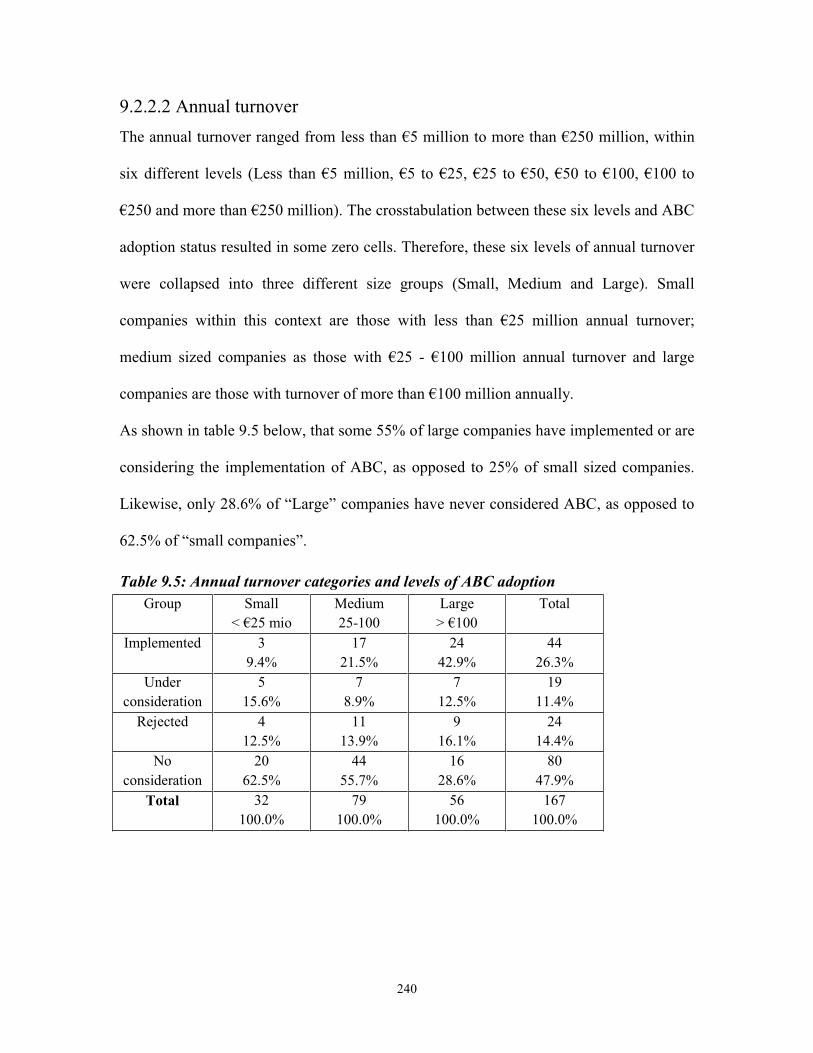
240
9.2.2.2 Annual turnover The annual turnover ranged from less than €5 million to more than €250 million, within
six different levels (Less than €5 million, €5 to €25, €25 to €50, €50 to €100, €100 to
€250 and more than €250 million). The crosstabulation between these six levels and ABC
adoption status resulted in some zero cells. Therefore, these six levels of annual turnover
were collapsed into three different size groups (Small, Medium and Large). Small
companies within this context are those with less than €25 million annual turnover;
medium sized companies as those with €25 - €100 million annual turnover and large
companies are those with turnover of more than €100 million annually.
As shown in table 9.5 below, that some 55% of large companies have implemented or are
considering the implementation of ABC, as opposed to 25% of small sized companies.
Likewise, only 28.6% of “Large” companies have never considered ABC, as opposed to
62.5% of “small companies”.
Table 9.5: Annual turnover categories and levels of ABC adoption Group Small
< €25 mio Medium 25-100
Large > €100
Total
Implemented 3 9.4%
17 21.5%
24 42.9%
44 26.3%
Under consideration
5 15.6%
7 8.9%
7 12.5%
19 11.4%
Rejected 4 12.5%
11 13.9%
9 16.1%
24 14.4%
No consideration
20 62.5%
44 55.7%
16 28.6%
80 47.9%
Total 32 100.0%
79 100.0%
56 100.0%
167 100.0%

241
The high value of the chi-square statistics (23.017) indicates that the relationship between
turnover and ABC adoption status is significant (p-value= 0.001), table 9.6 below shows
the results.
Table 19.6: Chi-square tests for annual turnover Value df Asymp. Sig
(2- sided) Pearson Chi-Square
N of Valid cases 23.017
167 6 .001
9.2.3 Nationality of ownership and ABC adoption Table 9.7 provides the results of a cross tabulation of nationality with ABC adoption
status. Nationality relates to two categories, Irish and non-Irish. The results show that
some 43% of Irish companies have implemented or are considering the implementation
of ABC, around 15% of Irish companies have rejected ABC, and 41.3% are not
considering the implementation of ABC. For “Non Irish companies” some 30% have
implemented or are considering the implementation of ABC, 13.3% have rejected ABC,
and 56% are not considering the implementation of ABC system.
Table 9.7: Nationality categories and levels of ABC adoption
Group Irish
company Non-Irish company
Total
Implemented 28 30.4%
16 21.4%
44 26.3%
Under consideration
12 13.1%
7 9.3%
19 11.4%
Rejected 14 15.2%
10 13.3%
24 14.4%
No consideration
38 41.3%
42 56.0%
80 47.9%
Total 92 100.0%
75 100.0%
167 100.0%
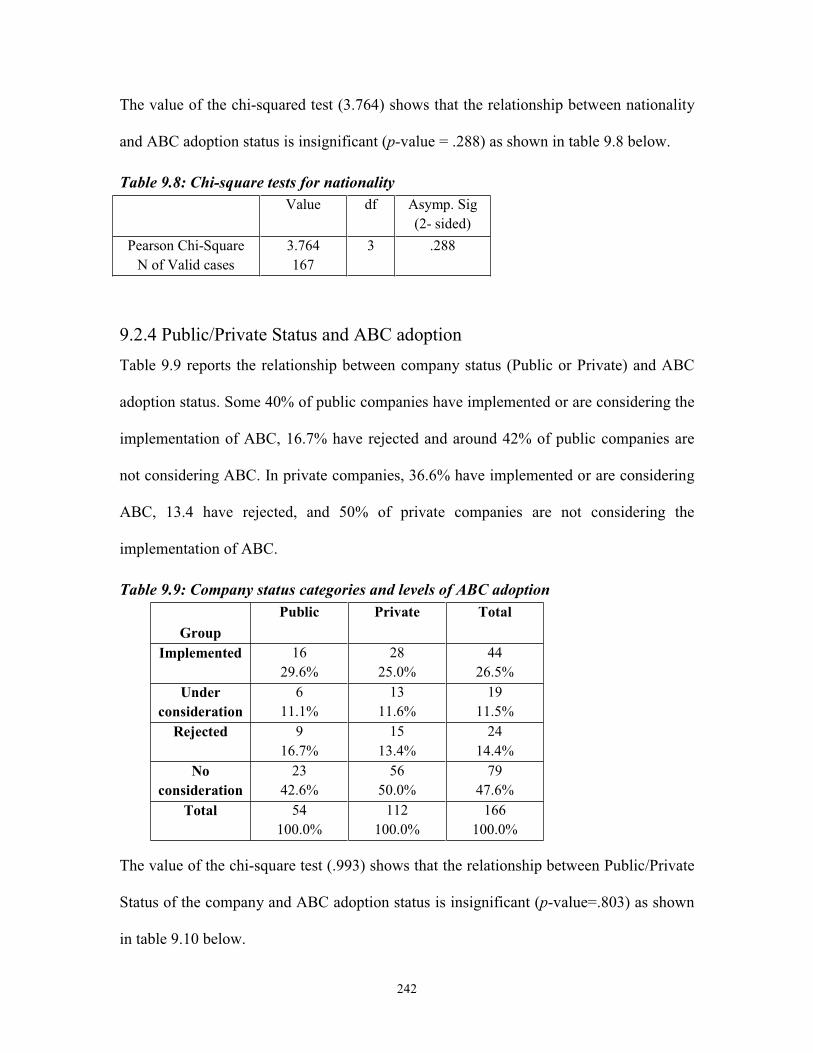
242
The value of the chi-squared test (3.764) shows that the relationship between nationality
and ABC adoption status is insignificant (p-value = .288) as shown in table 9.8 below.
Table 9.8: Chi-square tests for nationality
Value df Asymp. Sig
(2- sided) Pearson Chi-Square
N of Valid cases 3.764 167
3 .288
9.2.4 Public/Private Status and ABC adoption Table 9.9 reports the relationship between company status (Public or Private) and ABC
adoption status. Some 40% of public companies have implemented or are considering the
implementation of ABC, 16.7% have rejected and around 42% of public companies are
not considering ABC. In private companies, 36.6% have implemented or are considering
ABC, 13.4 have rejected, and 50% of private companies are not considering the
implementation of ABC.
Table 9.9: Company status categories and levels of ABC adoption
Group Public Private Total
Implemented 16 29.6%
28 25.0%
44 26.5%
Under consideration
6 11.1%
13 11.6%
19 11.5%
Rejected 9 16.7%
15 13.4%
24 14.4%
No consideration
23 42.6%
56 50.0%
79 47.6%
Total 54 100.0%
112 100.0%
166 100.0%
The value of the chi-square test (.993) shows that the relationship between Public/Private
Status of the company and ABC adoption status is insignificant (p-value=.803) as shown
in table 9.10 below.
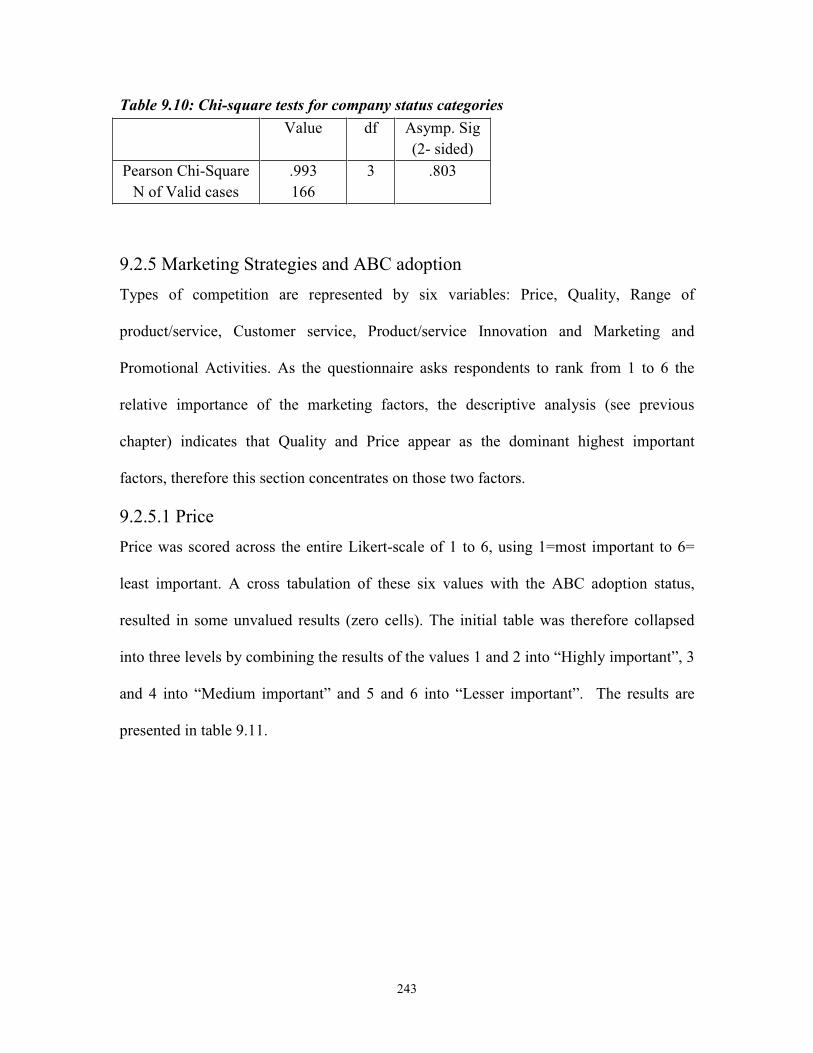
243
Table 9.10: Chi-square tests for company status categories Value df Asymp. Sig
(2- sided) Pearson Chi-Square
N of Valid cases .993 166
3 .803
9.2.5 Marketing Strategies and ABC adoption Types of competition are represented by six variables: Price, Quality, Range of
product/service, Customer service, Product/service Innovation and Marketing and
Promotional Activities. As the questionnaire asks respondents to rank from 1 to 6 the
relative importance of the marketing factors, the descriptive analysis (see previous
chapter) indicates that Quality and Price appear as the dominant highest important
factors, therefore this section concentrates on those two factors.
9.2.5.1 Price Price was scored across the entire Likert-scale of 1 to 6, using 1=most important to 6=
least important. A cross tabulation of these six values with the ABC adoption status,
resulted in some unvalued results (zero cells). The initial table was therefore collapsed
into three levels by combining the results of the values 1 and 2 into “Highly important”, 3
and 4 into “Medium important” and 5 and 6 into “Lesser important”. The results are
presented in table 9.11.

244
Table 9.11: Price category and levels of ABC adoption
Group Highly
important Of medium important
Lesser important
Total
Implemented 31 33.7%
7 14.6%
6 22.2%
44 26.3%
Under consideration 14 15.2%
2 4.2%
3 11.1%
19 11.4%
Rejected 11 12.0%
8 16.7%
5 18.5%
24 14.4%
No consideration 36 39.1%
31 64.6%
13 48.2%
80 47.9%
Total 92 100.0%
48 100.0%
27 100.0%
167 100.0%
Table 9.11 above shows that 92 firms (55% of respondents) indicated that “Price” was a
highly important factor in their marketing strategy; some 48% of them have implemented
or are considering the implementation of ABC, as opposed to 39% who have not
considered ABC and 12% who rejected ABC. On the other hand, 27 firms (16% of
respondents) indicated that “Price” was a lesser important factor in their marketing
strategy, 13 (48%) of which have never considered ABC, and 6 (22%) who have
implemented ABC.
The chi-square is (16.076) and significant (p-value=.013) as shown in table 9.12 below.
This indicates that there is a significant relationship between price and ABC adoption
status.
Table 9.12: Chi-square test for price category Value df Asymp. Sig
(2- sided) Pearson Chi-Square
N of Valid cases 16.076
167 6 .013

245
9.2.5.2 Quality Quality was scored across the entire Likert-scale of 1 to 6, using 1=most important to 6=
least important. The initial crosstabulation of the four levels of ABC adoption and the six
ranges of importance in quality as used in the questionnaire, resulted in a 24 cell matrix
(4 by 6). A number of the cells in this matrix had zero observations. The initial table was
therefore collapsed by combining the results of the values 1 and 2 into “Highly
Important”, 3 and 4 into “Medium Important” and 5 and 6 into “Lesser Important”. The
results are presented in table 9.13 below.
Table 9.13: Quality category and levels of ABC adoption
Group Highly
important Of medium important
Lesser important
Total
Implemented 30 32.3%
10 17.3%
4 25.0%
44 26.3%
Under consideration 8 8.6%
6 10.3%
5 31.3%
19 11.4%
Rejected 15 16.1%
6 10.3%
3 18.7%
24 14.4%
No consideration 40 43.0%
36 62.1%
4 25.0%
80 47.9%
Total 93 100.0%
58 100.0%
16 100.0%
167 100.0%
Table 9.13 above shows that 93 firms (56% of respondents) indicated that “Quality” was
a highly important factor in their marketing strategy, some 40% of them have
implemented or are considering the implementation of ABC, as opposed to 43% never
considered ABC and 16% who rejected ABC. On the other hand, 16 firms (9% of
respondents) indicated that “Quality” was a lesser important factor in their marketing
strategy. The chi-square value is (15.021) and significant (p-value=.020). This indicates
that there is a significant relationship between quality and ABC adoption status. Table
9.14 below reports the results.

246
Table 9.14: Chi-square tests for quality category Value df Asymp. Sig
(2- sided) Pearson Chi-Square
N of Valid cases 15.021
167 6 .020
9.2.6 Product Diversity and ABC adoption Table 9.15 below reports the relationship between number of products and the levels of
ABC adoption. As the cross tabulation of the original six categories of numbers of
products/services provided by the responding companies, and the four categories relating
to ABC adoption status resulted in a number of cells with zero values, the original six
categories were collapsed to three; Low (less than 10 products), Medium (11-100) and
High (more than 101 products). The table shows that 41.9% of “High” companies have
implemented ABC, as opposed to 3.6% of “Low” companies. Likewise, only 27.5% of
“Large” companies have never considered ABC, as opposed to 82.2% of “Small”
companies.
Table 9.15: Product diversity category and levels of ABC adoption
Group Low
<10 Medium 11-100
High > 101
Total
Implemented 2 3.6%
16 33.3%
26 41.9%
44 26.5%
Under consideration
4 7.1%
7 14.6%
8 12.9%
19 11.5%
Rejected 4 7.1%
9 18.8%
11 17.7%
24 14.5%
No consideration
46 82.2%
16 33.3%
17 27.5%
79 47.5%
Total 56 100.0%
48 100.0%
62 100.0%
166 100.0%
Table 9.16 below reports the chi-square test value (45.618) and shows that the
relationship between product diversity and ABC status is a very significant at (p-
value=.000).

247
Table 9.16: Chi-square tests for product diversity Value df Asymp. Sig
(2- sided) Pearson Chi-Square
N of Valid cases 45.618
166 6 .000
9.2.7 Cost Structure (Overhead) and ABC adoption Respondents were divided into three categories those with “Low overheads” (5% to
20%), Medium overheads (20% to 35%) and High overheads (35% to 65%). These three
categories were based on a division of the range of the overheads (5% to 65%) into three,
and by using the ‘categorize variables’ function within the SPSS, which divides this
range into three categories.
Table 9.17 below reports the results of a cross tabulation of these three categories of
overheads with ABC adoption status:
Table 9.17: Overheads category and levels of ABC adoption
Group Low
Overheads Medium
Overheads High
Overheads Total
Implemented 7
10.0% 9
23.7% 28
47.5% 44
26.3% Under
consideration 5
7.1% 5
13.2% 9
15.3% 19
11.4% Rejected 9
12.9% 2
5.3% 13
22.0% 24
14.4% No
consideration 49
70.0% 22
57.8% 9
15.2% 80
47.9% Total 70
100.0% 38
100.0% 59
100.0% 167
100.0% The table shows that 47.5% of “High overheads” companies have implemented ABC, as
opposed to 10% of “Low overheads” companies. Likewise, only 15.2% of “High
overheads” companies have never considered ABC, as opposed to 70% of “Low
overheads” companies.

248
The results in table 9.18 below, show that companies with larger overheads are more
likely to adopt ABC (Chi-squared 46.248, P-value= 0.000), and the relationship between
overheads and ABC adoption statues is a very significant.
Table 9.18: Chi-square tests for overheads category
Value df Asymp. Sig (2- sided)
Pearson Chi-Square N of Valid cases
46.248 167
6 .000
9.2.8 Expectation of overheads and ABC adoption status: Table 9.19 below shows the distribution of the expectation of changes in overhead costs
over the next five years with ABC adoption status. The initial crosstabulation of the four
levels of ABC adoption and six levels of expectation, as used in the questionnaire,
resulted in a 24 cell matrix (4 by 6). A number of the cells in this matrix had zero
observations. The initial table was therefore collapsed by combining the results of the
first two choices, to increase substantially and to increase slightly, into one classification,
entitled “To Increase”. The third choice was maintained as “To be Stable”. The results of
the fourth and fifth choices have been collapsed into one classification entitled “To
Decrease”. The last choice “Do not know” has been excluded for its unvalued results.
As reports in table 9.19 below, that some 49% of companies who expect that their
overheads “To Increase” have implemented ABC or are considering the adoption of
ABC, as opposed to 40%, and 11% of those have never considered ABC and have
rejected the ABC implementation. Likewise, only 20% of companies who expect that
their overheads “To Decrease” have implemented ABC or are considering ABC
implementation, as opposed to 60% and 20% of companies which have never considered
and have rejected the implementation of ABC.

249
Table 9.19: Expectation of overheads and ABC adoption status Group
To increase
To be stable To decrease Total
Implemented 28 38.9%
12 19.4%
3 12.0%
43 27.0%
Under consideration 7 9.7%
9 14.5%
2 8.0%
18 11.3%
Rejected 8 11.1%
10 16.1%
5 20.0%
23 14.5%
No consideration 29 40.3%
31 50.0%
15 60.0%
75 47.2%
Total 72 100.0%
62 100.0%
25 100.0%
159 100.0%
In terms of the relationship between the overhead expectation and ABC adoption status,
table 9.20 below reports the chi-square test value (12.898) and shows that the relationship
between overhead expectation and the ABC adoption status is significant at (p-
value=.045).
Table 9.20:Chi-square tests for overhead expectation Value df Asymp. Sig
(2- sided) Pearson Chi-Square
N of Valid cases 12.898
159 6 .045
9.2.9 Business Unit Culture and ABC adoption Two business unit culture dimensions, “Innovation” and “Outcome Orientation”, were
measured. Respondents were asked to indicate the extent to which each of ten items was
valued in their business unit. A 5-point Likert-type scale with anchors of 5 “valued to a
very great extent” and 1 “not valued at all” was used and scores for each dimension were
calculated as the sum of responses. The ten items were grouped into two cultural
dimensions “Innovation” and “Outcome Orientation” as following.

250
9.2.9.1. Innovation The first five items which relate to “Innovation” were analyzed in aggregation. Group of
cases were combined using SPSS into a single summary case and a newly aggregated
data which resulted into one dimension “Innovation” was created. As the cross tabulation
of the original five levels of innovation of the responding companies, and the four
categories relating to ABC adoption status resulted in a number of cells with zero values,
the original five levels were collapsed into three, by combined the results of scores (1 and
2) into “Not valued”, (3) into “Medium Valued” and (4and 5) into “Critically valued”
table 9.21 below reports the results.
The chi-squared test shows that the relationship between innovation and ABC adoption
status is significant. Some 31% of companies for whom innovation was “critically
valued” have implemented ABC, as opposed to 29% which innovation was not valued.
Moreover, 35% of companies where innovation was not valued have never considered
ABC, as opposed to only 29% who have implemented ABC. In general, the majority of
companies (112 companies) had a critically valued innovation, as opposed to only 17
companies for whom innovation was not valued.
Table 9.21: Innovation category and levels of ABC adoption
Group Not valued Medium
valued Critically
valued Total
Implemented 5
29.4% 4
10.5% 35
31.3% 44
26.3% Under
consideration 2
11.8% 6
15.8% 11
9.8% 19
11.4% Rejected 4
23.5% 5
13.2% 15
13.4% 24
14.4% No
consideration 6
35.3% 23
60.5% 51
45.5% 80
47.9% Total 17
100.0% 38
100.0% 112
100.0% 167
100.0%
251
The chi-square test (table 9.22) below shows that the relationship between Innovation and
ABC adoption status is significant (P-value = .018).
Table 9.22: Chi-square tests for innovation
Value df Asymp. Sig
(2- sided) Pearson Chi-Square
N of Valid cases 15.297
167 6 .018
9.2.9.2 Outcome orientation The same procedures adopted with “Innovation” have been followed with “Outcome
Orientation”. The five items of “Outcome Orientation” were analyzed in aggregate which
resulted in one dimension “Outcome orientation”. As the cross tabulation of the original
five levels by the responding companies, and the four categories relating to ABC
adoption status resulted in a number of cells with zero values, the original five levels
were collapsed into three; following the same procedures with the innovation above.
Table 9.23 below reports the results.
As shown in table 9.23 below, that those of companies which classified ‘Outcome
orientation’ as “Critically valued” (81 companies), divided among the four levels of ABC
adoption as, implemented (37.1%); under consideration (14.8%), rejected (18.5%) and
not considered (29.6%). The results also indicate that business units with critically
valued Outcome oriented (37.1%) have implemented ABC to a greater extent than those
with not valued outcome oriented (11.8%). In other words, around 74.5% of companies
with a less Outcome oriented culture are not considering the implementation of ABC
system.

252
Table 9.23: Orientation category and levels of ABC adoption
Group Not valued Medium
valued Critically
valued Total
Implemented 6
11.8% 8
22.9% 30
37.1% 44
26.3% Under
consideration 2
3.9% 5
14.3% 12
14.8% 19
11.4% Rejected 5
9.8% 4
11.4% 15
18.5% 24
14.4% No
consideration 38
74.5% 18
51.4% 24
29.6% 80
47.9% Total 51
100.0% 35
100.0% 81
100.0% 167
100.0%
Table 9.24 below shows that the chi-square test is very high (70.571) and the relationship
between outcome orientation and ABC adoption status are very significant (p-
value=.000).
Table 9.24: Chi-square tests for outcome orientation Value df Asymp. Sig
(2- sided) Pearson Chi-Square
N of Valid cases 70.571
167 6 .000
253
9.3 Mann-Whitney U tests:
Mann-Whitney U test is a non-parametric test alternative to the t-test for independent
samples, unlike the parametric t-test, this non-parametric test makes no assumptions
about the distribution of the data (e.g., normality) (Pallant 2001). This, like many non-
parametric tests, uses the ranks of the data rather than their raw values to calculate the
statistic. Since this test does not make a distribution assumption, it is not as powerful as
the t-test (Norusis, 2000). Mann-Whitney U test is employed to support the results
achieved by the t-test and also to compare the two groups ABC adopters or non-
adopters. The hypotheses for the comparison of two independent groups used by Mann-
Whitney are: Ho: The two groups come from identical populations
Ha: The two groups come from different populations
Notice that the hypothesis makes no assumptions about the distribution of the
populations. These hypotheses are also sometimes written as testing the equality of the
central tendency of the populations. The test statistic for the Mann-Whitney test is U.
This value is compared to a table of critical values for U based on the sample size of
each group. If U exceeds the critical value for U at some significance level (usually
0.05) it means that there is evidence to reject the null hypothesis in favor of the
alternative hypothesis (Hart 2001). Table 9.25 below indicates that there are statistically
significant differences in variation in size, product number, cost structure, expectation
and business culture between the two groups of companies. Thus the results produce
evidence to reject the null hypothesis mentioned above. The results also show that there
are no statistically significant differences in the types of competition (price and quality)
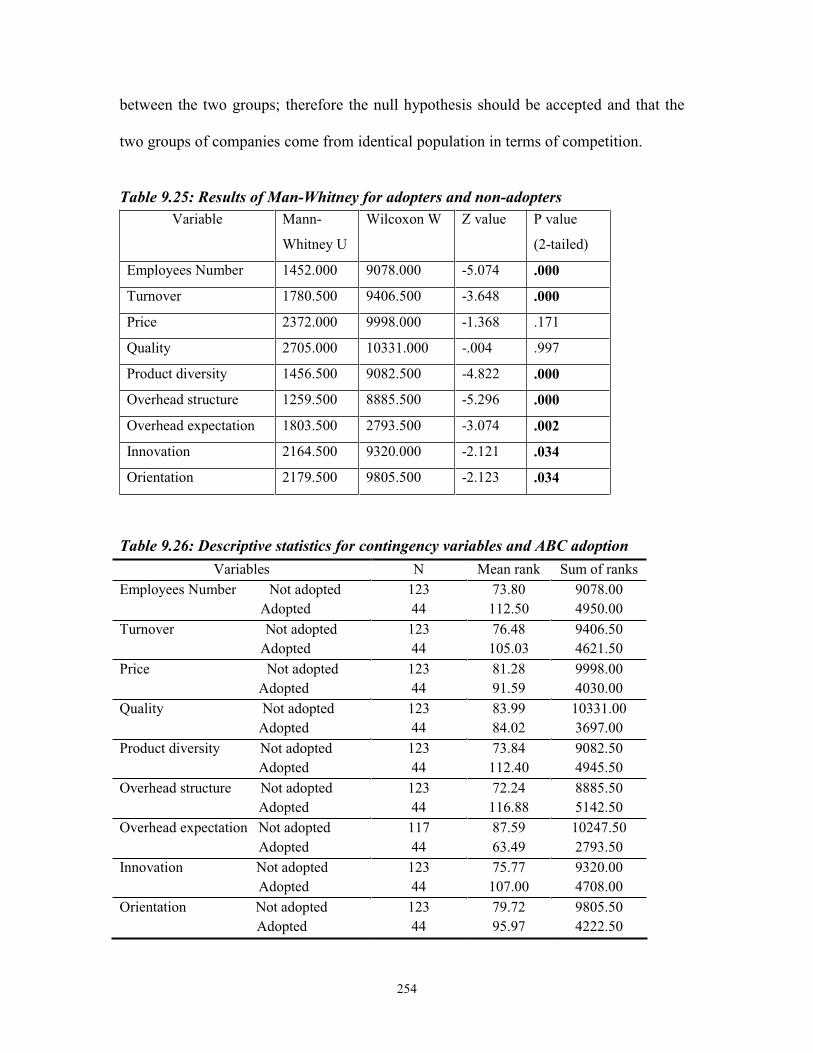
254
between the two groups; therefore the null hypothesis should be accepted and that the
two groups of companies come from identical population in terms of competition.
Table 9.25: Results of Man-Whitney for adopters and non-adopters Variable Mann-
Whitney U
Wilcoxon W Z value P value
(2-tailed)
Employees Number 1452.000 9078.000 -5.074 .000
Turnover 1780.500 9406.500 -3.648 .000
Price 2372.000 9998.000 -1.368 .171
Quality 2705.000 10331.000 -.004 .997
Product diversity 1456.500 9082.500 -4.822 .000
Overhead structure 1259.500 8885.500 -5.296 .000
Overhead expectation 1803.500 2793.500 -3.074 .002
Innovation 2164.500 9320.000 -2.121 .034
Orientation 2179.500 9805.500 -2.123 .034
Table 9.26: Descriptive statistics for contingency variables and ABC adoption
Variables N Mean rank Sum of ranks Employees Number Not adopted
Adopted 123 44
73.80 112.50
9078.00 4950.00
Turnover Not adopted Adopted
123 44
76.48 105.03
9406.50 4621.50
Price Not adopted Adopted
123 44
81.28 91.59
9998.00 4030.00
Quality Not adopted Adopted
123 44
83.99 84.02
10331.00 3697.00
Product diversity Not adopted Adopted
123 44
73.84 112.40
9082.50 4945.50
Overhead structure Not adopted Adopted
123 44
72.24 116.88
8885.50 5142.50
Overhead expectation Not adopted Adopted
117 44
87.59 63.49
10247.50 2793.50
Innovation Not adopted Adopted
123 44
75.77 107.00
9320.00 4708.00
Orientation Not adopted Adopted
123 44
79.72 95.97
9805.50 4222.50

255
9.4 Summary and Conclusion: The main goal of this chapter was to obtain a picture of how the contingent variables of this
study are related to the adoption status of ABC systems. The hypotheses tested in this chapter
are on the impact of contingency variables on the implementation of ABC systems.
The statistical analysis presented above aims to test each of the study’s hypotheses
extensively through four types of analysis. Chi-square tests identified whether there were any
significant differences between the variables of interest in the study.
Table 9.27 below compares the results of the Chi-square, Mann-Whitney and (t-test, and
ANOVA which applied as supporting the non parametric statistical) for each of the
contingency variables.
Table 9.27: Summary of results of all statistical analysis Contingency
Variables
Chi-square7
t value p-value
t-test
t value p value
Mann-Whitney
Z value p-value
ANOVA
F value Sig
Industrial Sector 17.874 .037 N/A8 N/A N/A N/A N/A N/A
Employees Number 31.453 .000 -5.521 .000 -5.074 .000 10.132 .000
Turnover 23.881 .000 -3.752 .000 -3.648 .000 7.132 .000
Nationality 3.764 .288 N/A N/A N/A N/A N/A N/A
Price/ competition 16.076 .013 3.748 .000 -1.368 .171 .991 .399
Quality/competition 15.021 .020 1.514 .132 -.004 .997 .998 .395
Product diversity 45.618 .000 -6.369 .000 -4.822 .000 16.596 .000
Overhead structure 46.248 .000 -5.658 .000 -5.296 .000 28.444 .000
Innovation 15.297 .018 -2.582 .011 -2.121 .034 5.304 .002
Orientation 70.571 .000 -4.281 .000 -2.123 .034 1.650 .180
7 One should remember that chi-square is used with all variables even the continuous ones (after being categorized). 8 Not applicable because it is a categorical and binary variables.

256
The null hypothesis on Industrial sector (there is no relationship between ABC adoption
and industrial sector) is rejected on the basis of the chi-square test which indicates that the
relationship between industrial sector and ABC adoption is significant (P=.037). Referring to
table 9.1, more than 50% (25 companies) of the 44 companies which have implemented
ABC, was “Manufacturing”. Interestingly, of the 80 companies which have never considered
the implementation of ABC around 46% (37 companies) were manufacturing companies.
The two null hypotheses on Size (there is no relationship between ABC adoption and firm
size when measured by number of employees or annual turnover) are rejected on the basis of
all tests. The chi-square establishes a significant relationship between size (EMPNO,
TURNOV) and ABC adoption status (.000 and .001) respectively. Referring to table 9.3, the
percentages of the companies which have implemented ABC, 4.5% are “Small” 43.2% are
“Medium” and 52.3 are “Large” respectively9. One can see that the percentage of large
companies which have implemented ABC is much higher than that of small and medium. On
the other hand, Table 9.5 relating to turnover indicates that the fast majority of companies
which have implemented ABC were in the large size category as compared with Small and
Medium: 54.6%, 6.8% and 38.6% respectively10. This supports the hypotheses (firm size
positively correlated to the adoption of ABC). The Student t-test also tests the previous
hypotheses, by examine whether the two means of non-adopters and ABC adopters are
significantly different from one another. The results indicate that the mean of ABC adopters
is much higher than non-adopters and shows a significant different between the two groups
9 Percentage presented in the Table 9.3 are calculated vertically, whereas these percentages are calculated horizontally and not presented in the table. 10 Percentage presented in the Table 9.5 are calculated vertically, whereas these percentages are calculated horizontally and not presented in the table.

257
(P=.000). It also shows a 95% confidence about this direction. Tests of Mann-Whitney and
ANOVA show significant results in both variables.
The null hypothesis on Nationality (there is no relationship between nationality and ABC
adoption) is accepted based on the results of the Chi-square test, indicating a non-significant
relationship between nationality and ABC adoption status (P=.288). Referring to table 9.7,
28 Irish companies (64%) have implemented ABC, compared with 16 non-Irish companies
(36%) from the total of 44 companies which have implemented ABC.
In the case of marketing strategy, which tested both Price and Quality, the null hypotheses
(there is no relationship between ABC adoption and Price and Quality) are rejected in all
statistics tests (Chi-square and t-test). The results of the Chi-square tests show that there is a
significant relationship between (price, quality) and the ABC adoption status (P-value = .013
and .020) respectively. The results of a crosstabulation of three levels of price and the four
ABC adoption groups presented in table 9.11 above indicate a significant difference in the
ABC adopters group. 31 companies (70%) of ABC adopters had price as the most important
factor in their marketing strategy, as opposed to 16% and 14% who ranked price as medium
and least important factor in their marketing strategy. Surprisingly, the majority of those who
have never considered ABC adoption (36 companies) ranked price as the most important
factor in their marketing strategy as well. There are no results from the extent literature to be
compared with those presented here, because this hypothesis has not been tested before.
The same results have been reported in table 9.13 above, the fast majority of ABC adopters
had quality as the highly important factor in their marketing strategy (30 companies out of
44), and furthermore, 50% of those who have never considered ABC had quality as the
highly important factor in their marketing strategy.

258
The Student t-tests report different results for price and quality. The null hypothesis with
regard to price (non-adopters have a higher mean than ABC adopters) is rejected, based on a
significant positive mean difference (P=.000) between the two groups (non-adopters and
adopters). The null hypothesis with regard to quality is accepted, as the Levene’s test was
non-significant (P=.132) and the difference between the variance is zero11. Mann-Whitney
results also show that there are no statistically significant differences in the types of
competition (price and quality) between the two groups; therefore the null hypothesis should
be accepted and that the two groups of companies come from identical population in terms of
competition.
In relation to product diversity, the results of the chi-square test show that the relationship
between product diversity and the ABC adoption status is very significant (P=.000). Table
9.15 above indicates that large companies (with more than 101 different products) are more
likely to adopt ABC than medium or small counterpart (59%, 36% and 5%). Furthermore, the
same table reports that small companies (with less than 10 different products) are more likely
to never consider the implementation of ABC.
The results of the t-test shows that the variances (-6.369) between non adopters and adopters
are significantly different in product diversity (P=.000), and one can be confident about
direction of these differences. Mann-Whitney and ANOVA results report significant
variances between the groups of ABC adopters and non-adopters.
With regard to overhead, the model indicates that a company which has a high overhead is
more likely to adopt ABC. All the statistical results (chi-square test and t-test) presented
above support the rejection of the null hypothesis, supporting the arguments that Irish
companies that have a high percentage of overhead are more likely to adopt ABC. The chi- 11 See table 9.25 above for more details.

259
square test shows a strong relationship between levels of overheads and ABC adoption status
(P=.000), furthermore a crosstabulation between those two variables (table 9.17) indicates
that 28 company (64%) who have a high level of overhead (between 35% to 65% of total
costs) have implemented ABC, as opposed to (20% and 16%) who had a medium and small
overheads. Percentages of companies which have never considered the implementation of
ABC in Low, Medium and High categories are approximately: 61.3%, 27.5% and 11.2%,
respectively12, and indicates that companies’ with low overheads are more likely not to have
considered ABC adoption. The results of Mann-Whitney and ANOVA show a significant
difference between the groups.
Innovation and Outcome orientation are chosen as represented Business unit culture to
examine their association with the extent of ABC adoption. Chi-square tests show a
significant association between the two dimensions (Innovation and Outcome orientation)
and the ABC adoption status (P=.018 and .000) respectively. Table 9.21 relating to
Innovation, indicates that around 80% of ABC adopters had a critically valued innovation, as
opposed to 11% and 9% (not valued and medium valued) respectively13. On the other hand,
51 companies (64%) of those who have never considered ABC had a critical valued
innovation, as opposed to 29% and 7% (medium valued and not valued). That leads to the
interpretation that Innovation is very highly valued among all companies regardless ABC
implementation. The t-test results report that the variances are significantly different (P
value=.011), and record a mean different of (-.3145) which means that the mean of ABC
adopters is higher than non ABC adopters.
12 Percentage presented in the Table 9.17 are calculated vertically, whereas these percentages are calculated horizontally and not presented in the table. 13 Percentage presented in the Table 9.21 are calculated vertically, whereas these percentages are calculated horizontally and not presented in the table.

260
The results of a crosstabulation of three levels of value within the outcome orientation and
the four ABC adoption groups presented in table 9.23 above indicate a significant difference
in the ABC adopters group. 30 companies (68%) of ABC adopters had orientation as
critically valued in their business culture, as opposed to 18% and 14% who ranked
orientation as medium valued and not valued. Moreover, 38 companies (48%) of those who
have never considered the implementation of ABC had a not valued orientation, as opposed
to 30% and 22% who ranked orientation as critically and medium valued respectively. The t-
test results indicate a significant difference between the two groups (non-adopters and ABC
adopters) and a negative mean difference (-.6321) which means that ABC adopters have a
higher mean than non-adopters.
Now that the significant relationships have been identified, the attention shifts to ascertaining
the overall fit of the research contingency model of ABC systems. Unfortunately, the
statistical techniques used in this chapter do not facilitate an overall model containing the
technical difficulties to the implementation of ABC. This suggests that cluster analysis
should be undertaken in the next chapter.

261
CHAPTER 10: CLUSTER ANALYSIS 10.1 Introduction This chapter presents the findings of the cluster analysis. This technique sorts cases
(companies) into groups, or clusters. A cluster is a group of relatively homogeneous cases or
observations, so that the degree of association is strong between companies of the same
cluster and weak between companies of different clusters. The statistical procedure for
identifying clusters was available in the SPSS software, and the Euclidean technique was
adopted. Three clusters have been utilised in this study, each cluster describes, in terms of the
data collected, the characteristics of companies (size, number of products, cost structure,
marketing strategy and business unit culture) using a descriptive statistics. Moreover, an
association between these clusters and ABC adoption status is examined.
The organisation of the rest of the chapter is as follows: section 10.2 reviews an introduction
to cluster analysis technique. Section 10.3 presents the K-means cluster analysis results,
which includes the characteristics of the clusters, and analyzing the reasons for considering,
rejecting and never considering ABC. The last section contains the conclusion of the chapter.
10.2 Cluster analysis method Everett, et al. (2001) define cluster analysis as a technique for categorizing observations into
groups such that observations in each group are similar to each other while observation in
one group should be different from those of other groups. Cluster analysis seeks to identify a
set of groups which both minimize within-group variation and maximize between-group
variation. Hair et al. (1998) argue that cluster analysis is an objective methodology for
quantifying the structural characteristics of a set of observations. This section will examine
the two main cluster methods as following.
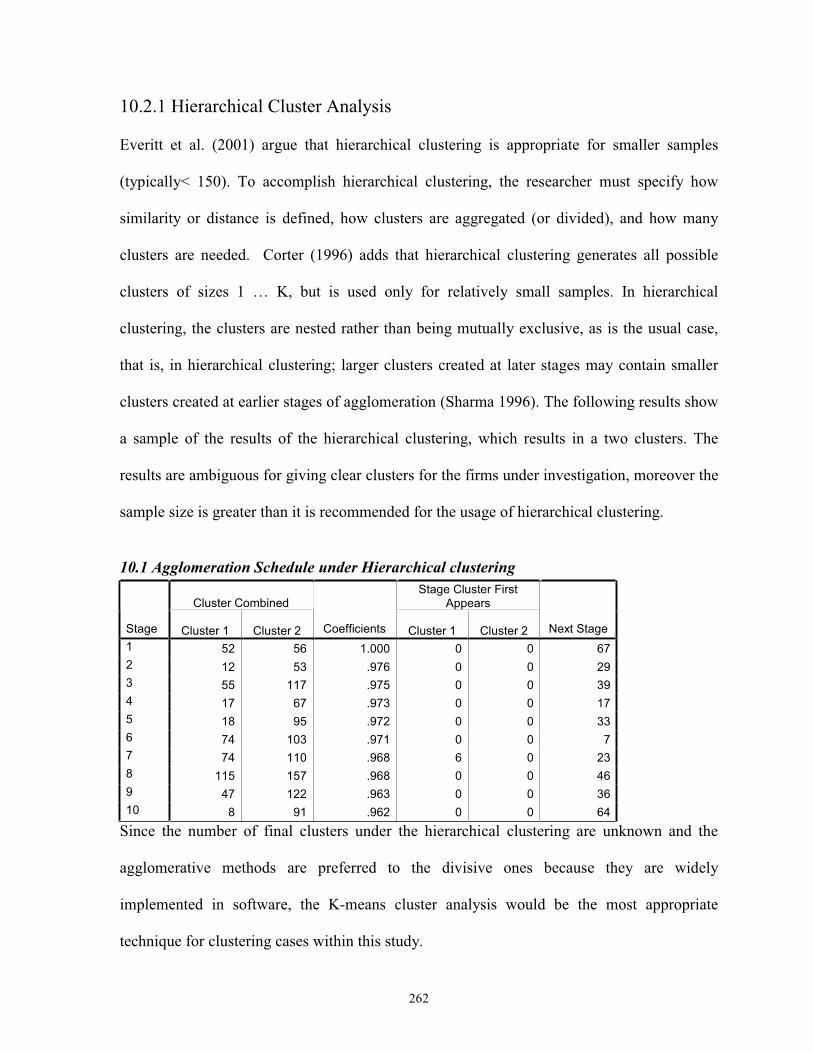
262
10.2.1 Hierarchical Cluster Analysis
Everitt et al. (2001) argue that hierarchical clustering is appropriate for smaller samples
(typically< 150). To accomplish hierarchical clustering, the researcher must specify how
similarity or distance is defined, how clusters are aggregated (or divided), and how many
clusters are needed. Corter (1996) adds that hierarchical clustering generates all possible
clusters of sizes 1 … K, but is used only for relatively small samples. In hierarchical
clustering, the clusters are nested rather than being mutually exclusive, as is the usual case,
that is, in hierarchical clustering; larger clusters created at later stages may contain smaller
clusters created at earlier stages of agglomeration (Sharma 1996). The following results show
a sample of the results of the hierarchical clustering, which results in a two clusters. The
results are ambiguous for giving clear clusters for the firms under investigation, moreover the
sample size is greater than it is recommended for the usage of hierarchical clustering.
10.1 Agglomeration Schedule under Hierarchical clustering
Cluster Combined Stage Cluster First
Appears
Stage Cluster 1 Cluster 2 Coefficients Cluster 1 Cluster 2 Next Stage 1 52 56 1.000 0 0 67 2 12 53 .976 0 0 29 3 55 117 .975 0 0 39 4 17 67 .973 0 0 17 5 18 95 .972 0 0 33 6 74 103 .971 0 0 7 7 74 110 .968 6 0 23 8 115 157 .968 0 0 46 9 47 122 .963 0 0 36 10 8 91 .962 0 0 64
Since the number of final clusters under the hierarchical clustering are unknown and the
agglomerative methods are preferred to the divisive ones because they are widely
implemented in software, the K-means cluster analysis would be the most appropriate
technique for clustering cases within this study.

263
10.2.2 K-means Cluster Analysis:
K-means cluster analysis uses Euclidean distance which is the most common distance
measure (Hair et al, 1998). The researcher must specify in advance the desired number of
clusters, K. Initial cluster centres are chosen in a first pass of the data, and then each
additional iteration group’s observations based on nearest Euclidean distance to the mean of
the cluster. Cluster centres change at each pass. The process continues until cluster means do
not shift more than a given cut-off value or the iteration limit is reached (Corter 1996).
Cluster centres are the average value on all clustering variables of each cluster's members.
The "Initial cluster centres," in spite of its title, gives the average value of each variable for
each cluster for the k well-spaced cases which SPSS selects for initialization purposes when
no initial file is supplied. The "Final cluster centres" table in SPSS output gives the same
thing for the last iteration step. The "Iteration history" table shows the change in cluster
centres when the usual iterative approach is taken. When the change drops below a specified
cut-off, the iterative process stops and cases are assigned to clusters according to which
cluster centre they are nearest.
In k-means clustering the researcher specifies the number of clusters in advance, and then
calculates how to assign cases to the K clusters. K-means clustering is much less computer-
intensive and is therefore sometimes preferred when datasets are large .Finally, two-step
clustering creates pre-clusters, and then it clusters the pre-clusters.
In this study as there are a large number of cases and eight different variables to be
examined, the K-means is chosen as being appropriate.

264
10.3 K-means Cluster Analysis Results
10.3.1 Number of clusters and Cluster centres
The 167 cases (companies) were clustered based on eight variables (Number of employees,
Annual turnover, Product diversity, Price, Quality, Overheads, Innovation and Outcome
orientation). Under K-means method, SPSS allows the specification in advance of the
desired number of clusters. A critical issue in cluster analysis is the determination of the
appropriate number of clusters. Unfortunately, no generally accepted criterion exists.
Researchers are therefore reduced to using existing theory to identify a natural number of
clusters that are interpretable in terms of the research question.
Based upon the above, it is important to examine the different results based on a different
number of clusters (2, 3 and 4), thereafter a selection of the most appropriate number of
clusters would be chosen.
10.3.1.1 Two Cluster results
The following results are based on a two clusters desired, three stages of the K-means to be
processed to achieve the final results as following:
Table 10.2: Number of cases in each cluster
Cluster 1
2
valid
missing
92 55%
75 45%
167 100%
000 000

265
Table 10.3: Initial cluster centres Cluster
1 2 EMPLONO TURNOV PRICE QUALITY PRODNO OVERHEAD INNOVATION ORIENTATION
6 6 3 3 6 2 2 4
1 1 2 3 1 5 4 5
Table 10.4: Final cluster centres Cluster
1 2 EMPLONO TURNOV PRICE QUALITY PRODNO OVERHEAD INNOVATION ORIENTATION
3.32 4.37 2.57 2.53 4.77 2.89 3.29 4.46
1.99 3.01 2.36 2.51 2.09 2.48 2.95 4.23
The results above shows a two clusters of the whole cases in the sample with different and
conflicted information. it is difficult to decide the nature of each cluster (large, small or
medium). Therefore, it is important to find out results of another number of clusters.
10.3.1.2 Four Cluster results
Table 10.5: Number of cases in each cluster
Cluster 1
2
3
4
valid
missing
38 23%
42 25%
59 35%
28 17%
167 100%
000 000

266
Table 10.6: Initial cluster centres Clusters
1 2 3 4 EMPLONO TURNOV PRICE QUALITY PRODNO OVERHEAD INNOVATION ORIENTATION
6 3 2 3 6 3 3 5
1 6 2 3 3 3 1 1
1 1 2 3 1 5 4 5
5 6 3 3 1 2 2 5
Table 10.7: Final cluster centres Clusters
1 2 3 4 EMPLONO TURNOV PRICE QUALITY PRODNO OVERHEAD INNOVATION ORIENTATION
4.13 5.08 2.55 2.53 5.11 2.89 3.45 4.50
2.25 3.20 2.58 2.50 5.08 2.75 3.13 4.43
1.75 2.75 2.34 2.53 1.97 2.39 3.00 4.31
3.50 4.86 2.50 2.54 2.61 3.04 3.00 4.14
The results above reports a four number of clusters (firms), the results above are ambiguous
in somewhat to fit the results of the previous chapter. Therefore, three clusters would be
more accurate and appropriate for the results of this study.
10.3.1.3 Three Cluster results
The three-cluster solution was chosen because it provides clusters that were consistent with
previous chapter analysis (three categories of independent variables; Small, Medium and
Large). Table 10.8 below shows the number of cases in each cluster and their percentages,
the first cluster includes 77 companies (46%), whereas cluster 2 consists of 34 companies
(20%) of the sample and the third cluster includes 56 companies (34%) of the sample.

267
Table 10.8: Number of cases in each cluster
Cluster 1
2
3
valid
missing
77 46%
34 20%
56 34%
167 100%
000 000 Table 10.9 below shows the initial cluster centres, which includes three clusters as desired,
and gives the average value of each variable in each cluster. It can be observed that cluster
(1) has the highest averages with all variables, for example (6) on size, product diversity,
overheads, innovation and outcome orientation. The second cluster shows a medium average
value and the third cluster reports the lowest average value.
Table 10.9: Initial cluster centres Cluster
1 2 3 EMPLONO TURNOV PRODNO PRICE QUALITY OVERHEAD INNOVATION ORIENTATION
6 6 6 3 3 3 6 6
4 5 3 2 4 3 3 4
2 2 1 2 2 2 4 4
The final cluster centres table 10.10 below gives the mean averages of each variable in each
cluster, which enables a descriptive name to be given to each cluster based on their dominant
averages.

268
Table 10.10: Final cluster centres Cluster
1 2 3 EMPLONO TURNOV PRODNO PRICE QUALITY OVERHEAD INNOVATION ORIENTATION
3.467 4.519 4.649 2.558 2.532 2.909 4.103 4.324
2.588 3.764 2.911 2.460 2.383 2.558 2.970 3.529
1.732 2.636 2.381 2.321 2.155 2.535 3.839 4.196
cluster 1 above reports a high mean in size (number of employees and turnover) 3.46 and
4.516 out of 6 respectively as compared with the mean scores within both second and third
clusters. Product diversity has also a high mean score in the first cluster (4.649) whereas,
cluster 2 and 3 have a less mean score 2.911 and 2.381 respectively. As explained above, that
Price and Quality have a different order in scores (1= most important, 3=least important), the
final cluster centres above shows that all clusters have the nearly same mean for price and
quality. Innovation and Orientation recorded a highest mean score within cluster 1 (4.103
and 4.324) and least mean scores in the other two clusters, even though cluster 3 has a high
mean than cluster 2.
According to the results above, cluster 1 includes those companies (77 companies) which
have a high mean scores of all variables (Large company’s cluster), cluster 2 (34 companies)
consists a medium mean scores (Medium company’s cluster) and cluster 3 (56 companies)
reports the smallest mean scores (Small company’s cluster).

269
10.3.2 Clusters and ABC adoption status Table 10.11 below shows a crosstabulation of the four groups of ABC adoption status and the
three clusters, resulting in a 12 cell matrix (3 by 4). Cluster one includes 77 companies (46%)
of the sample, 38 company (49.3%) have implemented ABC, 16 company (20.8%) have
never considered ABC adoption, 12 company (15.6%) rejected ABC and 11 company
(14.3%) are still considering the implementation of ABC. Cluster two consists of 34
companies (20%) of the sample, in which 20 companies (58.8%) have never considered
ABC, 7 companies (20.6%) had rejected ABC, 4 companies (11.8%) are considering ABC
and only 3 companies (8.8%) have implemented ABC. The third cluster (56 Companies)
includes 44 companies (78.6%) who have never considered ABC, only 5 companies who had
rejected ABC and 7 companies who are implemented or still considering the implementation
of ABC.
Table 10.11: Clusters and ABC adoption status
Group 1
Large 2
Medium 3
Small Total
Implemented 38
49.3% 3
8.8% 3
5.4% 44
26.3% Under
consideration 11
14.3% 4
11.8% 4
7.1% 19
11.4% Rejected 12
15.6% 7
20.6% 5
8.9% 24
14.4% No
consideration 16
20.8% 20
58.8% 44
78.6% 80
47.9% Total 77
100.0% 34
100.0% 56
100.0% 167
100.0% 10.3.3 Characteristics of the clusters This section describes the main characteristics of the three clusters. As is explained above,
the first cluster consists of the large type companies in (Size, Number of products, intensive
competition in price and quality, percentage of Overheads, and business unit culture

270
dimensions). The second cluster includes the medium type companies and the third cluster is
related to those companies who are small. Each cluster will be analysed to establish the value
of the independent variables, reasons for ABC rejection, factors against ABC adoption and
reasons for not considering ABC.
10.3.3.1 Type 1 companies (Cluster 1) Table 10.12 below shows the descriptive statistics of the 77 company with the eight
contingent variables, and reports the range, minimum, maximum, sum, means, standard
deviation and the variances of each of those variables. From the table below, it can be seen
that size (number of employees and turnover) is high (mean scores = 3.467 and 4.519)
respectively, number of products has also a high mean (mean scores=4.649, Minimum=1,
maximum=6). Price and quality had the opposite order, as 1 represents the most important
and 3 represents the least important, the mean scores were 2.558 and 2.532 respectively.
Overheads show mean scores of 2.909 in this cluster which is quiet high with comparison
with the two other clusters. Innovation and Orientation have high mean scores in this cluster
(4.103 and 4.324 respectively).
Table 10.12: Descriptive statistics for cluster 1 Variables Range Min Max Sum Mean Std.Deviation Variance Employees Turnover Product diversity Price Quality Overhead Innovation Orientation
5.00 4.00 5.00 2.00 2.00 3.00 3.00 3.00
1.00 2.00 1.00 1.00 1.00 2.00 2.00 2.00
6.00 6.00 6.00 3.00 3.00 5.00 5.00 5.00
267 348 358 197 195 224 316 333
3.467 4.519 4.649 2.558 2.532 2.909 4.103
4.324
1.252 1.154 1.167 .638 .552 .764 .836 .751
1.568 1.332 1.362 .408 .305 .584 .700 .564
N=77 Companies.
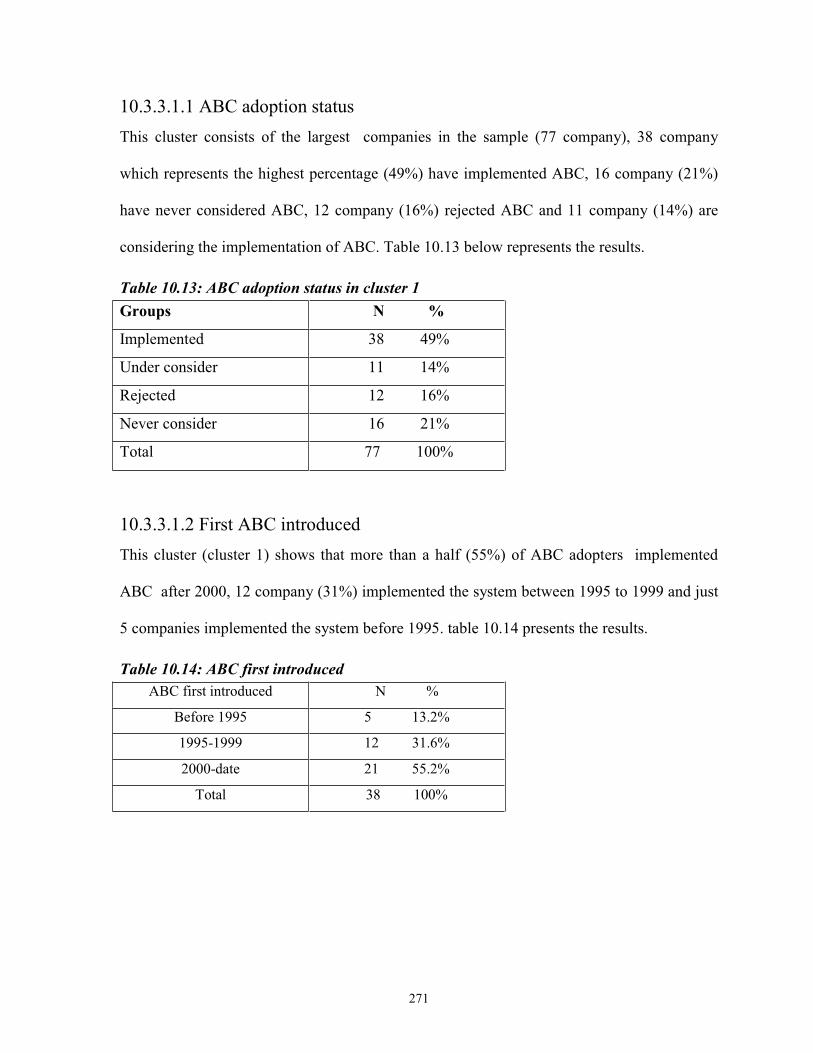
271
10.3.3.1.1 ABC adoption status This cluster consists of the largest companies in the sample (77 company), 38 company
which represents the highest percentage (49%) have implemented ABC, 16 company (21%)
have never considered ABC, 12 company (16%) rejected ABC and 11 company (14%) are
considering the implementation of ABC. Table 10.13 below represents the results.
Table 10.13: ABC adoption status in cluster 1 Groups N %
Implemented 38 49%
Under consider 11 14%
Rejected 12 16%
Never consider 16 21%
Total 77 100%
10.3.3.1.2 First ABC introduced This cluster (cluster 1) shows that more than a half (55%) of ABC adopters implemented
ABC after 2000, 12 company (31%) implemented the system between 1995 to 1999 and just
5 companies implemented the system before 1995. table 10.14 presents the results.
Table 10.14: ABC first introduced ABC first introduced N %
Before 1995 5 13.2%
1995-1999 12 31.6%
2000-date 21 55.2%
Total 38 100%

272
10.3.3.1.3 Factors against adoption of ABC 11 companies are currently considering the adoption of ABC in this cluster. Table 10.15
below presents the factors militating against its adoption.
Table 10.15: Factors against adoption of ABC Factors Frequency percentage
- Difficulty in selecting cost drivers
- Difficulty in defining activities
- High costs of ABC implementation
- Uncertainty of ABC benefits
- Difficulty in assigning resources to activities
- Data collection difficulties
- Difficulty in assigning activity’s costs to cost objects
- internal resistance
- A higher priority of other changes/projects
- Lack of top management support
- Inadequate computer software
10
8
7
6
8
6
7
2
3
2
3
90.9
72.7
63.6
54.5
72.7
54.5
63.6
18.2
27.3
18.2
27.3
(11 cases of under consideration) Difficulty in selecting cost drivers and difficulty in defining activities were the most common
difficulties militating against its adoption (90.9% and 72.7%). Difficulty in assigning
resources to activities was also ranked as a common problem (72.7%). High costs of ABC
implementation, Uncertainty of ABC benefits, Data collection difficulties and Difficulty in
assigning activity’s cost objects were ranked in the middle of the table (63.6%, 54.5%, 54.5%
and 63.6%) respectively. The bottom of the table shows the least important reasons, such as
internal resistance, higher priority of other changes/projects, and lack of top management
support.
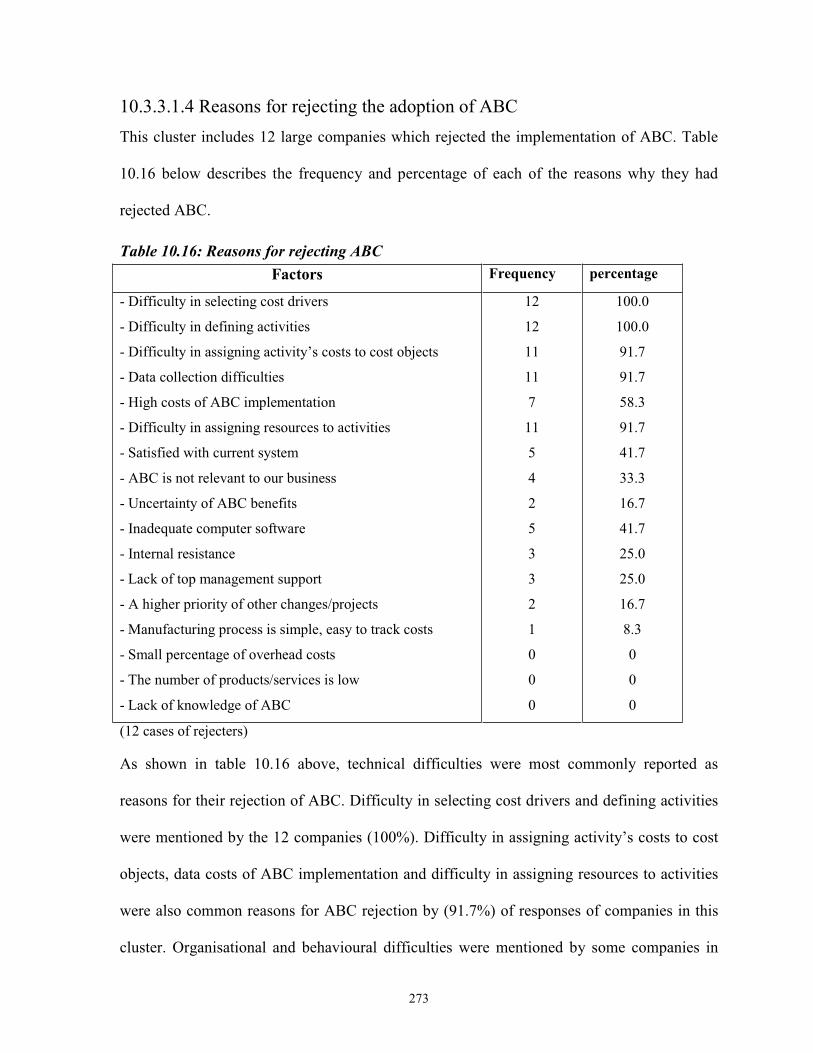
273
10.3.3.1.4 Reasons for rejecting the adoption of ABC This cluster includes 12 large companies which rejected the implementation of ABC. Table
10.16 below describes the frequency and percentage of each of the reasons why they had
rejected ABC.
Table 10.16: Reasons for rejecting ABC Factors Frequency percentage
- Difficulty in selecting cost drivers
- Difficulty in defining activities
- Difficulty in assigning activity’s costs to cost objects
- Data collection difficulties
- High costs of ABC implementation
- Difficulty in assigning resources to activities
- Satisfied with current system
- ABC is not relevant to our business
- Uncertainty of ABC benefits
- Inadequate computer software
- Internal resistance
- Lack of top management support
- A higher priority of other changes/projects
- Manufacturing process is simple, easy to track costs
- Small percentage of overhead costs
- The number of products/services is low
- Lack of knowledge of ABC
12
12
11
11
7
11
5
4
2
5
3
3
2
1
0
0
0
100.0
100.0
91.7
91.7
58.3
91.7
41.7
33.3
16.7
41.7
25.0
25.0
16.7
8.3
0
0
0
(12 cases of rejecters) As shown in table 10.16 above, technical difficulties were most commonly reported as
reasons for their rejection of ABC. Difficulty in selecting cost drivers and defining activities
were mentioned by the 12 companies (100%). Difficulty in assigning activity’s costs to cost
objects, data costs of ABC implementation and difficulty in assigning resources to activities
were also common reasons for ABC rejection by (91.7%) of responses of companies in this
cluster. Organisational and behavioural difficulties were mentioned by some companies in

274
this cluster, for example those which indicated satisfied with current system, ABC is not
relevant to our business, uncertainty of ABC benefits, internal resistance, and lack of top
management support. Surprisingly, small percentage of overhead costs, the number of
products/services is low and lack of knowledge of ABC were not mentioned by any rejected
companies in this cluster.
10.3.3.1.5 Reasons for not considering the adoption of ABC 16 companies in this cluster indicate that they have never considered the adoption of ABC.
Table 10.17 below shows the frequency and percentage of companies and the reasons for
their decision.
Table 10.17: Reasons for not considering ABC Frequency percentage
- Small percentage of overhead costs
- The number of products/service is low
- Satisfied with current system
- ABC is not relevant to our business
- Manufacturing process is simple, easy to track costs
- Lack of knowledge regarding ABC
6
5
8
10
6
5
37.5
31.2
50.0
62.5
37.5
31.2
(16 cases for not considering)
Irrelevance of the ABC and the satisfaction with the current system were the most reasons for
not considering ABC in this group (62.5% and 50%) respectively, followed by small
percentage of overheads, small number of products/services, manufacturing process is simple
and lack of knowledge regarding ABC.

275
10.3.3.2 Type 2 companies (Cluster 2) Table 10.18 below shows the descriptive statistics of the 34 company with the eight
contingent variables. In general, the results are medium with comparison with the first
cluster. Regarding size (number of employees and turnover) mean scores = 2.588 and 3.764)
respectively, number of products had a mean scores=2.91. Price and quality had the opposite
order, as 1 represents the most important and 3 represents the least important, the mean
scores were 2.460 and 2.383 respectively and Overheads show mean scores of 2.558.
Innovation and Orientation have mean scores (2.970 and 3.529 respectively).
Table 10.18: Descriptive statistics for cluster 2 Range Min Max Sum Mean Std. Deviation Variance
Employees
Turnover
Product diversity
Price
Quality
Overhead
Innovation
Orientation
4.00
4.00
5.00
2.00
2.00
3.00
4.00
4.00
1.00
2.00
1.00
1.00
1.00
2.00
1.00
1.00
5.00
6.00
6.00
3.00
3.00
5.00
5.00
5.00
88
128
99
84
81
87
101
120
2.588
3.764
2.911
2.460
2.383
2.558
2.970
3.529
1.157
1.046
1.464
.563
.551
.746
1.086
.861
1.340
1.094
2.143
.317
.304
.557
1.181
.742
* (1=most important, 3=least important). N=34 10.3.3.2.1 ABC adoption status This cluster consists of the medium 34 company in the sample. 20 companies which
represent the highest percentage in this group (59%), have never considered the
implementation of ABC. 7 companies (20%) rejected ABC, 4 companies (12%) are
considering the implementation of ABC and 3 companies (9%) have implemented ABC.
Table 10.19 below represents the results.

276
Table 10.19: ABC adoption status Groups Cluster 1
N %
Implemented 3 9%
Under consider 4 12%
Rejected 7 20%
Never consider 20 59%
Total 34 100% 10.3.3.2.2 Factors against adoption of ABC This cluster includes 4 companies which are considering the implementation of ABC. Table
10.20 below shows the factors militating against the adoption of system.
Table 10.20: Factors militating against adoption of ABC Factors Frequency percentage
- Difficulty in selecting cost drivers
- Difficulty in defining activities
- High costs of ABC implementation
- Uncertainty of ABC benefits
- Difficulty in assigning resources to activities
- Data collection difficulties
- Difficulty in assigning activity’s costs to cost objects
- internal resistance
- A higher priority of other changes/projects
- Lack of top management support
- Inadequate computer software
3
4
3
2
3
4
1
2
1
1
1
75.0
100.0
75.0
50.0
75.0
100.0
25.0
50.0
25.0
25.0
25.0
(4 cases of under consideration) As seen above, technical difficulties were the most common difficulties among those
companies, difficulty in defining activities, data collection difficulties, difficulty in selecting
cost drivers, difficulty in assigning resources to activities and high costs of the
implementation were ranked as the most factors against ABC adoption (100%, 100%, 75%,

277
75%, and 75%) respectively. Organisational and behavioural difficulties were the least
important factors against ABC adoption within this group.
10.3.3.2.3 Reasons for rejecting the adoption of ABC 7 companies had rejected the implementation of ABC in this group. As shown in table 10.21
below, technical difficulties were most commonly reported as reasons for their rejection of
the implementation of ABC.
Table 10.21: Reasons for rejecting ABC Factors Frequency percentage
- Difficulty in selecting cost drivers
- Difficulty in defining activities
- Difficulty in assigning activity’s costs to cost objects
- Data collection difficulties
- High costs of ABC implementation
- Difficulty in assigning resources to activities
- Satisfied with current system
- ABC is not relevant to our business
- Uncertainty of ABC benefits
- Inadequate computer software
- Internal resistance
- Lack of top management support
- A higher priority of other changes/projects
- Manufacturing process is simple, easy to track costs
- Small percentage of overhead costs
- The number of products/services is low
- Lack of knowledge of ABC
7
5
5
3
4
2
3
2
3
1
1
1
1
1
2
0
0
100.0
71.4
71.4
42.9
57.1
28.6
42.9
28.6
42.9
14.3
14.3
14.3
14.3
14.3
28.6
0
0
(7 cases of rejecters)
All responding companies in this cluster (7 companies) indicate that difficulty in selecting
cost drivers was a difficulty. This was followed by difficulty in defining activities, difficulty
in assigning activity’s costs to cost objects and high costs of the system (71%, 71% and

278
57%). Organisational and behavioural issues were also indicated by some companies within
this group, for example, 42% of rejecting companies (3 companies) indicate difficulty in data
collection, satisfied with their current system, and uncertainty of the ABC benefits.
Furthermore, 1 company indicates inadequate computer software, internal resistance, lack of
top management support, higher priority of other changes/projects and manufacturing
process is simple, easy to track costs as a reason for rejecting the system.
10.3.3.2.4 Reasons for not considering the adoption of ABC 20 companies (59%) in this cluster have never considered the implementation of ABC. The
most commonly stated reasons related to the small percentage of overhead costs and small
number of products and services (100%). Satisfaction with their current system and
irrelevant of ABC to their business were also given as reasons for not considering the system
(90% and 75%). In the bottom of table 10.22 below, simplicity of manufacturing process and
lack of knowledge regarding ABC were given as reasons for their decision (45% and 25%).
Table 10.22: Reasons for not considering ABC Factors Frequency percentage
- Small percentage of overhead costs
- The number of products/service is low
- Satisfied with current system
- ABC is not relevant to our business
- Manufacturing process is simple, easy to track costs
- Lack of knowledge regarding ABC
20
20
18
15
9
5
100.0
100.0
90.0
75.0
45.0
25.0
(20 cases for not considering)

279
10.3.3.3 Type 3 companies (Cluster 3) The third cluster consists of 56 companies (34%) of the sample. Eight contingent variables
have been used in this cluster to examine the characteristics of the companies.
Table 10.23 below presents the results.
Table 10.23: Descriptive statistics for cluster 3 Range Min Max Sum Mean Std. Deviation Variance
Employees
Turnover
Product diversity
Price
Quality
Overhead
Innovation
Orientation
3.00
4.00
5.00
2.00
2.00
3.00
3.00
2.00
1.00
1.00
1.00
1.00
1.00
2.00
2.00
3.00
4.00
5.00
6.00
3.00
3.00
5.00
5.00
5.00
97
145
131
130
143
142
215
235
1.732
2.636
2.381
2.321
2.155
2.535
3.839
4.196
.797
.910
1.254
.690
.658
.712
.804
.698
.636
.828
1.574
.477
.433
.508
.646
.488
N= 56 Companies It can be seen from the table 10.23 above that the mean scores of size (Employees number
and Turnover) were quite small with comparison to the previous two clusters (1.732 and
2.636). The cluster also indicates small mean scores for number of products and the level of
overhead costs (2.381 and 2.535). Furthermore companies had a little price and quality
competition than the first and second clusters. Finally, the cluster shows a high mean scores
of innovation and orientation (3.839 and 4.196) respectively.
10.3.3.3.1 ABC adoption status The vast majority of companies within this cluster 44 company (79%) have never considered
the implementation of ABC, as opposed to 3 companies (5%) which have implemented ABC.
5 companies have rejected ABC and 4 companies are currently considering ABC
implementation. Table 10.24 below shows the results.
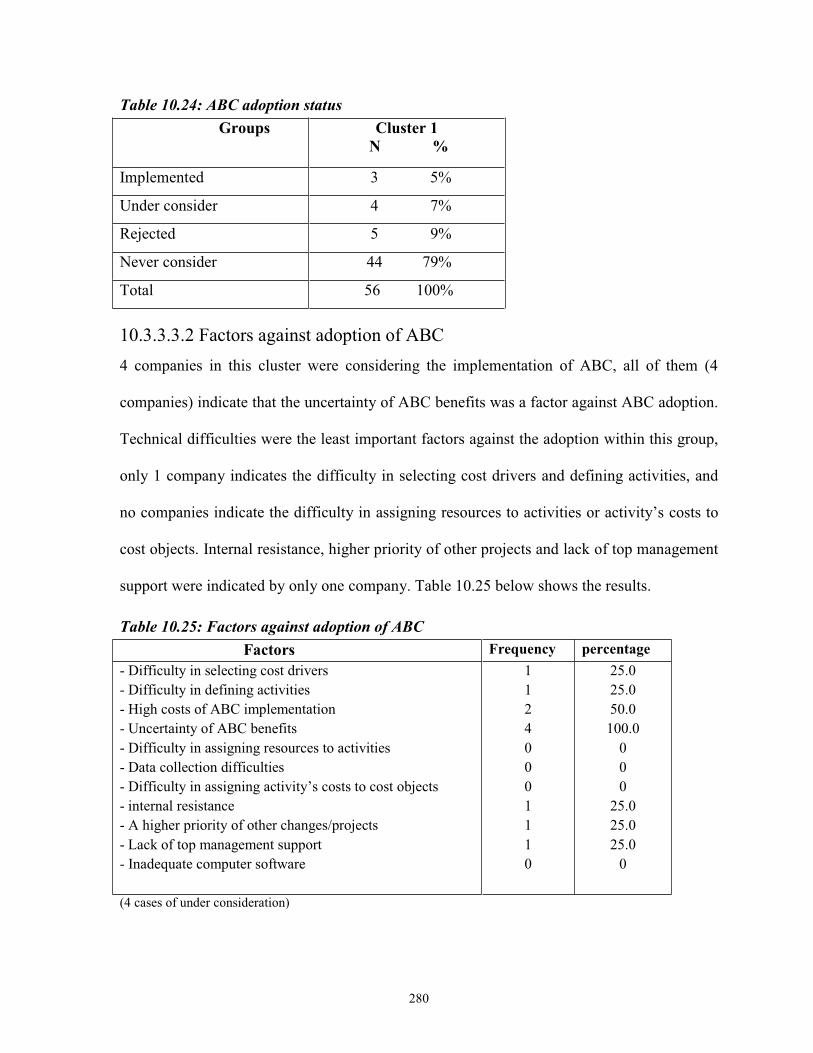
280
Table 10.24: ABC adoption status Groups Cluster 1
N %
Implemented 3 5%
Under consider 4 7%
Rejected 5 9%
Never consider 44 79%
Total 56 100% 10.3.3.3.2 Factors against adoption of ABC 4 companies in this cluster were considering the implementation of ABC, all of them (4
companies) indicate that the uncertainty of ABC benefits was a factor against ABC adoption.
Technical difficulties were the least important factors against the adoption within this group,
only 1 company indicates the difficulty in selecting cost drivers and defining activities, and
no companies indicate the difficulty in assigning resources to activities or activity’s costs to
cost objects. Internal resistance, higher priority of other projects and lack of top management
support were indicated by only one company. Table 10.25 below shows the results.
Table 10.25: Factors against adoption of ABC Factors Frequency percentage - Difficulty in selecting cost drivers - Difficulty in defining activities - High costs of ABC implementation - Uncertainty of ABC benefits - Difficulty in assigning resources to activities - Data collection difficulties - Difficulty in assigning activity’s costs to cost objects - internal resistance - A higher priority of other changes/projects - Lack of top management support - Inadequate computer software
1 1 2 4 0 0 0 1 1 1 0
25.0 25.0 50.0
100.0 0 0 0
25.0 25.0 25.0
0
(4 cases of under consideration)

281
10.3.3.3.3 Reasons for rejecting the adoption of ABC This group of companies (5 companies) within this cluster which rejected the implementation
of ABC identified their reasons for ABC rejection; the results are presented in table 10.26
below.
Table 10.26: Reasons for rejecting ABC Factors Frequency percentage
- Difficulty in selecting cost drivers - Difficulty in defining activities - Difficulty in assigning activity’s costs to cost objects - Data collection difficulties - High costs of ABC implementation - Difficulty in assigning resources to activities - Satisfied with current system - ABC is not relevant to our business - Uncertainty of ABC benefits - Inadequate computer software - Internal resistance - Lack of top management support - A higher priority of other changes/projects - Manufacturing process is simple, easy to track costs - Small percentage of overhead costs - The number of products/services is low - Lack of knowledge of ABC
1 1 1 1 4 0 4 4 4 1 2 3 2 2 4 3 0
20.0 20.0 20.0 20.0 80.0
0 80.0 80.0 80.0 20
40.0 60.0 40.0 40.0 80.0 60.0
0 (5 cases of rejecters) As shown in table 10.26 above, technical difficulties were rarely stated to be the least reasons
for rejecting the implementation of ABC within this group of companies. Only 1 company
indicates the difficulty in selecting cost drivers, defining activities, and assigning activity’s
costs to cost objects. The majority of companies in this group (4 companies) indicate that
high costs of ABC implementation, satisfied with current system, ABC is not relevant to their
business and uncertainty of ABC benefits were the most common reasons for rejecting ABC.
In the bottom of table 10.20 above, a high number of companies indicate that small

282
percentage of overhead costs, the low number of products/services and the lack of top
management support were crucial reasons for ABC rejection.
10.3.3.3.4 Reasons for not considering the adoption of ABC 44 companies which have not considered the adoption of ABC were clustered in this group.
Table 10.27 below reports the reasons for their decision.
Table 10.27: Reasons for not considering ABC Factors Frequency percentage
- Small percentage of overhead costs
- The number of products/service is low
- Satisfied with current system
- ABC is not relevant to our business
- Manufacturing process is simple, easy to track costs
- Lack of knowledge regarding ABC
44
44
40
36
39
38
100.0
100.0
90.9
81.8
88.6
86.4
(44 cases for not considering) All companies (44 companies) indicate that small percentage of overhead costs and the low
number of products and services were the reasons for not considering the adoption of ABC.
40 companies (90%) were satisfied with their current system, and 39 companies (88%) had a
simple manufacturing process. 38 companies (86%) indicate that they have a lack of
knowledge regarding ABC, and 36 companies (81%) referred to the irrelevant of ABC to
their business as a reason for not considering the adoption of ABC.
10.3.3.4 A comparison between the clusters and non ABC adopters This section shows the main differences within the three clusters for the three classes of Non
ABC Adopters, Rejecters, Under consideration and Never considered. It is possible to test for
differences in frequencies between tables 10.15, 10.20, and 10.25 then test for differences
between tables 10.10, 10.15 and 10.20 and also test between tables 10.17, 10.22 and 10.27
mentioned above. This will establish the common reasons for non-adoption of the system.
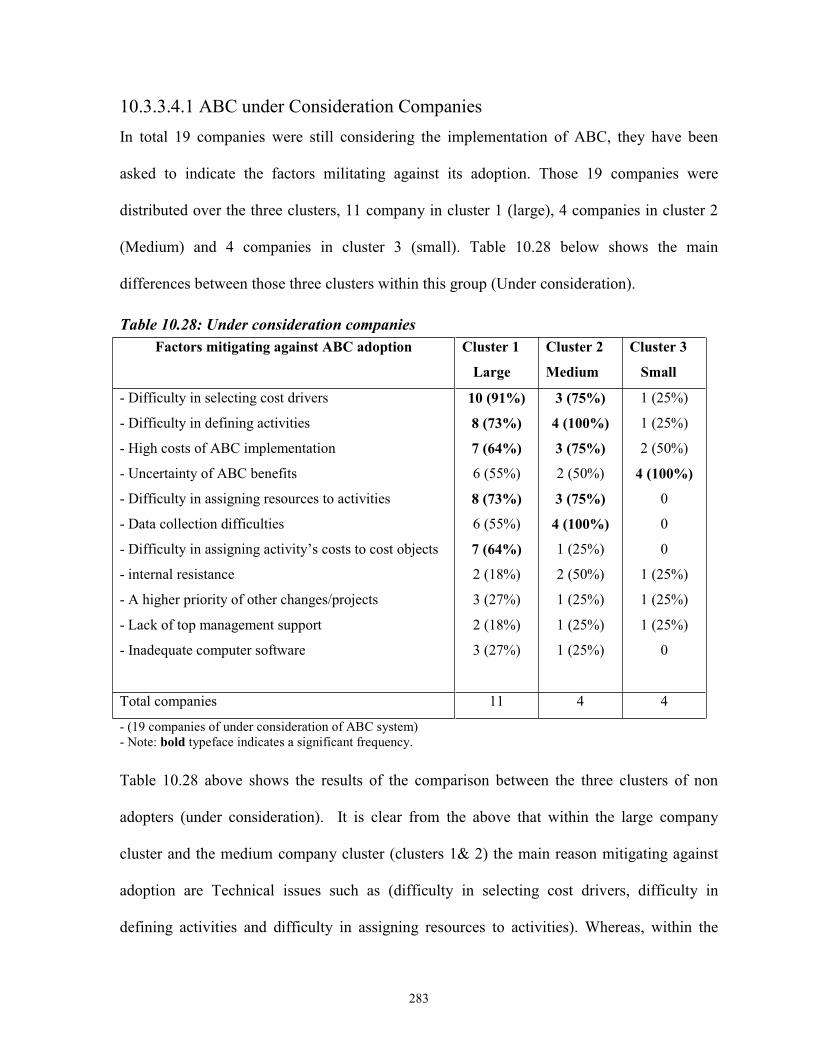
283
10.3.3.4.1 ABC under Consideration Companies In total 19 companies were still considering the implementation of ABC, they have been
asked to indicate the factors militating against its adoption. Those 19 companies were
distributed over the three clusters, 11 company in cluster 1 (large), 4 companies in cluster 2
(Medium) and 4 companies in cluster 3 (small). Table 10.28 below shows the main
differences between those three clusters within this group (Under consideration).
Table 10.28: Under consideration companies Factors mitigating against ABC adoption Cluster 1
Large
Cluster 2
Medium
Cluster 3
Small
- Difficulty in selecting cost drivers
- Difficulty in defining activities
- High costs of ABC implementation
- Uncertainty of ABC benefits
- Difficulty in assigning resources to activities
- Data collection difficulties
- Difficulty in assigning activity’s costs to cost objects
- internal resistance
- A higher priority of other changes/projects
- Lack of top management support
- Inadequate computer software
10 (91%)
8 (73%)
7 (64%)
6 (55%)
8 (73%)
6 (55%)
7 (64%)
2 (18%)
3 (27%)
2 (18%)
3 (27%)
3 (75%)
4 (100%)
3 (75%)
2 (50%)
3 (75%)
4 (100%)
1 (25%)
2 (50%)
1 (25%)
1 (25%)
1 (25%)
1 (25%)
1 (25%)
2 (50%)
4 (100%)
0
0
0
1 (25%)
1 (25%)
1 (25%)
0
Total companies 11 4 4
- (19 companies of under consideration of ABC system) - Note: bold typeface indicates a significant frequency. Table 10.28 above shows the results of the comparison between the three clusters of non
adopters (under consideration). It is clear from the above that within the large company
cluster and the medium company cluster (clusters 1& 2) the main reason mitigating against
adoption are Technical issues such as (difficulty in selecting cost drivers, difficulty in
defining activities and difficulty in assigning resources to activities). Whereas, within the

284
small company cluster (cluster 3) the main reason for non adoption is uncertainty of the
benefits of ABC system.
10.3.3.4.2 ABC Rejecters Companies The 24 companies which had rejected the implementation of ABC system were asked to
indicate the reasons for its rejection of the system. The 24 rejecting companies were
distributed over the three clusters. 12 companies in cluster (1), 7 companies in cluster (2) and
5 companies in cluster (3). Table 10.29 below indicates the results of the comparison
between those three clusters.
Table 10.29: ABC rejecters companies Factors Cluster 1
Large Cluster 2 Medium
Cluster 3 Small
- Difficulty in selecting cost drivers - Difficulty in defining activities - Difficulty in assigning activity’s costs to cost objects - Data collection difficulties - High costs of ABC implementation - Difficulty in assigning resources to activities - Satisfied with current system - ABC is not relevant to our business - Uncertainty of ABC benefits - Inadequate computer software - Internal resistance - Lack of top management support - A higher priority of other changes/projects - Manufacturing process is simple, easy to track costs - Small percentage of overhead costs - The number of products/services is low - Lack of knowledge of ABC
12 (100%) 12 (100%) 11 (92%) 11 (92%) 7 (58%)
11 (92%) 5 (42%) 4 (33%) 2 (17%) 5 (42%) 3 (25%) 3 (25%) 2 (17%) 1 (8%)
0 0 0
7 (100%) 5 (71%) 5 (71%) 3 (43%) 4 (57%) 2 (29%) 3 (43%) 2 (29%) 3 (43%) 1 (14%) 1 (14%) 1 (14%) 1 (14%) 1 (14%) 2 (29%)
0 0
1 (20%0 1 (20%) 1 (20%) 1 (20%) 4 (80%)
0 4 (80%) 4 (80%) 4 (80%) 1 (20%) 2 (40%) 3 (60%) 2 (40%) 2 (40%) 4 (80%) 3 (60%)
0 Total companies 12 7 5
- Note: bold typeface indicates a significant frequency.

285
The results above indicate that within the large company cluster and the medium company
cluster (clusters 1&2) the main reasons for non adoption of ABC (rejected) are technical
issues, while within small company cluster (cluster 3) the main reasons for non adoption is
perceived unsuitable of the ABC system such as (Satisfied with current system, ABC is not
relevant to our business, uncertainty of ABC benefits and small percentage of overhead
costs).
10.3.3.4.3 ABC Not-considering Companies The 80 companies which have not considered the implementation of ABC system were asked
to indicate the possible reasons for its decision. The 80 companies were distributed over the
three clusters, which resulted 16 companies in cluster (1), 20 companies in cluster (2) and 44
companies in cluster (3). Table 10.30 below indicates the results of the comparison between
those three clusters.
Table 10.30: Reasons for not considering ABC Factors Cluster 1
Large Cluster 2 Medium
Cluster 3 Small
- Small percentage of overhead costs - The number of products/service is low - Satisfied with current system - ABC is not relevant to our business - Manufacturing process is simple, easy to track costs - Lack of knowledge regarding ABC
6 (38%) 5 (31%) 8 (50%)
10 (63%) 6 (38%) 5 (31%)
20 (100%) 20 (100%) 18 (90%) 15 (75%) 9 (45%) 5 (25%)
44 (100%) 44 (100%) 40 (91%) 36 (82%) 39 (89%) 38 (86%)
Total company 16 20 44
- (80 companies of not considering of ABC system) - Note: bold typeface indicates a significant frequency. Table 10.24 above shows the significant reasons for not considering the implementation of
ABC systems. The results show that within the small company cluster the main reasons for
non adoption is perceived unsuitable of ABC system which includes all the reason asked to
this group, such as (small percentage of overhead costs, small number of products/services,

286
and satisfaction with the current system). On the other hand, within the large company
cluster, these variables (perceived unsuitable of ABC system) have not been the main reasons
for not considering the ABC system, as it represents the small percentages comparing with
the two other clusters.

287
10.4 Summary and Conclusion
Based upon the contingency variables of firm size, product diversity, marketing strategy, cost
structure, and business unit culture, K-means clustering was utilized to identify homogeneous
subgroups of companies in a sample. Using a Euclidean distance measure, a good separation
of the sample into three company types was achieved, the technique aims to minimize within
cluster variation, and to maximize between cluster variations, where in the latter case
distance between clusters is measured from respective centred.
In terms of clustering, three clusters were achieved. Type 1 companies (77 companies) had
the following characteristics: large number of employees and turnover; large product
diversity, intensive price and quality competition, high level of overheads, and critical
business unit culture (innovation and outcome orientation).
As compared to other company types, type 3 companies (56 company) have considerably
lower number of employees (mean scores= 1.732, compared to 3.467 for type 1 companies).
They also had smaller annual turnover, smaller number of products, lower competition, lower
overheads and quite high innovation and orientation. The type 2 companies (34 companies)
show medium mean results on all variables except innovation and orientation which were the
latest within this cluster as shown in table 10.10.
A crosstabulation of the three clusters and the four levels of ABC adoption resulted in a high
significant relationship (p-value=.000). Referring to table 10.11, around 85% of companies
(38 company) which implemented ABC were type 1 companies (cluster 1), whereas 55% of
companies (44 company) which have never considered the adoption of ABC were in type 3
companies, which means that large companies are more likely to adopt ABC and smaller
companies are more likely to not considering the adoption of ABC.

288
By analyzing the factors militating against ABC adoption for those who were considering
ABC adoption within the three clusters, the results show that larger companies (type 1 and 2
companies) indicate the technical issues as the most commonly stated difficulties mitigating
against its adoption. The results therefore confirm the relationship between technical
difficulties and companies characteristics from one side and ABC adoption status from the
other side.
Regarding those who rejected the implementation of ABC (24 company), the results show
that for the larger companies (type 1 and 2) (12 and 7 companies), technical issues were the
most common difficulties encountered during their implementation.
Type 3 companies indicate that organisational and behavioural issues were the most common
reasons for their rejection and technical issues were the least cited.
The 80 companies in the sample which have never considered the adoption of ABC divided
among the three clusters as following: 16, 20 and 44 (cluster1, 2, and 3). All companies
within the second and third clusters indicate that small percentage of overheads and low
number of products was the most common reasons for not considering the adoption of ABC,
those two clusters were medium and small in their characteristics.

289
CHAPTER 11: EVALUATION OF THE RESEARCH MODEL 11.1 Introduction This chapter presents the results of the analysis conducted in chapters 8, 9 and 10, and shows
how these results support the theoretical model developed in chapter 6 and how they support
each of the thirteen hypotheses been posed in chapter 7. Seven of these hypotheses relate to
the contingency model of ABC adoption, and six hypotheses relate to the barriers to the
implementation of ABC systems. Various statistical analyses have been used (Univariate,
Bivariate and Cluster analysis), which were deemed appropriate to examine and evaluate the
research model and hypotheses.
The rest of the chapter is organised as follows: Section 11.2 reviews the research model.
Section 11.3 examines the relationship of contingency variables and ABC adoption by testing
the first seven hypotheses. Section 11.4 presents the results of cluster analyses regarding the
barriers to the implementation of ABC systems. The last section 11.5 contains the conclusion
of the chapter.
11.2 Research Model Chapter 6 has developed a model of ABC adaptation. The model suggests that in the
adoption of ABC, likely two sets of variables are at work. The contingency factors and the
company’s ability to address and overcome the barriers and difficulties associated with ABC
implementation.
The overall model which has been developed is as given in chapter 6, reproduced below:

290
Figure 11.1: A contingency model of ABC adoption
Adopters
Rejecters
Under consider
Not considered
Adoption status
Technical issues Behavioural issues Systems issues
Contingent factors
Issues encountered
Why rejected
Issues being encountered
Reasons why
Contingent factors - Product diversity - Cost structure - Firm Size - Type of competition - Company sector - Nationality - Business unit culture

291
11.3 Relationship of contingency variables and ABC adoption
Chapter 9 presents and discusses the results of the bivariate analysis of the underling
relationship between the contingent factors and levels of ABC adoption. Four statistical
methods have been utilised (Chi-square, t-test, Mann-Whitney and ANOVA) to establish
whether the seven hypothesized variables are individually associated with ABC adoption.
The summary of bivariate analysis results are represented below:
Table 11.1: Summary of results of bivariate analysis Contingency
variables
Chi-square
t value p-value
t-test
t value p value
Mann-Whitney
Z value p-value
ANOVA
F value Sig
INDUSTRIAL 17.874 .037 N/A N/A N/A N/A N/A N/A
EMPNOMBE 31.453 .000 -5.521 .000 -5.074 .000 10.132 .000
TURNOVER 23.881 .000 -3.752 .000 -3.648 .000 7.132 .000
NATIONAL 3.764 .288 N/A N/A N/A N/A N/A N/A
PRICE 16.076 .013 3.748 .000 -1.368 .171 .991 .399
QUALITY 15.021 .020 1.514 .132 -.004 .997 .998 .395
PRODNOMB 45.618 .000 -6.369 .000 -4.822 .000 16.596 .000
OVERHEAD 46.248 .000 -5.658 .000 -5.296 .000 28.444 .000
INNOVATIO 15.297 .018 -2.582 .011 -2.121 .034 5.304 .002
ORIENTATI 70.571 .000 -4.281 .000 -2.123 .034 1.650 .180
Based on the above table, a discussion of the contingent factors individually and their
association with the adoption of ABC systems is presenting as follows:
11.3.1 Company sector
This study seeks to establish if the economic sector in which the company operates has any
significance for the implementation of ABC systems. It was expected that manufacturing
companies are more likely to adopt ABC than companies within other sectors. The results
indicate that financial companies are more likely to adopt ABC than companies within other

292
sectors. The chi-squared test (see table 11.1 above) shows that the relationship between
industry classification and ABC adoption status is significant (p-value = .037). The findings
of this study therefore, support the hypothesis posed, moreover, the results support the
findings of previous studies (Innes and Mitchell 1995. 2000; Clarke et al. 1999; Pierce and
Brown 2004). The main finding is that there is a strong association between economic sector
and the adoption of ABC systems, for the companies examined.
11.3.2 Firm size
Firm size has been measured both by the number of employees and annual turnover. The
findings report a significant association exists between both number of employees, annual
turnover and the implementation of ABC systems. The chi-squared test shows that the
relationship between firm size (number of employees and annual turnover) and ABC
adoption status is significant (p-value = .000 and .001 respectively). The Levene’s test (t-test)
is significant with firm size (p = .000 and .000), which means that the variances are
significantly different between non-adopters and adopters, and the mean differences scored (-
.5366 and -.4529 respectively). The results of Mann-Whitney U test, which support the
results achieved by the t-test indicate that there are statistically significant differences in
variation in number of employees and annual turnover (P value = .000 and .000 respectively).
The results of ANOVA shows a significant mean differences between the four groups of
companies in size (adopters, rejecters, under considers and non-considers), these differences
are highly significant (.000 and .000 respectively), (see table 11.1). It was expected that large
companies in terms of number of employees and turnover were more likely to adopt ABC
than smaller companies. The results above support this hypothesis and moreover indicate that
there is a significant difference among the different groups of companies in terms of firm

293
size. The findings of this study also support the argument that ‘the size of the company is
usually a factor in the rate of adoption of sophisticated cost accounting systems’ (Innes and
Mitchell, 1995, 1999; Bjornenak, 1997; Van Nguyen and Brooks, 1997; Krumwiede, 1998;
Clarke et al, 1999). The results of this study support some previous ABC studies which
indicate that company size does provide a statistically significant source of differentiation
between ABC adopters and non-adopters; a markedly significant higher rate of adoption is
apparent in the larger firms surveyed (Innes and Mitchell, 1995; Bjornenak, 1997; Boot and
Giacobbe, 1998; Krumwiede, 1998; Clarke et al. 1999; Groot, 1999; and Pierce and Brown,
2004).
11.3.3 Nationality
Nationality has been examined to establish its association with the implementation of ABC
system. It was expected that multinational companies were more likely to adopt ABC system
than national companies. The findings indicate that a higher percentage of Irish companies
(43 %) have implemented or are considering the implementation of ABC than do
multinational companies (30%). Moreover, 56% of multinational companies have not
considered ABC compared to 41% of national companies. The value of the chi-squared test
(3.764) shows insignificant relationship between nationality and ABC adoption (p-value =
.288). The results of this study support the findings of Pierce and Brown (2004) whose found
that ABC adoption rates are higher among indigenous Irish firms than multinational,
although not significantly higher. However, the results are in conflict with Clark et al. (1999)
who report a greater percentage of multinational subsidiaries using ABC than do national
firms. Therefore, the results do not support the hypothesis posed in this study.
294
11.3.4 Product diversity
This study adopts the position that product diversity is a significant factor in the adoption of
ABC systems. It was expected that firms which have more production diversity were more
likely to adopt ABC than firms which have less production diversity. The findings report that
a greater percentage of highly diversified companies (55%) have implemented or are
considering the implementation of ABC than do lowly diversified companies (10%),
moreover, 82% of lowly diversified companies have not considered ABC compared to 27%
of highly diversified companies. The chi-square results indicate a significant association
between product diversity and ABC adoption (p-value = .000). The differences in means
between the two groups (adopter and non-adopters) and the four groups (adopters, rejecters,
under considered, and not considered) are also significant in all statistical tests utilized in this
study (see table 11.1). The results of this study support the findings of previous studies on
ABC implementation (Brown et al 2004; Bjornenak 1997; Clarke et al 1999; Groot 1999; and
Abernethy et al 2001).
Product diversity thus appears to be an important variable to the implementation of ABC,
companies which have more product diversity are more likely to adopt ABC than companies
with a low number of products.
11.3.5 Competition
Types of competition have been examined to test their association with ABC
implementation. The main statistical analyses focused upon price and quality which appear
as the dominant highest important factors. It was expected that firms which face high levels
of competition were more likely to adopt ABC than those which face less competition. The
results in table 11.1 above show a significant association between both price, and quality,

295
individually, and ABC adoption (P-value= .013 and .020 respectively). Results of the t-test
which compared mean-values of each variable (price and quality) between the two groups
indicate a significant differences in price (.000) and insignificant differences in quality
(.132)). That means quality is an important factor at all companies regardless of its decision
regarding ABC systems. The findings of this study support the results of previous studies
which are non supportive of an association between high level of competition and ABC
adoption (Bjornenak, 1997; Van Nguyen and Brooks, 1997; and Cinquini et al. 1999).
11.3.6 Cost structure (level of overheads)
Despite the conflict between the theoretical literature and the results of previous surveys
relating to ABC implementation and level of overhead expenditure, this study hypothised
that firms which have a greater percentage of total cost as overheads are more likely to
implement ABC than other firms. The results in table 11.1 show that companies with higher
overhead percentages are more likely to adopt ABC, and the association between overheads
and ABC adoption statues is very significant (chi-squared 46.248, P-value= .000). The
findings of the t-tests which compare mean-values of overhead between the two groups
(adopters and non-adopters) show that, in all cases, means between the two groups are
significantly different (p-value = .000) and show that companies which have adopted ABC or
plan to adopt ABC possess significant difference in terms of overhead when compared with
firms which have not adopted ABC. The ANOVA and Mann-Whitney tests indicate
significant differences in overhead between the four groups of companies (P-value = .000).
The results of this study therefore, support the theoretical literature (Cooper and Kaplan,
1988; Cooper, 1989b; Drury, 1989; Mitchell, 1994) which argues that growth of overhead
compounds the problematic distortion inherent in traditional systems, therefore promoting

296
ABC as the solution to overcome these distortions. However, previous surveys report a non-
association between the percentage of overhead to total costs and the implementation of ABC
(Booth and Giacobbe 1989; Brown et al. 2004; Clarke et al. 1999; Van Nguyen and Brooks,
1997; Bjornenak, 1997; and Cinquini et al 1999).
11.3.7 Business unit culture
This study examined business unit culture as a contingent factor associated with the
implementation of ABC by Irish companies. Business unit culture was divided into two
categories, namely innovation and outcome orientation. The findings of the study (table 11.1
above) show a significant association between innovation and outcome orientation
individually and the adoption of ABC systems (P-value = .018 and .000 respectively). T-tests
results which compared mean-values of innovation and outcome orientation between the two
groups, show that, in both cases, means between the two groups significantly different (p-
value = .011 and .000 respectively). ANOVA test shows that in innovation, means between
the four groups of companies are significantly different (.002), whereas insignificant
differences were found in means between the four groups in outcome orientation (.180). It
was expected that firms which have a culture of innovation and outcome orientation will be
more likely to adopt ABC. The results of the study support this expectation. The results also
support the previous study by Baird et al. (2004) which is the only other study which
examines the association between business unit culture and the adoption of ABC systems.

297
11.4 Technical issues and ABC adoption
Having established the contingency model of ABC adoption, the research seeks to identify
whether technical issues are a significant barriers to the implementation of ABC or whether
other barriers, such as behavioural issues and/or systems are more significant. In order to
differentiate “barriers” as a general reason for no adoption from the contingent factors,
companies were first clustered on the basis of the contingent factors. A three cluster approach
was adopted in order to maintain consistency with the bivariate analysis.
This resulted in the following 3 clusters:
Table 11.2: Clusters and ABC adoption status Group/ Clusters
Large 1
Medium 2
Small 3
Total
Implemented
38 49.3 %
3 8.8 %
3 5.4%
44 26.3 %
Under consideration
11 14.3 %
4 11.8 %
4 7.1 %
19 11.4 %
Rejected
12 61.4 %
7 20.6 %
5 8.9 %
24 14.4 %
No consideration 16 20 44 80 20.8% 58.8% 78.6% 47.9% Total 77 34 56 167 1100% 100% 100% 100%
When companies are clustered on the basis of their prime factor profiles, it was expected
there will be significant differences in the ABC adoption status between clusters. Table 11.2
above indicates significant differences in the adoption of ABC. The large number of
companies which have implemented ABC (38 out of 44 companies) are found in cluster one,
while only 6 companies of ABC adopters found in both clusters 2 and 3. Therefore, a
significant differences in the ABC status between clusters have been found, which support
hypothesis 8.

298
Having clustered the companies and having established that there are significant differences
in their ABC adoption rates, a profile of each cluster was developed. This profile represents a
measure of each variable which was established in the contingency model.
Table 11.3: Descriptive statistics of the clusters
Variables N Mean Std. D N Mean Std. D N Mean Std. D
Employees No
Turnover
Product No
Price
Quality
Overhead
Innovation
Orientation
77
77
77
77
77
77
77
77
3.467
4.519
4.649
2.558
2.532
2.909
4.104
4.325
1.252
1.154
1.167
.638
.552
.764
.836
.751
34
34
34
34
34
34
34
34
2.588
3.764
2.911
2.470
2.382
2.558
2.970
3.529
1.158
1.046
1.464
.563
.551
.746
1.086
.861
56
56
56
56
56
56
56
56
1.732
2.636
2.381
2.321
2.155
2.535
3.839
4.196
.797
.910
1.254
.690
.658
.712
.804
.698
Table 11.3 above shows the descriptive statistics for each cluster with the eight contingent
variables. The results indicate that type 1 companies (cluster 1) have a significant different
profile from type 2 and type 3. Type 1 companies have the highest mean in all variables
followed by type 2 companies which represent the medium companies and finally the
smallest companies represented by cluster 3.
While the upholding of hypothesis 8 above allows us to say that the adoption rates between
the clusters is statistically different, there is variation in each cluster, as shown in table 10.7,
10.13 and 10.18, which are represented below in a combined form.
Clusters Cluster 1 Cluster 2 Cluster 3

299
Table 11.4: ABC adoption status among clusters
Groups N % N % N %
Implemented 38 49% 3 9% 3 5%
Under consider 11 14% 4 12% 4 7%
Rejected 12 16% 7 20% 5 9%
Never considered 16 21% 20 59% 44 79%
Total 77 100% 34 100% 56 100%
Table 11.4 above reports the status of ABC adoption between the three clusters. Within each
cluster, a difference in ABC adoption status was expected. Cluster one which represents the
larger companies in the sample (77 companies), includes the highest percentage of those
companies which implemented ABC (38 companies out of 44), clusters 2 and 3 consists a
small percentage of those adopters. In fact, non-adopters represent 51% of the companies in
cluster one. These non adopters were differentiated into three categories; Currently
Considering ABC 14%, Have Rejected 16% and Never considered 21%. It is interesting to
note that even in type 1 companies more than half have not implemented the system.
In cluster two which includes the medium profile companies (34 companies), only 9% of
companies have adopted ABC, while 91% have not adopted the system. Similar results were
found in cluster three (56 small profile companies) with only 5% being adopters. The results
above also show that all three categories of non adopters i.e those who have rejected ABC
after consideration, those who are currently considering ABC and those who have not
Clusters Cluster 1 Cluster 2 Cluster 3
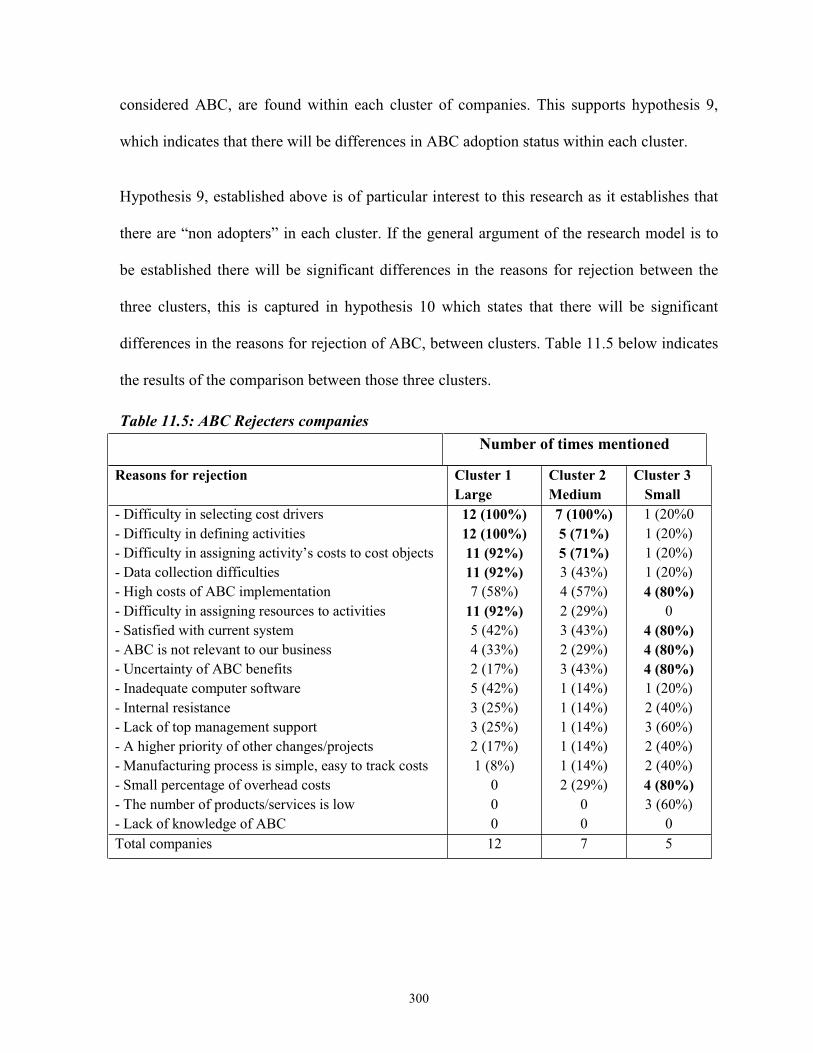
300
considered ABC, are found within each cluster of companies. This supports hypothesis 9,
which indicates that there will be differences in ABC adoption status within each cluster.
Hypothesis 9, established above is of particular interest to this research as it establishes that
there are “non adopters” in each cluster. If the general argument of the research model is to
be established there will be significant differences in the reasons for rejection between the
three clusters, this is captured in hypothesis 10 which states that there will be significant
differences in the reasons for rejection of ABC, between clusters. Table 11.5 below indicates
the results of the comparison between those three clusters.
Table 11.5: ABC Rejecters companies
Number of times mentioned
Reasons for rejection Cluster 1 Large
Cluster 2 Medium
Cluster 3 Small
- Difficulty in selecting cost drivers - Difficulty in defining activities - Difficulty in assigning activity’s costs to cost objects - Data collection difficulties - High costs of ABC implementation - Difficulty in assigning resources to activities - Satisfied with current system - ABC is not relevant to our business - Uncertainty of ABC benefits - Inadequate computer software - Internal resistance - Lack of top management support - A higher priority of other changes/projects - Manufacturing process is simple, easy to track costs - Small percentage of overhead costs - The number of products/services is low - Lack of knowledge of ABC
12 (100%) 12 (100%) 11 (92%) 11 (92%) 7 (58%)
11 (92%) 5 (42%) 4 (33%) 2 (17%) 5 (42%) 3 (25%) 3 (25%) 2 (17%) 1 (8%)
0 0 0
7 (100%) 5 (71%) 5 (71%) 3 (43%) 4 (57%) 2 (29%) 3 (43%) 2 (29%) 3 (43%) 1 (14%) 1 (14%) 1 (14%) 1 (14%) 1 (14%) 2 (29%)
0 0
1 (20%0 1 (20%) 1 (20%) 1 (20%) 4 (80%)
0 4 (80%) 4 (80%) 4 (80%) 1 (20%) 2 (40%) 3 (60%) 2 (40%) 2 (40%) 4 (80%) 3 (60%)
0 Total companies 12 7 5

301
The results of cluster analysis show that within the ‘closely aligned’ cluster (cluster 1),
technical difficulties were the most commonly reported reasons for (table 11.5). The cluster
which is ‘least aligned’ (cluster 3), shows that technical difficulties were the second least
mentioned reasons for rejection, and that contingent issues are the dominant reasons for such
rejection. Therefore, technical issues are the most common cause for rejection of ABC within
the cluster whose profile most closely matches the prime factors. Furthermore, contingent
issues are the most dominant reasons for rejection of ABC within the cluster whose profile
‘least aligned’ the prime factors.
The above results are supportive of hypothesis ten which states that there will be significant
differences in the reasons for rejection of ABC between clusters. Moreover, the results above
support the hypothesis eleventh which states that technical issues will be the most common
cause for rejection of ABC within the cluster whose profile most closely matches the prime
factors.
The research model also embraces companies which are actively considering ABC adoption.
The model suggests that the factors militating against adoption will differ between clusters.
Table 11.6 below presents the results and shows that there are significant differences in the
factors militating against implementation of ABC between clusters. The results show that
technical issues are the most common factors militating against ABC within companies who
are actively considering its adoption, within the cluster whose profile most closely matches
the prime factors (clusters 1). On the other hand, technical issues are not mentioned or least
frequently factors militating against ABC adoption within companies who are actively
considering its adoption, within the cluster whose profile least closely matches the prime
factors (cluster 3).

302
Table 11.6: Under consideration companies Factors mitigating against ABC adoption Cluster 1
Large
Cluster 2
Medium
Cluster 3
Small
- Difficulty in selecting cost drivers
- Difficulty in defining activities
- High costs of ABC implementation
- Uncertainty of ABC benefits
- Difficulty in assigning resources to activities
- Data collection difficulties
- Difficulty in assigning activity’s costs to cost objects
- internal resistance
- A higher priority of other changes/projects
- Lack of top management support
- Inadequate computer software
10 (91%)
8 (73%)
7 (64%)
6 (55%)
8 (73%)
6 (55%)
7 (64%)
2 (18%)
3 (27%)
2 (18%)
3 (27%)
3 (75%)
4 (100%)
3 (75%)
2 (50%)
3 (75%)
4 (100%)
1 (25%)
2 (50%)
1 (25%)
1 (25%)
1 (25%)
1 (25%)
1 (25%)
2 (50%)
4 (100%)
0
0
0
1 (25%)
1 (25%)
1 (25%)
0
Total companies 11 4 4
The above table tests the last two hypotheses (12 and 13), and shows that there are significant
differences in the factors militating against ABC adoption (within companies who are
actively considering its adoption) between clusters. Furthermore, the dominance of technical
issues amongst the barriers to implementation is established supporting the hypothesis which
states that technical issues will be the most common factor mitigating against ABC adoption
(within companies who are actively considering its adoption) within the cluster whose profile
most closely matches the prime factors.

303
11.5 Summary and conclusion
This research has sought to answer two interrelated questions. The first research question is
“Is the adoption of ABC by Irish companies associated with firm-specific characteristics,
namely industry sector, firm size, nationality, product diversity, type of competition, cost
structure and business unit culture?.
Based on the contingency model developed in chapter 6, seven variables and their
hypothised relationship with ABC adoption have been examined in the first section of this
chapter. Previous surveys are not unanimous in their support of the impact of the individual
variables upon ABC adoption. While different surveys of the same variable sometimes use
different operational definitions of the variable, and of ABC adoption, nonetheless there does
appear to be support for a general argument that the seven identified variables potentially
impact upon ABC adoption. The results of this study show a strong significant association
between six of those contingent variables namely (product diversity, cost structure, firm size,
types of competition, company sector and business unit culture) and the adoption of ABC.
Nationality has been found to have a non significant association with ABC adoption
The research model (figure 11.1) suggests that in the adoption of ABC, likely two sets of
variables are at work. The contingent variables which likely render it appropriate or useful
for the company to adopt ABC, and the company’s ability, or willingness to address the
barriers and difficulties associated with ABC adoption. The model also suggests that the
contingent variables alone may not of themselves adequately explain the actual take up of
ABC systems. Moreover, the model suggests that two companies which have similar profiles
with regard to the contingent variables may yet reach different decisions with regard to ABC

304
adoption, due to their differing abilities or willingness to address the issues relating to
implementation. Of the various possible barriers to implementation, this research has focused
on technical issues, and has sought to answer the second research question, which is “What is
the extent of the technical difficulties encountered during the implementation of ABC
system?
The findings of the cluster analysis both examine the research model and answer the second
research question. The model suggest that two companies which have similar profiles with
regard to contingent factors (with higher overheads, more product diversity etc. ) may yet
reach different decision with regards to ABC adoption, due to their differing abilities or
willingness to address and overcome the issues relating to ABC implementation. The results
completely support this suggestion.
The results also show that technical issues are the most common factor militating against
ABC adoption within companies who have rejected or are actively considering its adoption
within the cluster whose profile most closely matches the prime factors.
With regard to the extent of technical issues, as barriers to implementing ABC, the results
show as follows:
(i) Amongst companies which have rejected ABC, technical issues are the most
frequently stated reasons for rejection, amongst those companies whose profile most
closely matches the prime factors.
(ii) Amongst companies which are actively considering the adoption of ABC
technical issues are the most frequently stated factors militating against ABC
introduction, amongst those companies whose profile most closely matches the prime
factors.

305
CHAPTER 12: CONCLUSIONS, CONTRIBUTIONS, AND FUTURE RESEARCH 12.1 Introduction The conceptual model of this study based on constructs that emerged from the existing
literature (Chapters 2-5) was developed in chapters 6. The research questions and hypotheses
were posed in Chapter 7, and the model was tested with data from a survey of companies
listed on Business and Finance (2004) Irelands Top 1000 companies (167 firms). The data
has been examined using various statistical analysis (Univariate, Bivariate and Cluster
analysis) deemed appropriate to the nature of the data and the research model.
The main argument in this study is that there are two main interacting sets of factors
influencing ABC adoption, the contingency factors, and the barriers and difficulties
associated with ABC implementation. Chapter 9 has established the relationship between the
contingency factors and the ABC adoption status. In Chapter 10, the barriers and difficulties
relating to implementation of ABC were examined using the cluster analysis.
This Chapter provides the final conclusions relating to the hypotheses, and considers the
contributions of the study. The principle research question is re-addressed. The theoretical
and methodological contributions of the study are then considered and suggestions for future
research opportunities are also provided.
The organisation of the chapter is as follows. Section 12.2 concludes the research questions
based on testing and examining the research hypotheses. Section 12.3 presents the theoretical
and methodological contributions of the research. Section 12.4 identifies limitations and
suggestions for future research. The last section contains the closing remarks for the study.

306
12.2 Concluding the research questions The concept of contingency theory and its relationship to management accounting is well
established. Fisher (1995) pointed out that contingency theory has become one of the
dominant paradigms for research into management accounting design. Contingency theory
suggests that there is no ideal form of management accounting. Rather, particular features or
contingencies of an appropriate accounting system will depend upon the specific
circumstances in which an organization finds itself (Otley, 1980).
Organisations need up-to-date information to support them in making the right decision.
Costing systems should provide the accurate and necessary cost information for both
informed operational and strategic decisions about resources acquisition and use (Berliner
and Brimson, 1988). During the 1980s many organisations began to realize the adverse
consequences of allowing their traditional costing systems to generate inaccurate costing
information (Cokins, 1999). Especially during the late 1980s, traditional costing practices
were widely recognized by academics to be unlikely to provide useful information for
management (Kaplan, 1984; Kennedy, 2000). While many lamented that costing practices
were lagging behind the contemporary manufacturing environment (Kaplan, 1984; Johnson
& Kaplan, 1987; Dunk, 1989), some claimed that traditional costing systems should be
eliminated (e.g. Kaplan, 1990a). As a result, Activity-Based Costing (ABC) has been
developed as a remedial solution in order to eliminate the distortions of overhead cost
allocation, and to present an opportunity to provide a better decision-making base for
managers.
Despite strong advocacy in favour of ABC systems (Cooper 1988a, b; Cooper and Kaplan
1991, 1992 and 1998) adoption rates are not overwhelming (Innes et al. 2000). Survey
evidence suggests that, over the past decade, there has been a growing awareness of ABC,

307
but overall rates of implementation have been low (Innes and Mitchell 1995, 2000;
Bjornenak1997; Nguyen and Brooks1997; Clark et al. 1999; Groot 1999; Cinquini et al.1999;
Changruksut 2002; Cotton et al.2003; Pierce and Brown 2004; Manalo 2004; and Cohen et
al. 2005). A suggested reason for this is that the adoption of ABC has been inhibited in many
companies by the behavioural and systems factors (Anderson 1995; Shields 1995). However,
the application of a contingency theory prospective would likely suggest that contextual
variables also exert an influence upon ABC adoption. Behavioural and systems issues may be
viewed as possible barriers to be overcome in ABC adoption, while the overall suitability of
the system is influenced by the contextual or contingent factors. The barriers to ABC
adoption may also include technical issues.
Anderson et al (2002, p.195) state: “an aspect of ABC implementation that researchers have
neglected is the process of designing the ABC model – i.e. the resources, activities and cost
drivers that are the ‘economic map’ of the organisation”. By contrast, a number of studies
have considered behavioural issues (Anderson, 1995; Shields, 1995; McGowan and Klammer
1997; Anderson et al., 2002). However, there is evidence (Cobb et al 1992; Armitage and
Nicholson 1993; Innes and Mitchell 1990, 1995, 2000; Clarke 1997) that there are specific
technical issues which may impact upon ABC implementations. It is on such technical issues
that this research has focused.
In section 7.4 the research questions were formulated and described. The research questions
addressed in this study are:
1. Is the adoption of ABC by Irish companies associated with firm-specific
characteristics, namely industry sector, firm size, nationality, product diversity, type of
competition, cost structure and business unit culture?

308
2. What is the extent of the technical difficulties encountered during the
implementation of ABC system?
The technical difficulties focused upon are those identified in the literature review i.e.
(i) Identifying the major activities that take place in an organisation
(ii) Assigning resources to those activities
(iii)Aggregating activities to create cost pools/ activity centres
(iv) Determining the cost drivers for each activity
(v) Assigning the cost of activities to cost objects
The study sought to establish the factors associated with ABC adoption in order to answer
the research questions. When conducting empirical research, the researcher must decide
whether prior expectations should dictate the design of investigation procedures. Should the
study use hypotheses based on conceptual reasoning or should the hypotheses be deduced
from the empirical findings (Gernon and Wallace, 1995)? The choice in this study was to
specify hypotheses prior to obtaining the empirical data. Based on an extensive review of the
management accounting literature, the hypotheses were specified in advance. These
hypotheses determined the direction, scope, and structure of the questionnaire. Results
derived from the empirical data were evaluated to determine whether the hypotheses were or
were not supported.

309
12.3 Theoretical and Methodological contributions The aim of this study was to examine not only the association between the adoption of ABC
system and the contingent variables, but also to develop a new model of ABC adoption
which seeks to incorporate contingency theory relating to a set of variables that identified
from the literature as likely to be influential in ABC adoption, as well as the significant of
technical issues, which may act as barrier to such implementation. Therefore, the study
contributes theoretically and methodologically to the management accounting literature in
several ways.
12.3.1 Dual Influences This research has sought to examine the reasons why the take up or adoption of ABC systems
remains low, given the advantages which the system offers over the more traditional
approach to dealing with overhead costs. A major theoretical contribution of this study is the
realisation that two distinct sets of variables influence the adoption of ABC. In this study
these sets of influences are referred to, respectively, as “Contingent Variables” and
“Barriers”. The theoretical model developed in this research views the Contingent Variables
as rendering ABC “appropriate” for use by particular companies. Thus, for example, firms
with high levels of overheads (as a percentage of total cost) are more likely to find ABC
appropriate to their particular information needs than firms with a low level of overheads.
However, for ABC to be adopted by a firm the second set of variables, the “Barriers to
Implementation” must be overcome. These implementation barriers are viewed, in this
research, as potential difficulties which may inhibit the adoption of the ABC system. Thus,
for example, a lack of senior management support for ABC may be a sufficient inhibitor to
prevent the implementation of the ABC system. Adopting the position that there are two

310
distinctive sets of variables which influence the adoption of ABC, this research has sought to
identify and model these distinctive sets of variables. As far as the author is aware this is the
first study to consider the interaction between these sets of variables.
12.3.2 Classification of the potential Barriers to ABC implementation Based upon a review of the literature this research has classified implementation issues, or
difficulties into three main types. These have been termed “Behavioural”, “Technical” and
“Systems” difficulties or barriers. The benefit of this classification is that it allows the results
of the various studies relating to ABC adoption to be summarised in a coherent fashion.
Thus, for example individually identified issues such as difficulties in identifying activity
centres, difficulties in identifying cost drivers, and difficulties in assigning costs to activities
have been classified under the general heading of “Technical Difficulties”. Likewise, such
individual issues as lack of senior management support, lack of suitable accounting staff, and
internal resistance have been classified under the heading of “Behavioural Issues”, while
Systems Difficulties or Barriers include the individually identified difficulties such as
inadequate computer software, data collection difficulties etc. Thus, while the various studies
reviewed in this research have identified various common problems relating to ABC
implementation, the classification adopted in this study allows us to focus in on the generic
nature of the difficulties rather than deal with a (very) long list of highly specific issues.
12.3.3 Identification of Contingent Factors Drawing upon the literature of Contingency Theory, as developed both in the general
management literature and more specifically in the management accounting literature
together with a consideration of the results of published research on ABC adoption, a
contingency model of ABC adoption has been developed. In this model seven contingent

311
variables were identified, each of which is justified as likely relating to the adoption of ABC.
As argued under the heading “Duel Influences” the view taken in this research is that the
contingent factors or variables likely render ABC appropriate for adoption. The contingent
variables identified were as follows, Firm Size, Nationality, Cost structure, Industrial Sector,
Type of Competition, Product Diversity and Business Unit Culture. Of these all but one, i.e.
Nationality were found to be significantly associated with ABC adoption. The contingency
model was therefore largely verified.
12.3.4 Use of Cluster Analysis / Profiling of Companies As far as the author can establish this is the first study of ABC adoption which has utilised
the statistical technique of Cluster Analysis to classify, or group, companies which were the
basis of the study. The particular Cluster Analysis technique which was utilised was the K
mean clustering method. The 167 companies were clustered into three groups based upon the
values of seven variables, each of which had been established as being a significant
contingent variable. The choice of three as the number of clusters to utilise was dictated by
the data relating to the variables, which had previously been “collapsed” into three categories
in order to facilitate Chi-square analysis. The resulting three clusters have significantly
different rates of ABC adoption, as established by Chi-square tests. Some 63% of Cluster 1
companies had either adopted ABC or had adoption under active consideration, as opposed to
some 20% of Cluster 2, and some 12% of Cluster 3.
Based upon the mean value of each of the variables used to form the clusters, a “profile” of
the companies within each of the clusters was developed. As far as can be established this is
the first time that company profiles have been developed in the study of ABC adoption.
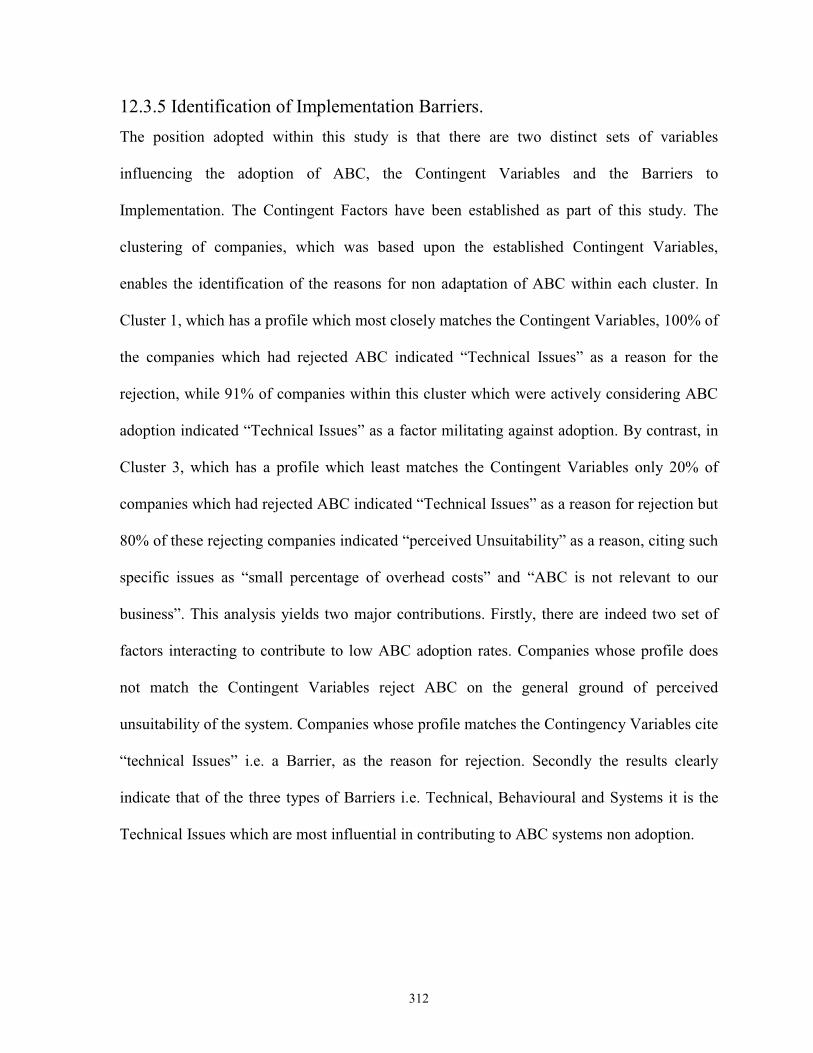
312
12.3.5 Identification of Implementation Barriers. The position adopted within this study is that there are two distinct sets of variables
influencing the adoption of ABC, the Contingent Variables and the Barriers to
Implementation. The Contingent Factors have been established as part of this study. The
clustering of companies, which was based upon the established Contingent Variables,
enables the identification of the reasons for non adaptation of ABC within each cluster. In
Cluster 1, which has a profile which most closely matches the Contingent Variables, 100% of
the companies which had rejected ABC indicated “Technical Issues” as a reason for the
rejection, while 91% of companies within this cluster which were actively considering ABC
adoption indicated “Technical Issues” as a factor militating against adoption. By contrast, in
Cluster 3, which has a profile which least matches the Contingent Variables only 20% of
companies which had rejected ABC indicated “Technical Issues” as a reason for rejection but
80% of these rejecting companies indicated “perceived Unsuitability” as a reason, citing such
specific issues as “small percentage of overhead costs” and “ABC is not relevant to our
business”. This analysis yields two major contributions. Firstly, there are indeed two set of
factors interacting to contribute to low ABC adoption rates. Companies whose profile does
not match the Contingent Variables reject ABC on the general ground of perceived
unsuitability of the system. Companies whose profile matches the Contingency Variables cite
“technical Issues” i.e. a Barrier, as the reason for rejection. Secondly the results clearly
indicate that of the three types of Barriers i.e. Technical, Behavioural and Systems it is the
Technical Issues which are most influential in contributing to ABC systems non adoption.

313
12.4 Suggestions for Future Research Given that this research has established the significance of technical issues in ABC adoption,
it is recommended that further empirical research should be conducted using a case studies
approach both within companies that have already implemented ABC, and companies which
have rejected its implementation. As a research tool the case study focuses on understanding
the dynamics present in a real life setting. The approach can be based on either single or
multiple case study designs reflecting different design situations (Yin 1994).
In-depth interviews and participant observation could be used to investigate more fully the
current practice among Irish companies that have implemented ABC system.
The following possibilities and suggestions provide possible avenues for further research:
Initially, case studies should be conducted in companies that have adopted ABC, posing the
following question:
How are the technical difficulties addressed? The technical difficulties being addressed are
those identified in this study, as being of particular significance i.e.
(i) Identifying the major activities that take place in an organisation
(ii) Assigning resources to those activities
(iii) Aggregating activities to create cost pools/ activity centres
(iv) Determining the cost drivers for each activity
(v) Assigning the cost of activities to cost objects
The research question could be divided into a series of questions relating to each of the
difficulties. In order to fully understand how the difficulties were overcome, it would be
likely beneficial to address the following questions:
(i) What did they (the companies) do?

314
(ii) Why did they do it in that particular way?
(iii) How did they go about doing it?
(iv) Why did they choose that particular method of doing it?
In addition, given that there are likely alternative approaches to addressing and resolving the
technical difficulties, it may will be beneficial to seek to capture the experience of the
companies by posing a further two questions, as follows.
(v) How satisfied are they with the results of there actions?
(vi) How would they change the approach, if provided with such an opportunity?
12.5 Closing Remarks In closing this work I shall state what at the present time it seems an important general
conclusion which may be drawn. The conclusion to which I would especially invite attention
is the following: in the adoption of ABC, it is likely that two sets of variables are at work -
the contingency factors and the company’s ability to address and overcome the barriers and
difficulties associated with ABC implementation. Even though the statistical results of this
study show a strong significant association between contingency factors and the adoption of
ABC, the contingent factors alone do not of themselves adequately explain the actual take up
of ABC systems. Moreover, the results show that two companies which have similar
characteristics with regard to the contingent factors can achieve different decisions with
regard to ABC adoption, due to their differing abilities or willingness to address the issues
relating to implementation. The results also show that technical issues are the most common
variables acting against ABC adoption, both within companies which have rejected and those
which are actively considering its adoption. Therefore, it can be concluded that it is not only

315
behavioural issues as suggested by the extant management accounting literature which
influence ABC adoption, but that technical issues are highly significant. It is hoped that this
result will contribute to a fruitful development of knowledge, both in terms of theory
construction and practical implementation.

316
13. BIBLIOGRAPHY Abed Al-Nasser, A., and Wei, L., (2008). Why Did ABC Fail at the bank of China?. Management Accounting Quarterly, spring 2008, Vol.9, No.3, pp.7-19. Abernethy, M., Lillis, A., Brownell, P. and Carter, P., (2001). Product Diversity and Costing System Design Choice: Field Study Evidence, Management Accounting Research, Vol.12, pp.261-279. Alder, R. W., (1999). Management Accounting: Making it World Class, Butterworth- Heinmann, Oxford. Alder, R.W., Everett, A.M., and Waldron, M., (2000). Advanced Management Accounting Techniques in Manufacturing: Utilization, Benefits, and Barriers to Implementation, Accounting Forum, Vol.24, No.2, June, pp.131-148. Aldenderfer, M., and Blashfield, R., (1984). Cluster Analysis: A sage University Paper, Newbury Park. Anderson, S.W., (1995). A Framework for Assessing Cost Management Systems Change: The Case of Activity-Based Costing Implementation at General Motors 1986- 1993, Journal of Management Accounting Research, Vol.7, fall, pp.1-51. Anderson, S.W., Hesford, J.W., and Young, S.M., (2002). Factors Influencing the Performance of Activity-Based Costing Teams: A Field Study of ABC model development time in the automobile Industry, Accounting, Organizations and Society, Vol.27. pp.195-211. Anderson, S.W., and Young, S.M., (1999). The Impact of Contextual and Process Factors on the Evaluation of Activity-Based Costing Systems, Accounting, Organizations and Society, Vol.24, pp.525-559. Andrade, M., Pessauha, R., Espozel, A., Maia, l. and Qassim, R., (1999). Activity-Based Costing for Production Learning, International Journal of Production Economics, Vol.62. pp.175-180. Armitage, H., and Nicholson, R., (1993). Activity-Based Costing: A survey of Canadian Practice, CMA Magazine, March, p.22.
Ashton, D., Hopper, T., and Scapens, R., (1995). Issues in Management Accounting, 2nd Edition, Prentice Hall. Babad, Y. M., and Balachandran, B., (1993). Cost driver optimisation in activity-based costing. The Accounting Review. Vol.68, No.3. pp. 563-575.

317
Babbie, E., Halley, F., and Zaino, J., (2003). Adventures in social research: data analysis using SPSS 11.0/11.5 for windows. Thousand Oaks: pin forge press. Baird, K.M., Harrison, G.L., and Reeve, R.C., (2004). Adoption of Activity Management Practices: a note on the extent of adoption and the influence of organizational and cultural factors, Management Accounting Research, Vol.15. Pp.383-399. Bailey, J., (1991). Implementation of Activity-Based Costing Systems by UK Companies, Management Accounting, February, pp.30-32. Berliner, C. and Brimson, J.A., (1988). Cost Management for Today’s Manufacturing: The CAM-I Conceptual Design, Harvard Business Scholl press, Boston, Mass. Bhimani, A., and Pigott, D., (1992). Implementing ABC: A Case study of Organisational and Behavioural Consequences, Management Accounting Research, Vol.3, pp.119-132. Bjornenak, T., (1997). Diffusion and accounting: the case of ABC in Norway, Management Accounting Research, 8, pp 3-17. Booth, P., and Giacobbe, F., (1997). Activity-Based Costing in Australian Manufacturing firms: Key Survey Findings, Management Accounting Issues Report by the Management Accounting Centre of Excellence of ASCPA, No.5, March, pp.1-6. Bourque, L., and Fielder, E., (1995). How to Conduct Self-Administered and Mail Surveys, Sage Publications, Thousand Oaks. Brace, N., Kemp, R., and Snelgar, R., (2003). SPSS for psychologists: a guide to data analysis using SPSS for windows. Basingstoke: Macmillan. Briers, M., and Chua, W.F., (2001). The Role of Actor-Networks and Boundary Objects in Management Accounting Change: A field Study of an Implementation of Activity- Based Costing, Accounting Organizations and Society, Vol.26, pp.237- 269. Brimson, J., and Fraser, R., (1991). The Key Features of ABB, Management Accounting (UK), January, pp.42-43. Brown, D., Booth, P., and Giacobbe, F., (2004). Technological and Organizational influences on the adoption of Activity-Based Costing in Australia, Accounting and Finance, Vol.44, No.3, pp.329-356. Bryman, A., and Cramer, D., (2001). Quantitative data analysis for social scientist. Rout ledge. Burns, T., and Stalker, G.M., (1961). The management of Innovation, London: Taristock.

318
Burns, W.J., and Waterhouse, J.H., (1975). Budgetary Control and Organization Structure. Journal of Accounting Research (autumn, 1975), pp.177-203.
Burrell, G., and Morgan, G., (1979). Sociological Paradigms and Organisational Analysis, 1st Edition, Heinemann, London.
Cassell, C., and Symon, G., (1994). Qualitative Methods and Analysis in Organizational Research: A practical Guide, London, Sage. Chapman, C., (1997). Reflections on a Contingent View of Accounting, Accounting Organizations and Society, Vol.22, pp.189-205. Chenhall, R.H., (2003). Management control systems design within its organizational context: findings from contingency-based research and directions for the future. Accounting Organizations and Society 28, 127-168. Chenhall, R. H., and Langfield-Smith, K., (1998). The Relationship between Strategic
Priorities, Management Techniques and Management Accounting: An Empirical Investigation using A System Approach. Accounting, Organisations and Society, Vol.23, No.3, pp. 243-264.
Chenhall, R.H., and Langfield-Smith, K., (1998). Adoption and Benefits of Management Accounting Practices: An Australian Study, Management Accounting Research, Vol.9, pp.1-19.
Chenhall, R.H., and Morris, D., (1986). The Impact of Structure, Environment, and Interdependence on the Perceived Usefulness of Management Accounting Systems. The Accounting Review, Vol. 61, No.1, pp.16-20.
Chongruksut, W., (2002). The Adoption of activity-based costing in Thailand, Victoria university, Thailand. Chung, L.H., Schoch, H.P., and Teoh, H.Y., (1997). Activity-Based Costing in Singapore: A Synthesis of Evidence and Evaluation, Accounting Research Journal, Vol.10, No.2, pp.125-141. Cinquini, L., Collini, P., Marelli, A., Quagli, A., and Silvi, R., (1999). A Survey on Cost
Accounting Practices in Italian Large and Medium size Manufacturing Firms, The 22nd annual Congress of the European Accounting Association, Bordeaux, France.
CIMA, (1996). Management Accounting Official Terminology, The Chartered Institute of
Management Accountants, 63 Portland Place, London W1N 4AB. Clarke, P., (1992). Management Accounting practices in Irish manufacturing businesses: A pilot study, Irish Accounting and Finance Association Proceedings, 17-34.
319
Clarke, P., (1997). Management Accounting practices in large Irish manufacturing firms, IBAR-Irish Business and Administrative Research, volume 18, pp 136-152. Clarke, P., Hill, N., and Stevens, K., (1999). Activity-Based Costing in Ireland: Barriers to and Opportunities for, change. Critical perspectives on Accounting, 10, pp 443-468. Cobb, I., Innes, J., & Mitchell, F., (1992). Activity Based Costing: problems in Practice, The Chartered Institute of management Accountants, first Edition. Cohen, S., Venieris, G., and Kaimenak, E., (2005). ABC: Adopters, Supporters, Deniers and Unawares, Managerial Auditing Journal, Vol.20, No.9, pp:981-1000. Cokins, G., (1999). Using ABC to become ABM, Journal of Cost Management, Vol.13, No.1, pp: 29-35. Cooper, R., (1987). Does your company need a new Cost System? Journal of cost Management, pp: 45-49. Cooper, R., (1988a). The Rise of Activity-Based Costing – Part one: What is an Activity- Based Costing? Journal of Cost Management, Vol.2, pp: 45-54.
Cooper, R., (1988b). The Rise of Activity-Based Costing—Part two: When Do I Need an Activity-Based Cost System? Journal of Cost Management, pp. 41-48.
Cooper, R., (1989). You Need a New Cost System when…., Harvard Business Review. pp: 77-82. Cooper, R., (1990). Five Steps to ABC System Design, Accountancy, Nov 1990, pp: 78- 81. Cooper, R., and Kaplan, R.S., (1987). How Cost Accounting Systematically Distorts Product Costs, Harvard Business schools Press: pp 204-228. Cooper, R., and Kaplan, R. S., (1988a). How Cost Accounting Distorts Product Costs, Management Accounting, 8, 3, pp. 20-7. Cooper, R. and Kaplan, R.S., (1988b). Measure Costs Right: Make the Right Decisions. Harvard Business Review. Pp 96-103.
Cooper, R., and Kaplan, R. S., (1991). Profit Priorities from Activity-Based Costing. Harvard Business Review, pp. 130-135. Cooper, R., and Kaplan, R. S., (1998). The Design of management Systems: Text and Cases. Second Edition. Prentice Hall International, INC.

320
Cooper, R., Kaplan, R. S., Lawrence, S., Morrissey, E., and Oehm, R.M., (1992). Implementing Activity-Based Costing Management: Moving from Analysis to Action, IMA, Montvale. Corter, J.E. (1996). Tree models of similarity and association, Sage, Thousand, Oaks, CA. Cotton, W.D.J., Jackman, S.M. and Brown, R.A. (2003). Note on a New Zealand Replication of the Innes et al. UK Activity-Based Costing Survey, Management Accounting Research, Vol. 14, No.1, pp.67-72. Creswell, J.W, (2003). Research design: Qualitative, Questionnaire and Mixed Methods Approaches, Thousand Oaks, CA: Sage.
Daft, R.L and Macintosh, N.B. (1978). A new Approach to Design and Use of Management Information. California Management Review, 2, 82-92.
Damanpour, F. (1996). Organizational Complexity and Innovation: Developing and Testing Multiple Contingency Models, Management Science, Vol.42, No.5. Drazin, R. and Van de Van, A. (1985). Alternative Forms of Fit in Contingency Theory, Administrative Science Quarterly, Vol.30, pp.514-539. Drury, C., (1996). Management and Cost accounting. Fourth Edition. International Thomson Business Press. Drury, C. (2000). Management & Cost Accounting, Fifth Edition, Thomson Learning. Drury, C. (2001). Management Accounting for Business Decisions. Second Edition, Thomson Learning.
Drury, C., (2004). Management and Accounting. Sixth Edition, Thomson.
Drury, C., Braund, S., Obdorne, P., and Mike., (1993). A survey of Management Accounting Practices in UK Manufacturing Companies. The Chartered Association of Certified Accountants (ACCA). Drury, C., Lamminmaki, D., (2001). A comparison of New Zealand and British product costing practices, The International Journal of Accounting, 36, pp 329-347.
Dugdale, D., (1990). The Uses of Activity-Based Costing, Management Accounting, October, pp:36-38.
Dunk, A., (1989). Management Accounting Lag, ABACUS, Vol.25, No.2.

321
Eden, R., Lay, C., and Maingot, M. (2004). Case Studies of ABC adoption in Canada, Paper presented at the IFA, Belfast, April, 2004.
Emmanuel, C., Otley, D., and Merchant, K., (1990). Accounting for management Control, second edition, Chapman & Hall.
Euske, K.J., and Alan, V., (2007). “Enhancing the ABC Cross”. Management Accounting Quarterly, Summer 2007, Vol.8, No.4, pp.48-64. Everett, B., Landau, S., and Leese, M., (2001). Cluster analysis, 4th Edition. London: Edward Arnold Publishers Ltd. Field, A., (2000). Discovering statistics using SPSS for windows: advanced techniques for the beginner. London, Thousand Oaks: sage publications. Field, A., (2005). Discovering statistics using SPSS, 2nd edition. London: Sage.
Fink, A., (1995). How to Analyze Survey Data, Sage Publications, Thousand Oaks.
Fisher, J., (1995). Contingency-based Research on management control Systems: Categorization by level of complexity. Journal of Accounting Literature, Vol. 14, pp.24-53.
Fisher, J., and Govindarajan, V., (1993). Incentive Compensation Design, Strategic Business Unit Mission, and Competitive Strategy, Journal of Management Accounting Research, Vol.5, pp.129-144. Flamholtz, E., (1983). Accounting Budgeting and Control Systems in Their Organizational Context: Theoretical and Empirical Perspectives, Accounting, Organizations and Society, Vol.8, pp.153-169. Foster, G., and Gupta, M., (1990). Activity Accounting: An Electronics industry implementation, In R. Kaplan, ed., Measures for Manufacturing Excellence, Harvard Business School Press. Foster, G., and Swenson, D., (1997). Measuring the Success of Activity-Based Cost Management and Its Determinants, Journal of Management Accounting Research, Vol.9. pp.109-141.
Francis, G., (2001). Introduction to SPSS for Widows, 3rd edition, Pearson Education Australia, Sydney.
Friedman, A., and Lyne, S., (1997). Activity-Based Techniques and the Death of the Beancounter, The European Accounting Review, Vol.6, pp.19-44.

322
Friedman, A. and Lyne, S. (1999). Success and Failure of Activity-Based Techniques: A Long term Perspective 1st Edition, CIMA Publishing.
Gerdin, J., (2005). The impact of departmental interdependencies and management accounting system use on subunit performance, Orebro university-Jan Wallander Och-Tom Hedelius Foundation.
Gerdin, J., and Greve, J., (2004). Forms of Contingency Fit in Management Accounting Research – a Critical Review, Accounting, Organizations and Society, Vol.29, pp.303-326.
Gernon, H., and Wallace, R.S.O., (1995). International Accounting Research: A Review of its Ecology, Contending Theories and Methodologies, Journal of Accounting Literature, Vol.14, pp.54-106.
Ginzberg, M., (1980). An Organizational Contingencies View of Accounting and Information Systems Implementation, Accounting, Organizations and Society, Vol.5, pp.369-382.
Gioia, D., and Pitre, E., (1990). Multiparadigm Perspectives on Theory Building, Academy of Management Review, Vol.15, pp.584-622.
Gordon, L.A. and Miller, D., (1976). A contingency framework for the design of accounting information systems, Accounting organizations and Society, Vol. 1, no.1, pp.59-69.
Gordon, L.A., and Narayanan, V.K., (1984). Management Accounting systems, Perceived Environmental Uncertainty and Organization Structure: An Empirical Investigation, Accounting, Organizations and Society, Vol.9, No.1, pp.33-47.
Gosselin, M., (1997). The Effect of Strategy and Organizational Structure on the Adoption and Implementation of Activity-Based Costing, Accounting, Organizations and Society, Vol.22, pp.105-122.
Groot, T. L., (1999). “Activity-Based Costing in US and Dutch Food Companies”. Advances in Management Accounting, Volume 7, pp.47-64. Govindarajan, V., (1984). Appropriateness of Accounting Data in Performance Evaluation: An Empirical Examination of Environmental Uncertainty as an Intervening Variable, Accounting, Organizations and Society, vol.9, pp.125-135. Govindarajan, V., and Fisher, J., (1990). Impact of Output Verses Behaviour Control and Resource Sharing on Performance: Strategy as a Mediating variable, Academy of Management Journal, Vol.33, pp.259-285.

323
Govindarajan, V. and Gupta, A., (1985). Linking Control Systems to Business Unit Strategy: Impact on Performance , Accounting, Organizations and Society, Vol.10, pp. 51-66. Gunasekaran, A., Marri, H. B., & Grieve, R. J., (1999) “Justification and Implementation of Activity-Based Costing in small and medium-sized enterprises”, Logistics International Management, Volume 12, Number 5, pp 386-94.
Gunasekaran, A., and Sarhadi, M., (1998). Implementation of Activity-Based Costing in Manufacturing, International Journal of Production Economics, Vol.56-57, pp.231-242.
Haas, M. and Kleingeld, A., (1999). Multilevel Design of Performance Measurement Systems: Enhancing Strategic Dialogue Throughout the Organization, Management Accounting Research, Vol.10. Pp.233-261. Hair, J., Anderson, R., Tatham, R., and Black, W., (1998). Multivariate Data Analysis. Fifth Edition, Prentice Hall, New Jersey. Hart, A., (2001). Mann-Whitney test is not just a test of medians: differences in spread can be important, BMJ. Hansen, D. R., and Mowen, M., (2000), “Management Accounting”. 5th Edition. International Thomson Publishing, (ITP). Henri, J.F., (2006). Organizational Culture and Performance Measurement Systems, Accounting, Organizations and Society, Vol.31, pp.77-103. Hicks, D. T., (1999). Activity-Based Costing: Making it Work for Small and Mid-Sized Companies. John Wiley and Sons, Inc. Second Edition. Homburg, C., (2001). A note on optimal cost driver selection in ABC. Management Accounting Research, Volume 12, pp. 197-205. Hoque, Z., and James, W., (2000). Linking Balanced Scorecard Measures to size Market Factors: Impact on Organisational Performance, Journal of Management Accounting Research, Vol.12, pp.1-17. Horngren, C. T., (1995). Management Accounting: This Century and Beyond, Management Accounting Research, Vol.6, PP.281-286. Horngren, C. T., Datar, S. M., and Foster, G., (1997). Cost Accounting: A managerial Emphasis, 9th Edition, Prentice Hall, International, Inc.

324
Horngren, C. T., Datar, S. M., and Foster, G., (2003). Cost Accounting: A managerial Emphasis. Eleventh Edition, Prentice Hall. Hosmer, D., and Lemeshow., (2000). Applied Logistic Regression, Wiley.
Hussey, J. and Hussey, R. (1997). Business Research: A Practical Guide for Undergraduate and Postgraduate Students, 1st Edition, Macmillan Business, London.
Innes, J., and Mitchell, F., (1990). Activity-Based Costing: A Review with case studies. London: The Chartered Institute of Management Accounting. Innes, J., and Mitchell, F., (1991). A Survey of CIMA members, Management Accounting (UK), Vol.69, October, pp.28-30. Innes, J., and Mitchell, F., (1992), Activity-Based Costing: Problems in Practice. First Edition. The Chartered Institute of Management Accounting Innes, J., and Mitchell, F., (1993). Activity-Based Cost Management – A case Study of Development and Implementation. CIMA. Innes, J., and Mitchell, F., (1995). A Survey of Activity-Based Costing in the UK’s largest companies, Management Accounting Research, Vol.6, No.2, pp: 137-153. Innes, J., and Mitchell, F., (1998). A practical Guide to Activity-Based Costing. First Edition. The Chartered Institute of Management Accounting (CIMA). Innes, j., Mitchell, F., and Sinclair, D., (2000). Activity-based costing in the UK’s largest companies: A comparison of 1994 and 1999 survey results. Management Accounting Research, 11, pp.349-362. Ittner, C. D., Larcker, D, F., & Randall, T., (1997). The activity-based cost hierarchy production policies and firm profitability. JMAR, vol.9.
Jackson, W., (1995), “Methods: Doing Social Research”, Prentice-hall, Canada Inc., Scarborough, Ontario.
Johnson, H.T., (1990). “Beyond Product Costing: A Challenge to Cost Management’s Conventional Wisdom”, Journal of Cost Management, Vol.4, Issue.3, Fall, pp:15- 21.
Johnson, H., and Kaplan, R., (1987), “Relevance Lost: The Rise and Fall of Management Accounting”, Boston, Massachusetts: Harvard Business School press.
Julie, L., and Audrey, T., (2007). “ Environmental Consideration in Product Mix Decisions Using ABC and TOC”. Management Accounting Quarerly, Fall 2007, vol.9, No.1, pp. 13-25.

325
Kalagnanam, S., and Lindsay, R., (1998), “The use of Organic Models of Control in JIT Firms: Generalizing Woodward’s Findings to Modern Manufacturing Practices”, Accounting, Organizations and Society, Vol.24, pp.1-30.
Kaplan, R.S., (1988), “One Cost System Isn’t Enough”, Harvard Business Review, January-February, pp.61-66.
Kaplan, R.S., (1990), “Measures for Manufacturing Excellence”, Harvard Business School Press, Boston.
Kaplan. R.S., (1992), “In Defence of Activity-Based Cost Management”, Management Accounting, November, pp.58-63.
Kaplan, R.S., (1984), “The Evolution of Management Accounting”, the Accounting Review, Vol.LIX, pp: 390-418.
Kaplan, R. S., and Atkinson, A. A., (1998), “Advanced Management Accounting”. Third Edition, Prentice Hall International, INC.
Kennedy, T., and Affleck-Graves, J., (2001), “The Impact of Activity-Based Costing Techniques on Firm Performance”, Journal of Management Accounting Research, Vol.13, pp: 19-45.
Khandwalla, P.N., (1972), “The Effect of Different Types of Competition on the Use of Management Controls”. Journal of Accounting Research, vol.10 issues 2, pp 275- 285.
Khandwalla, P.N., (1977). The Design of Organizations, Harcourt Brace Jovanovich, New York.
Kidd, P., (1994). Agile Manufacturing-Forging New Frontiers. Addison-Wesley Publishing Company.
Kip, K., and Augustin, S., (2007). Comaring U.S. and German Cost Accounting Methods. Management Accounting Quarterly, Spring 2007, Vol.8, No.3, pp.01-14.
Kock, S., (1995), “Implementation Considerations for ABC Systems in Service Firms: The Unavoidable Challenge”, Management Decision, Vol.33, pp: 57- 63.
Krumwiede, K.R., (1998), “The Implementation Stages of Activity-Based Costing and the Impact of Contextual and Organizational Factors”, Journal of Management Accounting Research, Vol.10, pp.238-277. Krumwiede, K.R., and Roth, H.P., (1997), “Implementing Information Technology Innovations: The Activity-Based Costing Example”, S.A.M. Advanced Management Journal, Vol.62, Issue.4, Fall, pp.4-13.

326
Lawrence, P.R., and Lorsch, J.W., (1967), “Organization and Environment: Managing Differentiation and Integration”. Richard D. Irwin, Inc. Homewood, I llinois. Lin, B., Collins, J., Su, R. K., (2001), “Supply Chain Costing: an activity-based perspective”, International Journal of Physical Distribution & Logistics Management, Vol. 31 Number 10, pp. 702-713. Lukka, K., and Granlund, M., (2002), “The Fragmented Communication Structure within the Accounting Academia: The Case of Activity-Based Costing Research Genres”, Accounting, Organisation and Society, Vol.27, pp: 165-190.
Macarthur, J., (2006), “Cultural Influences on German versus U.S. Management Accounting Practices”, Management Accounting Quarterly, winter Vol.7, No.2.
Macintosh, N., and Daft, R., (1987), “Management Control Systems and Departmental Interdependencies: An Empirical Study”, Accounting, Organization and Society, Vol.12, pp.49-61.
Manalo, M.V., (2004), “Activity based costing vs. traditional cost accounting systems among Top 500 corporations in the Philippines”, De La Salle University- Manila, Philippines.
McGowan, A.S., and Klammer, T.P., (1997), “Satisfaction with Activity-Based Costing Management Implementation”, Journal of Management Accounting Research, Vol.9, pp.217-237.
Menard, S, W., (2001), “Applied Logistic Regression Analysis (Quantitative Applications in the Social Sciences)”, Second Edition, Sage publications, INC.
Merchant, K. A., (1981), “The design of the corporate budgeting system: Influences on managerial behavior and performance”. The Accounting Review, Vol. LVI, No. 4, pp. 813-828.
Merchant, K. A., (1985), “Organizational Control and Discretionary Program Decision Making: A Field Study”, Accounting, Organizations and Society, Vol.10, pp.67- 85.
Miles, R., and Snow, C., (1978), “Organizational Strategy, Structure, and Process”, McGraw Hill: New York.
Mitchell, F., (1994), “A Commentary on the Applications of Activity-Based Costing”, Management Accounting Research, Vol.5, pp.261-277.
Mishra, B., and Vaysman, I., (2001) “Cost-system choice and incentives – Traditional Vs Activity-based costing”. Journal of Accounting Research. Vol. 39, No.3. pp: 619- 641.

327
Morrow, M., (1992), “Activity-Based Management: New Approaches to Measuring Performance and Managing Costs”, Woodhead-Faulkner, New York. Morrow, M., and Ashworth, G. (1994), “An Evolving Framework for Activity-Based Approaches”, management Accounting (UK), February, pp.20-25. Nguyen, H.V., and Brooks, A., (1997), “An Empirical Investigation of Adoption Issues Relating to Activity-Based Costing”, Asian Review of Accounting, Vol.5, No.1, pp.1-18. Nicholls, B., (1992). ABC in the UK: A status Report, Management Accounting, May, pp.22-23, 28. Ning, Y., (2005). The Development of Costing Systems: A historical Perspective”, Journal of Modern Accounting and Auditing, Vol.1, No.2, pp: 16-29. Norris, G., (1997). The Formation of Managers’ Views of ABC and Their Impact on the Outcome of its Use: A grounded Theory Case Study, Accounting Research Journal, Vol.10, No.2, pp.180-200. Norusis, M., (2000). SPSS 10.0 guide to data analysis, Prentice Hall.
O’Dea, T., and Clarke, P., (1994). Management Accounting Systems: Some Field Evidence from sixteen Multinational Companies in Ireland, The Irish Accounting Review, Vol.1, No.1, pp.199-216. O’Guin, M.C. (1991). The complete guide to activity-based costing. Englewood Cliffs: Prentice Hall.
O’Reilly, C.A., Chatman, J., and Caldwell, D.F., (1991). People and Organizational Culture: a profit comparison approach to assessing person-organization fit, Acod. Mange. J. September, pp.487-516.
Otley, D.T., (1978). Budget use and managerial performance. Journal of Accounting Research, 16 (1), pp.122-149.
Otley, D.T., (1980). The contingency theory of management accounting: Achievement and prognosis. Accounting organizations and Society, Vol. 5, no.4, pp.413-428.
Otley, D.T., (1994). Management Control in Contemporary Organizations: Towards a Wider Framework, Management Accounting Research, Vol.5, pp:289-299. Pallant, J., (2001). SPSS Survival Manual. Milton Keynes: Open University press. Perrow, C., (1970). Organizational Analysis: A sociological view, London, Tavistock.

328
Peter, C.B., (1998). National Culture and Activity-Based Costing System: a note, Management Accounting Research, Vol.9, pp.241-260. Philip, B., and Mandi, M., (2008). Inside Activity-Based Cost Systems (ABC). Industrial Management, May 2008, Vol.50, Issue.3, pp. 17-31. Pierce, B., and Brown, R., (2004). An Empirical study of Activity-Based systems in Ireland, The Irish Accounting Review, Vol. 11 Number 1, pp33-55. Pohlen, T.L and Londe, B.J., (1998). Activity-Based Costing in Logistics, Journal of Business Logistics, Vol.15, No.2, pp.11-12. Porter, M., (1980). Competitive Strategy, The Free Press, New York. Porter, M., (1985). Competitive Advantage: Creating and Sustaining Superior Performance, The Free Press, New York. Pugh, D.S., Hickson, D.J., Hinigs, C.R. and Turner, C., (1969). Dimensions of Organization Structure, Administrative Science Quarterly. June, pp.65-105.
Rayburn, J.M., and Rayburn, L.G., (1991). Contingency Theory and the Impact of New accounting technology in Uncertain Hospital Environments. Accounting Auditing & Accountability Journal, vol. 4 no.2, pp.55-75.
Sanders, M., Berry, D., and Mitchell, S., (2000). Understanding Multivariate Research: A Primer For Beginning Social Scientist, Boulder: Westview Press. Sartorius, k., Eitzen, C., and Kamala, P., (2007). The design and implementation of
Activity-Based Costing (ABC): a South African Survey. Meditari Accountancy Research, Vol.15. No.2, pp.01-22.
Scapens, R. W., (1991). Management Accounting: A Review of Recent Developments”. Second Edition. Macmillan Education LTD.
Sekaran, U., (2000) Research methods for business: a skill building approach”, Chichester: Wiley.
Sharma, S.C. (1996). Applied Multivariate Techniques, New York; Chichester: Wiley.
Sharman, P., (1994). Activity and Driver Analysis to Implement ABC. Society of Management Accounting of Canada. Pp. 13-16. Shields, M.D. (1995). An Empirical Analysis of Firms: Implementation Experiences with Activity-Based Costing, Journal of Management Accounting Research, Vol.7, fall, pp.148-164.

329
Shields, M.D. and McEwen, M., (1996). Implementing Activity-Based Costing systems successfully, Journal of Cost management, Vol.9, Issue.4, winter, pp.15-22. Shields, M.D. and Young, S.M., (1989). A Behavioural Model for Implementing Cost management Systems, Journal of Cost Management, winter, pp.17-27. Shim, E. and Stagliano, A.J. (1997). A Survey of US. Manufacturers on Implementation of ABC, Journal of Cost management, Vol.11, Issue.2, March-April, pp.39-41.
Siegel, A., (1996). Statistics and data analysis: an introduction, Chichester: Niley.
Siegel, S. and Castellan, N.J. (1988). Nonparametric Statistics for the Behavioural Sciences, New York: McGraw-Hill.
Sim, K., and Killough, L., (1998). The Performance Effects of Complementarities Between Manufacturing Practices and Management Accounting Systems”, Journal of Management Accounting Research, Vol.10, pp.325-346.
Soin, K., Seal, W. and Cullen, J. (2002). ABC and Organizational Change: An Institutional Perspective, Management Accounting Research, Vol.13, pp.249- 271.
Taylor, L. J., (2002). Activity-Based Costing: Why your company can’t succeed without it. AFP Exchange, Volume 4, Issue 4, pp.50-53.
Thomas, A.P., (1991). Towards a Contingency theory of Corporate Financial Reporting Systems”. Accounting Auditing & Accountability Journal, vol. 4, No.4, pp 40-57.
Tiessen, P., and J. H. Waterhouse., (1983). Towards a descriptive theory of management accounting. Accounting, Organizations and Society 8(2-3): 251-267.
Troxel, R.B. and Weber, M.G., (1990). The Evolution of Activity-Based Costing. Journal of Cost Management for the Manufacturing Industry. 14-22. Turney, P. B.B., (1996). Activity-Based Costing: The Performance Breakthrough. London. The Chartered Institute of Management Accounting.
Van Nguyen, H., and Brooks, A., (1997). An empirical investigation of adoption issues relating to activity-based costing, Asian Accounting Review, Vol.5, pp.1-18.
Venkatraman, N., (1989) Strategic Orientation of Business Enterprises: The Construct Dimensionality and Measurement, Management Science, Vol. 35, pp.942-962.
Woodward, J., (1965). Industrial Organization: Theory and Practices, Oxford University Press, Oxford.

330
Young, S., and Selto, F., (1991). New Manufacturing Practices and Cost Management: A Review of the Literature and Directions for Research, Journal of Accounting Literature, Vol. 10, pp: 265-298.

331
Appendix A
Re: Implementation of Activity-Based Costing Systems Dear The area of Activity-Based Costing (ABC) appears to offer significant benefits to those companies which have adopted it. However, there is also evidence that the introduction of the system poses significant difficulties. In an attempt to investigate these issues, I am conducting a survey of the top 1,000 Irish companies and would very much appreciate if you could participate in the study by completing and returning the enclosed questionnaire. The questionnaire seeks to establish the extent to which ABC practices have been adopted by Irish companies and the implementation problems that they have encountered or identified. The results of the survey will be used in an aggregated form only. Individual responses are anonymous and confidential. The survey forms part of my Ph.D. work which I am undertaking in the school of Accounting and Finance at the Dublin Institute of Technology. It is also hoped that aspects of the result will be published in aggregate in various professional and academic journals. Should you have any quires regarding the research or the questionnaire please contact my supervisor Dr. Tadhg Barrett (E-mail: [email protected]) or myself (E-mail: [email protected] or phone 086-3200514). Your participation in this survey would be very much appreciated, and I look forward to receiving your completed questionnaire soon. Please send the completed questionnaire by post to my collection base at Room 3048, DIT, Aungier St., Dublin 2. An addressed envelope is enclosed to facilitate your response. Thank you in anticipation of your co-operation. ______________________________________ Fawzi Abusalama

332
Section 1: Organisational and Environmental Characteristics
1. Please indicate, by ticking the appropriate box, the industrial sector in which your company primarily operates:
(a) Business services
(b) Manufacturing
(c) Transport and distribution
(d) Retail trade
(e) Financial services
(f) Exporter
(g) Importer
(h) Other (please specify __________________________________ )
2. Please indicate the number of employees in your company:
Less than 100 501-1,000 100-250 1,001-2,000 251-500 More than 2,000
3. Please indicate the annual turnover of your company:
Less than €5 million Between €50 to €100 million Between €5 to €25 million Between €100 to €250 million Between €25 to €50 million More than €250 million
4. Is your company a wholly Irish-owned company?
a) Yes
b) No
If no, please state the dominant nationality of the ownership of your company.
_________________________________________________
5. Please indicate if your company is public or private by ticking the appropriate box: Public Private

333
6. Please rank from 1 to 6 the relative importance of the following factors in the marketing
strategy of your company (where 1= most important, 2= second most important, etc)
Factors Ranking
a Price b Quality c Range of products/ services d Customer service e Product/service innovation f Marketing and Promotional activities
7. How many products/ services does your company provide?
Single product/service 51-100
1-10 101-1000
11-50 More than 1000 product/service
8. Please indicate which of the following accounting and management techniques are utilised
within your organisation?
a) Standard costing b) Job costing c) Process costing d) Budgeting e) Target cost planning f) Payback period g) Cost-Volume-Profit analysis (CVP) h) Return On Investment (ROI) i) Activity-Based Costing (ABC) j) Activity-Based Management ABM) k) Activity Cost Analysis (ACA) l) Balance Scorecard (BCS) m) Net present value (NPV) n) Quality cost analysis (COQ) o) Other techniques utilised _________________________________ _________________________________

334
9. Please indicate the importance of the following objectives in allocating overhead costs, by
circling the appropriate number. Not of Little of medium Very Critically
important importance importance important important
a) Product/ service cost control 1 2 3 4 5
b) Product/ service pricing 1 2 3 4 5
c) External reporting 1 2 3 4 5
d) Production/ service planning 1 2 3 4 5
e) Department evaluation 1 2 3 4 5
f) Managers’ performance 1 2 3 4 5
evaluation
g) Control of cost incidence 1 2 3 4 5
h) Please state any other objectives sought to be achieved by the allocation of
overhead costs _______________________________________________________
_______________________________________________________
10. Please indicate the approximate percentage of your total company cost accounted for by
each of the following categories.
a) Direct material --------- %
b) Direct labour --------- %
c) Production/service overhead --------- %
d) Other --------- %
Total 100 %
11. Over the next five years, how do you expect the proportion of production/ service
overhead costs to total costs to vary in your firm?
a) To increase substantially
b) To increase slightly
c) To be stable
d) To decrease slightly
e) To decrease substantially
f) Do not know

335
12. Below is a list of values that may be used to describe the nature of the work environment in business units. For each item please indicate the extent to which it is valued in your company. Response option:
Not valued Valued to a very at all great extent
Innovation:
a A willingness to experiment 1 2 3 4 5
b Not being constrained by many rules 1 2 3 4 5
c Being quick to take advantage of opportunities 1 2 3 4 5
d Being innovative 1 2 3 4 5
e Risk taking 1 2 3 4 5
Outcome orientation:
a Being competitive 1 2 3 4 5
b Being achievement oriented 1 2 3 4 5
c Having high expectations for performance 1 2 3 4 5
d Being results oriented 1 2 3 4 5
e Being action oriented 1 2 3 4 5

336
Section 2: Activity-Based Costing (ABC) 13. Please indicate how familiar you are with Activity-Based Costing (ABC) systems?
No General Good Extensive Expert Knowledge knowledge knowledge knowledge knowledge
14. Where did you first learn of ABC? a) University b) Professional training c) Seminars or conferences d) In-house training e) Own reading (books, journals and so on) f) Other (please state) _________________________
15. What is the current level of ABC adoption within your organisation? a) Full implementation of ABC b) Implemented ABC in selected areas c) Implemented ABC as a pilot project d) Currently under consideration (please go to question 24) e) Rejected ABC after assessment (please go to question 25) f) No consideration of ABC to date (please go to question 26) 16. When was ABC first introduced into your company? a) Before 1995 b) 1995- 1999 c) 2000- 2004
17. Who initiated ABC adoption within your company?
a) Senior management b) Production managers c) Accounting/ Finance managers d) Marketing managers e) Customer service managers f) Information systems personnel g) Research & development personnel h) Other (please specify) ___________________

337
18. When introducing ABC, did your company initially introduce it:
a) Across the whole organisation
b) In selected areas
19. How much involvement had each of the following categories in the implementation of ABC? Please indicate your response by circling a number for each item. Response option:
Low High involvement involvement
a In-house accountants 1 2 3 4 5
b Information systems personnel 1 2 3 4 5
c External consultants 1 2 3 4 5
d Senior executives 1 2 3 4 5
e Production personnel 1 2 3 4 5
f Sales/marketing personnel 1 2 3 4 5
g Distribution personnel 1 2 3 4 5
h Purchasing/procurement personnel 1 2 3 4 5
i Research & development personnel 1 2 3 4 5
20. Please circle the number which best describes the importance of the following factors in the decision to adopt ABC. Response option:
Not Little Medium Very Critically important important important important important
a Increasing overhead costs 1 2 3 4 5
b Increasing range of product/service 1 2 3 4 5
c Inability of the traditional cost systems to
provide relevant cost information
1 2 3 4 5
d Increasing competition 1 2 3 4 5
e Increasing regulatory environment 1 2 3 4 5
f Please state any other factors which influenced the ABC adoption
____________________________________________________________________________________________________________

338
21. Please circle a number to indicate the level of success you would attribute to the ABC system in your company, in relation to each of the following specified areas of application. Response options: Success Level
Low High a Stock valuation 1 2 3 4 5
b Product/service pricing 1 2 3 4 5
c Output decisions 1 2 3 4 5
d Cost reduction 1 2 3 4 5
e Budgeting 1 2 3 4 5
f New product/service design 1 2 3 4 5
g Customer profitability analysis 1 2 3 4 5
h Value added analysis 1 2 3 4 5
i Cost modelling 1 2 3 4 5
j Outsourcing decisions 1 2 3 4 5
k Process/operating mgt. 1 2 3 4 5
l Restructuring decisions 1 2 3 4 5
m Forecasting 1 2 3 4 5
n Capital investment decisions 1 2 3 4 5
o Performance measures 1 2 3 4 5
p Strategic planning 1 2 3 4 5
q Quality initiative 1 2 3 4 5
r Reward system 1 2 3 4 5
s JIT/speed initiative 1 2 3 4 5

339
22. Please circle a number to indicate the degree of importance you attach to the application
of ABC in the following specified areas.
Response Options:
Importance Low High
a Stock valuation 1 2 3 4 5
b Product/service pricing 1 2 3 4 5
c Output decisions 1 2 3 4 5
d Cost reduction/mgt 1 2 3 4 5
e Budgeting 1 2 3 4 5
f New product/service design 1 2 3 4 5
g Customer profitability analysis 1 2 3 4 5
h Value added analysis 1 2 3 4 5
i Cost modelling 1 2 3 4 5
j Outsourcing decisions 1 2 3 4 5
k Process/operating management 1 2 3 4 5
l Restructuring decisions 1 2 3 4 5
m Forecasting 1 2 3 4 5
n Capital investment decisions 1 2 3 4 5
o Performance measures 1 2 3 4 5
p Strategic planning 1 2 3 4 5
q Quality initiative 1 2 3 4 5
r Reward system 1 2 3 4 5
s JIT/speed initiative 1 2 3 4 5

340
23. In implementing ABC, what was the extent of the difficulties encountered in the following areas? Response options:
Very Relatively Some Quite Very easy easy difficult difficult difficult
a In defining activities 1 2 3 4 5 b In assigning resources to activities 1 2 3 4 5 c In selecting cost drivers 1 2 3 4 5 d In assigning the cost of activities
to cost objects 1 2 3 4 5
e In designing the system 1 2 3 4 5 f Other (please identify the other areas which
were difficult in the implementation of the ABC system)
_________________________________________________________________________________________________________
Please go to page 12.
24. If your company is currently considering the adoption of ABC, please indicate the
factors militating against its adoption.
Please tick those factors which you are consider significantly inhibiting the adoption of ABC.
a) Difficulty in defining activities b) Difficulty in assigning resources to activities c) Difficulty in selecting cost drivers d) Difficulty in assigning cost of activities to cost objects e) Data collection difficulties f) Internal resistance g) High cots of implementing ABC h) Lack of top management support i) Uncertainty of ABC benefits j) Inadequate Computer software k) A higher priority of other changes/ projects. l) Other factors militating against ABC adoption _______________________________________________________________ _______________________________________________________________ Please go to question 27.
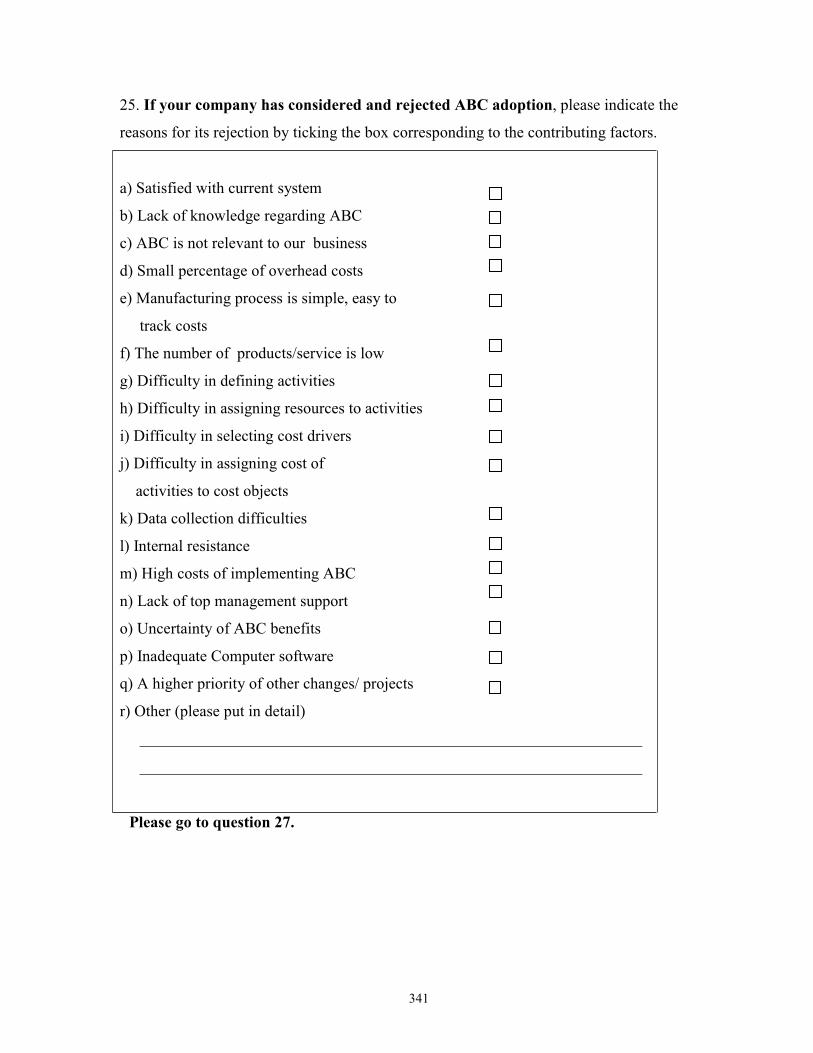
341
25. If your company has considered and rejected ABC adoption, please indicate the
reasons for its rejection by ticking the box corresponding to the contributing factors.
a) Satisfied with current system
b) Lack of knowledge regarding ABC
c) ABC is not relevant to our business
d) Small percentage of overhead costs
e) Manufacturing process is simple, easy to
track costs
f) The number of products/service is low
g) Difficulty in defining activities
h) Difficulty in assigning resources to activities
i) Difficulty in selecting cost drivers
j) Difficulty in assigning cost of
activities to cost objects
k) Data collection difficulties
l) Internal resistance
m) High costs of implementing ABC
n) Lack of top management support
o) Uncertainty of ABC benefits
p) Inadequate Computer software
q) A higher priority of other changes/ projects
r) Other (please put in detail)
_______________________________________________________________
_______________________________________________________________
Please go to question 27.

342
26. If your company has never considered the adoption of ABC, please indicate the
possible reasons for this by ticking the box corresponding to the contributing factors.
a) Satisfied with current system b) Lack of knowledge regarding ABC c) ABC is not relevant to our business d) Small percentage of overhead costs e) Manufacturing/service process is simple, easy to track costs f) The number of products/services is low g) Other factors militating against ABC adoption _______________________________________________________________ _______________________________________________________________
27. In your company, which of the following bases are currently used to allocate overhead
costs to products/ services?
a) Direct labour hours b) Machine hours c) Direct materials costs d) Units of production/ customer service e) Other (please specify)______________________
28. How satisfied are you with your current overhead cost allocations?
a) Very satisfied
b) Reasonably satisfied
c) Needs improvements
d) Dissatisfied.
29. Do you anticipate that your company will adopt ABC in the next five years?
a) Yes
b) No
c) I do not know

343
In order to follow up the various issues raised on this topic and to improve the quality of my
data, I would like to interview some of the respondents to this questionnaire. If you are
interested in this study and willing to be interviewed, please complete the details below.
Company name: ________________________________________
Your name: ____________________________________________
Position in company: ____________________________________
Telephone number: _____________________________________
E-mail Address: ________________________________________
******************************
Thank you for your time and effort. It is very much appreciated

344
(Reminder Letter)
Re: Implementation of Activity-Based Costing Systems Dear, Recently, a questionnaire was sent to you which requested information on the implementation of Activity-Based Costing Systems (ABC). If you have already returned this questionnaire to me, please accept my sincere thanks. If not, I would be very grateful if you could do so at your earliest convenience. It is hoped that the results of the survey will give a broad view of the extent to which ABC practices have been adopted by Irish companies and the implementation problems that have been encountered. If by some chance you did not receive the questionnaire, or it was misplaced, please do not hesitate to contact me at (E-mail: [email protected] or phone 086-3200514). Another questionnaire will be forwarded to you immediately. Thank you in anticipation of your co-operation. ______________________________________ Fawzi Abusalama