barriers to low carbon innovation - university of leeds
TRANSCRIPT

Barriers to low carbon innovation
Dr Jannik Giesekam@jannikgiesekam
Research Fellow in Energy, Materials and Climate Policy University of Leeds
30/11/16CIRIA, London These slides are available from www.jannikgiesekam.co.uk/research
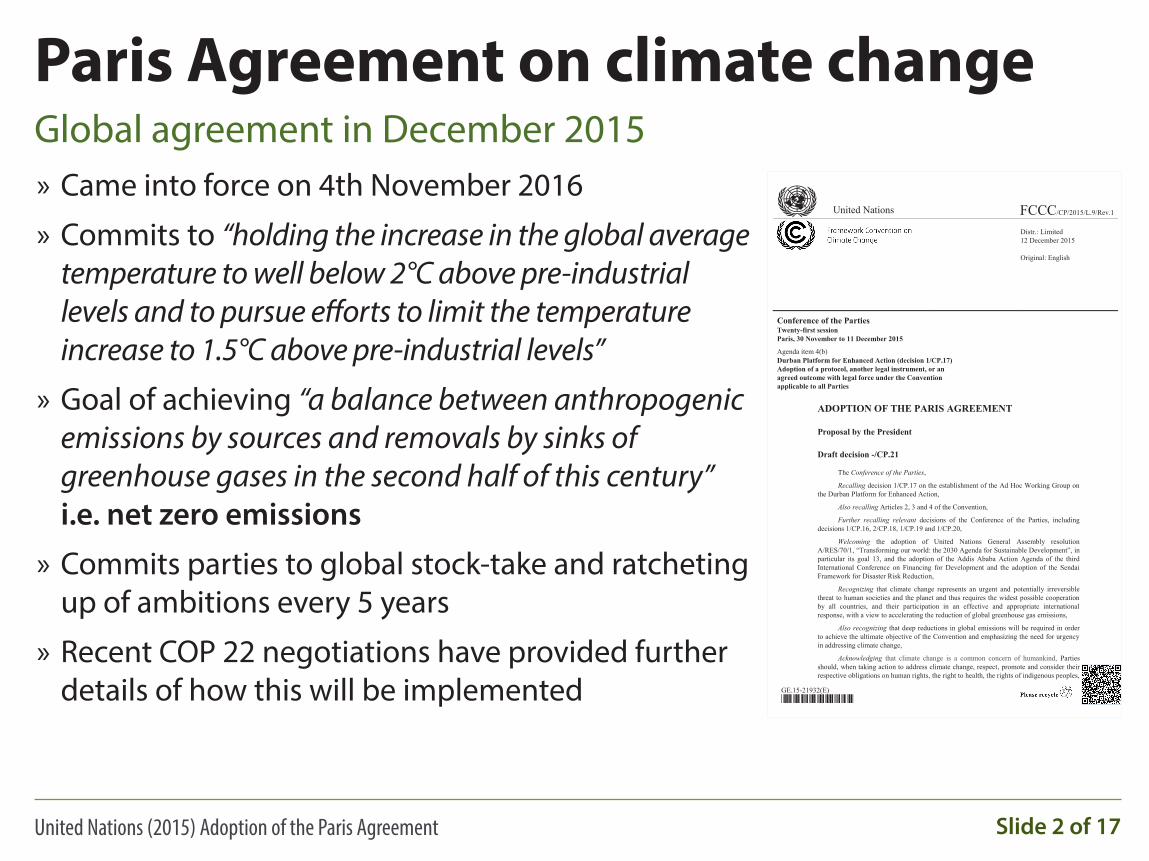
Paris Agreement on climate changeGlobal agreement in December 2015
Slide 2 of 17
» Came into force on 4th November 2016
» Commits to “holding the increase in the global average temperature to well below 2°C above pre-industrial levels and to pursue efforts to limit the temperature increase to 1.5°C above pre-industrial levels”
» Goal of achieving “a balance between anthropogenic emissions by sources and removals by sinks of greenhouse gases in the second half of this century” i.e. net zero emissions
» Commits parties to global stock-take and ratcheting up of ambitions every 5 years
» Recent COP 22 negotiations have provided further details of how this will be implemented
GE.15-21932(E) *1521932*
Conference of the Parties Twenty-first session Paris, 30 November to 11 December 2015
Agenda item 4(b) Durban Platform for Enhanced Action (decision 1/CP.17) Adoption of a protocol, another legal instrument, or an agreed outcome with legal force under the Convention applicable to all Parties
ADOPTION OF THE PARIS AGREEMENT
Proposal by the President
Draft decision -/CP.21
The Conference of the Parties,
Recalling decision 1/CP.17 on the establishment of the Ad Hoc Working Group on the Durban Platform for Enhanced Action,
Also recalling Articles 2, 3 and 4 of the Convention,
Further recalling relevant decisions of the Conference of the Parties, including decisions 1/CP.16, 2/CP.18, 1/CP.19 and 1/CP.20,
Welcoming the adoption of United Nations General Assembly resolution A/RES/70/1, “Transforming our world: the 2030 Agenda for Sustainable Development”, in particular its goal 13, and the adoption of the Addis Ababa Action Agenda of the third International Conference on Financing for Development and the adoption of the Sendai Framework for Disaster Risk Reduction,
Recognizing that climate change represents an urgent and potentially irreversible threat to human societies and the planet and thus requires the widest possible cooperation by all countries, and their participation in an effective and appropriate international response, with a view to accelerating the reduction of global greenhouse gas emissions,
Also recognizing that deep reductions in global emissions will be required in order to achieve the ultimate objective of the Convention and emphasizing the need for urgency in addressing climate change,
Acknowledging that climate change is a common concern of humankind, Parties should, when taking action to address climate change, respect, promote and consider their respective obligations on human rights, the right to health, the rights of indigenous peoples,
+
United Nations FCCC/CP/2015/L.9/Rev.1
Distr.: Limited 12 December 2015 Original: English
United Nations (2015) Adoption of the Paris Agreement

Emissions scenarios to 2100Current commitments likely to yield around 3°C increase
Slide 3 of 17
net-negative global emissions
1980 2000 2020 2040 2060 2080 2100−20
0
20
40
60
80
100
2.0−3.7°CRCP6
1.7−3.2°CRCP4.5
0.9−2.3°CRCP2.6
3.2−5.4°CRCP8.5relative to 1850–1900>1000 ppm CO2eq
430–480 ppm
480–580 ppm
720–1000 ppm
580–720 ppm
Scenario categories
Data: CDIAC/GCP/IPCC/Fuss et al 2014
Em
issi
ons
from
foss
il fu
els
and
cem
ent (
GtC
O¿/
yr)
2016 Estimate
Historical emissions
Global Carbon ProjectGlobal Carbon Project (2016) Carbon budget and trends 2016 - www.globalcarbonproject.org/carbonbudget

INSIGHTS | PERSPECTIVES
182 14 OCTOBER 2016 • VOL 354 ISSUE 6309 sciencemag.org SCIENCE
GR
AP
HIC
: G
. G
RU
LL
ÓN
/SCIENCE
By Kevin Anderson1,2 and Glen Peters3
In December 2015, member states of the
United Nations Framework Convention
on Climate Change (UNFCCC) adopted
the Paris Agreement, which aims to hold
the increase in the global average temper-
ature to below 2°C and to pursue efforts
to limit the temperature increase to 1.5°C.
The Paris Agreement requires that anthropo-
genic greenhouse gas emission sources and
sinks are balanced by the second half of this
century. Because some nonzero sources are
unavoidable, this leads to the abstract con-
cept of “negative emissions,” the removal of
carbon dioxide (CO2) from the atmosphere
through technical means. The Integrated
Assessment Models (IAMs) informing pol-
icy-makers assume the large-scale use of
negative-emission technologies. If we rely on
these and they are not deployed or are unsuc-
cessful at removing CO2 from the atmosphere
at the levels assumed, society will be locked
into a high-temperature pathway.
CARBON BUDGETS
To understand the implications of the Paris
Agreement for mitigation policy, we must
translate its qualitative temperature limits
into quantitative carbon budgets, specifying
how much CO2 can be emitted across the
remainder of the century to keep warming
below a given temperature level (1). Uncer-
tainties in the climate system mean that such
budgets are specified with quantitative like-
lihoods. Borrowing from the taxonomy of
likelihoods used by the Intergovernmental
Panel on Climate Change (IPCC), the most
generous interpretation of the Paris Agree-
ment’s requirement to keep the temperature
rise well below 2°C is, at least, a likely (66 to
100%) chance of not exceeding 2°C.
The IPCC has assessed 900 mitigation
scenarios from about 30 IAMs (2). Of these,
76 scenarios from five IAMs had sufficient
data to estimate the carbon budget for a
likely chance of not exceeding 2°C. These
scenarios give a carbon budget of between
600 and 1200 billion metric tons (Gt) CO2
(10 to 90% range) for the period from 2016
until the peak in temperature [updated from
(1)]. Increasing the likelihood of keeping tem-
peratures below 2°C (or shifting the ceiling
to 1.5°C) will reduce still further the available
carbon budget (3). The budget is also subject
to a reduction each year, currently around 40
Gt CO2, due to continued fossil fuel, industry,
and land-use change emissions.
It is important to keep in mind that de-
spite their intuitive appeal, the complexity of
carbon budgets make it impossible to assign
a specific budget to a given temperature rise.
FROM BUDGETS TO EMISSION PATHWAYS
Because the carbon budgets represent cu-
mulative emissions, different emission path-
ways can be consistent with a given budget.
Using the 76 scenarios consistent with a
likely chance of not exceeding 2°C (see the
figure), two key features are immediately
striking. First, the scenarios assume that
the large-scale rollout of negative-emission
technologies is technically, economically, and
socially viable (2, 4). In many scenarios, the
level of negative emissions is comparable in
size with the remaining carbon budget (see
the figure) and is sufficient to bring global
emissions to at least net zero in the second
half of the century. Second, there is a large
and growing deviation between actual emis-
sion trends and emission scenarios. The sum
of the national emission pledges submitted to
the Paris negotiations (COP21) lead to an in-
crease in emissions, at least until 2030. They
thus broaden the division between pathways
consistent with the temperature goals of the
Paris Agreement (5) and require either much
more severe near-term mitigation (6) or ad-
ditional future negative emissions.
It is not well understood by policy-makers,
or indeed many academics, that IAMs assume
such a massive deployment of negative-emis-
sion technologies. Yet when it comes to the
more stringent Paris obligations, studies sug-
gest that it is impossible to reach 1.5°C with
a 50% chance without significant negative
emissions (3). Even for 2°C, very few scenar-
ios have explored mitigation without nega-
tive emissions (2). Negative emissions are
also prevalent in scenarios for higher stabili-
zation targets (7). Given such a pervasive and
pivotal role of negative emissions in mitiga-
tion scenarios, their almost complete absence
from climate policy discussions is disturbing
and needs to be addressed urgently.
NEGATIVE-EMISSION TECHNOLOGIES
Negative-emission technologies exist at
various levels of development (8–11). Af-
forestation and reforestation, although not
CLIMATE CHANGE
The trouble with negative emissionsReliance on negative-emission concepts locks in humankind’s carbon addiction
1Tyndall Centre, University of Manchester, Manchester M13 9PL, UK. 2Centre for Sustainable Development, Uppsala University, 75236 Uppsala, Sweden. 3Center for International Climate and Environmental Research—Oslo (CICERO), Pb. 1129 Blindern, 0318 Oslo, Norway. Email: [email protected]; [email protected]
50
40
30
20
10
0
–10
–20
1980 2000 2020 2040 2060 2080 2100
Glo
ba
l C
O2 e
mis
sio
ns
(G
t C
O2/
ye
ar)
Net emissions
Approximate emission pledges (INDCs)
Historical emissions
Emissions from fossil fuels, industry, and net land-use change
Net negative emissions
Realized negative emissions
Median model outcomes
2015
No quick fixesModelers generally report net carbon emissions, unintentionally hiding the scale of negative emissions. Separating
out the positive CO2 emissions from fossil fuel combustion, industry, and land-use change reveals the scale of
negative CO2 emissions in the model scenarios (16). INDCs, Intended Nationally Determined Contributions.
Published by AAAS
on
Oct
ober
14,
201
6ht
tp://
scie
nce.
scie
ncem
ag.o
rg/
Dow
nloa
ded
from
Current models for >66% chance of 2°CAre heavily dependent on negative emissions technologies
Slide 4 of 17Anderson & Peters (2016) The trouble with negative emissions Science 354 pp:182-183

Current targets for the UKBased on series of legally binding 5 year carbon budgets
Slide 5 of 17
0
100
200
300
400
500
600
700
800
900
1000 MtCO2e
1990
1995
2000
2005
2010
2015
2020
2025
2030
2050
UK Carbon BudgetsUK GHG emissions
2050 target
23%
35%
50%57%
80%
All targets are relative to baseline of territorial emissions in 1990
29%

New UK goal is net zero emissionsNear the middle of this century
Slide 6 of 17
» UK Government has already intimated that the net zero goal must enter UK law: “The question is not whether but how we do it”
» CCC advise goal means UK must be net zero CO2 by 2055-2075 for >66% chance of achieving 2°C or before 2050 for 1.5°C
Quote from Andrea Leadsom – Minister of State for Energy - Hansard HC Deb vol 607 col 725 (14 March 2016)CCC (2016) UK climate action following the Paris Agreement

hydrogen, however process and CCS emissions will be harder to decarbonise. Structural shifts such as demand for industrial products moving to less carbon-intensive products and increased reuse of products and materials may further reduce emissions in this sector.
In total we envisage a minimum of about 120 MtCO2e/yr emissions across the economy (of which 65 Mt/yr is CO2) coming from aviation, agriculture and industry as well smaller contributions from CCS, surface transport, shipping and waste. Breakthrough innovations or changes in demand could drive emissions down further in the hard-to-reduce sectors. But successful new technologies typically take 30-40 years to develop from invention to mass deployment,20 suggesting that even if there are breakthroughs in coming years there will still be a significant level of emissions in 2050 and probably for some time beyond.
Figure 3.1. Residual UK greenhouse gas emissions in 2050 under Max deployment across all sectors
Source: CCC calculations.
20 UKERC (2015) A review of the evidence on the time taken for new technologies to reach widespread commercialisation.
-100
-50
0
50
100
150
MtC
O2e
/yr
Shipping
Aviation
Other non-CO₂
Agriculture non-CO₂
Industry
Transport
Buildings
Power
Wood in construction
Afforestation
Biomass CCS
Total
41 UK climate action following the Paris Agreement | Committee on Climate Change
Achieving net zero in the UKWill be extremely difficult
Slide 7 of 17CCC (2016) UK climate action following the Paris Agreement
» Requires maximum deployment of all identified mitigation options
» Plus deployment of negative emissions technologies (up to max ~100 MtCO2e/yr)
» Plus further offsetting elsewhere
» Remaining emissions in current CCC scenarios are predominantly from aviation, agriculture and industry (mainly materials production i.e. construction products)

UK net zero CO2
>66% chance of 2°C5th Carbon Budget
GHG 57% <1990CCA
80% <1990
60yr
40yr
30yr
20yr
50yr
HS2
Crossrail 2
Asset design life
2010 2020 2030 2040 2050 2060 2070 2080 2090 2100
HinkleyPoint C
The implications for constructionMany assets under design now must operate in a net zero nation
Slide 8 of 17

0 200 400 600 800 1000
Cap (22%) Op (78%)Low Carbon Routemap for the Built Environment (2012)
Domestic Non-domestic
InfrastructureInfrastructure
Energy Supply Transport Business Residential Agriculture Waste
UK territorial accounts (2012)
Manufactured goods & construction
Home heating & private car travel Electricity Transport
services Other servicesFuels, materials, water & waste
Agriculture & food
UK carbon footprint (2012)
Cap Op (29%) Use (70%)Infrastructure Carbon Review (2010)
Energy
Transport Water Telecoms
Energy Transport
Greenhouse gas emissions (MtCO2e)
Remaining emissions in CCC 2050 net zero scenario
Territorial basisConsumption basis
The challengeA snapshot of UK greenhouse gas emissions (MtCO2e)
Slide 9 of 17UK’s carbon footprint published by DEFRA (1997-2013) based on CIEMAP data
» Priorities are energy and transport
» However long term targets require reductions everywhere, including CapCarb

Progress so farRoutemap progress report produced in December 2015
Slide 10 of 17
» Progress to 2013 suggests we are not on trend to meet 2025 ambitions
» Capital carbon emissions have increased since 2013 Routemap report
Green Construction Board Low Carbon Routemap for the Built Environment
2015 Routemap Progress | Technical Report
15 December 2015
Historic emissions
Projected emissions
Routemap 80% reduction scenario
0
50
100
150
200
250 MtCO2e
2005 2010 2015 2020 2025
* Projected emissions based upon analysis by presenter using reported OpCarb (including provisional statistics for 2015) and projected CapCarb (using reported financial value of output and extrapolating historic emissions intensity trend)
*

CIEMAP workOn barriers to low carbon construction
Slide 11 of 17
» Meta-analysis of barriers presented in literature
» Surveys and interviews
» Industry and public workshops
RESEARCH PAPER
Construction sector viewson lowcarbonbuildingmaterials
Jannik Giesekam1, JohnR.Barrett2 and PeterTaylor3
1Energy Research Institute,University of Leeds, Leeds LS2 9JT,UKE-mail: [email protected]
2SustainabilityResearch Institute,School of Earth andEnvironment,University of Leeds,LeedsLS2 9JT,UK
3Centre for Integrated Energy Research,School of Earth and Environment,University of Leeds,Leeds LS2 9JT,UK
As is the case in a number of countries, the UK construction industry faces the challenge of expanding production whilst
making ambitious greenhouse gas emission reductions. Embodied carbon constitutes a growing proportion of whole-life
carbon emissions and accounts for a significant share of total UK emissions. A key mitigation strategy is increasing the
use of alternative materials with lower embodied carbon. The economic, technical, practical and cultural barriers to the
uptake of these alternatives are explored through a survey of construction professionals and interviews with industry
leaders. Perceptions of high cost, ineffective allocation of responsibility, industry culture, and the poor availability of
product and building-level carbon data and benchmarks constitute significant barriers. Opportunities to overcome
these barriers include earlier engagement of professionals along the supply chain, effective use of whole-life costing,
and changes to contract and tender documents. A mounting business case exists for addressing embodied carbon, but
has yet to be effectively disseminated. In the meantime, the moral convictions of individual clients and practitioners
have driven early progress. However, this research underscores the need for new regulatory drivers to complement
changing attitudes if embodied carbon is to be established as a mainstream construction industry concern.
Keywords: alternative materials, CO2 reduction, construction sector, embodied carbon, greenhouse gas emissions,
market acceptance, professional knowledge
IntroductionThe construction sector is the largest global consumerof materials, and buildings are the sector with thelargest single energy use worldwide (Krausmannet al., 2009; De Ia Rue du Can & Price, 2008). Conse-quently, buildings are also responsible for 19% ofglobal greenhouse gas (GHG) emissions (Intergovern-mental Panel on Climate Change (IPCC), 2014).Recent studies have suggested that buildings offer thegreatest abatement opportunities for reducing GHGemissions in the short-term (IPCC, 2014; McKinsey& Co., 2009). Policy-makers have responded to thisthrough the introduction of regulation requiringimprovements in building fabric and performance,such as the European Union (EU) Energy Performanceof Buildings Directive. These regulations have princi-pally focused on the operational GHG emissions
associated with energy use in activities such as spaceheating, cooling and lighting. However, these regulat-ory drivers have not extended to the embodiedcarbon1 associated with the initial production of struc-tures (Figure 1).
A recent review of building life cycle assessmentsdemonstrated that embodied carbon can account foranywhere between 2% and 80% of whole-life carbonemissions (Ibn-Mohammed, Greenough, Taylor,Ozawa-Meida, & Acquaye, 2013). The precise pro-portion depends upon a number of characteristicsincluding building use, location, material palette, andassumptions about the service life and future energysupply. The proportion tends to be higher in certainstructure types, such as industrial warehousing,where embodied emissions can contribute up to 90%
BUILDING RESEARCH & INFORMATION 2015http://dx.doi.org/10.1080/09613218.2016.1086872
# 2015 Taylor & Francis
Dow
nloa
ded
by [U
nive
rsity
of L
eeds
] at 0
4:01
16
Oct
ober
201
5
Energy and Buildings 78 (2014) 202–214
Contents lists available at ScienceDirect
Energy and Buildings
journa l homepage: www.e lsev ier .com/ locate /enbui ld
The greenhouse gas emissions and mitigation options for materialsused in UK construction
Jannik Giesekama,∗, John Barrettb, Peter Taylorc, Anne Owenb
a Energy Research Institute, University of Leeds, Leeds LS2 9JT, UKb School of Earth and Environment, University of Leeds, Leeds LS2 9JT, UKc Centre for Integrated Energy Research, University of Leeds, Leeds LS2 9JT, UK
a r t i c l e i n f o
Article history:Received 17 January 2014Received in revised form 14 April 2014Accepted 16 April 2014Available online 30 April 2014
Keywords:Building materialsClimate change mitigationConstructionEmbodied emissionsInput–Output Analysis
a b s t r a c t
The UK construction industry faces the daunting task of replacing and extending a significant propor-tion of UK infrastructure, meeting a growing housing shortage and retrofitting millions of homes whilstachieving greenhouse gas (GHG) emission reductions compatible with the UK’s legally binding target ofan 80% reduction by 2050. This paper presents a detailed time series of embodied GHG emissions fromthe construction sector for 1997–2011. This data is used to demonstrate that strategies which focus solelyon improving operational performance of buildings and the production efficiencies of domestic materialproducers will be insufficient to meet sector emission reduction targets. Reductions in the order of 80%will require a substantial decline in the use of materials with carbon-intensive supply chains. A varietyof alternative materials, technologies and practices are available and the common barriers to their useare presented based upon an extensive literature survey. Key gaps in qualitative research, data and mod-elling approaches are also identified. Subsequent discussion highlights the lack of client and regulatorydrivers for uptake of alternatives and the ineffective allocation of responsibility for emissions reductionwithin the industry. Only by addressing and overcoming all these challenges in combination can theconstruction sector achieve drastic emissions reduction.
© 2014 Elsevier B.V. All rights reserved.
1. Introduction
The evidence of climate change is now “unequivocal” [1] and theanticipated increases in the frequency of extreme weather events,threats to water and food security and the massive loss of biodiver-sity represent a fundamental risk to the health and livelihoods ofa large portion of the global population. The extensive and grow-ing evidence base suggests that it is “extremely likely that humaninfluence has been the dominant cause of the observed warmingsince the mid-20th century” [2], principally through the extractionand burning of fossil fuels alongside changes to land use. Humanshave already significantly altered three quarters of the world’s ter-restrial habitats and continue to extract 60 billion tonnes of rawmaterials each year [3,4]. The construction sector is the largest userof these materials [4]. Buildings are the sector with the largest sin-gle energy use worldwide and are responsible for approximately athird of global carbon emissions [5,6].
∗ Corresponding author. Tel.: +44 0113 343 2556.E-mail address: [email protected] (J. Giesekam).
In the UK, the volume of carbon dioxide emissions that theconstruction sector influences is significant, accounting for an esti-mated 47% of total UK CO2 emissions [7]. In a typical year, the UKconstruction industry requires over 420 million tonnes of materialresources, energy equivalent to just under 8 million tonnes of oil,and is responsible for over 90% of non-energy mineral extraction[8,9]. The construction sector is also the largest generator of waste,at over 100 million tonnes per year in 2008 [10]. Furthermore, everyyear the construction industry uses 6500 ha of land and is respon-sible for a third of all industry-related pollution incidents [11]. Inaddition to direct environmental impacts from its activities, thesector also has a critical role to play in enabling the supply of cleanenergy and facilitating sustainable practices in other areas of theeconomy. The impending transition to a low carbon economy rep-resents a sizeable package of works for the construction industry.Indeed, the influential 2010 UK Innovation and Growth Team (IGT)report concluded that “over the next 40 years, the transition to lowcarbon can almost be read as a business plan for construction” [12].
The UK is facing a sizeable housing shortfall, the imminentreplacement of the majority of its electricity generating plant, andintends to increase public investment in many pieces of large-scaleinfrastructure (such as high speed rail and highway networks) [13].
http://dx.doi.org/10.1016/j.enbuild.2014.04.0350378-7788/© 2014 Elsevier B.V. All rights reserved.Drivers and barriers to the adoption of
sustainable materials
Jannik Giesekam
Research Fellow in Energy, Materials and Climate PolicyUniversity of Leeds
05/04/16CIRIA Offices, London These slides are available from www.jannikgiesekam.co.uk/research
Slides from CIRIA ‘Advances in innovative sustainable materials’ event
Giesekam et al. (2014, 2016) & CIRIA event slides - all available at ciemap.ac.uk

» Perception of high costs
» Dearth of knowledge, understanding and skills
» Lack of quality benchmark data (particularly at project level)
» Availability of product carbon information
» Insufficient allocation of responsibility for carbon reduction
» Industry culture
» Lack of client understanding or ambition
» Low value of materials
» Procurement and tendering process and timescales
» Negative perceptions of low carbon alternatives
» Lack of demonstration projects and product testing
Barriers to low carbon innovationOften include
Slide 12 of 17See Giesekam et al. (2014, 2016) papers for further discussion

Vast international marketGHG emissions of construction sector supply chain by country
Slide 13 of 17Based upon CIEMAP MRIO analysis using WIOD data for 40 countries plus ‘rest of world’
0
20
40
60
80
100 MtCO2e
1997 1998 1999 2000 2001 2002 2003 2004 2005 2006 2007 2008 2009
Australia
Brazil
Canada
Germany
Spain
France
UK
Ireland
Italy
Netherlands
0
500
1,000
1,500
2,000
2,500
3,000 MtCO2e
1997 1998 1999 2000 2001 2002 2003 2004 2005 2006 2007 2008 2009
India
China
USA
Japan
» Construction firms in these 14 countries alone influence 4.4 GtCO2e of supply chain emissions
» Substantial opportunities for export of low carbon expertise and products

» Highly motivated and informed client
» Strong leadership and consistent messaging
» Early engagement of full supply chain
» Targets and contractual obligations that ensure alignment of value chain
» Innovative elements positioned as integral to satisfaction of project constraints
» Frequent communication and knowledge shared across project team
» Effective knowledge capture and post project learning
Common features of innovative projectsInclude
Slide 14 of 17See Giesekam et al. (2014, 2016) papers for further discussion

» Gathering more data on the link between cost & carbon
» Effectively expressing co-benefits (such as health and productivity gains)
» Inserting better incentives in environmental assessment schemes (e.g. BREEAM)
» Taking ownership of the issue within industry and within Government
» Developing a range of narratives
» Co-ordinated advocacy for change
» Recognising the importance of individuals
Securing additional driversRequires
Slide 15 of 17

Government Construction StrategyFor the current parliament
The Infrastructure and Projects Authority (2016) Government Construction Strategy 2016-2020 Slide 16 of 17
» One of the principal objectives is to “enable and drive whole-life approaches to cost and carbon reduction”
» Objective 3.6 is to “Develop data requirements and benchmarks for measurement of whole-life cost and whole-life carbon (embodied and operational)”
» “Government contracts will encourage innovative sustainability solutions on carbon reduction where value can be demonstrated”
» Ultimately forming “recommendations for a future approach”
Reporting to HM Treasuryand Cabinet Office
Government Construction Strategy 2016-20
March 2016

» The net zero emissions goal creates a new carbon context
» Earlier mitigation will be more cost effective and reduces dependence upon unproven negative emissions technologies
» Faster progress and greater innovation is needed to get the construction industry back on a trajectory that is consistent with national carbon targets
» There are many barriers to innovation but these are slowly being overcome
» Further coordination and collaboration is required to secure additional drivers
» The costs of inaction and the significant global marketplace for low carbon solutions should be motivations to act now
» We must work together to develop a vision of a low carbon construction industry that is consistent with the goals of the Paris Agreement
SummaryAchieving net zero requires unprecedented levels of innovation
Slide 17 of 17These slides are available from www.jannikgiesekam.co.uk/research