barriers to technology adoption in the caricom and peru · barriers to technology adoption in the...
TRANSCRIPT
Barriers to Technology Adoption in the CARICOM and Peru
International Food Security Dialogue 2014 Edmonton May 2, 2014
Enhancing Food Production, Gender Equality and Nutritional Security in a Changing World
Engle-Warnicka,b, J., Escobalc, J., Laszloa,b,c, S. and Raeburna, K. a: Department of Economics, McGill; b:CIRANO; c:GRADE, Peru
Presented by Sonia Laszlo Associate Director, ISID, McGill University
Associate Professor, Economics, McGill University
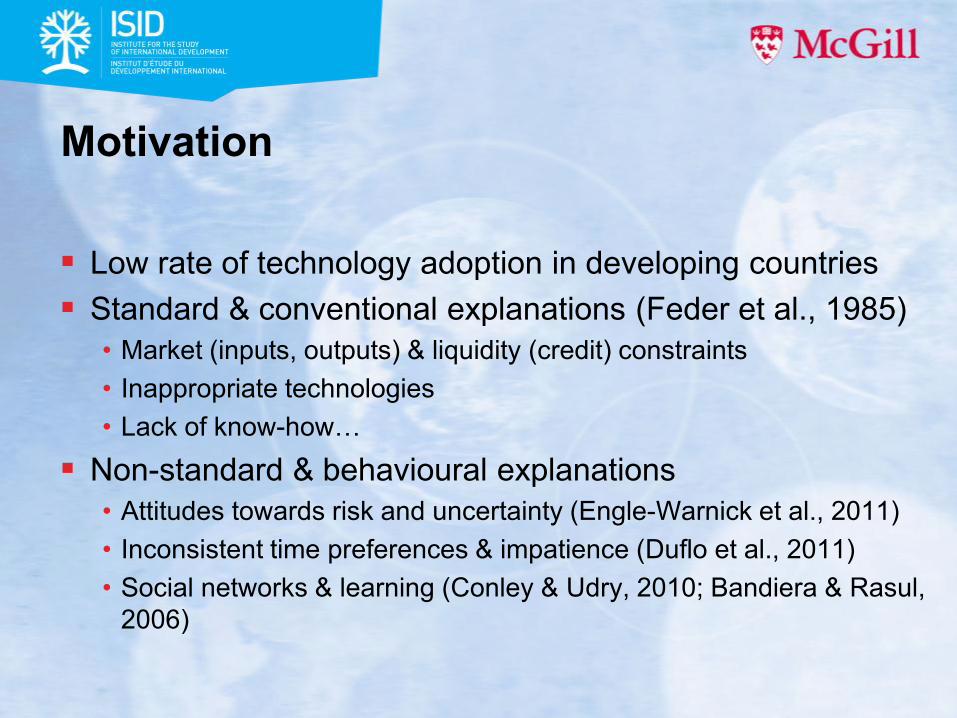
Motivation
Low rate of technology adoption in developing countries Standard & conventional explanations (Feder et al., 1985)
• Market (inputs, outputs) & liquidity (credit) constraints • Inappropriate technologies • Lack of know-how…
Non-standard & behavioural explanations • Attitudes towards risk and uncertainty (Engle-Warnick et al., 2011) • Inconsistent time preferences & impatience (Duflo et al., 2011) • Social networks & learning (Conley & Udry, 2010; Bandiera & Rasul,
2006)

CARICOM Food Security Project
CIFSRF1 project, joint venture McGill & UWI and number of Third Party Partners (Guyana, St Kitts, St Lucia, Trinidad & Peru)
Main goals: • Improve health & nutrition in CARICOM population (high rates of overweight
and obesity) • Develop food production systems based on agricultural diversification, water
conservation and efficient use of land “Farm to Fork” approach:
• Interventions in farming practices (GUY, SKN, SLA, TTO) • Nutritional interventions in schools (SKN & TTO)
Great opportunity to study these issues in a context where technology adoption in agriculture matters
1 Canadian International Food Security Research Fund, IDRC & DFATD

Technology adoption – research questions
What are the existing barriers to technology adoption in GUY, SKN, SLA & TTO? • What is the degree of adoption? • Do standard explanations go far in explaining these patterns?
What are the behavioural determinants of technology adoption in these countries? • Do risk and uncertainty aversion matter? • What can we learn about beliefs about the technology and peer
effects?

Overview of multi-method approach Producer Household Surveys
(PHS) Multi-purpose modular design
• Demogs & farm practices & tech adopt
• Risk and uncertainty attitudes • …
Directly comparable questionnaire Data collection: Oct 2011- Mar 2012 Partnership with local partners
Economics Experiments (EXP)
N hhlds Local partner GUY 304 NAREI SKN 91 MARM & ind. cons. STL 118 MALFF TTO 93 UWI & ind. cons.
Technology adoption decision-making under uncertainty
Peru (Feb 2012, GRADE) • Does social learning play a role in
forming beliefs about relative riskiness and ambiguity of different technologies?
• Known v unknown probability distributions
• 305 farmers in 3 regions participated Guyana (Nov 2012, NAREI)
• Tech adoption modeled as a public good • Experimentation with a technology provides
information about unknown distributions • 136 farmers from 1 region participated

PHS Results Table 1: Socio-demographic characteristics of household heads in the samples of farming households from Guyana, St. Lucia, St. Kitts and Trinidad Characteristics GUY SLA St. Kitts Trinidad Pooled
Age (Mean)+ 44.4 (12.5) 51.8 (10.8) 49.2(9.6) 49.0(11.3) 47.2 (12.1)
Female 14.1% 23.7% 20.1% 10.0% 16%
Married 84.9% 55.1% 50.5% 72.0% 72%
Education Primary 38.6% 66.7% 12.7% 26.5% 38%
Secondary 54.1% 18.9% 67.6% 45.8% 48%
College/Univ. 4.3% 7.8% 9.9% 21.7% 9%
Total N 304 118 91 93 606 Source: PHS Baseline 2012. Reproduced from Laszlo et al. (2013), Table 2. + Standard deviation in parenthesis.

PHS Results Table 2: Use and Adoption of New Technology by Farmers Surveyed in Guyana, St. Lucia, St. Kitts and Trinidad
Country Crop Tool or
Equipment Irrigation
Technique Fertilizer Pesticide
Record-keeping
Technique N
GUY 2.7% 1.0% 0.7% 28.2% 47.6% 0.3% 298 SLA 13.0% 0.9% 3.4% 0.9% 14.7% 0.0% 116 SKN 17.5% 14.8% 1.6% 3.2% 3.2% 1.9% 63 TTO 10.8% 10.5% 3.9% 19.2% 11.4% 3.9% 78 Total 7.62% 3.68% 1.81% 18.38% 30.36% 0.92% 555 N 551 543 554 555 550 542 Source: PHS Baseline 2012. Table reproduced from Laszlo et al. (2013), Table 12
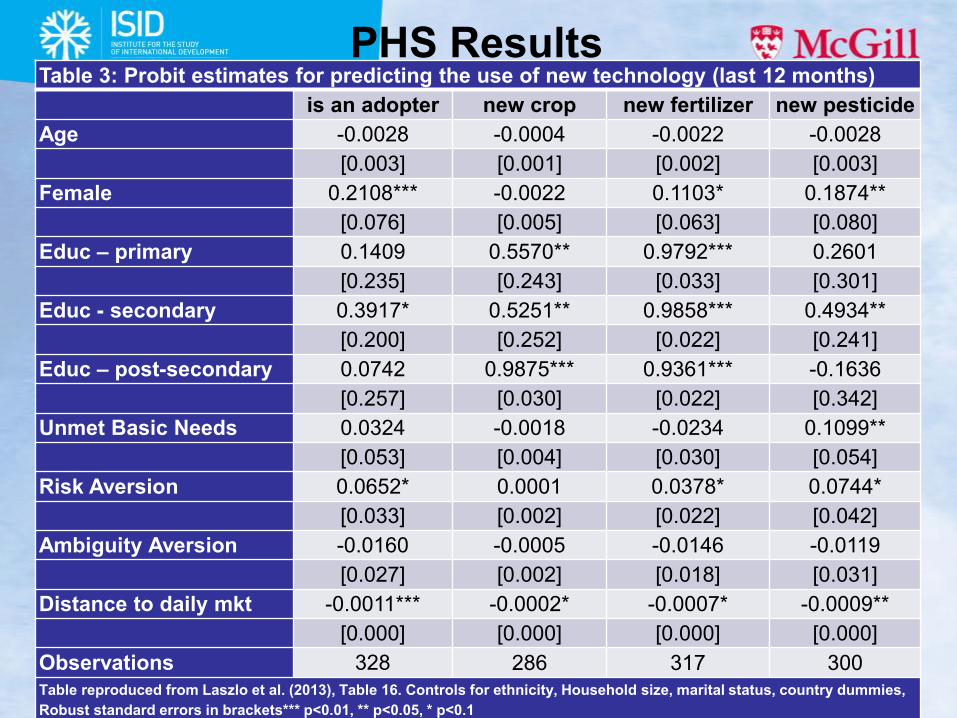
PHS Results Table 3: Probit estimates for predicting the use of new technology (last 12 months)
is an adopter new crop new fertilizer new pesticide Age -0.0028 -0.0004 -0.0022 -0.0028
[0.003] [0.001] [0.002] [0.003] Female 0.2108*** -0.0022 0.1103* 0.1874**
[0.076] [0.005] [0.063] [0.080] Educ – primary 0.1409 0.5570** 0.9792*** 0.2601
[0.235] [0.243] [0.033] [0.301] Educ - secondary 0.3917* 0.5251** 0.9858*** 0.4934**
[0.200] [0.252] [0.022] [0.241] Educ – post-secondary 0.0742 0.9875*** 0.9361*** -0.1636
[0.257] [0.030] [0.022] [0.342] Unmet Basic Needs 0.0324 -0.0018 -0.0234 0.1099**
[0.053] [0.004] [0.030] [0.054] Risk Aversion 0.0652* 0.0001 0.0378* 0.0744*
[0.033] [0.002] [0.022] [0.042] Ambiguity Aversion -0.0160 -0.0005 -0.0146 -0.0119
[0.027] [0.002] [0.018] [0.031] Distance to daily mkt -0.0011*** -0.0002* -0.0007* -0.0009**
[0.000] [0.000] [0.000] [0.000] Observations 328 286 317 300 Table reproduced from Laszlo et al. (2013), Table 16. Controls for ethnicity, Household size, marital status, country dummies, Robust standard errors in brackets*** p<0.01, ** p<0.05, * p<0.1
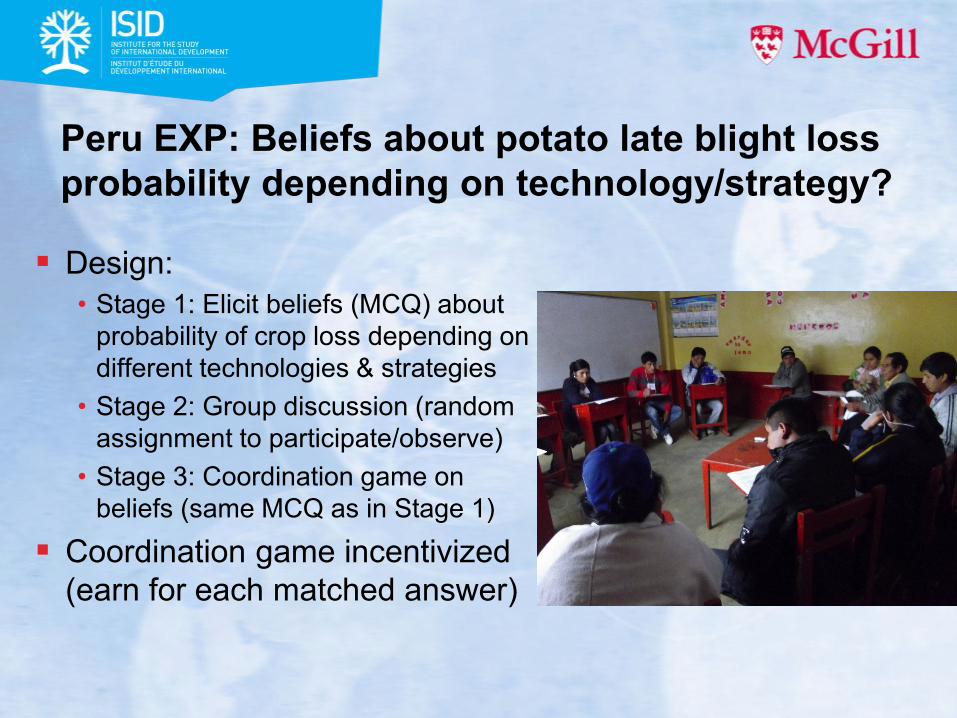
Peru EXP: Beliefs about potato late blight loss probability depending on technology/strategy?
Design: • Stage 1: Elicit beliefs (MCQ) about
probability of crop loss depending on different technologies & strategies
• Stage 2: Group discussion (random assignment to participate/observe)
• Stage 3: Coordination game on beliefs (same MCQ as in Stage 1)
Coordination game incentivized (earn for each matched answer)

Peru EXP: Beliefs about potato late blight loss probability depending on technology/strategy?
More educated farmers: • Stronger beliefs about probability distributions of technologies • Less likely to change beliefs after participating in discussion • Important peer effects: less educated farmers may benefit
disproportionately from group discussions about technologies (may be enhanced by grouping them with educated farmers)
Women: • Less likely to use modern technologies to protect against blight • Less likely to change their belief about probability distributions after a
chat • Gender composition of peer groups matter

Guyana EXP: Social learning & technology adoption as public good Basic idea:
• Experimentation allows realization of ambiguous outcome • The more farmers who experiment, the more outcomes are realized.
Design: • Farmers choose between relatively risky and relatively ambiguous
gambles (simulating technologies). • Step 1: Elicit their preference between the two gambles. • Step 2: Revise their decision knowing that other participants in the
group would observe the realization of their choice • Step 3: Allow them to revisit their decision after having uncovered
partial information about the ambiguous probability distribution.
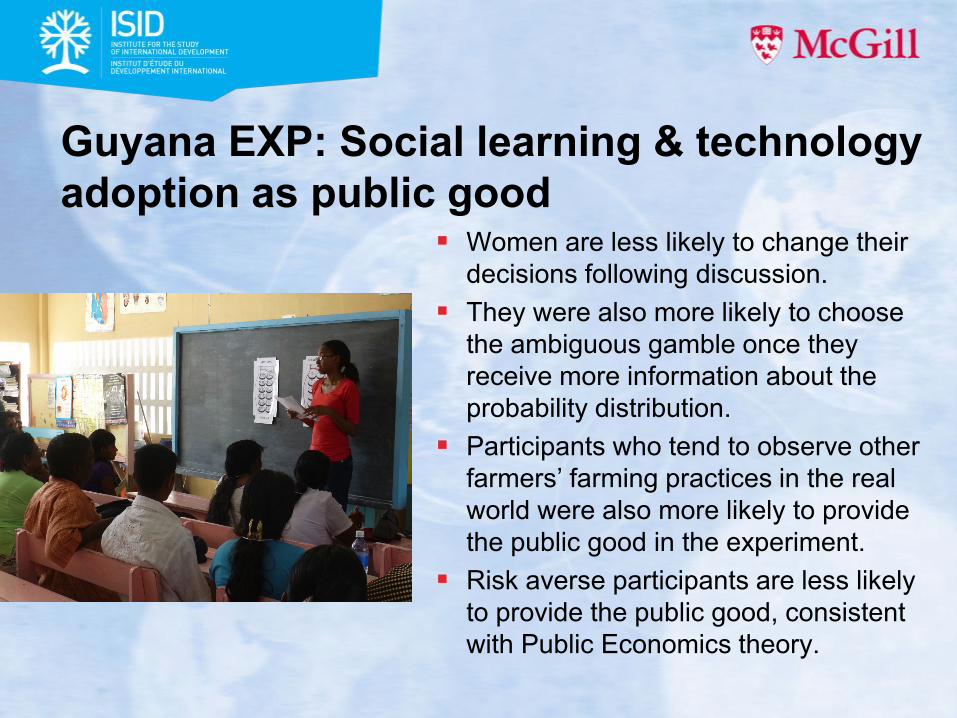
Guyana EXP: Social learning & technology adoption as public good
Women are less likely to change their decisions following discussion.
They were also more likely to choose the ambiguous gamble once they receive more information about the probability distribution.
Participants who tend to observe other farmers’ farming practices in the real world were also more likely to provide the public good in the experiment.
Risk averse participants are less likely to provide the public good, consistent with Public Economics theory.

Conclusions – Policy Considerations
1. Policies which foster access to markets should improve technology adoption.
• Given the geographical constraints, one possible avenue for policy intervention is extending the road network to improve transportation between producing areas and markets.
2. CARICOM farmers face binding credit and financing constraints. Policy makers should consider options to facilitate access to financing (credit and insurance).

Conclusions – Policy Considerations
3. Increase information exchange about the yield probability distribution functions of different:
• Technical assistance through agricultural extension services. • Peer groups and social networks can be instrumental in facilitating
this sort of information, and at relatively low cost.
4. Women farmers have a larger propensity to adopt new technologies than men:
• Most responsive to receiving new info & more likely to choose ambiguous options with new info on probability distributions.
• Technical assistance particularly effective if targeted to women, and allowing the diffusion process within their social networks.
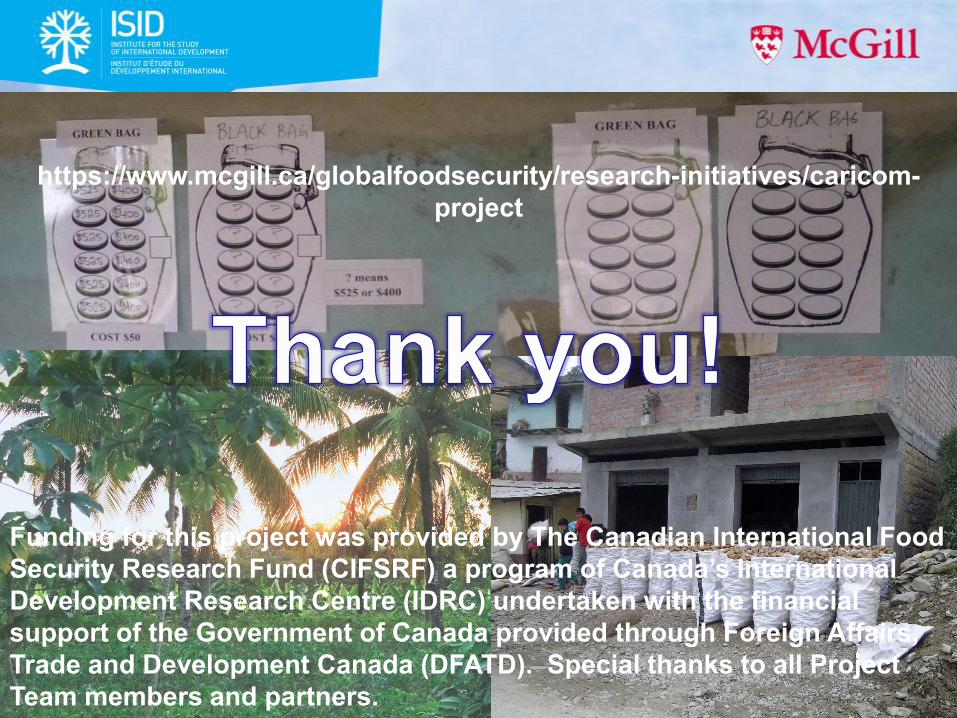
Funding for this project was provided by The Canadian International Food Security Research Fund (CIFSRF) a program of Canada’s International Development Research Centre (IDRC) undertaken with the financial support of the Government of Canada provided through Foreign Affairs, Trade and Development Canada (DFATD). Special thanks to all Project Team members and partners.
https://www.mcgill.ca/globalfoodsecurity/research-initiatives/caricom-project
References Conley, T. and C. Udry. 2010. “Learning about a New Technology: Pineapple in Ghana” American
Economic Review 100 (1): 35-69. Dulfo, E., M. Kremer and J. Robinson. 2011. “Nudging farmers to use fertilizer: Theory and
Experimental Evidence from Kenya.” American Economic Review 101 (6): 2350-90. Engle-Warnick, J., J. Escobal and S. Laszlo. 2011. “Ambiguity Aversion and Portfolio Choice in Small-
Scale Peruvian Farming” B.E. Journal of Economic Analysis & Policy 11(1):1-56. Engle-Warnick, J., J. Escobal and S. Laszlo. 2014. Technical report: Technology adoption in Peruvian
potato farming: Evidence from a Coordination Game experiment on farmer beliefs about strategies to combat Late Blight. Technical report for CARICOM Food Security Project, McGill University, Quebec, Canada.
Engle-Warnick, J., S. Laszlo and K. Raeburn. 2014. Technical report: Technology adoption as a public good: evidence from an economics experiment in Guyana. Technical report for CARICOM Food Security Project, McGill University, Quebec, Canada.
Laszlo, S., T. Thompson-Colon and L. Sjolander. 2013. Producer Household Survey: Report on General Baseline Findings for Guyana, St Lucia, Trinidad-Tobago and St Kitts-Nevis. CARICOM Food Security Project, McGill University, Quebec, Canada.
Thompson-Colón, T. and S. Laszlo. 2013. Producer Household Survey Methodology Report for the Baseline Survey Data Collection in Guyana, St. Lucia, Trinidad-Tobago, and St. Kitts-Nevis. CARICOM Food Security Project, McGill University, Quebec, Canada.