bartlett, nh housing chatham, nh matters conway, nh · cooper,cargill,chant attorneysatlaw...
TRANSCRIPT

H O U S I N G M A T T E R S
Wo r k f o r c e H o u s i n g ; i t s e v e r y b o d y ’s b u s i n e s s !
Albany, NH
Bartlett, NH
Chatham, NH
Conway, NH
Eaton, NH
Freedom, NH
Hart’s Location, NH
Jackson, NH
Madison, NH
Ossipee, NH
Tamworth, NH
Brownfield, ME
Fryeburg, ME
A Housing Resource Booklet for Mt. Washington Valley Communities August, 2012
in Mt. Washington Valley

Housing Matters in Mt. Washington Valley
i
A c k n o w l e d g e m e n t s
This report was developed by the Mt. Washington Valley Housing Coalition (MWVHC). Funding for printing was provided by New Hampshire Housing Finance Authority.
A summary of the information and statistics contained in this resource booklet were presented to Mt. Washington Valley community and business leaders on November 16, 2011 at the “Housing Matters” workshop. Financial support for the workshop was provided by the following: Northway Bank, Glen Builders, OVP Management Inc., KIP Investment Properties, M&M Assurance Group, Leone, McDonnell & Roberts, New Hampshire Housing Finance Authority and New Hampshire Charitable Foundation.
For more information on this report, the Housing Matters Project, and/or Mt. Washington Valley Housing Coalition please contact:
Theresa KennettEmail: tkennett@mwvhc-‐nh.orgPhone: (603) 452-‐7414Or visit: http://www.mwvhc-‐nh.org
MWVHC is a private, non-‐pro_it organization governed by a local board of directors. Fiscal sponsorship is provided by the Mt. Washington Valley Economic Council.
The focus of MWVHC’s work is to:• increase awareness about the need for, and bene_its of, workforce housing as it relates to
economically sustainable communities; • partner with business and community leaders to identify and secure necessary planning and
zoning resources for workforce housing; • provide support for developers who are interested in delivering quality, workforce housing.
MWVHC serves the communities of Albany, Bartlett, Chatham, Conway, Eaton, Freedom, Hart’s Location, Jackson, Madison, Ossipee, and Tamworth, NH and Brown_ield and Fryeburg, ME.
The MWVHC of_ice is located at the MWV Tech Center, 53 Technology Lane, Suite 102, Conway, NH, 03818.
Mt. Washington Valley Housing Coalition Mission
To improve the environment for building an adequate supply of affordable, diverse housing units for all who live and work
in the greater Mt. Washington Valley.

Housing Matters in Mt. Washington Valley
ii
F o r e w o r d
The recent turmoil in the housing market has not reduced housing prices to affordable levels for Mt. Washington Valley’s working families. While price declines have led to an erosion of equity for many existing homeowners, potential Airst-‐time buyers have remained priced out of the market. Not only does the affordability gap persist in the residential market, it also persists in the rental market. Many working families must choose between commuting long distances or spending too much of their take-‐home pay to live closer to work.
The problem of workforce housing not only impacts those in need of housing, it also impacts the broader community. Mt. Washington Valley businesses report that the mismatch in affordability is having a negative effect on business expansion, workforce recruitment and employee retention.
Housing matters in Mt. Washington Valley because businesses need workers and workers need an affordable place to live. Market failure in housing, especially at a time when the economy is poised to recover, will undermine the economic vitality and growth in MWV communities. It is with this mounting concern in mind that the Mt. Washington Valley Housing Coalition (MWVHC) ofAicially formed in October of 2010 under the Aiscal sponsorship of the Mt. Washington Valley Economic Council (Economic Council).
After meeting with business and community leaders to bring this economic development issue to the forefront, the MWVHC spent the next several months gathering data to quantify the affordability issue in Mt. Washington Valley towns. Data sources that were used include the U. S. Census, American Community Survey, New Hampshire and Maine Bureaus of Employment Security, New Hampshire Association of Realtors, New Hampshire Housing, and several studies and research articles.
Most importantly, to quantify the impact of housing on local businesses, the MWVHC partnered with the Economic Council to administer and analyze a region-‐wide employer survey in September of 2011.
The analysis is presented on a regional basis, with data provided on a municipal level for the towns that comprise Mt. Washington Valley, including Albany, Bartlett, Chatham, Conway, Eaton, Freedom, Hart’s Location, Jackson, Madison, Ossipee, and Tamworth, New Hampshire and BrownAield and Fryeburg, Maine.
While the importance of workforce housing cannot be overstated, its solutions are complex and will require the support and involvement of the business community, government, and citizens. The MWVHC welcomes your involvement and feedback. If you would like more information, please contact the MWVHC at (603) 452-‐7414 or go to www.mwvhc-‐nh.org.
MWVHC Board of Directors:
Evelyn Whelton, MWVHC Chairman;Northway Bank
Jill Burrows, MWVHC Secretary;Memorial Hospital
Betsey Harding, MWVHC Treasurer;Jackson Planning Board
Ed Butler, MWVHC Past Chair,Notchland Inn
Charles AllenGlen Builders
Bob BridghamEaton, NH
Michael E. CoutureArchitect
Jac CuddyMWV Economic Council
Jeff HayesNorth Country Council
Suzette IndelicatoStarting Point
Brenda LeavittBadger Realty
Bob MagounHabitat for Humanity
Megan ScheidEastern Slope Inn
Pam SensRed Jacket Mountain View Resort
Maureen WestrickFine ResidentialArchitecture
Theresa KennettProgram Director53 Technology Lane, Suite 100Conway, NH 03818(603) 452-7414 [email protected]

Housing Matters in Mt. Washington Valley
iii
T a b l e o f C o n t e n t s
Acknowledgements ...........................................................................................................................................i
Foreword ..............................................................................................................................................................ii
Table of Contents .............................................................................................................................................iii
Executive Summary ...............................................................................................................................Page 1
The Impact of Housing on the Region’s Economy: MWV Employer Survey ................Page 3
Affordability, Housing Market Trends, & Income .....................................................................Page 5
Housing Supply & Demand .................................................................................................................Page 8
Sustainable Measures ...........................................................................................................................Page 12
Conclusion .................................................................................................................................................Page 15
Sponsors and Supporters Listing Page .........................................................................................Page 18
Appendix A: Employer Survey Results ........................................................................................Page 19
Appendix B: Average Annual Employment ................................................................................Page 22
Appendix C: Owner and Renter Costs as a Percentage of Household Income.............Page 23
Appendix D: 2010 Median Sales and Gross Rental Costs in Carroll County..................Page 23
Appendix E: 2010 Estimated Household Income in MWV Towns ....................................Page 24
Appendix F: Average Weekly Wages .............................................................................................Page 25
Appendix G: 2010 ProXile of Housing Characteristics ............................................................Page 26
Appendix H: Population Counts 1990 -‐ 2010 ............................................................................Page 27
Appendix I: Median Age ......................................................................................................................Page 27
Appendix J: Household Counts By Town......................................................................................Page 28
Appendix K: Household Composition By Town .......................................................................Page 29
Appendix L: Housing Inventory: Type of Structure ..............................................................Page 30
Appendix M: Age of Housing ............................................................................................................Page 32
New Hampshire’s Workforce Housing Law: What it means for NH’s economic recovery and what it does for communities.....Page 34

Exe c u t i v e S u m m a r y
In order to assess the degree to which housing is impacting the regional economy, the Mt. Washington Valley Housing Coalition (MWVHC) partnered with the Mt. Washington Valley Economic Council (Economic Council) to conduct an employer survey in September of 2011. One hundred and twenty surveys were distributed and 80 completed surveys were returned. Survey respondents were very representative of total employment in Mt. Washington Valley (MWV).
One hundred percent of municipal respondents, 83% of hospitality respondents and 80% of retail respondents indicated that the lack of affordable housing is impacting their ability to expand their business and recruit and retain a workforce.1
Two factors determine affordability, the price of housing and the ability of people to pay that price and still afford other basic necessities such as food, clothing, and medical costs. Based on the generally accepted affordability standard that no more than 30% of household monthly income should go toward housing costs, it is estimated that 53% of renter households and 35% of owner households are over burdened with housing costs.2
The 2010 median selling price for a home in Carroll County was $190,000. The annual household income required to meet the standard of affordability is $50,680. Fifty-‐six percent of MWV households earned less than $50,000 in 2010 and 37% earned less than $35,000. 3
The 2010 median gross rental cost (rent plus utilities) in Carroll County was $870 per month. A retail worker, earning the 2010 median hourly wage of $10.86, would have to work 67 hours per week and a hospitality worker earning the median hourly wage of $9.73 would have to work 75 hours per week to meet the standard of affordability.4 There is substantial failure in the MWV housing market with respect to the needs of low to moderate wage earners.
Nearly 40% of housing units in MWV are second homes5, taking up large amounts of land, driving up values, and altering the demand side of the equation. Second homes also generate the demand for workers, but the rise in property values and subsequent housing costs make it unaffordable for low to moderate wage earners to live within a reasonable distance of their workplace. Understanding the secondary or “multiplier” effects of the second home industry is key to resort community planning.
The MWV population is getting bigger and older faster than the two states in which its towns reside. The region realized a population increase of 30% between 1990 and 2010, signi\icantly outpacing the rate of increase for NH and Maine. The MWV median age grew by 6.2 years between 2000 and 2010 and, on April 1, 2010, there were more homes with adults over the age of 64 than children under the age of 18.6 An aging population will change the pattern of housing needs and preferences, alter the nature of the demand for services, change transportation requirements, and challenge existing planning practices.
The local housing market has failed to provide a range of units that are affordable to workers who are employed in the industries that comprise the great majority of MWV’s economic base. The region’s great dependence on tourism and its large inventory of second homes are two factors that continue to impact the demand for workforce housing and the affordability gap for workers. An emerging factor that will increase the demand for services, exacerbate the existing need for
Housing Matters in Mt. Washington Valley
1

workforce housing, and challenge existing community planning practices is the region’s aging population. Sustainable strategies that can be implemented to encourage the creation of an adequate supply of affordable housing for all age groups include removing barriers to development, providing developer incentives, and other inclusionary zoning mechanisms.
The MWVHC looks forward to helping communities acquire the necessary resources to develop smart growth, sustainable policies that encourage the development of accessible, affordable housing while protecting the natural amenities that make this region a quality place in which to live, work, and play.
Executive Summary
2
1 MWVEC/MWVHC Employer Survey, 2011
2U. S. Census, American Community Survey, 2006 - 2010 Estimates, Housing Characteristics
3 U. S. Census, American Community Survey, 2006 - 2010 Estimates; Income Statistics
4 NH Bureau of Employment Security; New Hampshire Association of Realtors
5 2010 U. S. Census Report; Housing Occupancy
6 2000 & 2010 Census Reports; Household Counts
Onsite Management : 603-356-7031 / 888-667-9636 [email protected] Leasing Info : 617-965-9700 [email protected]
2 Common CourtNorth Conway, NH
1498 White Mtn. Highway North Conway, NH
19 Barnes RoadNorth Conway, NH

T h e I m p a c t o f H o u s i n g o n t h e R e g i o n ’ s E c o n om y
In order to assess the degree to which housing is impacting the regional economy, the MWVHC partnered with the Economic Council to conduct an employer survey in September of 2011. One hundred and twenty businesses representative of the Valley’s economic base were targeted. Letters explaining the objective of the survey and requesting participation were mailed in August and appointments were scheduled with willing participants in a follow up phone call.
Business Visitation Blitz Day took place on September 19th, 2011. Individual board members from each of the partnering organizations met with business owners and/or managers at their workplace to complete the survey and discuss business concerns. Eighty surveys were completed; in some instances the surveys were completed prior to Blitz Day and mailed back to the Economic Council.
Service sector employment represents 75% of total employment. in MWV.1
Housing Matters in Mt. Washington Valley
3
Survey Respondents Were Very Representative of Total Employment in MWV
MWV Employer Survey Respondents Total Employment in MWV
Survey Respondents Were Fairly Representative of Service Sector Employment in MWV

Key Findings from the MWV Employer Survey:
✦ 92% of survey respondents agree that rental costs are high relative to income.✦ 81% agree that home purchase prices are high relative to income.✦ 63% agree that there is a short supply of available rental housing.✦ 59% believe that the proximity of affordable housing is a problem.✦ 50% believe that the quality of affordable housing is an issue. ✦ 28% agree that business should play an active role in communicating housing issues and
inVluencing policy. ✦ The great majority of municipal, retail, hospitality, and recreation employers report that the
ability to expand their business is signiVicantly impacted by an inadequate supply of affordable housing options. Higher paying industries are impacted, but to a much lesser degree.
✦ The great majority of municipal, retail, hospitality, and recreation employers report that their ability to retain employees is signiVicantly impacted by an inadequate supply of affordable housing options. Higher paying industries are impacted, but to a much lesser degree.
✦ The great majority of municipal, retail, hospitality, and recreation employers report that their ability to recruit employees is signiVicantly impacted by an inadequate supply of affordable housing. Higher paying industries are impacted, but to a much lesser degree.
Please see detailed survey responses in Appendix A.
The Impact of Housing on the Region’s Economy
4
1 Occupational Employment Statistics; NH Bureau of Employment Security and Maine Bureau of Employment Security; 2010
RE/MAX PresidentialCommercialBayard Kennett603-387-7857
[email protected] Conway NH
603-356-9444
When location matters.
www.mwvre.com
Mt. Washington Valley, NH

A f f o r d a b i l i t y , H o u s i n g M a r k e t T r e n d s & I n c om e
De<ining AffordabilityThe generally accepted de/inition of affordability is for a household to pay no more than 30 percent of its annual income on housing. Families who pay more are considered cost burdened and may have dif/iculty affording necessities such as food, clothing, transportation, and medical care. In addition, educational opportunities are lost while cultural, recreational, and leisure activities are dramatically curtailed or cut back altogether. It is estimated that 53 percent of Mt. Washington Valley renter households are over-‐burdened with housing costs and 35 percent of Mt. Washington Valley owner households are over-‐burdened with housing costs. 1
Housing Market Trends & IncomeTwo factors determine affordability; the price of housing and the ability of people to pay that price.
In 2000, the median price for a single family home in Carroll County was $113,000. That number rose to its peak of $229,000 in 2007, an increase of 103%. After two declining years, the median selling price rebounded in 2010 to $190,000.
The annual household income required to meet the standard of affordability on a $190,000 home purchase is $50,680.
An estimated 56% of MWV households earned less than $50,000 and an estimated 37% earned less than $35,000 in 2010. 2
Housing Matters in Mt. Washington Valley
5
Source: NH Association of Realtors

In addition to the surge in home sales prices, rental prices also experienced a dramatic increase over the last decade, rising from a cost of $564 for gross monthly rent (rent plus utilities) in the year 2000 to $870 in 2010.
A retail worker, earning the 2010 median hourly wage of $10.86, would have to work 67 hours per week and a hospitality worker, earning the median hourly wage of $9.73 per hour would have to work 75 hours per week to meet the standard of affordability.3
The 2010 average weekly wage for retail, the largest private industry sector when measured by employment, was $481. Hospitality, the second largest private industry sector, paid an average weekly wage of $323, and healthcare and social assistance, the third largest industry sector, paid an average weekly wage of $626.
Wages have not kept pace with the cost of housing. The median sales price for a single family home increased by 68%, the monthly median gross rental cost (rent plus utilities)increased by 54%, and the median household income increased by 21%. There is substantial market failure, with respect to low and moderate wage earners.
Affordability, Housing Market Trends & Income
6
1 American Community Survey, 2006 - 2010 Estimates: Owner and Renter Costs
2 American Community Survey, 2006 - 2010 Estimates: Income Statistics
3 NH Bureau of Employment Security; New Hampshire Association of Realtors
Source: NH Housing Finance Authority

Housing Matters in Mt. Washington Valley
7
x� REMODELING x� RESIDENTIAL x� COMMERCIAL x� SITE WORK x� CONSTRUCTION MANAGEMENT
ONE OF MOUNT WASHINGTON VALLEY’S MOST RESPECTED COMPANIES FOR OVER 35 YEARS
P. O. BOX 1880 NO. CONWAY, NH 03860
(603) 356-3401 VOICE (603) 356-5492 FAX
WWW.GLENBUILDERS.COM
Glen Builders Inc. GENERAL CONTRACTOR

H o u s i n g S u p p l y a n d D em a n d
Housing InventoryHousing inventory is de/ined as the total number of units in a region. According to the U.S. Census Bureau, on April 1, 2010, the of/icial count of housing units in MWV towns was 24,520. The Census breaks down the inventory further into “occupied” and “vacant” units. A housing unit is considered occupied if it is claimed as a primary residence for one or more people on April 1 of the census year and it is considered vacant if it is not. On April 1, 2010, 56% of housing units in MWV were occupied and 44% were vacant.
Of the region’s 10,739 vacant homes, 89% were categorized as second homes; housing units of various kinds, whose owners maintain a primary residence elsewhere and who spend only part of their time in the MWV region. The very high percentage of second homes is due to the fact that the region has evolved from the provision of general tourism products and services to also becoming a desirable place to own a second home.
Second home inventory takes up large amounts of land. As a result, second home values and the land surrounding them rise above that normally paid for workforce housing. The second home market alters the demand side of the equation. Even if homes are
available for rent and purchase, many workers cannot afford the monthly costs.
The Second Home Phenomenon In Tourist Based EconomiesTypically, in a second home resort community there is initial development and maturation of a traditional tourism industry. However, over time, second homes become a large and often dominant part of the physical, economic, and social landscape. Their development creates a demand for workers above that of the traditional tourist industry, especially in housing construction but also in home maintenance, operation and use.
Second homeowners pay taxes, insurance, and utility costs. When they come to the region, second homeowners shop in retail establishments and eat in restaurants. As their numbers increase, and the land available for development decreases, a dilemma is created. Second homes have generated the need for more workers, but the rise in property values and subsequent housing costs have made it dif/icult for the workers to live within a reasonable distance of their workplace. Knowledge of the effects of the second home industry is essential to resort community planning, including understanding and anticipating the secondary or “multiplier” effects of the industry.1
Housing Matters in Mt. Washington Valley
8
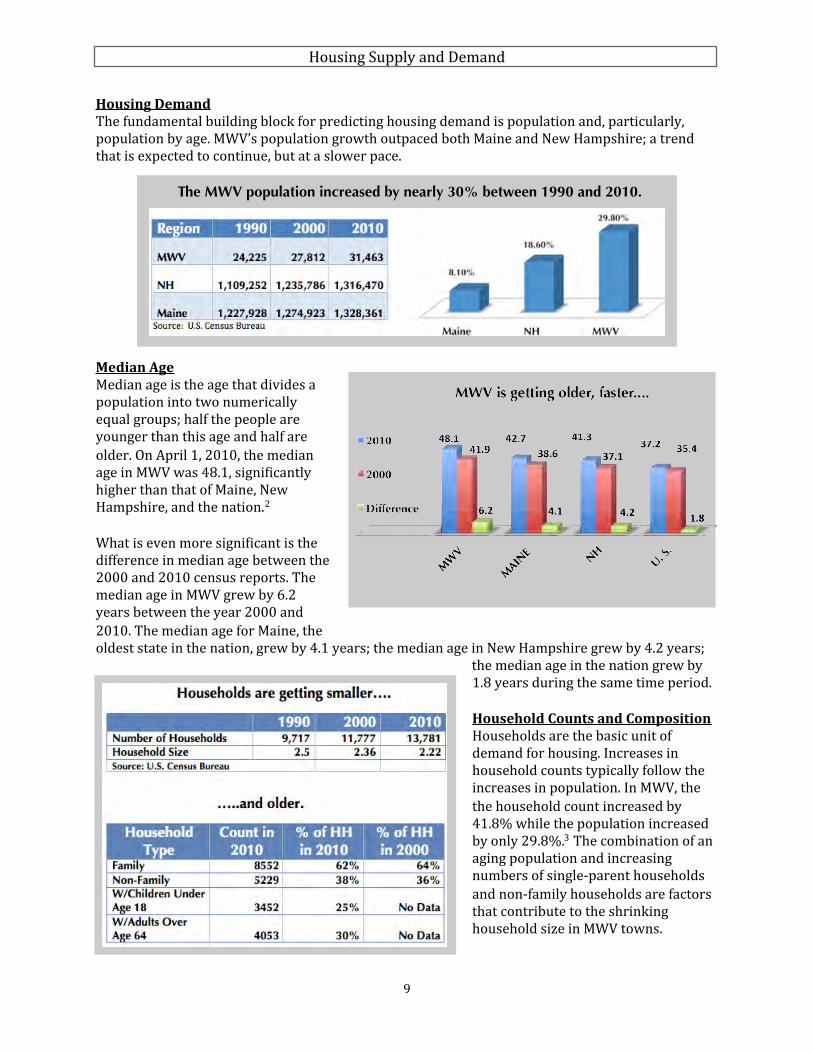
Housing DemandThe fundamental building block for predicting housing demand is population and, particularly, population by age. MWV’s population growth outpaced both Maine and New Hampshire; a trend that is expected to continue, but at a slower pace.
Median AgeMedian age is the age that divides a population into two numerically equal groups; half the people are younger than this age and half are older. On April 1, 2010, the median age in MWV was 48.1, signi/icantly higher than that of Maine, New Hampshire, and the nation.2
What is even more signi/icant is the difference in median age between the 2000 and 2010 census reports. The median age in MWV grew by 6.2 years between the year 2000 and 2010. The median age for Maine, the oldest state in the nation, grew by 4.1 years; the median age in New Hampshire grew by 4.2 years;
the median age in the nation grew by 1.8 years during the same time period.
Household Counts and CompositionHouseholds are the basic unit of demand for housing. Increases in household counts typically follow the increases in population. In MWV, the the household count increased by 41.8% while the population increased by only 29.8%.3 The combination of an aging population and increasing numbers of single-‐parent households and non-‐family households are factors that contribute to the shrinking household size in MWV towns.
Housing Supply and Demand
9
The MWV population increased by nearly 30% between 1990 and 2010.

Household composition is determined by the people living together and their relationship to one another. The U.S. Census considers a family household one that is comprised of a married couple with or without children or a single parent with children. A non-‐family household is comprised of a single person or unmarried, unrelated single people living together. On April 1, 2010, there were more homes in MWV with adults over the age of 64 than children under the age of 18.
According to a recent survey, nearly 90% of people over age 65 want to stay in their home for as long as possible, and 80% believe their current town of residence is where they will always live.4 Population aging is a signi/icant factor in both the housing market and regional economy of MWV. An aging population will challenge existing neighborhood design and community planning practices, alter the nature of the demand for services, increase the demand for workers, and change transportation requirements.
Community planning practices that encourage affordable housing will not only provide for an aging population, they will also attract the young talent needed to staff businesses, lead companies, and build communities in which all age groups can thrive.
Housing Supply and Demand
10
1 Linda Venturoni, Patrick Long, & Richard Perdue, The Economic and Social Impacts of Second Homes in Four Mountain Resort Counties of Colorado, 2005, p.11
2 U. S. Census, 2000 and 2010 Population Statistics
3 U. S. Census; 2000 & 2010 Household Counts
4 AARP and the National Conference of State Legislatures; Aging in Place: A State Survey of Livability Policies and Practices, In Brief 190, December 2011
Source: 2010 U.S. Census Report
Housing Matters in Mt. Washington Valley
11

S u s t a i n a b l e M e a s u r e sHistory has shown that no single program or strategy will solve the affordable housing problem in a community. Developing sustainable and comprehensive approaches that attack the problem from many angles and address long-‐term needs will provide the best solutions.
Research Second Home Industry Impacts and Second Home Conversion PotentialTraditionally, residential homes and their neighborhoods have provided workers with a decent home and adequate community services. However, second homes are different in that they are not a residence, but an industry creating a demand for workers. Secondly, second homes drive up property values, including residential housing for workers. Because of this, it becomes especially important for elected ofAicials and community planners to understand and estimate the secondary effects of second homes in tourist based economies. With this information, policies can be developed by local governments to protect the natural amenities, provide for the needs of citizens, and inAluence the growth in the second home industry. To ignore this information concerning second homes casts social and economic fate to the wind.1.
Regulatory ApproachesLot size and dimensional standards, landscaped buffers, erosion control measures, road standards and other requirements can add to the costs of designing and constructing residential projects. Examining land use provisions to determine which standards might be reduced or waived, as long as undue adverse impacts to natural values do not result, can facilitate the creation of affordable lots and residences.
There are a number of regulatory approaches used to encourage the provision of affordable housing opportunities. The objective of such efforts is to create and maintain a relatively permanent stock of affordable housing units that help sustain diverse and vibrant communities, populations and economies.
Inclusionary ZoningInclusionary zoning is the term used to describe zoning regulations which allow affordable housing development as an integral part of overall development occurring within communities. Inclusionary housing provisions promote the production of affordable housing by encouraging or requiring developers to incorporate a certain percentage of affordably priced housing lots or units in development proposals.
Density bonuses and lot size reductions Density bonuses typically allow an increase in the number of market-‐rate lots or units that can be developed on a parcel in exchange for pricing some lots and units within the affordability ranges of low to moderate income households. Affordable housing density bonuses tend to range from 10 to 50 percent and occasionally up to 100 percent, depending upon the number and price ranges of affordable lots/units being constructed. The bonuses usually apply to developments larger than a certain threshold number for subdivision lots or housing units, for example, 5-‐lot/unit and greater subdivisions. The practical result of density bonuses is a reduced minimum lot size.
Simply reducing lot size requirements for the purpose of providing affordable housing units is another approach to changing dimensional standards for dwelling units. Such reductions can be applied across the jurisdiction for residential development proposals, if language that requires the construction and long-‐term maintenance of affordable dwellings accompanies the lot size reductions.
Housing Matters in Mt. Washington Valley
12

Accessory apartmentsAccessory apartments offer another approach to providing affordable housing options. Accessory apartments are self-‐contained second dwelling units built within or attached to an existing single family home. They have their own private entrances, kitchens and bathrooms. Sometimes they are permitted in converted accessory structures, such as barns, garages and sheds. In all cases, accessory apartments are smaller than the main dwelling unit, and if attached, are usually constructed to be similar in architectural style and look like part of the main house. There are often requirements placed upon the provision of adequate and safe water supplies and wastewater disposal and the application of setback, lot coverage, and parking standards.
Accessory apartments can supply housing opportunities within neighborhoods and present an effective means to disperse affordable housing throughout communities. They are not always intended to supply affordable dwelling units, however. Often homeowners add the apartments to provide additional income to themselves, use extra space and share heating and maintenance costs, or to house younger or older family members or caretakers. Many communities allow accessory apartments without restricting their use to affordable housing.
Multi-‐family developmentOne of the most effective ways to boost affordable housing options is to increase multi-‐family housing units. Multi-‐family housing can place many more units on a piece of land than single family dwellings, although very dense concentrations of units can only be accommodated in areas with public or common water supplies and wastewater disposal.
Ensuring Long-‐term AffordabilityRegulatory strategies usually provide for long-‐term affordability assurances. Otherwise, as has occurred in New Hampshire and other parts of the country, regulatory provisions in local or regional plans and ordinances offer density bonuses or waive certain requirements only to have the affordable units “escape” when the original or subsequent owners sell and reap the increased market values that have accrued over the years. Effective affordable housing strategies now address both affordability time frames and mechanisms.
The MWVHC looks forward to working with community leaders to gather the necessary tools that communities need to make informed decisions about their planning and zoning strategies.
Sustainable Measures
13
1 Linda Venturoni, Patrick Long, & Richard Perdue, The Economic and Social Impacts of Second Homes in Four Mountain Resort Counties of Colorado, 2005, p.11

Housing Matters In Mt. Washington Valley
14

C o n c l u s i o n
MWV has a housing affordability problem. The trend toward second home ownership and upscale single-‐family development is at odds with the housing demand of working families who are employed in the industries that comprise the great majority of region’s economic base.
Retail and hospitality employers report that during the recent recession they have, at times, struggled to recruit and retain an adequate workforce. The human resource manager for a major local employer said “ I can’t pay people enough to make it worth their while to drive 60 miles a day to get to and from work.” As the economy recovers, people who are currently driving long distances to get to work, may Iind other options closer to home, which will exacerbate existing recruitment and retention struggles for local employers.
Continued dependency on tourism and, in particular, the retail and hospitality industries is evidence that future demand for owner and renter housing will mirror existing demand, which is substantially weighted toward low to moderate household incomes.
An emerging factor that will further challenge communities and amplify the need for affordable housing, as well as a diversity of housing options, is the region’s aging population. Seniors will need a full continuum of housing choices in terms of forms of housing, types of tenure, and a range of services in order to age in place, live independently, and continue to be active contributors to community life. Thus far, the private housing industry has not responded to the call for affordable, accessible housing in MWV’s communities.
The greying of the MWV region can provide a stimulus for “Smart Growth” strategies and economic development. By designing more compact affordable neighborhoods, as well as an economy that meets consumer demand for services, the MWV region will realize economic and social beneIits for both younger and older generations.
History has shown that no single program or strategy will solve the affordable housing problem in a community. Developing sustainable and comprehensive approaches that attack the problem from many angles and address long-‐term needs will provide the best solutions.
Removing BarriersOutdated zoning ordinances and other local regulations can impede the successful development of workforce housing in that they limit the amount of housing that can be developed. Low density zoning has been shown to consistently reduce rental housing opportunities. Ordinances that allow for smaller minimum lot sizes, smaller home sizes, and a mix of housing types in areas that provide good access to employment, shopping, and needed services provide opportunity for the construction of affordable units for both younger and older generations.1
Housing Matters in Mt. Washington Valley
15
1 Leigh Ann King, AICP; Housing Affordability; Sustainable Community Development Code; Rocky Mountain Land Use Institute

Providing IncentivesSustainable communities also recognize the need to provide incentives to local developers so that the development of affordable housing is not just allowable, but can also provide a reasonable return on the developer’s investment. Incentives come in the form of bonus densities, waived or expedited permitting processes, and regulatory relief from development standards such as landscaping and parking provisions.2
Conclusion
16
2 Leigh Ann King, AICP; Housing Affordability; Sustainable Community Development Code; Rocky Mountain Land Use Institute
Experience a Higher Level of Service

Housing Matters in Mt. Washington Valley
17
A healthy community begins at home.
Memorial Hospital salutes the Mt. Washington Valley Housing Coalition’s work
to provide a! ordable workforce housing.
MemorialHospitalNH.org603-356-5461
Your partner for a lifetime of good health

18
CHALMERS INSURANCE GROUP3277 White Mountain HighwayNorth Conway, NH 03860Telephone: (603) 356-‐6926ChalmersInsuranceGoup.com
COOPER, CARGILL, CHANT Attorneys At Law2935 White Mountain HighwayNorth Conway, NH 03860(603) 356-‐5439coopercargillchant.com
CROSS INSURANCE AGENCY234 White Mountain HighwayConway, NH 03818(603) 447-‐5123 crossagency.com
FLATBREAD COMPANY27 White Mountain HighwayNorth Conway, NH 03860(603) 356-‐4470Klatbreadcompany.com
GLEN BUILDERSP.O. Box 1880Upper West Side Road,North Conway, NH 03860(603) 356-‐3401glenbuilders.com
JT REALTY3641 White Mountain HighwayNorth Conway, NH 03860(603) 356-‐7200jtrealty.com
KENNETT INVESTMENT PROPERTIESRemax Presidential3280 White Mountain HighwayNorth Conway, NH 03860(603) 387-‐7857mwvre.com
LEONE, MCDONNELL, & ROBERTS10 Duprey RoadNorth Conway, NH 03860(603) 356-‐6358lmrpa.com
M&M ASSURANCE GROUP, INC.3304 White Mountain HighwayNorth Conway, NH 03860Telephone: (603) 3392mmins.com
MEMORIAL HOSPITAL3073 White Mountain HighwayNorth Conway, NH 03860Telephone: (603) 356-‐5461memorialhospitalnh.org
MT. WASHINGTON VALLEY CHAMBER OF COMMERCE2617 Main St.North Conway, NH 03860(603) 356-‐3171mtwashingtonvalley.org
MT. WASHINGTON VALLEY ECONOMIC COUNCIL53 Technology Lane, Suite 100 Conway, NH 03818(603) 447-‐6622mwvec.com
NEW HAMPSHIRE CHARITABLE FOUNDATION37 Pleasant StreetConcord, NH 03301(603) 653-‐0387nhcf.org
NEW HAMPSHIRE HOUSING32 Constitution Drive Bedford, NH 03110(603) 472-‐8623nhhfa.org
NORTHWAY BANK3424 White Mountain HighwayNorth Conway, NH 03860(603) 733-‐1000northwaybank.com
OVP MANAGEMENT, INC.2 Common court, Unit C13North Conway, NH 03860Telephone: (603) 356-‐7031ovpmanagement.com
MAUREEN WESTRICKFINE RESIDENTIAL ARCHITECTUREP.O. Box 63Intervale, NH 03845Telephone: (603) 356-‐4899mwestrick.org
Thank You To Our Sponsors and Supporters
Appendix A: MWV Employer Survey Responses – September 2011
19
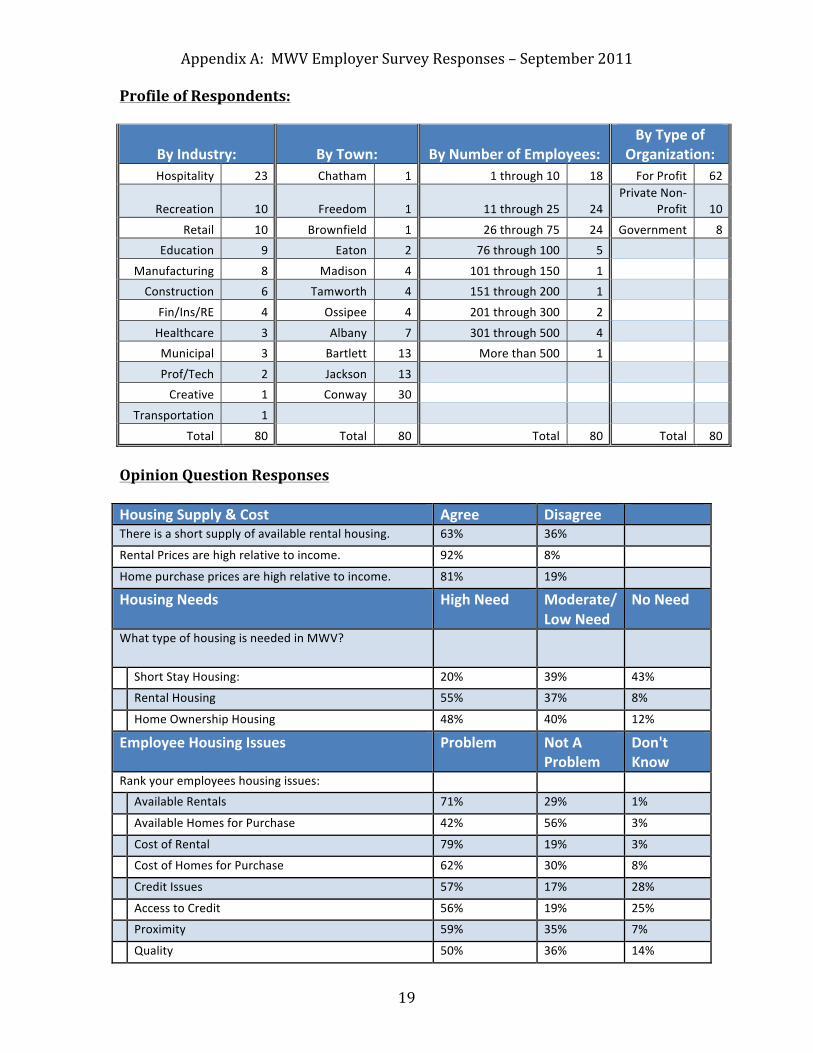
Profile of Respondents:
By Industry: By Town: By Number of Employees: By Type of
Organization: Hospitality 23 Chatham 1 1 through 10 18 For Profit 62
Recreation 10 Freedom 1 11 through 25 24 Private Non-‐
Profit 10
Retail 10 Brownfield 1 26 through 75 24 Government 8 Education 9 Eaton 2 76 through 100 5
Manufacturing 8 Madison 4 101 through 150 1 Construction 6 Tamworth 4 151 through 200 1
Fin/Ins/RE 4 Ossipee 4 201 through 300 2
Healthcare 3 Albany 7 301 through 500 4 Municipal 3 Bartlett 13 More than 500 1
Prof/Tech 2 Jackson 13 Creative 1 Conway 30
Transportation 1
Total 80 Total 80 Total 80 Total 80
Opinion Question Responses Housing Supply & Cost Agree Disagree There is a short supply of available rental housing. 63% 36%
Rental Prices are high relative to income. 92% 8%
Home purchase prices are high relative to income. 81% 19%
Housing Needs High Need Moderate/ Low Need
No Need
What type of housing is needed in MWV?
Short Stay Housing: 20% 39% 43%
Rental Housing 55% 37% 8%
Home Ownership Housing 48% 40% 12%
Employee Housing Issues Problem Not A Problem
Don't Know
Rank your employees housing issues:
Available Rentals 71% 29% 1%
Available Homes for Purchase 42% 56% 3%
Cost of Rental 79% 19% 3%
Cost of Homes for Purchase 62% 30% 8%
Credit Issues 57% 17% 28%
Access to Credit 56% 19% 25%
Proximity 59% 35% 7%
Quality 50% 36% 14%
Appendix A: MWV Employer Survey Responses – September 2011
20
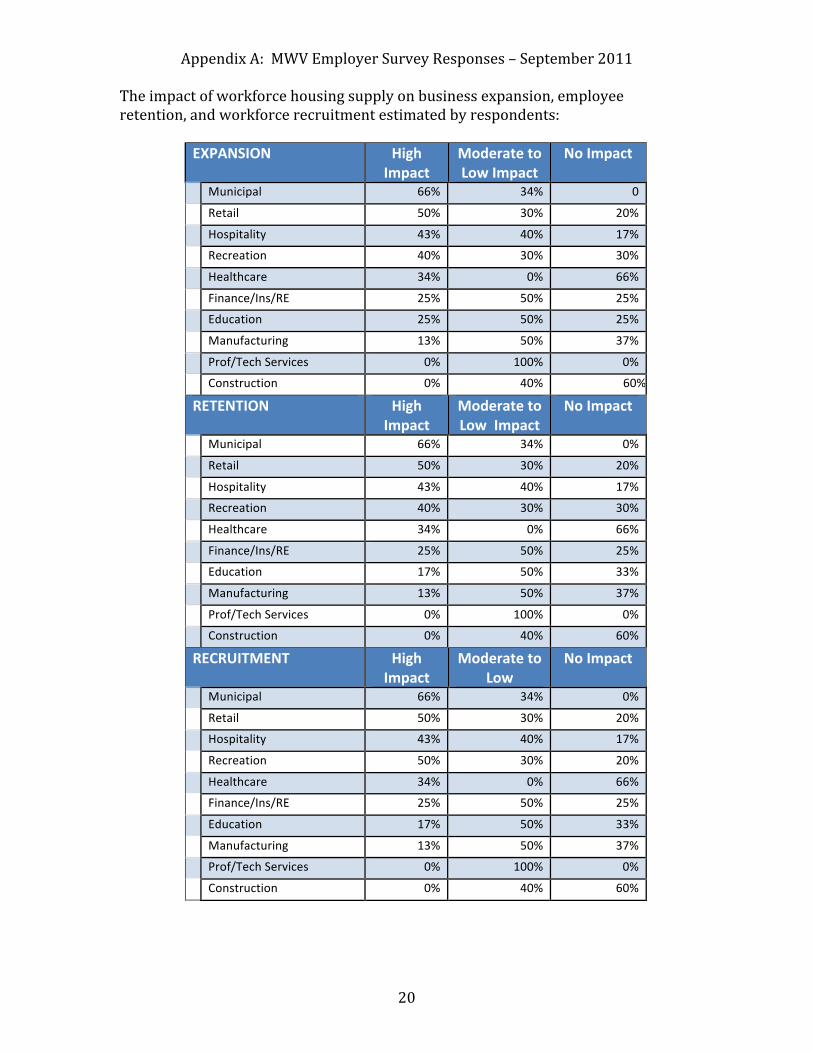
The impact of workforce housing supply on business expansion, employee retention, and workforce recruitment estimated by respondents:
EXPANSION High Impact
Moderate to Low Impact
No Impact
Municipal 66% 34% 0
Retail 50% 30% 20%
Hospitality 43% 40% 17%
Recreation 40% 30% 30%
Healthcare 34% 0% 66%
Finance/Ins/RE 25% 50% 25%
Education 25% 50% 25%
Manufacturing 13% 50% 37%
Prof/Tech Services 0% 100% 0%
Construction 0% 40% 60%
RETENTION High Impact
Moderate to Low Impact
No Impact
Municipal 66% 34% 0%
Retail 50% 30% 20%
Hospitality 43% 40% 17%
Recreation 40% 30% 30%
Healthcare 34% 0% 66%
Finance/Ins/RE 25% 50% 25%
Education 17% 50% 33%
Manufacturing 13% 50% 37%
Prof/Tech Services 0% 100% 0%
Construction 0% 40% 60%
RECRUITMENT High Impact
Moderate to Low
No Impact
Municipal 66% 34% 0%
Retail 50% 30% 20%
Hospitality 43% 40% 17%
Recreation 50% 30% 20%
Healthcare 34% 0% 66%
Finance/Ins/RE 25% 50% 25%
Education 17% 50% 33%
Manufacturing 13% 50% 37%
Prof/Tech Services 0% 100% 0%
Construction 0% 40% 60%

Appendix A: MWV Employer Survey Responses – September 2011
21
Workforce Housing Support Yes No Not
Sure Does your organization assist employees with housing issues?
26% 74%
Are you aware of incentive (inclusionary) zoning in your community?
26% 74%
Should your business play a role in communicating housing issue and influencing policy?
28% 69% 3%
Business Climate Good to Excellent
Neutral Poor to Very Poor
How do you rate your community as a place to do business?
Recreational Opportunities 99% 1% Public Services 70% 18% 12% Energy Costs 12% 41% 47% Transportation Costs 22% 35% 42% Labor Costs 56% 35% 9% Housing Costs 10% 36% 54% Ready & Able Workforce 26% 28% 46% Commercial Land & Buildings 25% 47% 28% Local Taxes 27% 36% 37% State Taxes 37% 385 25%

Appendix(B:((Average(Annual(Employment
INDUSTRY
Albany
Bartlet
t
Chatha
m
Conwa
y
Eaton
Freedo
m
Hart's
Jackso
n
Madison
Ossipe
e
Tamwo
rth
Fryebu
rg
Brown
field
MWV
Goods
Agri.(&(Forest.
n43
nn
20
70
133
266
((((((((
Construction
32
n368
n10
26
n51
22
509
1,018
((((
Manufacturing
n430
154
25
47
312
968
1,936
((((
Total(Goods
32
841
10
180
25
118
404
1,610
((((
3,220
((((
Services
Retail
20
((((((((((
123
((((((((
2,268
((((
9((((((((((((
30
((((((((((
26
((((((((((
421
((((((((
22
((((((((((
149
((((((((
28
((((((((((
3,096
((((
Accom/Food
28
((((((((((
533
((((((((
1,729
((((
67
((((((((((
274
((((((((
15
((((((((((
238
((((((((
94
((((((((((
2,978
((((
Health/Social
n1,091
((((
nn
nn
102
((((((((
423
((((((((
1,616
((((
Arts/Ent/Rec
n320
((((((((
nn
n65
((((((((((
385
((((((((
Other
n16
((((((((((
200
((((((((
n29
((((((((((
58
((((((((((
35
((((((((((
38
((((((((((
376
((((((((
Prof/Tech
nn
183
((((((((
4((((((((((((
nn
50
((((((((((
n67
((((((((((
304
((((((((
Finance/Ins
n188
((((((((
n33
((((((((((
n33
((((((((((
254
((((((((
Inform
ation
n208
((((((((
nn
nn
6((((((((((((
214
((((((((
Wholesale
120
((((((((
nn
39
((((((((((
19
((((((((((
178
((((((((
Admin/W
aste
n124
((((((((
nn
17
((((((((((
26
((((((((((
11
((((((((((
178
((((((((
Real(Estate
34
((((((((((
129
((((((((
nn
6((((((((((((
n169
((((((((
Trans/Wareh
n82
((((((((((
nn
n13
((((((((((
n95
((((((((((
Total(Services
48
((((((((((
706
((((((((
6,642
((((
80
((((((((((
333
((((((((
58
((((((((((
884
((((((((
348
((((((((
716
((((((((
28
((((((((((
9,843
((((
Government
Federal
^((((((((
15
((((((((((
^((((((((
86
((((((((((
^((((((((
6((((((((((((
^((((((((
3((((((((((((
2((((((((((((
12
((((((((((
7((((((((((((
131
((((((((
State
^((((((((
9((((((((((((
^((((((((
93
((((((((((
^((((((((
4((((((((((((
5((((((((((((
^((((((((
38
((((((((((
51
((((((((((
200
((((((((
Local
4((((((((((((
112
((((((((
12
((((((((((
579
((((((((
5((((((((((((
54
((((((((((
^((((((((
39
((((((((((
100
((((((((
460
((((((((
90
((((((((((
1,455
((((
Total(Gov
4((((((((((((
136
((((((((
12
((((((((((
759
((((((((
5((((((((((((
64
((((((((((
5((((((((((((
103
((((((((
509
((((((((
147
((((((((
1,786
((((
TOTAL
14,849
n(=(data(exists(but(does(not(meet(disclosure(standards.
Prepared(by:((Economic(and(Labor(Market(Inform
ation(Bureau,(NH(Employment(Security(&(M
aine(Employment(Security
22

Appendix C: 2010 Owner & Renter Costs as a Percentage of Household (HH) Income
23
OWNER UNITS RENTER UNITS
Town
Total Number of Units
Number of Units Paying 30%+ of HH Income
Percentage of Units Paying
30%+ of HH Income
Total Number of Units
Number of Units Paying 30%+ of HH Income
Percentage of Units
Paying 30%+ of HH Income
Albany 279 109 39% 41 21 51%
Bartlett 973 231 24% 249 114 46%
Chatham 142 36 25% 19 19 100%
Conway 2,850 901 32% 1,377 715 52%
Eaton 150 53 35% 25 3 12%
Freedom 490 181 37% 34 7 21%
Hart's Loc 14 4 29% 7 7 100%
Jackson 308 67 22% 41 10 24%
Madison 791 248 31% 141 72 51%
Ossipee 1,399 593 42% 224 182 81%
Tamworth 986 407 41% 156 65 42%
Brownfield 454 163 36% 55 26 47%
Fryeburg 1,042 448 43% 241 145 60%
MWV 9,878 3441 35% 2,610 1,386 53% Appendix D: 1998 – 2010 Median Sales and Gross Rental Costs In Carroll County
Median Sales Price Median Gross Year Units Sold For Residential Homes Rental Cost 1998 1,209 $95,000 $534 1999 1,377 $96,500 $541 2000 1,379 $113,000 $564 2001 1,277 $129,900 $609 2002 1,363 $146,000 $602 2003 1,372 $169,000 $650 2004 1,532 $199,000 $750 2005 1,420 $210,000 $749 2006 1,166 $220,000 $816 2007 738 $229,000 $812 2008 648 $205,000 $882 2009 713 $185,000 $868 2010 717 $190,000 $870
Median Sales Price Source: NH Association of Realtors
Median Gross Rental Cost Source: NH Housing Finance Authority

!24!
Appendix!E:!!20
10!Estim
ated!H
ousehold!Income
!in!MWV!T
owns!
!De
scrip
tion+
Alba
ny+
Bartlett+
Chatha
m+
Conw
ay+
Eaton+
Free
dom+
Hart's+Loc.+
Estim
ated
+#+of+H
ouseho
lds+
337+
+1,250
++16
5++4,296
++17
8+54
1+27
+Med
ian+Ho
useh
old+Income+
+$52
,548
+++$44
,663
+++$49
,792
+++$44
,034
+++$53
,929
+++$45
,030
+++$37
,917
++Pe
rcen
tage+of+H
ouseho
lds+M
aking:+
++
++
++
Less+th
an+$10
,000
+3.9%
+2.0%
+3.00
0%+
9.10
%+
3.90
%+
3.30
%+
0%+
$10,00
0+to+$14
,999
+8.3%
+6.2%
+2.40
0%+
6.00
%+
6.70
%+
5.70
%+
0%+
$15,00
0+to+$24
,999
+21
.7%+
7.0%
+7.90
0%+
10.80%
+10
.10%
+10
.40%
+29
.60%
+$2
5,00
0+to+$34
,999
+8.9%
+13
.6%+
15.800
%+
14.10%
+3.40
%+
15.50%
+18
.50%
+$3
5,00
0+to+$49
,999
+5.9%
+31
.0%+
21.200
%+
14.90%
+20
.20%
+24
.80%
+37
.00%
+$5
0,00
0+to+$74
,999
+19
.3%+
20.8%+
17.000
%+
21.30%
+25
.30%
+15
.90%
+0%
+$7
5,00
0+to+$99
,999
+11
.6%+
6.5%
+16
.400
%+
12.50%
+15
.70%
+11
.30%
+0%
+$1
00,000
+to+$14
9,99
9+11
.6%+
8.3%
+6.10
0%+
4.70
%+
9.60
%+
8.50
%+
14.80%
+$1
50,000
+to+$19
9,99
9+0.0%
+1.5%
+6.70
0%+
4.40
%+
5.10
%+
0.70
%+
0%+
$200
,000
+or+m
ore+
8.9%
+3.0%
+3.60
0%+
2.40
%+
0.00
%+
3.90
%+
0%+
Descrip
tion+
Jackson+
Mad
ison+
Ossipee+
Tamworth+
Brow
nfield+
Fryebu
rg+
MWV$
Estim
ated
+#+of+H
ouseho
lds+
359+
952+
1,70
7++1,172
++52
6+1,32
7++12,83
7++
Med
ian+Ho
useh
old+Income+
+$63
,068
+++$55
,808
+++$44
,967
+++$49
,545
+++$41
,544
+++$36
,925
++10
0.00
%+
Percen
tage+of+H
ouseho
lds+M
aking:+
++
++
++
Less+th
an+$10
,000
+2.80
%+
1.80
%+
9.40
%+
6.40
%+
3.20
%+
10.50%
+6.84
%+
$10,00
0+to+$14
,999
+4.50
%+
1.60
%+
10.60%
+6.20
%+
8.90
%+
7.60
%+
6.56
%+
$15,00
0+to+$24
,999
+8.60
%+
8.25
%+
7.40
%+
11.60%
+16
.20%
+10
.80%
+10
.28%
+$2
5,00
0+to+$34
,999
+2.80
%+
13.60%
+11
.00%
+11
.90%
+14
.40%
+18
.20%
+13
.33%
+$3
5,00
0+to+$49
,999
+21
.40%
+18
.00%
+19
.70%
+14
.60%
+15
.00%
+18
.50%
+18
.25%
+$5
0,00
0+to+$74
,999
+20
.15%
+21
.40%
+23
.00%
+23
.50%
+24
.00%
+20
.40%
+21
.35%
+$7
5,00
0+to+$99
,999
+10
.60%
+18
.50%
+12
.10%
+11
.40%
+12
.50%
+5.40
%+
11.41%
+$1
00,000
+to+$14
9,99
9+15
.90%
+12
.40%
+4.30
%+
6.10
%+
3.20
%+
5.10
%+
6.44
%+
$150
,000
+to+$19
9,99
9+1.90
%+
0.00
%+
0%+
2.10
%+
1.90
%+
3.50
%+
2.49
%+
$200
,000
+or+m
ore+
11.40%
+4.80
%+
2.40
%+
6.10
%+
0.60
%+
0%+
3.05
%+
Source:+U
.S.+C
ensus+B
ureau,+200
6X20
10+American
+Com
mun
ity+Survey++
++
++++++++++++++++++++
+

!25!
Appendix!F:!!Av
erage!W
eekly!Wages!By
!Town
!and!Industry!
! !Tow
n!To
tal!o
f!All!
Occup
ations!
Agric
ulture!&!
Forestry!
Constructio
n!Man
u9facturing!
Retail!
Trad
e!Hea
lth!&!
Social!Asst.!
Arts!&!
Recrea
tion!
Accom.!&
!Fo
od!Serv.!
Albany'
'$46
9.17
''$''''''''''0''''''''
'$66
9.95
''$''''''''''0'''''''''$5
27.52''
'$''''''''''0''''''''
$''''''''''0'''''''''$
243.24
''Ba
rtlett'
'$40
7.12
'''n''
'n''
n''$31
9.48
'''n''
'n''
'$33
3.26
''Ch
atham'
'n''
'$''''''''''0'''''''''''
'n''
n''n''
'$''''''''''0''''''''''''$
''''''''''0''''''''''''$''''''''''0'''''''''''
Conw
ay'
'$57
4.62
'''$83
3.60
'''$75
6.05
'''$68
3.17
'''$46
2.33
'''$82
8.20
'''$26
6.08
'''$36
3.05
''Eaton'
'$68
8.90
'''n''
'n''
'n''
'n''
$''''''''''0'''''''''''''$''''''''''0'''''''''''
n'Freedo
m'
'$61
5.85
'''n''
'n''
'$''''''''''0''''''''''''$31
7.48
'''n''
'$''''''''''0''''''''''''$39
7.14
''Ha
rt's'Locatio
n''n''
'$''''''''''0'''''''''''
'$''''''''''0''''''''''''$''''''''''0'''''''''''
'n''
'$''''''''''0''''''''''''$
''''''''''0'''''''''''
'n''
Jackson'
'$47
2.39
'''$''''''''''0'''''''''''
'$51
9.61
'''$''''''''''0'''''''''''$73
5.19
'''n''
'n''
'$34
4.43
''Madiso
n''$61
2.25
'''$''''''''''0'''''''''''
'$78
1.70
'''$88
9.25
'''$61
8.31
'''n''
'n''
'n''
Ossipee'
'$61
3.49
'''n''
'$57
2.39
'''$1,12
1.22
'''$48
9.01
'''n''
'n''
'$29
8.25
''Tamworth'
'$57
6.35
'''$61
5.62
'''$78
2.82
'''$55
3.17
'''343
.11*
'''$45
9.54
'''$25
9.48
'''$24
7.22
''Fryebu
rg'
'$67
6.00
'''$70
8.00
'''$58
8.00
'''$1,03
2.00
'''534
*''
'$58
9.00
'''n''
'$36
1.00
''Brow
nfield'
'$37
5.00
'''n''
'n''
'n''
'$46
3.00
'''$''''''''''0'''''''''''
'n''
n'
''
''
''
''
'MWV'
'$55
2.83
'''$71
9.07
'''$66
7.22
'''$85
5.76
'''$48
0.94
'''$62
5.58
'''$26
2.78
''32
3.45
'n'='da
ta'exists'b
ut'doe
s'not'm
eet'd
isclosure'stan
dards'''
*'Trad
e,'Transpo
rtation,'&'Utilities'
Prep
ared
'by:''Econo
mic'and
'Lab
or'M
arket'Information'Bu
reau
s,'NH'Em
ploymen
t'Security
'&'M
aine
'Employmen
t'Security
'
!

26
Appendix G: 2010 Profile of Housing Characteristics in MWV Towns
Town Total Units
Occupied Units
Vacant Units1
Percent Occupied
Percent Vacant
Albany 560 318 242 56.80% 43.20%
Bartlett 4,115 1,307 2,808 31.80% 68.20%
Chatham 270 139 131 51.50% 48.50%
Conway 6,921 4,479 2,442 64.70% 35.30%
Eaton 291 196 95 67.40% 32.60%
Freedom 1,580 699 881 44.20% 55.80%
Hart’s Location 54 21 33 38.90% 61.10%
Jackson 1,009 399 610 39.50% 60.50%
Madison 1,877 1,075 802 57.30% 42.70%
Ossipee 3,057 1,826 1,231 59.7% 40.3%
Tamworth 1,969 1,292 677 65.60% 34.40%
Fryeburg 1,844 1,368 476 74.20% 25.80%
Brownfield 973 662 311 68% 32%
MWV Region 24,520 13,781 10,739 56.20% 43.80%
2010 U. S. Census Report: Housing Characteristics
Profile of Vacant Units
Towns For Rent
Rented, Not Occupied
For Sale
Sold, Not Occupied
Second Homes
All Other Vacant
Albany 8 -‐ 1 -‐ 223 10
Bartlett 42 5 26 4 2,691 40
Chatham 1 -‐ 3 1 121 5
Conway 151 9 95 8 2,081 98
Eaton 3 -‐ 2 1 86 3
Freedom 10 -‐ 27 1 827 16
Hart's Location -‐ -‐ 2 -‐ 30 1
Jackson 9 2 9 1 570 19
Madison 23 2 25 6 726 20
Ossipee 52 5 58 7 1,045 64
Tamworth 48 6 28 8 493 94
Fryeburg 38 3 29 7 347 52
Brownfield 3 -‐ 15 2 265 26
MWV Region 388 32 320 46 9,505 448
2010 U. S. Census Report: Housing Characteristics
1 A housing unit is considered occupied if it is claimed as a primary residence for one or more people on April 1 of the census year and it is considered vacant if it is not.

27
Appendix H: 1990, 2000, & 2010 Population Counts by Town Town
Population 1990
Population 2000
Population 2010
Increase 1990 -‐ 2010
% Increase 1990 -‐ 2010
Albany 536 654 735 199 37%
Bartlett 2,290 2,705 2,788 498 22%
Chatham 268 260 337 69 26%
Conway 7,940 8,604 10,115 2,175 27%
Eaton 362 375 393 31 9%
Freedom 935 1,303 1,489 554 59%
Hart's Location 36 37 41 5 14%
Jackson 678 835 816 138 20%
Madison 1,704 1,984 2,502 798 47%
Ossipee 3,309 4,211 4,345 1,036 31%
Tamworth 2,165 2,510 2,856 691 32%
Fryeburg 2,968 3,083 3,449 481 16%
Brownfield 1,034 1,251 1,597 563 54%
MWV 24,225 27,812 31,463 7,238 30%
NH 1,109,252 1,235,786 1,316,470 207,218 19%
MAINE 1,227,928 1,274,923 1,327,567 99,639 8%
Source: 1990, 2000, & 2010 U. S. Census Reports
Appendix I: 2010 Median Age by Town
Town 2000 2010 Difference Albany 37.4 45.6 8.2
Bartlett 41.5 49.0 7.5
Chatham 40.8 45.1 4.3
Conway 39.9 44.5 4.6
Eaton 45.3 55.2 9.9
Freedom 48.6 53.1 4.5
Hart's Location 39.3 47.5 8.2
Jackson 45.6 54.3 8.7
Madison 39.6 47.4 7.8
Ossipee 41.5 47.4 7.8
Tamworth 40.6 47.6 7.0
Brownfield 43.1 44 0.9
Fryeburg 41.1 44.8 3.7
New Hampshire 37.1 41.3 4.2
Maine 38.6 42.7 4.1
Source 2010 U. S. Census Report
28
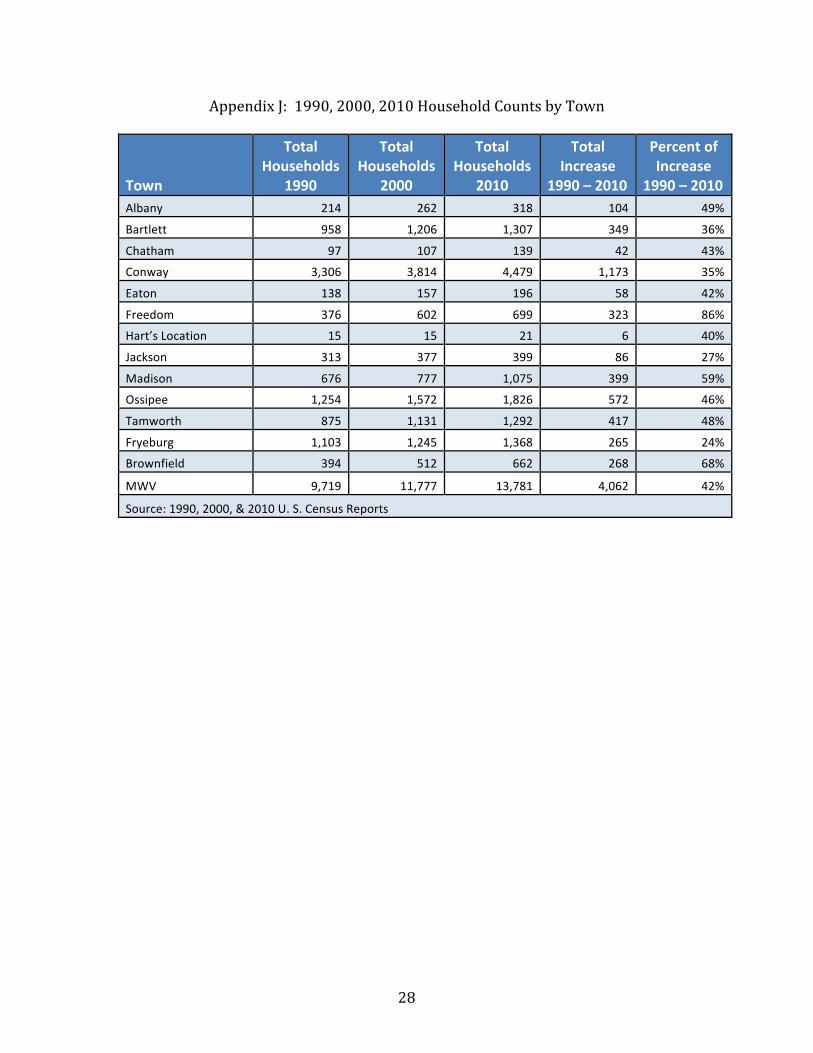
Appendix J: 1990, 2000, 2010 Household Counts by Town
Town
Total Households
1990
Total Households
2000
Total Households
2010
Total Increase
1990 – 2010
Percent of Increase
1990 – 2010 Albany 214 262 318 104 49%
Bartlett 958 1,206 1,307 349 36%
Chatham 97 107 139 42 43%
Conway 3,306 3,814 4,479 1,173 35%
Eaton 138 157 196 58 42%
Freedom 376 602 699 323 86%
Hart’s Location 15 15 21 6 40%
Jackson 313 377 399 86 27%
Madison 676 777 1,075 399 59%
Ossipee 1,254 1,572 1,826 572 46%
Tamworth 875 1,131 1,292 417 48%
Fryeburg 1,103 1,245 1,368 265 24%
Brownfield 394 512 662 268 68%
MWV 9,719 11,777 13,781 4,062 42%
Source: 1990, 2000, & 2010 U. S. Census Reports

29
Appendix K: 2010 Household Composition by Town
Town
Total Household
2010
Family Household
2010
Non-Family
Household 2010
W/Children under 18 2010
W/Adults 65 + 2010
Albany 318 205 113 83 87
Bartlett 1,307 762 545 285 417
Chatham 139 95 44 37 41
Conway 4,479 2,638 1,841 1,153 1,209
Eaton 196 114 82 30 65
Freedom 699 457 242 133 277
Hart’s Location 21 12 9 3 5
Jackson 399 241 158 60 149
Madison 1,075 720 355 286 308
Ossipee 1,826 1,165 661 461 554
Tamworth 1,292 770 522 311 385
Fryeburg 1,368 920 448 421 399
Brownfield 662 453 209 189 157
MWV 13,781 8,552 5,229 3,452 4,053
Percent of Total 100% 62% 38% 25% 30%
2010 U. S. Census Report

Appendix L: Inventory by Town and Type of Structure
30
Albany Estimate
Bartlett Estimate
Chatham Estimate
Type of Structure Margin of Error
Margin of Error
Margin of Error
Total: 599 +/-‐72 4,074 +/-‐209 275 +/-‐58
1, detached* 462 +/-‐59 1,780 +/-‐177 256 +/-‐58
1, attached** 0 +/-‐114 73 +/-‐78 0 +/-‐114
2 12 +/-‐14 464 +/-‐131 0 +/-‐114
3 or 4 0 +/-‐114 587 +/-‐136 3 +/-‐5
5 to 9 0 +/-‐114 718 +/-‐158 0 +/-‐114
10 to 19 0 +/-‐114 248 +/-‐99 0 +/-‐114
20 or more 0 +/-‐114 126 +/-‐67 0 +/-‐114
Mobile home 125 +/-‐46 78 +/-‐56 16 +/-‐16
Boat, RV, van, etc. 0 +/-‐114 -‐ +/-‐114 0 +/-‐114
599 4,074 275
Units in Structure
Single Family 462 1,853 256
Multi-‐Family 12 2,143 3
Mobile Home & Other 125 78 16
Total 599 4,074 275
2006 -‐ 2010 American Community Survey
Type of Structure Conway Estimate
Margin of Error
Eaton Estimate
Margin of Error
Freedom Estimate
Margin of Error
Total: 6,765 +/-‐366 278 +/-‐45 1,671 +/-‐93
1, detached* 3,948 +/-‐320 247 +/-‐46 1,381 +/-‐95
1, attached** 27 +/-‐28 3 +/-‐6 0 +/-‐114
2 247 +/-‐127 7 +/-‐11 13 +/-‐15
3 or 4 666 +/-‐211 21 +/-‐16 6 +/-‐10
5 to 9 588 +/-‐192 0 +/-‐114 92 +/-‐24
10 to 19 327 +/-‐190 0 +/-‐114 5 +/-‐9
20 or more 192 +/-‐113 0 +/-‐114 0 +/-‐114
Mobile home 770 +/-‐211 0 +/-‐114 174 +/-‐74
Boat, RV, van, etc. 0 +/-‐114 0 +/-‐114 0 +/-‐114
6,765 278
1,671
Units in Structure
Single Family 3975 250
1381 Multi-‐Family 2020 28
116
Mobile Home & Other 770
174 Total 6765 278 1671 2006 -‐ 2010 American Community Survey
• Single Family Detached Home ** Single Family Attached – Row House or Town House

Appendix L: Inventory by Town and Type (Cont.)
31
Type of Structure
Hart's Location Estimate
Margin
of Error
Jackson Estimate
Margin of Error
Madison Estimate
Margin of Error
Ossipee Estimate
Margin of Error
Total: 60 +/-‐23 954 +/-‐101 1,922 +/-‐134 3,122 +/-‐231
1, detached* 60 +/-‐23 735 +/-‐81 1,745 +/-‐129 2,373 +/-‐239
1, attached** 0 +/-‐114 27 +/-‐22 21 +/-‐23 -‐ +/-‐114
2 0 +/-‐114 55 +/-‐37 19 +/-‐21 96 +/-‐77
3 or 4 0 +/-‐114 126 +/-‐42 0 +/-‐114 139 +/-‐90
5 to 9 0 +/-‐114 11 +/-‐18 23 +/-‐36 98 +/-‐63
10 to 19 0 +/-‐114 0 +/-‐114 8 +/-‐12 -‐ +/-‐114
20 or more 0 +/-‐114 0 +/-‐114 41 +/-‐48 -‐ +/-‐114
Mobile home 0 +/-‐114 0 +/-‐114 65 +/-‐43 416 +/-‐113
Boat, RV, van, etc. 0 +/-‐114 0 +/-‐114 0 +/-‐114 -‐ +/-‐114
60 954 1,922 3,122
Units in Structure Single Family 60 762 1,766 2,373 Multi-‐Family 192 91 333 Mobile Home & Other 65 416 Total 60 954 1,922 3,122
2006 -‐ 2010 American Community Survey Tamworth Brownfield Fryeburg
Type of Structure Estimate Margin of Error
Estimate Margin of Error3
Estimate4 Margin of Error5
Total: 1,841 +/-‐162 882 +/-‐65 1,828 +/-‐169
1, detached 1,456 +/-‐139 815 +/-‐69 1,514 +/-‐187
1, attached -‐ +/-‐114 0 +/-‐104 -‐ +/-‐104
2 9 +/-‐11 11 +/-‐12 35 +/-‐34
3 or 4 42 +/-‐44 13 +/-‐13 40 +/-‐26
5 to 9 55 +/-‐36 0 +/-‐104 49 +/-‐60
10 to 19 36 +/-‐34 0 +/-‐104 27 +/-‐40
20 or more 12 +/-‐10 0 +/-‐104 -‐ +/-‐104
Mobile home 231 +/-‐75 43 +/-‐25 163 +/-‐88
Boat, RV, van, etc. -‐ +/-‐114 0 +/-‐104 -‐ +/-‐104
1,841 882 1,828 Units in Structure
Single Family 1,456 815 1514 Multi-‐Family 154 24 151
Mobile Home & Other 231 43 163
Total 1,841 882 1828
2006 -‐ 2010 American Community Survey • Single Family Detached Home ** Single Family Attached – Row House or Townhouse

Appendix(M:((In
ventory(by(T
own(and(Ag
e(of(Structu
re(
(32(
!!Alba
ny!
!!Ba
rtlett!
!!Ch
atha
m!
!!Co
nway!
!!Ag
e!of!Hou
sing
!Units!
Estim
ate!
Margin!of!
Error!
Estim
ate!
Margin!of!
Error!
Estim
ate!
Margin!of!
Error!
Estim
ate!
Margin!of!
Error!
Built&200
5&or&later&
13&
+/-1
2 18
&+/
-29
8 +/
-9
153
+/-1
27
Built&200
0&to&200
4&42
&+/
-29
95&
+/-3
8 6
+/-1
0 52
3 +/
-190
Built&199
0&to&199
9&61
&+/
-25
170&
+/-9
6 45
+/
-36
738
+/-2
00
Built&198
0&to&198
9&10
6&+/
-41
1945
&+/
-193
25
+/
-17
1,77
9 +/
-324
Built&197
0&to&197
9&14
7&+/
-51
1024
&+/
-173
49
+/
-24
1,27
2 +/
-261
Built&196
0&to&196
9&58
&+/
-31
234&
+/-9
2 22
+/
-16
456
+/-1
69
Built&195
0&to&195
9&58
&+/
-27
107&
+/-6
0 24
+/
-17
317
+/-1
30
Built&194
0&to&194
9&35
&+/
-26
36&
+/-2
0 18
+/
-10
181
+/-9
6
Built&193
9&or&earlier&
79&
+/-3
5 44
5&+/
-116
78
+/
-38
1,34
6 +/
-261
Total&
599&
&40
74&
&27
5&&
6,76
5&&
!!Eaton!
!!Free
dom!
!!Hart's!Location!
Jackson!
!!Ag
e!of!Hou
sing
!Units!
Estim
ate!
Margin!of!
Error!
Estim
ate!
Margin!of!
Error!
Estim
ate!
Margin!of!
Error!
Estim
ate!
Margin!of!
Error!
Built&200
5&or&later&
3&+/95&
10&
+/99&
0&+/9114
&10
&+/912&
Built&200
0&to&200
4&26
&+/915&
48&
+/922&
0&+/9114
&40
&+/928&
Built&199
0&to&199
9&32
&+/917&
241&
+/986&
10&
+/913&
118&
+/940&
Built&198
0&to&198
9&46
&+/921&
551&
+/972&
15&
+/914&
258&
+/954&
Built&197
0&to&197
9&12
&+/911&
237&
+/950&
31&
+/918&
157&
+/951&
Built&196
0&to&196
9&31
&+/917&
214&
+/953&
4&+/96&
190&
+/951&
Built&195
0&to&195
9&30
&+/918&
67&
+/933&
0&+/9114
&53
&+/933&
Built&194
0&to&194
9&7&
+/98&
76&
+/936&
0&+/9114
&21
&+/917&
Built&193
9&or&earlier&
91&
+/930&
227&
+/956&
0&+/9114
&10
7&+/943&
Total&
278&
&1,67
1&&
60&
&95
4&&
2006
&–&201
0&Am
erican
&Com
mun
ity&Survey!
&&
&&
&&
&

Appendix(M:((In
ventory(by(Town(and(Ag
e(of(Structu
re(
(33(
!!M
adis
on
O
ssip
ee
Ta
mw
orth
Bro
wnf
ield
!!Es
timat
e M
argi
n of
Er
ror
Estim
ate
Mar
gin
of
Erro
r Es
timat
e M
argi
n of
Er
ror
Estim
ate
Mar
gin
of
Erro
r To
tal:!
1,92
2 +/
-134
3
,122
+/
-231
1,
841
+/-1
62 882!
+/-6
5 Bu
ilt&200
5&or&later&
54
+/-4
7 1
34
+/-7
0 38
+/
-32
24&
+/-1
6 Bu
ilt&200
0&to&200
4&20
6 +/
-81
330
+/
-126
28
+/
-27
81&
+/-3
8 Bu
ilt&199
0&to&199
9&28
6 +/
-84
262
+/
-111
17
5 +/
-53
146&
+/-3
9 Bu
ilt&198
0&to&198
9&44
9 +/
-102
7
12
+/-1
57
353
+/-8
4 167&
+/-4
9 Bu
ilt&197
0&to&197
9&28
8 +/
-92
720
+/
-200
38
6 +/
-100
161&
+/-4
1 Bu
ilt&196
0&to&196
9&23
3 +/
-93
169
+/
-84
252
+/-8
0 40&
+/-1
6 Bu
ilt&195
0&to&195
9&10
6 +/
-60
219
+/
-98
47
+/-3
1 41&
+/-2
2 Bu
ilt&194
0&to&194
9&61
+/
-45
61
+/
-52
0 +/
-114
98&
+/-3
7 Bu
ilt&193
9&or&
earlier&
239
+/-7
6 5
15
+/-1
49
562
+/-1
34
124&
+/-3
6 &&
1,922&
&&&3,122&&&&
1,841&
&&882&
&&!!
Frye
burg
!!
&&
&&
&&
!!Es
timat
e M
argi
n of
Er
ror
&&
&&
&&
Total:!
1828!
+/-1
69 &
&&
&&
&Bu
ilt&200
5&or&later&
55&
+/-4
9 &
&&
&&
&Bu
ilt&200
0&to&200
4&86&
+/-5
9 &
&&
&&
&Bu
ilt&199
0&to&199
9&145&
+/-9
1 &
&&
&&
&Bu
ilt&198
0&to&198
9&300&
+/-1
12 &
&&
&&
&Bu
ilt&197
0&to&197
9&331&
+/-1
08 &
&&
&&
&Bu
ilt&196
0&to&1969&
65&
+/-4
7 &
&&
&&
&Bu
ilt&195
0&to&195
9&84&
+/-6
4 &
&&
&&
&Bu
ilt&194
0&to&194
9&166&
+/-8
5 &
&&
&&
&Bu
ilt&193
9&or&
earlier&
596&
+/-1
54 &
&&
&&
&&&
1828&&&
&&
&&
&&
&

Housing Matters in Mt. Washington Valley
34
NEW HAMPSHIRE’S WORKFORCE HOUSING LAW – RSA 674:58-61
Why It’s Important to New Hampshire’s Economic Recovery & Growth
A balanced housing market is essential to New Hampshire’s economy.
For years the state has been faced with a shortage of housing for low and moderateincome families – the backbone of our labor force.
Home prices have fallen to 2003 levels but this was a time when prices were alreadyvery unaffordable. Rental housing costs have not dropped at all.
When our economy is strong there is a demand for new entry level housing. Local
zoning that prevents the market from meeting this demand inhibits economicgrowth.
As our economy recovers, the demand for good starter homes and rentals will
increase. The law gives municipalities the ability to determine the best location fornew workforce housing.
The workforce housing law gives the free market an opportunity to create good
homes to purchase and attractive places to rent that our labor force desires.
The workforce housing law guides local officials to make decisions that
are good for their communities and good for New Hampshire.
Local officials recognize that they have a legal responsibility to provide anopportunity for the development of reasonably-priced housing.
A growing and diverse local economy yields stable property values.
The law is a carefully crafted solution that balances the needs of the free market
with New Hampshire’s strong tradition of local control. It is the consensus of a
broad coalition that includes the NH Municipal Association, the NH Business andIndustry Association, and housing advocates.
What the Law does not do
Doesn’t impose a “one size fits all” approach.
Doesn’t override local decision-makingauthority – planning remains a local issue.
Doesn’t create quotas for housing construction.
Doesn’t create an obligation to build –municipalities only need to provide a
reasonable opportunity to meet the demand for
new homes.
Doesn’t require expenditure of municipal funds
– there is no local fiscal obligation whatsoever.
Doesn’t shift the burden of proof – developersstill must prove their case before a local board
and in court if they appeal.
Doesn’t interfere with a community’s ability toprotect the environment, or otherwise address
valid health, safety, or natural resource
protection issues.
What the Law does
Provides great flexibility to meet the demand
for housing in a municipality.
Protects municipalities from frivolous lawsuits
by providing a clear local process for
determining a development’s economicviability.
Gives local boards the authority to require
demonstration of developers’ costs in meetinglocal requirements.
Provides safeguards to address the legitimate
need of a community to regulate developmentfor environmental and public safety concerns.
Includes a definition of “affordable” by relating
housing cost with the incomes of the local
workforce.
Recognizes that some communities have
already provided their fair share of workforce
housing.

whereyouplayyouplayyouworkwhereworkwhere
LEADERSHIP • INNOVATION • RESPONSIBLE GROWTH
MWVEC.COM • 603-447-6622 MTWASHINGTONVALLEY.ORG • 877-948-6867
MOUNT WASHINGTON VALLEY
BUSINESS VISITORS

Our goal is simple. We want to help New Hampshire’s working families achievesuccessful homeownership by offering affordable mortgage loans and other assistance.
Why a New Hampshire Housing mortgage?
Here are six excellent reasons to choose one of our mortgage products when you purchase a home:
• Great fi xed rates• Money available for downpayment and closing costs• Free homebuyer education classes • Money available for property renovations if you purchase a fi xer-upper • Options for private mortgage insurance as well as government insured • No hidden fees
And the best part?
We’re not just for fi rst-time homebuyers anymore.
www.GoNewHampshireHousing.com1-800-649-0470