base metals such as copper and zinc are widely used …/media/files/a/anglo-american-plc-v2/... ·...
TRANSCRIPT

Base metals such as copper and zinc are widely used in communications and information technology
Base Metals

46 | Anglo American plc Fact Book 2007/8
Base Metals
Financial highlights
In 2007, Copebrás was reclassified from Industrial Minerals to Base Metals, to align with internal management reporting. As such, all the data presented above has been reclassified for the Copebrás results.

Anglo American plc Fact Book 2007/8 | 47
Base Metals
Financial dataUS$m 2007(1) 2006 2005 2004 2003 2002
Turnover(2)
Subsidiaries 5,746 5,092 3,224 2,883 1,932 1,029 Joint Ventures 1,383 1,442 712 611 323 413 Associates – – – 88 60 58 Total turnover 7,129 6,534 3,936 3,582 2,315 1,500 Of which: Copper: 4,507 4,537 2,597 2,154 1,247 Collauhasi 1,383 1,442 712 611 323 Anglo American Sur (formerly Minera Sur Andes) 2,273 2,219 1,306 991 587 Anglo American Norte (formerly Mantos Blancos) 851 876 579 464 277 Other – – – 88 60 Nickel, Niobium, Mineral Sands and Phosphates 1,583 1,081 898 790 561 Catalão 106 66 49 44 39 Codemin 325 219 136 89 56 Loma de Níquel 553 334 249 247 136 Namakwa Sands and other 184 180 175 148 141 Copebrás 415 282 289 262 189 Zinc 1,039 916 441 638 506 Black Mountain 165 148 80 49 62 Lisheen 364 396 147 111 150 Skorpion 510 372 214 73 – Other(3) – – – 405 295 EBITDA 4,683 4,255 2,038 1,707 616 361 Of which: Copper: 3,192 3,238 1,590 1,252 447 Collauhasi 1,062 1,037 468 412 162 Anglo American Sur (formerly Minera Sur Andes) 1,630 1,640 824 608 216 Anglo American Norte (formerly Mantos Blancos) 507 563 299 225 65 Other (7) (2) (1) 7 4 Nickel, Niobium, Mineral Sands and Phosphates 842 492 344 354 198 Catalão 57 26 20 29 23 Codemin 242 144 75 48 26 Loma de Níquel 390 229 153 158 73 Namakwa Sands and other 44 52 48 38 29 Copebrás 109 41 48 81 47 Zinc 729 588 157 131 (1) Black Mountain 93 42 12 2 (5) Lisheen 242 280 62 29 13 Skorpion 394 266 83 22 – Other (3) (80) (63) (53) 48 (37) Depreciation and amortisation 345 358 331 366 295 204 Operating profit before special items and remeasurements 4,338 3,897 1,707 1,341 321 157Operating special items and remeasurements – 8 (11) (237) (208) (51)Operating profit after special items and remeasurements 4,338 3,905 1,696 1,104 113 106 Net interest, tax and minority interests (1,238) (1,242) (455) (276) (101) (71) Underlying earnings 3,100 2,655 1,252 1,065 220 86Of which: Copper: 2,060 1,908 983 855 216 80 Collauhasi 701 586 257 280 78 Anglo American Sur (formerly Minera Sur Andes) 1,026 996 529 413 111 Anglo American Norte (formerly Mantos Blancos) 340 328 195 163 28 Other (7) (2) 2 (1) (1) Nickel, Niobium, Mineral Sands and Phosphates 555 278 214 206 90 71 Catalão 60 15 17 29 18 Codemin 178 96 68 27 16 Loma de Níquel 243 134 92 108 41 Namakwa Sands and other 31 25 25 13 1 Copebrás 43 8 12 29 14 Zinc 558 525 100 37 (65) (66)Black Mountain 65 38 10 3 (6) Lisheen 174 287 54 15 4 Skorpion 319 200 36 (12) – Other(3) (73) (56) (45) (2) (84) 1Net segment assets 4,989 4,599 4,928 5,087 4,178 3,681 Capital expenditure 582 315 304 393 370 447
(1) Copebrás has been reclassified from Industrial Minerals to Base Metals to align with internal management reporting. As such the comparative data has been reclassified accordingly.
(2) 2002 and 2003 turnover is shown before deduction of TC/RC’s. All other years are shown after deduction of TC/RC’s.(3) Results for Hudson Bay for 2003 and 2004 are included within ‘Other’.

48 | Anglo American plc Fact Book 2007/8
Base Metals
Right: Mantoverde – copper anodes
Business overviewAnglo Base Metals has interests in 14 operations in six countries, producing copper, nickel, zinc, niobium, phosphate fertilisers, titanium dioxide and zircon, together with associated by-products including lead, molybdenum and silver.
In Chile, its six copper operations comprise the wholly owned Los Bronces, El Soldado, Mantos Blancos and Mantoverde mines, the Chagres smelter and a 44% interest in the Collahuasi mine. The mines also produce associated by-products such as molybdenum and silver.
Other South American operations are the Loma de Níquel nickel mine in Venezuela, and the Codemin nickel and Catalão niobium mines in Brazil. Anglo Base Metals also has a controlling interest in Copebrás, a leading Brazilian producer of phosphate fertilisers and phosphoric acid. Phosphate fertilisers are used to supplement natural soil nutrients to achieve high agricultural yields.
Operating profit2006
$3,897m2007
$4,338mEBITDA2006
$4,255m2007
$4,683m• Increased production volumes for copper in 2007
• Further upside potential in copper through Quellaveco and Michiquillay in Peru and Pebble in Alaska
• Barro Alto to boost attributable nickel output by an average of 36,000 tpa from 2011
In southern Africa, Black Mountain and Skorpion mines produce zinc and associated by-products such as lead, copper and silver. Anglo Base Metals’ sole European operation is the Lisheen zinc and lead mine in Ireland.
In January 2007, black economic empowerment company Exxaro Resources agreed to acquire Anglo Base Metals’ Namakwa mineral sands operation in South Africa, which produces titanium dioxide, zircon and rutile, together with associated by-products, along with 26% each of Black Mountain and Gamsberg, a large, moderate-grade zinc undeveloped deposit located in the Northern Cape province of South Africa. Black Mountain and Gamsberg will remain subsidiaries of, and continue to be managed and operated by, Anglo Base Metals.

Anglo American plc Fact Book 2007/8 | 49
Base Metals
The 100% owned Skorpion zinc mine in Namibia commenced commercial production in May 2004, and produces some 150,000 tonnes of zinc per year at full production. Black Mountain is a wholly owned zinc, lead, copper and silver concentrate operation located in South Africa. Namakwa Sands is a wholly owned mineral sands operation producing titanium dioxide slag, zircon, rutile and pig iron in South Africa. Anglo American has agreed, subject to the satisfaction of certain conditions precedent, that it will sell 100% of Namakwa and 26% of each of Black Mountain and Gamsberg to Exxaro, the black empowerment company.
In Chile, Anglo American holds a 44% joint venture interest in the Collahuasi copper mine and has a 100% interest in Los Bronces, El Soldado, Mantos Blancos and Mantoverde copper mines and the Chagres smelter. In Brazil, Anglo American owns the ferronickel producer, Codemin, the ferroniobium producer, Catalão, and also has a controlling interest in Copebrás, a leading Brazilian producer of phosphate fertilizers and phosphoric acid. In Venezuela, Anglo American holds a 91.4% interest in the Loma de Níquel ferronickel operation.
In addition, Anglo American has an 81.9% interest in the Quellaveco copper project in Peru and 100% of the Barro Alto nickel project in Brazil.
The wholly owned Lisheen zinc/lead mine in central Ireland, produced over 160,000 tonnes of zinc in concentrate in 2007.
2
3
1
4
5
2
3
9
4 10
5
6
5
8
7
1
11
12
1
● ● ●
Southern Africa1 100% BlackMountain
(South Africa)2 100% NamakwaSands
(South Africa) 3 100% Skorpion (Namibia) 4 100% Gamsberg (South Africa)
●●●●
●●
●
South America1 100% BarroAltoProject (Brazil)2 100% Catalão (Brazil) 3 100% Codemin (Brazil) 4 44% Collahuasi (Chile) 5 100% LosBronces (Chile) 5 100% ElSoldado (Chile) 5 100% Chagres (Chile) 6 100% MantosBlancos (Chile) 7 100% Mantoverde (Chile) 8 81.9% QuellavecoProject (Peru) 9 91.4% LomadeNíquel
(Venezuela) 10 73% CopebrásCubatão (Brazil) 11 73% CopebrásCatalão (Brazil) 12 100% Michiquillay (Peru)
●Ireland1 100% Lisheen
●●
Key Underground OpenCut Other

50 | Anglo American plc Fact Book 2007/8
Base Metals
Industry overviewapplications, including tyres, paints, pharmaceuticals and chemical processing.
With the exception of nickel, base metals industry ownership is presently relatively fragmented. The global market shares of the four largest copper, nickel and zinc metal producers are approximately 25%, 52% and 23% respectively (but subject to ongoing consolidation in the base metals industry). Producers are price takers and there are relatively few opportunities for product differentiation.
The industry is capital intensive and is likely to become more so as high grade surface deposits are exhausted and deeper and/or lower grade deposits, requiring greater economies of scale in order to be commercially viable, are developed. Real prices of copper, nickel and zinc have declined over the long term, although there have been material and sustained deviations from this trend, most notably over the past five years. The decline in real prices reflects the long term reduction in costs as a result of improvements in technology and lower input costs. Average margins have, therefore, tended to be maintained.
For the past five years, the ongoing industrialisation and urbanisation of China has driven demand for a range of commodities. This, together with interest from speculative and investor funds, has resulted in a base metal price up-cycle which has been unprecedented both in its extent and its longevity. China now comprises an estimated 27%, 24% and 31% of global demand for copper, nickel and zinc respectively, the markets for which have all benefited materially.
The majority of copper produced is used by the wire and cable markets and takes advantage of the metal’s electrical conductivity, corrosion resistance and thermal conductivity. Applications that make use of copper’s electrical conductivity, such as wires (including building wire), cables and electrical connectors, account for around 60% of total demand, while about 20% comes principally from the construction industry, which uses copper to produce plumbing pipe and roof sheeting, owing to the metal’s corrosion resistant qualities. Copper’s thermal conductivity also makes it suitable for use in heat transfer applications such as air conditioning and refrigeration, which make up some 10% of total demand. Other applications include structural and aesthetic uses.Around 65% of all refined nickel goes into stainless steel. Other uses include high corrosion-resistant alloys for use in chemical plants, superalloys that can withstand extreme temperatures and are predominantly used in aviation, high-tech electronic uses, as a hardening agent in special steels and as a substrate for chromium plating.
Zinc is used predominantly in galvanising and alloys. Steel coated with zinc (galvanised steel) exhibits high levels of corrosion resistance. This application is responsible for around 50% of total demand. Zinc based alloys in die casting, ranging from automotive components to toys and models, account for around 10-12% of demand, with copper-based zinc alloys (brass) accounting for 15-17%. Zinc semis are used as roofing products and in dry cell batteries (8-10%). Chemical and other applications make up the remainder of refined demand (approximately 13-15%), where zinc is used in a diverse range of products and
MarketsAverageprices(c/lb) 2007 2006
Copper 323 305
Nickel 1,686 1,095
Zinc 147 148
Lead 118 58
During 2007, the copper market was broadly in balance, with prices recovering strongly in the first half as the Chinese restocked, but then moved lower in the fourth quarter. Nickel had a buoyant first six months, with very tight terminal market stocks, but weakened materially in the second half as ongoing stainless steel production cutbacks, greater scrap availability, substitution and increases in nickel pig-iron production all contributed to a material build up of stock across the year. Zinc prices weakened, particularly in the second half, owing to market concerns about the impact of increasing 2008 supply on terminal market stocks.

Anglo American plc Fact Book 2007/8 | 51
Base Metals
Market information

52 | Anglo American plc Fact Book 2007/8
Base Metals
Strategy and growthAnglo Base Metals’ strategy is to find or acquire, develop and operate long life, low cost mines in a socially and environmentally responsible manner, with a strong focus on efficient resource allocation, continuous improvement and capital and operating excellence.
The business is constantly developing and evaluating growth options from a combination of sources, including greenfield and brownfield projects, acquisitions, exploration and technology development.
In addition to the growth potential arising from approved expansions at Los Bronces, Collahuasi and Barro Alto, and studies into further growth potential in particular at Collahuasi and Quellaveco, Anglo American, through its Base Metals division, has invested in a number of major new copper projects.
In April 2007, Anglo American tendered $403 million and won the Michiquillay privatisation auction in Peru. The consideration for this world class resource, with a production potential of up to 300,000 tpa, will be payable over five years. However, there is a right to exit the project, at any time after the first year, by paying 30% of the difference between monies expended and the $403 million. During the first year there is a minimum work commitment of $1 million with no exit payment. The Peru based team has been mobilised and the primary focus of efforts in the first 12 months will be the development of a productive relationship with the local communities.
In July 2007, Anglo American became a 50% partner with the Northern Dynasty Partnership (a wholly owned affiliate of Northern Dynasty Minerals Limited) in the Pebble Limited Partnership for a staged cash investment of $1.425 billion. The partnership owns the Pebble Project, the key assets of which are the open pit style Pebble West copper-gold-molybdenum deposit and the adjacent, deeper and higher grade Pebble East
deposit. The objective is to complete a pre-feasibility study in 2008, a feasibility study around 2011 and to have a world class mine in operation by 2015. A key priority is to build supportive relationships with local communities, consistent with Anglo American’s policy of developing and operating projects to the highest social and environmental standards and to promote development that is truly sustainable.
ProjectsAnglo Base Metals has a strong project pipeline which provides significant scope for organic growth. The pipeline includes the Barro Alto nickel project, which is on track for first production in 2010 and is due to increase existing nickel production by an average 36,000 tpa from 2011. To date, in excess of $900 million of the $1.5 billion capital expenditure required has been committed to this project and the strength of the Brazilian currency is putting ongoing material upward pressure on the domestic component of capital expenditure.
The $1.7 billion Los Bronces expansion project, which aims to increase sulphide mill throughput from 61,000 tonnes per day (tpd) to 148,000 tpd and increase copper production by an average of 170,000 tpa to an initial production level exceeding 400,000 tpa, has been approved. Construction is under way, with first production scheduled for 2011.
A debottlenecking project at Collahuasi, which will increase sulphide mill throughput from 130,000 tpd to 140,000 tpd, has been approved at a total cost of $64 million, with ramp up due to commence in the second half of 2008. The first phase of a potential two phase expansion at Collahuasi, which will increase throughput to 170,000 tpd, plus the addition of a separate 30,000 tpd sulphide leach circuit (equivalent to around 650,000 tpa of copper on a 100% basis), will be evaluated during 2008. Recent exploration success at
Rosario Oeste suggests that there is potential to further increase production to around 1 million tpa by 2014.
The revised feasibility study on the Quellaveco project in Peru, which contemplates an operation producing approximately 200,000 tpa of copper in concentrate at a capital cost of approximately $1.7 billion, will be completed in 2008.
In addition, this organic growth will be boosted by the two major acquisitions made in 2007 – Pebble and Michiquillay.
Chagres, Mantoverde, Mantos Blancos, El Soldado, Catalão, Gamsberg, Copebrás, Boyongan and Kalayaan have early stage studies under way examining options for projects that will either increase production and/or extend mine lives.
Right: A view of the open pit operations at Los Bronces
Anglo American plc Fact Book 2007/8 | 53
Base Metals
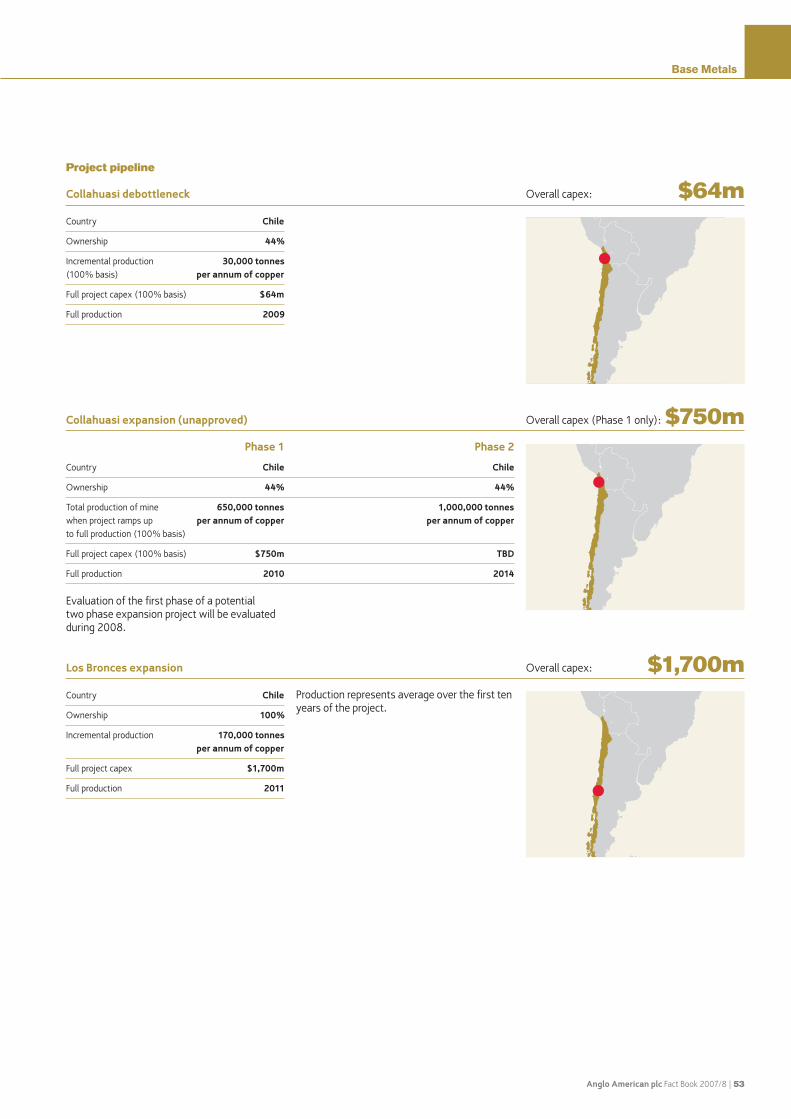
Country Chile
Ownership 44%
Incremental production 30,000 tonnes (100% basis) per annum of copper
Full project capex (100% basis) $64m
Full production 2009
NORTH
WEST
PROVINCE
GAUTENG MPUMALANGA
LIMPOPO PROVINCE
Johannesburg
2
46
3
7
Project pipeline
Collahuasi debottleneck $64mOverall capex:
Evaluation of the first phase of a potential two phase expansion project will be evaluated during 2008.
Phase 1 Phase 2
Country Chile Chile
Ownership 44% 44%
Total production of mine 650,000 tonnes 1,000,000 tonnes when project ramps up per annum of copper per annum of copper to full production (100% basis)
Full project capex (100% basis) $750m TBD
Full production 2010 2014
Collahuasi expansion (unapproved) $750mOverall capex (Phase 1 only):
Production represents average over the first ten years of the project.
Country Chile
Ownership 100%
Incremental production 170,000 tonnes per annum of copper
Full project capex $1,700m
Full production 2011
Los Bronces expansion $1,700mOverall capex:

54 | Anglo American plc Fact Book 2007/8
Base Metals
Country Peru
Ownership 100%
Total production of mine up to 300,000 tonnes when project ramps up to of copper per annum full production
Full project capex $2,000-$2,500m
Full production 2016
Michiquillay will also produce 7 ktpa molybdenum, 230 kozpa gold and 2.3 Mozpa silver by-products.
Michiquillay (unapproved)
$2,000m- $2,500mOverall capex:
First production is scheduled for 2010, with full production of 36,000 tonnes per annum of nickel to be reached in 2011.
Country Brazil
Ownership 100%
Incremental production 36,000 tonnes per annum of nickel
Full project capex $1,500m
Full production 2011
A pre-feasibility study is expected to be completed in 2008 and feasibility study around 2011.
Country US
Ownership 50%
Total production of mine 350,000 tonnes when project ramps per annum of copper, up to full production 12 ktpa molybdenum (100% basis) and 600 kozpa gold
Full project capex TBD
Full production TBD
$1,500mOverall capex:
Pebble (unapproved) TBDOverall capex:
Quellaveco has the potential to produce an average of 200,000 tonnes per annum of copper and 3-4 kpta of molybdenum and 1.6 Mozpa of silver over a mine life in excess of 25 years. A development decision on the Quellaveco project is expected in 2008.
Country Peru
Ownership 81.9%
Total production of mine 200,000 tonnes when project ramps up to per annum of copper full production (100% basis)
Full project capex (100% basis) $1,700m
Full production 2013
Quellaveco $1,700mOverall capex:
Barro Alto
Strategy and growth continued

Anglo American plc Fact Book 2007/8 | 55
Base Metals
Production dataProduction (tonnes) 2007 2006 2005 2004 2003 2002
Copper Collahuasi (attributable basis) 198,900 193,600 187,900 211,700 173,700 190,800 Anglo American Sur (formerly Minera Sur Andes) – Los Bronces mine 231,200 226,000 227,300 231,600 207,800 29,000 – El Soldado mine 72,800 68,700 66,500 68,800 70,500 10,000– Chagres Smelter Copper blister/anodes 164,100 173,400 138,100 165,000 160,100 21,900 Acid 493,400 499,200 371,900 440,500 436,700 66,400 Total production for Anglo American Sur group 304,000 294,700 293,800 300,400 278,300 39,000
Anglo American Norte (formerly Mantos Blancos) – Mantos Blancos mine 88,900 91,700 87,700 94,900 86,900 96,200 – Mantoverde mine 61,000 60,300 62,000 60,100 60,200 57,300 Total production for Anglo American Norte group 149,900 152,000 149,700 155,000 147,100 153,500
Black Mountain – copper in concentrate 2,200 3,400 3,200 5,200 4,700 5,400 Hudson Bay – – – 74,300 83,100 83,400 Other – – – 19,400 21,900 25,600
Total Anglo Base Metals Copper production 655,000 634,800 634,600 766,000 708,800 497,700 Nickel Codemin 9,900 9,800 9,600 6,500 6,400 6,000 Loma de Níquel 15,700 16,600 16,900 17,400 17,200 15,500 Other 100 1,300 4,100
Total Anglo Base Metals Nickel production 25,600 26,400 26,500 24,000 24,900 25,600 Niobium Catalão 4,700 4,700 4,000 3,500 3,300 3,300
Mineral Sands Namakwa Sands Slag tapped 151,300 133,900 164,400 169,300 165,800 162,700 Iron tapped 101,800 88,900 105,400 105,900 105,900 103,000 Zircon 114,800 128,400 128,600 119,100 93,300 112,400 Rutile 24,500 28,200 29,100 23,700 20,400 26,000 Ilmenite 300,300 272,200 316,100 320,600 314,600 315,900
PhosphatesCopebrásSodium tripolyphosphate 56,700 71,100 106,000 115,700 88,800 88,200Phosphates 1,037,800 901,500 1,036,200 1,169,300 1,040,300 734,600
Zinc and Lead Black Mountain Zinc in concentrate 28,300 34,100 32,100 28,200 25,900 27,600 Lead in concentrate 41,900 48,300 42,200 37,500 39,600 45,300 Hudson Bay Zinc – – – 107,000 117,900 108,100 Gold (ozs) – – – 73,400 57,500 59,300 Silver (ozs) – – – 1,020,900 1,032,800 1,234,200 Lisheen (100% basis) Zinc in concentrate 164,700 170,700 159,300 156,300 169,300 151,500 Lead in concentrate 20,200 23,100 20,800 17,200 20,800 22,000
Skorpion Zinc 150,100 129,900 132,800 119,200 47,400 –
Total Zinc(1) 343,100 334,700 324,200 410,700 360,500 211,500Total Lead 62,100 71,400 63,000 54,700 60,400 56,300
(1) Attributable.
56 | Anglo American plc Fact Book 2007/8
Base Metals
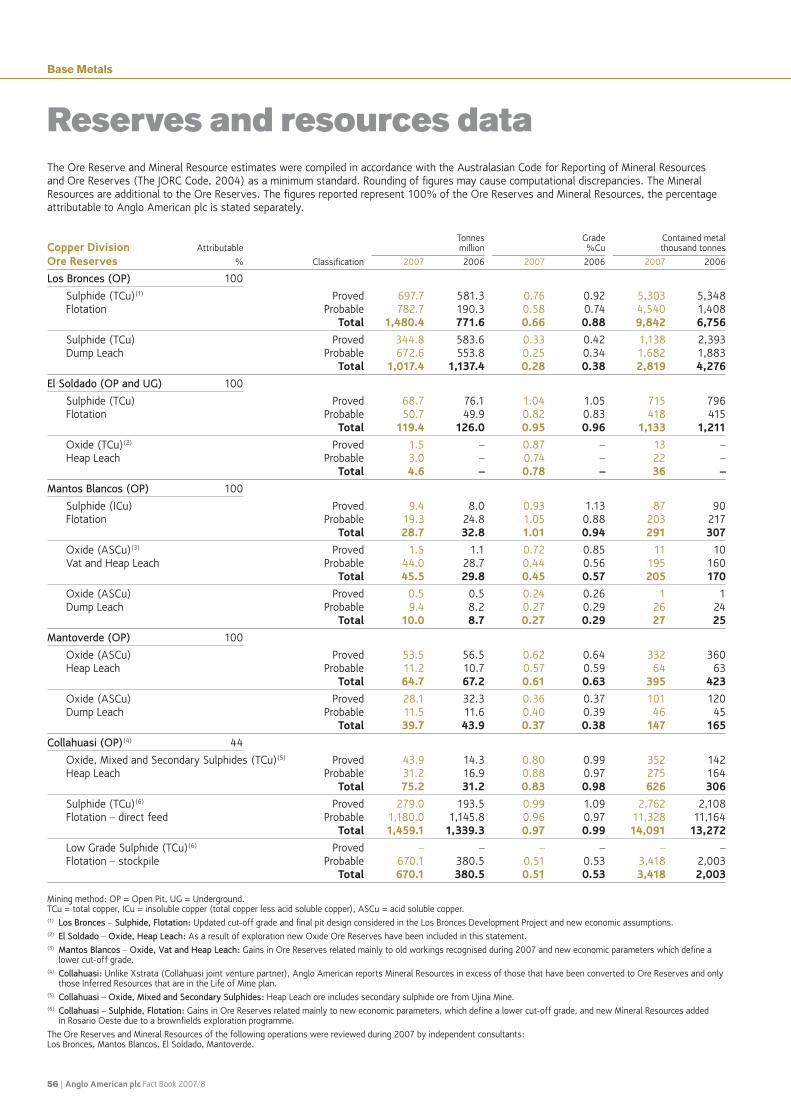
Reserves and resources dataThe Ore Reserve and Mineral Resource estimates were compiled in accordance with the Australasian Code for Reporting of Mineral Resources and Ore Reserves (The JORC Code, 2004) as a minimum standard. Rounding of figures may cause computational discrepancies. The Mineral Resources are additional to the Ore Reserves. The figures reported represent 100% of the Ore Reserves and Mineral Resources, the percentage attributable to Anglo American plc is stated separately.
Tonnes Grade Contained metal Copper Division Attributable million %Cu thousand tonnes
Ore Reserves % Classification 2007 2006 2007 2006 2007 2006
LosBronces(OP) 100
Sulphide (TCu)(1) Proved 697.7 581.3 0.76 0.92 5,303 5,348 Flotation Probable 782.7 190.3 0.58 0.74 4,540 1,408 Total 1,480.4 771.6 0.66 0.88 9,842 6,756 Sulphide (TCu) Proved 344.8 583.6 0.33 0.42 1,138 2,393 Dump Leach Probable 672.6 553.8 0.25 0.34 1,682 1,883 Total 1,017.4 1,137.4 0.28 0.38 2,819 4,276ElSoldado(OPandUG) 100
Sulphide (TCu) Proved 68.7 76.1 1.04 1.05 715 796 Flotation Probable 50.7 49.9 0.82 0.83 418 415 Total 119.4 126.0 0.95 0.96 1,133 1,211 Oxide (TCu)(2) Proved 1.5 – 0.87 – 13 – Heap Leach Probable 3.0 – 0.74 – 22 – Total 4.6 – 0.78 – 36 –MantosBlancos(OP) 100
Sulphide (ICu) Proved 9.4 8.0 0.93 1.13 87 90 Flotation Probable 19.3 24.8 1.05 0.88 203 217 Total 28.7 32.8 1.01 0.94 291 307 Oxide (ASCu)(3) Proved 1.5 1.1 0.72 0.85 11 10 Vat and Heap Leach Probable 44.0 28.7 0.44 0.56 195 160 Total 45.5 29.8 0.45 0.57 205 170 Oxide (ASCu) Proved 0.5 0.5 0.24 0.26 1 1 Dump Leach Probable 9.4 8.2 0.27 0.29 26 24 Total 10.0 8.7 0.27 0.29 27 25Mantoverde(OP) 100
Oxide (ASCu) Proved 53.5 56.5 0.62 0.64 332 360 Heap Leach Probable 11.2 10.7 0.57 0.59 64 63 Total 64.7 67.2 0.61 0.63 395 423 Oxide (ASCu) Proved 28.1 32.3 0.36 0.37 101 120 Dump Leach Probable 11.5 11.6 0.40 0.39 46 45 Total 39.7 43.9 0.37 0.38 147 165Collahuasi(OP)(4) 44
Oxide, Mixed and Secondary Sulphides (TCu)(5) Proved 43.9 14.3 0.80 0.99 352 142 Heap Leach Probable 31.2 16.9 0.88 0.97 275 164 Total 75.2 31.2 0.83 0.98 626 306 Sulphide (TCu)(6) Proved 279.0 193.5 0.99 1.09 2,762 2,108 Flotation – direct feed Probable 1,180.0 1,145.8 0.96 0.97 11,328 11,164 Total 1,459.1 1,339.3 0.97 0.99 14,091 13,272 Low Grade Sulphide (TCu)(6) Proved – – – – – – Flotation – stockpile Probable 670.1 380.5 0.51 0.53 3,418 2,003 Total 670.1 380.5 0.51 0.53 3,418 2,003 Mining method: OP = Open Pit, UG = Underground. TCu = total copper, ICu = insoluble copper (total copper less acid soluble copper), ASCu = acid soluble copper.(1) LosBronces–Sulphide,Flotation: Updated cut-off grade and final pit design considered in the Los Bronces Development Project and new economic assumptions.(2) ElSoldado–Oxide,HeapLeach: As a result of exploration new Oxide Ore Reserves have been included in this statement. (3)MantosBlancos–Oxide,VatandHeapLeach: Gains in Ore Reserves related mainly to old workings recognised during 2007 and new economic parameters which define a
lower cut-off grade. (4) Collahuasi:Unlike Xstrata (Collahuasi joint venture partner), Anglo American reports Mineral Resources in excess of those that have been converted to Ore Reserves and only
those Inferred Resources that are in the Life of Mine plan.(5) Collahuasi–Oxide,MixedandSecondarySulphides: Heap Leach ore includes secondary sulphide ore from Ujina Mine. (6) Collahuasi–Sulphide,Flotation: Gains in Ore Reserves related mainly to new economic parameters, which define a lower cut-off grade, and new Mineral Resources added
in Rosario Oeste due to a brownfields exploration programme. The Ore Reserves and Mineral Resources of the following operations were reviewed during 2007 by independent consultants: Los Bronces, Mantos Blancos, El Soldado, Mantoverde.

Anglo American plc Fact Book 2007/8 | 57
Base Metals
Tonnes Grade Contained metal Copper Division Attributable million %Cu thousand tonnes
Mineral Resources % Classification 2007 2006 2007 2006 2007 2006
LosBronces(OP) 100
Sulphide (TCu)(1) Measured 111.7 118.1 0.47 0.50 529 584 Flotation Indicated 1,532.4 958.9 0.45 0.46 6,896 4,411 Measured and Indicated 1,644.1 1,077.0 0.45 0.46 7,425 4,995 Inferred in Mine Plan 43.1 17.9 0.67 0.67 289 120
Sulphide (TCu) Measured – – – – – – Dump Leach Indicated – – – – – – Measured and Indicated – – – – – – Inferred in Mine Plan 312.4 66.3 0.19 0.33 594 218
ElSoldado(OPandUG) 100
Sulphide (TCu) Measured 61.2 42.9 0.81 0.67 496 287 Flotation Indicated 47.9 48.8 0.73 0.74 349 363 Measured and Indicated 109.1 91.7 0.77 0.71 845 650 Inferred in Mine Plan 10.8 14.2 0.74 0.71 80 101
Oxide (TCu) Measured 0.1 – 0.87 – 1 – Heap Leach Indicated 0.2 – 0.84 – 2 – Measured and Indicated 0.3 – 0.85 – 3 – Inferred in Mine Plan 0.9 – 0.88 – 8 –
MantosBlancos(OP) 100
Sulphide (ICu) Measured 17.7 12.6 0.75 0.83 133 105 Flotation Indicated 112.8 71.7 0.70 0.83 791 595 Measured and Indicated 130.5 84.3 0.71 0.83 924 700 Inferred in Mine Plan 4.2 2.8 0.82 1.02 34 29
Oxide (ASCu) Measured 1.0 1.0 0.59 0.66 6 6 Vat and Heap Leach Indicated 9.7 12.6 0.55 0.57 53 72 Measured and Indicated 10.7 13.6 0.55 0.58 59 78 Inferred in Mine Plan 2.2 1.7 0.57 0.67 13 11
Oxide (ASCu) Measured – – – – – – Dump Leach Indicated – – – – – – Measured and Indicated – – – – – – Inferred in Mine Plan 1.1 0.8 0.24 0.27 3 2
Mantoverde(OP) 100
Oxide (ASCu) Measured 57.1 50.6 0.38 0.39 217 197 Heap Leach Indicated 59.6 56.8 0.36 0.37 215 210 Measured and Indicated 116.7 107.4 0.37 0.38 432 407 Inferred in Mine Plan 0.3 0.3 0.62 0.60 2 2
Oxide (ASCu) Measured – 1.2 – 0.32 – 4 Dump Leach Indicated 4.3 1.7 0.33 0.31 14 5 Measured and Indicated 4.3 2.9 0.33 0.31 14 9 Inferred in Mine Plan 0.6 0.4 0.37 0.34 2 2
Collahuasi(OP)(4) 44
Oxide, Mixed and Secondary Sulphides (TCu)(5) Measured – 0.1 – 0.97 – 1 Heap Leach Indicated 6.0 1.8 0.79 1.09 48 20 Measured and Indicated 6.0 1.9 0.79 1.09 48 21 Inferred in Mine Plan 1.3 0.5 1.18 0.74 16 4
Sulphide (TCu)(6) Measured 3.5 12.3 1.28 0.86 45 105 Flotation – direct feed Indicated 570.3 189.1 1.10 0.89 6,274 1,680 Measured and Indicated 573.8 201.4 1.10 0.89 6,318 1,785 Inferred in Mine Plan 374.0 202.2 0.95 0.93 3,553 1,878
Low Grade Sulphide (TCu)(6) Measured 2.9 35.0 0.50 0.45 14 157 Flotation – stockpile Indicated 154.6 238.3 0.50 0.46 773 1,108 Measured and Indicated 157.5 273.3 0.50 0.46 787 1,265 Inferred in Mine Plan 201.0 106.9 0.50 0.48 1,005 510 Mining method: OP = Open Pit, UG = Underground. TCu = total copper, ICu = insoluble copper (total copper less acid soluble copper), ASCu = acid soluble copper.

58 | Anglo American plc Fact Book 2007/8
Base Metals
Reserves and resources data continued
Tonnes Contained metal Zinc Division Attributable million Grade thousand tonnes
Ore Reserves % Classification 2007 2006 2007 2006 2007 2006
BlackMountain(UG)(1) 100
Deeps(2)
Zinc %Zn %Zn
Proved 1.3 0.2 2.50 2.34 32 6 Probable 7.4 11.5 3.75 3.88 279 446 Total 8.7 11.7 3.56 3.84 311 452 Copper %Cu %Cu Proved 0.21 0.25 3 1 Probable 0.81 0.76 61 88 Total 0.72 0.75 63 89 Lead %Pb %Pb
Proved 4.48 3.27 59 8 Probable 4.05 3.92 301 451 Total 4.12 3.91 360 459Lisheen(UG)(3) 100
Zinc %Zn %Zn
Proved 6.9 7.5 11.25 11.61 782 869 Probable 2.7 3.8 13.68 12.69 373 487 Total 9.7 11.3 11.94 11.97 1,155 1,356 Lead %Pb %Pb Proved 1.98 2.07 138 155 Probable 1.61 1.43 44 55 Total 1.88 1.85 182 210Skorpion(OP) 100
Zinc %Zn %Zn Proved 6.4 7.7 12.74 12.72 821 982 Probable 5.1 5.2 9.72 9.68 491 506 Total 11.5 13.0 11.41 11.49 1,312 1,488 Mining method: OP = Open Pit, UG = Underground. For the polymetallic deposits, the tonnage figures apply to each metal. (1) BlackMountain: On 18 January 2007, Exxaro exercised its option to acquire a 26% interest in Black Mountain. The sale is contingent on the conversion of old order to new
order mining rights. It is expected that this will take place in 2008. (2) BlackMountain–Deeps:A new 3D model has been built and the classification criteria changed along with new economic factors being applied. Ore Reserves include
8,745kt of silver ore at 55g/t as a by-product.(3) Lisheen:Decrease due to losses on the margins of the orebodies in Main East, Main West and oolite zones following mining and new underground drilling information.
The Ore Reserves of the following operations were reviewed during 2007 by independent consultants: Lisheen.
Anglo American plc Fact Book 2007/8 | 59
Base Metals
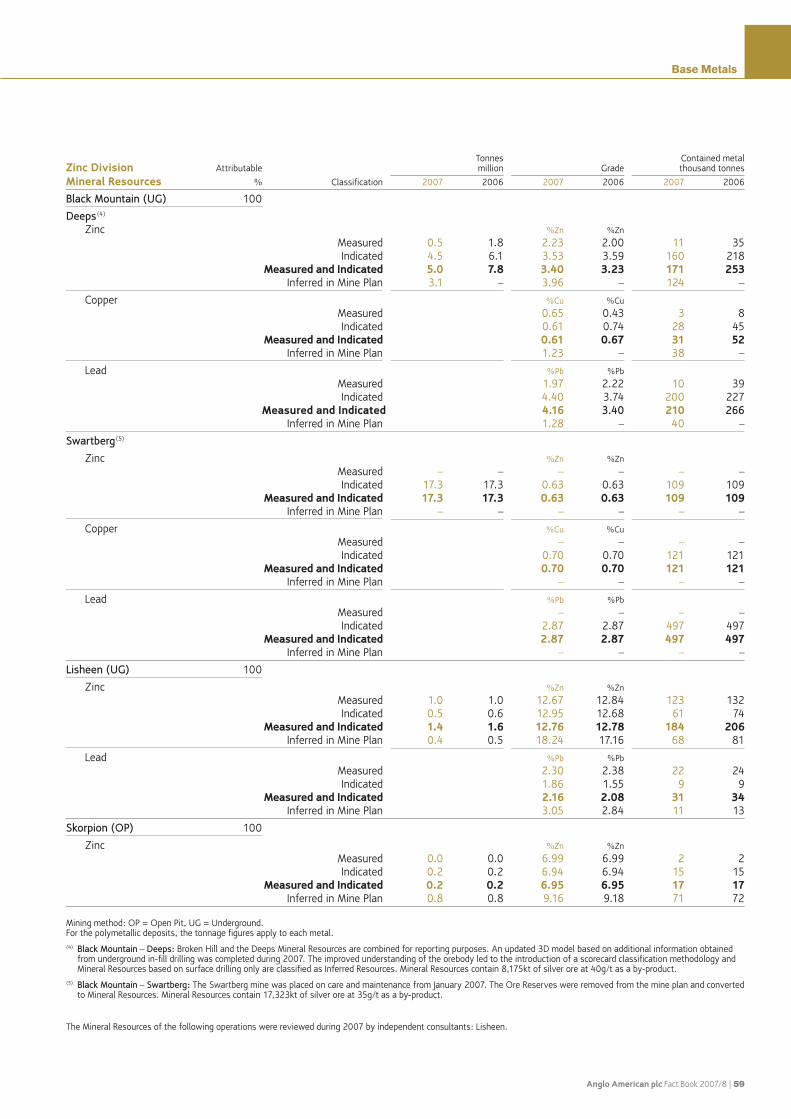
Tonnes Contained metal Zinc Division Attributable million Grade thousand tonnes
Mineral Resources % Classification 2007 2006 2007 2006 2007 2006
BlackMountain(UG) 100
Deeps(4)
Zinc %Zn %Zn Measured 0.5 1.8 2.23 2.00 11 35 Indicated 4.5 6.1 3.53 3.59 160 218 Measured and Indicated 5.0 7.8 3.40 3.23 171 253 Inferred in Mine Plan 3.1 – 3.96 – 124 –
Copper %Cu %Cu Measured 0.65 0.43 3 8 Indicated 0.61 0.74 28 45 Measured and Indicated 0.61 0.67 31 52 Inferred in Mine Plan 1.23 – 38 –
Lead %Pb %Pb Measured 1.97 2.22 10 39 Indicated 4.40 3.74 200 227 Measured and Indicated 4.16 3.40 210 266 Inferred in Mine Plan 1.28 – 40 –
Swartberg(5)
Zinc %Zn %Zn Measured – – – – – – Indicated 17.3 17.3 0.63 0.63 109 109 Measured and Indicated 17.3 17.3 0.63 0.63 109 109 Inferred in Mine Plan – – – – – –
Copper %Cu %Cu Measured – – – – Indicated 0.70 0.70 121 121 Measured and Indicated 0.70 0.70 121 121 Inferred in Mine Plan – – – –
Lead %Pb %Pb Measured – – – – Indicated 2.87 2.87 497 497 Measured and Indicated 2.87 2.87 497 497 Inferred in Mine Plan – – – –
Lisheen(UG) 100
Zinc %Zn %Zn Measured 1.0 1.0 12.67 12.84 123 132 Indicated 0.5 0.6 12.95 12.68 61 74 Measured and Indicated 1.4 1.6 12.76 12.78 184 206 Inferred in Mine Plan 0.4 0.5 18.24 17.16 68 81
Lead %Pb %Pb Measured 2.30 2.38 22 24 Indicated 1.86 1.55 9 9 Measured and Indicated 2.16 2.08 31 34 Inferred in Mine Plan 3.05 2.84 11 13
Skorpion(OP) 100
Zinc %Zn %Zn Measured 0.0 0.0 6.99 6.99 2 2 Indicated 0.2 0.2 6.94 6.94 15 15 Measured and Indicated 0.2 0.2 6.95 6.95 17 17 Inferred in Mine Plan 0.8 0.8 9.16 9.18 71 72 Mining method: OP = Open Pit, UG = Underground. For the polymetallic deposits, the tonnage figures apply to each metal. (4) BlackMountain–Deeps: Broken Hill and the Deeps Mineral Resources are combined for reporting purposes. An updated 3D model based on additional information obtained
from underground in-fill drilling was completed during 2007. The improved understanding of the orebody led to the introduction of a scorecard classification methodology and Mineral Resources based on surface drilling only are classified as Inferred Resources. Mineral Resources contain 8,175kt of silver ore at 40g/t as a by-product.
(5) BlackMountain–Swartberg: The Swartberg mine was placed on care and maintenance from January 2007. The Ore Reserves were removed from the mine plan and converted to Mineral Resources. Mineral Resources contain 17,323kt of silver ore at 35g/t as a by-product.
The Mineral Resources of the following operations were reviewed during 2007 by independent consultants: Lisheen.

60 | Anglo American plc Fact Book 2007/8
Base Metals
Reserves and resources data continued
Tonnes Contained metal Nickel Division Attributable million Grade thousand tonnes
Ore Reserves % Classification 2007 2006 2007 2006 2007 2006
BarroAlto(OP)(1) 100
Laterite %Ni %Ni
Proved 12.3 13.2 1.61 1.64 199 216 Probable 27.1 27.2 1.81 1.81 491 492 Total 39.5 40.4 1.75 1.75 690 708Codemin(OP) 100
Laterite %Ni %Ni
Proved 3.2 3.2 1.33 1.33 42 42 Probable 0.5 0.5 1.33 1.33 7 7 Total 3.7 3.7 1.33 1.33 49 49LomadeNíquel(OP) 91.4
Laterite %Ni %Ni
Proved 11.9 11.9 1.49 1.51 178 180 Probable 22.1 22.6 1.47 1.46 324 329 Total 34.0 34.5 1.48 1.48 502 509
Tonnes Contained metal Nickel Division Attributable million Grade thousand tonnes
Mineral Resources % Classification 2007 2006 2007 2006 2007 2006
BarroAlto(OP) 100
Laterite %Ni %Ni
Measured – – – – – – Indicated 16.9 16.9 1.36 1.36 230 230 Measured and Indicated 16.9 16.9 1.36 1.36 230 230 Inferred in Mine Plan 37.5 37.5 1.56 1.56 585 585
Codemin(OP) 100
Laterite %Ni %Ni
Measured 3.3 3.3 1.29 1.29 43 43 Indicated 3.5 3.5 1.25 1.25 44 44 Measured and Indicated 6.9 6.9 1.27 1.27 87 87 Inferred in Mine Plan – – – – – –
LomadeNíquel(OP)(2) 91.4
Laterite %Ni %Ni
Measured 1.2 1.0 1.40 1.41 16 15 Indicated 4.8 4.6 1.45 1.44 70 67 Measured and Indicated 6.0 5.7 1.44 1.44 86 81 Inferred in Mine Plan 1.7 1.6 1.39 1.38 23 22 Mining method: OP = Open Pit.(1) BarroAlto: The mineral resource model was updated and the mining design optimised to incorporate the new resources into the Ore Reserves. Ore from Barro Alto is currently
being processed at the Codemin plant.(2) LomadeNíquel: Increases are due to changes to the geological model incorporating new drilling information.
The Ore Reserves and Mineral Resources of the following operations were reviewed during 2007 by independent consultants: Loma de Níquel.

Anglo American plc Fact Book 2007/8 | 61
Base Metals
Tonnes Contained metal Niobium Attributable million Grade thousand tonnes
Ore Reserves % Classification 2007 2006 2007 2006 2007 2006
Catalão(OP)(1) 100
Carbonatite %Nb2O5 %Nb2O5 Proved 11.9 7.0 1.24 1.15 147 80 Probable 4.2 6.8 1.15 1.44 48 98 Total 16.0 13.8 1.21 1.29 195 178 Tonnes Contained metal Niobium Attributable million Grade thousand tonnes
Mineral Resources % Classification 2007 2006 2007 2006 2007 2006
Catalão(OP) 100
Carbonatite %Nb2O5 %Nb2O5
Measured 0.2 – 1.05 – 2 – Indicated 0.3 – 0.91 – 3 – Measured and Indicated 0.5 – 0.96 – 4 – Inferred in Mine Plan 0.6 – 0.90 – 5 – Tonnes Phosphate products Attributable million Grade
Ore Reserves % Classification 2007 2006 2007 2006
Copebrás(OP)(2) 73
%P2O5 %P2O5
Proved 79.6 84.3 13.3 13.3 Probable 152.1 152.3 13.4 13.4 Total 231.7 236.6 13.3 13.3
Tonnes Phosphate products Attributable million Grade
Mineral Resources % Classification 2007 2006 2007 2006
Copebrás(OP) 73
%P2O5 %P2O5
Measured 0.5 0.5 12.4 12.4 Indicated 20.3 20.3 11.4 11.4 Measured and Indicated 20.8 20.9 11.4 11.4 Inferred in Mine Plan 15.8 15.8 12.9 12.9
Mining method: OP = Open Pit.(1) Catalão: Increases due to new information from an exploration programme completed during 2007 and improved outlook for ferro-niobium prices which resulted in a lowering
of the cut-off grade.(2) Copebrás: Change due to production during 2007.

62 | Anglo American plc Fact Book 2007/8
Base Metals
Reserves and resources data continued
Tonnes Contained metal Heavy Minerals Attributable million Grade million tonnes
Ore Reserves % Classification 2007 2006 2007 2006 2007 2006
NamakwaSands(OP)(1) 100
Ilmenite %Ilm %Ilm
Proved 76.5 79.9 4.9 5.0 3.7 4.0 Probable 250.4 268.9 3.7 3.7 9.2 9.9 Total 326.8 348.8 4.0 4.0 12.9 13.9 Zircon %Zir %Zir Proved 1.2 1.2 0.9 1.0 Probable 0.9 0.9 2.4 2.5 Total 1.0 1.0 3.3 3.5 Rutile %Rut %Rut Proved 0.2 0.2 0.2 0.2 Probable 0.2 0.2 0.5 0.5 Total 0.2 0.2 0.7 0.7
Tonnes Contained metal Heavy Minerals Attributable million Grade million tonnes
Mineral Resources % Classification 2007 2006 2007 2006 2007 2006
NamakwaSands(OP)(1) 100
Ilmenite %Ilm %Ilm Measured 117.9 116.5 3.5 3.5 4.1 4.1 Indicated 148.4 143.6 3.4 3.4 5.0 4.9 Measured and Indicated 266.3 260.1 3.4 3.5 9.1 9.0 Inferred in mine plan 184.1 175.7 3.1 2.7 5.6 4.7
Zircon %Zir %Zir Measured 0.7 0.7 0.8 0.8 Indicated 0.7 0.7 1.0 1.0 Measured and Indicated 0.7 0.7 1.8 1.8 Inferred in mine plan 0.7 0.6 1.3 1.1
Rutile %Rut %Rut Measured 0.2 0.2 0.2 0.2 Indicated 0.2 0.2 0.2 0.2 Measured and Indicated 0.2 0.2 0.4 0.4 Inferred in mine plan 0.2 0.1 0.3 0.2 Mining method: OP = Open Pit. For the multi-product deposits, the tonnage figures apply to each product.(1) NamakwaSands:On 18 January 2007, Exxaro exercised its option to acquire a 100% interest of Namakwa Sands. The sale is contingent on the conversion of old order
to new order mining rights. It is expected that this will take place in 2008. Change due to production and resource model update during 2007.

Anglo American plc Fact Book 2007/8 | 63
Base Metals
Tonnes Contained metal Projects Attributable million Grade thousand tonnes
Ore Reserves % Classification 2007 2006 2007 2006 2007 2006
Quellaveco(OP)(1) 80
Copper %Cu %Cu Sulphide Proved 250.1 250.1 0.76 0.76 1,901 1,901 Flotation Probable 688.3 688.3 0.59 0.59 4,061 4,061 Total 938.4 938.4 0.64 0.64 5,962 5,962Gamsberg(OP)(2) 100
Zinc %Zn %Zn Proved 34.3 34.4 7.55 7.55 2,585 2,597 Probable 110.3 110.3 5.55 5.55 6,124 6,124 Total 144.5 144.7 6.03 6.03 8,709 8,721
Tonnes Contained metal Projects Attributable million Grade thousand tonnes
Mineral Resources % Classification 2007 2006 2007 2006 2007 2006
Quellaveco(OP) 80
Copper %Cu %Cu
Sulphide Measured 1.5 1.5 0.53 0.53 8 8 Flotation Indicated 176.7 176.7 0.46 0.46 813 813 Measured and Indicated 178.2 178.2 0.46 0.46 821 821 Inferred in Mine Plan 41.1 – 0.54 – 222 –
PebbleEast(UG)(3)(4) 50
Copper %Cu %Cu
Measured – – – – – – Indicated – – – – – – Measured and Indicated – – – – – – Inferred(5) 2,420.0 – 0.71 – 17,182 –
PebbleWest(OP)(3)(6) 50
Copper %Cu %Cu
Measured(7) 655.0 – 0.34 – 2,227 – Indicated(8) 1,760.0 – 0.30 – 5,280 – Measured and Indicated 2,415.0 – 0.31 – 7,507 – Inferred(9) 760.0 – 0.27 – 2,052 – Mining method: OP = Open Pit, UG = Underground.(1) Quellaveco: Based on a feasibility study completed in 2000.(2) Gamsberg: Based on a feasibility study completed in 2000 and reviewed in 2006 to account for prevailing economic and financial assumptions. The Mine Plan includes an
additional 54,200kt at 4.10% Zn of Inferred Mineral Resources.(3) Pebble: Copper Equivalent (CuEq) calculations use metal prices of $1.00/lb for copper, $400/oz for gold and $6.00/lb for molybdenum. The CuEq used for the tabulated
resources does not include estimates of metallurgical recoveries. Should provisional metallurgical recoveries be included in the CuEq calculation, an indication of the impact on the resource estimates is shown in the footnotes. It must be emphasised that metallurgical test work is ongoing at both Pebble East and Pebble West and that reliable estimates of recoveries will only be established during the current pre-feasibility study which is due for completion at end 2008. By definition mineral resources do not have demonstrated economic viability. Due to the uncertainty in the estimates of Inferred Resources, it should not be assumed that all of the Inferred Resources will necessarily upgrade to Indicated or Measured Resources.
(4) PebbleEast: The resources are based on drilling to November 2007 and a block model created in December 2007. A cut-off grade of 0.8% CuEq was used and is considered reasonable for a large-scale underground operation. The resources occur in a reasonably coherent volume but a more detailed underground design was not undertaken to constrain the resources or to test for reasonable prospects for eventual economic extraction. At a cut-off of 1% CuEq the estimates of resources are 1,500Mt at 0.82% Cu, 0.49g/t Au and 0.035% Mo (1.32% CuEq). If the estimates of recovery are used in the CuEq calculation, the estimate of Inferred Resources above a cut-off of 0.8% CuEq drops to 2,100Mt at 0.75% Cu, 0.43g/t Au and 0.035% Mo.
(5) PebbleEastco-productestimatedgrades(Inferred): Gold 0.42g/t, Molybdenum 0.034%.(6) PebbleWest: The resource block model used as the basis for reporting is unchanged from that used by Northern Dynasty Mines to previously publish resources. The resources
in the table are based on a cut-off grade of 0.4% CuEq. Reasonable prospects for eventual economic extraction for the Pebble West Measured and Indicated Resources is satisfied in that more than 96% of the resources fall within a pit generated using Measured, Indicated and Inferred Resources. At a cut-off of 0.5% CuEq the estimates of Measured plus Indicated Resources are 1,630Mt at 0.35% Cu, 0.39g/t Au and 0.018% Mo (0.69% CuEq). If the estimates of recovery are used in the CuEq calculation, the estimates of Measured plus Indicated Resources above a cut-off of 0.4% CuEq drops to 1,920Mt at 0.34% Cu, 0.37g/t Au and 0.017% Mo.
(7) PebbleWestco-productestimatedgrades(Measured): Gold 0.37g/t, Molybdenum 0.017%.(8) PebbleWestco-productestimatedgrades(Indicated): Gold 0.34g/t, Molybdenum 0.016%.(9) PebbleWestco-productestimatedgrades(Inferred): Gold 0.34g/t, Molybdenum 0.017%.

64 | Anglo American plc Fact Book 2007/8
Base Metals