based simulation model1 cristiano antonelli, dipartimento...
TRANSCRIPT
1
INNOVATION AS AN EMERGING SYSTEM PROPERTY: AN AGENT
BASED SIMULATION MODEL1
Cristiano Antonelli, Dipartimento di Economia, Università di Torino & BRICK
Collegio Carlo Alberto.
Gianluigi Ferraris, BRICK, Collegio Carlo Alberto.
ABSTRACT
The paper elaborates the notion of innovation as an emerging property of complex
system dynamics and presents an agent-based simulation model (ABM) of an
economy where systemic knowledge interactions among heterogeneous agents are
crucial for the recombinant generation of new technological knowledge and the
introduction of innovations. In this approach the organization of the system plays a
crucial role in assessing the chances of individual firms to actually introduce
innovations because it qualifies the access to external knowledge, an indispensable
input, together with internal learning and research activities, into the recombinant
generation of new knowledge. The introduction of innovations is analyzed as the
result of systemic knowledge interactions among myopic agents that are credited with
an extended procedural rationality that includes forms of creative reaction. The
creative reaction of agents may lead to the introduction of productivity enhancing
innovations. This takes place only when the structural, organizational and
institutional characteristics of the system are such that agents, reacting to out-of-
equilibrium conditions, can actually take advantage of external knowledge available
within the innovation system into which they are embedded to generate new
technological knowledge. The ABM enables to explore the effects that alternative
organizational features of the systems, namely different configurations of the
intellectual property right regimes and different architectural configurations of the
regional structure into which knowledge interactions take place, on the rates of
introduction of technological innovations. The results of the ABM suggest that the
dissemination of knowledge favors the emergence of creative reactions and hence
faster rates of introduction of technological innovations.
KEY-WORDS: Complex System Dynamics; Innovation; Emergent Property;
Technological Knowledge; Intellectual Property Rights; Knowledge Dissemination;
Agent-based Simulation.
JEL CODE:O33
1 The authors acknowledge the financial support of the European Union D.G. Research with the Grant number 266959
to the research project „Policy Incentives for the Creation of Knowledge: Methods and Evidence‟ (PICK-ME), within
the context Cooperation Program / Theme 8 / Socio-economic Sciences and Humanities (SSH), of the Collegio Carlo
Alberto and of the University of Torino. We are grateful to the referees, the Editor and Pietro Terna for the useful
comments to preliminary versions.
2
Introduction
The article develops an agent based simulation model (ABM) of innovation
considered as an emerging property of a complex system. It explores how
architectural, organizational and institutional variables, such as the spatial distribution
of firms and the intellectual property right regime, have an impact on innovative
behaviours. Firms are considered as myopic agents that may react creatively to un-
expected events. Their reaction may be adaptive or creative, according to the localized
context of action. The reaction of agents may lead to the introduction of productivity
enhancing innovations if and when the organization of the system is such that the
reactive agents can actually take advantage of external knowledge available within the
innovation system into which they are embedded. In this approach external knowledge
is an indispensable input, together with internal research activities, into the generation
of new knowledge.
Our approach contributes a line enquiry of evolutionary economics that emphasizes
the role of interactions among agents within the organized complexity of economic
systems. This approach differs from evolutionary analyses of a darwinistic ascent
where innovation is spontaneous and occurs randomly, in house capacities are
considered as the unique source of novelty creating activities and market are credited
with the role to select alternative novelties (Penrose 1959; Nelson and Winter 1982).
In our approach innovation is an emerging property at the system level that takes
place when the action of individuals and the organization of the system match.
Knowledge interactions among heterogeneous agents and the organization of the
knowledge flows within the system play a crucial role in assessing the chances of
individual firms to actually introduce innovations. The access to external knowledge
is viewed as an indispensable input, together with internal learning and research
activities, into the generation of new knowledge. The introduction of innovations is
analyzed as the result of systemic knowledge interactions among myopic agents that
are credited with an extended procedural rationality that includes forms of reaction.
Such reactivity can be either adaptive or creative. The reaction of agents can be
creative so as engender the introduction of productivity enhancing innovations when a
number of contextual conditions that enable the access to external knowledge are
fulfilled (Anderson Arrow Pines 1988; Lane 2009; Zhang 2003; Antonelli 2011).
The aim of the paper is to show that, because of the relevance of external knowledge
for the generation of new knowledge, the organization of the system articulated in the
different institutional and architectural settings of the structure into which knowledge
interactions take place, affects the rates of generation of new knowledge and the pace
of introduction of technological innovations (Bischi Dawid Kopel 2003).
Using ABM methodology, the paper shows that innovation is likely to emerge faster
and better in organized complex systems characterized by high levels of dissemination
and accessibility to knowledge externalities.
3
The rest of the paper is structured as it follows. Section 2 elaborates the theoretical
framework and presents the building blocks of an approach that integrates the
economics of innovation and the economics of complexity. Section 3 presents the
agent-based model of the innovation system. Section 4 exhibits the results of the
simulation focusing upon the alternative hypothesis about the institutional and
architectural features of the innovation system. Section 5 elaborates the policy
implications of the results. The conclusions summarize the main results and put them
in perspective.
The theoretical frame
This section presents the basic assumptions and hypotheses about the working of an
economic system where innovation is characterized as the emergent property of the
system dynamics of knowledge interactions. The introduction of innovations is
analyzed as the possible result of systemic interactions among heterogeneous and
myopic, yet learning and reactive, agents when and if they can take advantage of
external knowledge so as to make their reaction, creative, as opposed to adaptive.
A behavioral approach enriched by creativity
There are direct links between the Schumpeterian legacy and the behavioral theory of
the firm that have been poorly appreciated so far. Schumpeter (1947) in a landmark
contribution introduces the notion of creative reaction as a conclusive point of his
theoretical elaboration. Schumpeterian firms are portrayed explicitly as myopic
agents that not able to foresee all the possible events and are occasionally surprised
by un-expected events. Schumpeterian firms are myopic but endowed with the
capability to react and to rely upon external resources in their reaction. Their reaction
to the changing condition of their economic environment can be either adaptive or
creative. If their reaction is adaptive, equilibrium conditions prevail and lead to
traditional price/quantity adjustments with no innovation. Their reaction becomes
creative, as opposed to adaptive, when knowledge interactions supported by a viable
organization of the system makes possible to access external knowledge at favorable
conditions2. Creative reaction engenders out-of-equilibrium conditions and with
2 Schumpeter (1947) makes the point very clear: “What has not been adequately appreciated among theorists is the
distinction between different kinds of reaction to changes in „condition‟. Whenever an economy or a sector of an
economy adapts itself to a change in its data in the way that traditional theory describes, whenever, that is, an economy
reacts to an increase in population by simply adding the new brains and hands to the working force in the existing
employment, or an industry reacts to a protective duty by the expansion within its existing practice, we may speak of the
development as an adaptive response. And whenever the economy or an industry or some firms in an industry do
something else, something that is outside of the range of existing practice, we may speak of creative response. Creative
response has at least three essential characteristics. First, from the standpoint of the observer who is in full possession of
all relevant facts, it can always be understood ex post; but it can be practically never be understood ex ante; that is to
say, it cannot be predicted by applying the ordinary rules of inference from the pre-existing facts. This is why the „how‟
in what has been called the „mechanisms‟ must be investigated in each case. Secondly, creative response shapes the
whole course of subsequent events and their „long-run‟ outcome. It is not true that both types of responses dominate
only what the economist loves to call „transitions‟, leaving the ultimate outcome to be determined by the initial data.
Creative response changes social and economic situations for good, or, to put it differently, it creates situations from
which there is no bridge to those situations that might have emerged in the absence. This is why creative response is an
essential element in the historical process; no deterministic credo avails against this. Thirdly, creative response –the
frequency of its occurrence in a group, its intensity and success or failure- has obviously something, be that much or
4
appropriate external conditions feeds a virtuous cycle of growth and change
(Antonelli 2011).
This Schumpeterian legacy is fully consistent and actually complementary with the
basic assumptions of the beahavioral theory of the firm elaborated by Herbert Simon
and Jamie March. In the classic behavioral theory firms are myopic: their rationality
is bounded, as opposed to Olympian, because of the wide array of unexpected events,
surprises and mistakes that characterize their decision making and the conduct of
their business in a ever changing environment (March and Simon, 1958). Firms,
however, are endowed with an extended procedural rationality that includes the
capability to learn. Agents are intrinsically heterogeneous. They are characterized by
distinctive and specific characteristics that qualify their competence, the endowment
of tangible and intangible inputs and their location in the space of interactions (Cyert
and March 1963; March 1988; March, 1991).
In our approach agents can do more than adjusting prices to quantities and vice versa:
they can try and react to the changing conditions of their economic environment by
means of the generation of technological knowledge and its exploitation by means of
the introduction of technological innovations. To innovate firms mobilize their slack
resources consisting in tacit knowledge and competence accumulated by means of
internal learning processes (Leibenstein 1976). Internal slack resources, however, are
a necessary but not sufficient condition to innovate. The reaction becomes creative
only with the support of an organized complexity of the system where firms are
embedded
A behavioral theory of a myopic but learning firm enriched by the Schumpeterian
creativity provides the basis to implement a model of the economic complexity of
technological change. In our approach firms try and innovate when their
performances differ sharply from the average. A clear causality between
performances, both negative and positive is established. When performances are
below the average firms are dissatisfied and try to change their routines. When
performances are above the average, forms have more opportunities to fund risky
activities. This out-of-equilibrium causal link, in a typical satisfying approach,
between performances and attempts to innovate marks a clear difference with the post
Nelson&Winter approach where no causality is introduced and innovation is viewed
as the spontaneous result of the behavior of firms considered as single agents.
Innovation and knowledge
The introduction of technological and organizational innovations requires the
generation of new knowledge. The generation of knowledge is characterized by
specific attributes: knowledge is at the same time the output of a specific activity and
little, to do (a) with quality of the personnel available in a society, (b) with relative quality of personnel, that is, with
quality available to a particular field of activity relative to the quality available, at the same time, to others, and (c) with
individual decisions, actions, and patterns of behavior.” (Schumpeter 1947:149-150).
5
an essential input into the generation of new knowledge. Because of knowledge
indivisibility, the access to existing knowledge, at each point in time, is a condition
necessary for the generation of new knowledge. Yet no firm can command all the
available knowledge, hence no firm can generate new technological knowledge alone.
The twin character of knowledge as an output of a research process and the input into
the generation of further knowledge stresses the basic complementarity and
interdependence of agents in the innovation process: innovation is inherently the
collective result of the interdependent and interactive intentional action of economic
agents (Blume and Durlauf 2001 and 2005).
The structure of the system and its continual change, following the tradition of
analysis of Simon Kuznetz, play a crucial role. The organization and the structure of
the system affects the architecture of knowledge externalities, interactions and
transactions and plays a crucial role in the access to external knowledge and hence in
the definition of the actual chances of agents to implement their reactions and make it
creative, as opposed to adaptive (Silva and Teixeira 2009).
Technological knowledge is viewed as the product of recombination of existing ideas,
both diachronically and synchronically. The generation of new knowledge stems
from the search and identification of elements of knowledge that had not been
previously considered and their subsequent active inclusion and integration with the
preexisting components of the knowledge base of each firm (Weitzman 1996 and
1998; Fleming and Sorenson 2001).
Marshallian externalities as implemented by the notion of generative interactions play
a central role in this approach (Lane and Maxfield 1997). The amount of knowledge
externalities and interactions available to each firm influences their capability to
generate new technological knowledge, hence the actual possibility to make their
reaction adaptive as opposed to creative and able to introduce localized technological
changes. Each myopic agent has access only to local knowledge interactions and
externalities, i.e. no agent knows what every other agent in the system at large knows.
Because of the localized character of knowledge externalities and interaction, location
in a multidimensional space, in terms of distance among agents and their density,
matters. Interactions in fact are localized, as opposed to global. At each point in time
agents are rooted within networks of transactions and interactions that are specific
subsets of the broader array of knowledge externalities, interactions and transactions
that take place in the system. In the long term, however, they can move in space and
change their location in the networks. In so doing they change the organization of the
system.
Contingent factors influencing innovative vs. adaptive behaviors Appropriate structural and institutional characteristics of the system upgrade the
reaction of firms and help to make it actually creative and hence engender the
introduction of productivity enhancing innovations. Only when the role of such
external and complementary systemic conditions is taken into account the role of
6
innovation as the productivity enhancing result of an intentional action can be
articulated. The organization of the system plays a key role as it shapes the access to
external knowledge. When the role of the external context is properly appreciated, it
becomes clear that innovation is not only the result of the intentional action of each
individual agent, but it is also the endogenous product of dynamics of the system. The
individual action and the organization of the system conditions are the crucial and
complementary ingredients to explain the emergence of innovations (Lane et al.
2009).
Positive feedbacks take place when the external conditions into which each firm is
localized qualify the access to external knowledge so as to make the reaction of firms
creative, as opposed to adaptive. When the access conditions to the local pools of
knowledge enable the actual generation of new technological knowledge and feed the
introduction of innovations, actual gales of technological change may emerge. The
wider is the access to the local pools of knowledge and the larger is the likelihood
that firms are induced to react. The larger the number of firms that react and the better
the access conditions to external knowledge and the stronger are the chances that their
reaction are creative: technological change becomes a generalized and collective
process (Arthur 1990, 1994, 2009).
In such a context innovation is an emergent property that takes place when
complexity is „organized‟, i.e. when a number of complementary conditions enable
the creative reaction of agents and makes it possible to introduce innovations that
actually increase their efficiency. The dynamics of complex systems is based upon
the combination of the reactivity of agents, caught in out-of-equilibrium conditions,
with the features of the system into which each agent is embedded in terms of
externalities, interactions, positive feedbacks that enable the generation of localized
technological change and lead to endogenous structural change (Anderson, Arrow,
Pines 1988; Arthur, Durlauf, Lane 1997; Lane et al. 2009).
Innovation is the endogenous result of the system dynamics: it does not fall from
heaven, as standard economics suggests. Neither is it the result of random variation as
some evolutionary approaches, consistently with their with strong darwinistic traits,
where mutation take place randomly, contend. Agents react and succeed in their
creative reactions when a number of contingent external conditions apply at the
system level. Innovation is the result of the collective economic action of agents:
“innovation is a path dependent, collective process that takes place in a localized
context, if, when and where a sufficient number of creative reactions are made in a
coherent, complementary and consistent way. As such innovation is one of the key
emergent properties of an economic system viewed as a dynamic complex system”
(Antonelli 2008:I).
The appreciation of the systemic conditions that shape and make innovations possible,
together with their individual causes leads to the identification of innovation as an
emergent property of a system. Our approach provides a solution to the conundrum of
7
an intentional economic action whose rewards are larger than its costs. This can
happen only if the complexity of the system is appreciated. The introduction of
innovations that make it possible to enhance the productivity and efficiency of the
system can in fact take place only as the emergent property of an organized system
complexity and in turn organized complexity is explained as an endogenous and
dynamic process engendered by the interactions of rent-seeking agents, that try and
cope with the ever changing conditions of their product and factor markets (Antonelli
2009 and 2011).
Architectural and institutional trade-offs
In this context, because of the twin character of knowledge as the output of a research
process and the input into the generation of further knowledge, two knowledge
dissemination trade-offs take place. The first relates to the structure of intellectual
property right regimes; the second to the distribution in economic, regional and
knowledge space of knowledge generation activities. Let us analyze them in turn:
A) The intellectual property right trade-off. The structure of the intellectual property
right regimes, the scope of patents, their duration, the assignment procedures and
their exclusivity play a crucial role. Strong intellectual property right regimes
increase the appropriability of technological knowledge for they limit the leakage of
information and delay uncontrolled knowledge dissipation. Innovators can secure for
a longer period of time the benefits stemming from the generation of new
technological knowledge and the introduction of new technologies. Strong
intellectual property regimes increase the chances of innovators to exploit
technological knowledge. Consequently strong intellectual property right regimes
enhance the incentives to the generation of new knowledge and hence help increasing
the amount of resources that would be committed to the generation of new
knowledge. Strong intellectual property right regimes, however, reduce both the static
and the dynamic efficiency of economic and innovation systems. Strong property
right regimes increase the duration of monopolistic power in the product markets and
the appropriation of consumers‟ surplus by innovative suppliers. Strong property
right regimes, however, reduce the dynamic efficiency of innovation systems because
they prevent and delay the access to existing knowledge as an input into the
generation of new knowledge and hence reduce the efficiency of the recombination
process that leads to the generation of new technological knowledge. The combined
effect of strong property right regimes in fact is to increase the incentives to generate
research ad hence the amount of resources but the reduction of their efficiency
because at each point in time available knowledge cannot be used to recombine and
generate new knowledge and must be invented again. Strong intellectual property
right regimes risk to increasing the replication of research efforts and the reduction of
the pace of recombinant generation of technological knowledge. This knowledge
trade-off requires the fine-tuning of intellectual property rights with the identification
of the proper mix of the protection of appropriability on the one hand and the
dissemination of available knowledge.
8
B) The architectural trade-off. The architectural characteristics of the network of
interactions that qualify each economic system have powerful consequences on the
actual capability of each economic agent to generate new technological knowledge.
The distribution in regional and knowledge space of knowledge generation activities
has important effects. Because of the pervasive role of external knowledge as an input
into the recombinant generation of new technological knowledge the regional
concentration of knowledge generating activities may increase the pace of
technological advance. Proximity, in fact, helps the identification of useful external
knowledge hence reduces search and exploration costs. Proximity in regional space
helps reducing the risks of opportunistic behaviors because of increased interactions,
hence helps limiting transaction costs and finally proximity increases the
homogeneity of codes and favors the absorption of external knowledge. Excess
concentration may favor the forging ahead of small but effective clusters of highly
innovative groups of firms strongly interconnected and able to interact at a fast pace.
At the same time, however, excess concentration might be identified where the rest of
the system is cut of the flows of creative interactions and the dissemination of new
knowledge is delayed. Excess concentration risks to reduce knowledge variety and
the related opportunities for knowledge recombination. The dissemination of
knowledge generating activities may help the stimulus to the recombinant generation
of new knowledge because of the wider participation of a larger number of
heterogeneous agents in the collective endeavor that leads to the generation of new
knowledge. Once more it is clear that a knowledge trade-off between concentration
and dissemination of knowledge generating activities takes place with important
policy implications about the best allocation of additional research resources and
activities through regional space (Page 2011).
Agent based models can help structuring in a rigorous frame of analysis the dynamic
properties of the system so as to provide a context into which the implementation of
simulation techniques can exhibit the different results of alternative structures of
knowledge interaction mechanisms and intellectual property rights regimes3. This
exercise can contribute the implementation of an approach that adapts complex
system dynamics to economics where technological change is the central engine of
the evolving dynamics of the system and it is the result of the creative response of
intentional agents, embedded in an evolving architecture of market, social and
knowledge interactions (Aghion, David, Foray 2009; Terna 2009).
The simulation of the working of an economic system where technological change
can take place implements the basic intuitions of complexity theory and of economics
of innovation. The simulation will enable to identify the proper solutions to the two
knowledge trade-off that have been identified with respect to the structure of
intellectual property right regimes and the regional distribution of knowledge
generation activities.
3 Empirical investigations and tests of specific hypotheses can complement and support agent-based simulations. See
Antonelli and Scellato (2011) and Antonelli, Patrucco Quatraro (2011).
9
Let us now turn our attention to analyze the building blocks of our agent-based
simulation model. The following section shows how the use of the basic tools of
agent-based simulation can implement a rigorous representation of the dynamics of a
full-fledged economic system where agents are credited with the capability of
generating technological knowledge and generating technological innovations
provided a conducive architecture of network interactions and an effective intellectual
property right regime is implemented.
The simulation model The working of the system of interactions and transactions that qualify the simple but
articulated economic system outlined in the previous section can be explored by
means of a ABM in order to investigate the dynamics of the innovation process at the
system level4. ABM provides with the opportunity to explore the full range of
implications of a multilevel structure of interactions and transactions as framed in the
previous section and to take into account the variety of outcomes of the decisions
taken by each heterogeneous agent (Pyka Werker 2009; Terna 2009).
The ABM implemented in this section operationalizes, through the interactions
among a large number of objects representing the agents of our system, the working
of a typical complex process characterized by the key role of Marshallian
externalities and augmented by the Schumpeterian assumption that firms are credited
with the capability to try and innovate according to the levels of their performances
and the context into which they are localized (Dawid 2006).
The model assumes that firms are boundedly rational but endowed with procedural
rationality enriched by the capability to react and to innovate when and if a number of
external circumstances are provided. The rationality of their behaviour is objective, as
opposed to subjective. Firms in fact do react to the dynamics of both product and
factor markets but never maximize. Their reaction includes the possibility to
innovate, instead of sheer adjustments of quantities to prices.
In the ABM demand and supply meet in the market place; production is decided ex
ante; firms try and sell their output in the product market, where customers spend
their revenue. The matching between demand and supply sets temporary prices that
define the performances of firms. According to the levels of their performances and
the availability of external knowledge firms can fund dedicated research activities to
try and innovate (Lane 2009).
In the simulation, heterogeneous firms produce homogeneous products sold into a
single market. In the product markets the households expend the revenues stemming
4 The pseudo code of the model can be found in the Appendix A, flow charts describing the processes performed by the
agents are shown in Appendix B, and the analytical organization of the model with the founding equations are detailed
in Appendix C.
10
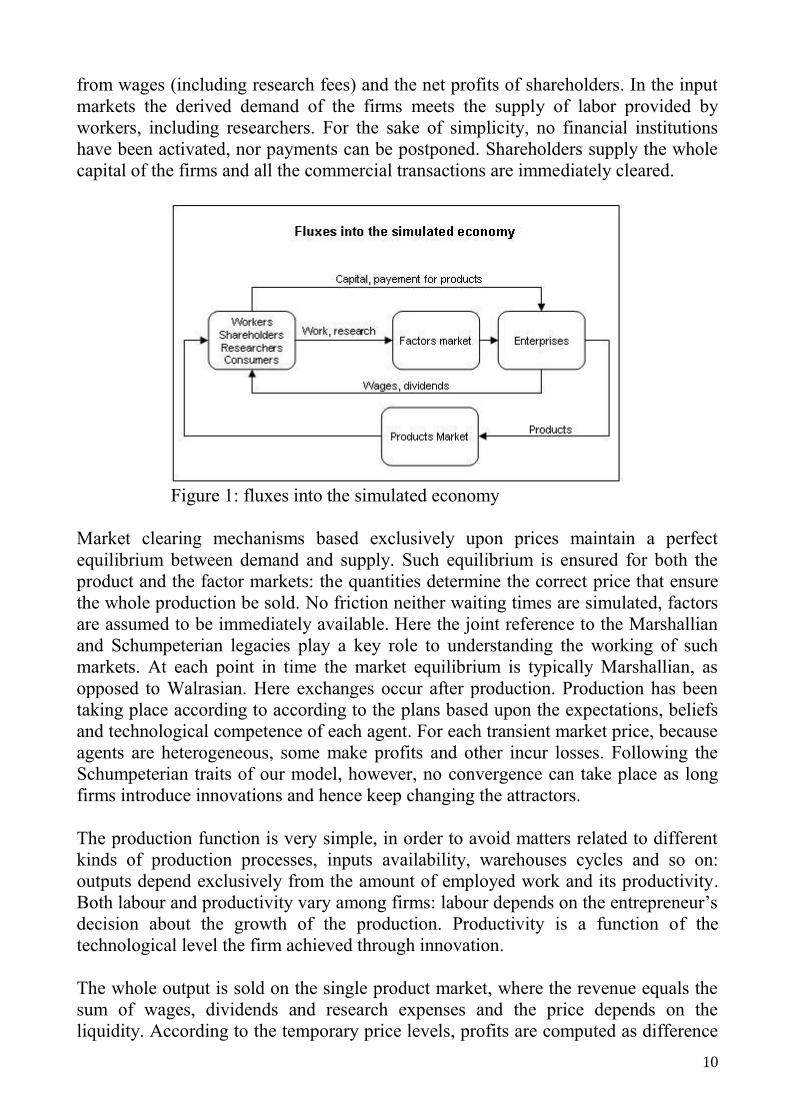
from wages (including research fees) and the net profits of shareholders. In the input
markets the derived demand of the firms meets the supply of labor provided by
workers, including researchers. For the sake of simplicity, no financial institutions
have been activated, nor payments can be postponed. Shareholders supply the whole
capital of the firms and all the commercial transactions are immediately cleared.
Figure 1: fluxes into the simulated economy
Market clearing mechanisms based exclusively upon prices maintain a perfect
equilibrium between demand and supply. Such equilibrium is ensured for both the
product and the factor markets: the quantities determine the correct price that ensure
the whole production be sold. No friction neither waiting times are simulated, factors
are assumed to be immediately available. Here the joint reference to the Marshallian
and Schumpeterian legacies play a key role to understanding the working of such
markets. At each point in time the market equilibrium is typically Marshallian, as
opposed to Walrasian. Here exchanges occur after production. Production has been
taking place according to according to the plans based upon the expectations, beliefs
and technological competence of each agent. For each transient market price, because
agents are heterogeneous, some make profits and other incur losses. Following the
Schumpeterian traits of our model, however, no convergence can take place as long
firms introduce innovations and hence keep changing the attractors.
The production function is very simple, in order to avoid matters related to different
kinds of production processes, inputs availability, warehouses cycles and so on:
outputs depend exclusively from the amount of employed work and its productivity.
Both labour and productivity vary among firms: labour depends on the entrepreneur‟s
decision about the growth of the production. Productivity is a function of the
technological level the firm achieved through innovation.
The whole output is sold on the single product market, where the revenue equals the
sum of wages, dividends and research expenses and the price depends on the
liquidity. According to the temporary price levels, profits are computed as difference
11
between income and costs, no taxes are paid, neither part of the profit can be retained
into the enterprise. Shareholders either will receive the profits or reintegrate the
losses.
Heterogeneous firms are localized into an economic structure represented as a
regional and technological space. Both spaces are managed as grids divided into cells
each of which can host an unlimited number of firms. The position into the regional
grid determines the neighbourhood into which firms can observe their competitors,
comparing results. The position of each firm in the technological grid measures its
productivity and defines the possibility to access quasi-public knowledge. The
distribution in the two space dimensions is not consistent: firms technologically very
close could be positioned in far distant cells of the regional space and vice versa. In
this way the absorption of technological knowledge spilling from firms based in
regional and technological proximity may enable the introduction of an innovation
with positive effects in terms of productivity growth.
The localization of agents in both space dimensions is the result of their past activities
and yet it can be changed at each point in time. The results obtained during a
production and consumption cycle influence the strategies the agents will take during
the next cycle. Hence the dynamics of the model is typically characterized by path
dependence: the dynamics in fact is non-ergodic because history matters and
irreversibility limits and qualifies the alternative options at each point in time. At
each point in time, however, the effects of the initial conditions may be balanced by
occasional events that may alter the „path‟ i.e. the direction and the pace of the
dynamics (David 2007).
The firms into the model, in fact, are always comparing their performances in terms
of profits, to the neighbours average results, the difference between own figures and
neighbours average ones increases the motivation to innovate. Transparency is
clearly local: the ray within which firms can observe the conduct of other firms is
limited accordingly with a parameter value. Beyond that ray information is scarce and
costly.
The farther is profitability from the average and the deeper the out-of-equilibrium
conditions. Firms can innovate if the results are under the average level, to improve
their performances, as well as when the results are above the average level, to take
advantage of abundant liquidity and reduced opportunity costs for risky undertakings.
Innovation is viewed as the possible result of intentional decision-making that takes
place in out-of-equilibrium conditions. The farther away is the firm from equilibrium
and the stronger the likelihood for innovation to take place. Hence we assume a U-
relationship between levels of profitability and innovative activity, as measured by
the rates of increase of total factor productivity (Antonelli and Scellato 2011).
Summarizing, firm increases its motivation to innovate each time its performance is
found to be far enough from the average. Such a motivation become stronger and
12
stronger if the enterprise‟s relative position remains outside a band for several and
consecutive production cycles: after a parametrically set number of consecutive
cycles the enterprise performs an innovation trial.
The simulation of the innovation process
ABM enables to explore in detail the innovation process and the role within it of the
external factors that shape the recombinant generation of technological knowledge.
At each point in time firms can react so as to try and increase their productivity.
Hence they can move and change their regional and technological localization by
means of research costs. The research costs are directly related to the actions
performed by each firm to innovate, either:
mobilize internal slack competence
absorb external knowledge spilling from neighbours,
move to other location in order to exploit more developed neighbours.
We assume a sequence of innovative steps. At first firms try and mobilize their own
internal slack competence. The firms that have not sufficient potential try and absorb
the external technological knowledge spilling from a neighbour and, if knowledge
absorption is not possible, they can move randomly to another location into the
physical space. Let us consider them in turn:
a) firms can mobilize their internal slack competence accumulated by means of
learning processes. The firms of the model are endowed with the ability to learn
better ways to perform their production cycles. Each time a production cycle is done,
firms acquire and cumulate some technological potential. Such a potential can be
transformed in actual innovation only by means of appropriate research activities and
access to external knowledge. Firms are able to build up competence by means of
learning processes. The accumulation of experience proceeds at a specific internal
“learning rate” that is biased by the impact of external “learning factor” that reflects
the competence level of the enterprises‟ neighbourhoods, measured as the average
productivity of the neighbours enterprises. The competence can be transformed in
real innovation when a parametrical threshold is reached, at a cost. Because the
internal slack competence is seldom sufficient to support the recombinant generation
of new technological knowledge and hence the actual introduction of a productivity
enhancing innovation, firms explore the technological and regional space into which
they are localized and try to access and absorb the knowledge of their neighbours
(March 1991).
b) absorption enables to take advantage of the technology introduced by other firms:
because of absorbing costs however it is not free. The effective access to external
technological knowledge requires substantial resources in exploration, identification,
decodification and integration into the internal knowledge base (Cohen and Levinthal
1989 and 1990). Moreover, because of bounded rationality, firms can observe only
the other ones that lay in a certain neighbourhood whose extension depends on a
“view” parameter: his value limits the number of positions all around the agent it can
13
explore. Due to the fact the simulated world is managed as a grid the position of the
agent limits this view: agents in a corner have less possibility to observe than other
located in the middle of the grid, as well as agents in a very crowded neighbours have
more information than isolated firms. Note that a single position into the grid could
pile several agents, so simply exploring its cell an agent may found other firms to
observe.
The view parameter determines only the number of cells the agent can access, the real
number of other firms it can observe depend upon the evolution of the agents‟
distribution and constitutes an emerging phenomenon that continuously evolves
during the execution of the simulation. When the agent is located near the end of the
grid its capability falls dramatically.
A major constraint to the possibility to take advantage and absorb others‟
technologies is represented by intellectual property rights (IPR). In order to model a
credible IPR regime we allow enterprises to patent their technology and hence to
retain exclusive exploitation rights for a certain number of cycles (Reichman 2000).
By observing other firms each firm knows the latest technological level they apply
that is not covered by a patent licence. The key parameter “patent expiration” is used
to experiment different scenarios, its value determines the number of production
cycles each innovation remains hidden to the competitors. It is plausible to expect
that the longer is the patent period, value of the patent expiration parameter (pe), the
higher will be the research effort: unless enterprises were given the exclusive
possibility to exploit the research results, no private firms would be interested in
investing money, because their discovery would be immediately available for
competitors. In the model, even with patent expiration equal to zero, the new
technology is exploited exclusively by the innovating enterprise for almost one cycle.
Observed technologies can be absorbed only if the distance between them and the
own ones is less than a parametrical value, so called “knowledge absorption
threshold”. This limitation has been introduced to avoid dramatic jumps in the
productivity of firms that would be not plausible. Knowledge absorption has a cost
equal to the named distance. Because the possibility to observe neighbours depends
on the position of each enterprise into the physical space, when knowledge absorption
gives poor or null results enterprises could decide to move into another location in
order to meet better technological conditions.
c) relocalization. The third way to improving productivity levels consists in moving
around the physical space in order to reach more interesting neighbours. When the
mobilization of competence and knowledge absorption are not viable solutions, firms
can try and move randomly to another location in the hope to found better developed
zones. Movement is limited by a parameter called “jump”, its value determines the
maximum amount of cells the firms can go through vertically and horizontally back
or forward; the effective number of cells the enterprise will move is determined
14
randomly into this range, that constitutes a Von Neumann‟s neighbour. Moving costs
are directly related to the distance between the original and the new location.
Here we see how the structure of the system influences in several ways the innovation
chances of the enterprises: learning is faster for firms that operate in a well developed
neighbour, and imitators have higher possibilities to observe and copy if they operate
into a crowded and technologically advanced environments (Ozman 2009).
Firms are endowed, at the start of the simulation, with a competence and a
technological level, randomly tossed for each into the lowest quarter of the possible
values, following a uniform probability distribution. The simulations started with low
skilled firms, with a uniform distribution among them, both to give each firm:
the possibility to express its own development path,
a similar starting situation to analyze the different development paths.
In the real world, knowledge centres, like universities, technical and management
schools and so on, are located unevenly in the geographical territory with clear
effects: a large evidence confirms that firms operating in geographical regions whit
an high density of such organisations have higher chances to access higher level of
knowledge. To introduce these aspects in the simulation model we have represented
geographical regions by means of physical spaces where competence is distributed
following different configurations: from a full concentration in a limited space to a
well disseminated distribution. Knowledge centres are represented by firms with very
high technological level (so called “genius”), whose initial knowledge endowment is
randomly tossed within the highest quarter of the possible values, whereas normal
agents are given values in the lowest one.
Neighbours can take advantage of the external knowledge spilling from the „genius‟
within the boundaries of the knowledge absorption threshold value set up for the
simulation. Hence the higher the knowledge absorption possibility is and the stronger
is the influence of the genius to their neighbours. The patent duration does not slow
the effect because the initial knowledge is pretended to be an old and public one.
In order to experiment different scenarios the number of genius is parametrically
managed and could be set to zero to exclude this effects. The distribution in space of
agents is tossed randomly at the beginning of the process but it becomes fully
endogenous as agents are credited with the capability to move in regional space
searching for the access to external knowledge spilling in the proximity of „genius‟.
Hence the dynamics of the regional distribution of agents exhibits the typical traits of
path dependence.
The process is non-ergodic but not past-dependent: small variations can exert
important effects in terms of emergence of strong clusters or, on the opposite,
progressive dissemination in space (D‟Ignazio and Giovannetti 2006; Antonelli
2008).
15
Results of the simulations
The strength of the ABM consists in the possibility to assess in a coherent and
structured frame the systemic consequences of alternative structural configurations of
the properties of the system. Simulation techniques allow to exploring the outcomes
of different hypotheses concerning key issues of the model within a structured and
consistent frame that takes into account the full set of direct and indirect effects of the
interactions of agents (Pyka Werker 2009).
The results of the simulation confirm that the model is consistent and able to mimic
the working of a complex system where rent-seeking agents react to the changing
conditions of the product and factor markets. Hence the results confirm that the set of
equations is able to portray the working of a complex system based upon a large
number of heterogeneous agents on both the demand and the supply side that are
price taker in product markets. Markets clear with temporary equilibrium price. The
replication of the temporary equilibrium price in the long term confirms that the
model is appropriate to explore the general features of the system when the reaction
of firms is adaptive and consists in price to quantity adjustments. In the extreme case
where firms cannot innovate for the lack of internal competence to be mobilized and
external knowledge to be absorbed, the system mimics effectively the working of
static general equilibrium in conditions of allocative and productive efficiency but
with no dynamic efficiency. The markets sort out the least performing firms and drive
the prices to the minimum production costs. This result is important because it
confirms that static general equilibrium is the simple and elementary form of
complexity that takes place when agents cannot innovate. As soon as agents try and
succeed in their reaction to changing market conditions with the introduction of
innovations, the equilibrium conditions become dynamic and all the key features,
such as the prices, the quantities, the efficiency and the structure, of the system keep
changing (Antonelli 2011).
Innovation is effectively an emerging property of the system because it takes place
when the external conditions and the structure of the system provide access to the
external knowledge that is crucial to feed the effective recombinant generation of new
technological knowledge and hence the actual introduction of productivity enhancing
innovations by firms that try and cope with the changing conditions of the system
doing more than sheer adjustments of prices to quantities.
The access to external knowledge is necessary to achieve the effective recombinant
generation of new technological knowledge and to eventually introduce new
technologies. The structural characteristics of the system into which firms are
embedded are crucial to enable the reaction to become creative and hence to
introduce innovations that increase their productivity.
The simulations provide key information about the two knowledge trade-offs and
enable to assess the systemic effects in terms of dynamic efficiency of alternative
16
configurations of the intellectual property right regimes and architectures of the
network interactions We have explored the consequences of two sets of hypotheses:
1) the effects of different durations patents and 2) the effects of different architectural
properties of the system in terms of distribution of firms with high levels of
technological competence.
The effective recombinant generation of technological knowledge and the consequent
introduction of technological innovations is tracked and quantified in terms of
productivity growth, measured as the ratio of input o output. Firms that are able to
take advantage of knowledge externalities, to generate successfully new technological
change and hence to introduce better technologies, will experience an increase in the
general levels of efficiency of their production process and will experience higher
mark-ups with evident positive consequences on productivity levels.
The changes in productivity levels affect the dynamics of the system not only in
terms of average rates of growth but also in terms of variance. Growth cum
technological change is far from a steady increase. On the opposite it exhibits
fluctuations that are typical of long term Schumpeterian process of creative
destruction. Occasionally the majority of firms incur major losses due to the
mismatch between their current cost conditions and the performances of a few radical
innovators able to introduce breakthrough innovations. In a typical Schumpeterian
process we see that the introduction of radical innovations engenders occasional
phases of decline in output. It is interesting to note that the fluctuations are sharper
when the pace of technological change is higher and more specifically in the
configurations of spatial distribution and appropriability regimes that make faster the
rates of introduction of technological innovation and hence of productivity growth.
Let us now consider in turn the alternative results that are obtained with different
structural configurations of both the intellectual property right regimes and the spatial
distribution of firms5.
The first knowledge trade-off: Intellectual property right regimes
The first question the simulation has been employed to investigate refers to the role of
patent protection in promoting and sustaining the innovation. The well-known IPR
trade-off can now be investigated (Harison 2008; Vandekerckhove and De Bond
2008).
Intellectual property rights enable firms to secure exclusive rights on the
technological knowledge they have generated. By means of IPR enterprises can
exclude competitors from the exploitation of such new technologies and consolidate
an effective competitive advantage. At the micro level patent protection reinforces the
motivation to innovate giving the enterprise the possibility to exploit its own
innovation in an exclusive way (hereafter “reinforcing effect”).
5 The whole collection of all experiments data is available in Appendix D.
17
Moving from our basic assumption that the introduction of innovations builds upon in
the recombination of existing knowledge it is clear that the patent protection has a
negative effect: the longer the protection lasts the slower the new technologies can
spread among firms (hereafter “slowing effect”) (Gay, Latham, Le Bas 2008).
This research investigates both the effects focusing on the influence they have on the
innovation process. The simulations has been run using the following model set up:
all the firms (agents) operated into a common market and district,
all the firms started from a similar level of technologies, randomly tossed into
the first quarter of the achievable technologies following a uniform
distribution,
each firm was given high capability to observe the neighbours and to absorb
external knowledge,
the unique parameter that varied among the simulations was the “patent
expiration”, i. e. the time, in production cycles, a new technology was owned
by the innovator and not available to the other agents in the system.
The probability firms try to innovate even if their results are similar to their
neighbours ones is positively correlated to the patent expiration since its is less
than one hundred; for values greater than one hundred no innovation at all are
pursued by the firms unless their results were far from the neighbours ones.
Two sets of experiments have been executed both based upon the observation of the
average productivity level the agents achieved after a determined number of
production cycles. In the model productivity is positively correlated to the
technology, so the more a firm innovates the higher is its productivity: by observing
the dynamics of the productivity it is possible to study the effects of the institutional
and regional context upon the innovation strategy of the firms.
The first set of experiments consisted in benchmarking the innovation to explore the
difference among the results in terms of productivity levels obtained with several
different duration times of the patent protection and a benchmark figure, represented
by the productivity level the agents achieved with patent expiration set to one. To
ensure the results were robust and systematic, each simulation was run ten times by
varying, for each run, the seed employed to generate pseudo random numbers; the
result of each experiment was computed as the average of the ten runs results.
The second set of experiments consisted in correlating innovation and patent
expiration: fifty simulations was run varying, each time, both the random seed and
the value of the patent expiration parameter; the value was randomly tossed following
a uniform distribution into the interval: ]1,255[. The described approach ensured both
the robustness of the results and the independence of the parameters set up from any
researcher‟s mental schemata.
18
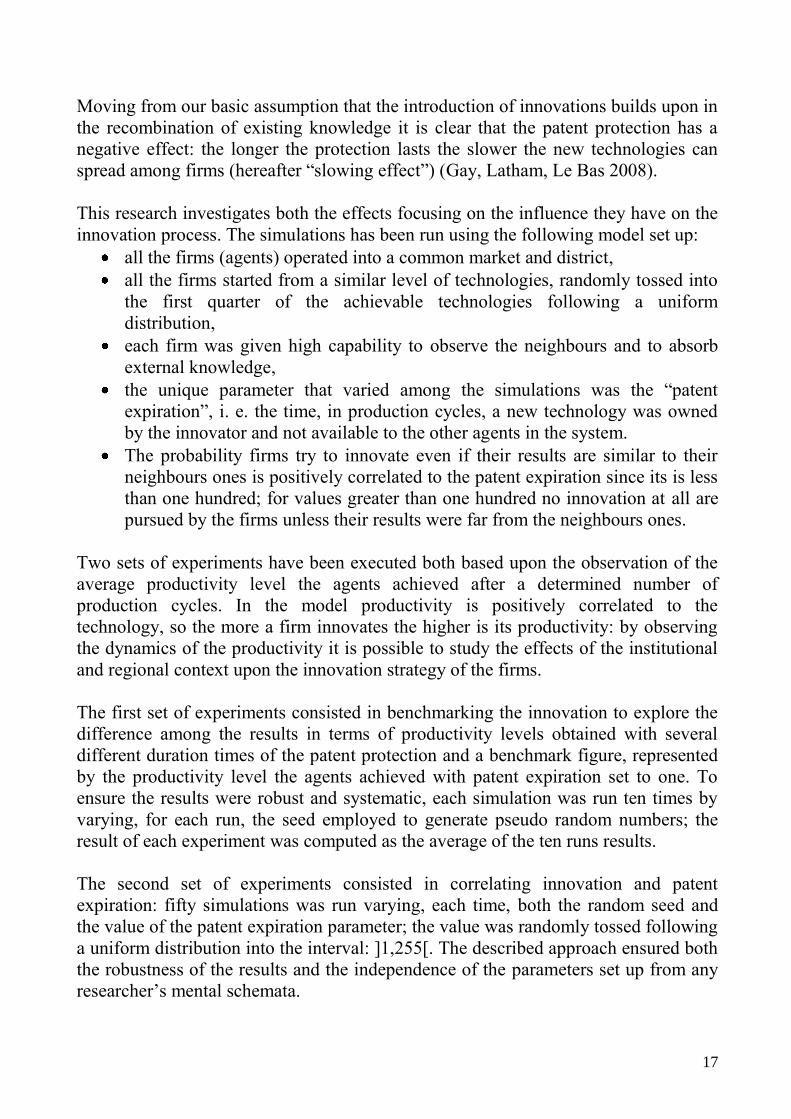
Benchmarking the productivity
The following figure 2 shows the average results obtained in five different
experiments based upon diverse values for the patent expiration parameters.
The results of the first one (patent expiration set to one) constitute our benchmark.
Each experiment consisted in running for several times (ten in this case) a simulation
five hundred whole production-consumption cycles long, with a determined value for
the patent expiration parameter and different random seed; the results of each
simulation have been summarized by means of the average productivity value
computed tacking the reached values of each firm into the population of the model.
The distribution of those average values exhibited a very low variance allowing its
usage as the representative value and suggesting that the results were robust and fully
independent from the different random numbers distributions generated for each
simulation starting from a diverse seed.
The graph shows that the four different scenarios (8, 55,144, 233) were not able to
achieve the benchmark (scenario 1), because the productivity level directly depended
on the achieved technological level, it would mean that the reinforcing effect has
been systematically weaker than the slowing one.
In sum the results confirm that the stronger the IPR protection was (the more
extended in time the patent protection was) the slower the innovation process
proceeded.
Figure 2: histogram representing the results of the simulations.
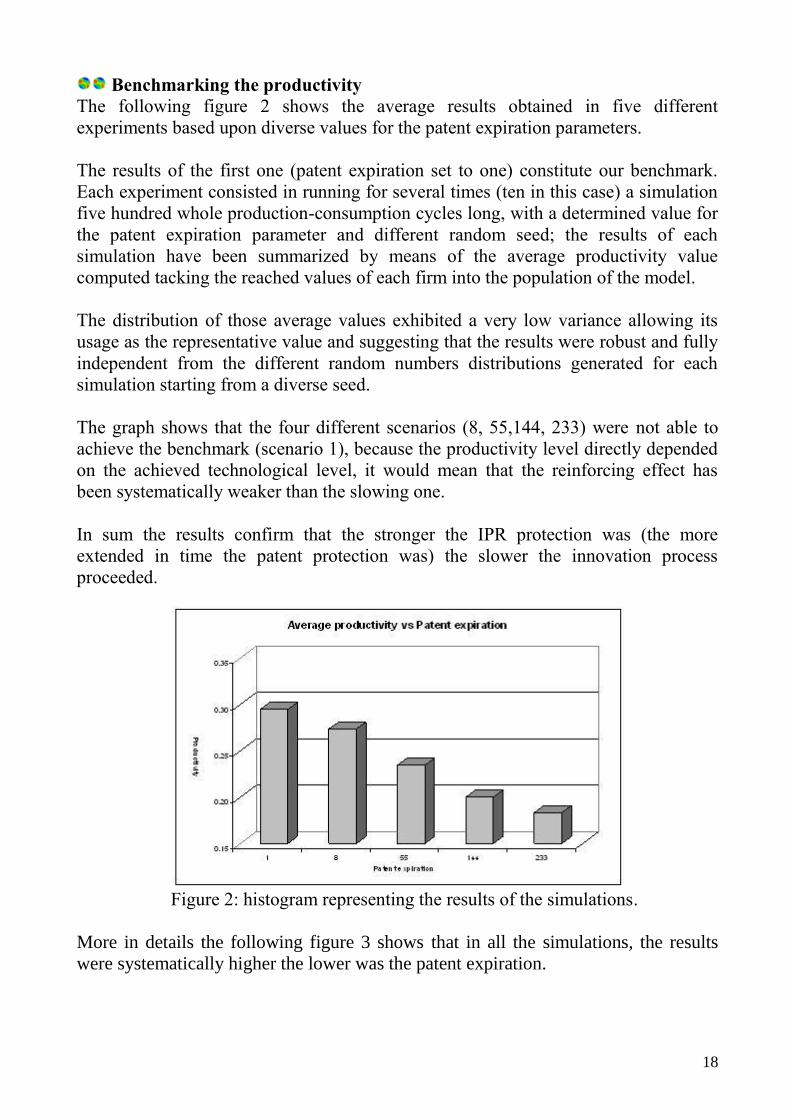
More in details the following figure 3 shows that in all the simulations, the results
were systematically higher the lower was the patent expiration.
19
Figure 3: results reached in each of the ten simulations.
The figure 4 better shows the trend of the phenomena by drawing minimum and
maximum results obtained in each experiment.
Figure 4: results of the experiments related to the value
of the patent expiration parameter.
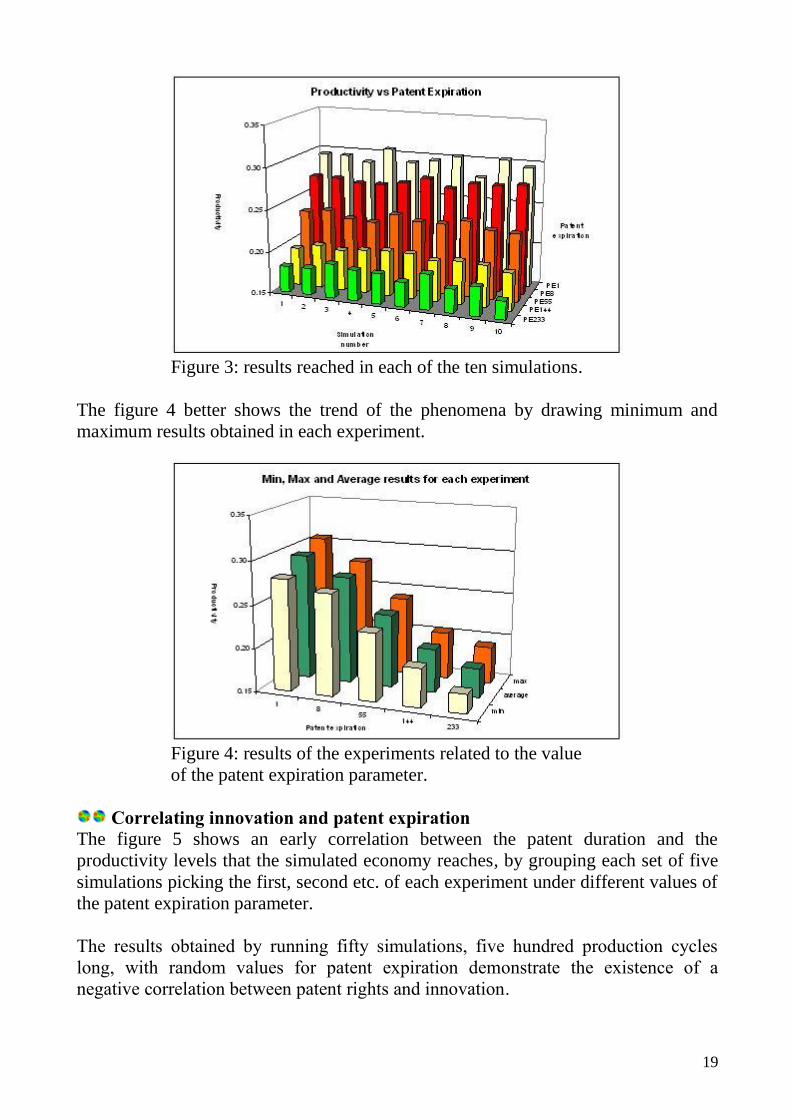
Correlating innovation and patent expiration
The figure 5 shows an early correlation between the patent duration and the
productivity levels that the simulated economy reaches, by grouping each set of five
simulations picking the first, second etc. of each experiment under different values of
the patent expiration parameter.
The results obtained by running fifty simulations, five hundred production cycles
long, with random values for patent expiration demonstrate the existence of a
negative correlation between patent rights and innovation.
20
Figure 5: correlation between patent expiration and productivity.
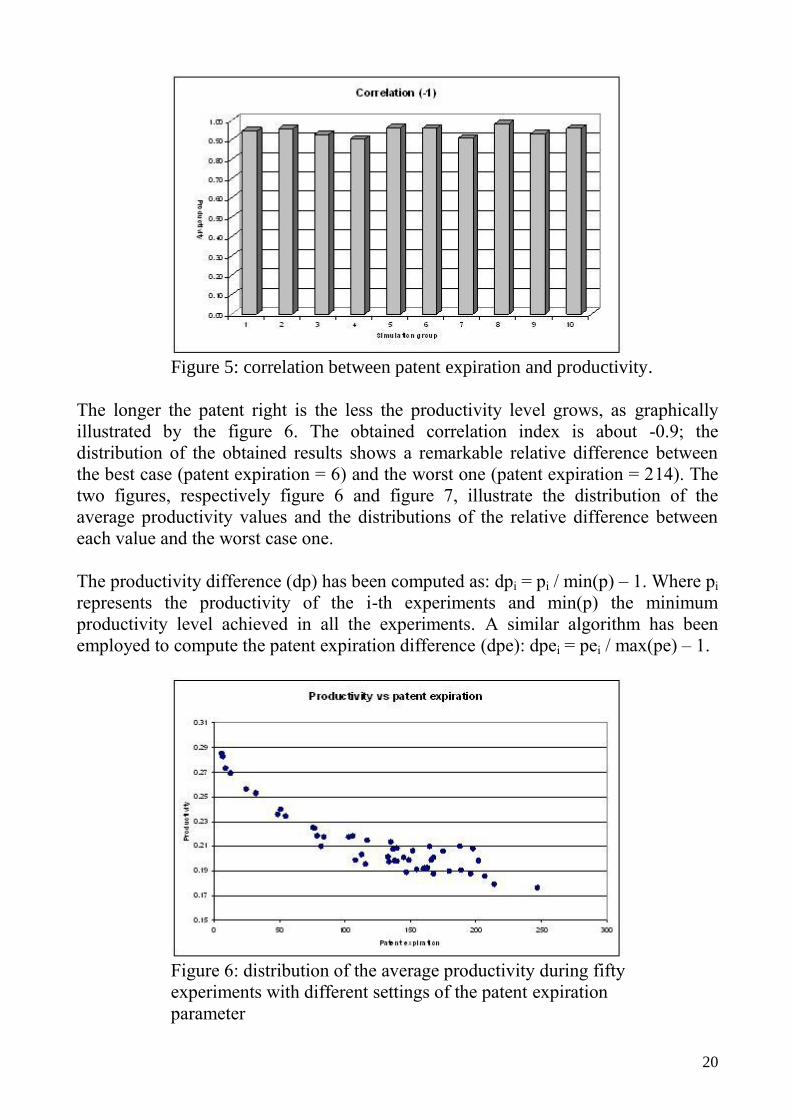
The longer the patent right is the less the productivity level grows, as graphically
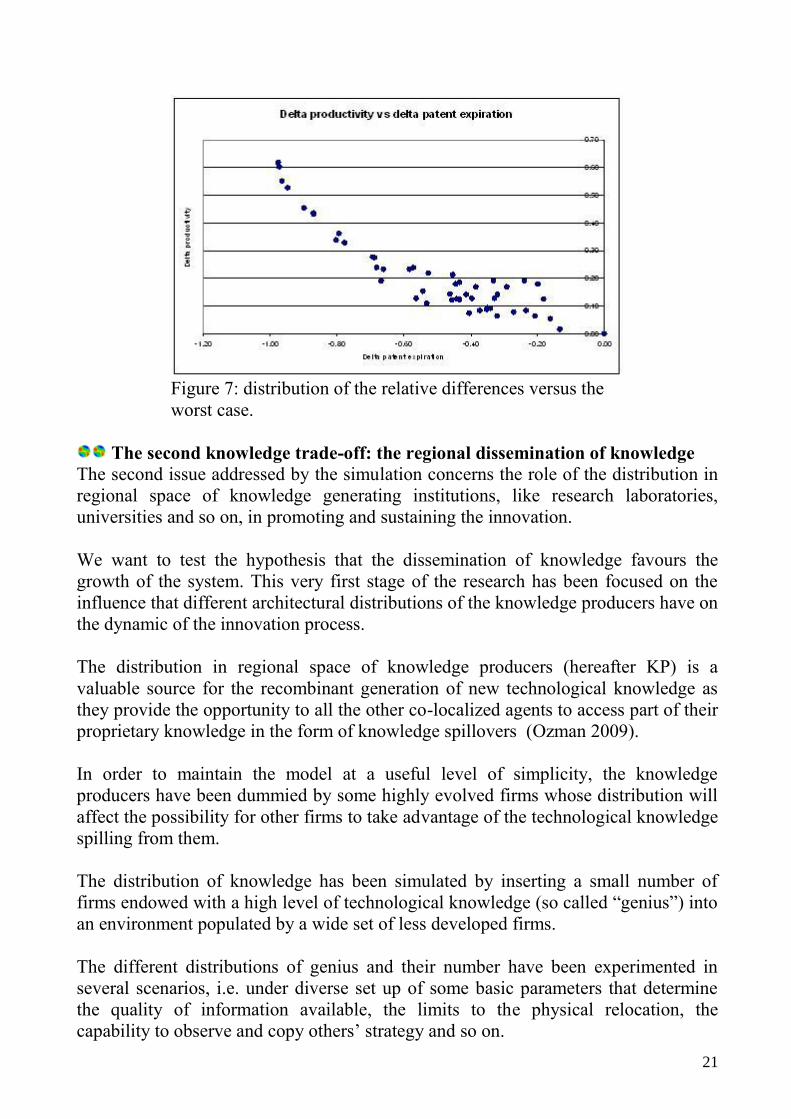
illustrated by the figure 6. The obtained correlation index is about -0.9; the
distribution of the obtained results shows a remarkable relative difference between
the best case (patent expiration = 6) and the worst one (patent expiration = 214). The
two figures, respectively figure 6 and figure 7, illustrate the distribution of the
average productivity values and the distributions of the relative difference between
each value and the worst case one.
The productivity difference (dp) has been computed as: dpi = pi / min(p) – 1. Where pi
represents the productivity of the i-th experiments and min(p) the minimum
productivity level achieved in all the experiments. A similar algorithm has been
employed to compute the patent expiration difference (dpe): dpei = pei / max(pe) – 1.
Figure 6: distribution of the average productivity during fifty
experiments with different settings of the patent expiration
parameter
21
Figure 7: distribution of the relative differences versus the
worst case.
The second knowledge trade-off: the regional dissemination of knowledge
The second issue addressed by the simulation concerns the role of the distribution in
regional space of knowledge generating institutions, like research laboratories,
universities and so on, in promoting and sustaining the innovation.
We want to test the hypothesis that the dissemination of knowledge favours the
growth of the system. This very first stage of the research has been focused on the
influence that different architectural distributions of the knowledge producers have on
the dynamic of the innovation process.
The distribution in regional space of knowledge producers (hereafter KP) is a
valuable source for the recombinant generation of new technological knowledge as
they provide the opportunity to all the other co-localized agents to access part of their
proprietary knowledge in the form of knowledge spillovers (Ozman 2009).
In order to maintain the model at a useful level of simplicity, the knowledge
producers have been dummied by some highly evolved firms whose distribution will
affect the possibility for other firms to take advantage of the technological knowledge
spilling from them.
The distribution of knowledge has been simulated by inserting a small number of
firms endowed with a high level of technological knowledge (so called “genius”) into
an environment populated by a wide set of less developed firms.
The different distributions of genius and their number have been experimented in
several scenarios, i.e. under diverse set up of some basic parameters that determine
the quality of information available, the limits to the physical relocation, the
capability to observe and copy others‟ strategy and so on.
22
Four different distributions for knowledge producers have been studied and compared
by observing their effects upon the evolution of the productivity, to ensure the
distributions were stable knowledge producers were not allowed to change their
position into the physical space. In the four different spaces we find 250 normal firms
and a certain number of knowledge-intensive ones (KP).
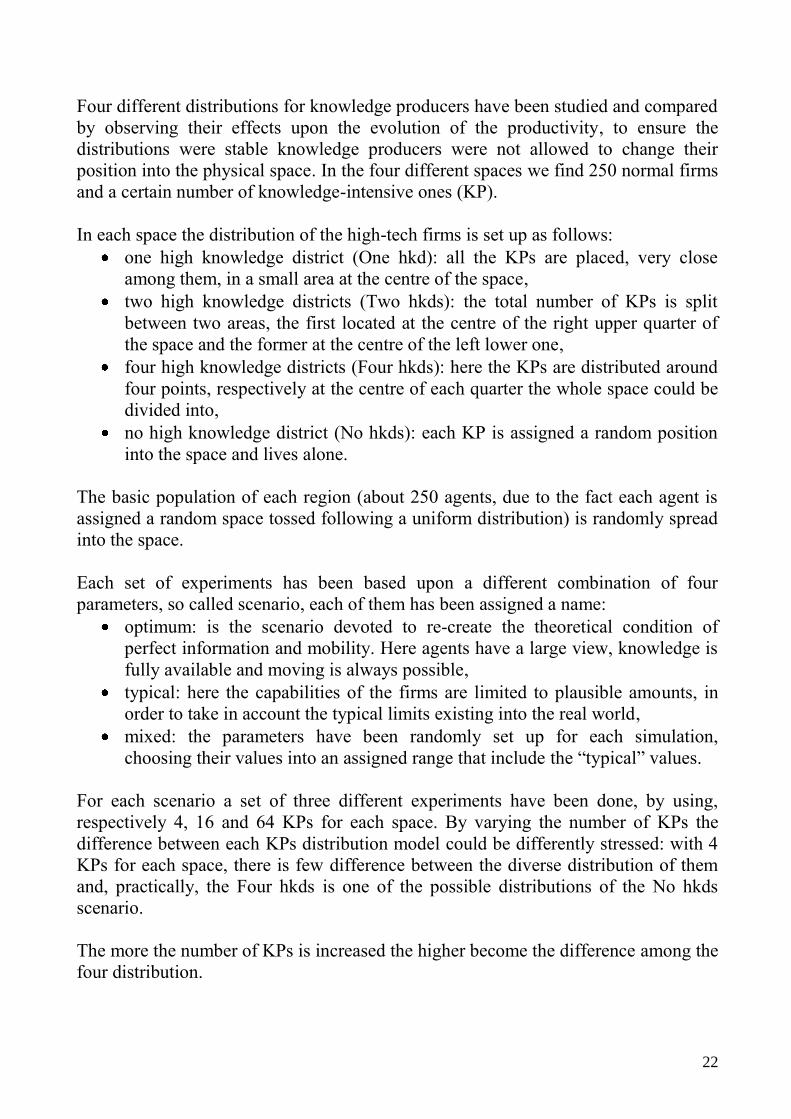
In each space the distribution of the high-tech firms is set up as follows:
one high knowledge district (One hkd): all the KPs are placed, very close
among them, in a small area at the centre of the space,
two high knowledge districts (Two hkds): the total number of KPs is split
between two areas, the first located at the centre of the right upper quarter of
the space and the former at the centre of the left lower one,
four high knowledge districts (Four hkds): here the KPs are distributed around
four points, respectively at the centre of each quarter the whole space could be
divided into,
no high knowledge district (No hkds): each KP is assigned a random position
into the space and lives alone.
The basic population of each region (about 250 agents, due to the fact each agent is
assigned a random space tossed following a uniform distribution) is randomly spread
into the space.
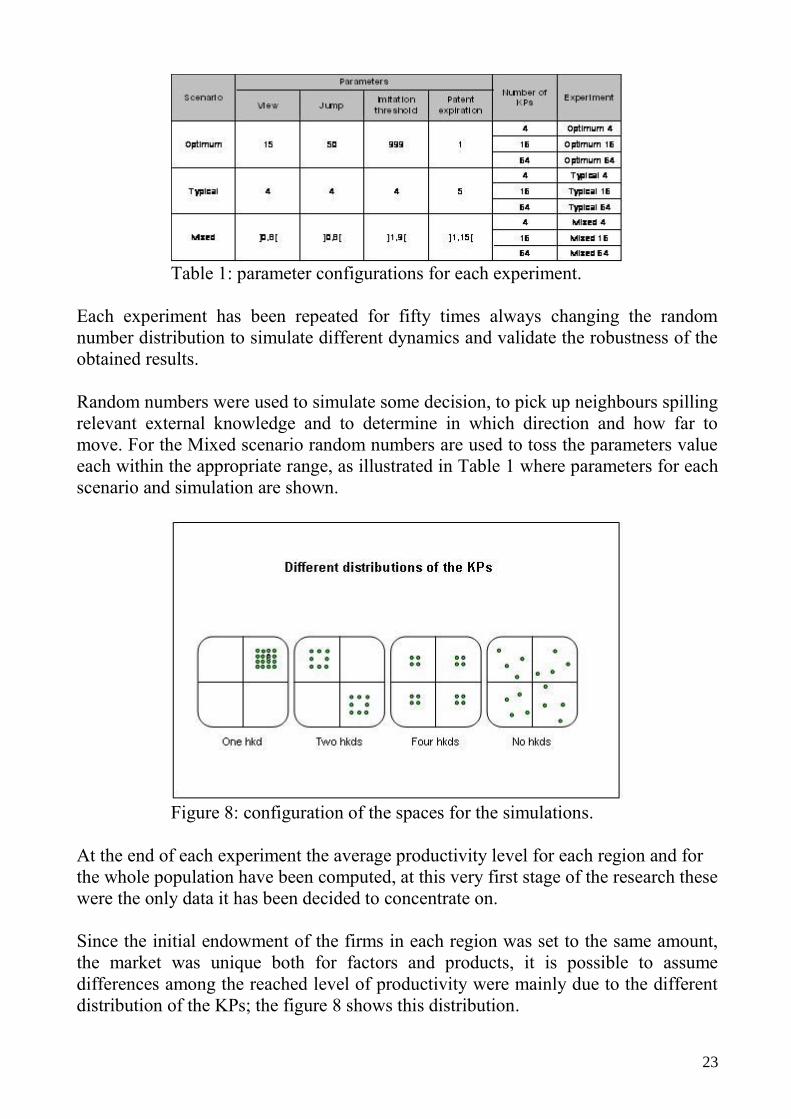
Each set of experiments has been based upon a different combination of four
parameters, so called scenario, each of them has been assigned a name:
optimum: is the scenario devoted to re-create the theoretical condition of
perfect information and mobility. Here agents have a large view, knowledge is
fully available and moving is always possible,
typical: here the capabilities of the firms are limited to plausible amounts, in
order to take in account the typical limits existing into the real world,
mixed: the parameters have been randomly set up for each simulation,
choosing their values into an assigned range that include the “typical” values.
For each scenario a set of three different experiments have been done, by using,
respectively 4, 16 and 64 KPs for each space. By varying the number of KPs the
difference between each KPs distribution model could be differently stressed: with 4
KPs for each space, there is few difference between the diverse distribution of them
and, practically, the Four hkds is one of the possible distributions of the No hkds
scenario.
The more the number of KPs is increased the higher become the difference among the
four distribution.
23
Table 1: parameter configurations for each experiment.
Each experiment has been repeated for fifty times always changing the random
number distribution to simulate different dynamics and validate the robustness of the
obtained results.
Random numbers were used to simulate some decision, to pick up neighbours spilling
relevant external knowledge and to determine in which direction and how far to
move. For the Mixed scenario random numbers are used to toss the parameters value
each within the appropriate range, as illustrated in Table 1 where parameters for each
scenario and simulation are shown.
Figure 8: configuration of the spaces for the simulations.
At the end of each experiment the average productivity level for each region and for
the whole population have been computed, at this very first stage of the research these
were the only data it has been decided to concentrate on.
Since the initial endowment of the firms in each region was set to the same amount,
the market was unique both for factors and products, it is possible to assume
differences among the reached level of productivity were mainly due to the different
distribution of the KPs; the figure 8 shows this distribution.
24
Results of the Optimum scenario
The “Optimum” scenario has been set up to validate the model under the classic
assumption of perfect information and mobility: provided that each regional space is
simulated by a square lattice 100 cells wide, jumping in each direction of 50 cells
means have a perfect mobility, as well as because the maximum distance between the
worst and the best technology has been limited, in these simulations, to 200 and
knowledge absorption threshold of 999 means that each technology could be copied.
The patent expiration set to one means that each adopted technology becomes quasi-
public in the successive production cycle, so each technology could be copied as soon
as it has been adopted.
The value of the view parameter would have been set to fifty too, as for the jump one,
but fifteen demonstrated to be enough to allow a good circulation of information and
guarantee the majority of the enterprises reached the higher technological level in a
very short time.
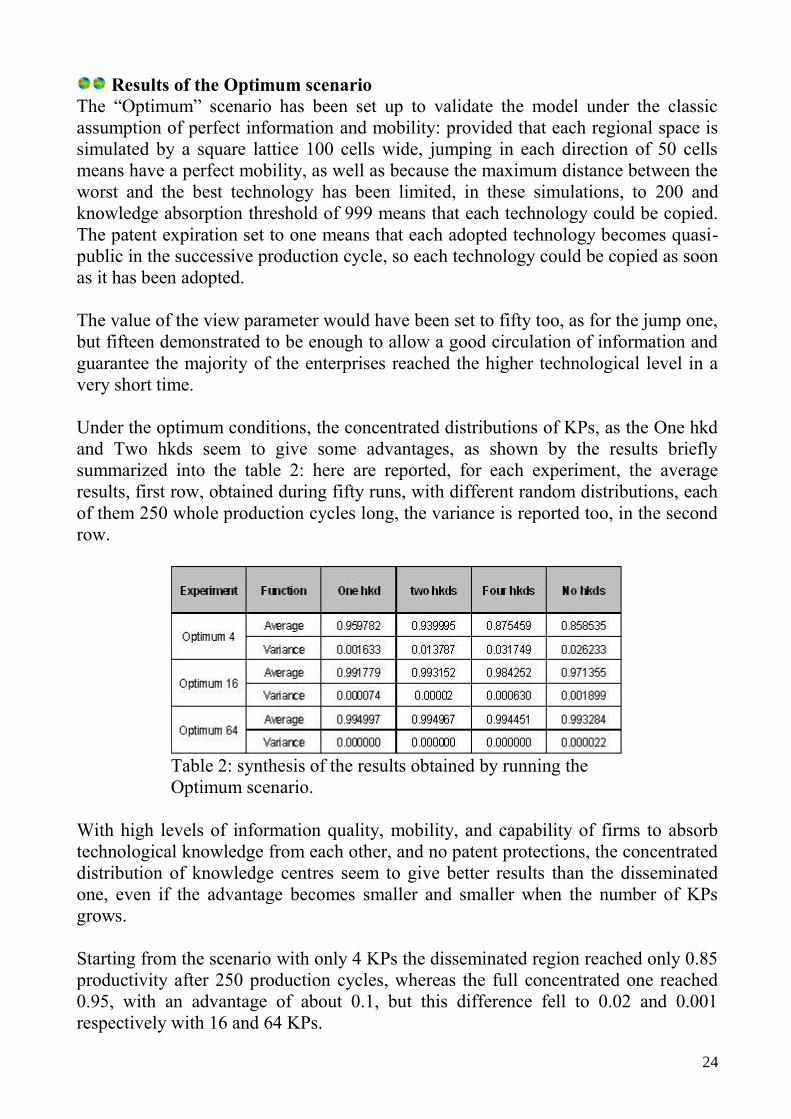
Under the optimum conditions, the concentrated distributions of KPs, as the One hkd
and Two hkds seem to give some advantages, as shown by the results briefly
summarized into the table 2: here are reported, for each experiment, the average
results, first row, obtained during fifty runs, with different random distributions, each
of them 250 whole production cycles long, the variance is reported too, in the second
row.
Table 2: synthesis of the results obtained by running the
Optimum scenario.
With high levels of information quality, mobility, and capability of firms to absorb
technological knowledge from each other, and no patent protections, the concentrated
distribution of knowledge centres seem to give better results than the disseminated
one, even if the advantage becomes smaller and smaller when the number of KPs
grows.
Starting from the scenario with only 4 KPs the disseminated region reached only 0.85
productivity after 250 production cycles, whereas the full concentrated one reached
0.95, with an advantage of about 0.1, but this difference fell to 0.02 and 0.001
respectively with 16 and 64 KPs.
25
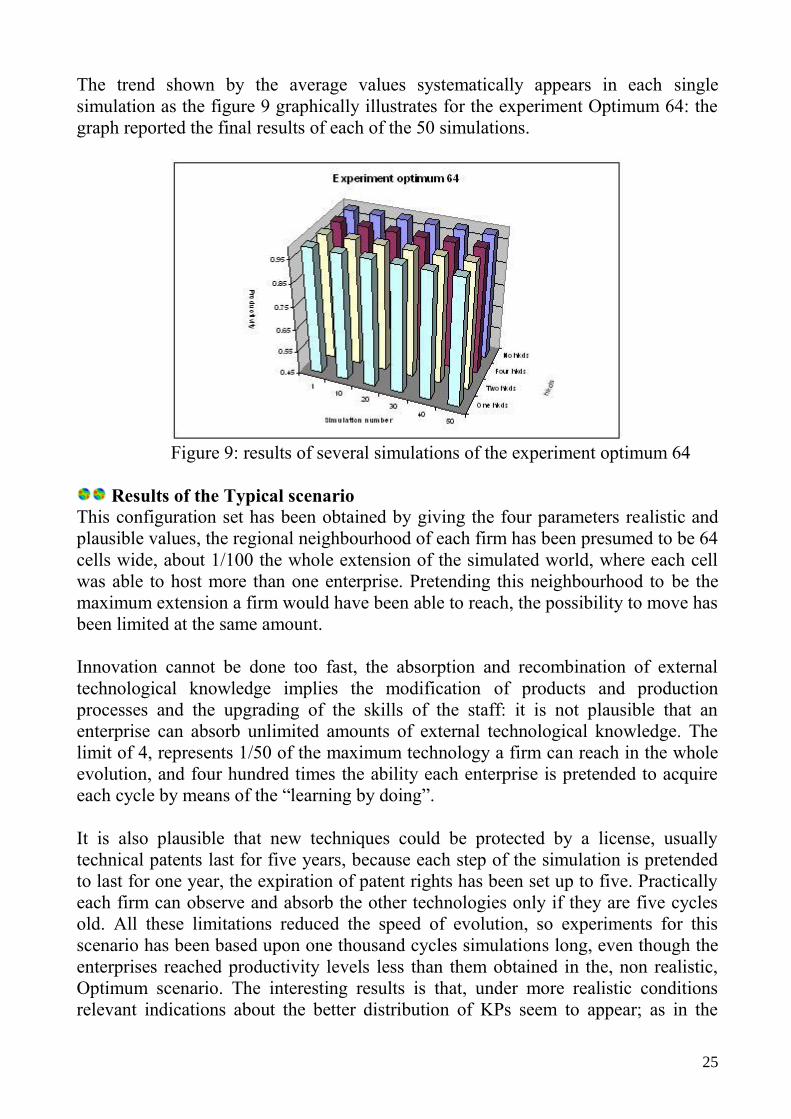
The trend shown by the average values systematically appears in each single
simulation as the figure 9 graphically illustrates for the experiment Optimum 64: the
graph reported the final results of each of the 50 simulations.
Figure 9: results of several simulations of the experiment optimum 64
Results of the Typical scenario
This configuration set has been obtained by giving the four parameters realistic and
plausible values, the regional neighbourhood of each firm has been presumed to be 64
cells wide, about 1/100 the whole extension of the simulated world, where each cell
was able to host more than one enterprise. Pretending this neighbourhood to be the
maximum extension a firm would have been able to reach, the possibility to move has
been limited at the same amount.
Innovation cannot be done too fast, the absorption and recombination of external
technological knowledge implies the modification of products and production
processes and the upgrading of the skills of the staff: it is not plausible that an
enterprise can absorb unlimited amounts of external technological knowledge. The
limit of 4, represents 1/50 of the maximum technology a firm can reach in the whole
evolution, and four hundred times the ability each enterprise is pretended to acquire
each cycle by means of the “learning by doing”.
It is also plausible that new techniques could be protected by a license, usually
technical patents last for five years, because each step of the simulation is pretended
to last for one year, the expiration of patent rights has been set up to five. Practically
each firm can observe and absorb the other technologies only if they are five cycles
old. All these limitations reduced the speed of evolution, so experiments for this
scenario has been based upon one thousand cycles simulations long, even though the
enterprises reached productivity levels less than them obtained in the, non realistic,
Optimum scenario. The interesting results is that, under more realistic conditions
relevant indications about the better distribution of KPs seem to appear; as in the
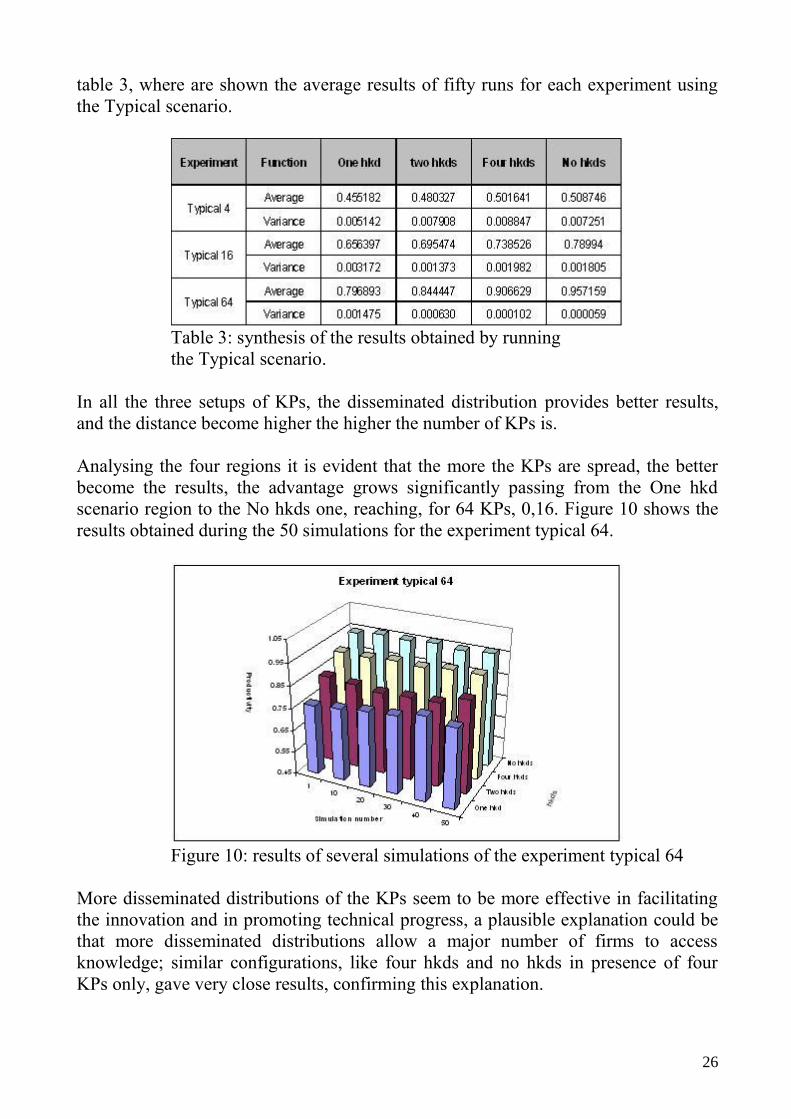
26
table 3, where are shown the average results of fifty runs for each experiment using
the Typical scenario.
Table 3: synthesis of the results obtained by running
the Typical scenario.
In all the three setups of KPs, the disseminated distribution provides better results,
and the distance become higher the higher the number of KPs is.
Analysing the four regions it is evident that the more the KPs are spread, the better
become the results, the advantage grows significantly passing from the One hkd
scenario region to the No hkds one, reaching, for 64 KPs, 0,16. Figure 10 shows the
results obtained during the 50 simulations for the experiment typical 64.
Figure 10: results of several simulations of the experiment typical 64
More disseminated distributions of the KPs seem to be more effective in facilitating
the innovation and in promoting technical progress, a plausible explanation could be
that more disseminated distributions allow a major number of firms to access
knowledge; similar configurations, like four hkds and no hkds in presence of four
KPs only, gave very close results, confirming this explanation.
27
Results of the Mixed scenario
The Mixed scenario has been built to test the results obtained into the typical one,
here the parameters set up is always changing, values are randomly tossed in ranges
that are distributed around the typical parameters value.
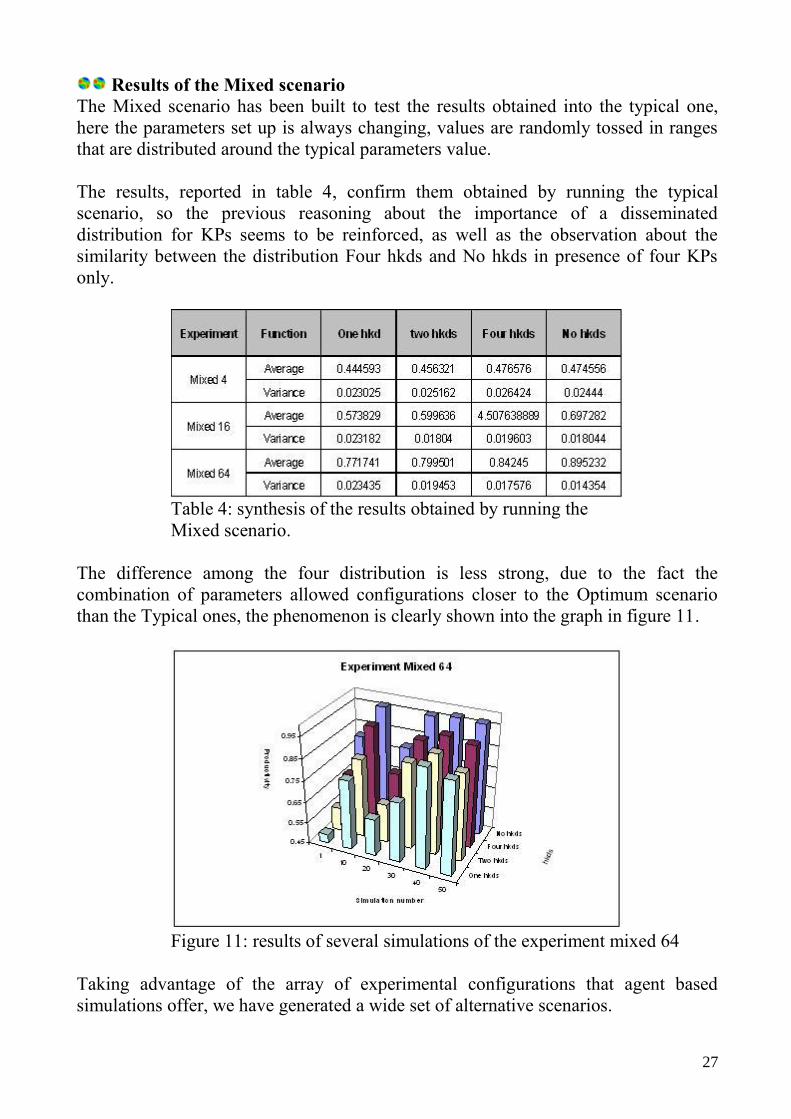
The results, reported in table 4, confirm them obtained by running the typical
scenario, so the previous reasoning about the importance of a disseminated
distribution for KPs seems to be reinforced, as well as the observation about the
similarity between the distribution Four hkds and No hkds in presence of four KPs
only.
Table 4: synthesis of the results obtained by running the
Mixed scenario.
The difference among the four distribution is less strong, due to the fact the
combination of parameters allowed configurations closer to the Optimum scenario
than the Typical ones, the phenomenon is clearly shown into the graph in figure 11.
Figure 11: results of several simulations of the experiment mixed 64
Taking advantage of the array of experimental configurations that agent based
simulations offer, we have generated a wide set of alternative scenarios.
28
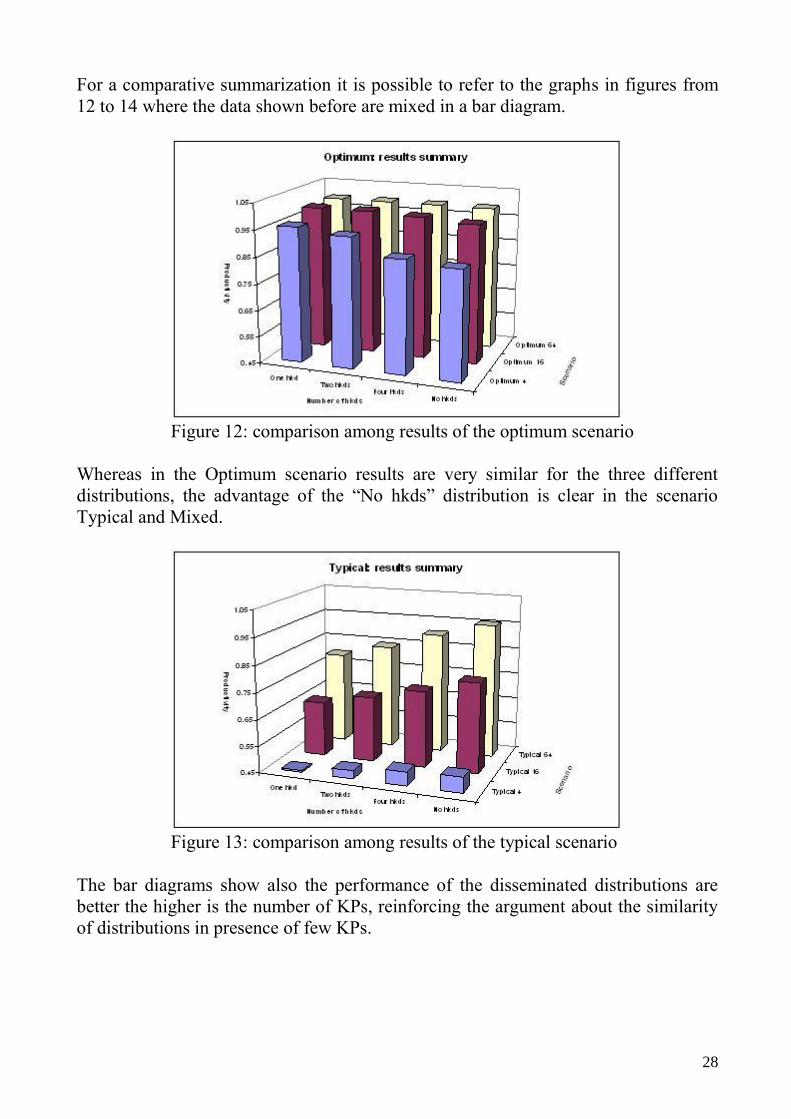
For a comparative summarization it is possible to refer to the graphs in figures from
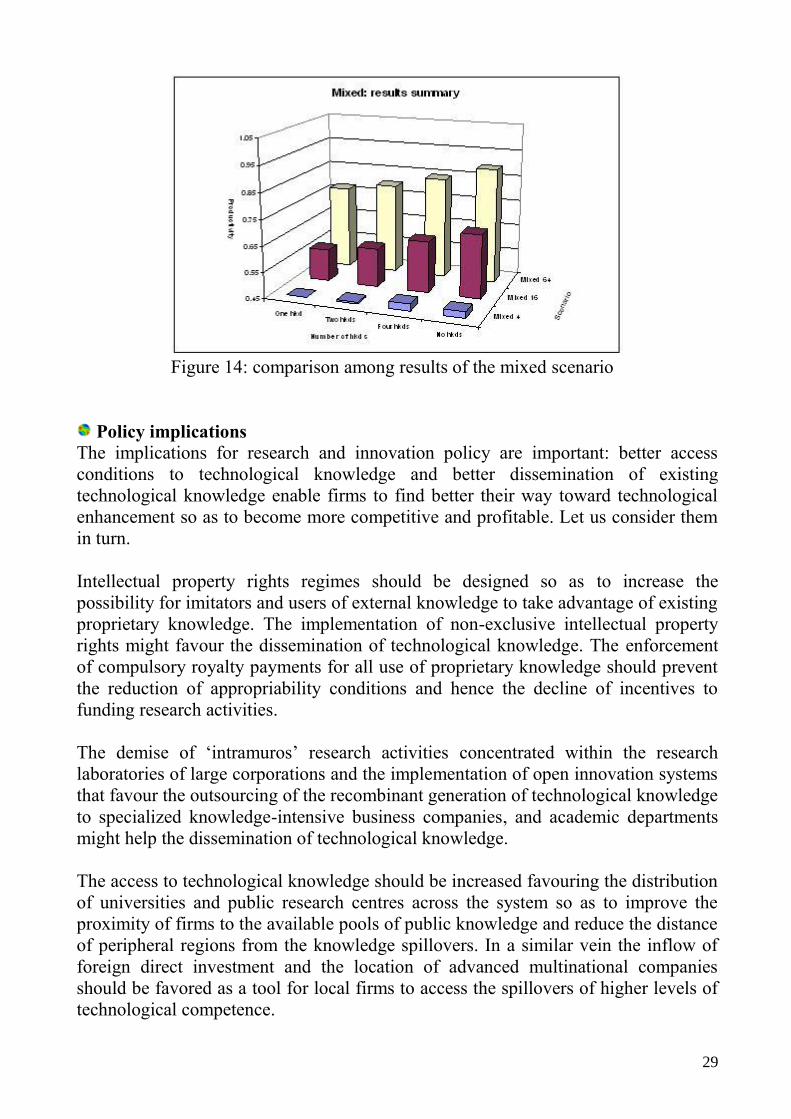
12 to 14 where the data shown before are mixed in a bar diagram.
Figure 12: comparison among results of the optimum scenario
Whereas in the Optimum scenario results are very similar for the three different
distributions, the advantage of the “No hkds” distribution is clear in the scenario
Typical and Mixed.
Figure 13: comparison among results of the typical scenario
The bar diagrams show also the performance of the disseminated distributions are
better the higher is the number of KPs, reinforcing the argument about the similarity
of distributions in presence of few KPs.
29
Figure 14: comparison among results of the mixed scenario
Policy implications
The implications for research and innovation policy are important: better access
conditions to technological knowledge and better dissemination of existing
technological knowledge enable firms to find better their way toward technological
enhancement so as to become more competitive and profitable. Let us consider them
in turn.
Intellectual property rights regimes should be designed so as to increase the
possibility for imitators and users of external knowledge to take advantage of existing
proprietary knowledge. The implementation of non-exclusive intellectual property
rights might favour the dissemination of technological knowledge. The enforcement
of compulsory royalty payments for all use of proprietary knowledge should prevent
the reduction of appropriability conditions and hence the decline of incentives to
funding research activities.
The demise of „intramuros‟ research activities concentrated within the research
laboratories of large corporations and the implementation of open innovation systems
that favour the outsourcing of the recombinant generation of technological knowledge
to specialized knowledge-intensive business companies, and academic departments
might help the dissemination of technological knowledge.
The access to technological knowledge should be increased favouring the distribution
of universities and public research centres across the system so as to improve the
proximity of firms to the available pools of public knowledge and reduce the distance
of peripheral regions from the knowledge spillovers. In a similar vein the inflow of
foreign direct investment and the location of advanced multinational companies
should be favored as a tool for local firms to access the spillovers of higher levels of
technological competence.
30
The dissemination of existing technological knowledge should become the object of
dedicated policy tools. The strengthening of the relations between the business
community and the public research system and specifically between firms and
universities might help the effective dissemination of knowledge and knowledge
generating competence. Public policy should support all interactions between
academics and firms favouring the actual creation of additional pecuniary knowledge
externalities with the provision of subsidies and fiscal allowances to all contracts
between firms and the academic system. The dissemination and implementation of a
fabric of good quality public research centers and universities through out the system
is likely to generate better results that the concentration of centers of worldwide
excellence in a few spots. For the same reasons the mobility of skilled and creative
scientists and experts among firms and between firms and research institutions at
large can become the target of dedicated research policy interventions aimed at
spreading competence and technological expertise.
Conclusion
This paper has implemented an evolutionary approach that integrates strong
Marshallian and Schumpeterian traits with the recent advances in the economics of
complexity, innovation can be considered as an emerging property of an economic
system that takes place when its structural characteristics provide access to external
knowledge as an indispensable input into the generation of new technological
knowledge. Building upon the Marshallian legacy, external knowledge is considered
an indispensable input, together with internal research activities, into the recombinant
generation of new knowledge. The reappraisal of the Schumpeterian notion of
innovation as a conditional result of a form of reaction to un-expected events, led to
articulate the hypothesis that the reaction of myopic but creative agents, that try and
cope with the changing conditions of their product and factor markets, may lead to
the effective recombinant generation of new technological knowledge and hence the
actual introduction of productivity enhancing innovations when they are embedded in
an organized complexity where they can actually take advantage of the external
knowledge available within the innovation system into which they are embedded.
In this context ABM enabled to explore the effects of alternative institutional.
organizational and architectural configurations of the knowledge structure of the
system in assessing the chances to pursue effectively the recombinant generation of
new technological knowledge and to introduce technological innovations. The
introduction of innovations is analyzed as the result of systemic interactions among
learning agents. The reaction of agents may become creative, as opposed to adaptive,
so as to lead to the introduction of productivity enhancing innovations when external
knowledge can be accessed at low costs and used in the recombinant generation of
new technological knowledge. Building upon agent-based simulation techniques the
paper has explored the effects that alternative configurations of the intellectual
property right regimes and architectural configurations of the system play in

31
assessing these costs and hence the chances to perform effectively the recombinant
generation of new technological knowledge.
The results of the ABM confirm that a system characterized by high levels of
knowledge dissemination is actually more effective in promoting the rates of
introduction of technological innovations. The results however show that systems
characterized by high levels of concentration could offer advantages in terms of faster
discovery, due to the close relations that could be established among the knowledge
producers. The implementation of an ABM has enabled the rigorous framing of a
complex system dynamics where innovation is the emerging property that takes place
when a number of complementary conditions qualify the reaction of firms and make
them creative. The simulation model can be applied to control the implications of an
array of alternative settings and hypotheses concerning appropriability conditions,
intellectual property rights regimes, knowledge generation routines and, most
important, policy interventions that can alter the structure of knowledge flows so as to
increase the levels of organization of the complexity of a system.
Taking inspiration from Schumpeter and Marshall, and the recent developments in the
analysis of the economic complexity of technological change, the ABM has shown the
systemic conditions that make innovation possible. Innovation is an emergent
property of the organized complexity of a system because innovation is as the
outcome of a situated and localized reaction when it can take advantage of a collective
and situated process, embedded in institutional as well structural settings, and
involving the combination of in-house and external knowledge and capabilities.
Additionally the uncertain outcome of these endeavours is portrayed as stochastic
functions (lotteries) emphasizing that there is no automaticity as regards success in
both activities. In this context an important aspect of the present elaboration is that the
spatial distribution of innovation activities is explained endogenously from the
interaction of competing firms.
Summarizing the results of the present simulation it seems to be possible to pretend
that the more the knowledge producers, like universities and advanced science-base
corporations, are spread upon the territory and the faster and more effective becomes
the innovation process. Myopic but creative firms coping with the changing
conditions of their product and factor markets are better able to improve their reaction
and make is creative, as opposed to adaptive, when technological knowledge is
disseminated in the regional, institutional and technological spaces.
References
AGHION P, David, P A, Foray, D (2009) Science, technology and innovation for
economic growth: Linking policy research and practice in 'STIG Systems'. Research
Policy 38, 681-693.
32
ANDERSON P W, Arrow K J, Pines D (eds.) (1988) The economy as an evolving
complex system. Addison Wesley, Redwood.
ANTONELLI C. (2008) Localized technological change: Towards the economics of
complexity. Routledge, London.
ANTONELLI C (2009) The economics of innovation: From the classical legacies to
the economics of complexity. Economics of Innovation and New Technology 18, 611-
646.
ANTONELLI C (ed.) (2011) Handbook on the economic complexity of technological
change, Edward Elgar, Cheltenham.
ANTONELLI C, Scellato G (2011) Out of equilibrium, profits and innovation,
Economics of Innovation and New Technology 20, forthcoming
ANTONELLI C, Patrucco P P, Quatraro F (2011) Productivity growth and pecuniary
knowledge externalities: An empirical analysis of agglomeration economies in
European regions, Economic Geography 87, 23-50.
ARTHUR W B (1990) Positive feedbacks in the economy. Scientific American 262,
92.
ARTHUR W B (1994) Increasing returns and path dependence in the economy.
Michigan University Press, Ann Arbor.
ARTHUR W B (1999) Complexity and the economy. Science 284, 107-109.
ARTHUR W B (2009), The nature of technology. What it is and how it evolves. Simon
Schuster, New York.
ARTHUR W B, Durlauf S N and Lane D A (eds.) (1997) The economy as an evolving
complex system II. Addison-Wesley, Redwood City, CA.
ARTHUR W B Durlauf S N, Lane D A (1997) Introduction, (pp.1-14) in Arthur W
B, Durlauf S N, Lane D A (eds.) The economy as an evolving complex system II.
Addison-Wesley, Reading.
ATKINSON A B and Stiglitz J E (1969) A new view of technological change.
Economic Journal 79, 573-578.
BISCHI G I, Dawid H. and Kopel M (2003) Gaining the competitive edge using
internal and external spillovers: A dynamic analysis, Journal of Economic Dynamics
and Control 27, 2171-2193.
33
BLUME L E, Durlauf S N (2005) The economy as an evolving complex system III.
Oxford University Press, Oxford.
BLUME, L E, Durlauf S N (eds.) (2001) Social dynamics. MIT Press, Cambridge.
BOSCHMA R A (2005) Proximity and innovation: A critical assessment. Regional
Studies 39, 61-74.
COHEN W M, Levinthal D A (1989) Innovation and learning: The two faces of
R&D, Economic Journal 99, 569-596.
COHEN W M, Levinthal D A (1990), Absorptive capacity: A new perspective on
learning and innovation, Administrative Science Quarterly 35, 128-152.
COWAN R, Jonard N, Zimmermann J B (2007) Bilateral collaboration and the
emergence of networks. Management Science 53, 1051-1067
COWAN R, Jonard N, Zimmermann J B (2006), Evolving networks of inventors.
Journal of Evolutionary Economics 16, 155-174
CYERT R M, March J C (1963) A behavioral theory of the firm. Prentice-Hall Inc.,
New Jersey
D‟IGNAZIO A, Giovannetti E (2006) From exogenous to endogenous economic
networks: Internet applications. Journal of Economic Survey 20, 757–96.
DAVID P A (2007) Path dependence: A foundational concept for historical social
science. Cliometrica: Journal of Historical Economics and Econometric History 1,
91-114
DAVID P A and Keely L (2003) The endogenous formation of scientific research
coalitions. Economics of Innovation and New Technology 12, 93–116.
DAWID H (2006), Agent-based models of innovation and technological change, in
Tesfatsion K and Judd K (eds.), Handbook of Computational Economics, Volume 2:
Agent-Based Computational Economics, North-Holland, Amsterdam, pp. 1235-1272.
DURLAUF S N (2005) Complexity and empirical economics. Economic Journal
115, 225-243.
FLEMING L, Sorenson O (2001) Technology as a complex adaptive system:
Evidence from patent data. Research Policy 30, 1019-1039.
FOSTER J (2005) From simplistic to complex systems in economics. Cambridge
Journal of Economics 29, 873-892.
34
GAY C, Latham W, Le Bas C (2008) Collective knowledge, prolific inventors and
the value of inventions: An empirical study of French, German and British Patents in
the Us, 1975-1999. Economics of Innovation and New Technology 17, 5-22.
HARISON E (2008) Intellectual property rights in a knowledge-based economy: A
new frame-of-analysis. Economics of Innovation and New Technology 17, 377-400.
KRUGMAN P (1994) Complex landscapes in economic geography. American
Economic Review 84, 412-417.
LANE D A, Maxfield R (1997) Foresight complexity and strategy. in Arthur W B,
Durlauf S N, Lane D A (eds.), The economy as an evolving complex system II.
Westview Press, Santa Fe, pp.169-198.
LANE D A et al. (2009) Complexity perspectives in innovation and social change.
Springer, Berlin.
LEIBENSTEIN H (1976), Beyond economic man, Harvard University Press,
Cambridge.
LUNDVALL B A (1988) Innovation as an interactive process: From user-producer
interaction to the national system of innovation. in Dosi G et al. (eds.) Technical
change and economic theory. Frances Pinter, London, pp. 349-69.
MARCH J C (1988) Bounded rationality ambiguity and the engineering of choice, in
Bell D E, Raiffa H, Tversky A (eds.) Decision making: Descriptive normative, and
prescriptive. Cambridge University Press, Cambridge.
MARCH J C (1991) Exploration and exploitation in organizing learning.
Organization Science 2, 71-87.
MARCH J C, Simon H A (1958) Organizations, John Wiley and Sons, New York.
MILLER J H, Page S E (2007) Complex adaptive systems. Princeton University
Press, Princeton.
NELSON R R, Winter S G (1982) An evolutionary theory of economic change, The
Belknap Press of Harvard University Press, Cambridge,
OZMAN M (2009) Inter-firm networks and innovation: A survey of literature,
Economics of Innovation and New Technology 18, 39-67.
PAGE S E (2011) Diversity and complexity, Princeton University press, Princeton.
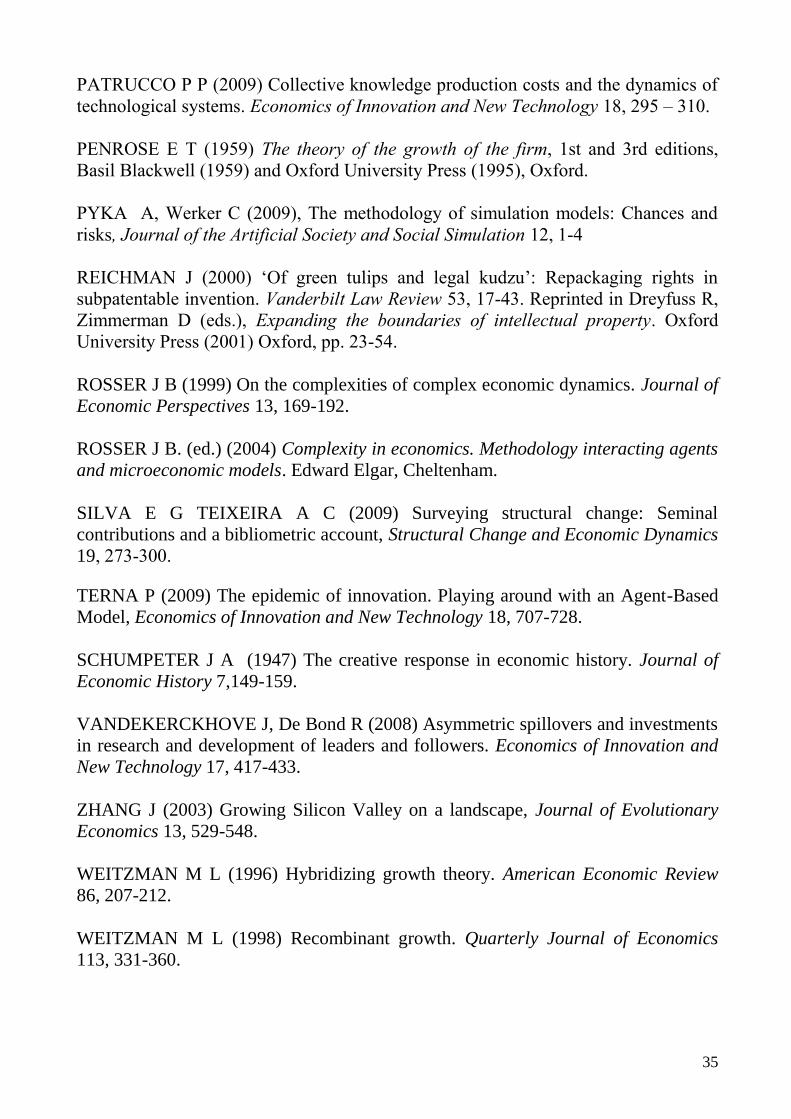
35
PATRUCCO P P (2009) Collective knowledge production costs and the dynamics of
technological systems. Economics of Innovation and New Technology 18, 295 – 310.
PENROSE E T (1959) The theory of the growth of the firm, 1st and 3rd editions,
Basil Blackwell (1959) and Oxford University Press (1995), Oxford.
PYKA A, Werker C (2009), The methodology of simulation models: Chances and
risks, Journal of the Artificial Society and Social Simulation 12, 1-4
REICHMAN J (2000) „Of green tulips and legal kudzu‟: Repackaging rights in
subpatentable invention. Vanderbilt Law Review 53, 17-43. Reprinted in Dreyfuss R,
Zimmerman D (eds.), Expanding the boundaries of intellectual property. Oxford
University Press (2001) Oxford, pp. 23-54.
ROSSER J B (1999) On the complexities of complex economic dynamics. Journal of
Economic Perspectives 13, 169-192.
ROSSER J B. (ed.) (2004) Complexity in economics. Methodology interacting agents
and microeconomic models. Edward Elgar, Cheltenham.
SILVA E G TEIXEIRA A C (2009) Surveying structural change: Seminal
contributions and a bibliometric account, Structural Change and Economic Dynamics
19, 273-300.
TERNA P (2009) The epidemic of innovation. Playing around with an Agent-Based
Model, Economics of Innovation and New Technology 18, 707-728.
SCHUMPETER J A (1947) The creative response in economic history. Journal of
Economic History 7,149-159.
VANDEKERCKHOVE J, De Bond R (2008) Asymmetric spillovers and investments
in research and development of leaders and followers. Economics of Innovation and
New Technology 17, 417-433.
ZHANG J (2003) Growing Silicon Valley on a landscape, Journal of Evolutionary
Economics 13, 529-548.
WEITZMAN M L (1996) Hybridizing growth theory. American Economic Review
86, 207-212.
WEITZMAN M L (1998) Recombinant growth. Quarterly Journal of Economics
113, 331-360.
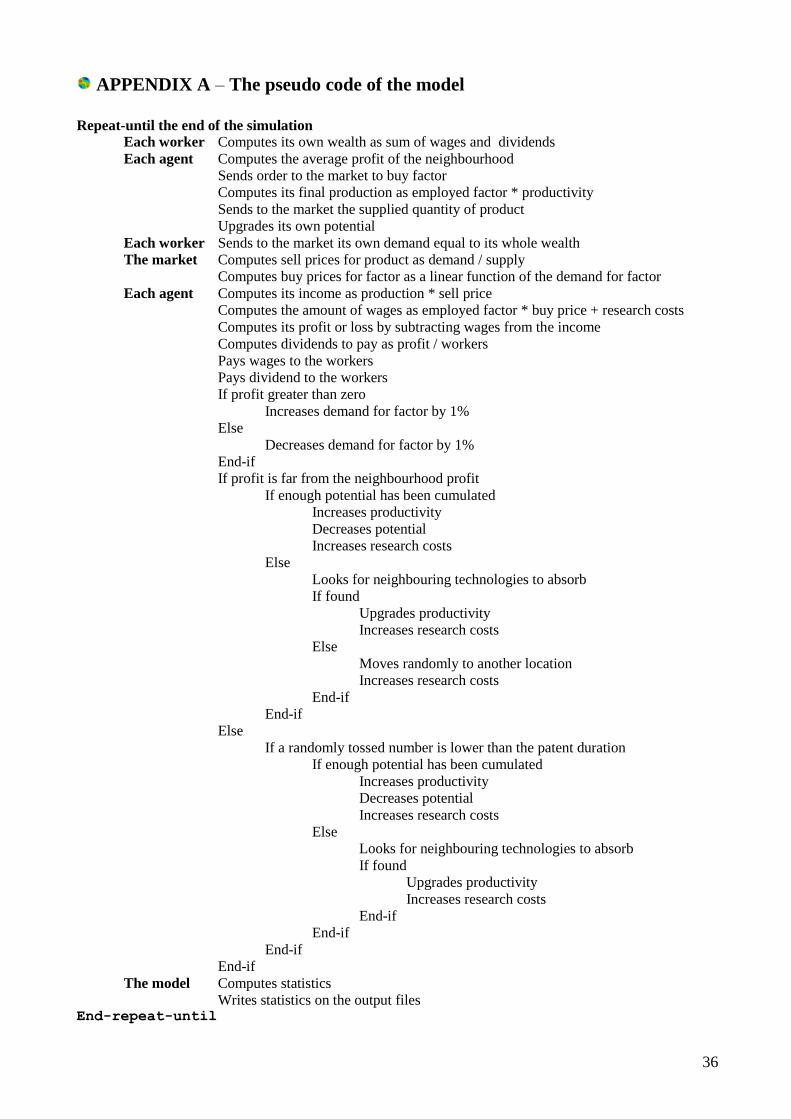
36
APPENDIX A – The pseudo code of the model
Repeat-until the end of the simulation
Each worker Computes its own wealth as sum of wages and dividends
Each agent Computes the average profit of the neighbourhood
Sends order to the market to buy factor
Computes its final production as employed factor * productivity
Sends to the market the supplied quantity of product
Upgrades its own potential
Each worker Sends to the market its own demand equal to its whole wealth
The market Computes sell prices for product as demand / supply
Computes buy prices for factor as a linear function of the demand for factor
Each agent Computes its income as production * sell price
Computes the amount of wages as employed factor * buy price + research costs
Computes its profit or loss by subtracting wages from the income
Computes dividends to pay as profit / workers
Pays wages to the workers
Pays dividend to the workers
If profit greater than zero
Increases demand for factor by 1%
Else
Decreases demand for factor by 1%
End-if
If profit is far from the neighbourhood profit
If enough potential has been cumulated
Increases productivity
Decreases potential
Increases research costs
Else
Looks for neighbouring technologies to absorb
If found
Upgrades productivity
Increases research costs
Else
Moves randomly to another location
Increases research costs
End-if
End-if
Else
If a randomly tossed number is lower than the patent duration
If enough potential has been cumulated
Increases productivity
Decreases potential
Increases research costs
Else
Looks for neighbouring technologies to absorb
If found
Upgrades productivity
Increases research costs
End-if
End-if
End-if
End-if
The model Computes statistics
Writes statistics on the output files End-repeat-until
37
APPENDIX B – Flow diagrams describing the model processes
Figure 15: Process performed by the simulation scheduler
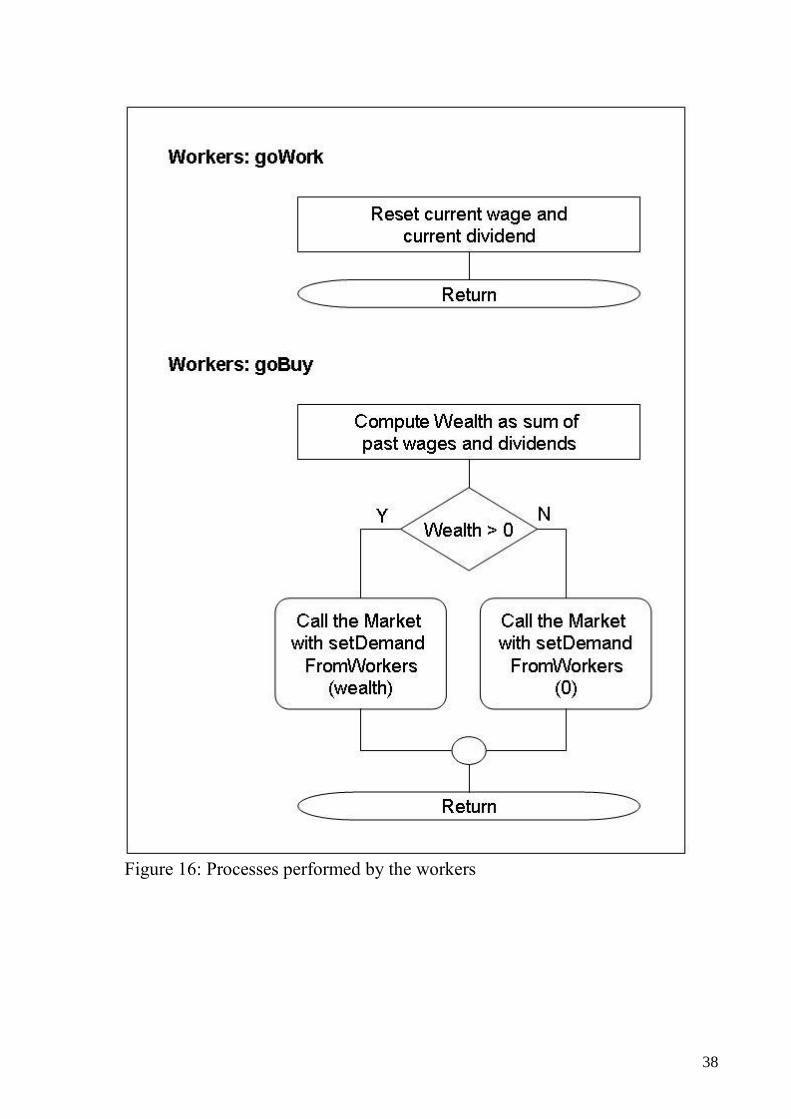
38
Figure 16: Processes performed by the workers
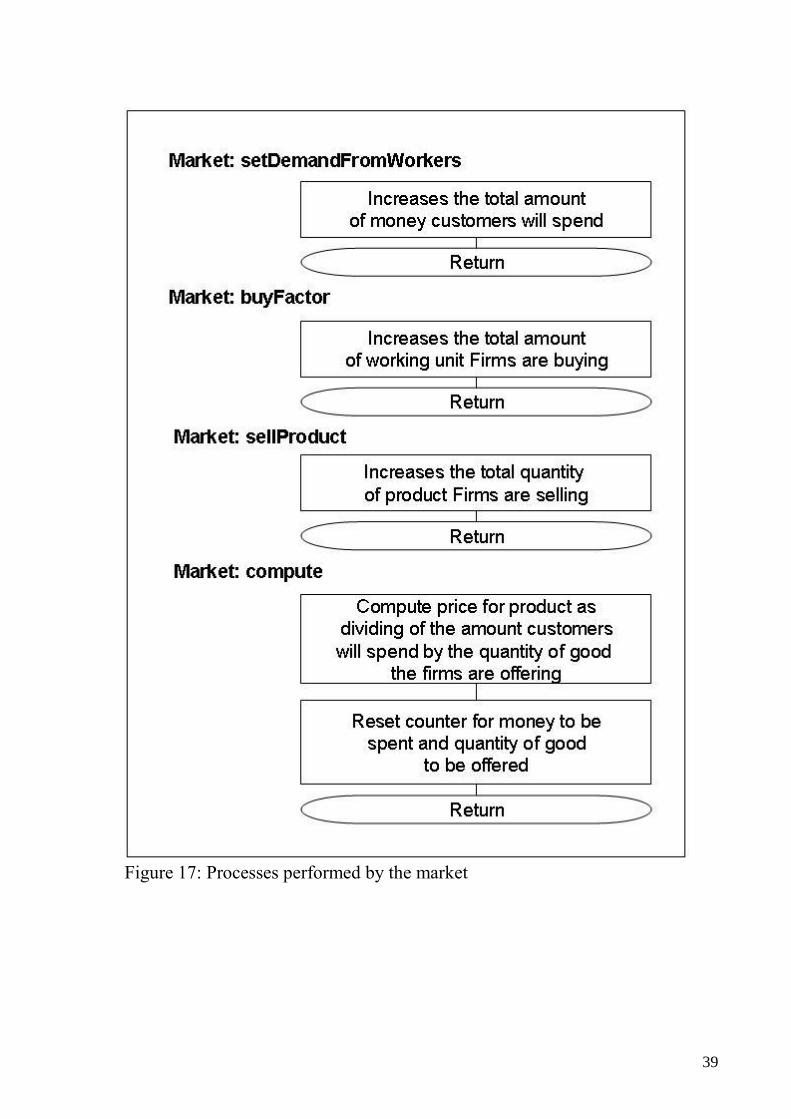
39
Figure 17: Processes performed by the market
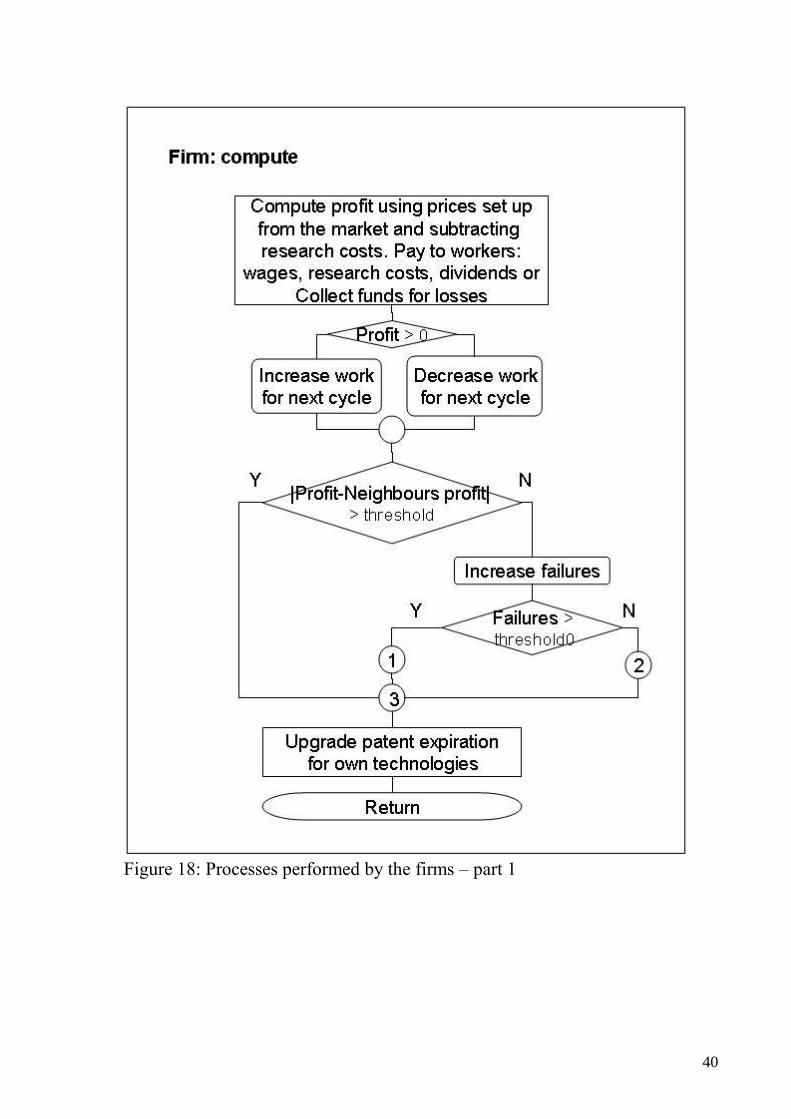
40
Figure 18: Processes performed by the firms – part 1
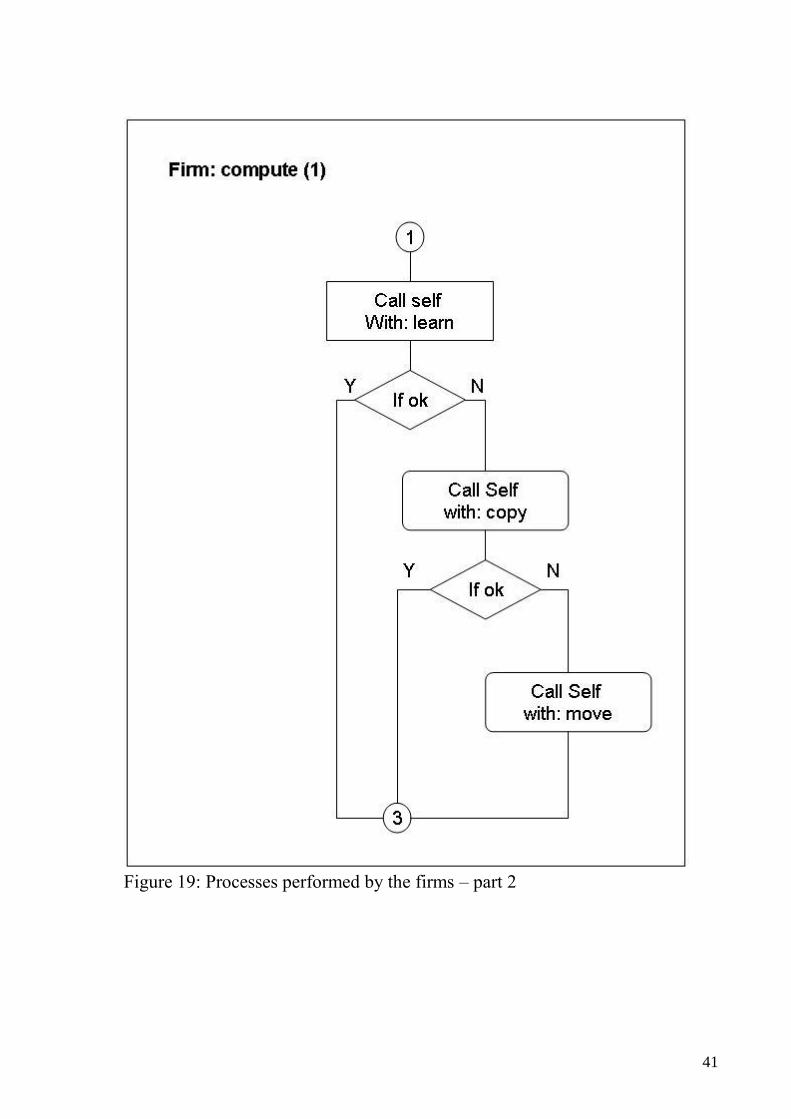
41
Figure 19: Processes performed by the firms – part 2
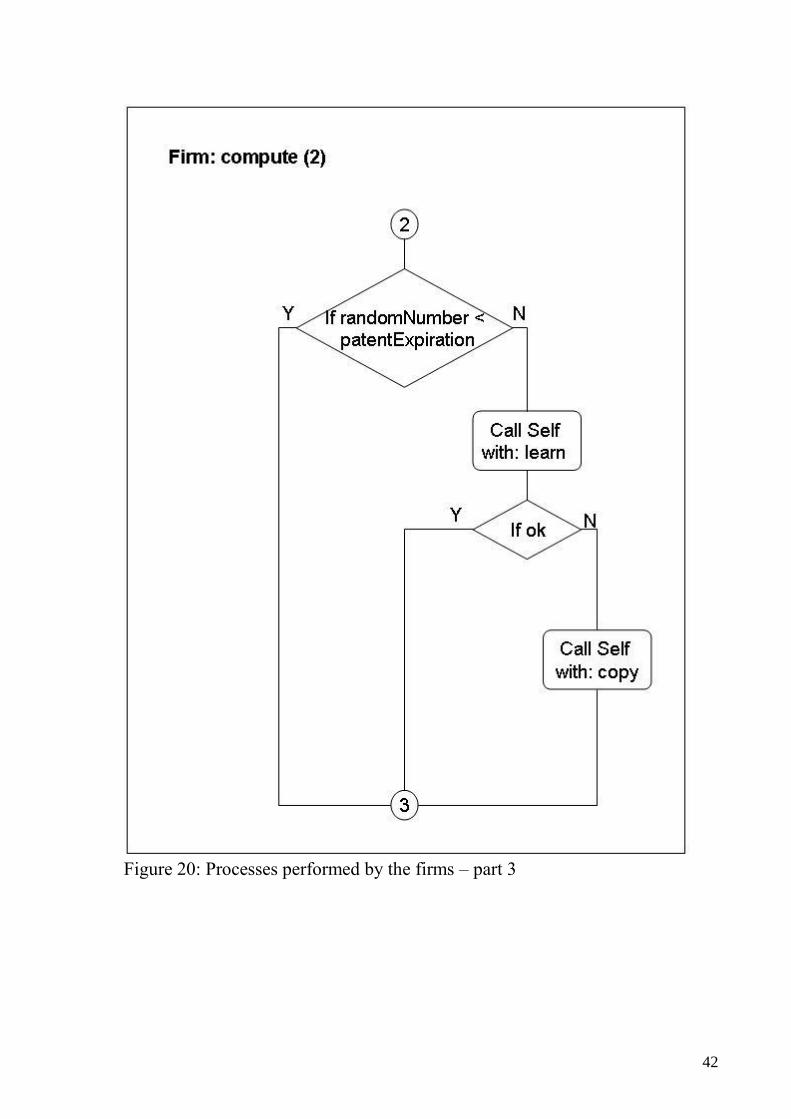
42
Figure 20: Processes performed by the firms – part 3
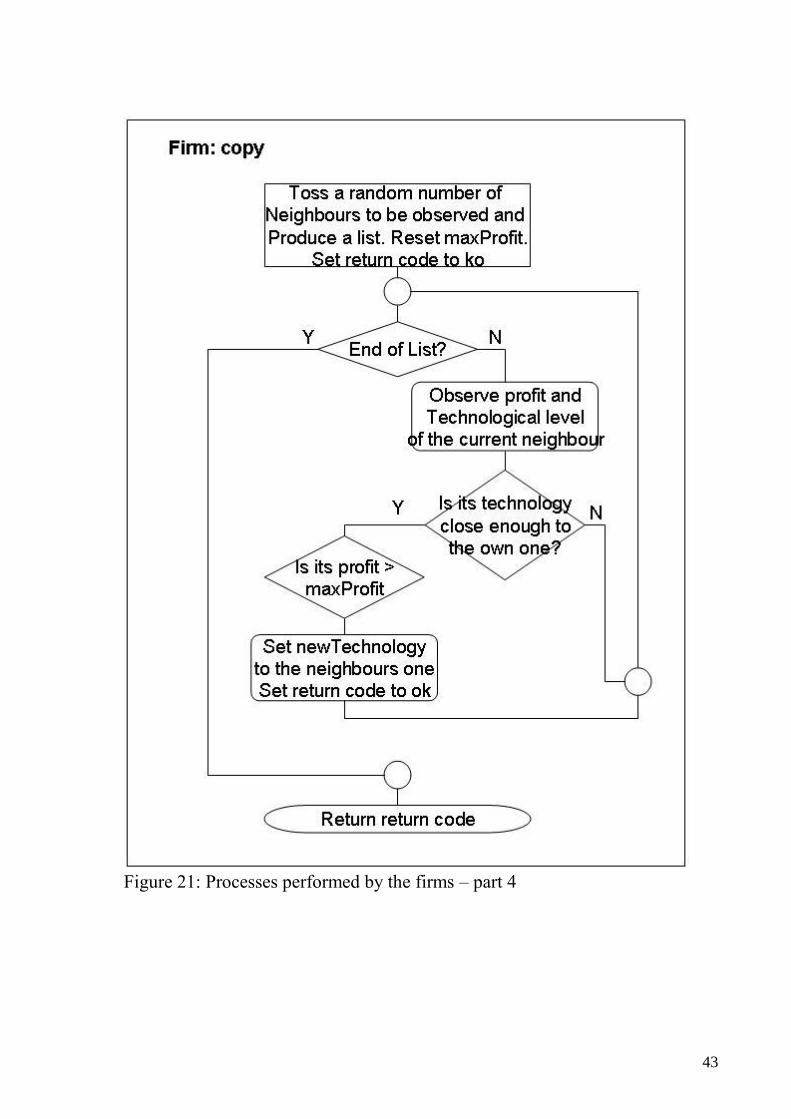
43
Figure 21: Processes performed by the firms – part 4
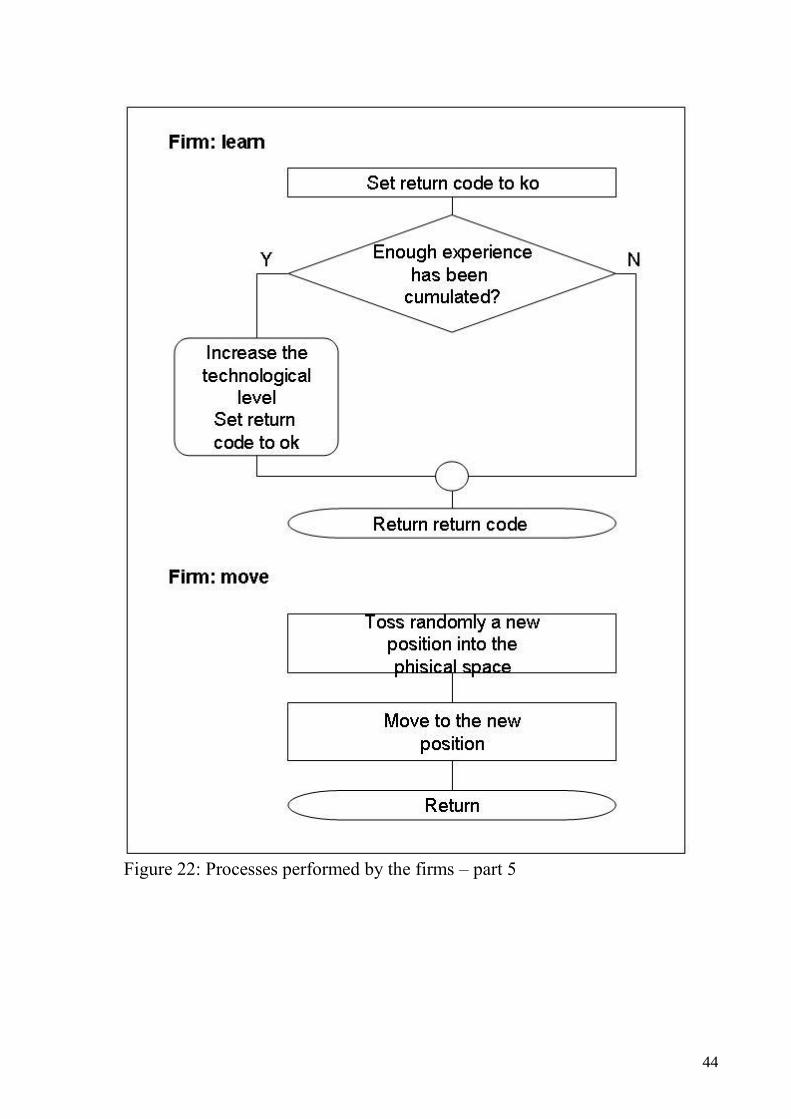
44
Figure 22: Processes performed by the firms – part 5
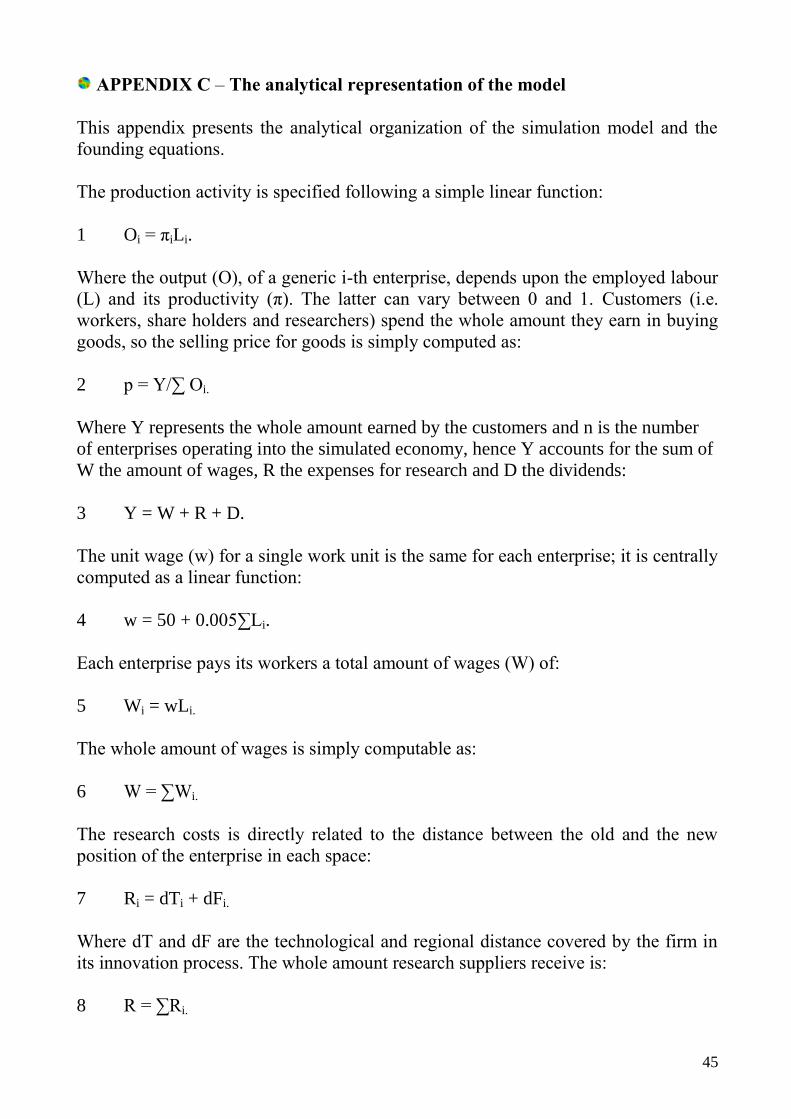
45
APPENDIX C – The analytical representation of the model
This appendix presents the analytical organization of the simulation model and the
founding equations.
The production activity is specified following a simple linear function:
1 Oi = πiLi.
Where the output (O), of a generic i-th enterprise, depends upon the employed labour
(L) and its productivity (π). The latter can vary between 0 and 1. Customers (i.e.
workers, share holders and researchers) spend the whole amount they earn in buying
goods, so the selling price for goods is simply computed as:
2 p = Y/∑ Oi.
Where Y represents the whole amount earned by the customers and n is the number
of enterprises operating into the simulated economy, hence Y accounts for the sum of
W the amount of wages, R the expenses for research and D the dividends:
3 Y = W + R + D.
The unit wage (w) for a single work unit is the same for each enterprise; it is centrally
computed as a linear function:
4 w = 50 + 0.005∑Li.
Each enterprise pays its workers a total amount of wages (W) of:
5 Wi = wLi.
The whole amount of wages is simply computable as:
6 W = ∑Wi.
The research costs is directly related to the distance between the old and the new
position of the enterprise in each space:
7 Ri = dTi + dFi.
Where dT and dF are the technological and regional distance covered by the firm in
its innovation process. The whole amount research suppliers receive is:
8 R = ∑Ri.
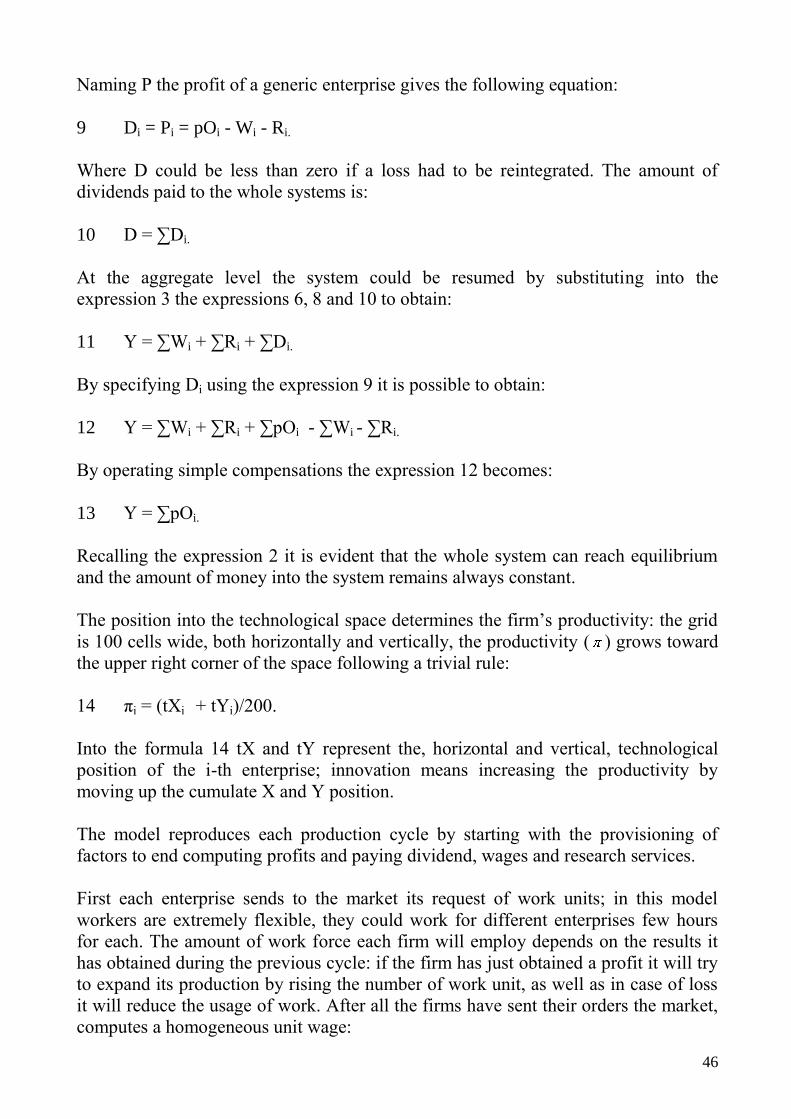
46
Naming P the profit of a generic enterprise gives the following equation:
9 Di = Pi = pOi - Wi - Ri.
Where D could be less than zero if a loss had to be reintegrated. The amount of
dividends paid to the whole systems is:
10 D = ∑Di.
At the aggregate level the system could be resumed by substituting into the
expression 3 the expressions 6, 8 and 10 to obtain:
11 Y = ∑Wi + ∑Ri + ∑Di.
By specifying Di using the expression 9 it is possible to obtain:
12 Y = ∑Wi + ∑Ri + ∑pOi - ∑Wi - ∑Ri.
By operating simple compensations the expression 12 becomes:
13 Y = ∑pOi.
Recalling the expression 2 it is evident that the whole system can reach equilibrium
and the amount of money into the system remains always constant.
The position into the technological space determines the firm‟s productivity: the grid
is 100 cells wide, both horizontally and vertically, the productivity ( ) grows toward
the upper right corner of the space following a trivial rule:
14 πi = (tXi + tYi)/200.
Into the formula 14 tX and tY represent the, horizontal and vertical, technological
position of the i-th enterprise; innovation means increasing the productivity by
moving up the cumulate X and Y position.
The model reproduces each production cycle by starting with the provisioning of
factors to end computing profits and paying dividend, wages and research services.
First each enterprise sends to the market its request of work units; in this model
workers are extremely flexible, they could work for different enterprises few hours
for each. The amount of work force each firm will employ depends on the results it
has obtained during the previous cycle: if the firm has just obtained a profit it will try
to expand its production by rising the number of work unit, as well as in case of loss
it will reduce the usage of work. After all the firms have sent their orders the market,
computes a homogeneous unit wage:
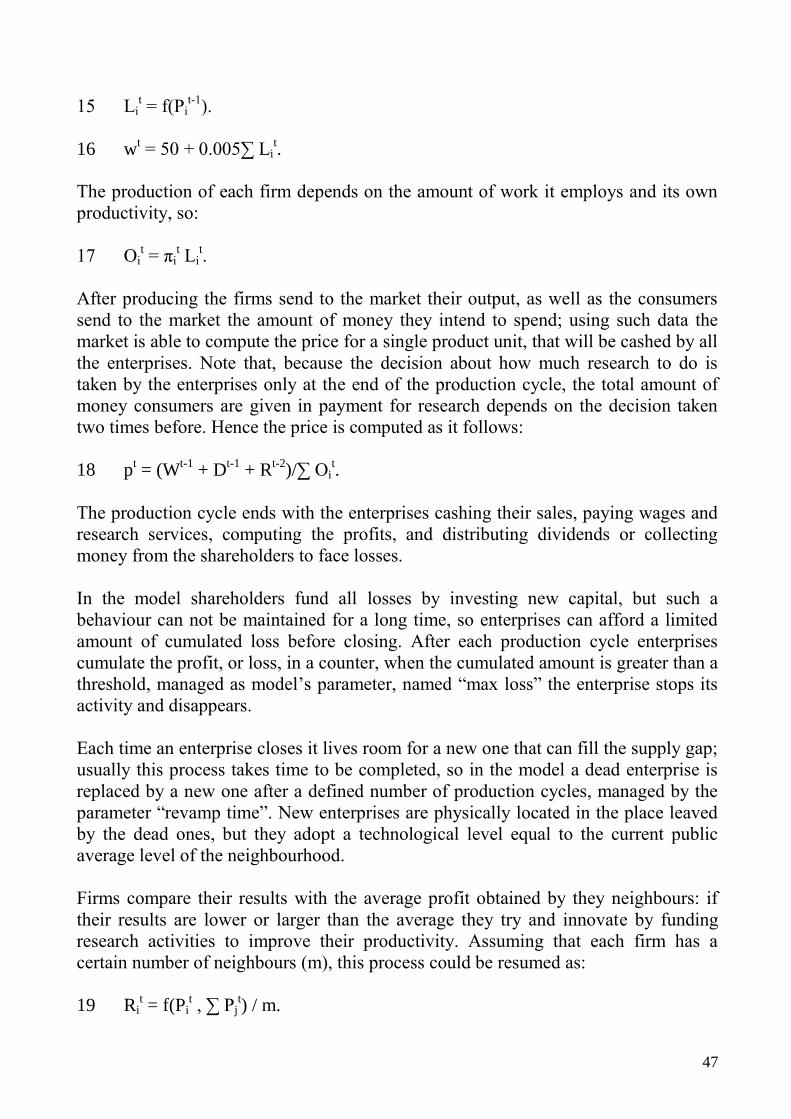
47
15 Lit = f(Pi
t-1).
16 wt = 50 + 0.005∑ Li
t.
The production of each firm depends on the amount of work it employs and its own
productivity, so:
17 Oit = πi
t Li
t.
After producing the firms send to the market their output, as well as the consumers
send to the market the amount of money they intend to spend; using such data the
market is able to compute the price for a single product unit, that will be cashed by all
the enterprises. Note that, because the decision about how much research to do is
taken by the enterprises only at the end of the production cycle, the total amount of
money consumers are given in payment for research depends on the decision taken
two times before. Hence the price is computed as it follows:
18 pt = (W
t-1 + D
t-1 + R
t-2)/∑ Oi
t.
The production cycle ends with the enterprises cashing their sales, paying wages and
research services, computing the profits, and distributing dividends or collecting
money from the shareholders to face losses.
In the model shareholders fund all losses by investing new capital, but such a
behaviour can not be maintained for a long time, so enterprises can afford a limited
amount of cumulated loss before closing. After each production cycle enterprises
cumulate the profit, or loss, in a counter, when the cumulated amount is greater than a
threshold, managed as model‟s parameter, named “max loss” the enterprise stops its
activity and disappears.
Each time an enterprise closes it lives room for a new one that can fill the supply gap;
usually this process takes time to be completed, so in the model a dead enterprise is
replaced by a new one after a defined number of production cycles, managed by the
parameter “revamp time”. New enterprises are physically located in the place leaved
by the dead ones, but they adopt a technological level equal to the current public
average level of the neighbourhood.
Firms compare their results with the average profit obtained by they neighbours: if
their results are lower or larger than the average they try and innovate by funding
research activities to improve their productivity. Assuming that each firm has a
certain number of neighbours (m), this process could be resumed as:
19 Rit = f(Pi
t , ∑ Pj
t) / m.
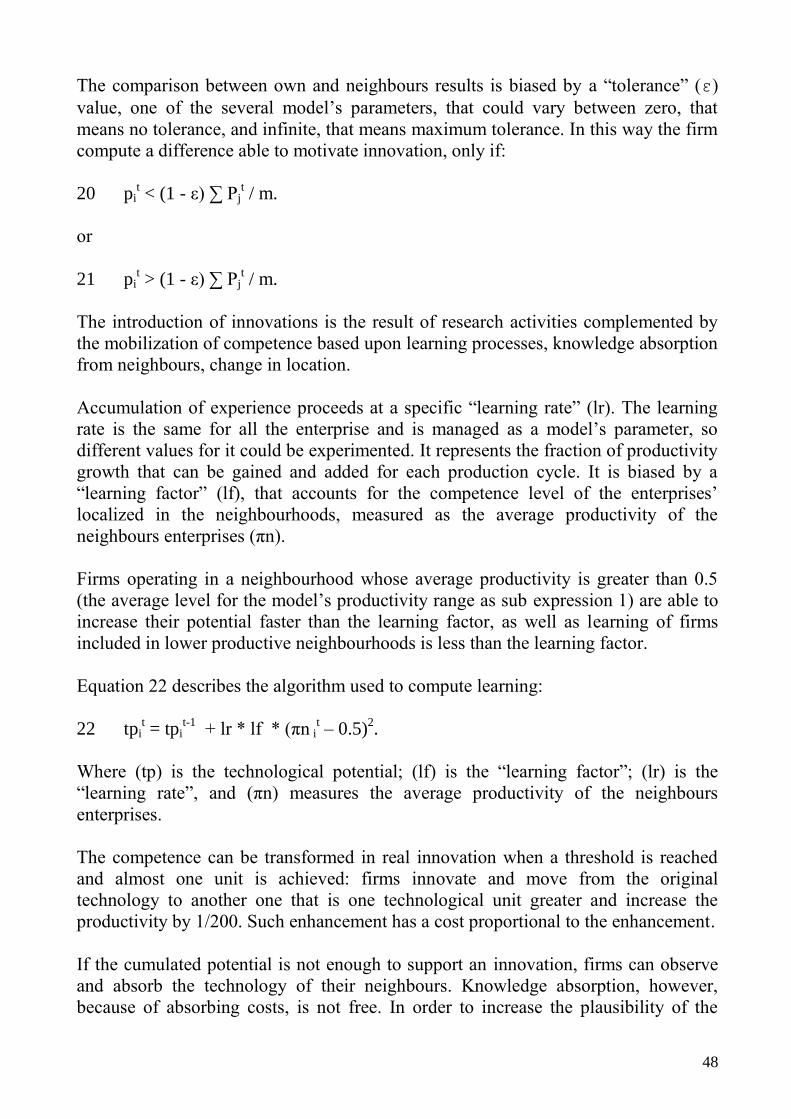
48
The comparison between own and neighbours results is biased by a “tolerance” (ε)
value, one of the several model‟s parameters, that could vary between zero, that
means no tolerance, and infinite, that means maximum tolerance. In this way the firm
compute a difference able to motivate innovation, only if:
20 pit < (1 - ε) ∑ Pj
t / m.
or
21 pit > (1 - ε) ∑ Pj
t / m.
The introduction of innovations is the result of research activities complemented by
the mobilization of competence based upon learning processes, knowledge absorption
from neighbours, change in location.
Accumulation of experience proceeds at a specific “learning rate” (lr). The learning
rate is the same for all the enterprise and is managed as a model‟s parameter, so
different values for it could be experimented. It represents the fraction of productivity
growth that can be gained and added for each production cycle. It is biased by a
“learning factor” (lf), that accounts for the competence level of the enterprises‟
localized in the neighbourhoods, measured as the average productivity of the
neighbours enterprises (πn).
Firms operating in a neighbourhood whose average productivity is greater than 0.5
(the average level for the model‟s productivity range as sub expression 1) are able to
increase their potential faster than the learning factor, as well as learning of firms
included in lower productive neighbourhoods is less than the learning factor.
Equation 22 describes the algorithm used to compute learning:
22 tpit = tpi
t-1 + lr * lf * (πn i
t – 0.5)
2.
Where (tp) is the technological potential; (lf) is the “learning factor”; (lr) is the
“learning rate”, and (πn) measures the average productivity of the neighbours
enterprises.
The competence can be transformed in real innovation when a threshold is reached
and almost one unit is achieved: firms innovate and move from the original
technology to another one that is one technological unit greater and increase the
productivity by 1/200. Such enhancement has a cost proportional to the enhancement.
If the cumulated potential is not enough to support an innovation, firms can observe
and absorb the technology of their neighbours. Knowledge absorption, however,
because of absorbing costs, is not free. In order to increase the plausibility of the
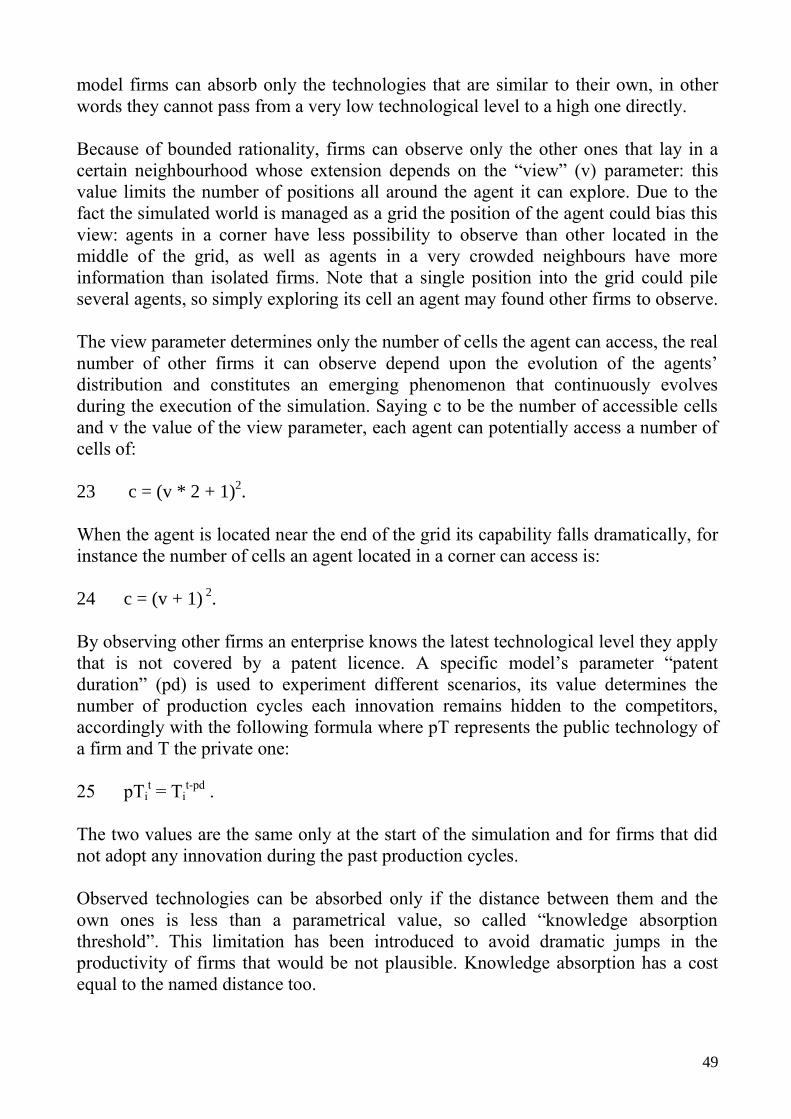
49
model firms can absorb only the technologies that are similar to their own, in other
words they cannot pass from a very low technological level to a high one directly.
Because of bounded rationality, firms can observe only the other ones that lay in a
certain neighbourhood whose extension depends on the “view” (v) parameter: this
value limits the number of positions all around the agent it can explore. Due to the
fact the simulated world is managed as a grid the position of the agent could bias this
view: agents in a corner have less possibility to observe than other located in the
middle of the grid, as well as agents in a very crowded neighbours have more
information than isolated firms. Note that a single position into the grid could pile
several agents, so simply exploring its cell an agent may found other firms to observe.
The view parameter determines only the number of cells the agent can access, the real
number of other firms it can observe depend upon the evolution of the agents‟
distribution and constitutes an emerging phenomenon that continuously evolves
during the execution of the simulation. Saying c to be the number of accessible cells
and v the value of the view parameter, each agent can potentially access a number of
cells of:
23 c = (v * 2 + 1)2.
When the agent is located near the end of the grid its capability falls dramatically, for
instance the number of cells an agent located in a corner can access is:
24 c = (v + 1) 2.
By observing other firms an enterprise knows the latest technological level they apply
that is not covered by a patent licence. A specific model‟s parameter “patent
duration” (pd) is used to experiment different scenarios, its value determines the
number of production cycles each innovation remains hidden to the competitors,
accordingly with the following formula where pT represents the public technology of
a firm and T the private one:
25 pTit = Ti
t-pd .
The two values are the same only at the start of the simulation and for firms that did
not adopt any innovation during the past production cycles.
Observed technologies can be absorbed only if the distance between them and the
own ones is less than a parametrical value, so called “knowledge absorption
threshold”. This limitation has been introduced to avoid dramatic jumps in the
productivity of firms that would be not plausible. Knowledge absorption has a cost
equal to the named distance too.
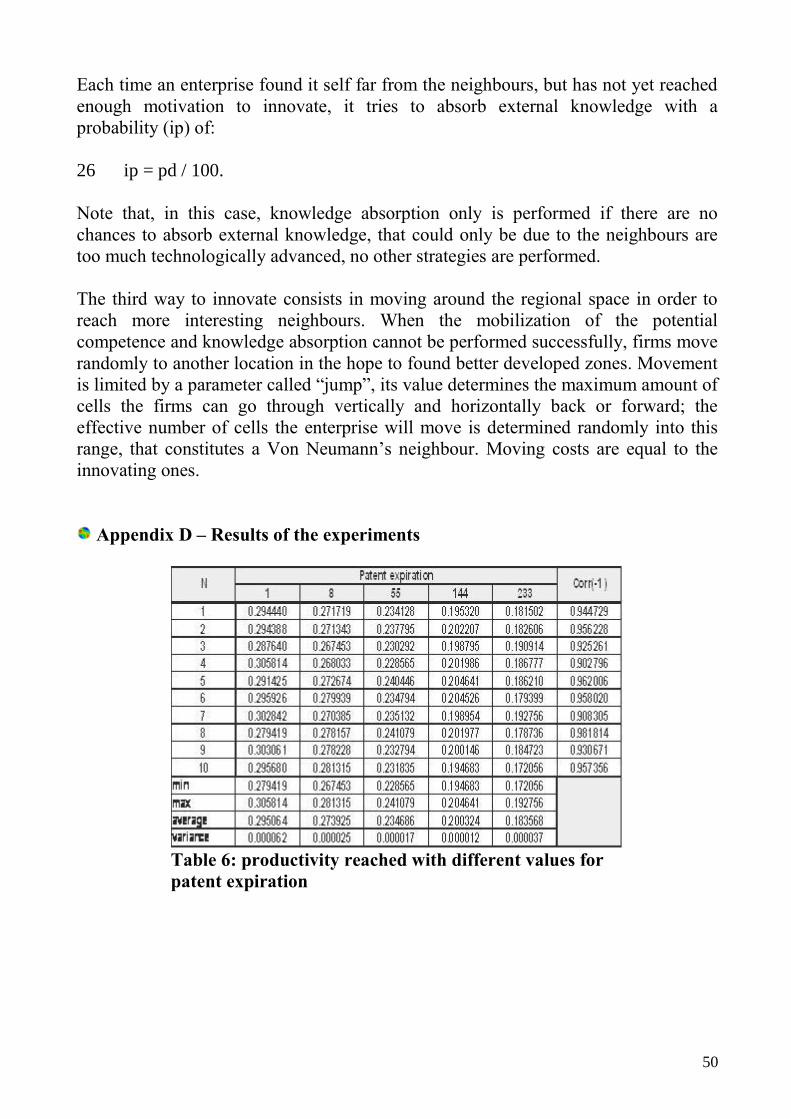
50
Each time an enterprise found it self far from the neighbours, but has not yet reached
enough motivation to innovate, it tries to absorb external knowledge with a
probability (ip) of:
26 ip = pd / 100.
Note that, in this case, knowledge absorption only is performed if there are no
chances to absorb external knowledge, that could only be due to the neighbours are
too much technologically advanced, no other strategies are performed.
The third way to innovate consists in moving around the regional space in order to
reach more interesting neighbours. When the mobilization of the potential
competence and knowledge absorption cannot be performed successfully, firms move
randomly to another location in the hope to found better developed zones. Movement
is limited by a parameter called “jump”, its value determines the maximum amount of
cells the firms can go through vertically and horizontally back or forward; the
effective number of cells the enterprise will move is determined randomly into this
range, that constitutes a Von Neumann‟s neighbour. Moving costs are equal to the
innovating ones.
Appendix D – Results of the experiments
Table 6: productivity reached with different values for
patent expiration
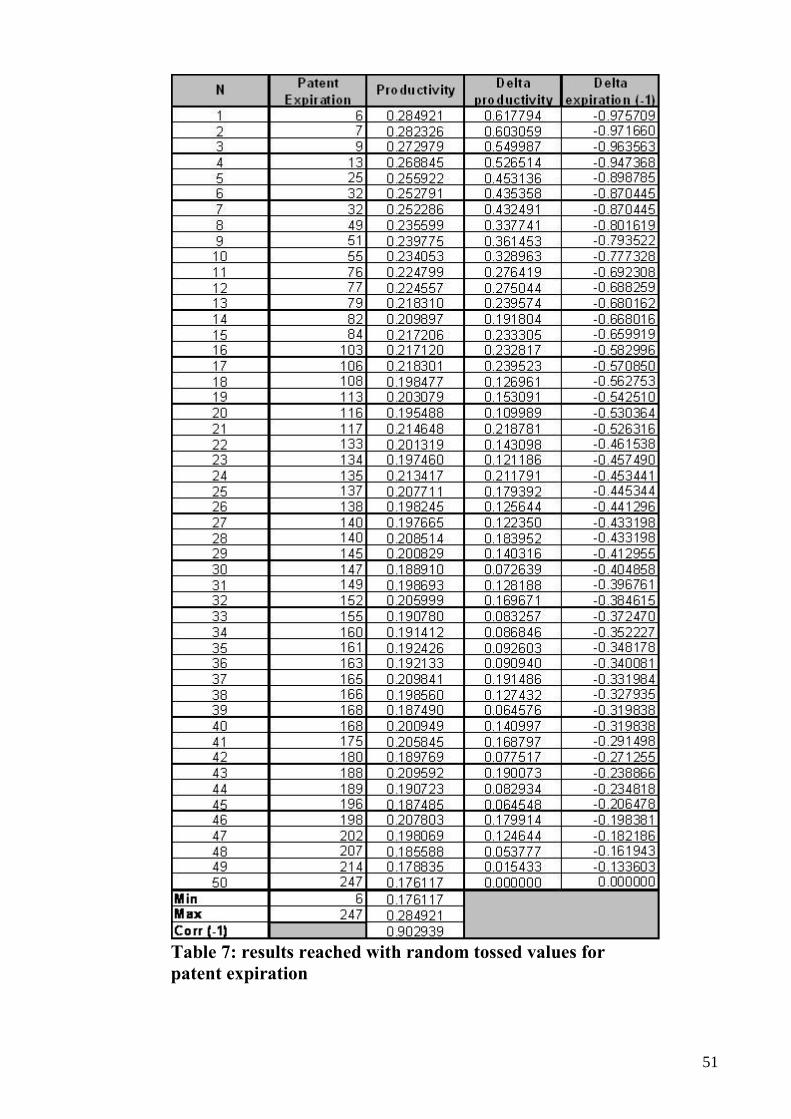
51
Table 7: results reached with random tossed values for
patent expiration

52
Table 8: results of the experiment optimum 4
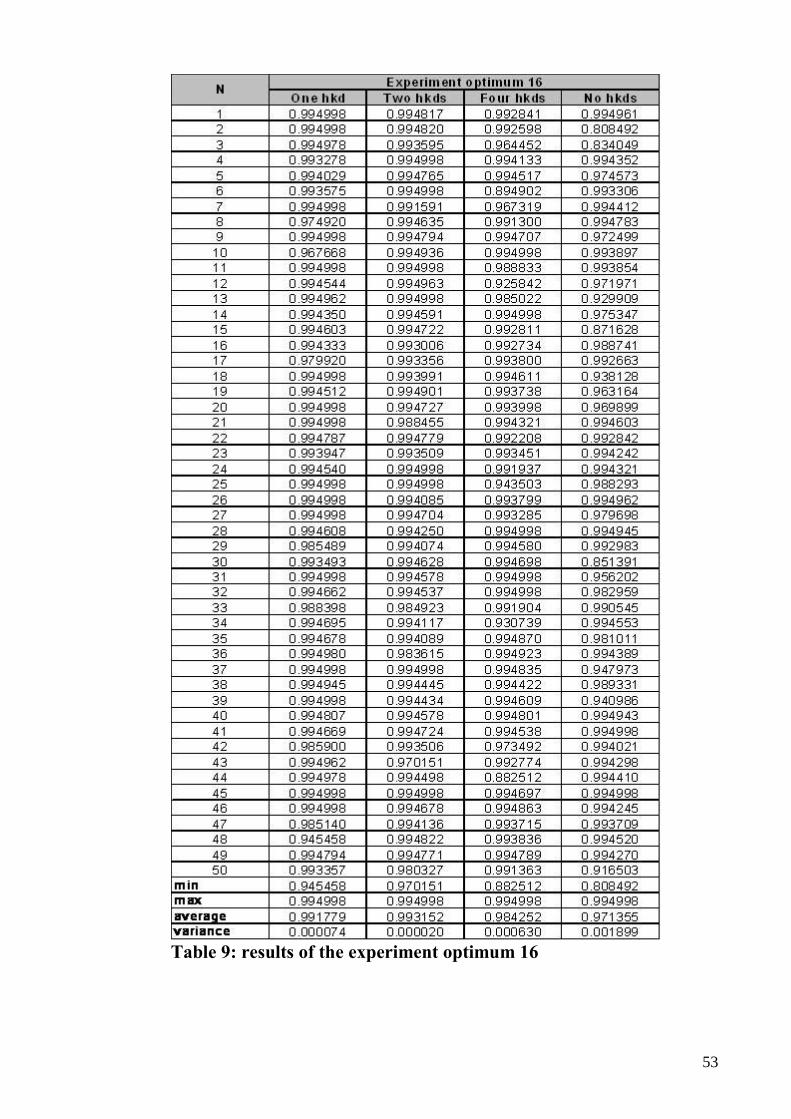
53
Table 9: results of the experiment optimum 16
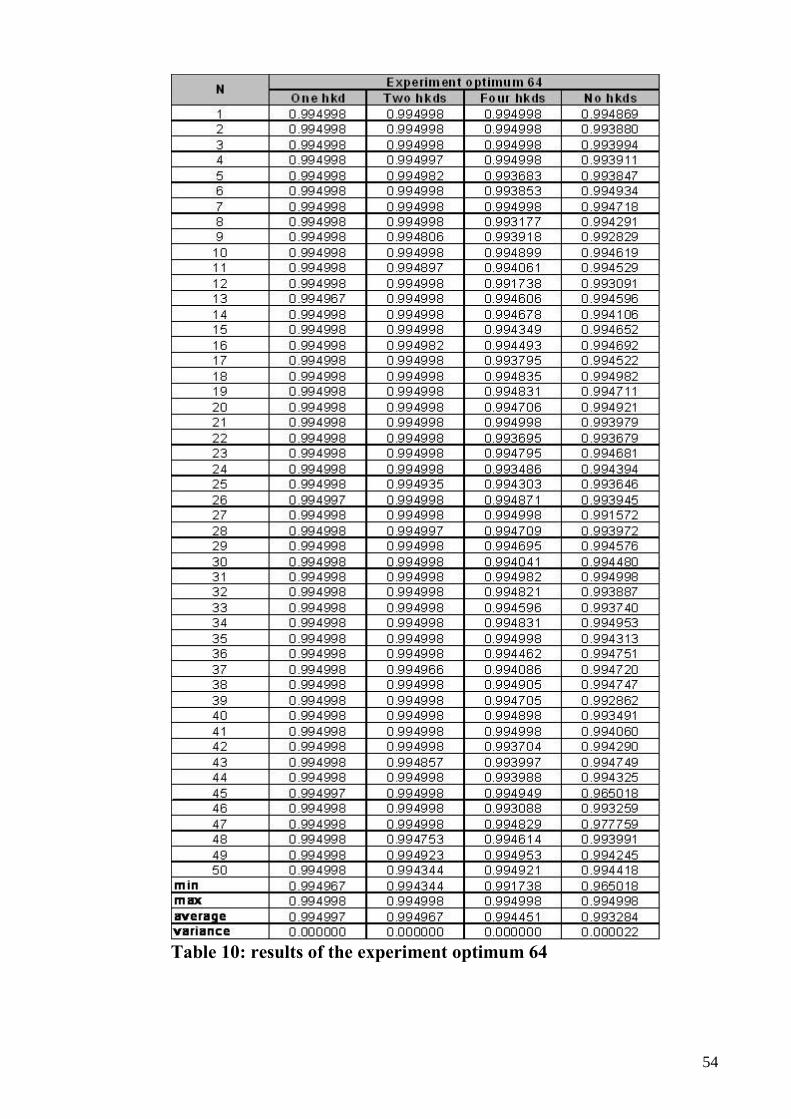
54
Table 10: results of the experiment optimum 64
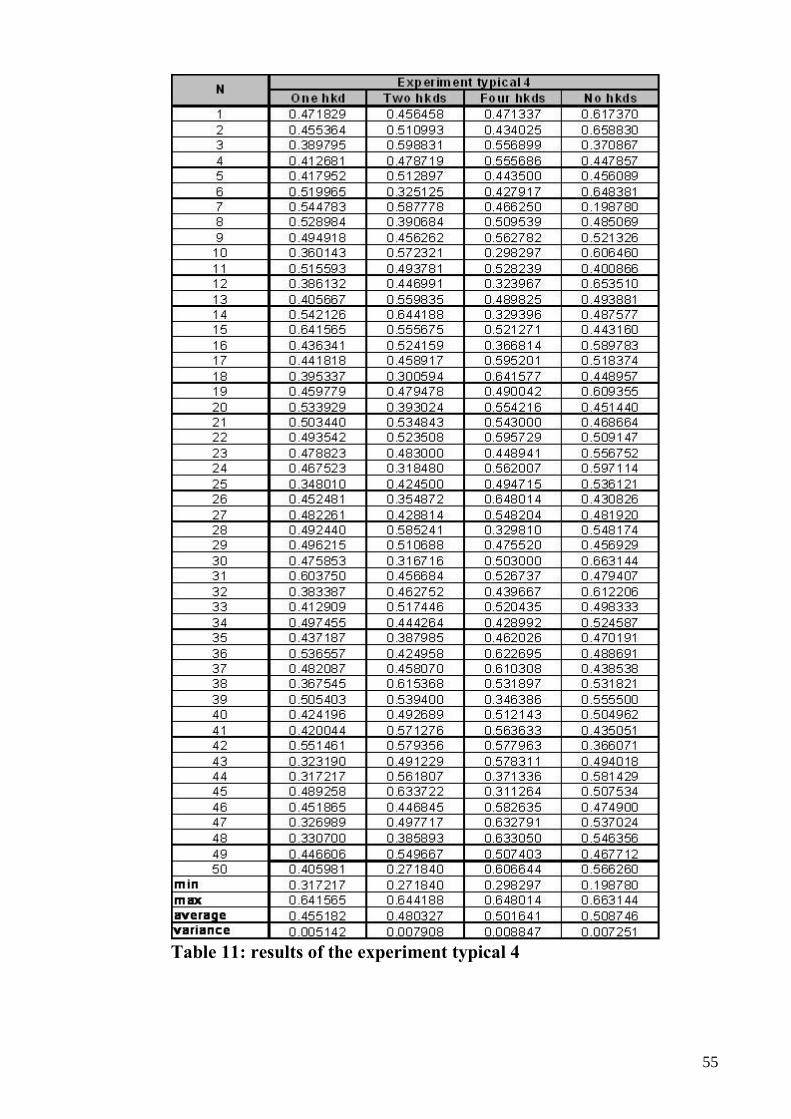
55
Table 11: results of the experiment typical 4
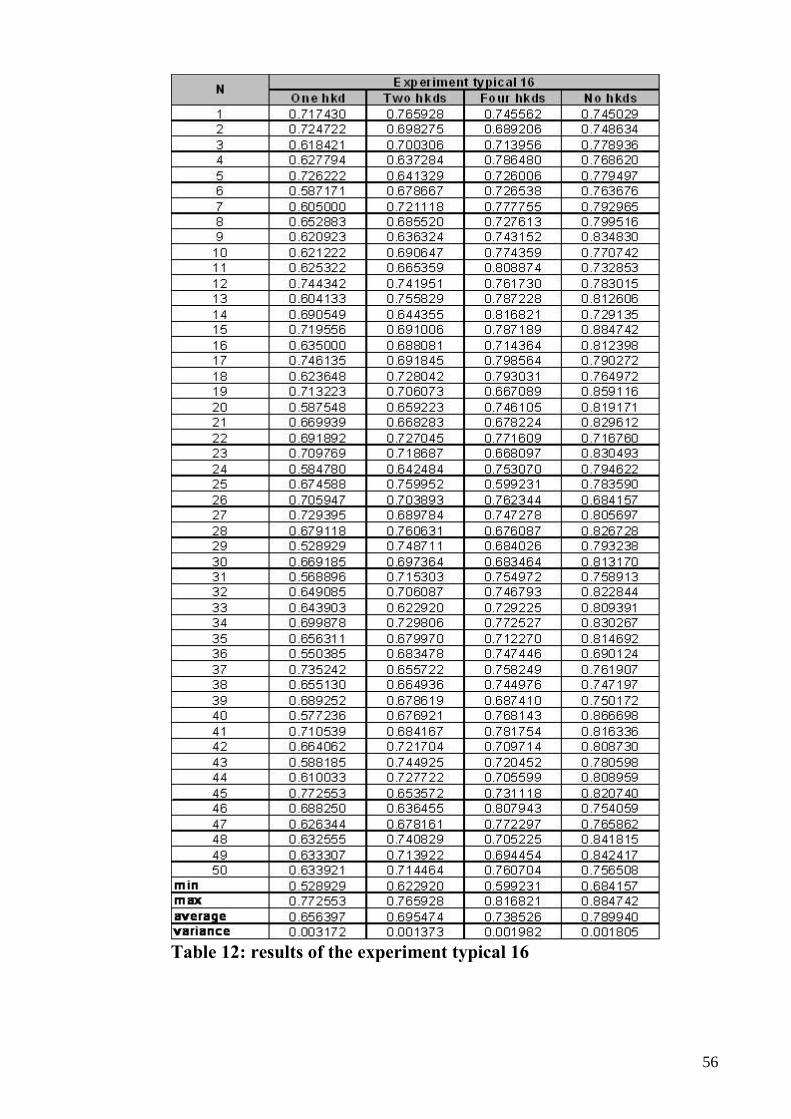
56
Table 12: results of the experiment typical 16
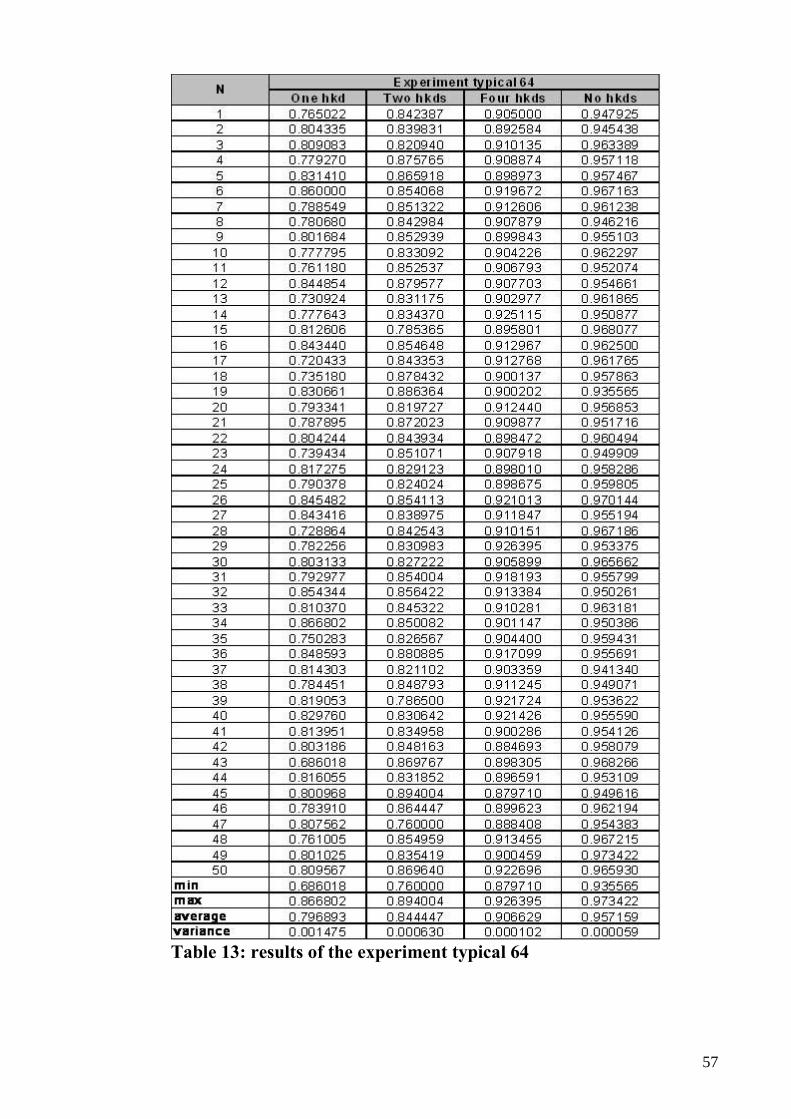
57
Table 13: results of the experiment typical 64

58
Table 14: results of the experiment mixed 4

59
Table 15: results of the experiment mixed 16

60
Table 16: results of the experiment mixed 64
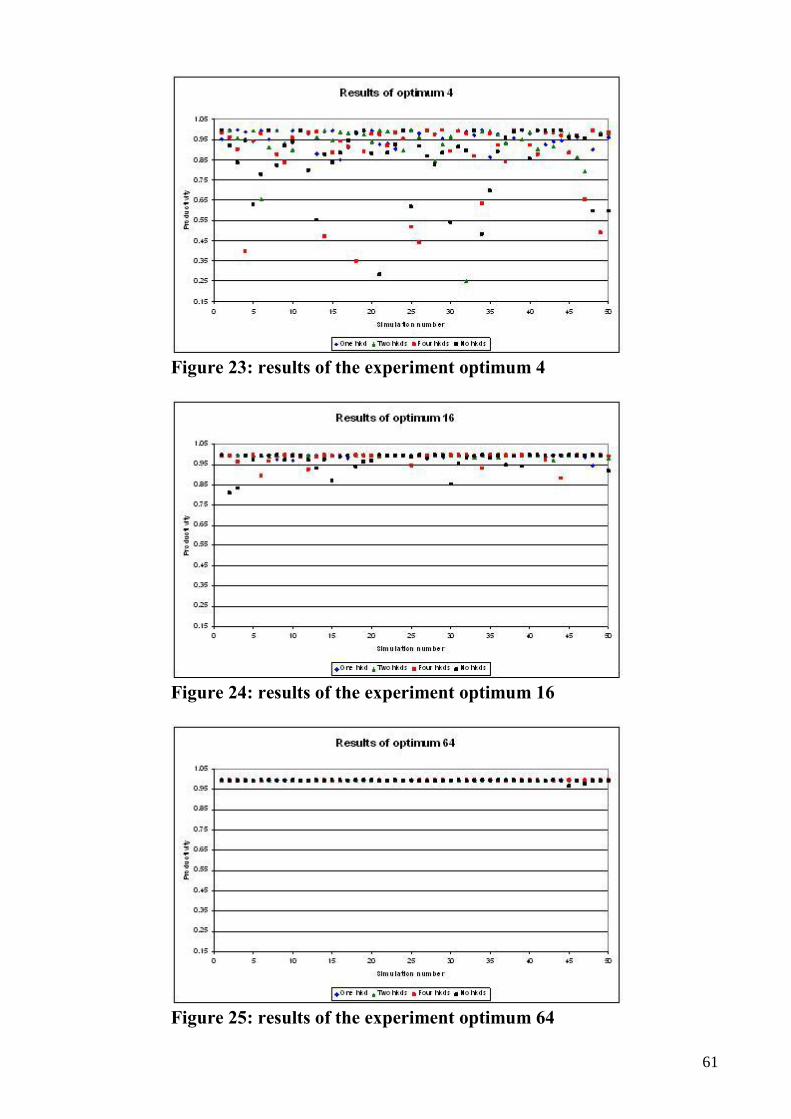
61
Figure 23: results of the experiment optimum 4
Figure 24: results of the experiment optimum 16
Figure 25: results of the experiment optimum 64
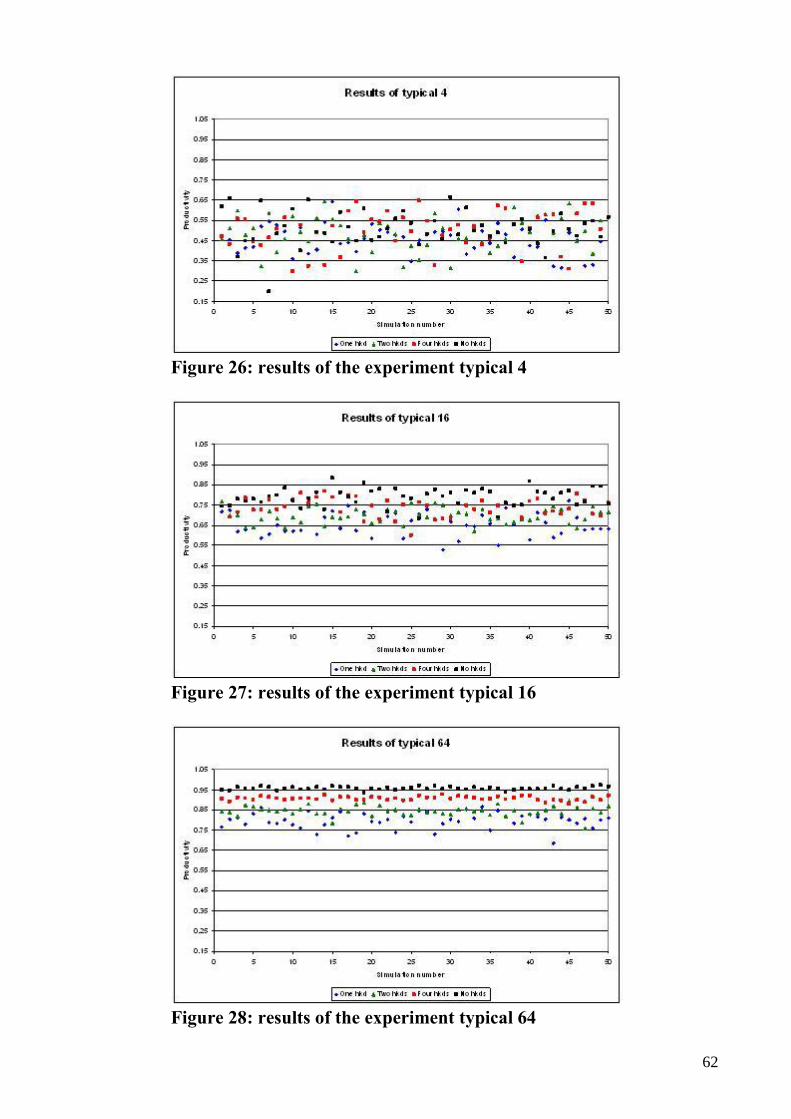
62
Figure 26: results of the experiment typical 4
Figure 27: results of the experiment typical 16
Figure 28: results of the experiment typical 64
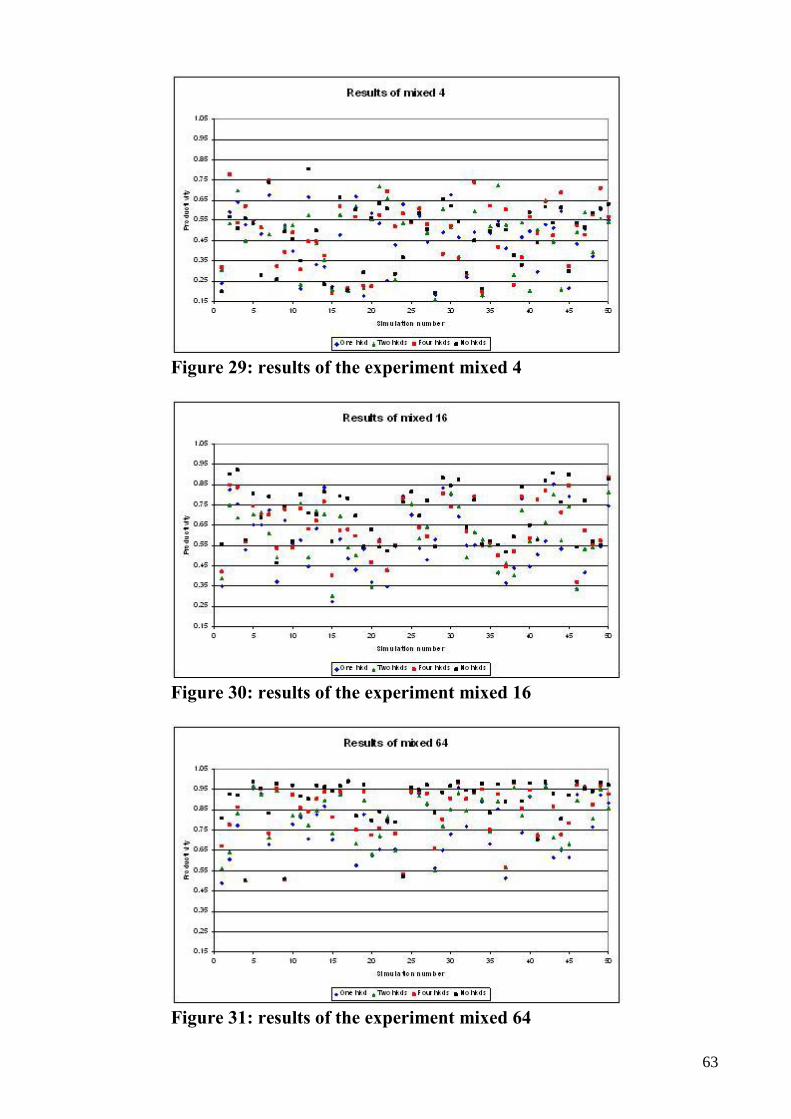
63
Figure 29: results of the experiment mixed 4
Figure 30: results of the experiment mixed 16
Figure 31: results of the experiment mixed 64