based sustainable management of tanguar haor: 2nd phase ministry of environment and forests,...
TRANSCRIPT

Community Based Sustainable Management of Tanguar Haor: 2nd Phase
Ministry of Environment and Forest, Government of Bangladesh
Operational Report
01 May - 31 October, 2010
November 2010 Bangladesh Country Office

Community Based Sustainable Management of Tanguar Haor: 2nd Phase
Ministry of Environment and Forests, Government of Bangladesh
Operational Report
01 May - 31 October, 2010
With Financial Assistance from:
Prepared and submitted by:
IUCN (International Union for Conservation of Nature)
Bangladesh Country Office House 11, Road 138, Gulshan-1
Dhaka 1212.
Phone: +8802 9890423, 9890395; ext-115 Fax: +8802 9892854
Web: www.iucn.org/bangladesh
In Cooperation & Association with
List of Acronyms AIGs Alternative Income Generation
BELA Bangladesh Environmental Lawyers Association
CCC Central Co-management Committee, previously named as Central Adhoc Committee
(CAC)
CNRS Centre for Natural Resource Studies - A local partner NGO of Bangladesh
CR Country Representative, IUCN-B
ECA Ecologically Critical Area
ERA Efforts for Rural Advancement – A local Partner NGO in Bangladesh
GoB Government of Bangladesh
HHs Households
IC Intercooperation - a technical partner organization
IGA(s) Inocme Generating Activity (ies)
IUCN-B International Union for Conservation of Nature, Bangladesh Country Office
MoEF Ministry of Environment and Forests
NCSIP-1 National Conservation Strategy Implementation Project Phase-1
OTR On Time Realisation Rate
PNGO Partner Non Governmental Organization
PRMP Participatory Resource Management Planning
PSMU Programme Support and Management Unit
SCM Social Capital Management
SDC Swiss Agency for Development and Cooperation
TH Tanguar Haor
THMC Tanguar Haor Management Committee
UCC Union Co-management Committee (s), previously named as Union Adhoc Committee
(UAC)
UP Union Parishad
Upazilla Literally, ‘sub-district’, unit of administration below the district level
VCC(s) Village Co-Management Committee(s)

Table of Content List of Acronyms .............................................................................................................. 2
List of Acronyms ............................................................................................................... 3
Table of Content ............................................................................................................... 4
Executive Summary .......................................................................................................... 6
Section 1: Introduction ...................................................................................................... 8
1.1. Background ............................................................................................................ 8
1.2. Report Structure ..................................................................................................... 8
Section 2: Taking Stock of the Progress ............................................................................. 9
2.1. Outcome 1 – Communities have capacity to negotiate, manage and use the natural resources for better livelihood ........................................................................................ 10
2.1.1. Output-1.1: Communities in all villages are mobilised, organised and are willing towards participating in co-management of TH resources ................................. 10
2.1.2. Output-1.2: Selected communities are involved with different livelihood options and IGAs.................................................................................................................. 13
2.2. Outcome 2 - A well functioning co-management body composed of the state, local government and communities manages the Tanguar Hoar following the wise use principle of Ramsar ....................................................................................................................... 15
2.2.1. Output-2.1: An interim governance mechanism for co-management of TH agreed and formed .............................................................................................................. 16
2.2.2. Output-2.2: Tanguar Haor ecosystem integrity improved. ................................ 19
2.2.3. Output-2.3: Community based participatory monitoring and evaluation system developed ............................................................................................................................ 21
2.3. Outcome 3 - Political and policy support continued at the national, regional and local level for up-scaling and ensuring long-term sustainability of the -management system for Tanguar Haor ................................................................................................ 22
2.3.1. Output-3.1 Knowledge Management System is working ................................... 22
2.3.2. Output-3.2: National and regional platforms established to support Co-management of TH .............................................................................................................. 23
Section3: Project Management and Implementation Issues ............................................. 24
3.1 Status of TPP and MoU ......................................................................................... 24
3.2 Management of the programme .......................................................................... 24
3.3 Project staffing ..................................................................................................... 25

3.4 Financial and Management Oversight .................................................................. 25
3.5 Project partners ................................................................................................... 25
Annexes ......................................................................................................................... 26
Annex-1: Showing progresses during May’10 – October’10 as per log-frame ................... 27
Annex-2: Tables, figures, diagrams and documents under Section 2: Taking stock of the progress ......................................................................................................................... 32
Annex-3: Leadership Status ............................................................................................. 59
Annex-4: Status of Functional VCC by Oct’10 ................................................................... 62
Annex-5: HH coverage and membership status by sex ..................................................... 63
Annex-6: List of training and meetings in last six months (May-Oct 10) ........................... 67
Annex-7: Summary status of Social Capital Management (SCM) by union........................ 68
Annex-8: Financial assistance status to the members by October 2010 ............................ 69
Annex-9: Project Management and Implementation Issues ............................................. 73

3rd_Operational_Report_May_Oct_10_TH-2[1], Page 6 of 75
Executive Summary 1. This is the third progress report, highlighting the progress made over the period of 01
May - 31 October, 2010.
2. This has been a period of a number of serious crises including an early flash flood, and an incidence of assault on government officials and the ensuing litigation involving some community leaders. Both incidences have had serious impact on the project, and considerably retarded the progress of routine work. With painstakingly slow but consistent persuasion and push from the project staff and community leaders, there has been good progress in terms of recovery by the end of the reporting period – although a fully recovery would still take time. These incidents have also provided for a learning experience for the project – especially to observe how to revive and restore progress amidst serious uncertainty and unfavourable environment through a well planned strategy grounded in the community and drawn on the self-esteem of community leaders.
3. A total of 431 persons received new membership during this period; however some 146 members left either due to paying outstanding from existing savings or not able to afford a weekly payment of BDT 12/ as savings and subscriptions regularly.
4. The TH community has attained a social status of ‘Crorepoti’ (multimillionaire) as they have accumulated a total of BDT 10,142,122/ by October 2010. The District Administration is planning to celebrate this grand event very soon.
5. The project has achieved a 66% coverage of underprivileged HHs. 37.7% of these underprivileged members successfully convinced and negotiated vis-à-vis their respective VCC leaders to secure financial assistance to conduct AIGs of their choice.
6. The average membership increased both in VCC and at the village level respectively by 9.7% and 8.3% reflecting increasing trust and confidence of the community.
7. A total of 590 women-headed families came under the fold of the organizational platform (i.e. formal membership of VCC).
8. Women leaders in TH acquired 22.72% seats in administrative group and and 23.86% in professional group in 33 VCCs where election been organised so far.
9. Underprivileged women constitute 69% of all female members in TH.
10. In context of the crises mentioned above, some significant governance measures and strategies have been tried and tested during this period. These include: organising special community mobilization meetings, co-opting additional key stakeholders into project committees, greater interactions with law enforcement agencies, and adaptive leadership on the part of the District Administration.
11. MoEF has played a very proactive role to support the project particularly to overcome the crisis soon after the incidence of the assault on the government staff in TH.

3rd_Operational_Report_May_Oct_10_TH-2[1], Page 7 of 75
12. To increase the effectiveness and ensure wider inclusion and support from key stakeholders, an additional 6 members – notably elected local government representatives and officials of law enforcing agencies - have been co-opted in the THMC.
13. A successful breeding of some fish species - notably Boal, Kalibaus, Sharputi, Gonia, Gang-Magur and Lachu has been done in TH, and delivered millions of fry and fingerlings that are expected to be spread out in four neighbouring districts.
14. A total of 816 fishermen participated in the non-commercial fish harvest during this period. Total income from non-commercial fishing events were BDT 667,845/.
15. TH community demarcated about 23.5 hector area in Rangamatia beel near Indrapur village of Uttar Sreepur union to develop a fish nursery for the endangered fish species like Rita, Baghair, Nanid, Sarputi (native), Chital and Mohashoal.
16. Good progress has been achieved towards finalization of the governmental approval and endorsement of the project. The TPP has been approved on 08.09.2010 and the MoU between SDC and the Government signed on 02 November 2010.
17. In parallel to the community led monitoring system, the project has taken a bold initiative to develop training facilitators from the community. So far, 42 facilitators are developed. A total of 23 were developed having representations from both administration and profession mainly for PRMP and 19 male absolutely for environment friendly HYV rice cultivation from agricultural profession. More facilitators will be developed to fulfil demand in livestock, small business and handicrafts.
18. IUCN has submitted a proposal to the Deputy Commissioner to delineate 14,774 hectors area as Tanguar Haor Ramsar Site. Main fish migratory routs and publicly visible boundaries i.e. demarcated naturally by river/canal/forest have been considered in the proposal. Approval of this proposal will increase fish security and reduce conflicts with the law enforcing agencies owing to the fact that people will able to identify the area and refrain from illegal access.
19. The VCC activation module developed by the project will assist UCC administrative leaders to supervise and activate inactive VCCs under their own jurisdiction.
20. A copy of the draft constitution developed by the project for the legal registration of Tanguar Haor Community has been distributed in all VCCs for their review and practice.
21. A summary of the project progress as per the agreed-upon Log-frame (LFA) is enclosed in Annex-1.

3rd_Operational_Report_May_Oct_10_TH-2[1], Page 8 of 75
Section 1: Introduction
1.1. Background
The 2nd Phase of the “Community Based Sustainable Management of Tanguar Haor (TH) Project” has completed its third six month period successfully. TH has been recognised as a globally significant wetland with an unique ecosystem, known for its diverse species of fish and as a staging ground for at least half a million of migratory birds. It is the primary source of living for over 56,000 people located in villages around its periphery. The Government of Bangladesh had become very keen to replace “traditional leasing” with a co-management system after the completion of a first ever conservation project in Bangladesh titled “National Conservation Strategy Implementation Project (NCS IP)” in the early 90s where IUCN-B (International Union for Conservation of Nature, Bangladesh Country Office) worked as a technical partner. Eventually, the Government took a bold decision to declare TH as an Ecologically Critical Area (ECA) in 1999 and a Ramsar site in 2000.
The Swiss Agency for Development and Cooperation (SDC) expressed interest to provide funding support after having a positive assessment of a proposal prepared by IUCN-B in response to an official request from the government that appraised by Mr. Peter Hislaire as an independent international consultant. Mr. Hislaire proposed 15 years target to implement the project in three stages comprising Preparatory stage, Development stage and Consolidation stage.
The first stage started in December 2006. In March 2008, a review mission found the progress satisfactory and suggested to continue the preparatory stage until some solid outcomes are reached and upscaled in the development stage. SDC then signed another contract with IUCN-B in April 2009 to initiate the 2nd phase from May 2009 to April 2012 as an expansion of preparatory stage. This is the third operational report highlights the progress made over the period between May 2010 and October 2010.
1.2. Report Structure This report documents progresses in line with the three expected outcomes and their respective outputs in three sections. Section one comprises a brief introduction. Section two is describing output based progresses during this reporting period. This section contains detail analytical results in comparison to the first and second operational reports (Phase II) and also with the initial progress status by April 2009 (Phase I). Section three discusses on the project management and financial aspect. References of data and information discussed in these sections are gathered in the Annexure.

3rd_Operational_Report_May_Oct_10_TH-2[1], Page 9 of 75
Section 2: Taking Stock of the Progress This particular six month period can be recognised as significant learning event from the perspective of the institutionalisation process and the revival of the community. It started with a shocking flash flood that collapsed all flood protection mechanisms in the haor area and submerged the entire crop at a very premature stage and deprived people from harvest their only crop to survive. It led a serious socio-economic crisis not only in TH but the entire haor basin. Consequently, a significant portion of the male population migrated to the city leaving their families vulnerable:
They became absolutely dependent on fishing. Savings and subscription, which are considered as the fundamental things of an organisation, were stopped. Majority of the families refraining from paying instalments of financial assistance that they received from their own organisation truly started to starve. As a result, all organisational norms, disciplines, values and self-initiatives of resource management which were achieved in the last three years seemed to be collapsed. People enjoyed free harvest. Project staff and committed leaders attempted to resolve this deadlock situation in June 2010, through providing license and permits for legal fishing with the active support from the district administration. The situation started to change. People started savings and paying instalments to revive organisational norms and rules but it knocked back more crucially in July when two top leaders of the community had to surrender to the court accused of magistrate assault and given a “Druto Bichar Ain” (Speedy Trial Act of Bangladesh). This unwanted incidence encouraged the vested interest groups to convince the community that the government is no longer with the project. Consequently, whole socio-political situation has been turned into such a situation that would require more than a year to restore. However, the project went through an outstanding learning process during that difficult period of time, and observed, how a good layout plan of an organisation, commitment, ownership and self-esteem leadership can breathe life into a dead.
The mobilisation approach of this period (May-October 2010) was initiated with the modified organizational structure to be represented by four administrative and five professional leaders. In order to execute the modified structure, necessary communication materials published and circulated, special meeting organised in all villages, central leaders developed benefit packages for each and every professions and asked the members to choose their profession accordingly. This approach was popular among the masses and mobilisation reached a point but dropped to zero literally; soon after the second incidence. A modality of ‘Village Activation Process’ has been developed through a series of consultative meetings with the partners and leaders to restore organisational discipline. Implementation of the newly developed VCC activation modality is now firmly under way and giving positive result which may reflect in the next reporting period.
Nevertheless, the outcomes of the progress achieved during this particular reporting time (01 May - 31 October, 2010) are presented below under different outputs with a comparative

3rd_Operational_Report_May_Oct_10_TH-2[1], Page 10 of 75
analysis with the previous time frame during the first and second operational reports (Phase II) and also with the initial progress status by April 2009 (Phase I).
2.1. Outcome 1 – Communities have capacity to negotiate, manage and use the natural resources for better livelihood
This particular outcome has been considered as the foundation for the development objective. It expects mobilization of 10,205 HHs living in 84 villages to be organized under the organizational structure of 81 Village Co-management Committees (VCC), 4 Union Co-Management Committees (UCC) and a Central Co-Management Committee (CCC). All members would have an interactive understanding on the vision, mission, organizational integrity and institutional sustainability. They would be mobilized for the purpose of establishing a functional co-management system of TH having sufficient options of different livelihoods and IGAs to reduce dependency on TH resources. An interim governance mechanism for co-management of TH is expected to be formed with the common consensus of all stakeholders. Community organization would have legal status to take part in the governance mechanism. Resource sharing concepts would be finalized through large scale application and proper agreement following wise use principle of Ramsar.
2.1.1. Output-1.1: Communities in all villages are mobilised, organised and are willing towards participating in co-management of TH resources
Organisational strength Considering the level of dependency and demand of the community no new village was included during this period. Despite the above mentioned incidences, the Central Co-Management Committee of TH managed to protect previous strength of 76 villages under 73 Village Co-Management Committees (VCC) except two1
Membership reached a total of 4,954 numbers including 431 new members during this reporting period, however, a total of 146 members have withdrawn membership either to pay their outstanding debts from the existing savings or because they are simply not able to afford saving BDT 10/ and subscribe BDT 2/ every week regularly. Female membership has increased by 1.7% in comparison to the previous six months. Household (HH) coverage has increased from 38.79% to 52.8% with a total of 4,350 incorporating 372 new households. Maximum HH coverage (61.8%) achieved in Dakshin Sreepur union. The average number of members both per VCC and Villages has been increased by 9.7% and 8.3% respectively during this period. Progress (0.7%) made in women leadership coverage mainly due to
with significant extent of steady progress in comparison to the last.
1 Both the villages named Painakhali having 34 households and Teroghar with 43 are located in Uttar Sreepur union under Tahirpur Upazila not responding properly owing to the fact that major portion of the male members are either absconding (Painakhali village to avoid arrest from a murder case) or migrated to the city due to flood.
3rd_Operational_Report_May_Oct_10_TH-2[1], Page 11 of 75
modified structure. Percentage of elected women leaders in the VCCs by October 2010 is 22.72% in the administrative group and 23.86% in professional group. Accumulation of social capital per VCC on average has reached BDT 58,188/ is 1.1% higher in comparison to the last. Please see status of functional VCC in Figure 4.1 and village coverage in Table 4.1 of Annex 4. Detail of household coverage and membership status by sex have provided in Table 5.1 and 5.2 of Annex 5. Progress made in different indicators under organizational strength shown in Table 2.1.1 of Annex 2.
Management and leadership Increasing trends of progress has been noticed in leadership functionalities at different tiers. A total of 1,722 weekly VCC meetings were conducted by the village leaders with the support from the community facilitator during this six months period. They have organised monthly meetings to review plans and progress as per yearly Participatory Resource Management Plan (PRMP). CCC organised 7 meetings to overcome the challenges evolved from the natural and manmade disaster. CCC managed to organise formal election in 33 villages fulfilling a condition of 100% updates with new portfolio. So far, a total of 220 leaders (male 169 and female 51) are elected. In general female leaders have acquired 23.18% seats in the 33. However, in administrative category, female leaders attained 22.72% seats (30 out of 132) and in profession achieved 23.18% (21 out of 67) seats with better performance. Elections of the remaining VCCs are under way. Election of UCC and CCC are expected to be organised in December. Please see progress on management and leadership in Table 2.1.2 of Annex 2 and more detail information in Figure 3.1 and 3.2 of Annex 3 and in Annex 6 (Meetings).
Capacity building initiatives In order to develop the managerial capacity and skill of the community leaders, Project Support Management Unit (PSMU) organised 54 person-days training of trainers (ToT) on PRMP and developed 23 co-facilitators from the community where 5 were female. Inter Corporation (IC) took lead to provide market extension trainings to 48 village members and 6 project staffs. Leadership training is planned to initiate soon after the completion of the VCC elections in November 2010. IC also took lead to conduct 45 person-days ToT on first step rice cultivation training to develop 19 male facilitators from the community. Please see list of training in the last six months in Annex 6 and Table 2.1.6. More detail on this will be discussed under the outputs of Outcome-2.
Community is being accustomed with TH activity modality A series of consultative meetings and workshops were conducted with the community leaders to resolve various concurrent issues like adoption of modality for lar boshi, tana jaal and daittya borshi under non-commercial fish harvest, pursuance of accepting license and permits instead of free fishing (after flood), development of tender rules and regulations for community based beel chai fishing, commercial fish harvest mechanism, community patrolling, VCC elections under new structure and PRMP facilitation under the guidance of newly trained community leaders. Community started to get accustomed with the resource harvest modality considering Ramsar wise-use principle and the subsistence income for the

3rd_Operational_Report_May_Oct_10_TH-2[1], Page 12 of 75
underprivileged. Please find more on common consensus and practice explored in Table 2.1.3 of Annex 2.
Providing support to communities The legal procedure of acquiring khash lands for UCC office in four unions is under way. Survey and investigation by the local administration is completed. Both the Upazila Nirbahi Officers (UNOs) of Tahirpur and Dharmapasha have submitted their reports to the Deputy Commissioner (DC), Sunamganj. Construction of UCC offices will be started soon after getting his endorsement. However, UCC offices are rented and kept operational to encourage leaders and members to increase community involvement and participation with the process. All union level staff of CNRS and ERA are now staying in these offices to provide full support to the leaders. All these offices are furnished with accommodation and solar electricity.
Operations of the Information Centre PSMU is trying to relocate the existing information centre somewhere in a government premises with more space and better environment. This is now in active consideration of the district administration.
Providing matching funds A total amount of BDT 12,51,000.00 has been deposited in the bank account of CCC fund to enhance the capacity of the community organization.
Boats for each UCC Two new residential boats with modern accommodation facilities are procured in this reporting period.
Problems, constraints and lessons learned In addition to the natural and manmade problems and constraints as stated earlier, the project suffered a lot from staff drop out in a regular interval, long vacancies in the posts of field facilitators, supervisors and community facilitators have hindered the smooth progress of project activity, as it is hard to find prospective candidates within the community and potentials from outside the region are not interested to work in these remote areas. Another constraint was transitional stability of the community leaders as they often migrate in search of jobs. Frequent transfer of government officials at district and upazila level has also been a serious problem which had a negative impact to slowdown the progress.
Sincere effort, commitment with good understanding and team spirit can overcome any natural and manmade crisis at any stage. Introducing and developing co-facilitators from the community to conduct PRMP and training got momentum rolling while project staffs were busy to restore trust and confidence of the mass in the working area. The introduction of VCC activation module for project staff and publication of communication materials (ref: annex diagram 2.1.1) illustrating roles and responsibilities of leaders, different range of supports for different professional groups, and exploration of different potentials under different professional banner aiming mainly to functionalise VCCs round the year worked very satisfactorily to convince the community to be reorganised. Declaration of incentives

3rd_Operational_Report_May_Oct_10_TH-2[1], Page 13 of 75
from the district administration mainly to enhance income and rights were found to work as stimulant in restoration of trust and confidence on the project. For instance, declaration of forest to be used to restore fish habitat and use of organisational boats by the magistrates for patrolling TH inspired people to get reorganised.
Initiative of a partner organisation to provide relief and rehabilitation support without having prior consultation with the existing decision making bodies of the community resulted confusion, misunderstanding and mistrust which anguished some leaders to mobilise members against the project. It required extra effort from IUCN to make people believe that it has not been initiated by the project at all.
Behavioural change The following changes in attitude and behaviour are observed among the members of the community.
o Members are getting aware of leaders’ roles and responsibilities and are arguably making better voting decisions to elect better leaders.
o Some leaders and community members including the recently developed co-facilitators are showing proactive roles establishing rules and regulations at VCC level.
o People are accepting a greater number of women leadership under the modified organisational structure.
o Some leaders are improving skill to communicate district administration on various issues.
o Negotiation capacity of the CCC and UCC leaders’ has been increased. They are getting accustomed with putting logic and argument in THMC and other meetings particularly organised with project and government officials.
2.1.2. Output-1.2: Selected communities are involved with different livelihood options and IGAs.
Communities continued the social capital management (SCM) program satisfactorily with greater experience and learning while providing support to the members to conduct different livelihood options and alternative income generating activities (IGAs) in the project area. Progress under social capital program is discussed below.
Accumulation of social capital under SCM Table 2.1.4 of Annex 2 shows that the communities have achieved better performance in this reporting period in comparison to the last particularly in the collection of subscription (3.99%), savings (2.93%), principal (12.23%) and interest (53.72%), but poor rate of performances in providing financial assistance (-54.30%), collection of admission fee (-51.79%) and service charge (-39.10%) despite existing heavy demand for financial assistance at the field level. This was done intentionally by the UCC leaders as they felt risks providing financial assistance during havoc situation emerged during flood and magistrate assault and also due to the fact that the CCC has imposed a condition of 100% updates from all members before receiving any benefits from the project..

3rd_Operational_Report_May_Oct_10_TH-2[1], Page 14 of 75
Accumulation of social capital (Fee+Subscription+Savings+Service Charge) per member has been decreased by (-7.68%) and (-41.32%) in comparison to the last and same period (May-Oct) in 2009 respectively. This data clearly indicates the impact of early flood and the incidence of magistrate assault on the organisational performances of the community.
Despite of this, an increased rate (10.09%) of progress has been identified at cumulative level of collection which contributed the community to attain a social status of ‘Crorepoti” (multimillionaire) during this period. So far, collection of a total amount of BDT 10,142,122/ by a community organisation like TH has been recognised as one of the historic success in the field of social mobilisation in Bangladesh and elsewhere in the world. Please see more details in Annex 7.
Financial assistance under SCM Table 2.1.5 of Annex 2 shows that the total amount of financial assistance provided to the members reached BDT 7,843,000/ of which BDT 1,128,000/ was received by the female members which is increased by 10.58% to reach a cumulative figure of 13.49%. However, the total amount of financial assistance decreased by -53.77% in comparison to the pervious six months. Please see more analysis on financial assistance in figures 8.1-8.4, village wise information on financial assistance in Table 8.1 and union wise comparative analysis between different periods are attached in Annex 8.
Membership withdrawal It was discussed earlier that membership withdrawal has been increased to 173.97% in comparison to the last six months. Most of these members had to withdraw membership as they were not able to update their savings and instalments equal to a regular member. Considering its negative impact in the community, CCC leaders then decided to allow savings weaver for the first time in cases of savings defaulters with an imposition of rules of 100% OTR. Community members have shown positive response to this measure that contributed to decrease membership withdrawal and members are paying all dues of financial assistance they received earlier.
Capacity building initiatives for alternative income generation (AIG) In order to promote alternative income for the community members, the project through its partner Inter Corporation (IC) revised the existing training module on agriculture and provided a total of 48 man-days ToT to develop 16 trainers from agriculture profession group from the community to conduct training to the members. Another training module on vegetable cultivation has also been developed and awaiting for field test.
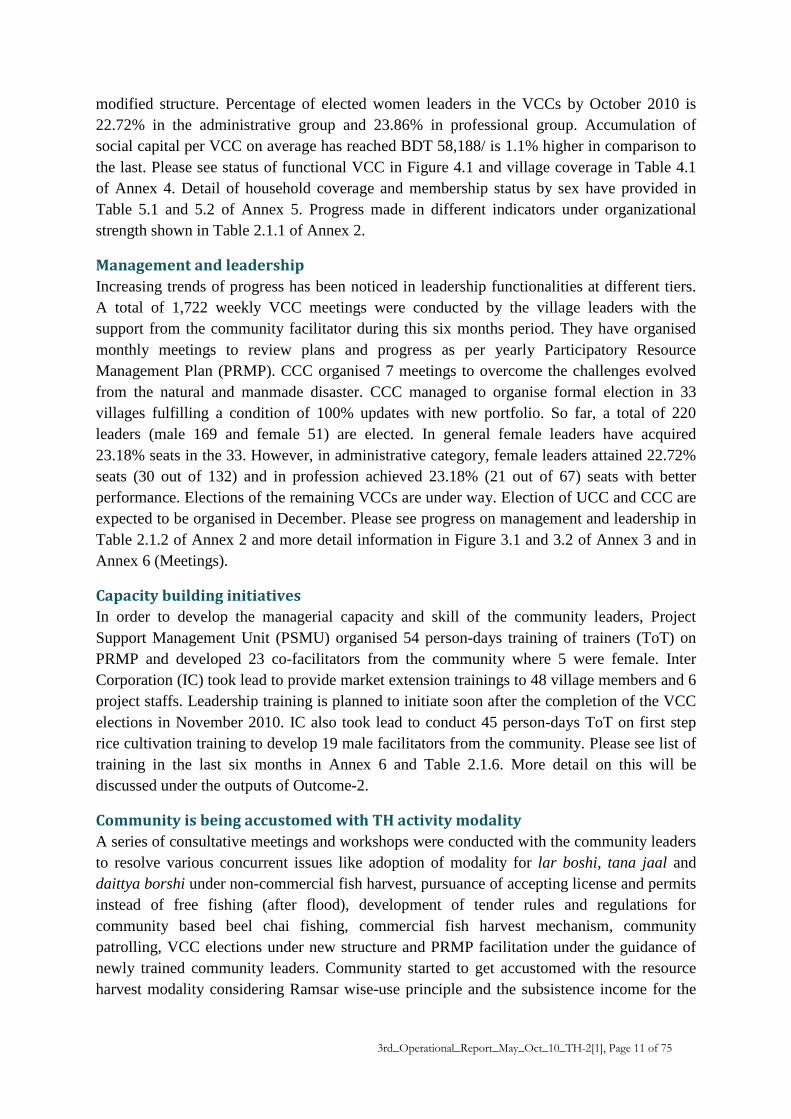
Status of underprivileged Project is continuing efforts in accommodating the underprivileged HHs under the organisational platform and provides support through SCM activities. Table 2.1.7 of Annex 2, shows that 2,869 number of underprivileged HHs received membership that constitutes 66% of the total HHs (4,350) covered by the project. Selected underprivileged members (3,467) constitute 70% of the total membership (4,954), where 37.7% members (1,868) achieved to convince VCC leaders to receive financial assistance from the respective UCCs.

3rd_Operational_Report_May_Oct_10_TH-2[1], Page 15 of 75
A total of 590 women headed families were brought under the organizational platform. Female membership among the underprivileged has increased by 1.90% in the last 6 months. Underprivileged female members (590) constitute 69% of all female members (852) in TH. A total of 303 female members from the underprivileged received financial assistance that constitutes 79.5% of the total female recipients who received BDT 9,75,000/ constituting 79.4% of the total amount received by females. Please see Table 2.1.8-9, Figure 2.1.1-4 of Annex 2 for more details.
List of AIGs with priority and context Out of 2,407 financial assistances to conduct AIGs, the highest domain identified as small businesses (1,608) followed by agriculture (614), poultry & duckery (103), livestock (75) and handicrafts (8). Fishing boat stands alone at the top of the list with the highest 617, among other sub-domain categories followed by high yield variety of rice cultivation (421), fish business (170), grocer's Shop (147), rice business (140) and fishing net (106). The fishing boat is mostly popular among males while cultivation of high yield variety of rice to the female members. Table 2.1.10 of Annex 2 is showing the AIG status and analysis of sub-domain categories in Table 2.1.11 of Annex 2.
Participatory Resource Management Plan (PRMP) Revised module of PRMP has been developed accommodating new organizational structure and lessons learned from the previous years. Co-facilitators are developed through ToT from the community considering five professional backgrounds. Field tests were completed in two villages with the revised module and newly developed co-facilitators. A schedule has been prepared to conduct PRMP in other villages soon after completion of election in all the villages. An interactive PRMP calendar depicting all significant activities at VCC level with both Bangla and English dates is expected to be published by December 2010. Draft sample of the final version of PRMP calendar is furnished in Diagram 2.1.2 of Annex 2.
2.2. Outcome 2 - A well functioning co-management body composed of the state, local government and communities manages the Tanguar Hoar following the wise use principle of Ramsar
This outcome expects mainly an interim governance mechanism for co-management of TH formed with the common consensus of all stakeholders, which comprises of representatives from the community, local administration and the state. Community organization will have legal status by the end of the project allowing the community to take part in the governance mechanism. Resource sharing concepts would be finalized through large scale application and proper agreement following wise use principles of Ramsar. Community people are expected to demonstrate distinct change in behaviour and attitudes to accommodate co-management norms, values and wise-use principles of Ramsar Site. In addition, ecosystem integrity of the TH is expected to be improved with the enhancement of knowledge. Knowledge on ecosystem integrity would be improved through different studies that would

3rd_Operational_Report_May_Oct_10_TH-2[1], Page 16 of 75
help to update the existing TH Management Model. Also the community based participatory monitoring and evaluation system would be developed to assist the community members and leaders to monitor and evaluate the progress of the activities that was planned through the PRMP, such as measuring the quality of organizations and leadership at village, union and central level, identifying the positive and negative impacts of activities, assessing livelihood and income status of the household members and the affectivity of resource management mechanism with due consideration to wise use principals of Ramsar. The main progresses of this outcome in line with outputs within the reporting time frame are presented below.
2.2.1. Output-2.1: An interim governance mechanism for co-management of TH agreed and formed
Governance mechanism of TH co-management The Governance mechanism of TH co-management has stepped into a new era by successfully facing the multidimensional socio-political crises provoked from unexpected incidence of government official assault in TH area. The district administration demonstrated a splendid role in overcoming this exhausted situation resultant afterward. Other members of THMC have also played an active role in this regard. Frequent visits in TH especially by DC, SP and ASP, Ansar Adjutant, BDR Officials and respective magistrates contributed largely to improve the situation rapidly. A special meeting was organised in Tanguar Haor (in Takerghat) with the chair of DC in participation of all high level officials and stakeholders. The output of that multi-stakeholders meeting contributed significantly to overcome the worsening situation and restoration of trust and confidence on project and project officials. This event has helped minimising a large gap between the district administration and the community. Local government representatives from the respective unions have also shown their comprehensible commitment towards establishing a co-management system in TH.
The commitment of district administration in establishing co-management system in TH is also proven by arranging the highest number of decision making events in any six months period i.e. 4 THMC meetings, 1 special meeting in TH, Some of the major decisions taken by THMC is presented below:
o From now on the assigned magistrates will attend in different awareness raising events in TH villages in cooperation of project staff.
o A forest resource harvest modality with a benefit sharing proportion of 60% for the members, 25% for CCC and the rest of 15% as revenue to be deposited in government treasury.
o Use of government owned resources for habitat restoration in Tanguar Haor, for instance, Hijal branches are to be placed under water particularly in the selected perennial water bodies to increase fish habitat to stay in from ‘Ranchi baag’ near Ranchi village of Dhakshin Bangshikunda union. Successful implementation of this modality will encourage the district administration to replicate the system in other villages of TH.
o BADC seed dealership to the CCC. o Conducting mobile court against illegal fishing nets.

3rd_Operational_Report_May_Oct_10_TH-2[1], Page 17 of 75
o Submission of project activity schedule to all concerned UNOs and TH Cell to provide support from local administration to the project.
o Procurement of boats from the community to be used by the learned magistrates, police and ansars to patrol.
o Membership of the two accused leaders suspended temporarily till the end of the trial and getting free from accusation.
o Introduction of report submission system by the assigned magistrates soon after completion of duty and presentation in the THMC meetings.
o Selection of 20 community leaders to provide information to the district administration on illegal fishing and corruption.
o All fishing under non-commercial fish harvest is prohibited on every Thursday. o All kinds of fishing prohibited at night. o Appointment of a ‘Peshkar’ to assist the assigned magistrates during mobile court.. o Initiation of Mobile court under the leadership of concerned UNOs to stop use of
‘kona jaal’ , ‘current jaal’ and ‘bandaria jal’ in TH. o DLO office to take necessary steps to provide vaccination support in the TH area and
provide LSP training to the selected members of the community. o BWDB, Sunamganj to take necessary steps to re-excavate important beels and khals
(fish migration routs) in TH. o A request letter to be sent to the Director General (DG), Haor and Wetland
Development Board to include TH in the hoar master plan. o Project to deliver 5 mobile phones to establish effective communication system with
the project staffs and community leaders during the patrol.
Formation of sub-committees THMC has formed several sub-committees to reinforce the supervision system in TH. These are: (i) 5 members committee to procure fingerlings of six extinct fish species headed by Additional Deputy Commissioner, (ADC, Revenue) and representatives from IUCN, CNRS, ERA and CCC, (ii) 4 members committee to submit report on the present status of ansar camps and feasibility of shifting those near BDR camps instead of using primary schools in TH area chaired by the ADC (Revenue) incorporating ASP, Ansar Adjutant and a representative from IUCN as member, and (iii) 5 members committee to investigate community proposal of destroying boats instead of giving auction captured by the law enforcing agencies in TH similarly chaired by the ADC (Revenue) incorporating the officer in charge of TH cell and one representative from IUCN, CNRS and ERA as member.
Newly co-opted members of THMC THMC has co-opted the following members during this six months:
a. District Ansar Adjutant, Bangladesh Ansar, Sunamganj. b. Chairman, Uttar Sreepur Union Parishad. c. Chairman, Dhakshin Sreepur Union Parishad. d. Chairman, Uttar Bangshikunda Union Parishad. e. Chairman, Dhakshin Bangshikunda Union Parishad. f. Officer in-charge, Bangladesh Police, Tahirpur Thana. and

3rd_Operational_Report_May_Oct_10_TH-2[1], Page 18 of 75
g. Officer in-charge, Bangladesh Police, Maddyanagar Thana.
Proactive role from MoEF MoEF has shown a very significant role to support the project particularly to overcome the crisis soon after the incidence of magistrate assault in TH. Dr. Nasir Uddin, the National Project Director (NPD) and Joint Secretary (Development), Ministry of Environment and Forest (MoEF) visited Sunamganj and attended a meeting with the district administration to provide necessary instructions to mitigate the crisis. NPD also visited IUCN project office, Sunamganj to meet project officials and CCC leaders to provide necessary instructions on that. Mr. Quazi Monirul Islam, the Deputy Chief of the same ministry accompanied NPD during the visit.
Dr. Mihir Kanti Mazumder, the Honourable Secretary, MoEF organised an inter-ministerial meeting attended by a representative from DC, Sunamganj, high officials from the Home Ministry, Bangladesh Police, Department of Ansar and Country Representative of IUCN. In the meeting he has reaffirmed the commitment of the country to the Ramsar Convention and instructed all concerned to provide all cooperation to implement the project. A copy of the meeting minutes is attached as PDF attachment 2.2.1 in Annex 2.
Active participation of local administration Local administration is actively participated in giving license and permission of different fishing under the non-commercial fish harvest program. District administration introduced license and permit with photo for the first time during this period. Required number of copies of licence and permit were supplied to the camps and concerned UNOs to follow up and supervise. Assigned magistrates were active to play roles in stopping fish poaching during this period. Sometimes they took the support of the local community in this regard. Two magistrates showed active role to support the community to conduct VCC elections in Shibpur village under Uttar Sreepur union and Golgaon under Uttar Bangshikunda union. Their participation increased the level of confidence of on project activities.
Progress in taking control over TH resources Community leaders have taken several decisions to take over the control on TH resources. They have participated in the government tender process to rent boats for patrolling TH. In order to establish transparency and accountability among the boat men and leaders (to be involved with patrolling) the CCC approved an amount of BDT 6,50,000/ for every year from their own source of income mainly to support the members so that they can perform their duty without getting involved with any sort of corruption.
Community actions against fish poachers The community proposal of involving a community guards instead of Ansars has been processed by the MoEF and forwarded to the finance ministry for their endorsement. A total of 141 actions were taken so far by the community members to prevent fish poaching where 44 actions were accomplished independently by the community leaders, 66 were initiated jointly with project staff and 31 were jointly with the assigned magistrates by October 2010.

3rd_Operational_Report_May_Oct_10_TH-2[1], Page 19 of 75
It is estimated that these efforts have captured about BDT 995,000/ worth of illegal fishing gears from fish poachers. (Table 2.2.1 in Annex 2)
2.2.2. Output-2.2: Tanguar Haor ecosystem integrity improved.
Successful fish breeding as an Impact of fish conservation strategy in TH
TH experienced a very successful breeding of some specific fish species that produced a huge numbers of fry and fingerlings that has spread in all the neighbouring districts through the fish migratory routs and rivers connected with TH. Despite having lot of constraints and problems during this reporting period, community people, fishermen, bio-diversity expert and environmentalists observed this huge achievement of TH this year. Some important species like Boal, Kalibaus, Sharputi, Gonia, Gang Magur and Lachu enjoyed a very successful breeding with low mortality rate in TH. People observed thousands of fish fry and fingerlings of these particular species during the whole rainy season. Abundance of these species was also noticed in the market of Sunamganj, Kishorgonj, Hobiganj and Netrokona districts. Community people and experts are recognising this as a success of TH conservation strategy owing to the fact that all wetlands in Sunamganj and neighbouring districts has been under leasing system where the lease holders did not maintain any conservation strategy to maximise harvest. Moreover, due to early flood TH community also failed to fish almost 40% of the conservation area, which also contribute higher fish abundance in the neighbourhood. Increased number of an endangered species Chital through restricted to fish was noticed in the local market. The daily Jugantor published news of increased number of another endangered species named Mohashol in the area.
Revised modality of commercial fish harvest - lesson learned Community leaders are now attempting to review the existing commercial fish harvest modality for 2011 considering the experience gathered in 2010. They have proposed to introduce open auction/tender system among the qualified CCCs to achieve maximum weaver out of the fishermen’s 40% share for each beels. The proposed modality though yet to be endorsed by the district administration is expecting maximum care and protection of water bodies from fish poachers from the successful bidder. It will also introduce collective fishing and equal scopes of earnings for each fisherman with maximum catch. CCC representatives are expecting to raise the issue in the next in THMC meeting for DC’s endorsement. Please see the list of perennial beels selected for commercial fish harvest in Table 2.2.2 and draft tender notice along with conditions in Figure 2.2.1 of Annex 2.
Non-commercial fish harvest A total of 816 fishermen participated so far in non-commercial fish harvest by October 10. Total income from non-commercial fishing events were BDT 667,845/. Please see more details in Table 2.2.4 of Annex 2.
Revised modality of Beel based Chai (traditional fishing trap)
Considering the experience of conducting beel based chai fishing in 27 spots in 2010, all fishermen group from all VCCs gathered in a meeting has revised the existing modality to

3rd_Operational_Report_May_Oct_10_TH-2[1], Page 20 of 75
maximise benefits to the organisation in the coming year rather it benefits the individuals which was identified as a bad case last season. According to the revised modality, only the members from fishermen profession of a particular village will be eligible for apply, fishermen from a single village can be grouped into more groups to compete different spot under the leadership of the respective fisherman secretary provided that one single fisherman will not be allowed to compete in two. In the mean time, they have identified new spots and splited the big ones to accommodate more fishermen in the process. List of spots is furnished in Table 2.2.3 and draft tender notice along with conditions in Figure 2.2.2 of Annex 2.
Lar (long line hooks) fishing
This event of non-commercial fish harvest provided immense support in coping up the economic crisis during flood this year. A total of 519 fishermen took part in this event through procuring 173 licenses and 372 permits in 3 times from the DC, Sunamganj. Total income from the lar borshi was BDT 132,000/. Please find more details in Table 2.2.5 of Annex 2.
Analysis shows that average fish catch per day/boat varied from lowest 2.5 kg to highest 7.0 kg. Income ranged per day/boat from lowest BDT 500/ to highest BDT 1,400/. Highest total income was noticed BDT 63,000/ by Mr. Amirul Islam, Hukumpur village in 45 days of fishing. Dominant species of the lar borshi were Boal, Bain, Taki, Meni, Baila, Gojar, Foloi, Gangmagur etc. (please see more in Table 2.2.6 of Annex 2)
Habitat restoration A total of 16 perennial beels are identified to improve the fish habitat through piling more bamboos and Hijal branch (Katha) this year. Of which, 8 beels are already piled with Katha. Rest of the beels will be piled through collecting Katha from Ranchi baag soon. Tender for the procurement of Jhai bamboo has been completed by Oct 10.
Demarcation of nursery beel Rangamatia beel near Indrapur village of Uttar Sreepur union is selected for preparing as fish nursery beel to rear the fish fingerlings of rare species i.e. Rita, Baghair, Nanid, Sarputi (native), Chital and Mohashoal collecting from open water natural sources. GPS survey is completed and procurement of necessary materials is underway. Total area of the nursery would be 23.5 ha.
TH boundary delineation Joint committee for delineation of the actual boundary of TH formed by IUCN, CNRS and District administration has submitted its report. Proposed new area of the TH is 14,774 ha consisting of 21 mouzas (5 partial). Approval of this proposed area is now under active consideration of DC who is supposed to send a letter to the steering committee of MoEF. Map of the proposed TH boundary is attached in Figure 2.2.3 of Annex 2.
Hydrological and ecological status Studies on the hydrological and ecological status are still underway involving renowned experts of the Bangladesh University of Engineering and Technology (BUET).

3rd_Operational_Report_May_Oct_10_TH-2[1], Page 21 of 75
Legal support for legalising existing community organisations in TH Assessment of the laws and regulations regarding the registration of the TH co-management organization is going on by BELA-the legal partner of the project. A report is expecting soon with recommendation of registration process.
Community awareness programmes A number of awareness programmes are taken by the community leaders through direct support of project on protecting uzza fishing protection, fish poaching, using indiscriminate fishing gears and modality of different fishing events. Two events of fishermen gathering arranged on disseminating the revised modalities of both commercial and non-commercial fish harvest.
2.2.3. Output-2.3: Community based participatory monitoring and evaluation system developed
This output focuses mainly on developing the required monitoring and evaluation tools and capacity of the community to monitor the performance of the co-management system. Progresses under this output are described below:
Participatory monitoring and evaluation by leaders After successful field test of the performance-based monitoring and evaluation tool for VCC, a survey was carried out by selected leaders of UCC on 10 particular VCC. Among the surveyed VCCs none of the villages obtained grade ‘A’ (>80% marks). VCC of Mandiata obtained the highest with grade ‘B’ (61-79% marks) following Gashi (B), Bangshikunda (C) and Golgaon (D).
DRR assessment completed A series of consultative meeting has been organised to finalise the Disaster Risk Reduction report. Fine tuning is going on and expected to be released by December 2010.
Gender survey in TH completed A gender survey report already been completed and published. This has been posted in the IUCN website with access to everyone.
Market extension study completed by IC Draft assessment report on market extension and value chain analysis has been submitted by IC. The report is now under the final process to incorporate comments and suggestions.
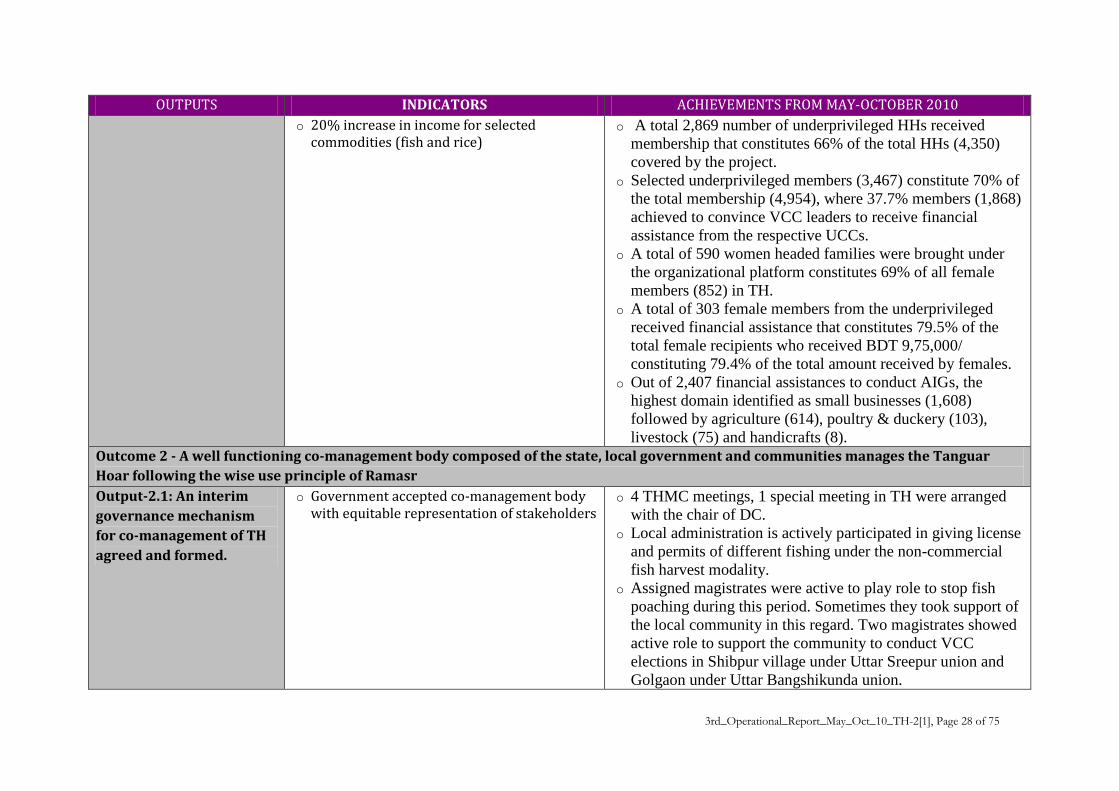
Capacity assessment on conducting PRMP and HHBP by IC IC has submitted another draft report on capacity assessment on conducting PRMP and HHBP by the community themselves. The report is also under review for incorporating comments and suggestions.
Module on new AIGs developed A number of new AIG is selected by the community leaders and project staffs to be promoted among different profession group members. These are Cattle rearing, Sheep rearing, Pig

3rd_Operational_Report_May_Oct_10_TH-2[1], Page 22 of 75
rearing, Duck hatchery, Carrying boat, Sewing machine etc. Draft modalities are developed and awaiting for PSMU review and to be endorsed by CCC after necessary modification.
2.3. Outcome 3 - Political and policy support continued at the national, regional and local level for up-scaling and ensuring long-term sustainability of the -management system for Tanguar Haor
Progresses in this phase is expected to provide an improved knowledge management system from the social and biological perspectives. Issues of social context are social behaviours (values, norms, myths, tradition and culture), gender, different means of production, resource harvesting mechanism, communication system, livelihood patterns, socio-political situation, rate and extremity of resource dependency, natural calamities, vulnerability, existing coping pattern, resource exploitation mechanism, resource types and its potentiality. The main issues of biological context are reproduction and regeneration mechanism of the resources, threats affecting natural production and conservation, ecosystem and biodiversity, minimum and maximum harvest limit and databases of existing resources is working to take decision by different platforms at national, district and local level to contribute to the long-term sustainability of the management system of TH. Progresses of this outcome within the reporting time frame are presented below:
2.3.1. Output-3.1 Knowledge Management System is working Progress under this output is presented below:
1. SCM database is upgraded with incorporating the sex information that enables the project personnel to analyze the coverage of female members and female HHs in any project activities.
2. Weekly electronic reporting system has been revised incorporating user friendly elements and reducing the formulae errors.
3. SCM data flow protocol is established with time frame from CF to DEO. 4. Introduced 7 new registers to maintain the savings, subscription, principal, etc. in field
level properly. 5. All field supervisors of the partners are deployed in the union level offices that ensured
daily updating of registers by CF and FF. 6. Community leaders are being made responsible for collection and documentation of
savings, subscriptions and instalments of financial assistance. 7. Profession choice materials are distributed at all villages and activity of profession choice
by most of the members completed. 8. Existing village profile upgraded for 42 villages. 9. VCC activation manual is developed in this phase. 10. A total of 4 manual/guidelines and modules were revised for different purposes during the
last 6 (six) months 11. Election manual has been revised incorporating the profession based options.

3rd_Operational_Report_May_Oct_10_TH-2[1], Page 23 of 75
12. Election materials produced and distributed in all villages. 13. Election results are being documented following the standard guideline and brought back
to the PSMU offices and stored properly. 14. Draft constitution of TH co-management organization is disseminated at all VCCs and
feedbacks gathered. 15. SCM accounts of 42 villages are checked and verified so far. 16. Upgradation of TH website is still in process. 17. TH e-newsletter is designed to commencement its first version by December 2010. 18. Participated in botanical fair arranged by district administration in Sunamganj.
2.3.2. Output-3.2: National and regional platforms established to support Co-management of TH
The world environmental day was observed by arranging meetings and rally at Tahirpur and Dharmapasha Upazila. Public gatherings arranged in Tahirpur on the eve of inauguration of Lar fishing by UNO, Tahirpur under non-commercial fish harvest. CR of IUCN met with several organization, projects and programs to exchange the views of re-establishing national wetland network. IPAC project personnel at TH are working closely with the community leaders. Daily newspapers and TV channels covered different issues highlighting project activities.

3rd_Operational_Report_May_Oct_10_TH-2[1], Page 24 of 75
Section3: Project Management and Implementation Issues
3.1 Status of TPP and MoU
The Technical Assistance Project Proposal (TPP) of the current phase of the project has been approved by the Planning Commission of the Government of Bangladesh with effect from May 2009 to April 2012 vide it’s memo no. 20.338.014.01.71.033.2009.182, Dated: 08.09.2010.
Consequently, the Memorandum of Understanding (MoU) between the Swiss Confederation, Represented by the Swiss Federal Department of Foreign Affairs, acting through the Swiss Agency for Development and Cooperation (SDC) and the Government of Bangladesh represented by the Economic Relations Division of Ministry of Finance has been signed on 02 November for the period of 3 (Three) years from May 2009 to April 2012.
Through approval of TPP and signing of the MoU between SDC and ERD, the project has got formal recognition of the government and the grant for this project aided by the SDC has been included in the Annual Development Programme (ADP) of the Government of the People’s Republic of Bangladesh.
3.2 Management of the programme
IUCN country representative keeps continuous liaison with the Honourable Secretary of the Ministry of Environment and Forest to update major issues of TH. The Team Leader and the Project Manager of the project keep regular liaison with the NPD and other concerned officials for smooth implementation of the project.
Tanguar Haor Management Committee (THMC) under the leadership of the Deputy Commissioner (DC), Sunamganj has been continuing necessary supports from the district administration to implement the project. In the mean time the Additional Deputy Commissioner (ADC, revenue), and the Upazila Nirbahi Officer, Tahirpur who are the important members of THMC have been transferred from Sunamganj. ADC (general) is now acting as ADC revenue to support the project activities from the district administration. New UNO has joined Tahirpur upazila and attended two THMC meetings so far. Major decisions taken in this reporting period discussed earlier in sub-section “Governance mechanism of TH co-management under output-2.1 above.
Project Support Management Unit (PSMU) has been active to monitor the progress of the project at field level and providing technical and accompaniment support to the project

3rd_Operational_Report_May_Oct_10_TH-2[1], Page 25 of 75
partners through regular field visits and organising meeting, consultative discussions and workshop with all the partners as well as with the CCC leaders regularly.
3.3 Project staffing
PSMU has now been supervising project activities with full strength. Considering the complexity of the project the project is planning to recruit a micro-credit expert to provide technical support to the partners as well as to the UCCs and CCC as Junior Program Officer replacing Mrs. Ahana Adrika to be based in Sunamganj instead of Dhaka to be executed from the next January 2011. Team leaders of the project is staying in Sunamgonj and leading the TH team in consultation with the CR. The Project Manager is staying in Dhaka and playing a significant role in establishing better communication with GoB in order to achieve quick decisions in favour of the project implementation process.
3.4 Financial and Management Oversight
A total of BDT 13,747,979/ has been spent against a call forward budget of DBT 24,255,845/ during this reporting period. Overall burn rate of this reporting period is 57% which is 9% higher in comparison to the last 6 months.
Burn rate of program activities under Part-3 has also been increased by 11% in comparison to the last 6 months. So far, the project achieved an overall burn rate of 34% in the middle of the phase. As the approval process of TPP has already been completed, the project will run with full swing to achieve 100% rate in the remaining period of the phase. Please see some important clarifications illustrated in Table 9.1 of Annex-9.
3.5 Project partners
All partners namely CNRS, ERA, BELA and IC are working with the project with specific ToR and budget. Both CNRS and ERA have deployed their union level staff at union level. At present, project staffs are providing maximum support to the community with better relationship and integrity. However, both the partners working at field level have been suffering from regular staff drop out. BELA project Coordinator has also resigned from his post to join a higher study in abroad. BELA has already filled in the post but CNRS and ERA yet to fulfil a significant number of vacancies at field level.

3rd_Operational_Report_May_Oct_10_TH-2[1], Page 26 of 75
Annexes

3rd_Operational_Report_May_Oct_10_TH-2[1], Page 27 of 75
Annex-1: Showing progresses during May’10 – October’10 as per log-frame OUTPUTS INDICATORS ACHIEVEMENTS FROM MAY-OCTOBER 2010
Outcome 1 - Communities have capacity to negotiate, manage and use the natural resources for better livelihood Output-1.1: Communities in all villages are mobilised, organised and are willing towards participating in co-management of TH resources.
o By December 2011, community people of 88 villages organized under 81 village committees, four union committees and one central committee, having elected leadership, 20% women’s leadership in organisational decision making process, coverage of 60% households and accumulation of Taka 50, 000/ (in average) as self capital in each village committee.
o 76 villages under 73 Village Co-Management Committees (VCC).
o Membership reached a total of 4,954. o Percentage of female membership increased by 1.7% in
comparison to the previous six months. o Household (HH) coverage is increased from 38.79% to
52.8% with a total of 4,350. o Average number of members both per VCC and Villages has
been increased by 9.7% and 8.3% during this period respectively.
o Women leaders acquired 21.9% seats in 33 VCC election organised by October 2010.
o Accumulation of social capital per VCC on average reached BDT 58,188/ that is 1.1% higher in comparison to the last.
o A total of 1,722 weekly VCC meetings were conducted by the village leaders.
o CCC organised 7 meetings and also managed to organise formal election in 33 villages fulfilling a condition of 100% updates with new portfolio.
Output-1.2: Selected communities are involved with different livelihood options and IGAs.
o At least 50% members got involved with IGAs having loan facilities and other support from the self initiatives of respective union committees.
o Men and women have equal access to resources with special priority to ultra-poor
o At least 50% HHBP entrepreneurs has increased income by 50%
o 20 new IGAs embraced by the communities
o A total amount of BDT 10,142,122/ has accumulated by the community organisation recognised as one of the historic success in the field of social mobilisation in Bangladesh and elsewhere in the world.
o Total amount of financial assistance provided to the members reached at BDT 7,843,000/ of which BDT 1,128,000/ was received by the female that increased by 10.58% to reach a cumulative figure of 13.49%.
3rd_Operational_Report_May_Oct_10_TH-2[1], Page 28 of 75
OUTPUTS INDICATORS ACHIEVEMENTS FROM MAY-OCTOBER 2010 o 20% increase in income for selected
commodities (fish and rice) o A total 2,869 number of underprivileged HHs received
membership that constitutes 66% of the total HHs (4,350) covered by the project.
o Selected underprivileged members (3,467) constitute 70% of the total membership (4,954), where 37.7% members (1,868) achieved to convince VCC leaders to receive financial assistance from the respective UCCs.
o A total of 590 women headed families were brought under the organizational platform constitutes 69% of all female members (852) in TH.
o A total of 303 female members from the underprivileged received financial assistance that constitutes 79.5% of the total female recipients who received BDT 9,75,000/ constituting 79.4% of the total amount received by females.
o Out of 2,407 financial assistances to conduct AIGs, the highest domain identified as small businesses (1,608) followed by agriculture (614), poultry & duckery (103), livestock (75) and handicrafts (8).
Outcome 2 - A well functioning co-management body composed of the state, local government and communities manages the Tanguar Hoar following the wise use principle of Ramasr Output-2.1: An interim governance mechanism for co-management of TH agreed and formed.
o Government accepted co-management body with equitable representation of stakeholders
o 4 THMC meetings, 1 special meeting in TH were arranged with the chair of DC.
o Local administration is actively participated in giving license and permits of different fishing under the non-commercial fish harvest modality.
o Assigned magistrates were active to play role to stop fish poaching during this period. Sometimes they took support of the local community in this regard. Two magistrates showed active role to support the community to conduct VCC elections in Shibpur village under Uttar Sreepur union and Golgaon under Uttar Bangshikunda union.

3rd_Operational_Report_May_Oct_10_TH-2[1], Page 29 of 75
OUTPUTS INDICATORS ACHIEVEMENTS FROM MAY-OCTOBER 2010 o A total of 141 actions were taken so far by the community
members to prevent fish poaching where 31 were jointly with the assigned magistrates.
Output 2.2 Tanguar Haor ecosystem integrity improved.
o Updated TH/Ramsar management plan o Upazila watch committee at up and
downstream o Fishers continue subsistence fishing without
conflict o Hydrological, ecological status of TH is in
place o Number of identified vulnerable species
increased
o Successful fish breeding as an Impact of fish conservation strategy in TH created an enabling environment for some important species like Boal, Kalibaus, Sharputi, Gonia, Gang Magur and Lachu to breed successfully with low mortality rate.
o Revised modalities of commercial fish harvest and beel based Chai (traditional fishing trap) are in place.
o A total of 816 fishermen participated so far in non-commercial fish harvest by October 10. Total income from non-commercial fishing events were BDT 667,845/.
o A total of 519 fishermen took part in Lar (long line hooks) fishing under non-commercial fish harvest.
o A total of 16 perennial beels are identified to improve the fish habitat.
o Rangamatia beel near Indrapur village of Uttar Sreepur union is selected for preparing as fish nursery beel.
o Studies on the hydrological and ecological status are underway.
o Assessment of the laws and regulations regarding the registration of the TH co-management organization is going on.
Output-2.3: Community based participatory monitoring and evaluation system developed.
o Community based participatory monitoring and evaluation system is functioning in at least 30 villages
o Data collected at specific interval of time and accommodated in the software
o Soon after the completion of required number of field tests, the performance-based monitoring and evaluation tool for VCC introduced. A sample survey was carried out by the selected leaders of UCC on 10 particular VCC.
o Market extension study completed. o Draft assessment report on market extension and value chain
analysis developed by IC.
3rd_Operational_Report_May_Oct_10_TH-2[1], Page 30 of 75
OUTPUTS INDICATORS ACHIEVEMENTS FROM MAY-OCTOBER 2010 o Capacity assessment on conducting PRMP and HHBP is also
under review incorporating comments and suggestions. o A number of new AIGs is selected by the community leaders
and project staffs to be promoted among different profession group members.
Outcome 3 - Political and policy support continued at the national, regional and local level for up-scaling and ensuring long-term sustainability of the -management system for Tanguar Haor Output-3.1: Knowledge Management System is working.
o Current mechanism reviewed o Strategy for knowledge management
developed o Information and data repository
strengthened and established o Protocol developed on Information and data
repository o 10 Information materials published in Bangla o Methodological guide for KM developed o Disaster Risk identified and risk reduction
strategy developed o Gender Baseline is in place o Biodiversity status assessed
o DRR assessment completed. o Gender survey in TH completed. o SCM database is upgraded with sex segregation. o Weekly electronic reporting system introduced, revised and
functioning. o SCM data flow protocol is established with time frame from
CF to DEO. o Introduced 7 new registers to establish manual
documentation system of SCM in all union level office of UCC.
o All field supervisors of the partners are deployed in the union level offices that ensured daily updating of registers by CF and FF.
o Profession choice materials are distributed at all villages. o Village profile upgraded in 42 villages. o VCC activation manual is developed in this phase. o Election manual has been revised to accommodate new
organisational portfolio. o Election materials produced and distributed in all villages. o Election results are being documented following the standard
guideline. o Draft constitution of TH co-management organization is
disseminated at all VCCs. o TH e-newsletter is designed to commencement its first

3rd_Operational_Report_May_Oct_10_TH-2[1], Page 31 of 75
OUTPUTS INDICATORS ACHIEVEMENTS FROM MAY-OCTOBER 2010 version by December 2010.
Output 3.2 National and regional platforms established to support Co-management of TH.
o Civil society members playing active role in favour of co-management
o Scientists are contributing towards technical aspects of TH
o Linkage established with Ramsar Bureau o A Civil Society platform organised o A national Scientific Advisory Body formed o A national network of Ramsar Wetlands
Management formed o Capacity need assessed o 50 people received training on roles and
responsibilities o At least 100 popular theatre performance
organised o 10 brochures/posters/leaflets published in
Bangla o Two video documentary produced and
showed
o World environmental day 2010 observed at upazila lavel under the leadership of respective UNOs.
o CR of IUCN met with several organization, projects and programs to exchange views establishing national wetland network.
o Daily newspapers and TV channels covered different issues highlighting project activities.
o In order to develop the managerial capacity and skill of the community leaders, PSMU organised 54 person-days training of trainers (ToT) on PRMP and developed 16 co-facilitators from the community.
o Inter Corporation (IC) took lead to provide market extension trainings to 48 village members and 6 project staffs.
o IC also took lead to conduct 45 person-days ToT on first step rice cultivation training to develop 16 facilitators including 6 female from the community.

3rd_Operational_Report_May_Oct_10_TH-2[1], Page 32 of 75
Annex-2: Tables, figures, diagrams and documents under Section 2: Taking stock of the progress
Table 2.1.1: Showing progress under organizational strength
SL #
Description
Status by
April 2009
Progress during
May’09 -October’09
Progress during Nov’09-April’10
Progress during Apr’10-Oct’10
Rate of increase
in the last six months
Cumulative Progress
by October 2010
Rate of increase
in compare to May-Oct 09
1 No. of VCC 48 11 14 0 -100.0% 73 -100.0% 2 No of
Member 3,021 629 873 431 -50.6% 4,954 -31.5%
3 HH coverage (No.)
2,778 501 699 372 -46.8% 4,350 -25.7%
4 %of female member
14.8% 14.7% 15.5% 17.2% 1.7% 17.2% 2.5%
5 Average no of member per VCC
41 50 62 68 9.7% 68 24.0%
6 Average no of member per village
40 48 60 65 8.3% 65 25.0%
7 Percent of women leadership
15.5% 19.6% 21.2% 21.9% 0.7% 21.9% 2.3%
8 Accumulation of average social capital per VCC
21,658 14,137 11,135 11,258 1.1% 58,188 -21.2%
Table 2.1.2: Showing progress in management and leadership
SL #
Description Status
by April 2009
Progress during
May'09-October'09
Progress during
Nov'09-April'10
Progress during Apr'10-Oct'10
Cumulative Progress by Oct'10
1 No of CCC Meetings (executive) 4 2 2 7 15 2 No of CCC Meetings (general) 4 2 2 3 11 3 No of UCC meetings (executive) 36 14 10 9 69 4 No of UCC meetings (General) 5 7 10 9 31 5 No of VCC monthly meetings 41 49 246 202 538 6 No of VCC weekly meetings 1780 745 1638 1722 5885

3rd_Operational_Report_May_Oct_10_TH-2[1], Page 33 of 75
Table 2.1.3: Showing activity modality for community
Sl # Description of
activities Expected outputs Time-frame
1. Annual General Meeting and Election
- Income and expenditure statement - Profit distribution - New leadership
May, June & July
2. Participatory Resource Management Planning (PRMP)
- Annual plan organisational development, AIGs and resource management
August September & October
3. Preparation for agriculture and commercial fish harvest
- Financial assistance to farmers and fishermen
- Price fixation of fish through tender
- License and permits
November & December
4. Commercial fish harvest - Income from resource management
January, February & March
5. Review progress, reinforcement and plan
- Experience capitalisation - Next year plan
April

3rd_Operational_Report_May_Oct_10_TH-2[1], Page 34 of 75
Diagram 2.1.1: Communication materials developed for profession change activities in the course of organizational re-structuring

3rd_Operational_Report_May_Oct_10_TH-2[1], Page 35 of 75

3rd_Operational_Report_May_Oct_10_TH-2[1], Page 36 of 75
Table 2.1.4: Showing progress in accumulation of social capital under SCM
SL #
Description Status by April 2009
Progress during
October 2009
Progress during April 2010
Progress during
October 2010
Rate of increase
in the last six months
Cumulative Progress
by October 2010
Rate of increase
in compare to May-Oct 09
1 Total no of members received financial assistance
648 726 709 324 -54.30% 2407 -55.37%
2 % of female members received financial assistance
13.40% 15.70% 13.10% 24.10% 11.00% 15.5% 8.40%
3 Collection of admission fee (in BDT)
60,360 12,440 17,340 8360 -51.79% 98,500 -32.80%
4 Collection of Subscription (in BDT)
221,302 165,886 127,558 132646 3.99% 647392 -20.04%
5 Collection of Savings (in BDT)
1,258,135 838,054 652,158 671277 2.93% 3419624 -19.90%
6 Collection of Principal (in BDT)
874,500 1,324,925 1,517,075 1702625 12.23% 5,419,125 28.51%
7 Collection of Interest (in BDT)
13,150 93,975 112,025 172200 53.72% 391,350 83.24%
8 Collection of Service charge (in BDT)
41,201 15,608 15,781 9611 -39.10% 82,201 -38.42%
9 Collection of Insurance premium (in BDT)
20,870 25,540 21,880 15640 -28.52% 83,930 -38.76%
10 Total Collection
2,489,518 2,476,428 2,463,817 2,712,359 10.09% 10,142,122 9.53%
11 Rate of capital accumulation per member
523.34 282.74 179.71 165.91 -7.68% 857.43 -41.32%
12 Rate of savings per member
416.46 229.60 144.19 135.50 -6.02% 690.28 -40.98%

3rd_Operational_Report_May_Oct_10_TH-2[1], Page 37 of 75
Table 2.1.5: Showing progress in providing financial assistance under SCM
SL #
Description Status by April 2009
Progress during
October 2009
Progress during April 2010
Progress during
October 2010
Rate of increase
in the last six months
Cumulative Progress
by October 2010
Rate of increase in compare to May-Oct 09
1 Total amount of financial assistance to all members in BDT
1,951,000 2,283,000 2,468,000 1141000 -53.77% 7,843,000 -50.02%
2 Amount of financial assistance to female members
266,000 257,000 334,000 271000 -18.86% 1,128,000 5.45%
3 Female share in financial assistance (%)
13.38% 16.04% 13.49% 24.07% 10.58% 13.49% 8.03%
4 Savings Withdrawal
2990 0 10,540 38,650 266.70% 52180 -
5 Membership Withdrawal
18,058 11,810 5,800 15,890 173.97% 51558 34.55%
6 Total Debit 1,966,048 2,308,810 2,448,340 1,195,540 -51.17% 7,918,738 -48.22% 7 Cumulative
Balance 523,470 691,088 706,565 2,223,384 214.68% 4144507 221.72%
Table 2.1.6: Showing capacity building initiatives for alternative income
SL #
Description Status by April 2009
Progress during
May’09-Oct'09
Progress during
Nov’09-Apr’10
Progress during Apr’10-Oct’10
Cumulative Progress by
October 2010
1 Person-days training on Agriculture
1.1 1st step 0 27 247 54 328
1.2 2nd step 0 0 216 0 216 1.3 3rd step 0 0 179 0 179

3rd_Operational_Report_May_Oct_10_TH-2[1], Page 38 of 75
Table 2.1.7: Showing status with the underprivileged
SL #
Description Status by
April 2009
Progress during
May’09-October’09
Progress during
Nov’09-April’10
Progress during
October 2010
Rate of increase
in the last six months
Cumulative Progress by
October 2010
1 Utilization of CCC fund (in BDT)
0 0 155,000 0 -100.00% 155,000
2 No of underprivileged HHs received membership
2006 349 373 141 -62.20% 2,869
3 No of members from underprivileged HHs
2248 412 502 305 -39.24% 3,467
4 No of female members from underprivileged HHs
324 54 105 107 1.90% 590
Table 2.1.8: Showing list of underprivileged members status by sex and by occupation
SN Occupation by 30 Apr 09 by 31 Oct 09 by 30 Apr 10 by 31 Oct 10 Cumulative
F M T F M T F M T F M T F M T 1 Barkee 17 86 103 4 31 35 4 19 23 7 13 20 32 149 181 2 Fisher 80 753 833 6 114 120 25 182 207 12 76 88 123 1125 1248 3 Landless 93 447 540 14 83 97 39 84 123 42 44 86 188 658 846 4 Marginal 99 540 639 26 107 133 31 87 118 42 55 97 198 789 987 5 Small Business 35 98 133 4 23 27 6 25 31 4 10 14 49 156 205
A Total UPV Member 324 1924 2248 54 358 412 105 397 502 107 198 305 590 2877 3467
B % Sex UPV Member 14 86 13 87 21 79 35 65 17 83 C % of UPV out of SCM
Member 73% 75% 74% 59% 67% 66% 64% 56% 58% 71% 70% 71% 69% 70% 70%
D Total UPV HHs 42 1964 2006 2 347 349 8 365 373 3 138 141 55 2814 2869
E % Sex UPV HHs 2 98 1 99 2 98 2 98 2 98
F % of UPV HHs out of SCM HHs
78% 72% 72% 33% 70% 70% 7% 62% 53% 38% 38% 38% 31% 67% 66%
*F=Female; M=Male; T=Total

3rd_Operational_Report_May_Oct_10_TH-2[1], Page 39 of 75
Table 2.1.9: Showing financial assistance to underprivileged members by villages
Union Village Financial Assistance to UPV
Female Male Total Count Sum (Tk) % Count Sum (Tk) % Count Sum (Tk)
Uttar Sreepur
Bhoraghat 11 38,000 33.6% 23 75,000 66.4% 34 113,000 Binodpur 8 28,000 12.7% 57 192,000 87.3% 65 220,000 Birendranagar 0 0 0.0% 16 58,000 100.0
% 16 58,000
Chiragaon 3 9,000 8.3% 31 99,000 91.7% 34 108,000 Golabari 0 0 0.0% 31 107,000 100.0
% 31 107,000
Indrapur 10 26,000 15.7% 43 140,000 84.3% 53 166,000 Jamalpur 15 47,000 56.0% 12 37,000 44.0% 27 84,000 Joipur 3 10,000 10.4% 28 86,000 89.6% 31 96,000 Kamonapara 20 64,000 71.1% 8 26,000 28.9% 28 90,000 Mandiata 8 24,000 11.9% 58 177,000 88.1% 66 201,000 Moihiajuri 8 26,000 23.4% 27 85,000 76.6% 35 111,000 Mujrai 16 50,000 26.0% 41 142,000 74.0% 57 192,000 Nobabpur 0 0 0.0% 14 43,000 100.0
% 14 43,000
Ratanpur 16 51,000 48.6% 17 54,000 51.4% 33 105,000 Silani Tahirpur 2 6,000 4.7% 39 123,000 95.3% 41 129,000
Sub-total= 120 379,000 20.8% 445 1,444,000 79.2% 565 1,823,000
Dakshin Sreepur
Bolaikandi 1 3,000 20.0% 4 12,000 80.0% 5 15,000 Dumal 11 35,000 21.6% 41 127,000 78.4% 52 162,000 Gorergaon 0 0 0.0% 1 3,000 100.0
% 1 3,000
Hukumpur 3 9,000 8.5% 31 97,000 91.5% 34 106,000 Jangail 0 0 0.0% 14 47,000 100.0
% 14 47,000
Jibonpur 1 3,000 25.0% 3 9,000 75.0% 4 12,000 Joyasree 5 17,000 12.1% 37 124,000 87.9% 42 141,000 Keshtopur 0 0 0.0% 21 63,000 100.0
% 21 63,000
Lamagaon 1 3,000 0.9% 95 314,000 99.1% 96 317,000 Mahmoodpur 2 7,000 6.1% 34 108,000 93.9% 36 115,000 Manik Khila 3 9,000 5.8% 47 146,000 94.2% 50 155,000 Moazzampur 1 3,000 25.0% 3 9,000 75.0% 4 12,000 Nouagaon 1 3,000 33.3% 2 6,000 66.7% 3 9,000 Patabuka 21 68,000 29.8% 48 160,000 70.2% 69 228,000 Ramshinghapur 7 24,000 18.0% 33 109,000 82.0% 40 133,000 Santospur 2 6,000 25.0% 6 18,000 75.0% 8 24,000 Shibpur 4 14,000 35.0% 6 26,000 65.0% 10 40,000 Utiargaon 0 0 0.0% 2 6,000 100.0
% 2 6,000
Vandar Chapar 3 10,000 35.7% 6 18,000 64.3% 9 28,000 Sub-total= 66 214,000 13.2% 434 1,402,000 86.8% 500 1,616,00
0 Uttar Bangshikunda
Antarpur 2 7,000 5.4% 38 122,000 94.6% 40 129,000 Bakatala 5 16,000 9.2% 47 157,000 90.8% 52 173,000 Bangalvita 8 27,000 17.3% 34 129,000 82.7% 42 156,000 Bholaganj 0 0 0.0% 3 9,000 100.0 3 9,000

3rd_Operational_Report_May_Oct_10_TH-2[1], Page 40 of 75
Union Village Financial Assistance to UPV
Female Male Total Count Sum (Tk) % Count Sum (Tk) % Count Sum (Tk)
% Golappur 9 29,000 16.6% 45 146,000 83.4% 54 175,000 Golgaon 6 19,000 17.3% 27 91,000 82.7% 33 110,000 Isamari 0 0 0.0% 5 15,000 100.0
% 5 15,000
Kartikpur 1 3,000 2.5% 34 115,000 97.5% 35 118,000 Majhersara 9 35,000 27.3% 26 93,000 72.7% 35 128,000 Nababpur 2 6,000 4.8% 37 120,000 95.2% 39 126,000 Rajendrapur 1 3,000 8.3% 11 33,000 91.7% 12 36,000 Rampur 0 0 0.0% 27 86,000 100.0
% 27 86,000
Rupnagar 8 28,000 15.7% 46 150,000 84.3% 54 178,000 Sub-total= 51 173,000 12.0% 380 1,266,000 88.0% 431 1,439,00
0 Dakshin Bangshikunda
Amanipur 2 6,000 66.7% 1 3,000 33.3% 3 9,000 Bangshikunda 6 20,000 12.3% 42 142,000 87.7% 48 162,000 Basaura 3 10,000 13.5% 19 64,000 86.5% 22 74,000 Birsinghapara 3 9,000 30.0% 7 21,000 70.0% 10 30,000 Datiapara 3 9,000 11.1% 22 72,000 88.9% 25 81,000 Ghashi 10 30,000 32.6% 20 62,000 67.4% 30 92,000 Hatpatol 10 30,000 35.7% 17 54,000 64.3% 27 84,000 Jaipur 2 6,000 18.2% 9 27,000 81.8% 11 33,000 Kakarhati 1 3,000 14.3% 6 18,000 85.7% 7 21,000 Kauhani 4 15,000 11.8% 34 112,000 88.2% 38 127,000 Khidirpur 0 0 0.0% 4 12,000 100.0
% 4 12,000
Makardi 1 3,000 9.1% 10 30,000 90.9% 11 33,000 Nauagaon 0 0 0.0% 6 18,000 100.0
% 6 18,000
Nischintapur 4 12,000 9.4% 33 115,000 90.6% 37 127,000 Rangchi 4 13,000 9.2% 39 128,000 90.8% 43 141,000 Sanua 12 40,000 29.2% 30 97,000 70.8% 42 137,000 Satur 0 0 0.0% 4 12,000 100.0
% 4 12,000
Shishua 1 3,000 25.0% 3 9,000 75.0% 4 12,000 Sub-total= 66 209,000 17.3% 306 996,000 82.7% 372 1,205,00
0 Cumulative by Oct 10 303 975,000 16.0% 1,565 5,108,000 84.0% 1,868 6,083,00
0

3rd_Operational_Report_May_Oct_10_TH-2[1], Page 41 of 75
Figure 2.1.1-4: Financial assistance status to underprivileged members
0
100
200
300
400
500
600M
ale
Fem
ale
Tota
l
Mal
e
Fem
ale
Tota
l
Mal
e
Fem
ale
Tota
l
Mal
e
Fem
ale
Tota
l
1 Dec'07 to 30 Apr'09
1 May'09 to 31 Oct'09
1 Nov'09 to 30 Apr'10
1 May'10 to 31 Oct'10
No.
Period/Sex
Figure 1: Financial assistance to UPV by number and sex
020406080
100120
1 Dec'07 to 30 Apr'09
1 May'09 to 31 Oct'09
1 Nov'09 to 30 Apr'10
1 May'10 to 31 Oct'10
No
of F
emal
e M
embe
r
Figure 2: Trend of FA to UPV in no. to female member
0.050000.0
100000.0150000.0200000.0250000.0300000.0350000.0
1 Dec'07 to 30 Apr'09
1 May'09 to 31 Oct'09
1 Nov'09 to 30 Apr'10
1 May'10 to 31 Oct'10
Tk.
Figure 3: Trend of FA to UPV female member in BDT

3rd_Operational_Report_May_Oct_10_TH-2[1], Page 42 of 75
Table 2.1.10: Showing AIG status under major domain category
Domain Male Female Total % Small business 1381 226 1608 66.80 Agriculture 537 77 614 25.50 Poultry & Duckery 70 33 103 4.27 Livestock 51 23 75 3.10 Handicrafts 4 5 8 0.34 Total 2043 364 2407 100.00
Table 2.1.11: Most popular sub-domain AIG categories
Domain Sub-domain Popular AIG Sub-Domain
Female Male Total Agriculture Fish Business 0 12 7
Fishing boat 0 3 1 High yield variety 60 405 421 Lease Agriculture 0 8 1 Local variety 11 90 84 Potato cultivation 0 3 1 Rice Business 3 4 3 Soyabeen 3 4 3 Soyabeen cultivation 0 8 5 Total 77 537 526
Handicrafts Bamboo 1 0 1 Mat 0 2 2 Sewing Machine 2 0 1 Tailoring 2 0 2 Wood Business 0 2 1 Total 5 4 7
Livestock Chicken rearing 1 0 1 Cow 9 19 23 Duck rearing 8 5 10 Goat 2 19 19 Sheep 3 8 11 Total 23 51 64
Poultry & Duckery Cake preparation 0 2 1
0.0
500000.0
1000000.0
1500000.0
2000000.0
1 Dec'07 to 30 Apr'09
1 May'09 to 31 Oct'09
1 Nov'09 to 30 Apr'10
1 May'10 to 31 Oct'10
Tk.
Figure 4: Overall trend of FA to UPV in BDT

3rd_Operational_Report_May_Oct_10_TH-2[1], Page 43 of 75
Domain Sub-domain Popular AIG Sub-Domain
Female Male Total Chicken rearing 22 44 57 Duck rearing 11 24 30 Total 33 70 88
Small business Barki boat 1 5 3 Beetle leave and nut Business 0 9 7 Boat 0 3 1 Chai in selected beel 0 10 6 Chicken rearing 2 9 7 Cow 0 2 1 Daitta 0 2 1 Egg Business 0 2 1 Fertilizer Business 0 2 1 Fish Business 11 202 170 Fish Drying Business 0 6 4 Fishing boat 59 651 617 Fishing boat & Chai 0 7 6 Fishing boat & chai 0 2 1 Fishing boat & Chai 0 3 2 Fishing net 10 107 106 Fried rice business 0 5 5 Fuel Business 2 11 13 Grocer's Shop 50 117 147 Hawker 14 23 33 High yield variety 1 4 5 Local variety 0 1 1 Medicine shop 3 17 16 Milk Business 0 1 1 Prawn Business 0 1 1 Rice Business 45 113 140 Rice mill 0 2 2 Sweet shop 0 9 9 Tailoring 5 7 11 Tea stall 2 22 20 Transportation by boat 20 13 26 Vegetables 1 4 5 Wood Business 0 9 9
Total 226 1,381 1,378 Grand Total 364 2,043 2,407

3rd_Operational_Report_May_Oct_10_TH-2[1], Page 44 of 75
Diagram 2.1.2: Showing sample of final version of PRMP calendar
AMÖnvqY 1417b‡f¤i 2010
10 AMÖnvqY eyaevi 24 b‡f¤i
11 AMÖnvqY e„n¯úwZevi 25 b‡f¤i
12 AMÖnvqY ïµevi 26 b‡f¤i
13 AMÖnvqY kwbevi 27 b‡f¤i
mvßvwnK mfv Rvgvjcyi, Rqkªx, M‡oiMvuI,
ejvBKvw›`, mvZzi, iv‡R›`ªcyi, wLw`icyi, evKvZjv, eskxKzÛv, mvD_cvov
gvwmK mfv
‡Mvjvevox, K…ócyi, nvZcvUb, AvgZicyi, ‡ZiNi
mvßvwnK Kgx© mfv mvßvwnK QywU
Qwe
mvßvwnK mfv gBqvRyix, B›`ªcyi, kªxqviMvuI, Rxebcyi, ‡gvqv‡¾gcyi, `vwZqvcvov, gv‡SiQov,
evmvDov, KvKinvwU, Kvw˩Kcyi
gvwmK mfv Kvgvjcyi, ivgwmsncyi, exiwmsncvov,
‡fvjvMÄ
14 AMÖnvqY iweevi 28 b‡f¤i
15 AMÖnvqY ‡mvgevi 29 b‡f¤i
16 AMÖnvqY g½jevi 30 b‡f¤i
mvßvwnK mfv cvwbqvLvwj, Kvgbvcvov,
wQjvbxZvwnicyi, RvbRvBj, gvwbKwLjv, isPx, wkïqv, iƒcbMi, ‡bvqvMvI
gvwmK mfv
gw›`qvZv, m‡š—vlcyi, Nvmx, Rqcyi, ivgcyi
mvßvwnK mfv Rqcyi, g`bcyi, we‡bv`cyi, ‡bvqvMvuI, Dw_qviMvuI, cvUvcyKv, fvÛviPvci,
gvKow`, ‡Mvjvccyi, ‡bvqve›`, BQvgvwi
gvwmK mfv bevecyi, ûKzgcyi, wbwðš—cyi,
ev½vjwfUv
mvßvwnK mfv ex‡i›`ªbMi, gyRivB, fyivNvU, gvngy cyi, jvgvMvuI, Wygvj, fevbxcyi, †MvjMvI,
Avgvbxcyi, mvbyqv, evÆv
gvwmK mfv iZbcyi, kxecyi, KvDnvbx, bevecyi
Qwe
Kg© cwÄKv Uvs¸qvi nvIo mgvRwfwËK †UKmB e¨e¯’vcbv Kg©m~Px
AskMÖnYg~jK m¤ú` e¨e ’vcbv cwiKíbv 1417 e½vã 2010-2011 Lªxóvã
G mßv‡ni ¸i“Z¡c~Y© Kg©KvÛ
cÖwk¶Y - 2q avc K…wl cÖwk¶Y D‡Øvab bjLvMov ebvqb I wej cybtLbb RvZxq ivgmvi Rjvfywg †bUIqvK© ˆZwi evRvi m¤cÖmviY I Dbœqb PvB‡qi †UÛvi Av‡qvRb
gvwmK mfvi Av‡jvP¨ welqmg~n
2q avc K…wl cÖwk¶Y wej wfwËK PvB evwYwR¨K grm¨ AvniY Kvh©µg n —wkí I ¶z ª e¨emvi Avw_©K mnvqZv
‡bvU
Diagram 2.1.2: Showing sample of final version of PRMP calendar

3rd_Operational_Report_May_Oct_10_TH-2[1], Page 45 of 75
PDF attachment 2.2.1: Showing Copy of Intra-Ministerial Meeting Minutes

3rd_Operational_Report_May_Oct_10_TH-2[1], Page 46 of 75

3rd_Operational_Report_May_Oct_10_TH-2[1], Page 47 of 75

3rd_Operational_Report_May_Oct_10_TH-2[1], Page 48 of 75

3rd_Operational_Report_May_Oct_10_TH-2[1], Page 49 of 75

3rd_Operational_Report_May_Oct_10_TH-2[1], Page 50 of 75

3rd_Operational_Report_May_Oct_10_TH-2[1], Page 51 of 75

3rd_Operational_Report_May_Oct_10_TH-2[1], Page 52 of 75
Table 2.2.1: Showing community actions against fish poachers
SL #
Description
Status by
April 2009
Progress during
October 2009
Progress during April 2010
Progress during
October 2010
Cumulative Progress
by October 2010
1. Nos. of actions against fish poaching independently by community
12 NA 32 0 44
2. No of actions against fish poaching by community jointly with project staff
24 NA 40 2 66
3. Nos. of actions against fish poaching by community jointly with Magistrate
0 NA 29 2 31
4. Tentative price of illegal gears captured during action
200,000 NA 750,000 45,000 995,000
5. Person-days orientation on fish harvest modality to the members of law enforcing agencies working in Tanguar Haor.
0 NA 40 NA 40
6. Person-days orientation on fish harvest modality to the members of district administration working in Tanguar Haor.
0 NA 13 NA 13
Table 2.2.2: Showing list of proposed perennial beels for CFH 2011
SN# Name of the beels
1. Hatirgatha 2. Mohishergatha 3. Chattainnya 4. Noihal 5. Ainna 6. Paglakona 7. Eraillakona 8. Sattarkuri 9. Pannar beel 10. Berbaria 11. Lechuamara 12. Najarkhali 13. Somsar 14. Golgolia 15. Goinnakuri 16. Rowa beel (outside of 60% no fishing zone) 17. Rupaboi beel (outside of 60% no fishing zone) 18. Ballardhoba beel (outside of 60% no fishing zone) 19. Tekunnia beel (outside of 60% no fishing zone) 20. Alam duar (outside of 60% no fishing zone)

3rd_Operational_Report_May_Oct_10_TH-2[1], Page 53 of 75
Figure 2.2.1: Showing draft tender notice with conditions for CFH 2011

3rd_Operational_Report_May_Oct_10_TH-2[1], Page 54 of 75
Table 2.2.3: Showing list of proposed spots for beel based chai fishing
µ bs g~j wej I we‡ji As‡ki bvg
Dc‡Rjv PvB emv‡bvi Rb¨ wbwÏó mxgvbv/ ’v‡bi †PŠnwÏ c~e© cÖvš— cwðg cÖvš— DËi cÖvš— `w¶Y cÖvš—
1. mgmvi wej 2. c~e© cvk¦© Zvwnicyi bevecy‡ii
K¨v¤ú ‡bŠKvi`viv PzbLyjvwe‡ji eªxR cvUbvBb`x I
ˆeVvLvjx w&ej 3. cwðg cvk¦© Zvwnicyi ‡bŠKvi`viv bvwc‡Zi`viv
Kv›`v KjvMvI ˆeVvLvjx w&ej
4. GivBjv‡Kvbv wej (Pvicvk)
Zvwnicyi Kv›`v wnRjevM evMjxQov Kv›`v
5. MBb¨vKzwi wej (Pvicvk) Zvwnicyi gw›`qvZv iDqvi Kv›`v GivBj¨v‡Kvbvi Kv›`v
cvUbvBb`x
6. Lv¾vDwi/Rqcy‡ii wej (Pvicvk)
Zvwnicyi cvUbvBb`x bqnvjwej Rqcyi MÖvg cvbvwej
7. ‡Mvj‡Wvev wej 8. c~e© cvk¦© Zvwnicyi cvUbvBb`x LvB¾¨vDwii
Kv›`v LvB¾¨vDwii Kv›`v
cvUbvBb`x
9. e¨vmLvjx wej (Pvicvk) Zvwnicyi cvUbvBb`x †Mvj‡Wvevi Kv›`v
cvUbvBb`x cvUbvBb`x
10. cvbv - BKi`vBi wej Zvwnicyi cvUbvB b`x ‡Mvj‡Wvevi Kv›`v
cvUbvB b`x cvUbvB b`x
11. Uvb †j”Pzqv wej Zvwnicyi wnRjevM ‡jPzqvgviv Web`cyi Kv›`v 12. mvËviKzwi wej Zvwnicyi iƒcveBKv›`v Kjgvi‡UK iƒcveBwej MjMwjqviKv›`v 13. LBj¨vi wej Zvwnicyi MBb¨vKzwi jvgvi¸j Gi¨vjv‡Kvbvi
Kv›`v iDqv
14. nvwZigviv wej Zvwnicyi KvjviUzK Kv›`v
bjKvwV ej¨viWyev AvBb¨v
15. gywÝAvjx wej Zvwnicyi IƒcveB Mvs KvjviUzK D°ziv Kv›`v mËviKywii eva 16. MjMBj¨v wej Zvwnicyi LvjMvs QËviKzwi iƒcveB ivgwmsncy‡ii Kv›`v 17. cvwbWyev wej Zvwnicyi KvDqvi Lv‡ji
Kv›`v Kvwji‡`e wej bqnvj ivgwmsncy‡ii Kv›`v
18. KvDqvi Lv‡ji wej Zvwnicyi bZzb b`x cvwbiWyevi Kv›`v
ivRbMi wej bZzb b`x
19. ivsMvgvBƨv wej Zvwnicyi B›`ªcyi Mªvg evs&MvjwfUv wek¦‡ivW ‡ei‡ewiqvi Kv›`v 20. bvBb`¨v wej Zvwnicyi ‡jPzqvgvivi
Kv›`v ‡ei‡ewiqvi Kv›`v
Uv‡bi ¸‡ji Kv›`v ‡jPzqvgvivi Kv›`v
21. gv‡Si ¸Bj wej Zvwnicyi iZbcyi B›`ªcy‡ii Kv›`v we‡i›`ªbMi evRvi ‡jPzqvgvivi Kv›`v 22. nvRsLvjx wej
(†mvbveyB) Zvwnicyi iƒcveyB KvjviUz‡Ki
Kv›`v D°zivi Kv›`v iƒcveyB
23. bvwRi`viv - ˆeVvLvjx wej
Zvwnicyi ‰eVvLvjxi Kv›`v ‰eVvLvjxi cwð‡gi Avdi
gvwj‡Ki †Wvev cvUbvBb`x
24. wRiZjvi ¸c wej Zvwnicyi mgmvi wej evMjx Qov KjvMvI mgmvi Kv›`v 25. PzbLjv-wej Zvwnicyi ‡U‡KiNv‡Ui
iv Ív Pzb‡Lvjvi eªxR cvnvo KvBc‡_i iv¯Ív
26. evMgvivi ¸c Zvwnicyi `wokªxi Kv›`v PUvb¨vi Lvj bRiLvjxi`viv LvjMvs 27. cyivbev‡Mi †Wvev Zvwnicyi LvjMvs iDqvwej MBb¨vKzwii Kv›`v iDqv 28. ivRbMi wej Zvwnicyi L¾¨vDwii
Kv›`v bqnvj wej LvjMvs KvDqvi Lvj
29. MRvwiqvi we‡ji DËicvk
Zvwnicyi MBb¨vKzwii Avdi
‡jPzqvgvivi Kv›`v
dBjvi we‡ji Kv›`v
MRvwiqv
30. Dˇii `vBo Zvwnicyi MBb¨vKzwii MRvwiqvi Kv›`v dBjvi we‡ji cyivbMÖv‡gi Kv›`v

3rd_Operational_Report_May_Oct_10_TH-2[1], Page 55 of 75
µ bs g~j wej I we‡ji As‡ki bvg
Dc‡Rjv PvB emv‡bvi Rb¨ wbwÏó mxgvbv/ ’v‡bi †PŠnwÏ c~e© cÖvš— cwðg cÖvš— DËi cÖvš— `w¶Y cÖvš—
Avdi Kv›`v 31. PUvb¨vi Qov Zvwnicyi iDqvi Kv›`v iƒcvey‡qi Kv›`v ‡jPzqvgviv PuvBb¨vwej 32. †jPzqvgvivi Pvwicvk Zvwnicyi iDqvi Kv›`v nvwZiMvZv
Lv‡ji Kv›`v bvBb¨vi Kv›`v bvI`viv
33. mvgmvMi wej ag©cvkv ‡ei‡ewiq AvgZicyi BQvgvix ‡ZKzwbqv Kv›`
34. Uvb †ei‡ewiqv wej ag©cvkv
35. c~e© cvk¦© ag©cvkv iƒcbMi MÖvg msjMœ (Kvjvwgqv nB‡Z PwK`vi ch©š—)
36. cwðg cvk¦© ag©cvkv evKvZjv MÖvg msjMœ (PwK`vi nB‡Z bvI`viv ch©š—)
37. DËi cvk¦© ag©cvkv gv‡SiQov I ev½vjwfUv MÖvg msjMœ (bvI`viv nB‡Z ev½vjwfUv ch©š—)
38. `w¶Y cvk¦© ag©cvkv B›`ªcyi MÖvg msjMœ (ev½vjwfUv nB‡Z B›`ªcyi ch©š—)
39. ‡mvbvWywe wej ag©cvkv
40. DËi cvk¦© ag©cvkv ‡ZKyBbœv Qovi cvi 500 wgUvi 500 wgUvi
41. `w¶Y cvk¦© ag©cvkv ‡ZKyBbœv gy³vi Lvj cx‡ii †¶Z isPxi Kv›`v
42. evbwej (iswP) ag©cvkv jvgvi wej isPx ‡mvbvWywei Kv›`v nvRivhvwb
43. bjKvwV wej ag©cvkv `xwNicvo ‡ZKzBbœv Kv›`v DPv Kv›`v Avwbœi Kv›`v
44. DËi cvk¦© ag©cvkv KvwKqvi †Uvc bjKvwV evjvi‡Wvev `w¶b nvwZgviv
45. `w¶Y cvk¦© ag©cvkv KvwKqvi †Uvc AvBbœvi `vi DËi nvwZgviv AvBbœvi Kv›`v
46. Qovwej ag©cvkv AvgZicyi ‡Mvjvccyi Qovicvo Qovi Rv½vj
47. Avgm‡ii wej ag©cvkv ‡ei‡ewiqvi cvo
ivgmvMi ‡ei‡ewiqv Kv›`v ‡ZKzBbœv wej
48. ‡Mvj‡Wvev (iswP) ag©cvkv evjvi‡Wvev ‡ZKzBbœ Mvs nvwZgviv Kv›`v AvBbœv Kv›`v/`xwNi cvo

3rd_Operational_Report_May_Oct_10_TH-2[1], Page 56 of 75
Figure 2.2.2: Showing draft tender notice with conditions for beel based chai fishing
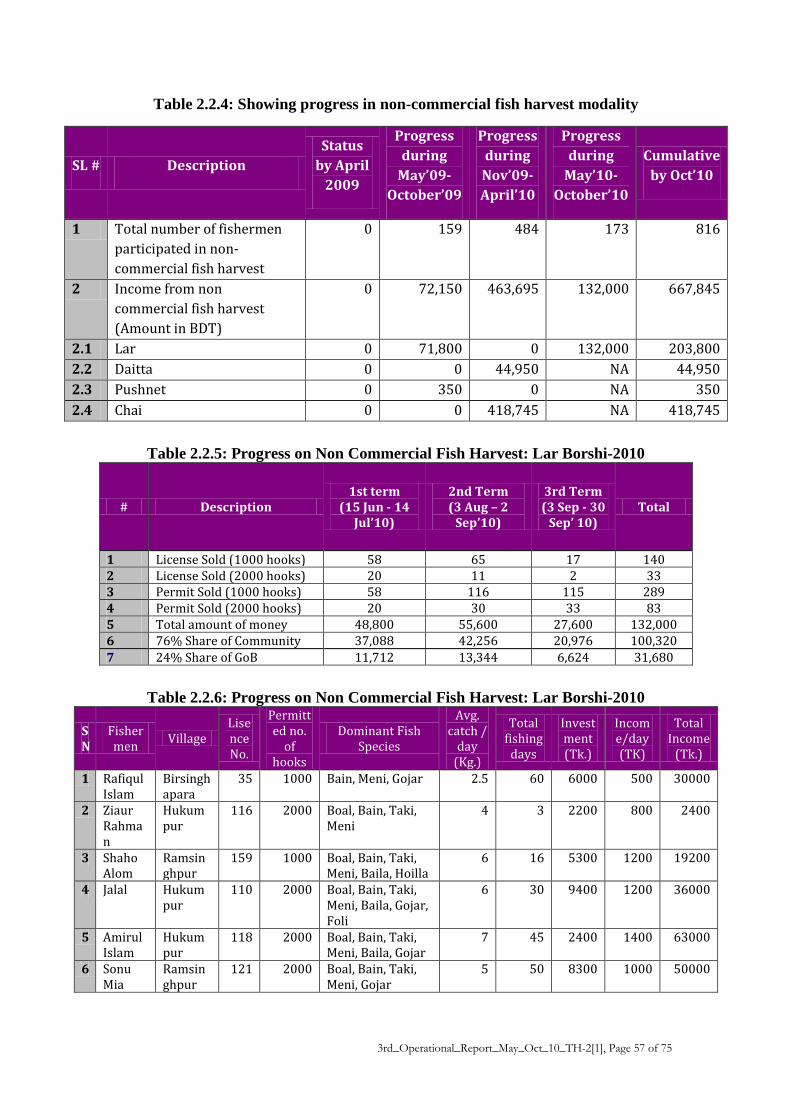
3rd_Operational_Report_May_Oct_10_TH-2[1], Page 57 of 75
Table 2.2.4: Showing progress in non-commercial fish harvest modality
SL # Description Status
by April 2009
Progress during
May’09-October’09
Progress during Nov’09-April’10
Progress during
May’10-October’10
Cumulative by Oct’10
1 Total number of fishermen participated in non-commercial fish harvest
0 159 484 173 816
2 Income from non commercial fish harvest (Amount in BDT)
0 72,150 463,695 132,000 667,845
2.1 Lar 0 71,800 0 132,000 203,800 2.2 Daitta 0 0 44,950 NA 44,950 2.3 Pushnet 0 350 0 NA 350 2.4 Chai 0 0 418,745 NA 418,745
Table 2.2.5: Progress on Non Commercial Fish Harvest: Lar Borshi-2010
# Description 1st term
(15 Jun - 14 Jul’10)
2nd Term (3 Aug – 2
Sep’10)
3rd Term (3 Sep - 30
Sep’ 10) Total
1 License Sold (1000 hooks) 58 65 17 140 2 License Sold (2000 hooks) 20 11 2 33 3 Permit Sold (1000 hooks) 58 116 115 289 4 Permit Sold (2000 hooks) 20 30 33 83 5 Total amount of money 48,800 55,600 27,600 132,000 6 76% Share of Community 37,088 42,256 20,976 100,320 7 24% Share of GoB 11,712 13,344 6,624 31,680
Table 2.2.6: Progress on Non Commercial Fish Harvest: Lar Borshi-2010
SN
Fishermen Village
Lisence No.
Permitted no.
of hooks
Dominant Fish Species
Avg. catch /
day (Kg.)
Total fishing
days
Investment (Tk.)
Income/day (TK)
Total Income
(Tk.)
1 Rafiqul Islam
Birsinghapara
35 1000 Bain, Meni, Gojar 2.5 60 6000 500 30000
2 Ziaur Rahman
Hukumpur
116 2000 Boal, Bain, Taki, Meni
4 3 2200 800 2400
3 Shaho Alom
Ramsinghpur
159 1000 Boal, Bain, Taki, Meni, Baila, Hoilla
6 16 5300 1200 19200
4 Jalal Hukumpur
110 2000 Boal, Bain, Taki, Meni, Baila, Gojar, Foli
6 30 9400 1200 36000
5 Amirul Islam
Hukumpur
118 2000 Boal, Bain, Taki, Meni, Baila, Gojar
7 45 2400 1400 63000
6 Sonu Mia
Ramsinghpur
121 2000 Boal, Bain, Taki, Meni, Gojar
5 50 8300 1000 50000

3rd_Operational_Report_May_Oct_10_TH-2[1], Page 58 of 75
Figure 2.2.3: Showing map of proposed TH boundary

3rd_Operational_Report_May_Oct_10_TH-2[1], Page 59 of 75
Annex-3: Leadership Status Figure 3.1: Comparative status of community leaders at different tires
45
1
45
0 1
62
8
74
18
72
8
72
28
48
0 0 0 0 0
1020304050607080
EC EC GB EC GB
Village Union Central
Famale leadership at different tires
by Apr'09
by Oct'09
by Apr'10
by Oct'10
190
35
231
936
233
28
331
829
293
28
293
627
171
0 0 0 0 0
50
100
150
200
250
300
350
EC EC GB EC GB
Village Union Central
Male leadership at different tires
by Apr'09
by Oct'09
by Apr'10
by Oct'10

3rd_Operational_Report_May_Oct_10_TH-2[1], Page 60 of 75
Figure 3.2: View of monthly meeting as per newly introduced profession based modality
VCC monthly meeting sitting arrangement by profession VCC monthly meeting is going on
235
36
276
937
295
36
405
937
365
36
365
936
219
0 0 0 0 0
50100150200250300350400450
EC EC GB EC GB
Village Union Central
Total number of leadership at different tires of TH
by Apr'09
by Oct'09
by Apr'10
by Oct'10
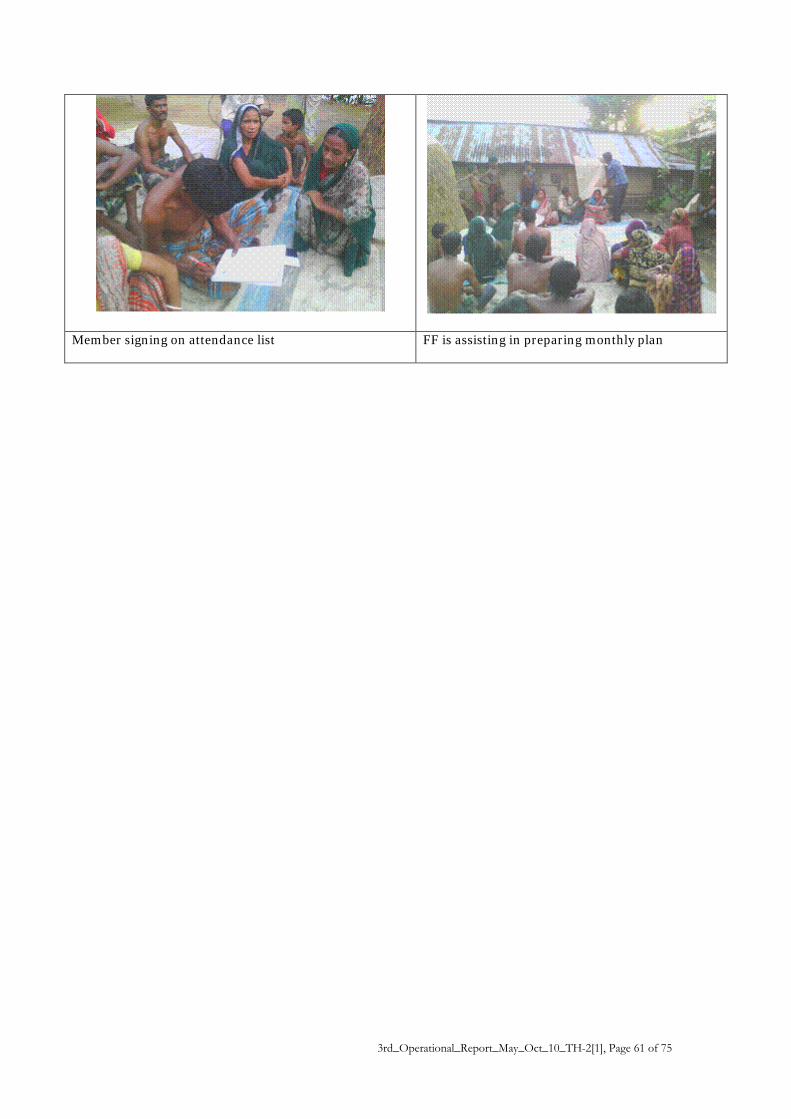
3rd_Operational_Report_May_Oct_10_TH-2[1], Page 61 of 75
Member signing on attendance list FF is assisting in preparing monthly plan

3rd_Operational_Report_May_Oct_10_TH-2[1], Page 62 of 75
Annex-4: Status of Functional VCC by Oct’10
Figure 4.1: Status of functional VCC
Table 4.1: Coverage of VCC and village by union
Union Village No. VCC
Coverage Indicator (Target) Coverage Indicator (Target) Uttar Sreepur 22 33 19 27 Dakshin Sreepur 20 20 20 20 Uttar Bangshi-kunda 14 15 14 14 Dakshin Bangshi-kunda 20 20 20 20
Total 76 88 73 81

3rd_Operational_Report_May_Oct_10_TH-2[1], Page 63 of 75
Annex-5: HH coverage and membership status by sex Table 5.1: Status of House Hold and Membership Coverage
Union Village Committee
Cens
us H
H 1 Dec'07 - 30 Apr'09 (Phase 1) 1 May'09 - 30 Oct'09 (Phase
2) 1 Nov'09 - 30 Apr'10 (Phase 2) 1 May'10 - 31 Oct'10 (Phase
2) Cumulative
HH Coverage Membership HH Coverage Membership HH Coverage Membership HH Coverage Membership HH Coverage Membership
MH
FH
T M F T MH
FH
T M F T MH
FH
T M F T MH
FH
T M F T MH
FH
T M F T
Uttar Sreepur
Bhoraghat 84 28 2 30 21 10 31 1 0 1 0 1 1 0 0 0 0 0 0 21 1 22 17 5 22 50 3 53 38 16 54
Binodpur 85 48 0 48 46 7 53 0 0 0 0 0 0 7 0 7 13 0 13 3 0 3 4 0 4 58 0 58 63 7 70
Birendranagar 272 47 1 48 47 4 51 3 0 3 3 0 3 2 0 2 4 0 4 0 0 0 0 0 0 52 1 53 54 4 58
Chiragaon 67 44 0 44 43 6 49 0 0 0 0 0 0 0 0 0 0 0 0 0 0 0 0 0 0 44 0 44 43 6 49
Golabari 29 26 2 28 38 4 42 0 0 0 0 0 0 0 0 0 0 0 0 4 0 4 0 6 6 30 2 32 38 10 48
Indrapur 134 90 2 92 86 9 95 0 0 0 0 0 0 3 0 3 4 1 5 13 0 13 11 2 13 106 2 108 101 12 113
Jamalpur 116 49 1 50 31 23 54 0 0 0 0 0 0 1 0 1 1 0 1 13 0 13 9 4 13 63 1 64 41 27 68
Joipur 52 43 1 44 48 6 54 2 0 2 3 0 3 1 0 1 1 0 1 0 0 0 0 0 0 46 1 47 52 6 58
Kamalpur 34 0 0 0 0 0 0 30 0 30 24 6 30 1 0 1 1 0 1 0 0 0 0 0 0 31 0 31 25 6 31
Kamonapara 42 23 2 25 9 23 32 0 0 0 0 0 0 1 0 1 3 0 3 10 0 10 5 7 12 34 2 36 17 30 47
Mandiata 155 89 2 91 99 16 115 6 0 6 7 0 7 5 0 5 6 0 6 1 0 1 1 0 1 101 2 103 113 16 129
Modonpur 45 0 0 0 0 0 0 0 0 0 0 0 0 19 8 27 20 9 29 8 1 9 4 6 10 27 9 36 24 15 39
Moihiajuri 46 32 0 32 36 11 47 1 0 1 2 0 2 0 0 0 0 0 0 3 0 3 3 0 3 36 0 36 41 11 52
Mujrai 44 36 0 36 36 24 60 0 0 0 0 0 0 0 0 0 0 0 0 12 0 12 12 1 13 48 0 48 48 25 73
Nobabpur 59 28 0 28 32 4 36 0 0 0 0 0 0 3 0 3 3 0 3 7 0 7 7 0 7 38 0 38 42 4 46
Paniakhali 49 5 0 5 5 0 5 0 0 0 0 0 0 17 0 17 22 1 23 0 0 0 0 0 0 22 0 22 27 1 28
Ratanpur 250 68 0 68 60 22 82 0 0 0 0 0 0 1 0 1 4 1 5 0 0 0 0 0 0 69 0 69 64 23 87
Silani Tahirpur 98 68 0 68 67 2 69 5 0 5 3 3 6 0 0 0 0 0 0 0 0 0 0 0 0 73 0 73 70 5 75
Teroghar 48 0 0 0 0 0 0 0 0 0 0 0 0 13 18 31 11 22 33 0 0 0 0 0 0 13 18 31 11 22 33
Dakshin
Bhabanipur 54 0 0 0 0 0 0 0 0 0 0 0 0 19 8 27 21 9 30 2 0 2 2 0 2 21 8 29 23 9 32
Bolaikandi 28 0 0 0 0 0 0 0 0 0 0 0 0 16 3 19 19 12 31 6 0 6 6 1 7 22 3 25 25 13 38

3rd_Operational_Report_May_Oct_10_TH-2[1], Page 64 of 75
Union Village Committee
Cens
us H
H 1 Dec'07 - 30 Apr'09 (Phase 1) 1 May'09 - 30 Oct'09 (Phase
2) 1 Nov'09 - 30 Apr'10 (Phase 2) 1 May'10 - 31 Oct'10 (Phase
2) Cumulative
HH Coverage Membership HH Coverage Membership HH Coverage Membership HH Coverage Membership HH Coverage Membership
MH
FH
T M F T MH
FH
T M F T MH
FH
T M F T MH
FH
T M F T MH
FH
T M F T
Sreepur
Dumal 98 65 0 65 65 9 74 8 0 8 18 8 26 0 0 0 0 0 0 0 0 0 0 0 0 73 0 73 83 17 100
Gorergaon 20 0 0 0 0 0 0 11 0 11 10 5 15 0 0 0 0 0 0 0 0 0 0 0 0 11 0 11 10 5 15
Hukumpur 81 55 2 57 49 8 57 2 0 2 5 0 5 1 0 1 2 0 2 2 0 2 2 0 2 60 2 62 58 8 66
Jangail 32 21 1 22 23 1 24 0 0 0 0 0 0 1 0 1 1 0 1 1 0 1 1 0 1 23 1 24 25 1 26
Jibonpur 18 0 0 0 0 0 0 0 0 0 0 0 0 15 1 16 17 5 22 1 0 1 0 1 1 16 1 17 17 6 23
Joyasree 78 44 0 44 42 4 46 2 0 2 2 0 2 0 0 0 1 0 1 0 0 0 0 0 0 46 0 46 45 4 49
Keshtopur 42 39 0 39 39 2 41 1 0 1 1 0 1 0 0 0 5 0 5 0 0 0 0 0 0 40 0 40 45 2 47
Lamagaon 344 159 2 161 158 6 164 31 1 32 41 1 42 4 1 5 7 1 8 0 0 0 0 0 0 194 4 198 206 8 214
Mahmoodpur 196 63 0 63 63 4 67 7 0 7 10 2 12 1 0 1 2 0 2 0 0 0 0 0 0 71 0 71 75 6 81
Manik Khila 218 165 5 170 165 12 177 2 0 2 1 1 2 0 0 0 0 0 0 0 0 0 0 0 0 167 5 172 166 13 179
Moazzampur 58 0 0 0 0 0 0 0 0 0 0 0 0 30 15 45 31 16 47 0 0 0 0 0 0 30 15 45 31 16 47
Nouagaon 59 0 0 0 0 0 0 38 2 40 28 14 42 4 0 4 5 0 5 0 0 0 0 0 0 42 2 44 33 14 47
Patabuka 311 82 1 83 57 27 84 3 1 4 1 3 4 3 1 4 3 1 4 6 0 6 6 0 6 94 3 97 67 31 98
Ramshinghapur 118 58 3 61 53 8 61 4 0 4 7 0 7 6 1 7 9 3 12 1 0 1 0 1 1 69 4 73 69 12 81
Santospur 60 0 0 0 0 0 0 0 0 0 0 0 0 37 12 49 37 15 52 16 0 16 12 7 19 53 12 65 49 22 71
Shibpur 24 0 0 0 0 0 0 0 0 0 0 0 0 13 8 21 15 12 27 7 0 7 8 1 9 20 8 28 23 13 36
Utiargaon 53 0 0 0 0 0 0 42 2 44 35 12 47 0 0 0 0 0 0 1 0 1 1 0 1 43 2 45 36 12 48
Vandar Chapar 36 24 0 24 22 3 25 2 0 2 2 2 4 0 0 0 0 0 0 0 0 0 0 0 0 26 0 26 24 5 29
Uttar Bangshi-kunda
Antarpur 71 51 0 51 48 3 51 0 0 0 1 0 1 4 0 4 9 1 10 1 0 1 1 0 1 56 0 56 59 4 63
Bakatala 254 63 0 63 62 3 65 10 0 10 8 3 11 11 2 13 13 3 16 2 0 2 2 0 2 86 2 88 85 9 94
Bangalvita 118 52 0 52 43 12 55 2 0 2 2 0 2 0 0 0 2 0 2 0 0 0 0 0 0 54 0 54 47 12 59
Bholaganj 65 0 0 0 0 0 0 22 0 22 25 0 25 0 0 0 0 0 0 6 0 6 7 0 7 28 0 28 32 0 32
Golappur 96 64 3 67 54 15 69 0 0 0 2 0 2 0 1 1 8 2 10 56 2 58 23 59 82 120 6 126 87 76 163
Golgaon 125 36 2 38 34 4 38 0 0 0 0 0 0 0 0 0 0 0 0 26 0 26 9 18 27 62 2 64 43 22 65

3rd_Operational_Report_May_Oct_10_TH-2[1], Page 65 of 75
Union Village Committee
Cens
us H
H 1 Dec'07 - 30 Apr'09 (Phase 1) 1 May'09 - 30 Oct'09 (Phase
2) 1 Nov'09 - 30 Apr'10 (Phase 2) 1 May'10 - 31 Oct'10 (Phase
2) Cumulative
HH Coverage Membership HH Coverage Membership HH Coverage Membership HH Coverage Membership HH Coverage Membership
MH
FH
T M F T MH
FH
T M F T MH
FH
T M F T MH
FH
T M F T MH
FH
T M F T
Isamari 95 0 0 0 0 0 0 24 0 24 24 1 25 1 0 1 1 0 1 2 0 2 1 1 2 27 0 27 26 2 28
Kartikpur 352 65 0 65 64 1 65 4 0 4 3 1 4 1 2 3 1 3 4 27 1 28 22 13 35 97 3 100 90 18 108
Majhersara 118 72 6 78 65 21 86 1 0 1 0 1 1 0 0 0 0 0 0 1 0 1 1 0 1 74 6 80 66 22 88
Nababpur 86 55 0 55 55 3 58 1 0 1 2 0 2 0 0 0 1 1 2 0 0 0 0 0 0 56 0 56 58 4 62
Rajendrapur 40 29 0 29 28 3 31 0 0 0 0 0 0 2 0 2 4 0 4 0 0 0 0 0 0 31 0 31 32 3 35
Rampur 136 36 0 36 35 2 37 0 0 0 0 0 0 4 0 4 6 2 8 8 1 9 7 2 9 48 1 49 48 6 54
Rupnagar 431 80 0 80 78 5 83 5 0 5 7 0 7 92 1 93 118 0 118 6 0 6 6 0 6 183 1 184 209 5 214
Southpara 70 0 0 0 0 0 0 0 0 0 0 0 0 64 6 70 64 6 70 0 0 0 0 0 0 64 6 70 64 6 70
Dakshin Bangshi-kunda
Amanipur 101 0 0 0 0 0 0 35 0 35 36 2 38 7 3 10 8 6 14 6 1 7 5 2 7 48 4 52 49 10 59
Bangshikunda 257 57 1 58 59 5 64 5 0 5 11 0 11 7 1 8 9 1 10 6 0 6 2 4 6 75 2 77 81 10 91
Basaura 60 45 0 45 44 4 48 3 0 3 8 1 9 0 0 0 0 0 0 0 0 0 0 0 0 48 0 48 52 5 57
Batta 35 0 0 0 0 0 0 0 0 0 0 0 0 33 2 35 37 3 40 5 0 5 8 0 8 38 2 40 45 3 48
Birsinghapara 72 0 0 0 0 0 0 28 0 28 30 5 35 1 1 2 1 2 3 5 0 5 5 0 5 34 1 35 36 7 43
Datiapara 339 69 0 69 70 4 74 3 0 3 3 0 3 4 0 4 5 2 7 3 0 3 3 0 3 79 0 79 81 6 87
Ghashi 129 106 3 109 80 36 116 3 0 3 9 8 17 1 1 2 1 2 3 0 0 0 0 0 0 110 4 114 90 46 136
Hatpatol 116 57 2 59 44 25 69 0 0 0 0 0 0 3 0 3 7 1 8 9 0 9 9 0 9 69 2 71 60 26 86
Jaipur 126 0 0 0 0 0 0 49 0 49 47 2 49 0 0 0 2 2 4 13 0 13 12 3 15 62 0 62 61 7 68
Kakarhati 58 0 0 0 0 0 0 34 0 34 36 2 38 0 0 0 0 0 0 0 0 0 0 0 0 34 0 34 36 2 38
Kauhani 167 44 2 46 41 6 47 10 0 10 16 0 16 5 0 5 7 0 7 23 0 23 27 0 27 82 2 84 91 6 97
Khidirpur 75 0 0 0 0 0 0 45 0 45 50 2 52 2 1 3 3 0 3 6 0 6 3 5 8 53 1 54 56 7 63
Makardi 36 26 0 26 23 5 28 0 0 0 0 0 0 0 0 0 0 0 0 3 0 3 4 0 4 29 0 29 27 5 32
Nauagaon 86 0 0 0 0 0 0 0 0 0 0 0 0 44 0 44 47 0 47 0 0 0 0 0 0 44 0 44 47 0 47
Nischintapur 287 47 1 48 49 5 54 6 0 6 7 0 7 3 0 3 3 0 3 4 0 4 4 0 4 60 1 61 63 5 68
Noyaband 11 0 0 0 0 0 0 0 0 0 0 0 0 5 3 8 5 5 10 0 0 0 0 0 0 5 3 8 5 5 10

3rd_Operational_Report_May_Oct_10_TH-2[1], Page 66 of 75
Union Village Committee
Cens
us H
H 1 Dec'07 - 30 Apr'09 (Phase 1) 1 May'09 - 30 Oct'09 (Phase
2) 1 Nov'09 - 30 Apr'10 (Phase 2) 1 May'10 - 31 Oct'10 (Phase
2) Cumulative
HH Coverage Membership HH Coverage Membership HH Coverage Membership HH Coverage Membership HH Coverage Membership
MH
FH
T M F T MH
FH
T M F T MH
FH
T M F T MH
FH
T M F T MH
FH
T M F T
Rangchi 328 89 1 90 83 12 95 4 0 4 6 0 6 26 2 28 30 4 34 7 1 8 8 1 9 126 4 130 127 17 144
Sanua 110 82 6 88 76 17 93 0 0 0 0 0 0 0 0 0 0 0 0 1 0 1 1 0 1 83 6 89 77 17 94
Satur 118 0 0 0 0 0 0 0 0 0 1 6 7 31 2 33 33 3 36 0 0 0 0 0 0 31 2 33 34 9 43
Shishua 35 0 0 0 0 0 0 0 0 0 0 0 0 15 5 20 16 7 23 0 0 0 0 0 0 15 5 20 16 7 23
Total
8,2
40
2,7
24
54
2,7
78
2,5
75
44
6
3,0
21
49
5
6
50
1
53
7
92
62
9
59
0
10
9
69
9
70
9
16
4
87
3
36
4
8
37
2
28
1
15
0
43
1
4,1
73
17
7
4,3
50
4,1
02
85
2
4,9
54
Table 5.2: Cumulative progress by 31 October 2010 in HH coverage and membership
Union VCC Census HH
Cumulative Progress by 31 October 2010 HH Coverage Membership
Male Headed
Female Headed
Total HH
% of Male
Headed
% of Female Headed
HH Coverage (%) out
of Census
Male Female Total Member
% of Male
% of Female
Member distribution
by Union (%)
Uttar Sreepur 19 1709 941 41 982 95.8 4.2 57.5 912 246 1158 78.8 21.2 23.4 Dakshin Sreepur
20 1928 1121 70 1191 94.1 5.9 61.8 1110 217 1327 83.6 16.4 26.8
Uttar Bangshikunda
14 2057 986 27 1013 97.3 2.7 49.2 946 189 1135 83.3 16.7 22.9
Dakshin Bangshikunda
20 2546 1125 39 1164 96.6 3.4 45.7 1134 200 1334 85.0 15.0 26.9
Total 73 8240 4173 177 4350 95.9 4.1 52.8 4102 852 4954 82.8 17.2 100.0

3rd_Operational_Report_May_Oct_10_TH-2[1], Page 67 of 75
Annex-6: List of training and meetings in last six months (May-Oct 10) Training
No Description Date Total person-days Number of participant Organization From To
1. Staff Training 1. 3 Day Long Market Extension Training for Project Staffs - - 48 CNRS= 7, ERA= 7, PSMU= 02 CNRS, ERA, PSMU,
IC 2. 3 Day Long PRMP Co-facilitator Training for Selected
Community Members - - 54 Community members=16;
CNRS=1, ERA=1 CNRS, ERA, PSMU
Meeting
No. Description From To Days Number of Participant
Organization
1. Central co-management committee (EC) monthly meeting 23.06.10 23.06.10 01 22 CNRS, ERA, PSMU, CCC
2. Central co-management committee (GB) monthly meeting 24.06.10 24.06.10 01 38 CNRS, ERA, PSMU, CCC
3. Central co-management committee (GB) monthly meeting 02.07.10 03.07.10 02 35 CNRS, ERA, PSMU, CCC
4. Project Staff meeting 17.07.10 19.07.10 03 18 CNRS, ERA, PSMU,
5. Central co-management committee (GB) monthly meeting 04.08.10 04.08.10 01 55 CNRS, ERA, PSMU, CCC
6. Senior Project Staff meeting 04.09.10 04.09.10 01 15 CNRS, ERA, PSMU,
7. Central co-management committee (GB) monthly meeting 29.09.10 30.09.10 02 48 CNRS, ERA, PSMU, CCC
8. Central co-management committee (EC) monthly meeting 24.10.10 25.10.10 01 14 CNRS, ERA, PSMU, CCC
9. Central co-management committee (EC) monthly meeting 25.10.10 26.10.10 02 60 CNRS, ERA, PSMU, CCC

3rd_Operational_Report_May_Oct_10_TH-2[1], Page 68 of 75
Annex-7: Summary status of Social Capital Management (SCM) by union Description (A) SCM Status from 1 Dec'07 to 30
Apr'09 (B) SCM Status from 1 May'09 to 31
Oct'09 (C) SCM Status from 1 Nov'09 to 30
Apr'10 (D) SCM Status from 1 May' 31 Oct'10 G Total
(A+B+C+D)
US DS UB DB Total
(A) US DS UB DB Total
(B) US DS UB DB Total
(C) US DS UB DB Total
(D)
Member (N) 875 820 638 688 3021 52 209 80 288 629 127 249 245 252 873 104 49 172 106 431 4954
Borrower (N) 179 189 153 129 650 203 206 146 168 723 211 202 153 153 719 84 46 98 96 324 2416
Admimission Fee (Tk.)
17500 16400 12740 13720 60360 1060 4180 1600 5600 12440 2520 4960 4700 5160 17340 2300 940 3140 1980 8360 98500
Subscription (Tk.)
77750 63120 40914 39518 221302 39794 59948 28394 37750 165886 35202 38832 21002 32522 127558 33348 38680 24540 36078 132646 647392
Savings (Tk.) 393630 319170 282190 263145 1258135 198825 299680 140649 198900 838054 176496 195860 110847 168955 652158 167230 193560 124457 186030 671277 3419624
Principal (Tk.) 234150 255225 180600 204525 874500 375475 388850 292975 267625 1324925 492925 390250 341850 292050 1517075 519925 425400 372150 385150 1702625 5419125
Interest (Tk.) 2050 225 1875 9000 13150 25500 35325 15825 17325 93975 35650 32450 28200 15725 112025 66725 33600 45025 26850 172200 391350
Service charge (Tk.)
11936 11660 8564 9041 41201 3060 4923 2965 4660 15608 3114 4386 4190 4091 15781 2710 1649 3099 2153 9611 82201
Insurance (Tk.) 5720 5880 4710 4560 20870 7280 6740 5400 6120 25540 6480 6460 4150 4790 21880 3850 3740 3930 4120 15640 83930
Total Collection (Tk.)
742736 671680 531593 543509 2489518 650994 799646 487808 537980 2476428 752387 673198 514939 523293 2463817 796088 697569 576341 642361 2712359 10142122
Financial Assistance to Members (Tk.)
530000 567000 459000 395000 1951000 626000 657000 454000 546000 2283000 715000 682000 562000 509000 2468000 309000 165000 350000 317000 1141000 7843000
Savings Withdrawal (Tk.)
0 0 2990 0 2990 0 0 0 0 0 3720 880 500 5440 10540 910 31650 260 5830 38650 52180
Membership Withdrawal (Tk.)
4430 1150 11758 720 18058 4040 1150 6620 0 11810 0 0 5800 0 5800 4500 4340 2340 4710 15890 51558
Total Debit (Tk.)
534430 568150 473748 395720 1972048 630040 658150 460620 546000 2294810 718720 682880 568300 514440 2484340 314410 200990 352600 327540 1195540 7946738
Balance (Tk.) 208306 103530 57845 147789 517470 20954 141496 27188 -8020 181618 33667 -9682 -53361 8853 -20523 481678 496579 223741 314821 1516819 2195384

3rd_Operational_Report_May_Oct_10_TH-2[1], Page 69 of 75
Annex-8: Financial assistance status to the members by October 2010 Figure 8.1 – 8.4: Comparative analysis of financial assistance between different periods
0200400600800
Mal
e
Fem
ale
Tota
l
Mal
e
Fem
ale
Tota
l
Mal
e
Fem
ale
Tota
l
Mal
e
Fem
ale
Tota
l
1 Dec'07 to 30 Apr'09
1 May'09 to 31 Oct'09
1 Nov'09 to 30 Apr'10
1 May'10 to 31 Oct'10
No.
Period/Sex
Figure 1: Financial assistance by number and sex
0
20
40
60
80
100
120
140
1 Dec'07 to 30 Apr'09
1 May'09 to 31 Oct'09
1 Nov'09 to 30 Apr'10
1 May'10 to 31 Oct'10
No
of F
emal
e M
embe
r
Figure 2: Trend of FA in no. to female member
0.0
50000.0
100000.0
150000.0
200000.0
250000.0
300000.0
350000.0
400000.0
1 Dec'07 to 30 Apr'09
1 May'09 to 31 Oct'09
1 Nov'09 to 30 Apr'10
1 May'10 to 31 Oct'10
Tk.
Figure 3: Trend of FA to female member by BDT

3rd_Operational_Report_May_Oct_10_TH-2[1], Page 70 of 75
Table 8.1: Showing village wise information of financial assistance
Union Village Financial Assistance by 31 October 2010
Female Male Total Count Sum (Tk) % Count Sum (Tk) % Count Sum (Tk)
Uttar Sreepur
Bhoraghat 13 45,000 36.6% 24 78,000 63.4% 37 123,000 Binodpur 8 28,000 11.8% 62 209,000 88.2% 70 237,000 Birendranagar 0 0 0.0% 30 106,000 100.0% 30 106,000 Chiragaon 5 16,000 11.3% 39 125,000 88.7% 44 141,000 Golabari 0 0 0.0% 33 113,000 100.0% 33 113,000 Indrapur 10 26,000 12.9% 54 175,000 87.1% 64 201,000 Jamalpur 15 47,000 49.0% 16 49,000 51.0% 31 96,000 Joipur 3 10,000 8.8% 34 104,000 91.2% 37 114,000 Kamonapara 34 112,000 77.8% 10 32,000 22.2% 44 144,000 Mandiata 11 32,000 13.1% 70 213,000 86.9% 81 245,000 Modonpur 1 3,000 33.3% 2 6,000 66.7% 3 9,000 Moihiajuri 10 33,000 28.0% 27 85,000 72.0% 37 118,000 Mujrai 16 50,000 25.3% 43 148,000 74.7% 59 198,000 Nobabpur 0 0 0.0% 19 58,000 100.0% 19 58,000 Paniakhali 0 0 0.0% 1 3,000 100.0% 1 3,000 Ratanpur 18 58,000 49.2% 19 60,000 50.8% 37 118,000 Silani Tahirpur 3 9,000 5.8% 47 147,000 94.2% 50 156,000
Sub-total= 147 469,000 21.5% 530 1,711,000 78.5% 677 2,180,000 Dakshin Sreepur
Bolaikandi 2 6,000 28.6% 5 15,000 71.4% 7 21,000 Dumal 12 38,000 21.8% 44 136,000 78.2% 56 174,000 Gorergaon 0 0 0.0% 1 3,000 100.0% 1 3,000 Hukumpur 7 22,000 17.2% 34 106,000 82.8% 41 128,000 Jangail 0 0 0.0% 19 63,000 100.0% 19 63,000 Jibonpur 1 3,000 25.0% 3 9,000 75.0% 4 12,000 Joyasree 5 17,000 11.1% 41 136,000 88.9% 46 153,000 Keshtopur 1 3,000 4.0% 24 72,000 96.0% 25 75,000 Lamagaon 1 3,000 0.8% 120 394,000 99.2% 121 397,000 Mahmoodpur 2 7,000 4.9% 43 135,000 95.1% 45 142,000 Manik Khila 4 12,000 5.7% 64 200,000 94.3% 68 212,000 Moazzampur 1 3,000 16.7% 5 15,000 83.3% 6 18,000 Nouagaon 1 3,000 33.3% 2 6,000 66.7% 3 9,000 Patabuka 26 84,000 26.9% 68 228,000 73.1% 94 312,000 Ramshinghapur 10 34,000 15.4% 57 187,000 84.6% 67 221,000
0.0500000.0
1000000.01500000.02000000.02500000.03000000.0
1 Dec'07 to 30 Apr'09
1 May'09 to 31 Oct'09
1 Nov'09 to 30 Apr'10
1 May'10 to 31 Oct'10
Tk.
Figure 4: Overall trend of FA in BDT

3rd_Operational_Report_May_Oct_10_TH-2[1], Page 71 of 75
Union Village Financial Assistance by 31 October 2010
Female Male Total Count Sum (Tk) % Count Sum (Tk) % Count Sum (Tk)
Santospur 3 9,000 23.1% 10 30,000 76.9% 13 39,000 Shibpur 4 14,000 32.6% 7 29,000 67.4% 11 43,000 Utiargaon 0 0 0.0% 2 6,000 100.0% 2 6,000 Vandar Chapar 4 13,000 30.2% 10 30,000 69.8% 14 43,000
Sub-total= 84 271,000 13.1% 559 1,800,000 86.9% 643 2,071,000 Uttar Bangshikunda
Antarpur 3 10,000 5.9% 50 160,000 94.1% 53 170,000 Bakatala 5 16,000 7.2% 63 206,000 92.8% 68 222,000 Bangalvita 9 30,000 16.6% 41 151,000 83.4% 50 181,000 Bholaganj 0 0 0.0% 3 9,000 100.0% 3 9,000 Golappur 10 32,000 16.6% 50 161,000 83.4% 60 193,000 Golgaon 8 26,000 19.0% 33 111,000 81.0% 41 137,000 Isamari 0 0 0.0% 6 18,000 100.0% 6 18,000 Kartikpur 1 3,000 1.9% 45 151,000 98.1% 46 154,000 Majhersara 19 70,000 32.1% 42 148,000 67.9% 61 218,000 Nababpur 2 6,000 3.3% 54 174,000 96.7% 56 180,000 Rajendrapur 1 3,000 6.1% 15 46,000 93.9% 16 49,000 Rampur 0 0 0.0% 32 103,000 100.0% 32 103,000 Rupnagar 8 28,000 14.7% 50 163,000 85.3% 58 191,000
Sub-total= 66 224,000 12.3% 484 1,601,000 87.7% 550 1,825,000 Dakshin Bangshikunda
Amanipur 2 6,000 50.0% 2 6,000 50.0% 4 12,000 Bangshikunda 6 20,000 8.5% 64 214,000 91.5% 70 234,000 Basaura 4 13,000 9.6% 36 122,000 90.4% 40 135,000 Batta 0 0 0.0% 6 18,000 100.0% 6 18,000 Birsinghapara 3 9,000 27.3% 8 24,000 72.7% 11 33,000 Datiapara 4 12,000 9.6% 33 113,000 90.4% 37 125,000 Ghashi 18 55,000 29.6% 43 131,000 70.4% 61 186,000 Hatpatol 14 42,000 38.9% 21 66,000 61.1% 35 108,000 Jaipur 2 6,000 15.4% 11 33,000 84.6% 13 39,000 Kakarhati 1 3,000 14.3% 6 18,000 85.7% 7 21,000 Kauhani 5 18,000 10.1% 48 160,000 89.9% 53 178,000 Khidirpur 0 0 0.0% 5 15,000 100.0% 5 15,000 Makardi 1 3,000 6.5% 14 43,000 93.5% 15 46,000 Nauagaon 0 0 0.0% 7 21,000 100.0% 7 21,000 Nischintapur 4 12,000 5.8% 57 195,000 94.2% 61 207,000 Rangchi 7 22,000 10.5% 58 188,000 89.5% 65 210,000 Sanua 12 40,000 26.3% 35 112,000 73.7% 47 152,000 Satur 0 0 0.0% 4 12,000 100.0% 4 12,000 Shishua 1 3,000 20.0% 4 12,000 80.0% 5 15,000
Sub-total= 84 264,000 14.9% 462 1,503,000 85.1% 546 1,767,000 Cumulative by Oct 10
Total 381 1,228,000 15.7% 2,035 6,615,000 84.3% 2,416 7,843,000

3rd_Operational_Report_May_Oct_10_TH-2[1], Page 72 of 75
Table 8.2: Showing union wise analysis of financial assistance in different periods
Union 1 Dec'07 to 30 Apr'09 Male Female Total
No. Tk. % M No. Tk. % F No. Tk. % Union Uttar Sreepur 147 439000.0 82.1 32 91000.0 17.9 179 530000.0 27.5 Dakshin Sreepur 163 489000.0 86.2 26 78000.0 13.8 189 567000.0 29.1 Uttar Bangshikunda 137 411000.0 89.5 16 48000.0 10.5 153 459000.0 23.5 Dakshin Bangshikunda 113 346000.0 87.6 16 49000.0 12.4 129 395000.0 19.8 TH Total 560 1685000.0 345.5 87 266000.0 13.4 650 1951000.0 100.0
Union 1 May'09 to 31 Oct'09 Male Female Total
No. Tk. % M No. Tk. % F No. Tk. % Union Uttar Sreepur 152 471000.0 74.9 51 155000.0 25.1 203 626000.0 28.1 Dakshin Sreepur 185 590000.0 89.8 21 67000.0 10.2 206 657000.0 28.5 Uttar Bangshikunda 131 408000.0 89.7 15 46000.0 10.3 146 454000.0 20.2 Dakshin Bangshikunda 139 457000.0 82.7 29 89000.0 17.3 168 546000.0 23.2 TH Total 607 1688000.0 84.0 116 257000.0 16.0 723 2283000.0 100.0
Union 1 Nov'09 to 30 Apr'10 Male Female Total
No. Tk. % M No. Tk. % F No. Tk. % Union Uttar Sreepur 174 590000.0 82.5 37 125000.0 17.5 211 715000.0 29.3 Dakshin Sreepur 177 597000.0 87.6 25 85000.0 12.4 202 682000.0 28.1 Uttar Bangshikunda 135 490000.0 88.2 18 72000.0 11.8 153 562000.0 21.3 Dakshin Bangshikunda 136 457000.0 88.9 17 52000.0 11.1 153 509000.0 21.3 TH Total 622 2134000.0 86.5 97 334000.0 13.5 719 2468000.0 100.0
Union 1 May'10 to 31 Oct'10
Male Female Total
No. Tk. % M No. Tk. % F No. Tk. % Union Uttar Sreepur 57 211000.0 67.9 27 98000.0 32.1 84 309000.0 25.9 Dakshin Sreepur 34 124000.0 73.9 12 41000.0 26.1 46 165000.0 14.2 Uttar Bangshikunda 81 292000.0 82.7 17 58000.0 17.3 98 350000.0 30.2 Dakshin Bangshikunda 74 243000.0 77.1 22 74000.0 22.9 96 317000.0 29.6 TH Total 246 870000.0 75.9 78 271000.0 24.1 324 1141000.0 100.0

3rd_Operational_Report_May_Oct_10_TH-2[1], Page 73 of 75
Union Cumulative by Oct’10 Male Female Total
No. Tk. % M No. Tk. % F No. Tk. % Union Uttar Sreepur 530 1711000.0 78.3 147 469000.0 21.7 677 2180000.0 28.0 Dakshin Sreepur 559 1800000.0 86.9 84 271000.0 13.1 643 2071000.0 26.6 Uttar Bangshikunda 484 1601000.0 88.0 66 224000.0 12.0 550 1825000.0 22.8 Dakshin Bangshikunda 462 1503000.0 84.6 84 264000.0 15.4 546 1767000.0 22.6 TH Total 2035 6615000.0 84.2 381 1228000.0 15.8 2416 7843000.0 100.0
Annex-9: Project Management and Implementation Issues
Table 9.1: Showing financial performance considering all expected outputs
Code Function/ Designation
Budget actual period
(May'10-Oct'10)
Costs actual period
(May'10-Oct'10)
Balance Budget actual period
Burn rate
previous period
Nov'09-Apr'10 in %
Burn rate
present period May-
Oct'10 in %
Remarks/ Causes of changes in burn rate in this report period
TOTAL Part 1: Managerial costs of IO 2,745,817 1,261,197 1,484,620 80% 46%
Acting PC’s cost reversed in this period which was booked in the earlier six months period. Bangkok mission cost remains unspent in this reporting period.
TOTAL Part 2: Project implementation 8,159,744 6,840,126 1,319,618 62% 84%
Satisfactory burn rate achieved due to frequent travel, field visits during this reporting period as consequence of flash flood and magistrate assault on duty.
Total Part 1 + 2: Services 10,905,561 8,101,323 2,804,238 67% 74%
Total Output-1.1: 5,176,048 3,515,771 1,660,278 35% 68%
Burn rate almost doubled due to increase of related activities i.e. organization meetings, election in vcc’s and capacity building. Matching fund provided to the CCC. Boats are procured for UCCs.

3rd_Operational_Report_May_Oct_10_TH-2[1], Page 74 of 75
Code Function/ Designation
Budget actual period
(May'10-Oct'10)
Costs actual period
(May'10-Oct'10)
Balance Budget actual period
Burn rate
previous period
Nov'09-Apr'10 in %
Burn rate
present period May-
Oct'10 in %
Remarks/ Causes of changes in burn rate in this report period
Total Output-1.2: 2,278,393 1,418,943 859,451 48% 62%
Special effort has been given in accumulation of SCM fund which now crossed Tk. 1 core. Activities related to covering more underprivileged beneficiaries increased. Financial assistance on different AIGs increased to the community members as on flash flood occurred in Apr 10. PRMP module revised, annual PRMP calendar designed and co-facilitators developed.
Total Output-2.1: 1,245,114 175,283 1,069,831 14% 14%
Arranged 4 THMC and 1 special meeting’s to overcome the situation. But due to unstable socio-political condition prevailed in the project area, advancement on the other governance activities were sloth down.
Total Output-2.2: 2,835,925 56,258 2,779,667 26% 2%
Major activity of this reporting period was procurement of ‘fingerlings’ of six extinct fishes. No bidder was interested to participate in tender. So whole cost remain unexpended except notice circulated in national newspaper. Reed restoration activity could not be initiated due to prevailing socio-political situation. Hydrological and ecological status assessment reports are not completed.
Total Output-2.3: 349,413 48,340 301,073 36% 14%
Studies on gender, drr, market extension, value chain analysis and prmp assessment are not completed, payment of consultants remain due.
Total Output-3.1: 1,096,197 387,610 708,587 7% 35%
Knowledge management activities such as drafting constitution of TH co-management, checking and verification of SCM accounts, up-gradation of TH website, production of TH e-newsletter, participation in fair have been increased.

3rd_Operational_Report_May_Oct_10_TH-2[1], Page 75 of 75
Code Function/ Designation
Budget actual period
(May'10-Oct'10)
Costs actual period
(May'10-Oct'10)
Balance Budget actual period
Burn rate
previous period
Nov'09-Apr'10 in %
Burn rate
present period May-
Oct'10 in %
Remarks/ Causes of changes in burn rate in this report period
Total Output-3.2: 369,195 44,452 324,743 25% 12%
Project personnel were busy mainly in overcoming the exhausted situation at post flood and magistrate assault activities, so vary limited opportunity was to execute the activities related to national and regional platforms establishment.
TOTAL Part 3: Administered Project
Funds 13,350,284 5,646,656 7,703,628 33% 42%
GRAND TOTAL 24,255,845 13,747,979 10,507,865 48% 57%