basel iii capital buffers requirements and credit union ... basel iii capital buffer requirements...
TRANSCRIPT

1
Basel III capital buffer requirements and credit union prudential regulation: Canadian evidence∗∗∗∗
Helyoth Hessou Department of Finance, Insurance and Real Estate
Faculty of Business Administration Laval University, Quebec, Canada Email: [email protected]
Van Son Lai Laboratory for Financial Engineering of Laval University
Department of Finance, Insurance and Real Estate Faculty of Business Administration Laval University, Quebec, Canada Email: [email protected]
and
IPAG Business School, Paris, France
July 2016
∗ We acknowledge the financial support from the Autorité des Marchés Financiers of Quebec (Canada), the Conrad Leblanc Fund, and the Social Sciences and Humanities Research Council of Canada. The authors thank Marc-André Pigeon and Les Czarnota from Credit Union Central of Canada for their helpful advices and appreciate the excellent research assistance provided by Amine Arfaoui, Jean-Philippe Allard-Desrochers, Houa Balit and Olivier Côté-Lapierre.

2
Basel III capital buffer requirements and credit union prudential regulation: Canadian evidence
Abstract
Some Canadian provinces have already adopted Basel III rules for the oversight of their administrated credit unions. We analyze the importance of the Basel III additional capital buffer requirements for credit union prudential regulation. Based on a sample of the 100 largest credit unions in Canada from 1996 to 2014, we find that Canadian credit union capital buffers behave countercyclically over the business cycle. Further, credit unions hold a capital buffer bigger than the maximum buffer advocated under Basel III which is 5% of risk-weighted assets (RWA). These results suggest that, unlike commercial banks worldwide, credit unions, by and large, are already in compliance with the new Basel III buffer requirements. However, there is evidence that the capital buffers of low-capitalized credit unions are procyclical. These credit unions increased their RWA during booms but failed to build up additional capital accordingly. Hence, weakly capitalized credit unions are more likely to adjust their capital buffers if they are subject to Basel III capital buffer regulation.
Keywords: Capital regulation, Credit union capital, Business cycle fluctuations, Countercyclical capital buffer, Conservative capital buffer, Basel III.
3
Introduction
In North America, Canada has the highest proportion of members of credit unions —currently some 10 million, about one-third of Canada’s total population. Credit unions being non-profit institutions, operate on the principle of one-member-one-vote and are motivated by self-help and solidarity ideals (e.g., Brizland and Pigeon (2013), Goddard, McKillop and Wilson (2015)).
As of September 2014, of the 696 credit unions that operated in Canada, 352 operate out of the province of Quebec. The five (5) largest credit unions in Canada are Desjardins Group (Quebec), Vancity (British Columbia), Coast Capital Savings (British Columbia), Servus Credit Union (Alberta), Meridian Credit Union (Ontario), and First West Credit Union (British Columbia). Desjardins Group is by far the largest credit union federation in North America. Founded in 1900 by Alphonse Desjardins, it federates nearly half (344 local credit unions, or Caisses Populaires Desjardins) of credit unions in Canada. This federation has over 6 million members and manages over 210 billion Canadian dollars. In terms of assets, Desjardins Group achieves nearly the size of all other Canadian credit unions outside of Quebec combined (Moore, 2014).
Compared to banks, credit unions hold less assets. For example, Royal Bank of Canada (RBC), the largest Canadian bank, accounted for 940 billion $CAD in assets in 2014, almost 4.5 times the size of the entire Desjardins Group, the largest federation of unions in Canada, and roughly 25 times the size of the Caisse Centrale Desjardins. However, credit unions have specific characteristics that make them highly complementary to banking services. For example, credit unions are more efficient than banks in the assessment of the borrowers’ creditworthiness, because the members know each other fairly well, due to "common bond"1 and can impose sanctions on delinquent payers (see Banerjee, Besley and Guinnane, 1994). Furthermore, unlike banks credit unions fund a large share of their lending activities with stable "guaranteed" deposits. Vital to the national economy, they provide alternative non-profit-oriented financing to small and medium enterprises (SMEs), households and other economic agents that otherwise would have difficulty accessing traditional bank financing (CIBP, 2014). Given this importance and the fact that members' deposits are guaranteed by the regulatory bodies in Canada, credit unions are subject to provincial oversight.
In Quebec, for example, the Autorité des Marchés Financiers (AMF) ensures micro and macro prudential regulation of the credit union system. In a recent document (first issued in 2014 and revised in January 2016), it released new guidelines on regulatory standards (AMF (2016)) based on the recommendations of Basel III (BCBS (2011)). New requirements for credit unions are: (a) a leverage ratio (including off-balance sheet activities) as a supplementary measure to risk-based capital requirement of Basel II; (b) a countercyclical capital buffer, to promote the build-up of capital buffers in periods of expansion, that can be used during periods of stress; and (c) short-term and long-term liquidity standards (liquidity coverage ratio (LCR), net stable funding ratio (NSFR)).
The conservation and countercyclical capital buffers are introduced by regulators in response to the 2007-2008 banking crisis in which credit unions, known to perform better than banks through the business cycle (Smith and Woodbury, 2010), were definitely not 1 The common bond (usually, community bond, occupational bond, associational bond) is the factor which unites all the members of a credit union. Members know and trust each other, the savings of members are available to fellow members as loans. Credit judgements are made on character and personal records on top of commercial risk factors, see for instance, Emmons and Schmid (1999), McKillop and Wilson (2011, 2015).

4
the culprit. Unlike banks, due to their non-profit and cooperative status, credit unions face particular challenges to comply with capital regulations (Moore, 2014). This suggests that they have followed a prudent capital buffer management practice which has enabled them to weather well the 2008 financial crisis.
Meanwhile, most papers on credit unions focus on the credit union efficiency or modelling their objective function. Very few work has been done to analyze how their special business fits with various regulations governing them. This paper builds upon the capital structure adjustment theory to analyze the importance of Basel III countercyclical and conservation capital buffer for credit union prudential regulation.
By studying the cyclical behavior of Canadian credit unions’ capital buffers, we assess the desirability of the countercyclical capital buffer. We examine the importance of the conservation capital buffer based on the adjustment behavior of credit unions which are capital-constrained.
Closest to our paper is the one by Goddard, McKillop and Wilson (2015), which addresses the issue of capital adjustment for US credit unions. Since credit unions are subject to capital regulation based on their level of risk (asset risk), the existing literature highlights the importance of studying capital adjustment behavior jointly with risk posture. Unlike Goddard, McKillop and Wilson (2015), we account for the endogenous risk adjustment behavior in our capital adjustment framework. To suit our study for credit unions, we simultaneously take into consideration their non-for profit nature by jointly investigating capital and risk posture as well as decisions about benefits or profits to members (thereafter called as “benefit” to members).
Against this background, after building a unique dataset of 100 biggest Canadian credit unions which account for more than 95 per cent of total credit union system assets in Canada for the period of 1996 to 2014, we are the first to seek answers to two main research questions 1- Given that the desirability of the conservation buffer is an unsettled issue, especially for credit unions, are the new Basel III buffers requirements suitable and necessary for Canadian credit union prudential regulation? and 2- Are Canadian credit union capital buffer adjustments sensitive to the credit union capitalization?
We find that Canadian credit union capital buffers is significantly greater than 5% of risk-weighted assets (RWA) and behave countercyclically over the business cycle. However, there is evidence that low-capitalized credit unions capital buffers are procyclical. Well capitalized credit unions build up their buffers during booms so that they are not obliged to curtail credit allocation during busts, suggesting no need to impose Basel III countercyclical capital buffer requirements to these credit unions as they already hold sufficient countercyclical capital buffers. Interestingly, credit unions with higher buffers also hold more liquid assets. Meanwhile, low-capitalized credit unions reduce capital and raise risk-weighted assets over the business cycle. Credit unions with low net worth (measured by retained earnings per dollar of member shares) prudently manage their capital buffers. Furthermore, less profitable credit unions hold smaller buffers compared to those with higher performance and fail to prudently manage their capital buffers through the business cycle. By and large, weakly capitalized credit unions are those upon which the regulators should impose Basel III countercyclical capital buffers.
To the best of our knowledge, no studies like ours clearly address the merits of applying the conservation and countercyclical capital buffer requirements to credit unions prudential regulation. The remaining sections are organized as follows. Section 1 presents the credit union regulation followed by a brief literature in section 2. Section 3 discusses the
5
empirical model. After the data description in section 4, we discuss the results in section 5 and provide some additional analysis in section 6. The robustness check analysis is done in section 7 and section 8 concludes.
1. Credit unions regulation in Canada
Deposit insurance provided by the government is one of the main motives for credit union regulation. The incentive of moral hazard from managers is weaker in credit unions due to the shareholders status of the credit union members (depositors or borrowers). As owners of the credit union, they contribute to its management through their voting rights. That said, it is not necessary to protect depositors from excessive risk-taking behavior as is the case with banks. Unfortunately, evidence shows that members’ (depositors and borrowers) capacity to control and discipline credit unions is limited. In fact, due to the one-member-one vote situation, the incentive and ability of members to generate a concentration of voting power is limited and attendance of members at votes are low (Hiller et al., 2008). This reduction of the member supervisory power increases the information asymmetry that can trigger credit union runs in the event of doubt about its financial condition. Consequently, the regulation of credit unions is designed to protect depositors and deposit insurers against excessive risk taking from executives and to ensure the solvency of credit unions in difficult times2 (e.g., Goddard, McKillop and Wilson, 2015). Therefore, a capital requirement is desirable for the stability of credit unions, mainly during bad economic times. However, the exact capital ratio to apply to credit unions is to date an unsettled question.
Unlike banks, which are federally regulated, various provincial jurisdictions are responsible for the prudential regulation of Canadian credit unions. In each province, there are organizations which provide deposit insurance and regulate credit unions. Subject to provincial authorities, these entities ensure that Canadian credit unions maintain adequate capital to support their business and to contribute to financial stability. Regulations of capital take the form of minimum capital ratio requirements. Historically, credit unions must maintain adequate amounts of capital to support their risk and growth. Two capital requirements are implemented prior to the Basel III adoption. The risk-based capital ratio (total capital / total risk-weighted assets) is being implemented worldwide, and the non-risk-based capital ratio or leverage (total capital / total assets) was newly introduced under Basel III but has already been in effect in Canada for quite a while. Different limits have been applied by provinces. The 8% limits on the risk-based capital ratio is adopted by all provinces except British Columbia (10%) and Alberta (10.5%). Regarding leverage limits, all provinces have adopted a 5% leverage limit except Ontario (4%).
Following the 2007-2008 financial crisis, to upgrade the existing standards (Basel II), the Basel Committee has released its latest international regulatory standards called Basel III. The Basel III regulation strengthens capital adequacy by adding new capital buffer requirements and liquidity standards. Most of Basel III standards are primarily designed for banks and should be reviewed by provincial authorities when applied to credit unions. As pointed out by Wilcox (2011) and others, these standards sometimes fail to account for credit unions’ specificities. We focus in this paper on the newly introduced countercyclical and conservation Tier 1 capital. Credit unions actual capital ratios (risk-
2 According to the Australian Financial Institutions Commission (AFIC) among others similar organizations, capital regulation aims to protect the interests of depositors and promote integrity and financial efficiency.

6
based capital ratio and leverage ratio) are higher than the minimum required. This means that they already hold a sufficient buffer. However, this buffer is not mandatory prior to the new Basel III. The regulated buffer will impose new constraints and exert stress on credit unions. Firstly, they were allowed to lower their buffer to expand activities (assets or risky assets) without provisioning for capital. Such behavior is still possible under the conservation capital buffer but the capital buffer must quickly be rebuilt to meet the minimum capital buffer requirement. Secondly, the countercyclical capital buffer will impose another burden on credit unions during credit expansion. They will be required to rapidly come up with an additional core or Tier 1 capital buffer. Despite the desirability of such Tier 1 capital buffer, a sudden increase in its requirement could challenge credit unions due to their not-for-profit and private business status. For example, Hiller et al. (2008) show that under the pressure to satisfy the newly introduced risk-based capital ratio minimum of 8% in 1992, Australian credit unions resorted to regulatory arbitrage. Instead of raising new capital or reducing risk, credit unions reshuffled the components of their assets to make them seem artificially less risky. This behavior is a clear evidence of the difficulties credit unions face in having to rapidly raise their capital level. To meet Tier 1 capital requirements, financial institutions mostly rely on common equity or retained earnings (disclosed reserves). Unfortunately, credit unions are limited in raising either of these. Firstly, credit unions are private entities and cannot issue common equity on financial markets (Andrews, 2014; Hoel, 2007). They instead issue membership capital shares, which are not eligible as capital instruments (under IFRS standards) because they lack permanency. Members can withdraw their shares in the event of resignation. Some credit unions issue investment shares, but this is limited by the one-member-one-vote principle (Goddard, McKillop and Wilson, 2015). Hence, the only and least costly alternative for credit unions to meet the Tier 1 under Basel III Tier 1 conservation capital requirement is earnings retention (Andrews, 2014).
However, retention of earnings conflicts with the non-profit status of credit unions. It limits their ability to charge higher spreads to their customers-members-owners and so to generate enough profit to be retained to build up capital. Further, members have a preference for distributed profit (as dividends) over earning retention for the purpose of capital adequacy. Furthermore, credit unions have lost the tax advantage that allowed them to retain more profit as capital (Moore, 2014) and are currently experiencing competition with banks even in rural areas where they were major players. Due to this reliance on profit, sudden capital requirements may not be desirable for credit unions. Brown and Davis (2009) found that Australian credit unions set performance levels on short-term assets to progressively bridge the gap in capital (the difference between the target capital ratio and the actual one). In addition, Goddard, McKillop and Wilson (2015) find evidence of a gradual capital adjustment by credit unions in anticipation of the United States Prompt Corrective Action (PCA) in 2000. Like US credit unions, Canadian credit unions set their desired level of capital ratio well above the regulatory target and divulge it in their annual reports. They adopt a conservation capital building behavior essentially based on their disclosed reserves. For example, to meet their capital requirements, credit unions of Manitoba and Newfoundland & Labrador maintain a minimum of 3% of their assets in the form of retained earnings. In British Columbia, credit unions are required to hold at least 35% of retained earnings as capital. In Quebec, the Desjardins Group, to strengthen its capital position, regularly retains one-third (1/3) of its revenues for capital accumulation.
7
Since credit unions strive to build buffers despite their limited capital source alternatives, it appears important then to challenge the usefulness of the newly introduced additional buffer requirements for credit unions. We assess the desirability of the countercyclical capital buffer by studying the cyclical behavior of Canadian credit unions’ capital buffer. A positive co-movement with the cycle means that the capital buffer is high during hard times and low during recessions. This is undesirable, since during recessions revenues are low and it is difficult for credit unions to adjust for capital without cutting new loans or liquidating existing assets. This makes the countercyclical capital buffer appealing. By examining the adjustment behavior of the capital-constrained credit unions, we gauge the importance of a conservation capital buffer for credit union financial stability. Specifically, we study the adjustment behavior of credit unions when they are near to the regulatory limit. If the low-capitalized credit unions (below median capital) capital adjustment speed is faster than the one well-capitalized credit unions take, from a regulatory standpoint, it is desirable to impose a conservation capital buffer so that credit unions are not obliged to make sudden adjustments of capital.
We review next briefly the credit union capital adjustment literature. We also provide an overview of studies on risk taking and benefits for members, although these address research questions different than ours.
2. Brief literature review According to Goddard, McKillop and Wilson (2015), US credit union capital buffers are positively related to the business cycle (countercyclical). This means that credit unions manage to build their buffers during booms in order to avoid undesirable and socially costly adjustment during busts (by reducing assets or loans), and there is no need to require them to hold countercyclical capital buffers. In contrast, the study of Stolz and Wedow (2011) contradicts the non-desirability of countercyclical capital buffer documented in Goddard, McKillop and Wilson (2015). They found that Germany’s local banks’ capital buffers are instead procyclical during the 1993-2004 period. The main difference between the two studies is that they are conducted in two different countries using different ratios. There is also a difference in the capital ratios used in both studies. Stolz and Wedow (2011) use the risk-based capital buffer whereas Goddard, McKillop and Wilson (2015) use the capital-to-assets ratio. Interestingly, the fact that both ratios are monitored by Canadian credit union regulators gives a better view of the desirability of the additional buffer for credit unions. Note that there is evidence in the literature (e.g., Ayuso, Perez and Saurina, 2004; Guidara, Lai and Soumaré, 2013; among others) that banks’ capital buffers are procyclical, which makes the countercyclical capital buffer requirement very desirable for banks.
The desirability of the conservation capital buffer requirements is also an unsettled issue. Our contention is that the conservation capital buffer holding is only desirable if less capitalized credit unions adjust faster than well capitalized credit unions in reducing assets or cutting loans. As stated earlier, it is hard for credit unions to rapidly raise their capital ratio without cutting in loans or reducing assets. Some studies (Goddard, McKillop and Wilson, 2015; Stolz, Heid and Porath, 2003) confirm the asymmetry in adjustments based on the buffer levels held by credit unions. Goddard, McKillop and Wilson (2015) find that credit unions with low buffers adjust faster than well-capitalized credit unions. Stolz, Heid and Porath (2003) studied the behavior of capital-constrained credit unions prior to the crisis. They also investigated the impact of regulations on the adjustment of capital and
8
risk for financial institutions in Germany from 1994 to 2002. They find that adjustment to capital and risk depends on the amount of capital buffers. Banks and credit unions with lower capital buffers try to rebuild their buffers by increasing capital and reducing risk. However, banks and credit unions with high buffers try to maintain their buffers by increasing the risk when the capital stock increases. This result shows the importance to impose conservation capital buffers on credit unions to avoid costly capital raising during hard times and risk reduction through asset liquidation or credit crunch. Contrary to those studies, the results in Stolz and Wedow (2011) support that low-capitalized banks do not catch up with their well-capitalized peers over the observation period and they do not decrease risk-weighted assets during a recession. This finding suggests that their low capitalization does not force them to retreat from lending, which supports the desirability of conservation capital buffers for credit unions under Basel III.
Note that all of these studies do not internalize the specific not-for-profit and cooperative features of credit unions in their analysis. We complement their approach by estimating how the credit union adjustment process affects the benefits to members. In the next section, we describe the data and methodology for our study.
3. The empirical model
Let us recall that the aim of this paper is threefold. Firstly, we estimate the effect of business cycle fluctuations on Canadian credit union capital buffers (risk-based and leverage capital buffers). Secondly, we decompose the adjustment process by studying adjustment in the numerator of the ratio and its denominator. Thirdly, we investigate how capital, risk and the business cycle affect the credit union main objective, which is to offer benefit to members. This section describes our empirical model estimation strategy. We first present the partial adjustment model, state the hypotheses to be tested, and describe the estimation methodology. Then, we define the measures of the variables of interest, the credit union capital buffers and the business cycle. Finally, we define the measures and the potential impact of the credit union-specific control variables.
A. The partial adjustment model and hypotheses
The incentive to hold buffers derives from two assumptions: first, credit unions cannot adjust capital and risk instantaneously, otherwise they would not need to hold capital buffers; second, a violation of the regulatory minimum capital requirements triggers costly supervisory actions, possibly even leading to credit union closure (e.g., Stolz and Wedow (2011) among others). Existing literature shows that credit unions hold large capital buffers. Jackson (2007) describes the evolution of capital ratios for US credit unions over the 1990-2006 period and finds that they are over-capitalized (compared to banks). They hold on average 11.6% of capital compared to the minimum requirement of 8%. This result is also confirmed by Goddard, McKillop and Wilson (2015). Most of the credit unions in Canada declare in their annual reports that they target higher risk-based capital ratio (around 12%, compared to the minimum of 8%). This additional capital buffer held by credit unions allows them to guard against the risk of falling below the regulatory value. Marcus (1984), Milne and Whalley (2001), Milne (2004) and others have shown that financial institutions have an incentive to hold a capital buffer as insurance against breach of compliance with minimum regulatory capital requirements. We assume that they do so because of the high cost of capital adjustment.

9
In this paper, we consider two capital buffers, the risk-based capital buffer and the exposure-based capital ratio. The buffer on the risk-based capital (leverage ratio) is the additional capital that credit unions hold above the minimum of 8% of risk-weighted assets (RWA) (respectively 5% of total assets) required. To adjust for the risk-based capital ratio or leverage ratio, credit unions can increase their Tier 1 capital position (the numerator of the ratio) or decrease their risky asset holding or their total assets. This substitution effect between the numerator and the denominator of the ratio makes the adjustments in capital and risk interrelated. Further, credit unions are highly dependent on their profit to build capital, which contrasts with their non-profit nature. Therefore, we complement the joint capital and risk adjustment by also taking into consideration benefits for members.
The theoretical model that supports gradual adjustment to target is the partial adjustment model. It assumes that each year the credit union increases its capital to reduce the shortfall between the target and realized capital. This is similar to the approach used by Goddard, McKillop and Wilson (2015) for US credit unions and Stolz and Wedow (2011) for German credit unions. In choosing their targeted buffer, credit unions may find a tradeoff between the adjustment costs and the costs of operating with sub-optimal buffers. The proposed model enables partial adjustments of the credit unions’ risk-based capital and leverage buffers towards their desirable level. A quick adjustment towards a targeted buffer may have two conflicting explanations. Either the adjustment is less costly or the ratio is the binding one, in which case the credit union may quickly adjust in order to avoid non-compliance costs. The typical partial adjustment model is the following:
∆������ = �������∗ − ������ �� + ���, (1)
where ������ is either the risk-based capital or the leverage buffer of the credit union i at time t, and ��� is the error term. Equation (1) assumes that at every time t, the typical credit union i closes a proportion � of the gap between its actual buffer ������ � (the buffer realized the previous period) and its desired or targeted buffer ������
∗ in the current period. � is also interpreted as the speed of adjustment. The targeted buffer, being unobservable, is assumed to depend on the business cycle interacting with credit risk and credit union-specific variables (e.g., Berger et al., 2008; Goddard, McKillop and Wilson, 2015; Stolz and Wedow, 2011). Hence, the unobservable target buffer is expressed as follows:
������∗ = ������ + ������ ∗ ������,� + ���� � + ���, (2)
where ��� � is a vector of credit unions’ predetermined characteristics, ���� is a proxy for business, ������,� is a proxy for the credit union capitalization and ��� is the error term. Assuming that ��� � is properly determined, if the tradeoff theory of capital structure choice holds, then we should have ��, ��, �� ≠ 0. We replace expression (2) in equation (1) and obtain:
∆������ = ������� + ������ ∗ !"# + ���� � + ��� , −������ �� + ��� (3)
= −������� � + ������� + ������� ∗ ������,� + ����� � + ��� + ����.
to obtain the standard form of an endogenous lag model. We then add ����� � to both sides of Eq. (3) and get the following expression:
������ = 1 − �������� � + �������%,� + �������%,� ∗ ������,� + ����� � + ��� + ���� . (4)
We assume that the error term ��� + ���� can be decomposed into two independent components: the credit union-specific unobservable variable and the white noise. These
10
are assumed to follow a normal distribution with 0 means and different constant variances respectively.
Assuming the null hypothesis that business cycle fluctuations do not have an impact on the change in credit unions’ capital buffers, we can state our hypotheses in terms of the coefficient ��� as follows: H1a: ���= 0. Significant values of ��� imply that the business cycles affect the build-up of Canadian capital buffers. A positive sign of this coefficient means that capital buffer moves countercyclically.
We also test for the effect of capitalization on the cyclical behavior of buffers. Under the null hypothesis that capitalization does not affect cyclical behavior of buffers, we state our hypotheses in terms of the coefficient ��� as follows: H2a: ���= 0.
A significant ��� means that the impact of the business cycle on the capital buffer adjustment depends on the credit union buffer level. To dig further into how credit unions adjust their buffer, we study separately the behavior of the numerator and the denominator of the two capital ratios (risk-based capital ratio and leverage ratio). The two ratios share the same numerator which is the total regulatory capital but have different denominators (risk-weighted assets and total assets). We also evaluate how the business cycle and the capitalization impact the total capital (CAP), total risk proxied by RWA and total benefits to their members (BENEF). We estimate the following equation:
��� = �� + ��∆������ + �'����%,� ∗ ������,� + �(��� � + )���,� � + *�,� (5)
where ��� can be replaced by the total capital (CAP), the risk-weighted assets (RWA), the total asset (ASSETS) and the benefits for members (BENEF). In other words, business cycle fluctuations determines the build-up of capital buffers.
For each value of ��� (CAP, RWA, BENEF), by mean of the coefficient �1 we test the cyclical behavior as in Eq. (4). We also test for the significance of �(. The idea behind this test is to quantify how the components of the risk-based and leverage ratios or benefit to members vary with the optimal or targeted buffers.
B. Estimation methodology
The models in Eqs. (4)-(5) have a dynamic panel structure, so we employ the Blundell and Bond (1998) system generalized method of moments (Syst-GMM) estimator. Its controls for the credit union-specific unobservable component of the error term. At the same time, it also gets around the weak instrument problem that the Arellano and Bond (1991) estimator would encounter given the quasi unit root characteristic of our data. For models with endogenous regressors, as pointed out by Stolz and Wedow (2005), using too many instruments could result in seriously biased estimates. Hence, we only use a subsample of the entire series as instruments.
C. Dependent variables
a. Capital buffers, regulatory capital, risk
Capital buffers (BUFF_R, BUFF_A): A credit union’s capital buffer is the capital the credit union holds in excess of the regulatory minimum capital requirement. Hence, we define two measures of credit unions’ capital buffers (BUFF). The first one, BUFF_R is defined as the risk-based capital ratio (total capital / total risk-weighted assets) minus the 8% regulatory minimum. The second BUFF_A is defined as the leverage ratio (total capital / total assets) minus 5%.
11
Regulatory capital (CAP)
Total regulatory capital is computed as the sum of Tier 1 capital or core capital and Tier 2 capital or additional capital instruments. Main components of Tier 1 capital are the retained earnings and the capital injections by the credit union public owners and members. Tier 2 capital is made of subordinated debt and mostly issued by large credit unions to boost their capital buffer (Stolz and Wedow, 2005).
Risk weighted assets (RISK)
By financing members’ long-term risky projects (loans) with short-term deposits, credit unions take on credit and liquidity risk. They also bear market risk through their investment portfolios. This risk-taking, although socially beneficial, is also a source of instability for the credit unions in case of systematic defaults from borrowers. Therefore, regulators require credit unions to hold capital and reserves to cushion and cover unexpected losses. Credit unions should maximize their risk-adjusted profitability when allocating their portfolios. We are unaware of papers that document credit union risk-taking behavior following capital regulation except the one by Hillier et al. (2008), which finds evidence of regulatory arbitrage by credit unions to artificially decrease their risk level. Most existing literature on credit unions’ risk addresses how credit union revenue volatility is affected by membership or income diversification (see Frame, Karels and McClatchey, 2002; Ely, 2014; Esho, Kofman and Sharpe, 2005; Goddard, McKillop and Wilson, 2008). However, we are more interested in portfolio or asset risk rather than returns volatility or returns-based risk. Our focus is on how credit unions adjust their risk-taking behavior to meet regulatory requirements. As mentioned earlier, regulators measure banks risk taking by their total risk-weighted assets (RWA). Jacques and Nigro (1997) argue that the RWA captures both the allocation of risks and the quality of the portfolio risk. This risk measure incorporates credit risk, operational risk and market risks.
b. Benefits to members
Following Bauer (2008), the performance of credit unions in this study is measured by how much benefit members derived from their credit unions through loans and deposit certificate rates. This measure of benefit to members is drawn from the objective function of credit unions theoretically modelled by Taylor (1971, 1977), Smith, Cargill and Meyer (1981) and Smith (1984). According to these authors, credit unions maximize benefits to members by setting better rates on loans and deposits compared to the market. Specifically, Smith (1986) performs an empirical test to show that credit unions are neutral between the interests of their borrowing and saving members. Following the formulation of the objective function in these models, we compute the benefits to members as follows:
�"+"� = 0.5 ∗ -./0 − ./,�� 1 + 0.5 ∗ .2�
� −.20�
where ./,�� = /345 �5�6768� �593:6
;3�4< <345 and .2,�
� = =5�6768� 6>?6586 35 @6?38��;3�4< @6?38��
are respectively the
average loan and deposit rates levied by cooperative i in year t. So, weighted equally ./0 − ./,�
� may be interpreted as the benefit to a borrowing member and .2�� −.20� the
benefit to a lending member.
There is evidence in the literature that credit unions set their rates competitively with other financial intermediaries. Feinberg and Rahman (2001) finds that credit unions actively

12
participate in market discipline, forcing banks to provide competitive lending rates to their customers. Tokle and Tokle (2000) show that bank deposit rates are affected by the rates offered by credit unions. There is clear evidence that credit unions seek to maximize benefits to members.
Our variable benefit to members (BENEF) thus captures the average earnings available to lenders and borrowers, assuming that both categories of members (borrowers and lenders) have equal weight in the credit cooperative.
c. Credit unions specific control variables
To estimate the effect of business cycle fluctuations on changes in credit unions’ capital buffers, we control for the effect of credit union-specific variables on optimum capital buffers. In the following, we present the proxy variables suggested by the literature and their expected impact on optimum capital buffers. The variable definitions are also given in Table B.1 in Appendix B.
(Insert Table B.1 here)
The economic health of the province (GDPG): We use two different measures of GDPG (Gross Domestic Product Growth) to proxy the business cycle. The first measure is GDP growth by province and the second is GDP growth for all of Canada. Most credit unions operate locally within their provinces so they are more affected by the provincial economic condition. Indeed, economic conditions affect capital since the losses are more frequent in a recession. Also, as for banks (see Albertazzi and Gambacorta (2009) among many others), the cycle affects the risk because risk taking by credit unions depends on economic activities. We also expect that during hard times, credit unions may make tradeoffs between support to members or capital raising if they are less capitalized. We investigate the credit union adjustment of capital behavior during a short time interval (1996-2014), so the term of business cycle should be interpreted with caution. Instead, we expect that our proxy, the GDP growth captures the recent economic shock caused by the subprime crisis and delivers a “through-the-economic-activity” insight about credit union capital buffer adjustments.
(Insert Graph 2-5)
We plot on graphs 2 to 5 the patterns of the credit union capital buffer and provincial and Canadian GDP growth. Credit unions increase their buffers during booms and have not experienced falls in their buffers during a huge drop in GDP growth in 2009. Instead they have continuously increased their buffer following this period.
The volume of loans (LOAN): Goddard, McKillop and Wilson (2015) found a negative relation between their capital ratio and their loans granted. Indeed, by granting loans to members, credit unions increase their assets and risk measured by RWA (all else equal). This justifies why the LOAN variable, proxied by the ratio of total loans to total assets, is included in the equations of capital and risk.
Age of credit unions (AGE): In general, the longer the credit union existence, the more it gains experience in risk management and accumulates a sufficiently adequate capital
13
buffer. It can therefore offer services with lower interest rates than those of the competitors. The variable (AGE), as measured by the natural logarithm of the credit union age, is positively related to members’ benefits.
The credit union size (SIZE): Size (log of total assets) may influence target capital due to its relationship with risk diversification, investment opportunities and access to market funding. We use SIZE to account for diversification and economy of scale enjoyed by large credit unions (e.g., Goddard, McKillop and Wilson, 2015) and banks (Aggarwal and Jacques, 1998; Ayuso, Perez and Saurina, 2004; Flannery and Rangan, 2006 and 2008; Guidara et al., 2013).
Provision for loan losses (LOSS): Credit unions’ provision for anticipated loan losses reduces the nominal value of total assets and could potentially affect the leverage (Total capital/Total Assets), ceteris paribus. This variable is used in Shrieves and Dahl (1992) and Rime (2001).
Regulatory pressure (dyLow): Capital buffer theory predicts that an institution approaching the regulatory minimum capital ratio may have incentive to boost capital and reduce risk to avoid the regulatory cost triggered by a violation of the capital requirement. We follow the approach used by Aggarwal and Jacques (1998) and refined by Rime (2001) based on the bank’s buffer distance to its peers. We build a dichotomous variable which takes a value of 1 if the credit union risk-based capital ratio is among the 50% least capitalized. As most credit unions hold capital above the minimum requirements, this measure captures credit unions with a buffer below or above the median buffer value.
Liquidity (LIQUID): A higher ratio of liquid assets (such as Cash and Treasury bill to total assets) may reduce credit union incentive to target higher capital buffer. Credit unions can quickly sell their liquid position to cover their book capital needs (Stolz and Wedow, 2011).
Return on assets (ROA): The only and costless alternative for credit unions to adjust the capital buffer is earnings retention (Andrews, 2014). So we expect a positive effect of the return on assets (ROA) on capital buffers. However, a negative impact may also be plausible. Credit unions may choose to pay dividends when they are well capitalized. Holding less buffer when high returns on assets (ROA) are experienced may also be justified by the ability of the credit union to permanently generate high profits and to increase capital buffers by way of retained earnings when needed. Hence, we include credit union return on assets (ROA) with an ambiguous expected sign.
Mergers (dyMERG): We also include a dummy variable to capture mergers. The reason for including this variable is the ongoing merger wave within the Canadian credit union system. The dummy variable takes a value of 1 for the acquirer in the year of the merger and zero otherwise. The expected sign of the variable is negative given that acquiring credit unions are typically better capitalized before a merger.
4. Data and descriptive analysis
We collected financial data on the 100 major credit unions in Canada based on the list of the 100 largest credit unions published quarterly by Credit Union Central Canada. According to System Results published by the Canadian Credit Union Association (March 2016), as of fourth quarter 2015, the top 100 credit unions account for 88.6 per cent of total credit union system assets in Canada (excluding Quebec). If one includes Quebec, this statistic jumps to over 95 per cent. Specifically, we downloaded balance sheets,
14
income statements and capital requirements data from annual reports published by credit cooperatives on their websites, with 690 annual reports analyzed. This corresponds to an average of 7 years of data per credit union. Some credit unions post few annual reports on their websites. The collected data was then cleared to detect any inconsistencies that may affect the quality of the analysis. The most represented provinces are: Quebec (with a federation of 344 local credit unions), British Columbia (27 credit unions), Ontario (25 credit unions), Manitoba (20 credit unions) and Alberta (11 credit unions). Data on macroeconomic variables comes from Statistics Canada and the Quebec Statistics Institute. Our unique sample consists of an unbalanced panel of 100 major credit unions (by total assets) in Canada from 1996 to 2014.
A. Credit union asset and liability structure
a. Credit union asset structure
In this section, we evaluate major assets and liabilities components. We provide descriptive statistics for the whole sample period (1996-2014) and three sub-periods: The pre-crisis period (1996 to 2007), the crisis period (2007-2009) and the post-crisis period (2009-2014). Descriptive statistics on assets and liabilities components are summarized in Tables A.4 and A.5.
(Insert Tables A.4 and A.5 here)
The average credit union has 9.192 billion $CAD in total assets. The largest total assets among credit unions is 44 billion, attained in 2014 by Caisse Centrale Desjardins. This can be compared to Canadian financial institutions, where the largest bank in Canada (Royal Bank) is 4.5 times larger than the whole Desjardins group, the largest credit union in asset volume. The smallest credit union by asset size is Pierceland Credit Union located in the province of Saskatchewan, recorded in 2012 as having 35.441 million $CAD in assets.
(Insert Table A.4, A.5 and A.6 here)
(Insert Graph 1 here)
The distribution of assets by year can be found in Table A.6. We also compute the distribution of assets by year for a homogenous set of credit unions with available annual reports for the 1996-2014 period (see Table A.6, panel A). There is evidence that credit unions have continuously increased their total assets except during the 2009 crisis during which the average level of total assets fell below its 2008 level (see Graph 1).
Concerning the structure of total assets, we find that 79% of credit unions’ total assets consist of loans to members (commercial and agricultural (30%), residential mortgages (54%) and personal loans (16%)). This loan-dominated business model was increasingly emphasized over time in our sample, with a 75% loans-to-assets ratio before the crisis (1996-2006), 78% during the crisis (2007-2009) and 81% in the post crisis period. This highlights the credit unions’ traditional focus on providing credit to economy.
Investment is the second important component of credit union assets. Credit unions invest some of their funds in secured assets or derivative products for hedging purposes. In term of assets held they invest in government secured assets and credit union central shares. On average, 12% of credit union assets are made of investments in such assets. Asset

15
holdings for investment purposes have decreased over time, from 14% in the pre-crisis period to 11% in the post-crisis period up to 2014.
Credit unions also hold on average of 4% of their funds in cash-like assets. This proportion is 3% today, down from a 5% in the pre-crisis period.
b. Credit union liabilities and members’ equity structure
Credit unions’ major source of fund is deposits. On average, 86% of their funds come from deposits (personal and commercial members). This is quite stable through our whole period. Asset growth, in particular member loan growth that cannot be funded by member deposits, is funded through securitization, loan syndication, corporate borrowings or issuance of investments or saving accounts shares. Credit union borrowings average 3% of total funds. Members’ equity also provides an additional source of financing and is comprised of retained earnings and members’ shares. On average, member equity contributes to 6% of total funds.
B. Descriptive statistics of variables used in the regression analysis
(Insert Table B.2, B.3a, B.3b, B.3c and B4 here)
Descriptive statistics of the variables used in the regression analysis are computed for two subsamples of credit unions (high and low capital buffers). We identify significant control variables for our capital buffer analyses. In tables B.2 and B.3a we provide descriptive statistics for the business cycle indicators and the credit union-specific variables. Table B.3a provides the descriptive statistics for subsamples of credit unions with high and low capital buffers. We include the median value in the descriptive statistics for robustness motives. We also report the Wilcoxon rank sum test, which tests whether the subsamples come from the same population. Table B.3a reveals that, on average, credit unions with low capital buffers take higher risks, as given by higher risk-weighted assets per dollar of assets (RISK) but are not commensurately rewarded on average by higher returns on assets (ROA). These findings with respect to risk and return point to a possible inefficiency of credit unions with low capital buffers. We also observe that, on average, large credit unions are less capitalized. We test in Table B.3b whether credit unions’ actual risk-based capital buffer exceed the minimum capital buffer requirements under Basel III. Credit unions are required to hold at least 2.5% of their RWA for conservative buffer purpose and a proportion which varies between 0% to 2.5% of their RWA for countercyclical buffer purpose. In total, credit unions have to hold a capital buffer that comprises between 2.5% and 5% of their RWA. Results suggest that the credit union average buffer value is greater than 5% of RWA (at the 5 % statistical level). In Table B.3c we analyze the capital buffers dynamics by computing the average and median value for three subperiods: the pre-crisis period (1996 to 2007), the crisis period (2007-2009) and the post-crisis period (2009-2014). We find that credit union have continuously increased their buffer even during the crisis period. Interestingly, they increased their assets-based buffer which was small in the pre-crisis period.
Table B.4 gives the correlation matrix. It shows that most variables are significantly correlated with each other. For example, the correlation matrix suggests that large credit
16
unions (SIZE) hold less capital buffer3 (BUFF_A and BUFF_R), liquid assets (LIQUID) and provision for losses (LOSS) but take much more risk (RISK). The correlation between buffers and the business cycle is not significant but becomes negatively significant when we control for the credit union capitalization. This means that the effect of the business cycle on the buffer depends on the credit union capitalization. This correlation might stem from credit union-specific fixed effects, not accounted by the simple correlations analysis.
To tackle these possible shortcomings, we employ multivariate regression techniques which allow for fixed effects.
5. Regression analysis In the following subsections, we present the results of estimating Eqs. (4)-(5). We first show the results for Eq. (4) where we account for asymmetries in the behavior of capital buffers (Basel risk-based capital and leverage buffer) with respect to the business cycle and the capitalization of the credit union. We then decompose the two capital buffers and separately study their common numerator (CAP) and their denominators which include the Basel risk measure (RWA) and total assets (ASSETS), corresponding to estimating Eq. (5). Finally, we show how the business cycle and capitalization affect benefits to members (BENEF).
(Insert Table B.5, Panel A here)
Table B.5 (Panel A) presents the result of estimating Eq. (4), the Hansen test and the tests of serial correlation in the residuals. With respect to GDPG_P, provincial GDP growth, we find a positive and significant coefficient. Hence, business cycles do affect the buffers’ behavior (H1a: ���≠ 0). This is consistent with the positive relation found by Goddard, McKillop and Wilson (2015) for US credit unions. This result suggests that there is no need to require credit unions to build their buffers during booms (as suggested by the Basel III countercyclical capital buffer requirement), as they already do so. However, we find an opposite result for low-capitalized credit unions (below the median capital), by interacting the dummy variable of low capitalization (dyLOW) and the business cycle variable (GDPG_P). Hence, low-capitalized credit unions are those who will be directly impacted by the new Basel III countercyclical and conservative capital buffers. Results also suggest that credit unions with higher buffers also hold more liquid assets. To explore further the cyclical behavior depicted by Eq. (4), we run regressions relating to Eq. (5) on both components of the Basel risk-based capital buffer, i.e., capital (CAP) and risk-weighted assets (RWA). We only focus on the Basel risk-based buffer (BUFF_R) because new buffer requirements in Basel III are risk-based.
(Insert Table B.6 here)
Based on results of Table B.6, we find evidence that credit unions increase their capital position during booms. The coefficient of the CYLC_P in the first column is positive and significant, meaning that credit unions build up their buffers during booms so that they are not forced to curtail credit allocation during busts. However, the negative cyclical behavior found for low-capitalized credit unions is due to the reduction in their capital position during booms. We get this result by interacting the dummy variable of low capitalization (dyLOW)
3 Recall that the capital buffer is the additional capital banks hold above the minimum required. BUFF_A is the additional capital banks hold above the minimum capital-to-asset or leverage ratio. BUFF_R is the additional capital credit unions hold above the minimum capital-to-risk weighted assets ratio.

17
and the business cycle variable (GDPG_P). We obtain a negative and significant coefficient in column 1. In addition to their low capital in booms, low-capitalized credit unions increase their risk taking (RWA) during booms. We find a positive and significant relation between credit unions’ risk proxied by RWA and GDPG_P*dyLOW, the interaction variable term in column 2. This result is consistent with Stolz and Wedow (2011) for German banks. While low-capitalized banks effectively increase their exposure to credit risk by increasing risk-weighted assets in a boom, they fail to increase capital accordingly. This is also consistent with Ayuso, Perez and Saurina (2004), who point out that banks that do not build up capital sufficiently in booms to cover for the higher exposure to credit risk will be forced to increase buffers during busts. This stance from low-capitalized credit unions may be explained by the challenge they face to adjust quickly.
We finally address the cyclical behavior of the credit union benefits to members (BENEF). Let us recall that the main objective of credit unions is to grant competitive rates on loans and deposits to their members. Our analysis (column 3, Table B.6) suggests that there is no cyclical behavior in the way credit unions provide benefit to members. However, there is a negative relation between the size (SIZE) and age (AGE) of the credit union. This result may be explained by the fact that large credit unions tend to behave like banks and as such can diversify and expand the ways they reward their members. This may also be valid for the variable AGE as major large credit unions in Canada are likely the old ones.
6. Other extensions
Section 5 suggests that low-capitalized credit unions (below median capital) may be subject to a countercyclical capital buffer. In this section, we investigate additional credit union characteristics which may suggest implementation of a countercyclical capital buffer. We look at credit union profitability, credit union members’ shares value and credit union diversification.
A. Capital buffer cyclical behavior and credit union profitability ratio
We assess whether credit unions’ profitability has any explanatory power on their capital buffer management. We proxy the profitability ratio as the interest income divided by interest expense, a measure close to the earning coverage ratio. It measures the return on each $1 invested in interest activity. On average, credit unions’ interest activity profitability ratio averages 2.80. So on average each $1 invested returned $2.08. This profitability ratio has increased from 1.59 in the crisis period to 2.45 in the post-crisis period (see Table A.5). We conduct this analysis by replacing the capitalization variable (dyLOW) in Eq.(4) by a the dichotomous variable dyProfLOW which takes a value of 1 if the median credit union profitability ratio is below the whole sample median profitability ratio. Results show that credit unions with a higher profitability ratio (dyProfLOW=0) have a significant higher capital buffer compared to less profitable ones. They grant smaller benefit to their members compared to less profitable credit unions (see Table B.8, panel 2). The correlation matrix reported in Table B.7 attests that profitability ratio affects the cyclical behavior of Canadian credit union risk-based capital buffers (BUFF_R). The negative relation between the risk-based capital buffer BUFF_R and dyProfLOW*GDPG_P
suggests that less profitable credit unions failed to prudently manage their capital buffer.
18
B. Capital buffer cyclical behavior and credit union members’ value
There is evidence in the banking literature that banks with a higher charter value may adopt prudential capital management to protect their wealth against credit losses. In this section, we evaluate whether any credit union proxy for charter value has any explanatory power on the cyclical behavior of capital buffer. We proxy the credit union charter value by the members’ share value calculated as the total retained earnings divided by total member shares. The value of member shares increased significantly during the sample period due to an accumulation of retained earnings. From an average of 4.05 it is now 33.59 (see Table A.5). We conduct this analysis by replacing the capitalization variable (dyLOW) in Eq.(4) by a dichotomous variable dyValLOW which takes a value of 1 if the median credit union member share value is below the whole sample members’ shares value median. Results indicate that credit unions with high members’ shares value (dyValLOW=0) have a significant lower assets-based buffer (BUFF_A) compared to less valued ones. They, however, hold significantly higher liquid assets, take less risk and are more profitable (see Table B.8, panel 2). The correlation matrix presented in Table B.7 shows that the members’ share value affects the cyclical behavior of Canadian credit union capital buffer measured as the excess of capital above the minimum capital-to-assets or leverage ratio (BUFF_A). The positive relation between the leverage ratio buffer BUFF_A and dyValLOW*GDPG_P mean that credit unions with low net worth (measured by retained earnings per dollar of member shares) prudently managed their capital buffer through the business cycle.
C. Capital buffer cyclical behavior and credit union diversification
Credit unions diversifying by way of non-interest income may offset shocks to their interest income during stress periods. Köhler (2015) shows that savings and cooperative banks in the European Union will be significantly more stable and profitable if they increase their share of non-interest income, benefitting greatly from income diversification. This revenue diversification may strengthen their ability to build a capital buffer through earnings retention and by supporting asset growth. In this section, we evaluate whether credit union diversification via non-interest income has any explanatory power on their capital buffer cyclical behavior. We proxy diversification as non-interest income divided by interest income. This ratio aims to compare non-interest to interest income. Non-interest activities can be used as a hedge for interest revenue volatility if they can provide additional revenue to a credit union during a stress period. This ratio averages 0.46 through the whole sample, i.e., non-interest activities earned $0.46 for each dollar obtained from interest activities, on average. Up from $0.13 in non-interest earnings for each dollar from interest activities in the pre-crisis period, this ratio was as high as $1.48 during the crisis. Its highest value was recorded in 2009, the crisis year in Canada. This means that Canadian credit unions have made $1.48 in non-interest income for each dollar returned by interest activities. Interestingly, the diversification ratio drops to nearly its pre-crisis value today and averages $0.15 (see Table A.5). We account for diversification effects to study how it affects the cyclical behavior of credit union capital buffers. To achieve this goal, we replace the capitalization dyLOW variable by a new dichotomous variable dyDivLOW which takes a value of 1 if the credit union median diversification proxy is below the whole sample diversification median. A correlation analysis shows that the diversification effect on the cyclical behavior of capital buffers are non-significant (see Table B.7). Existing literature

19
on credit union diversification shows that there is a relation between credit union capitalization and diversification. According to Goddard, McKillop and Wilson (2008), the effect of diversification is positive for well-capitalized credit unions (found in Jackson, 2011) and negative for under-capitalized ones.
7. Robustness checks Previously, we use the regulatory measure of risk (RISK) (risk-weighted assets per unit of assets) and the provision per unit of asset (LOSS) to proxy for credit union backward and forward looking risk. One may criticize that risk-weighted assets are easy to game (for example, via securitization). In this section, we use an alternative risk measure that is closer to the credit union default risk measure: the ZSCORE measure. According to Esho et al. (2005), ZSCORE is an accounting-based measure of the probability of bankruptcy and is defined as the likelihood of incurring a loss greater than the credit union’s total capital.
AB��!" =�CD − �EFG
HEFG
where CAP is the capital-to-assets ratio, �EFG is the average ROA and HEFG is the ROA volatility.
(Insert Table B.10 here)
Our results suggest that the relation of the capital buffer to GDP growth and the cross variable CYCL*dyLOW remains unchanged.
(Insert Table B.9 here)
We also check whether results are driven by major credit unions such as Caisse Centrale Desjardins and Vancity credit union, or smaller ones, by excluding them from the analysis. We mainly compute deciles based on credit union size and run our regressions on the 2nd to 9th decile. This allows us to exclude largest and smallest credit unions from our sample without drastically reducing our sample. The results are similar to findings in section 5. We conclude that our results are not driven by observations in the distribution tails.
(Insert Table B.5, Panel B here)
We also test whether our results on the cyclical behavior of the capital buffers are driven by the major shock in GDP experienced in 2009 following the subprime crisis. We perform the Blundell-Bond analysis ignoring the year 2009 and obtain similar results to those reported previously (see Panel B of Table B.5).

20
8. Conclusion
This paper examines how the capital buffers (Basel risk-based and leverage ratio) of Canadian credit unions fluctuate over the business cycle. We find strong evidence that capital buffers (risk-based and assets-based) behave countercyclically. However, credit unions with low capital buffers react differently to the business cycle than credit unions with relatively higher capital buffers. Low-capitalized credit unions (below median capital) decrease capital buffers during busts. This decrease is jointly driven by capital and risk-weighted assets. Low-capitalized banks reduce capital and raise risk-weighted assets over the business cycle. One plausible explanation, suggested by Stolz and Wedow (2011), may be credit unions’ differing risk attitudes. A low capital buffer would then simply reflect lower credit union risk aversion. Furthermore, Blum (1999) shows that constrained banks may take higher risk to target higher profits in order to meet capital requirements. This behavior of low-capitalized credit unions may also reflect their poor risk management. Based on these results, we recommend regulators to implement the conservation buffer requirement to force low-capitalized credit unions to hold additional buffers. In effect, new buffer requirements would not impact well-capitalized credit unions as they already hold sufficient countercyclical capital buffers. It is worth noting that credit unions do not decrease their risk-taking during bad times, a feature that underscores the importance they give to sustaining vigorous credit allocation during recessions to revive the economy. Additional analyses suggest that credit unions with low net worth prudently build up their capital buffers. Less profitable credit unions hold smaller buffers compared to those of more profitable credit unions and fail to prudently manage their capital buffers through the business cycle. Finally, we find that credit union benefits to members are not prone to the business cycle but rather decrease with the credit union’s age and size.
21
Appendix A
Regulation of credit unions in Canada: A synthesis by province
Information on the credit union regulation comes from provincial Credit Union Act and Credit Unions’ annual reports.
1. British Columbia (BC)
Regulatory capital requirements are governed by the "Financial Institution Commission of British Columbia" (FICOM). They use the risk-weighted assets approach developed by the Bank of International Settlements 'BIS'. FICOM establishes a minimum risk-weighted capital ratio of 8%. In addition, FICOM recently required banks to hold a capital ratio of 10% and asked the credit unions to set their own capital ratios or target a capital ratio limit above the 10% limit. This capital ratio must include a minimum of 50% of core capital or Tier 1 (share capital "equity shares" and retained earnings). In addition, at least 35% of the regulatory capital must be retained earnings. Additional capital or Tier 2 capital, includes subordinated bonds, other investment shares and the share capital that does not meet the requirements of the capital base.
2. Ontario (ON)
Credit unions operating in the Province of Ontario are required to have a sufficient level of capital to protect themselves against unexpected losses and to align with the rules dictated by the "Credit Unions and Caisses Populaires Act Ontario." Under the "Act" all cooperatives are required to respect the 02 following ratios: (a) regulatory capital / total assets ≥ 4%, (b) regulatory capital / risk-weighted assets ≥ 8%. According to the "Act", the regulatory capital includes investment share of investment operations (investment shares), the share capital (member shares), retained earnings, the job gains and losses not yet realized (accumulated other comprehensive income) and the posted profits to be distributed to members (owner shares). The calculation of the risk-weighted assets is based on the guidelines dictated by the "Act". In addition, no payment will be made from regulatory capital that lowers it below regulatory requirements.
3. Saskatchewan (SK)
Credit Union Deposit Guarantee Corporation (CUDGC) is the regulator of the province of Saskatchewan credit unions and dictates the capital adequacy measures. These measures are based on the work of the Basel III committee and were adopted by all financial institutions in the world including Canadian credit unions. Currently the CUDGC implemented four essential rules to assess the level of capital of cooperatives: A minimum capital ratio of 8%, a minimum Tier1 risk-based ratio of 4.5% and a minimum leverage ratio of 5%. The threshold of the risk-weighted assets are calculated in accordance with CUDGC guidelines. To this end, credit risk, derivatives, off-balance sheet commitments and operational risk must be kept into account when calculating the risk-weighted assets.
4. Manitoba (MB)
Cooperatives operating in the Province of Manitoba are regulated by the "Deposit Guarantee Corporation of Manitoba". This regulatory body requires all cooperatives to maintain a level of regulatory capital satisfying the following conditions: (a) a leverage ratio limit of 5%, (b) a minimum "retained earnings" of 3% of the book value of assets and (c) a minimum risk-based capital ratio 8%.
5. Alberta (AB)
All cooperatives in the province of Alberta are subject to the guidelines and rules imposed by the "Credit Union Act of the Province of Alberta" under the supervision of the "Credit Union Deposit Guarantee Corporation". The "Act" ensures that the Province of Alberta honors its commitments to depositors. In addition, the "Act" requires all cooperatives to hold sufficient capital to protect themselves against unexpected losses. To this end, retained earnings constitute the form of the most stable and least expensive capital. Consequently, the "Act" encourages cooperatives to favor this category of capital. The capital requirements are established by the "Act" and regulated by "The Corporation". This regulatory proceeding requires that cooperatives must have a regulatory capital that meets the following two conditions: a leverage ratio limit of 5% and a risk-based capital ratio of 10.5%.
6. Prince Edward Island (PEI)
The regulatory authority "Credit Union Insurance Corporation" (CUDIC) was incorporated under the laws of Prince Edward Island to protect the deposits of the members of this province’s credit unions. This institution ensures that the Government of Prince Edward Island provide protection to member deposits. All cooperatives are required under the guidelines of the CUDIC to maintain a minimum capital-to-total assets ratio of 5%.
7. Newfoundland and Labrador (NL)
The organization "Credit Union Deposit Guarantee Corporation" is a provincial Crown corporation created to insure deposits of cooperative members in Newfoundland and Labrador. The company is responsible for the administration of cooperative activities and ensures the application of the regulations of the law on the part of cooperatives. The province requires credit unions to hold a capital reserve made up of member shares and retained earnings equal to 5% of total assets, and retained earnings to be minimally 3% of total assets. In addition, these financial institutions must maintain a minimum capital ratio (calculated on risk-weighted assets) of 8%.
8. Nova Scotia (NS)

22
Credit unions in Nova Scotia must comply with the regulatory requirements for regulatory capital imposed by the "Credit Union Act of Nova Scotia". The equity of the cooperative must at all times exceed 5% of total assets and the capital ratio must exceed 8%.
9. New Brunswick (NB)
Credit unions in this province are required to hold a 5% minimum capital-to-assets ratio. In addition, the risk-based capital-to-total assets ratio must meet the regulatory requirement of 8%.
Table A.1: Breakdown by provinces of the 100 largest cooperatives
This table shows the distribution of the 100 largest cooperatives we use in this study by province. Among the 100 largest cooperatives, we have not identified cooperatives in federal territories such as: NW Territories, Nunavut and Yukon.
Province Number of credit unions
Alberta (AB) 11
British Colombia (BC) 27
Manitoba (MB) 20
Quebec (Qc) 1
New Brunswick (NB) 1
Newfoundland and Labrador (NL) 1
Nova Scotia (NS) 2
Ontario (ON) 25
Prince Edward Island (PEI) 1
Saskatchewan (SK) 11
Total 100
Table A.2: List of regulators by province
This table shows the various regulatory institutions in charge of regulation in the various provinces of Canada. These regulatory institutions are also responsible to insure deposits in different provinces.
Provinces Regulators Abbreviations
BC The Credit Union Deposit Insurance Corporation « CUDIC »
AB The Credit Union Deposit Guarantee Corporation « CUDGC »
SK The Credit Union Deposit Guarantee Corporation « CUDGC »
MB The Deposit Guarantee Corporation of Manitoba « DGCM »
ON The Deposit Insurance Corporation of Ontario « DICO »
QC Autorité des Marchés Financiers « AMF »
NB The New Brunswick Credit Union Deposit Insurance Corporation « CUDIC »
NS The Nova Scotia Credit Union Deposit Insurance Corporation « NSCUDIC »
PEI The Credit Union Deposit Insurance Corporation « CUDIC »
NL The Credit Union Deposit Guarantee Corporation « CUDGC »
23
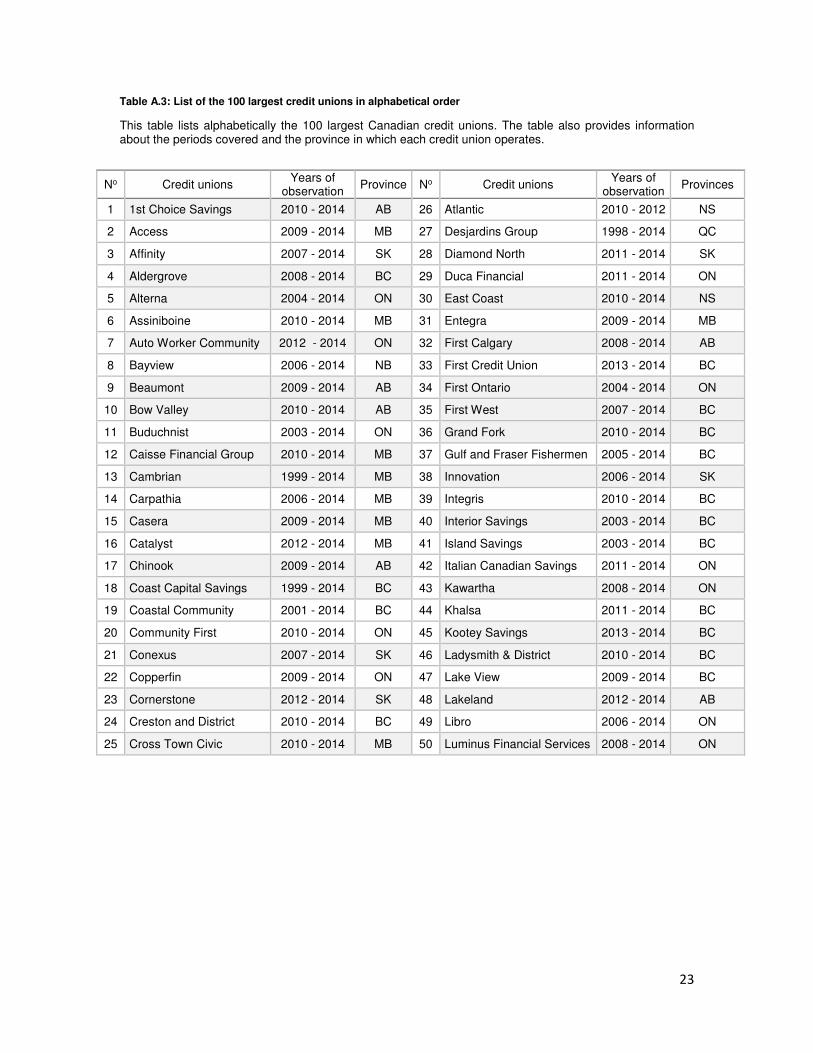
Table A.3: List of the 100 largest credit unions in alphabetical order
This table lists alphabetically the 100 largest Canadian credit unions. The table also provides information about the periods covered and the province in which each credit union operates.
No Credit unions Years of
observation Province No Credit unions
Years of observation
Provinces
1 1st Choice Savings 2010 - 2014 AB 26 Atlantic 2010 - 2012 NS
2 Access 2009 - 2014 MB 27 Desjardins Group 1998 - 2014 QC
3 Affinity 2007 - 2014 SK 28 Diamond North 2011 - 2014 SK
4 Aldergrove 2008 - 2014 BC 29 Duca Financial 2011 - 2014 ON
5 Alterna 2004 - 2014 ON 30 East Coast 2010 - 2014 NS
6 Assiniboine 2010 - 2014 MB 31 Entegra 2009 - 2014 MB
7 Auto Worker Community 2012 - 2014 ON 32 First Calgary 2008 - 2014 AB
8 Bayview 2006 - 2014 NB 33 First Credit Union 2013 - 2014 BC
9 Beaumont 2009 - 2014 AB 34 First Ontario 2004 - 2014 ON
10 Bow Valley 2010 - 2014 AB 35 First West 2007 - 2014 BC
11 Buduchnist 2003 - 2014 ON 36 Grand Fork 2010 - 2014 BC
12 Caisse Financial Group 2010 - 2014 MB 37 Gulf and Fraser Fishermen 2005 - 2014 BC
13 Cambrian 1999 - 2014 MB 38 Innovation 2006 - 2014 SK
14 Carpathia 2006 - 2014 MB 39 Integris 2010 - 2014 BC
15 Casera 2009 - 2014 MB 40 Interior Savings 2003 - 2014 BC
16 Catalyst 2012 - 2014 MB 41 Island Savings 2003 - 2014 BC
17 Chinook 2009 - 2014 AB 42 Italian Canadian Savings 2011 - 2014 ON
18 Coast Capital Savings 1999 - 2014 BC 43 Kawartha 2008 - 2014 ON
19 Coastal Community 2001 - 2014 BC 44 Khalsa 2011 - 2014 BC
20 Community First 2010 - 2014 ON 45 Kootey Savings 2013 - 2014 BC
21 Conexus 2007 - 2014 SK 46 Ladysmith & District 2010 - 2014 BC
22 Copperfin 2009 - 2014 ON 47 Lake View 2009 - 2014 BC
23 Cornerstone 2012 - 2014 SK 48 Lakeland 2012 - 2014 AB
24 Creston and District 2010 - 2014 BC 49 Libro 2006 - 2014 ON
25 Cross Town Civic 2010 - 2014 MB 50 Luminus Financial Services 2008 - 2014 ON

24
Table A.3: List of the 100 largest credit unions in alphabetical order (continuation and end)
No Credit unions Years of
observation Province No Credit unions
Years of observation
Province
51 Mainstreet 2012 - 2014 ON 76 Servus 2007 - 2014 AB
52 Mennonite Savings 2010 - 2014 ON 77 Sharons 2009 - 2014 BC
53 Meridian 2004 - 2014 ON 78 Shell 2012 - 2014 AB
54 Mountain View 2007 - 2014 AB 79 Starbuck 2010 - 2014 MB
55 Newfoundland & Labrador 2005 - 2014 NL 80 Steinbach 2008 - 2014 MB
56 Niverville 2009 - 2014 MB 81 Sudbury 2006 - 2014 ON
57 North Peace Savings 2009 - 2014 BC 82 Sunova 2011 - 2014 MB
58 North Shore 2011 - 2014 BC 83 Sunrise 2008 - 2013 MB
59 Northern 2009 - 2014 ON 84 Sunshine Coast 2001 - 2014 BC
60 Northern Light 2011 - 2013 ON 85 Swan Valley 2013 - 2014 MB
61 Northshore Financial 2008 - 2014 BC 86 Synergie 2009 - 2014 SK
62 Northern Savings 2008 - 2014 BC 87 Tandia 2013 - 2014 ON
63 Noventis 2010 - 2014 MB 88 TCU 2009 - 2014 SK
64 Pace 2006 - 2013 ON 89 The Police 2011 - 2014 ON
65 Penfincial 2009 - 2014 ON 90 Ukrainian 2005 - 2014 ON
66 Pierceland 2012 - 2014 SK 91 Vancity 1996 - 2014 BC
67 Portage 2008 - 2014 MB 92 Vanguard 2007 - 2014 MB
68 Prairie Centre Union 2011 - 2014 SK 93 Vantage One Credit Union
2012 - 2014 BC
69 Prospera 2001 - 2014 BC 94 Vision Battle River 1998 - 2014 AB
70 Provincial 2009 - 2013 PE 95 Westminster Savings 2009 - 2014 BC
71 Radius 2009 - 2014 SK 96 Westoba 2002 - 2014 MB
72 Revelstoke 2013 - 2014 BC 97 Weyburn 2012 - 2014 SK
73 Rocky 2006 - 2014 AB 98 WFCU 2006 - 2014 ON
74 Rosenort 2008 - 2014 MB 99 Your CU 2008 - 2014 ON
75 Salmon Arm Savings 2012 - 2014 BC 100 Your Neighbourhood 2007 - 2014 ON

25
Table A.4: Average assets and liabilities, major components in 1000s of $CAD
This table presents the average of major asset and liability components in 1000s of $CAD. We provide descriptive statistics for the whole sample period (1996-2014) and three sub-periods: the pre-crisis period (1996 to 2006), the crisis period (2007-2009) and the post-crisis period (2010-2014). We account for heterogeneity in size by computing weighted statistics. Weights are computed for a given credit union as the ratio of its average total assets and the sum of all credit union average assets. Weights must sum to 1. On the assets side we compute statistics for cash, loans to members and investments. On the liabilities and members’ equity side, we look at the member deposits, borrowings and members’ equity. Data covers the 100 largest credit unions in Canada according to the ranking of the Credit Union Central Canada (CUCA) during the 1996-2014 period.
Assets and liabilities (in 1000s $CAD)
1996-2014 1996-2007 2007-2009 2009-2014
Assets (major components) in 1000s $CAD Cash 280,399.5 359,614 418,212.9 158,318.3
Loans to members 6,649,570.9 5,780,384.3 6,272,912.9 7,458,044.8 Investments 1,428,026.9 1,477,173.5 1,145,947.0 1,524,266.5
Total assets 9,192,280.4 8,263,917.8 8,852,468.9 10,000,000 Liabilities and member’s equity (major components) in 1000s $CAD
Member deposits 7,422,235.5 6,715,729.2 6,869,167.6 8,194,868.8 Borrowings 216,344 187,789.6 275,742.1 203,853.4
Total liabilities 8,221,307 7,880,625 7,423,582 8,843,668 Members’ equity 515,619.9 377,240 465,368.2 640,249.9
Table A.5: Assets and liabilities, major components in proportions, profitability, diversification and value measures
This table presents major components of assets and liabilities in relative proportions. We also add some additional measures for profitability, membership value and diversification. We provide descriptive statistics for the whole sample period (1996-2014) and three sub-periods: the pre-crisis period (1996 to 2006), the crisis period (2007-2009) and the post-crisis period (2010-2014). We account for heterogeneity in size by computing weighted statistics. Weights are computed for a given credit union as the ratio of its average total assets and the sum of all credit union average assets. Weights must sum to 1. On the assets side we compute statistics for cash, loans to members and investments. On the liabilities and members’ equity side, we look at the member deposits, borrowings and members’ equity. Data covers the 100 largest credit unions in Canada according to the ranking of the Credit Union Central Canada (CUCA) during the 1996-2014 period.
Shares of assets and liabilities components in % 1996-2014
1996-2006
2007-2009
2010-2014
Asset structure (major components) in % Cash 0.04 0.05 0.05 0.03
Loans to members 0.79 0.75 0.78 0.81 Investments 0.12 0.14 0.10 0.11
Total liabilities and member’s equity structure (major components) in % Member deposits 0.86 0.85 0.87 0.87
Borrowings 0.03 0.03 0.03 0.02 Members’ equity 0.06 0.05 0.07 0.06
Others statistics Members’ value = retained earnings / members’ shares 23.30 4.05 16.45 33.59
Interest profitability = interest income/ interest expenses 2.08 1.59 1.87 2.45 Diversification = non-interest income/ interest income 0.46 0.13 1.48 0.15
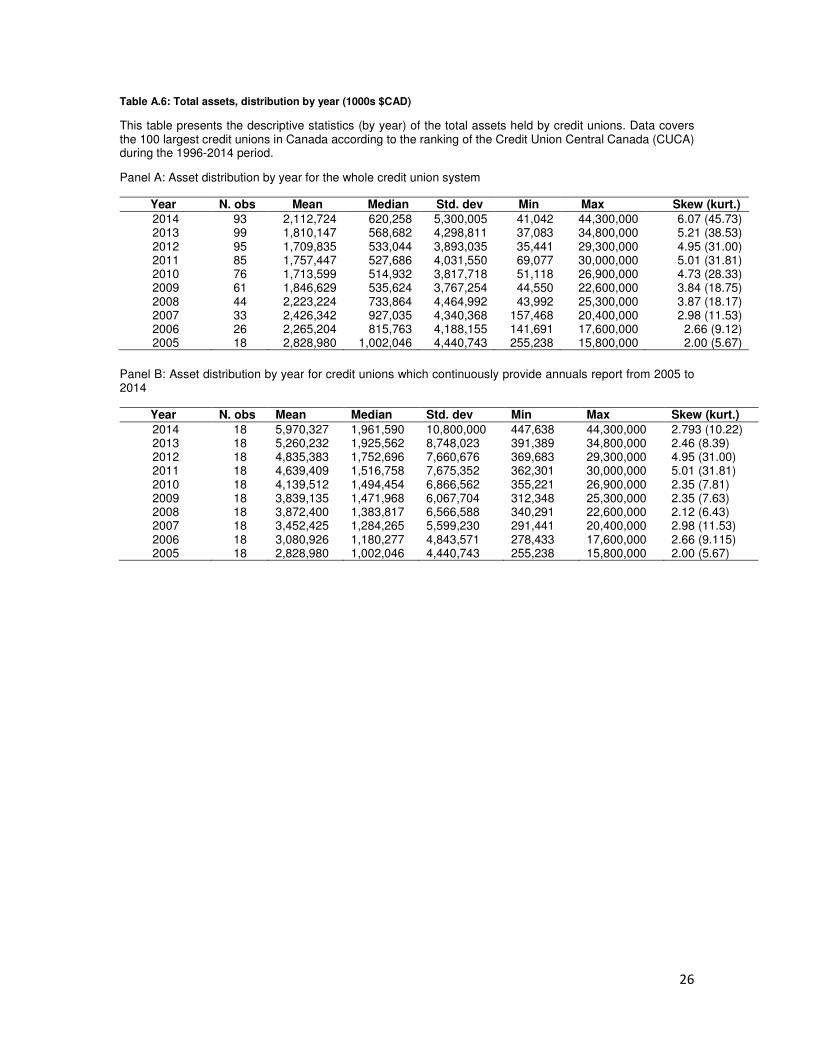
26
Table A.6: Total assets, distribution by year (1000s $CAD)
This table presents the descriptive statistics (by year) of the total assets held by credit unions. Data covers the 100 largest credit unions in Canada according to the ranking of the Credit Union Central Canada (CUCA) during the 1996-2014 period.
Panel A: Asset distribution by year for the whole credit union system
Panel B: Asset distribution by year for credit unions which continuously provide annuals report from 2005 to 2014
Year N. obs Mean Median Std. dev Min Max Skew (kurt.) 2014 93 2,112,724 620,258 5,300,005 41,042 44,300,000 6.07 (45.73) 2013 99 1,810,147 568,682 4,298,811 37,083 34,800,000 5.21 (38.53) 2012 95 1,709,835 533,044 3,893,035 35,441 29,300,000 4.95 (31.00) 2011 85 1,757,447 527,686 4,031,550 69,077 30,000,000 5.01 (31.81) 2010 76 1,713,599 514,932 3,817,718 51,118 26,900,000 4.73 (28.33) 2009 61 1,846,629 535,624 3,767,254 44,550 22,600,000 3.84 (18.75) 2008 44 2,223,224 733,864 4,464,992 43,992 25,300,000 3.87 (18.17) 2007 33 2,426,342 927,035 4,340,368 157,468 20,400,000 2.98 (11.53) 2006 26 2,265,204 815,763 4,188,155 141,691 17,600,000 2.66 (9.12) 2005 18 2,828,980 1,002,046 4,440,743 255,238 15,800,000 2.00 (5.67)
Year N. obs Mean Median Std. dev Min Max Skew (kurt.)
2014 18 5,970,327 1,961,590 10,800,000 447,638 44,300,000 2.793 (10.22) 2013 18 5,260,232 1,925,562 8,748,023 391,389 34,800,000 2.46 (8.39) 2012 18 4,835,383 1,752,696 7,660,676 369,683 29,300,000 4.95 (31.00) 2011 18 4,639,409 1,516,758 7,675,352 362,301 30,000,000 5.01 (31.81) 2010 18 4,139,512 1,494,454 6,866,562 355,221 26,900,000 2.35 (7.81) 2009 18 3,839,135 1,471,968 6,067,704 312,348 25,300,000 2.35 (7.63) 2008 18 3,872,400 1,383,817 6,566,588 340,291 22,600,000 2.12 (6.43) 2007 18 3,452,425 1,284,265 5,599,230 291,441 20,400,000 2.98 (11.53) 2006 18 3,080,926 1,180,277 4,843,571 278,433 17,600,000 2.66 (9.115) 2005 18 2,828,980 1,002,046 4,440,743 255,238 15,800,000 2.00 (5.67)

27
Appendix B
Table B.1: Definition of the variables
This table presents the dependent variables, the business cycle indicators and the credit union-specific (control) variables.
Dependent variables BUFF_R (risk-based) Basel capital to risk-weighted assets ratio minus 8% BUFF_A (assets-based) The leverage ratio minus 5% CAP Total regulatory capital scaled by the whole sample average regulatory capital RWA Risk-weighted assets scaled by the whole sample average risk-weighted assets Business cycle variables CYCL(Provincial) GDP growth by province CYCL (Canada) Canadian GDP growth Credit unions specific (control) variables LIQUID Cash over total assets RISK Risk-weighted assets scaled by total assets SIZE Natural log of total assets ROA Annual net profit before taxes over total assets dyMERGER 1 for the acquirer in the year of the merger and 0 otherwise dyLOW 1 if the credit union is among the 50% least capitalized in a respective year LOSS Loan loss provision over total loans AGE BENEF
Age of the credit union Benefit to members
Table B.2: Descriptive statistics for the business cycle indicator
This table presents descriptive statistics on the proxies for the business cycle. We use the provincial and Canadian GDP (gross domestic product) growth, respectively GDPG_P and GDPG_C. Data covers the 100 largest credit unions in Canada according to the ranking of the Credit Union Central Canada (CUCA) during the 1996-2014 period.
Mean Std. dev Median Minimum Maximum GDPG_P 0.038 0.053 0.041 -0.20 0.19 GDPG_C 0.040 0.030 0.042 -0.04 0.09
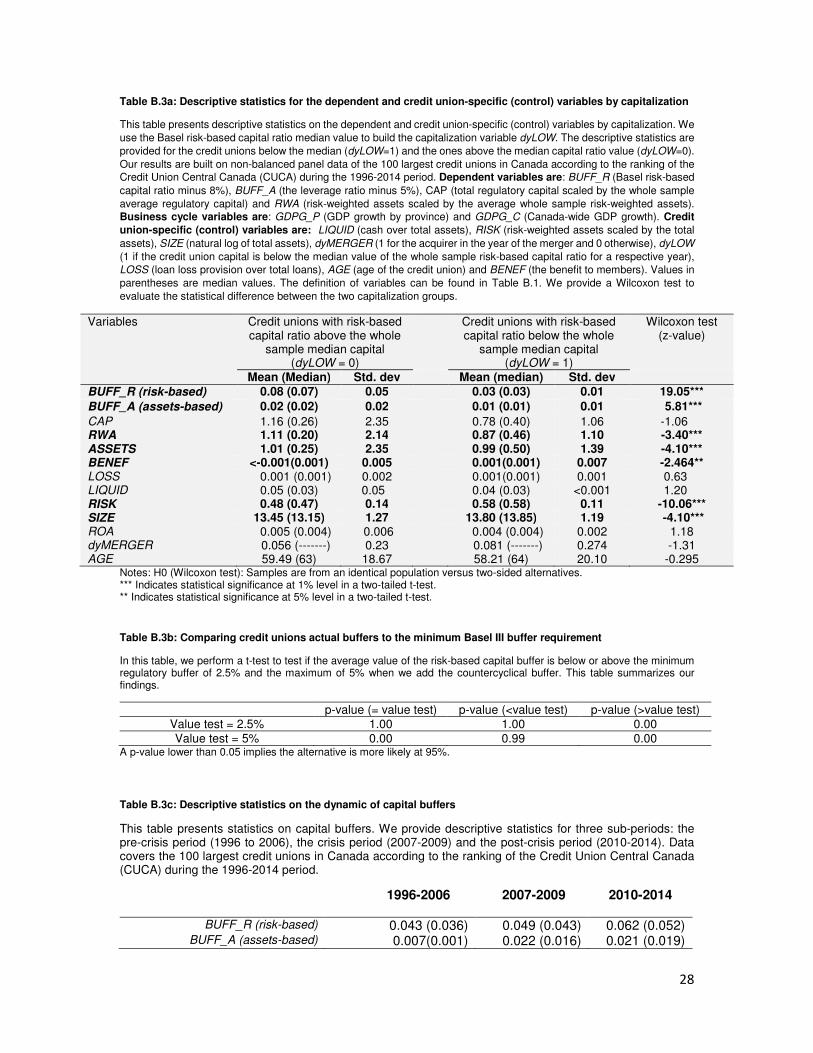
28
Table B.3a: Descriptive statistics for the dependent and credit union-specific (control) variables by capitalization
This table presents descriptive statistics on the dependent and credit union-specific (control) variables by capitalization. We use the Basel risk-based capital ratio median value to build the capitalization variable dyLOW. The descriptive statistics are provided for the credit unions below the median (dyLOW=1) and the ones above the median capital ratio value (dyLOW=0). Our results are built on non-balanced panel data of the 100 largest credit unions in Canada according to the ranking of the Credit Union Central Canada (CUCA) during the 1996-2014 period. Dependent variables are: BUFF_R (Basel risk-based capital ratio minus 8%), BUFF_A (the leverage ratio minus 5%), CAP (total regulatory capital scaled by the whole sample average regulatory capital) and RWA (risk-weighted assets scaled by the average whole sample risk-weighted assets). Business cycle variables are: GDPG_P (GDP growth by province) and GDPG_C (Canada-wide GDP growth). Credit
union-specific (control) variables are: LIQUID (cash over total assets), RISK (risk-weighted assets scaled by the total assets), SIZE (natural log of total assets), dyMERGER (1 for the acquirer in the year of the merger and 0 otherwise), dyLOW (1 if the credit union capital is below the median value of the whole sample risk-based capital ratio for a respective year), LOSS (loan loss provision over total loans), AGE (age of the credit union) and BENEF (the benefit to members). Values in parentheses are median values. The definition of variables can be found in Table B.1. We provide a Wilcoxon test to evaluate the statistical difference between the two capitalization groups.
Variables Credit unions with risk-based capital ratio above the whole
sample median capital (dyLOW = 0)
Credit unions with risk-based capital ratio below the whole
sample median capital (dyLOW = 1)
Wilcoxon test (z-value)
Mean (Median) Std. dev Mean (median) Std. dev BUFF_R (risk-based) 0.08 (0.07) 0.05 0.03 (0.03) 0.01 19.05***
BUFF_A (assets-based) 0.02 (0.02) 0.02 0.01 (0.01) 0.01 5.81***
CAP 1.16 (0.26) 2.35 0.78 (0.40) 1.06 -1.06 RWA 1.11 (0.20) 2.14 0.87 (0.46) 1.10 -3.40*** ASSETS 1.01 (0.25) 2.35 0.99 (0.50) 1.39 -4.10*** BENEF <-0.001(0.001) 0.005 0.001(0.001) 0.007 -2.464** LOSS 0.001 (0.001) 0.002 0.001(0.001) 0.001 0.63 LIQUID 0.05 (0.03) 0.05 0.04 (0.03) <0.001 1.20 RISK 0.48 (0.47) 0.14 0.58 (0.58) 0.11 -10.06*** SIZE 13.45 (13.15) 1.27 13.80 (13.85) 1.19 -4.10*** ROA 0.005 (0.004) 0.006 0.004 (0.004) 0.002 1.18 dyMERGER 0.056 (-------) 0.23 0.081 (-------) 0.274 -1.31 AGE 59.49 (63) 18.67 58.21 (64) 20.10 -0.295
Notes: H0 (Wilcoxon test): Samples are from an identical population versus two-sided alternatives. *** Indicates statistical significance at 1% level in a two-tailed t-test. ** Indicates statistical significance at 5% level in a two-tailed t-test.
Table B.3b: Comparing credit unions actual buffers to the minimum Basel III buffer requirement
In this table, we perform a t-test to test if the average value of the risk-based capital buffer is below or above the minimum regulatory buffer of 2.5% and the maximum of 5% when we add the countercyclical buffer. This table summarizes our findings.
p-value (= value test) p-value (<value test) p-value (>value test) Value test = 2.5% 1.00 1.00 0.00 Value test = 5% 0.00 0.99 0.00
A p-value lower than 0.05 implies the alternative is more likely at 95%.
Table B.3c: Descriptive statistics on the dynamic of capital buffers
This table presents statistics on capital buffers. We provide descriptive statistics for three sub-periods: the pre-crisis period (1996 to 2006), the crisis period (2007-2009) and the post-crisis period (2010-2014). Data covers the 100 largest credit unions in Canada according to the ranking of the Credit Union Central Canada (CUCA) during the 1996-2014 period.
1996-2006 2007-2009 2010-2014
BUFF_R (risk-based) 0.043 (0.036) 0.049 (0.043) 0.062 (0.052) BUFF_A (assets-based) 0.007(0.001) 0.022 (0.016) 0.021 (0.019)

29
Table B.4: Correlation matrix
This table presents the Pearson correlation statistics on the dependent variables, business cycle variables and credit union-specific (control) variables. Our results are built on non-balanced panel data of the 100 largest credit unions in Canada according to the ranking of the Credit Union Central Canada (CUCA) during the 1996-2014 period. Dependent variables are: BUFF_R (Basel risk-based capital ratio minus 8%), BUFF_A (the leverage ratio minus 5%), CAP (total regulatory capital scaled by the whole sample average regulatory capital) and RWA (risk-weighted assets scaled by the average whole sample risk-weighted assets). Business cycle variables are: GDPG_P (GDP growth by province) and GDPG_C (Canada-wide GDP growth). Credit unions specific (control) variables are: LIQUID (cash over total assets), RISK (risk-weighted assets scaled by the total assets), SIZE (natural log of total assets), dyMERGER (1 for the acquirer in the year of the merger and 0 otherwise), dyLOW (1 if the credit union capital is below the median value of the whole sample risk-based capital ratio for a respective year), LOSS (loan loss provision over total loans), AGE (age of the credit union) and BENEF (the benefit to members).
BUFF_R BUFF_A CAP RWA RISK LOSS LIQUID SIZE GDPG_P
dyLOW*GDPG_P ROA AGE
BUFF_R 1
BUFF_A 0.44 1.00
CAP -0.01 0.01 1.00
RWA -0.07 -0.02 0.99 1.00
RISK -0.36 0.41 -0.13 -0.08 1.00
LOSS 0.02 0.06 -0.06 -0.03 -0.01 1.00
LIQUID 0.34 0.19 -0.13 -0.14 -0.23 0.07 1.00
SIZE -0.25 -0.13 0.75 0.80 0.04 -0.11 -0.23 1.00
GDPG_P -0.03 0.06 -0.04 -0.04 0.06 -0.01 -0.01 0.02 1.00
dyLOW*GDPG_P -0.29 -0.08 -0.03 -0.01 0.28 -0.04 -0.04 0.12 0.615 1.00
ROA 0.07 0.05 -0.03 -0.03 -0.05 -0.02 -0.03 -0.04 0.09 -0.03 1.00
AGE 0.09 -0.13 0.21 0.16 -0.25 -0.08 -0.05 0.09 -0.07 -0.09 -0.07 1.00
Note: We use bold for correlation values significant at the 1% level.
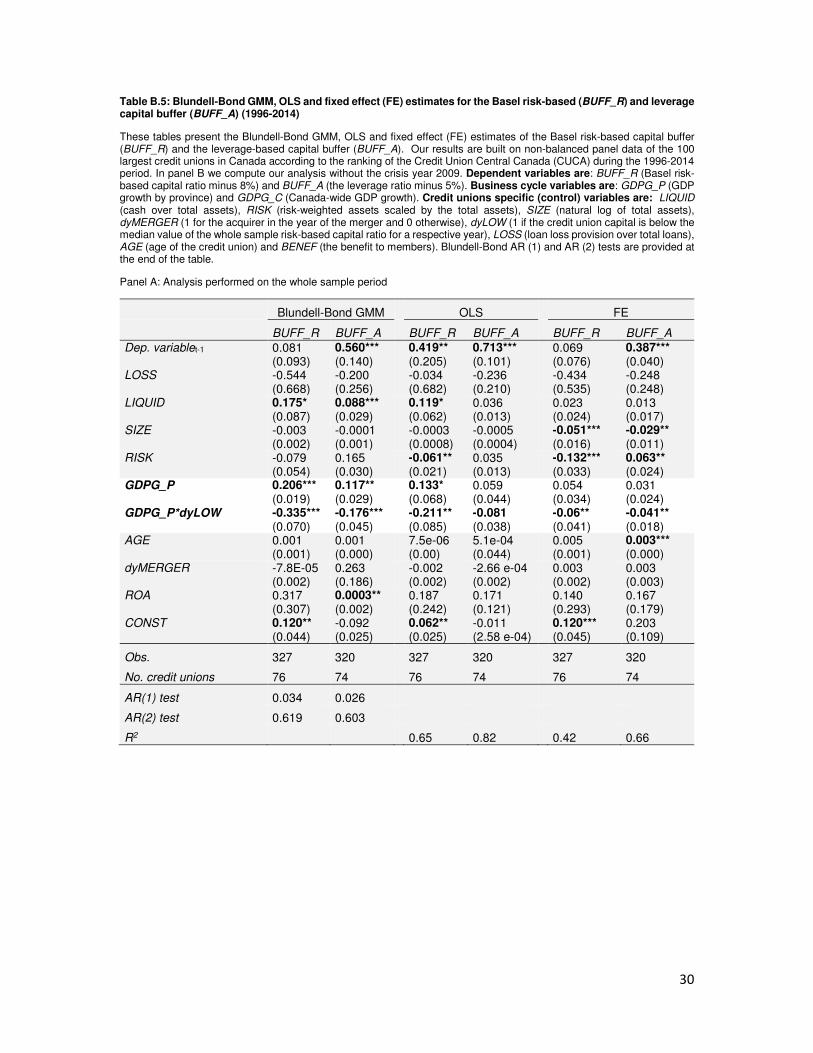
30
Table B.5: Blundell-Bond GMM, OLS and fixed effect (FE) estimates for the Basel risk-based (BUFF_R) and leverage capital buffer (BUFF_A) (1996-2014)
These tables present the Blundell-Bond GMM, OLS and fixed effect (FE) estimates of the Basel risk-based capital buffer (BUFF_R) and the leverage-based capital buffer (BUFF_A). Our results are built on non-balanced panel data of the 100 largest credit unions in Canada according to the ranking of the Credit Union Central Canada (CUCA) during the 1996-2014 period. In panel B we compute our analysis without the crisis year 2009. Dependent variables are: BUFF_R (Basel risk-based capital ratio minus 8%) and BUFF_A (the leverage ratio minus 5%). Business cycle variables are: GDPG_P (GDP growth by province) and GDPG_C (Canada-wide GDP growth). Credit unions specific (control) variables are: LIQUID (cash over total assets), RISK (risk-weighted assets scaled by the total assets), SIZE (natural log of total assets), dyMERGER (1 for the acquirer in the year of the merger and 0 otherwise), dyLOW (1 if the credit union capital is below the median value of the whole sample risk-based capital ratio for a respective year), LOSS (loan loss provision over total loans), AGE (age of the credit union) and BENEF (the benefit to members). Blundell-Bond AR (1) and AR (2) tests are provided at the end of the table.
Panel A: Analysis performed on the whole sample period
Blundell-Bond GMM OLS FE
BUFF_R BUFF_A
BUFF_R BUFF_A
BUFF_R BUFF_A
Dep. variablet-1 0.081 (0.093)
0.560*** (0.140)
0.419** (0.205)
0.713*** (0.101)
0.069 (0.076)
0.387*** (0.040)
LOSS -0.544 (0.668)
-0.200 (0.256)
-0.034 (0.682)
-0.236 (0.210)
-0.434 (0.535)
-0.248 (0.248)
LIQUID 0.175* (0.087)
0.088*** (0.029)
0.119* (0.062)
0.036 (0.013)
0.023 (0.024)
0.013 (0.017)
SIZE -0.003 (0.002)
-0.0001 (0.001)
-0.0003 (0.0008)
-0.0005 (0.0004)
-0.051*** (0.016)
-0.029** (0.011)
RISK -0.079 (0.054)
0.165 (0.030)
-0.061** (0.021)
0.035 (0.013)
-0.132*** (0.033)
0.063** (0.024)
GDPG_P 0.206*** (0.019)
0.117** (0.029)
0.133* (0.068)
0.059 (0.044)
0.054 (0.034)
0.031 (0.024)
GDPG_P*dyLOW -0.335*** (0.070)
-0.176*** (0.045)
-0.211** (0.085)
-0.081 (0.038)
-0.06** (0.041)
-0.041** (0.018)
AGE 0.001 (0.001)
0.001 (0.000)
7.5e-06 (0.00)
5.1e-04 (0.044)
0.005 (0.001)
0.003*** (0.000)
dyMERGER -7.8E-05 (0.002)
0.263 (0.186)
-0.002 (0.002)
-2.66 e-04 (0.002)
0.003 (0.002)
0.003 (0.003)
ROA 0.317 (0.307)
0.0003** (0.002)
0.187 (0.242)
0.171 (0.121)
0.140 (0.293)
0.167 (0.179)
CONST 0.120** (0.044)
-0.092 (0.025)
0.062** (0.025)
-0.011 (2.58 e-04)
0.120*** (0.045)
0.203 (0.109)
Obs. 327 320 327 320 327 320
No. credit unions 76 74 76 74 76 74
AR(1) test 0.034 0.026
AR(2) test 0.619 0.603
R2 0.65 0.82 0.42 0.66
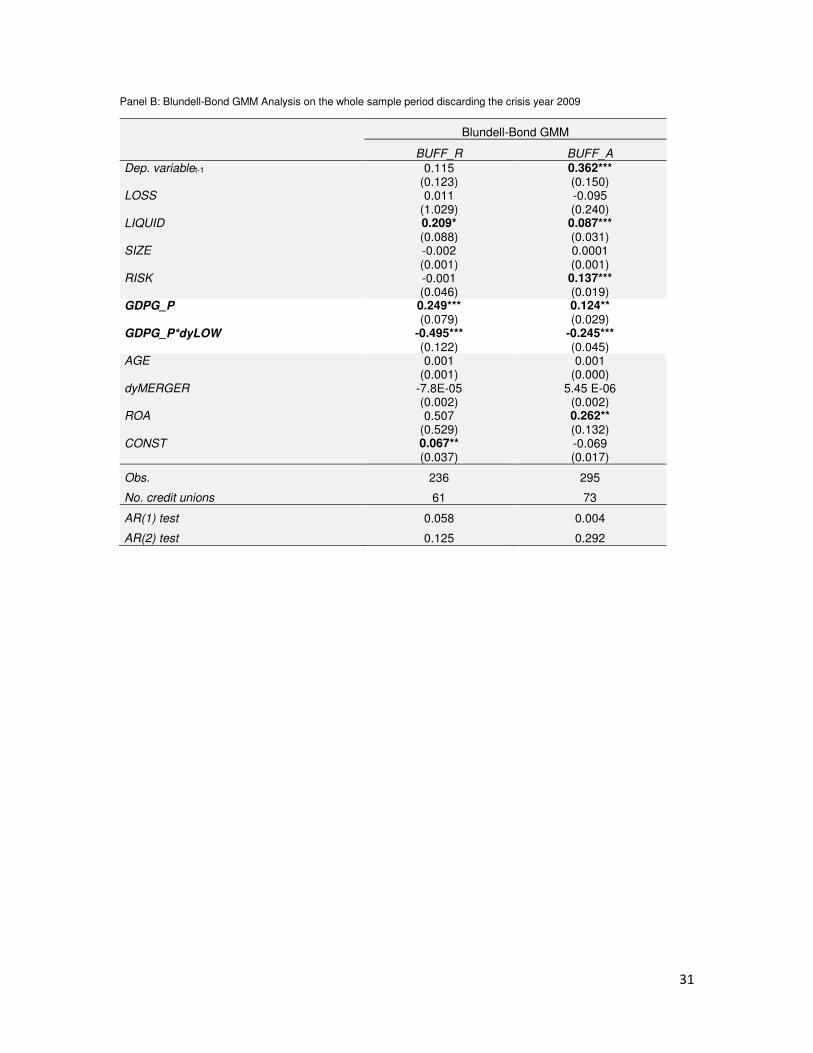
31
Panel B: Blundell-Bond GMM Analysis on the whole sample period discarding the crisis year 2009
Blundell-Bond GMM
BUFF_R BUFF_A
Dep. variablet-1 0.115 (0.123)
0.362*** (0.150)
LOSS 0.011 (1.029)
-0.095 (0.240)
LIQUID 0.209* (0.088)
0.087*** (0.031)
SIZE -0.002 (0.001)
0.0001 (0.001)
RISK -0.001 (0.046)
0.137*** (0.019)
GDPG_P 0.249*** (0.079)
0.124** (0.029)
GDPG_P*dyLOW -0.495*** (0.122)
-0.245*** (0.045)
AGE 0.001 (0.001)
0.001 (0.000)
dyMERGER -7.8E-05 (0.002)
5.45 E-06 (0.002)
ROA 0.507 (0.529)
0.262** (0.132)
CONST 0.067** (0.037)
-0.069 (0.017)
Obs. 236 295
No. credit unions 61 73
AR(1) test 0.058 0.004
AR(2) test 0.125 0.292

32
Table B.6: Blundell-Bond GMM estimates for the regulatory capital (CAP) and risk-weighted assets (RWA) (1996-2014)
This table presents the Blundell-Bond GMM estimates for the regulatory capital (CAP) and risk-weighted assets (RWA). Our results are built on non-balanced panel data of the 100 largest credit unions in Canada according to the ranking of the Credit Union Central Canada (CUCA) during the 1996-2014 period. Dependent variables are: CAP (total regulatory capital scaled by the whole sample average regulatory capital), RWA (risk-weighted assets scaled by the average whole sample risk-weighted assets) and BENEF (the benefit to members). Business cycle variables are: GDPG_P (GDP growth by province) and GDPG_C (Canada-wide GDP growth). Credit unions specific (control) variables are: LIQUID (cash over total assets), RISK (risk-weighted assets scaled by total assets), SIZE (natural log of total assets), dyMERGER (1 for the acquirer in the year of the merger and 0 otherwise), dyLOW (1 if the credit union capital is below the median value of the whole sample risk-based capital ratio for a respective year), LOSS (loan loss provision over total loans), AGE (age of the credit union) and BENEF (the benefit to members).
Blundell-Bond GMM
CAP RWA BENEF
Dep. variablet-1 1.172*** (0.033)
0.791*** (0.202)
0.176 0.252
LOSS 2.132 (5.296)
1.136 (4.734)
-0.023 0.242
LIQUID 0.631 (0.477)
-0.332 (0.212)
0.018 0.021
SIZE -0.033 (0.037)
-0.118 (0.074)
-0.038*** 0.013
RISK 1.758* (0.814)
0.165 (0.030)
0.042 0.031
CAP
0.364** 0.137
-0.0002 0.001
GDPG_P 0.921* (0.532)
-0.425 (0.279)
-0.002 0.015
GDPG_P*dyLOW -1.493* (0.759)
1.035*** (0.418)
0.025 0.023
AGE 0.001 (0.001)
-0.001 (0.001)
0.003*** 0.001
dyMERGER 0.064 (0.042)
0.103** (0.043)
0.005** 0.003
ROA 2.943 (5.520)
-1.803 (2.084)
-0.06 0.08
CONST -0.635** (0.591)
1.550 (1.008)
---
Obs. 320 320 194
No. credit unions 74 74 54

33
Table B.7: Correlation matrix (additional analysis)
This table presents the Pearson correlation statistics on the dependent variables, business cycle variables and credit union-specific (control) variables for additional regression analysis. Our results are built on non-balanced panel data of the 100 largest credit unions in Canada according to the ranking of the Credit Union Central Canada (CUCA) during the 1996-2014 period. Dependent variables are: BUFF_R (Basel risk-based capital ratio minus 8%), BUFF_A (the leverage ratio minus 5%), Business cycle variables are: GDPG_P (GDP growth by province), Credit unions specific (control) variables are: dyProfLOW*GDPG_P where dyProfLOW takes a value of 1 if the credit union profitability ratio is below the median value of the whole sample profitability ratio for a respective year), dyValLOW*GDPG_P where dyValLOW takes a value of 1 if the credit union members’ share value is below the median value of the whole sample member shares value for a respective year) and dyDivLOW*GDPG_P where dyDivLOW takes a value of 1 if the credit union level of diversification is below the median value of the whole sample diversification measure for a respective year).
BUFF_R BUFF_A GDPG_P
BUFF_R 1
BUFF_A 0.44 1.00
GDPG_P -0.03 0.06 1.00
dyProfLOW*GDPG_P -0.13 -0.11 0.34
dyValLOW*GDPG_P 0.003 0.17 0.53
dyDivLOW*GDPG_P 0.03 0.08 0.46
Note: We use bold for correlation values significant at the 1% level.

34
Table B.8: Descriptive statistics for the dependent and credit union-specific (control) variables by profitability and members’ share value
This table presents descriptive statistics on the dependent variables and credit union-specific (control) variables by profitability in panel 1 and by members’ share values in panel 2. Our results are built on non-balanced panel data of the 100 largest credit unions in Canada according to the ranking of the Credit Union Central Canada (CUCA) during the 1996-2014 period. Dependent
variables are: BUFF_R (Basel risk-based capital ratio minus 8%), BUFF_A (the leverage ratio minus 5%), CAP (total regulatory capital scaled by the whole sample average regulatory capital) and RWA (risk-weighted assets scaled by the average whole sample risk-weighted assets). Business cycle variables are: GDPG_P (GDP growth by province) and GDPG_C (Canada-wide GDP growth). Credit unions specific (control) variables are: LIQUID (cash over total assets), RISK (risk-weighted assets scaled by the total assets), SIZE (natural log of total assets), dyMERGER (1 for the acquirer in the year of the merger and 0 otherwise), dyLOW (1 if the credit union capital is below the median value of the whole sample risk-based capital ratio for a respective year), LOSS (loan loss provision over total loans), AGE (age of the credit union) and BENEF (the benefit to members). Values in parentheses are median values. The definition of variables can be found in Table B.1. We provide a Wilcoxon test to evaluate the statistical difference between the two capitalization groups.
Panel 1: Statistics and rank-sum test of variables on two subgroups of credit unions based on the dyProfLOW variable (takes a value of 1 if the credit union profitability ratio is below the median value of the whole sample profitability ratio for a respective year
Variables Credit unions with profitability measure above the whole sample median profitability variable (dyProfLOW = 0)
Credit unions with profitability below the whole sample
median capital (dyProfLOW = 1)
Wilcoxon test (z-value)
Mean (Median) Std. dev Mean (Median) Std. dev BUFF_R (risk-based) 0.06 (0.05) 0.05 0.04 (0.04) 0.02 3.78***
BUFF_A (assets-based) 0.02 (0.02) 0.02 0.01 (0.01) 0.02 6.32***
CAP 0.79 (0.30) 1.30 1.52 (0.36) 2.82 -0.68 RWA 0.79 (0.26) 1.25 1.51 (0.39) 2.47 -1.11 ASSETS 0.80 (0.29) 1.44 1.44 (0.30) 2.97 -0.371 BENEF <-0.001(0.001) 0.005 0.001(0.001) 0.008 -1.956** LOSS 0.001 (0.001) 0.002 0.001(0.001) 0.002 0.908 LIQUID 0.05 (0.03) 0.05 0.05 (0.03) 0.044 1.167 RISK 0.531 (0.53) 0.11 0.51 (0.53) 0.11 1.968 SIZE 13.52 (13.31) 1.15 13.70 (13.32) 1.45 -0.371 ROA 0.005 (0.004) 0.005 0.004 (0.004) 0.003 0.245 dyMERGER 0.07 (-------) 0.25 0.06 (-------) 0.237 0.41 AGE 58.85 (63) 16.97 54.44 (63) 23.31 -0.968
Panel 2: Statistics and rank-sum test of variables on two subgroups of credit unions based on the dyValLOW variable. It takes a value of 1 if the credit union members’ shares value is below the whole sample median value for a respective year
Variables Credit union with credit union members’ value above the
whole sample median members’ value
(dyValLOW = 1)
Credit union with credit union members’ value below the
whole sample median members’ value
(dyValLOW = 0)
Wilcoxon test (z-value)
Mean (Median) Std. dev Mean (Median) Std. dev BUF_R (risk-based) 0.06 (0.04) 0.05 0.06 (0.05) 0.03 -1.58 BUF_A (assets-based) 0.02 (0.01) 0.02 0.03 (0.02) 0.03 -5.46***
CAP 0.94(0.37) 1.55 1.09 (0.27) 2.35 1.62 RWA 0.95 (0.37) 1.39 1.07 (0.26) 2.15 1.06 ASSETS 1.00 (0.37) 1.77 0.99 (0.24) 2.55 4.24*** BENEF <-0.001(0.002) 0.006 0.001(0.001) 0.006 -1.2 LOSS 0.001 (0.001) 0.001 0.001(0.001) 0.002 -1.3 LIQUID 0.05 (0.03) 0.05 0.04 (0.03) 0.04 2.36*** RISK 0.53 (0.53) 0.11 0.54 (0.55) 0.09 -2.85*** SIZE 13.69 (13.56) 1.23 13.70 (13.32) 1.45 4.24*** ROA 0.005 (0.006) 0.004 0.004 (0.004) 0.003 2.33** dyMERGER 0.06 (-------) 0.24 0.07 (-------) 0.257 -0.45 AGE 60.21 (63) 17.98 56.84 (63) 21.13 1.83***

35
Table B.9: OLS and Fixed Effect (FE) estimates for the Basel risk-based (BUFF_R) and leverage capital buffer (BUFF_A) (1996-2014) for credit union size between the 2nd and 9th decile.
This table presents the Blundell-Bond GMM, OLS and fixed effect (FE) estimates for the Basel risk-based capital buffer (BUFF_R) and the leverage-based capital buffer (BUFF_A). Our results are built on non-balanced panel data of the 100 largest credit unions in Canada according to the ranking of the Credit Union Central Canada (CUCA) during the 1996-2014 period. Dependent variables are: BUFF_R (Basel risk-based capital ratio minus 8%) and BUFF_A (the leverage ratio minus 5%). Business cycle variables are: GDPG_P (GDP growth by province) and GDPG_C (Canada-wide GDP growth). Credit unions specific (control) variables are: LIQUID (cash over total assets), RISK (risk-weighted assets scaled by the total assets), SIZE (natural log of total assets), dyMERGER (1 for the acquirer in the year of the merger and 0 otherwise), dyLOW (1 if the credit union capital is below the median value of the whole sample risk-based capital ratio for a respective year), LOSS (loan loss provision over total loans), AGE (Age of the credit union) and ZSCORE (standard deviation of ROA between the credit union leverage ratio and its return on assets).
.
OLS FE
BUFF_R BUFF_A
BUFF_R BUFF_A
Dep. variablet-1 0.791*** (0.047)
0.810*** (0.054)
0.336*** (0.081)
0.351*** (0.064)
LOSS 0.312 (0.623)
0.046 (0.254)
0.675 (0.963)
0.156 (0.384)
LIQUID 0.029* (0.016)
-0.008 (0.010)
0.046 (0.024)
0.009 (0.013)
SIZE 0.002** (0.0009)
-0.0005 (0.0005)
-0.033*** (0.009)
-0.011*** (0.004)
RISK -0.048** (0.021)
0.039 (0.017)
-0.103*** (0.034)
0.071** (0.027)
GDPG_P 0.028 (0.028)
0.009 (0.017)
0.024 (0.034)
0.012 (0.010)
GDPG_P*dyLOW -0.056* (0.029)
-0.034* (0.019)
-0.046** (0.026)
-0.031** (0.018)
AGE <0.001 (<0.001)
<0.001 (<0.001)
-0.005 (0.006)
0.003*** (<0.001)
dyMERGER -0.002 (0.003)
-0.002 (<0.001)
<0.001 (<0.001)
-0.001 (0.55)
ROA 0.411 (0.302)
0.391 (0.216)
0.174 (0.268)
0.179 (0.171)
CONST 0.735 (0.720)
-0.15 (0.466)
-18.00 (13.28)
-12.66 (9.79)
Obs. 231 227 231 227
No credit unions 76 74 76 59
R2 0.87 0.87 0.50 0.32
Province dummies Yes Yes No No

36
Table B.10: OLS and fixed effect (FE) estimates for the Basel risk-based (BUFF_R) (1996-2014) with ZSCORE as bank risk measure
This table presents the OLS and fixed effect (FE) estimates for the Basel risk-based capital buffer (BUFF_R) where we replace the regulatory risk measure (RWA) by the ZSCORE measure. Our results are built on non-balanced panel data of the 100 largest credit unions in Canada according to the ranking of the Credit Union Central Canada (CUCA) during the 1996-2014 period. Dependent variables are: BUFF_R (Basel risk-based capital ratio minus 8%) and BUFF_A (the leverage ratio minus 5%). Business cycle variables are: GDPG_P (GDP growth by province) and GDPG_C (the Canada GDP growth). Credit unions specific (control) variables are: LIQUID (cash over total assets), RISK (risk-weighted assets scaled by the total assets), SIZE (natural log of total assets), dyMERGER (1 for the acquirer in the year of the merger and 0 otherwise), dyLOW (1 if the credit union capital is below the median value of the whole sample risk-based capital ratio for a respective year), LOSS (loan loss provision over total loans), AGE (age of the credit union) and ZSCORE (standard deviation of ROA between the credit union leverage ratio and its return on assets).
OLS FE
BUFF_R
BUFF_R
Dep. variablet-1 0.462*** (0.206)
0.133* (0.077)
LOSS -0.03 (0.653)
-0.201 (0.534)
LIQUID 0.124* (0.062)
0.061 (0.023)
SIZE 0.001 (0.001)
-0.036*** (0.014)
ZSCORE 0.001* (0.001)
0.001 (0.001)
GDPG_P 0.157 (0.072)
0.052 (0.026)
GDPG_P*dyLOW -0.266*** (0.097)
-0.106*** (0.028)
AGE <0.001 (<0.001)
-0.033 (0.021)
dyMERGER -0.002 (0.002)
0.001 (0.001)
ROA 0.216 (0.208)
0.031 (0.286)
CONST -1.35 (1.04)
-74.00 (42.90)
Obs. 388 388
No credit unions 87 87
R2 0.65 0.28
Province dummies Yes No

37
Graph 1: Asset distribution by year for credit unions with available annual reports from 2005 to 2014
This graph plots the average and median value of credit union total assets by years. For the sake of homogeneity, we only use a set of 18 of the 100 largest credit unions which have continuous reported annual data for the 1996-2014 period.
Graph 2: Basel risk-based capital buffer and GDP growth, smallest credit unions This graph plots the risk-based capital buffer (BUFF_R), the minimum regulatory buffer (RegBUFF) of 2.5% and Canadian GDP growth (GDPG_C) for two credit unions among the smallest in term of size: Sunshine Coast Credit Union and Sudbury Credit Union. In panel A, we plot the buffer and Canadian GDP growth. The comparison with the provincial GDP growth (GDPG_P) is made in panel B. We use non-balanced panel data of the 100 largest credit unions in Canada according to the ranking of the Credit Union Central Canada (CUCA) during the 1996-2014 period.
Panel A: Risk-based capital buffer and Canadian GDP growth Sunshine Coast Credit Union Sudbury Credit Union
0
1000000
2000000
3000000
4000000
5000000
6000000
7000000
2005 2006 2007 2008 2009 2010 2011 2012 2013 2014
10
00
s $
CA
D
Year
Mean
Median
-.05
0.0
5.1
.15
2006 2008 2010 2012 2014
BUFF_R GDPgrowthRegBUFF
Year
-.05
0.0
5.1
.15
2000 2005 2010 2015
82
BUFF_R GDPgrowth
RegBUFF
Year

38
Panel B: Risk-based capital buffer and provincial GDP growth Sunshine Coast Credit Union Sudbury Credit Union
Graph 3: Largest credit unions’ risk-based capital buffer and GDP growth, This graph plots the risk-based capital buffer (BUFF_R), the minimum regulatory buffer (RegBUFF) of 2.5% and Canadian GDP growth (GDPG_C) for the two largest credit unions in term of size: Vancity and Caisse Centrale Desjardins. In panel A, we plot the buffer and Canadian GDP growth on the left side and the provincial GDP growth (GDPG_P) on the right side for Vancity, the second largest credit union in Canada. Panel B addresses the same issue for Desjardins, the largest credit union.
Panel A: Risk-based capital buffer and Canadian GDP growth for the second largest credit union by size: Vancity
Panel B: Risk-based capital buffer and provincial GDP growth for the largest credit union by size: Caisse Centrale Desjardins
-.05
0.0
5.1
.15
2000 2005 2010 2015
BUFF_R ProvGDP_growthRegBUFF
Year
0.0
5.1
.15
2006 2008 2010 2012 2014
BUFF_R ProvGDP_growthRegBUFF
Year
-.05
0.0
5.1
1995 2000 2005 2010 2015
BUFF_R GDPgrowthRegBUFF
Year
-.05
0.0
5.1
1995 2000 2005 2010 2015
BUFF_R ProvGDP_growthRegBUFF
Year
-.05
0.0
5.1
2000 2005 2010 2015
BUFF_R GDPgrowthRegBUFF
Year
0.0
5.1
.15
2000 2005 2010 2015
BUFF_R ProvGDP_growthRegBUFF
Year

39
Graph 4: Basel risk-based capital buffer and GDP growth This graph plots Canadian GDP growth (GDPG_C), the minimum regulatory buffer (RegBUFF) of 2.5% and the median of the risk-based capital buffer, MdBUFFR.
Graph 5: Basel risk-based capital buffer and GDP growth for low- and well-capitalized credit unions
This graph plots Canadian GDP growth (GDPG_C), the minimum regulatory buffer (RegBUFF) of 2.5% and the average of the risk-based capital buffer BUFFLOW for low-capitalized (left) and BUFFHIGH for well-capitalized (right) credit unions. Low-capitalized credit unions have a capital buffer below the median capital buffer. We use non-balanced panel data of the 100 largest credit unions in Canada according to the ranking of the Credit Union Central Canada (CUCA) during the 1996-2014 period.
-.05
0.0
5.1
2000 2005 2010 2015
MdBUFFR GDPgrowthRegBUFF
Year
-.05
0.0
5.1
2006 2008 2010 2012 2014
BUFFLOW GDPgrowth
RegBUFF
Year
-.05
0.0
5.1
.15
2005 2010 2015
BUFFHIGH GDPgrowth
RegBUFF
Year
40
References
Albertazzi, U. and L. Gambacorta (2009). Bank profitability and the business cycle, Journal of Financial Stability, 5, pp. 393-409.
Aggarwal, R. and K.T. Jacques (2001). The impact of FDICIA and prompt corrective action on bank capital and risk: Estimates using a simultaneous equations model, Journal of Banking & Finance, 25, pp. 1139-1160.
Andrews A.M., (2014). Survey of co-operative capital, Report, Filene Research Institute.
Arellano, M. and S. Bond (1991). Some tests of specification for panel data: Monte Carlo evidence and an application to employment equations, Review of Economic Studies, 58, pp. 277-297.
Autorité des Marchés Financiers (AMF) (2016). Ligne directrice sur les normes relatives à la suffisance du capital de base, Coopératives de services financiers.
Ayuso, J., D., Perez and J. Saurina (2004). Are capital buffers pro-cyclical? Evidence from Spanish panel data, Journal of Financial Intermediation, 13, pp. 249-264.
Basel Committee on Banking Supervision (BCBS) (2011). Basel III: A global regulatory framework for more resilient banks and banking systems.
Banerjee, A., T. Besley and T. Guinnane (1994). Thy neighbor's keeper: The design of a credit union with theory and a test, Quarterly Journal of Economics, 109, pp. 491-515.
Bauer, K., 2008. Detecting abnormal credit union performance, Journal of Banking &
Finance, 32, pp. 573-586.
Berger, A.N., R. DeYoung, M.J. Flannery, D. Lee and Ö. Öztekin (2008). How do large banking organizations manage their capital ratios? Journal of Financial Services Research, 34, pp.123-149.
Blum, J. M. (1999). Do capital adequacy requirements reduce risks in banking? Journal of Banking and Finance, 23, pp. 755-771.
Blundell, R. and S. Bond (1998). Initial conditions and moment restrictions in dynamic panel data models, Journal of Econometrics, 87, pp. 115-143.
Brizland, S. and M. Pigeon (2013). Canada’s credit unions and the state of the system, Working Paper, Credit Union Central of Canada.
Brown, C. and K. Davis (2009). Capital management in mutual financial institutions, Journal of Banking & Finance, 33, pp. 443-455.
Confédération Internationale des Banques Populaires (CIBP) Report (2014). Credit union and popular banks: Local engines for global growth.
Ely, D. (2014). Credit unions and risk, Journal of Regulatory Economics, 46, pp. 80-111.
Emmons, W.R. and F.A. Schmid (1999). Credit unions and the common bond, Review, 81, pp. 41-64.
Esho, N., P. Kofman and I.G. Sharpe (2005). Diversification, fee income, and credit union risk, Journal of Financial Services Research, 27, pp. 259-281.
Feinberg, R.M. and A.F.M.A. Rahman (2001). A causality test of the relationship between bank and credit union lending rates in local markets, Economics Letters, 71, pp. 271-275.

41
Flannery, M.J. and K.P. Rangan (2006). Partial adjustment toward target capital structures, Journal of Financial Economics, 79, pp. 469-506.
Flannery, M.J. and K.P. Rangan (2008). What caused the bank capital build-up of the 1990s?. Review of Finance, 12, pp. 391-429.
Frame, W.S., G.V. Karels and C. McClatchey (2002). The effect of the common bond and membership expansion on credit union risk, The Financial Review, 37, pp. 613-636.
Goddard, J., D.G. McKillop and J.O.S. Wilson (2008). The diversification and financial performance of US credit unions, Journal of Banking & Finance, 32, pp. 1836-1849.
Goddard, J., D.G. McKillop and J.O.S. Wilson (2015). Regulatory change and capital adjustment of US credit unions, Journal of Financial Services Research, pp. 1-27.
Guidara, A., V.S. Lai, I. Soumaré and T.F. Tchana (2013). Banks’ capital buffer, risk and performance in the Canadian banking system: Impact of business cycles and regulatory changes, Journal of Banking & Finance, 37, pp. 3373-3387.
Stolz, S.F., Heid and D. Porath (2003). Does capital regulation matter for bank behaviour? Evidence for German savings banks, Discussion Paper Series, 2, Banking and Financial Studies from Deutsche Bundesbank, Research Centre.
Hillier, D., A. Hodgson, P. Stevenson-Clarke and S. Lhaopadchan (2008). Accounting window dressing and template regulation: A case study of the Australian credit union industry, Journal of Business Ethics, 83, pp. 579-593.
Hoel, R. (2007). Alternative capital for U.S. credit unions? A review and extension of evidence regarding public policy, Filene Research Institute.
Jackson, W.E. (2007). Is the U.S. credit union industry overcapitalized? An empirical examination, Filene Research Institute.
Jacques, K. and P. Nigro (1997). Risk-based capital, portfolio risk, and bank capital: A simultaneous equations approach, Journal of Economics and Business, 49, pp. 533-547.
Köhler, M. (2015). Which banks are more risky? The impact of business models on bank stability, Journal of Financial Stability, 16, pp.195-212.
Marcus, A.J. (1984). Deregulation and bank financial policy, Journal of Banking & Finance, 8, pp. 557-565.
McKillop, D.G. and J.O. Wilson (2011). Credit unions: A theoretical and empirical overview, Financial Markets, Institutions & Instruments, 20, pp. 79-123.
McKillop, D.G. and J.O. Wilson (2015). Credit unions as cooperative institutions: Distinctiveness, performance and prospects, Social and Environmental Accountability Journal, 35, pp. 96-112.
Milne, A. (2004). The inventory perspective on bank capital, Cass Business School Research Paper, 2004 - papers.ssrn.com.
Milne, A. and E. Whalley (2001). Bank capital regulation and incentives for risk-taking, Cass Business School Research Paper, 2001 - papers.ssrn.com.
Moore, P. (2014). Credit union system structure: A look at where we are today and some of our challenges for future, Working Paper, Credit Union Central Canada.
42
Rime, B. (2001). Capital requirements and bank behaviour: Empirical evidence for Switzerland. Journal of Banking & Finance, 25, pp. 789-805.
Shrieves, R. and D. Dahl (1992). The relationship between risk and capital in commercial banks, Journal of Banking & Finance, 16, pp. 439-457.
Smith, D. J., T.F. Cargill and R.A. Meyer (1981). Credit unions: An economic theory of a credit union, Journal of Finance, 36, pp. 519-528.
Smith, D.J. (1984). A theoretic framework for the analysis of credit union decision making, Journal of Finance, 39, pp. 1155-1168.
Smith, D.J. (1986). A test for variant objective functions in credit unions. Applied Economics, 18, pp. 959-970.
Smith, D. M. and S.A. Woodbury (2010). Withstanding a financial firestorm: Credit unions vs banks, Filene Research Institute.
Stolz, S. and M. Wedow (2005). Banks’ regulatory capital buffer and the business cycle: Evidence for German savings and cooperative banks. Deutsche Bundesbank Banking and Financial Studies Discussion Paper No. 07/2005.
Stolz, S. and M. Wedow (2011). Banks’ regulatory capital buffer and the business cycle: Evidence for Germany, Journal of Financial Stability, 7, pp. 98-110.
Taylor, R.A. (1971). The credit union as a credit union institution, Review of Social Economy, 24, pp. 207-217.
Taylor, R.A. (1977). Credit unions and economic efficiency, Rivista Internationale di Scienze Economiche e Commerciali, 24, pp. 239-247.
Tokle, R.J. and J.G. Tokle (2000). The influence of credit union and savings and loan competition on bank deposits rates in Idaho and Montana, Review of Industrial Organization, 17, pp. 427-439.
Wilcox, J.A. (2011). Reforming credit union capital requirements, University of California, Berkeley White Paper.