basel iii- pillar iii disclosures as at 31 december 2015 · 1 background 1 2 executive summary 2 3...
TRANSCRIPT

Basel III- Pillar III disclosures
As at 31 December 2015

Table of Contents
Section Description Page
1 Background 1
2 Executive Summary 2
3 Basel III Components 4
4 Risk and Capital Management 7
5 Regulatory Capital Requirements 10
6 Credit Risk 14
7 Market Risk 18
8 Operational Risk 19
9 Other Risks (Pillar II) 20
Pillar III – MACEEN CAPITAL 2015
1
1. Background Capital Market Authority (CMA) issued its Prudential Rules in December 2012. As per the
Chapter 20 of the Prudential Rules, all Authorized Persons (APs) are required to have in
place an Internal Capital Adequacy Assessment Process (“ICAAP”).
As outlined in the CMA prudential rules, ICAAP requires five features including governing
body oversight, sound capital assessment, comprehensive assessment of risks, monitoring
and reporting and internal control review. Therefore, ICAAP not only ensures that
companies have adequate capital to support all the risks in their business, but also
encourages them to develop and use better risk management techniques by including
adequate Stress Testing scenarios in monitoring and managing their risks.
Maceen Capital (“Maceen” or “the Company”), founded in 2010, provides its clients with a
range of Real Estate investment opportunities. Maceen conducts securities business
including, dealing as principal, underwriting, managing, arranging, and advisory and
custody and is regulated by Saudi Arabia’s CMA (license number 08132-37).

Pillar III – MACEEN CAPITAL 2015
2
2. Executive Summary
The Capital Adequacy and Risk Management Report for MACEEN CAPITAL “The Company”
has been prepared in accordance with the public / market disclosure requirements and
guidelines in respect of Pillar 3 of Basel III, as per the prudential rules published in December
2012 by Capital Market Authority “CMA” of the Kingdom of Saudi Arabia.
The purpose of this disclosure is to inform market participants of the key components, scope
and effectiveness of MACEEN’s risk management systems, risk measurement processes, risk
profile and capital adequacy. This is accomplished by providing consistent and
understandable disclosure of MACEEN’s risk profile in a manner that enhances
comparability with other institutions.
Pillar III is adopted by MACEEN in 2014 for the first time.
MACEEN has adopted the Standardized Approach for Credit Risk and highest of Basic
Indicator Approach and Expenditure approach for Operational Risk. These approaches have
been discussed in detail in the following pages of this report. The Company had no market
Risk as at 31 December 2015 since it had no debt or equity investments in the trading book
and accordingly no Market Capital charge was allocated.
This Capital Adequacy and Risk Management Report provides details on MACEEN’s risk
profile with business volumes by risk asset classes, which form the basis for the calculation
of our capital requirement.
In accordance with the minimum capital requirement calculation methodology as prescribed
under Basel III, MACEEN capital adequacy as at 31st December 2015 and a comparison
thereof with the figures as of 31st December 2014 is as follows:
As of
31 December 2015
As of
31 December 2014
Total Capital Adequacy Ratio (including Pillar II and stress tests impact)
1.08 0.44
It is clear that total capital ratio (including Pillar II and stress tests increased from 0.44 as of
31 December 2014 to 1.08 as of 31 December 2015 which is greater than 1 and in line with
CMA requirements.

Pillar III – MACEEN CAPITAL 2015
3
As of 31st December 2015 total Risk Weighted Assets (RWA) amounted to 612,619 which
comprised of 93 % Credit Risk and 7 % Operational Risk.
Capital adequacy assessment details as of 31st December 2015 are shown in the below table:
CAPITAL ADEQUACY ASSESSMENT SUMMARY – 31st
December 2015
Particulars
Regulatory Capital –
Pillar I
Risk Capital –
(Pillar I + Pillar II)
Credit Risk 79,926 79,926
Market Risk - -
Operational Risk 10,430 10,430
Pillar I Total 90,356 90,356
Interest Rate Risk in Banking Book - -
Liquidity Risk - 1,807
Reputation Risk - 452
Business/Strategic Risk - 452
Project Management Real Estate Risk - 452
Pillar II Total 3,163
Additional capital to cover stress testing 15,824
ICAAP Capital Requirement 109,343
Capital Base 117,772 117,772
Surplus (Deficit) in Capital Base 27,416 8,429
Capital Ratio 1.3 1.08
N.B: it is worth to be noted that all figures and amounts being reflected in this report are in
Saudi Riyals and rounded to the nearest thousand.

Pillar III – MACEEN CAPITAL 2015
4
3. Basel III Components In December 2012, CMA issued a circular requiring financial institutions operating in the
Kingdom of Saudi Arabia to report their capital adequacy requirements according to the
Basel III guidelines. Basel III is an international initiative (adopted by CMA) with a view to
ensure adequate capitalization of financial institutions on a more robust risk-sensitive basis
providing a framework for assessment of risk and calculation of regulatory capital
requirement, i.e. the minimum capital that an institution must hold, given its risk profile.
Basel III framework is intended to strengthen risk management practices and processes
within financial institutions.
CMA’s Basel II / III framework describes the following three pillars which are designed to be
mutually re-enforcing and are meant to ensure an adequate capital base which corresponds
to the overall risk profile of the financial institution:
� Pillar 1: Calculation of capital adequacy ratio based on charge for credit, market and
operational risks stemming from business operations.
� Pillar 2: Supervisory review process which includes:
• Internal Capital Adequacy Assessment Process (ICAAP) to assess
incremental risk types not covered under Pillar 1;
• Quantification of capital required for these identified risks; and
• The assurance that the Company has sufficient capital cushion (generated
from internal / external sources) to cover these risks over and above the
regulatory requirement under Pillar 1.
� Pillar 3: Market discipline through public disclosures that are designed to provide
transparent information on capital structure, risk exposures, risk mitigation and the
risk assessment process.
These concepts are further described in the following pages.
This report represents the Company’s market disclosures, under the Pillar 3 requirements,
of its risk profile and capital adequacy as at the end of 31st December 2015.
3.1 Pillar I – Minimum Capital Requirements
Basel II / III, as adopted and implemented by CMA, cover the minimum regulatory capital
requirement for financial institutions for credit, market and operational risks stemming
from its business operations. It also sets out the basis for consolidation of entities for capital
adequacy reporting requirements, the definition and calculations of Risk Weighted Assets
(RWA) and the various options given to financial institutions to calculate these Risk
Weighted Assets.
The regulatory capital requirements are calculated according to the following formula
(expressed as a percentage):
Minimum Capital Requirements = Capital Base
RWA
The Minimum Capital Requirements is to be greater or equal to 14 %.

Pillar III – MACEEN CAPITAL 2015
5
The table below describes the approaches available for calculating the RWA for each of the
aforementioned risk types:
Credit Risk Market Risk Operational Risk
Standardized Approach N/A Highest of Basic Indicator approach and Expenditure based approach
a) Credit Risk
The Company uses the Standardized Approach at the consolidated level for regulatory
reporting purposes. This approach differs from the Basel I regulations in that it allows the
use of external ratings, where available, from accredited ratings agencies for the
determination of appropriate risk weights, and also includes a wider range of eligible
financial collaterals.
b) Market Risk
The Company had no market Risk as at 31 December 2015 since it had no debt or equity
investments in the trading book and accordingly no Market Capital charge was allocated.
c) Operational Risk
The Company uses the higher of Basic Indicator Approach and Expenditure Based
Approach.
Basic Indicator Approach related capital charge is the average of the last 3 gross operating
Income multiplied by 15 %.
Expenditure Based Approach related capital charge is the total expenditure multiplied
by 25 %.
3.2 Pillar II – Supervisory Review Process
The Supervisory Review Process (SRP) under Pillar II requires financial institutions to
employ an Internal Capital Adequacy Assessment Process (ICAAP) aimed at:
a) Quantifying the Company’s own internal assessment of the level of capital that it deems
appropriate to adequately cover all material risks that it is exposed to; and
b) Instituting a comprehensive process for business and capital planning to ensure that
adequate capital is always available to cover its risk exposures. Companies are also required
to identify sources for raising additional capital in case of need and to provide documented
plans thereof. As part of this process financial institutions are required to ascertain whether
credit, market and operational risk capital charges calculated under Pillar I are adequate to
cover Companies’ internal assessment of these risks or not. Furthermore, they are expected
to ascertain additional capital requirements (over and above the Pillar I requirements) for
the Pillar II risks that Companies are exposed to (examples of some risks are liquidity risk,
reputation risk, business strategic risk and Real estate project management risk). The
ICAAP has to be designed to ensure that companies have sufficient capital cushion to meet
regulatory and internal capital requirements during periods of systemic / cyclical economic
downturns or during times of financial distress - which involves employing stress testing
and scenario analysis techniques.

Pillar III – MACEEN CAPITAL 2015
6
In compliance with the regulatory requirements, MACEEN has submitted its detailed ICAAP
Plan for the year 2013 and 2014.
3.2 Pillar III – Market Discipline
Under Pillar 3, CMA prescribes the qualitative and quantitative disclosures which are
required to be made to external stakeholders of the Company. The disclosures are designed
to enable stakeholders and market participants to assess an institution’s risk appetite, risk
exposures and risk profile. It encourages the move towards more advanced forms of risk
management.

Pillar III – MACEEN CAPITAL 2015
7
4. Risk and Capital Management In this chapter the consolidation principles for capital base within MACEEN are described,
as well as the principles adopted for the management and control of risk and capital.
4.1 Group Structure
MACEEN follows the Accounting Standards generally accepted in the Kingdom of Saudi
Arabia.
The consolidated financial statements as at 31st December 2015 include the financial
statements of the Company and its following subsidiaries.
MACEEN Logistics Projects Company
Maceen Logistics Projects Company is a limited liability company registered in Riyadh,
Saudi Arabia under commercial registration number 1010293905 dated 15 Ramadan 1431H
(Corresponding to 25 August 2010).
The Company is controlled by Maceen Capital Company and has been set up for the purpose
of purchase of land for the construction of buildings and investment such building by sale or
lease for the benefit of the company, managing and maintenance and development of
property buy and own the property for the benefit of the company, buying and selling and
exploitation of real estate and land for the benefit of the company, implementation of
contracts and installation work and operation and maintenance of computers and
preparation of related programs i.e. system applications and databases.
Shumou MACEEN Company
Shumou Maceen Company is a limited liability company registered in Riyadh, Saudi Arabia
under commercial registration number 1010299910 dated 1 January 2011 (Corresponding to
26 Muharram 1432H).
The Company is controlled by Maceen Capital Company and has been set up for the purpose
of installation work and maintenance of computers, preparation of related programs i.e.
system applications and databases, purchase of land for the construction of buildings
investment such building by sale or lease for the benefit of the company, managing and
maintenance and development of property, buy and own the property for the benefit of the
company, buying and selling and exploitation of real estate and land for the benefit of the
company.

Pillar III – MACEEN CAPITAL 2015
8
Hey Villa Te Company
Hey Villa Te Company is a limited liability company registered in Riyadh, Saudi Arabia
under commercial registration number 1010299916 dated 23 Muharram 1432H
(Corresponding to 29 December 2010).
The Company is controlled by Maceen Capital Company and has been set up for the purpose
of installation work and maintenance of computers, preparation of related programs i.e.
system applications and databases, purchase of land for the construction of buildings
investment such building by sale or lease for the benefit of the company, managing and
maintenance and development of property, buy and own the property for the benefit of the
company, buying and selling and exploitation of real estate and land for the benefit of the
company.
4.2 Risk and Capital Management Process
MACEEN is exposed to a broad range of risks in the normal course of its business. The
Company’s risk and capital assessment policies are designed to identify and quantify these
risks, set appropriate limits in line with defined risk appetite, ensuring control and
monitoring adherence to the limits. The principal risks associated with the Company’s
business are liquidity risk, reputation risk, business strategic risk and Real estate project
management risk.
Audit & Compliance Committee
The objective of the Audit & Compliance Committee is to assist the BOD in fulfilling its
responsibilities with respect to the internal control system of the Company and to ensure the
effectiveness of the internal controls and make recommendations to the BOD in the benefit
of the internal control of the Company and its shareholders.
Remuneration and Compensation Committee
The objective of Remuneration and Compensation Committee is to put a nomination system
for BOD membership and clear policies for the Company’s BOD and senior executives’
remunerations and compensations in a discussed and approved recommendation form by
the BOD.
BOD
The primary responsibility of the Board is to provide effective oversight over the Company’s
affairs for the benefit of its Shareholders and to balance the interests of its stakeholders,
such as its customers, employees, suppliers and local communities. The Board is responsible
for reviewing the development and execution of strategies, reviewing the selection,
performance and compensation of the Chairman, Managing Director (MD) / Chief Executive
Officer (CEO) and senior executives and ensuring transparency of communication and
disclosure of financial and non-financial information, including establishing an effective
audit process.
Risk Management department
The mission of Risk management at MACEEN Capital is to develop and maintain programs
that protect the Company from unanticipated loss by providing systematic risk analysis,
developing techniques to reduce potential exposure to loss, and procuring and

Pillar III – MACEEN CAPITAL 2015
9
administering insurance and self-insurance programs in accordance with MACEEN Capital’s
Risk Management Policy.
Specifically, Risk management’s primary goal is to minimize the adverse effects of accidental
losses by either stopping losses from happening using risk control techniques, or paying for
those losses that unavoidably occur, using risk financing or risk transferring techniques.
Internal Audit
The Internal audit for 2015 was performed by “UTC International” firm.
Compliance
Major duties and responsibilities for Compliance department are:
� Stays abreast of changes to regulations affecting the management, operations, and
product offerings of the establishment;
� Check all newly opened accounts to ensure appropriate KYC procedures and
standards;
� Cooperate with compliance audits, internal Audit and obtain satisfactory audit
results;
� Report findings to Audit Committee and follow up with related departments for
resolution on outstanding issues and violations;
� Report to the financial investigation unit on any occurrence of suspicious
transactions;
� Ensure that all staff are properly informed and trained in respect to combating
money laundering matters as well as reporting them; and
� Check all transaction done in Asset Management and company portfolio to ensure as
accordance to mandate and investment portfolio policy.

Pillar III – MACEEN CAPITAL 2015
10
5. Regulatory Capital Requirements This chapter describes MACEEN’s capital requirements, calculated on the basis of
regulatory guidelines. The risk types under Pillar I are in accordance with Basel II / III
guidelines issued by CMA and contain credit, market and operational risks.
As at 31st December 2015 the Company’s overall regulatory capital requirements under
Pillar I can be broken down as follows.
Risk Type Capital Requirement % of Total Requirement
Credit Risk 79,926 88.45%
Market Risk - -
Operational Risk 10,430 11.55 %
Total 90,356 100 %
5.1 Capital Requirement for Credit Risk
MACEEN calculates the capital requirements for credit risk according to the Standardized
Approach. Under this approach, exposures are assigned to portfolio segments based on the
type of counterparty and/or the nature of the underlying exposure.
The major portfolio segments as defined by the Basel guidelines adopted by CMA where
each segment has a defined risk weight ranging from 0% to 714% depending on tenor, type
of exposure, asset class, whether the counterparty has an external rating and whether the
exposure is past due.

Pillar III – MACEEN CAPITAL 2015
11
The following table describes the amount of exposures subject to credit risk and the related
capital requirements, by portfolio.
Asset Class
Exposure
1
Risk Weights
2
Effective RWA
3= 1 * 2
Capital
Requirement
4= 3 * 14 %
Exposure to APs and
Banks
442 20 % 88 12
Exposure to Corporates 7,392 714 % 52,779 7,389
High Risk Investments 47,553 400% 190,214 26,630
Investment Funds –
Exposures
32,506 150%
73,659 10,312 Investment Funds –
Exposures
8,300 300%
Other Exposures:
Tangible assets 3,892 300%
248,546 34,796
Deferred expenditure
/accrued income
9,999 300%
Retail Exposures 3,123 300%
Past Due Items 27,662 714%
Off-Balance Sheet
Commitments
786 714% 5,612 786
Total 141,655 570,899 79,926
5.2 Capital Requirements for Market Risk
The Company had no market Risk as at 31 December 20154 since it had no debt or equity
investments in the trading book and accordingly no Market Capital charge was allocated.
5.3 Capital Requirements for Operational Risk
The Company uses the higher of Basic Indicator Approach and Expenditure Based Approach.
Basic Indicator Approach related capital charge is the average of the last 3 gross operating
Income multiplied by 15 %.
Expenditure Based Approach related capital charge is the total expenditure multiplied by
25 %.

Pillar III – MACEEN CAPITAL 2015
12
The capital charge requirements for operational risk are detailed in the table below.
Basic Indicator Approach
Gross Operating Income Average Gross
operating
Income
Risk Capital
Charge
Capital
Requirement 2013 2014 2015
33,256 13,594 15,511 20,787 15 % 3,118
Expenditure Based Approach
Overhead expenses
(2015) Risk Capital Charge Capital Requirements
41,720 25 % 10,430
Maximum of Basic Indicator Approach and
Expenditure Based Approach
10,430

Pillar III – MACEEN CAPITAL 2015
13
5.4 Capital Structure
The total eligible capital (Tier I and II) calculated in accordance with CMA guidelines is
as follows.
CAPITAL BASE SAR '000
Tier-1 Capital
Paid-up capital 159,516
Share premium 0
Reserves 3,384
Audited retained earnings (18,949)
Verified previous year profit/(loss) 0
Verified interim profit/(loss) (26,179)
Loss offsetting against capital reduction 0
Tier-1 adjustment *
Unverified interim loss (-) 0
Unverified previous year loss (-) 0
Goodwill and intangible assets (-) 0
Unrealised losses from HFT investments (-) 0
Unrealised losses from AFS investments (-) 0
Deferred zakah assets (-) 0
Dividend expense from retained earnings (-) 0
Zakah expense from retained earning (-) 0
Other negative equity items (-) 0
Other deductions from Tier-1 (-)
Deductions (-) 0
Tier-1 capital 117,772
Tier-2 Capital
Subordinated loans 0
Tier 2 debt securities 0
Cumulative preference shares 0
Revaluation reserves 0
Tier-2 adjustment *
Other deductions from Tier-2 (-)
Deduction to meet Tier-2 capital limit (-) 0
Tier-2 capital 0
CAPITAL BASE 117,772
Pillar III – MACEEN CAPITAL 2015
14
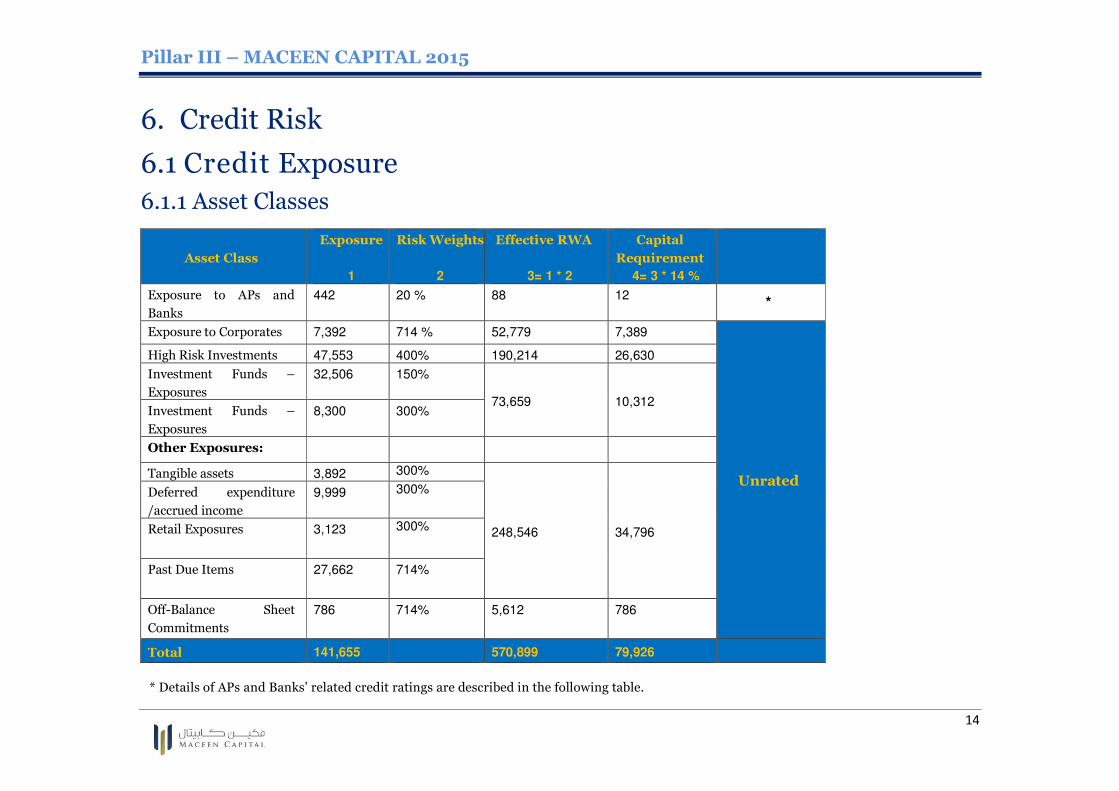
6. Credit Risk
6.1 Credit Exposure
6.1.1 Asset Classes
Asset Class
Exposure
1
Risk Weights
2
Effective RWA
3= 1 * 2
Capital
Requirement
4= 3 * 14 %
Exposure to APs and
Banks
442 20 % 88 12 *
Exposure to Corporates 7,392 714 % 52,779 7,389
Unrated
High Risk Investments 47,553 400% 190,214 26,630
Investment Funds –
Exposures
32,506 150%
73,659 10,312 Investment Funds –
Exposures
8,300 300%
Other Exposures:
Tangible assets 3,892 300%
248,546 34,796
Deferred expenditure
/accrued income
9,999 300%
Retail Exposures 3,123 300%
Past Due Items 27,662 714%
Off-Balance Sheet
Commitments
786 714% 5,612 786
Total 141,655 570,899 79,926
* Details of APs and Banks’ related credit ratings are described in the following table.
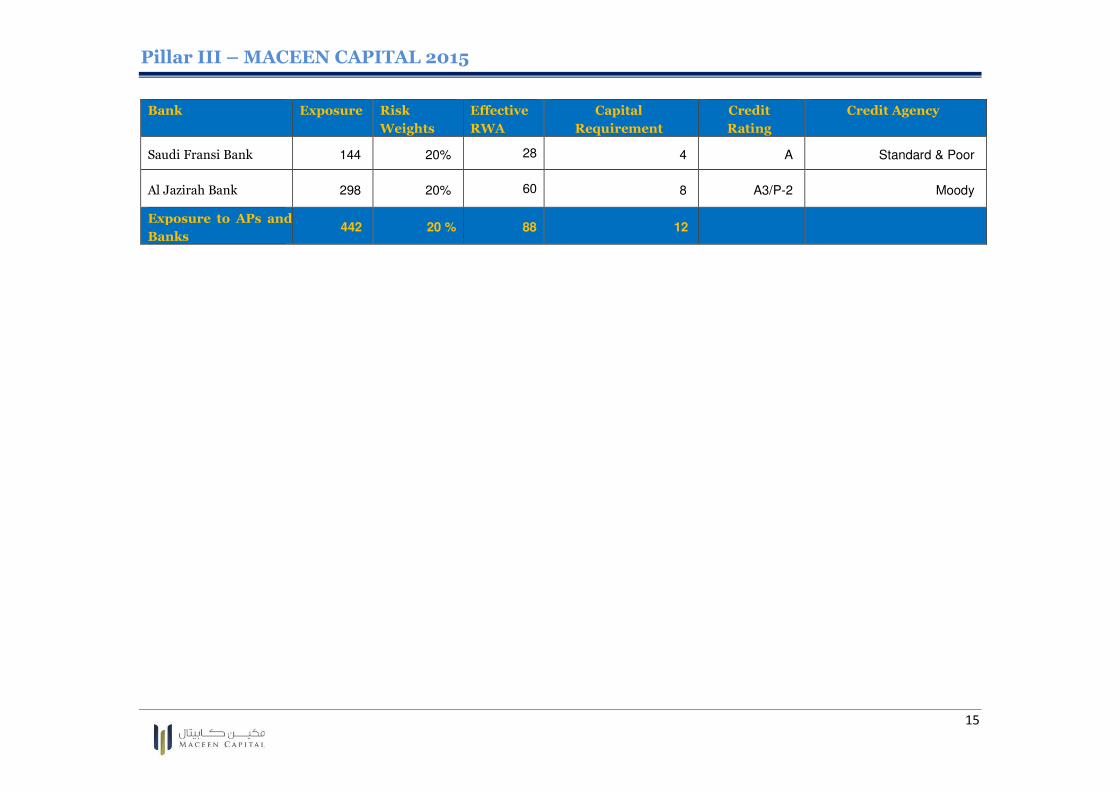
Pillar III – MACEEN CAPITAL 2015
15
Bank Exposure Risk
Weights
Effective
RWA
Capital
Requirement
Credit
Rating
Credit Agency
Saudi Fransi Bank 144 20% 28 4 A Standard & Poor
Al Jazirah Bank 298 20% 60 8 A3/P-2 Moody
Exposure to APs and
Banks 442 20 % 88 12

Pillar III – MACEEN CAPITAL 2015
16
6.1.2 Credit Exposures by MACEEN and its subsidiaries
More than 99% of credit risk exposure is being derived from MACEEN Capital.
6.1.3 Allocation of on-balance sheet exposures to risk weight buckets
An analysis of the portfolio by the regulatory risk weight buckets is presented in the table below:
Portfolio Risk Buckets
Total 20 % 150 % 300 % 400 % 714 %
Exposure to APs and
Banks 442 - - - - 442
Exposure to
Corporates - - - - 7,392 7,392
High Risk
Investments - - - 47,553 - 47,553
Investment Funds –
Exposures - 32,506 8,300 - - 40,806
Other Exposures:
Tangible assets - - 3,892 - - 3,892
Deferred expenditure
/accrued income - - 9,999 - - 9,999
Retail Exposures - - 3,123 - - 3,123
Past Due Items - - - - 27,662 27,662
Off-Balance Sheet
Commitments - - - - 786 786
Total 442 32,506 25,314 47,553 35,840 141,655
Total Related Capital Charge
12 6,826 10,632 26,630 35,826 79,926

Pillar III – MACEEN CAPITAL 2015
17
6.2 Receivables’ Ageing
Receivables Not Yet Due 0-90 days More than 90
days
Total as of 31
December 2015
Exposures related to
Corporates 7,392 - - 7,392
Investment Funds -
Exposures 32,506 - - 32,506
Other Exposures –
Retail Exposures 3,123 - - 3,123
Other Exposures -
Past Due Items - - 27,662 27,662
Total 43,021 - 27,662 70,683
No provision was accounted for during 2015 as the Company’s Management believes that all
receivables are collectable.
Pillar III – MACEEN CAPITAL 2015
18
7. Market Risk
Market risk is the risk that the value of a portfolio, either an investment portfolio or a trading
portfolio, will decrease due to the change in value of the market risk factors. The standard market
risk factors are stock prices, interest rates and foreign exchange rates. The associated
market risks are:
� Equity risk, the risk that stock prices and/or the implied volatility will change.
� Interest rate risk, the risk that interest rates and/or the implied volatility will change.
� Currency risk, the risk that foreign exchange rates and/or the implied volatility will
change.
The Company had no market Risk as at 31 December 2015 since it had no debt or equity
investments in the trading book and accordingly no Market Capital charge was allocated.

Pillar III – MACEEN CAPITAL 2015
19
8. Operational Risk
It is a risk of monetary losses resulting from inadequate or failed internal processes, people, and
systems or from external events. It includes legal risk, but excludes strategic and reputational risks.
Legal risk includes, but is not limited to, exposure to fines, penalties, or punitive damages resulting
from supervisory actions, as well as private settlements. It arises out of the legal implications of
failed systems, people, processes or external events.
Information Technology Risk, an integral part of Operational Risk arises out of failure in systems or
non-adherence to laid-down processes or misuse by staff apart from external events.
Measurement
The Operational Risk Capital Charge for Maceen is calculated as higher of the Basic
Indicator Approach (BIA) and Expenditure Based Approach under Pillar I as stipulated by CMA’s
prudential rules.
Basic Indicator Approach
Gross Operating Income Average Gross
operating
Income
Risk Capital
Charge
Capital
Requirement 2013 2014 2015
33,256 13,594 15,511 20,787 15 % 3,118
Expenditure Based Approach
Overhead expenses
(2015) Risk Capital Charge Capital Requirements
41,720 25 % 10,430
Maximum of Basic Indicator Approach and
Expenditure Based Approach
10,430
The capital charge for operational risk is the higher of the two above approaches of which is the
Expenditure based one amounting to 10.43 M.

Pillar III – MACEEN CAPITAL 2015
20
9. Other Risks (Pillar II)
Pillar II objectives are to cover risks not covered under Pillar I (which will be illustrated in details in
this section) along with additional capital charge resulting from stress tests.
9.1 Liquidity risk
Liquidity risk is defined as the company’s inability to meet its obligations. The analysis of liquidity
risk requires to measure the liquidity position of the company and to examine how funding sources
are likely to evolve under various scenarios. Liquidity risk usually arises from short term liabilities
that have a short contractual maturity such as non-interest bearing accounts and are generally dealt
by keeping a cash buffer to serve the liquidity needs.
Measurement
Liquidity Risk Charge at Maceen has been calculated using a comprehensive analysis of qualitative
as well as quantitative factors that Maceen is exposed to and the average between the two were
considered for the related liquidity risk capital charge calculation.
The qualitative assessment of Liquidity Risk is based on the requirements defined in section 11 of
annex 8 of CMA prudential rules based on which the liquidity management of Maceen is analysed.
The factors considered are as follows:
� How liquidity management shall be organized.
� How the assets and liabilities are put together.
� Distribution of various maturities and currencies.
� Transfer of liquidity among different currencies.
� Use of borrowing instruments to enhance cash flows.
� Possession of realizable assets.
� Preparedness for uneven intraday cash flows
For quantitative assessment of Liquidity Risk, the maturities of assets and liabilities have been
divided into the following:
� 0 to 6 Months
� Over 6 Months
Pillar III – MACEEN CAPITAL 2015
21
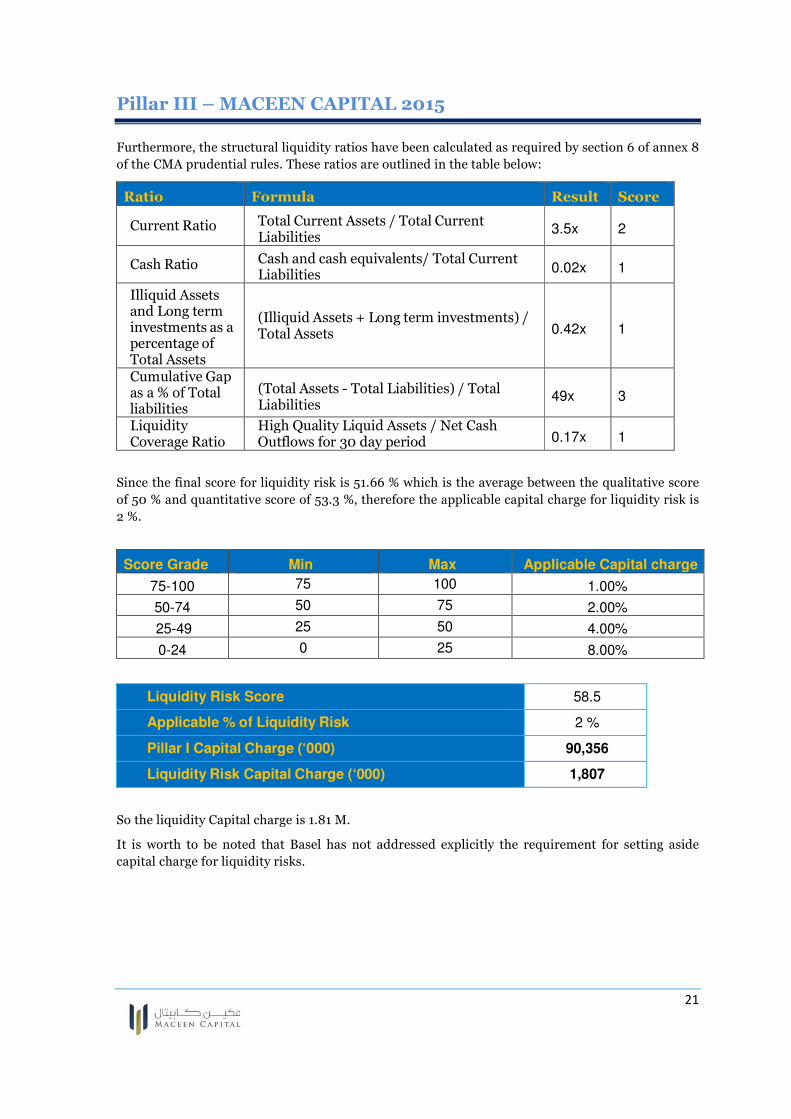
Furthermore, the structural liquidity ratios have been calculated as required by section 6 of annex 8
of the CMA prudential rules. These ratios are outlined in the table below:
Ratio Formula Result Score
Current Ratio
Total Current Assets / Total Current Liabilities
3.5x 2
Cash Ratio Cash and cash equivalents/ Total Current Liabilities
0.02x 1
Illiquid Assets and Long term investments as a percentage of Total Assets
(Illiquid Assets + Long term investments) / Total Assets 0.42x 1
Cumulative Gap as a % of Total liabilities
(Total Assets - Total Liabilities) / Total Liabilities
49x 3
Liquidity Coverage Ratio
High Quality Liquid Assets / Net Cash Outflows for 30 day period 0.17x 1
Since the final score for liquidity risk is 51.66 % which is the average between the qualitative score
of 50 % and quantitative score of 53.3 %, therefore the applicable capital charge for liquidity risk is
2 %.
Score Grade Min Max Applicable Capital charge
75-100 75 100 1.00%
50-74 50 75 2.00%
25-49 25 50 4.00%
0-24 0 25 8.00%
Liquidity Risk Score 58.5
Applicable % of Liquidity Risk 2 %
Pillar I Capital Charge (‘000) 90,356
Liquidity Risk Capital Charge (‘000) 1,807
So the liquidity Capital charge is 1.81 M.
It is worth to be noted that Basel has not addressed explicitly the requirement for setting aside
capital charge for liquidity risks.
Pillar III – MACEEN CAPITAL 2015
22
9.2 Reputation risk
Reputation risk is the current and prospective impact on earnings and capital arising from negative
public opinion. This may arise from market rumors, severe regulatory sanctions, or heavy financial
losses. Such negative publicity, whether true or not, may impair public confidence, result in costly
litigation, or lead to a decline in its client base/ business.
Maceen is a recognised name in the industry and has not faced any major adverse publicity,
investor run or regulatory penalties over its history. As an employer, the company’s remuneration is
in line with the industry. The policies for various risks are well documented and are reviewed
regularly. Risk and Compliance function at Maceen ensures that business is conducted within the
applicable legal and regulatory framework. The HR function focuses on developing ethical and
moral values in the employees.
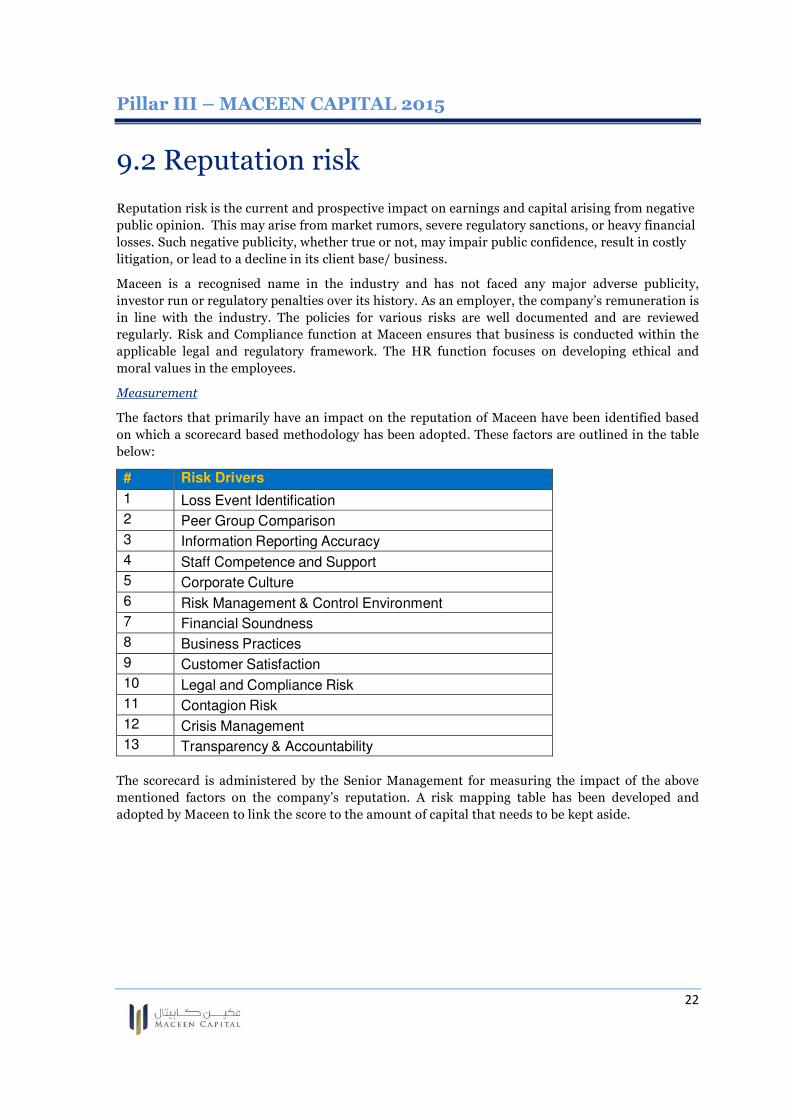
Measurement
The factors that primarily have an impact on the reputation of Maceen have been identified based
on which a scorecard based methodology has been adopted. These factors are outlined in the table
below:
# Risk Drivers
1 Loss Event Identification
2 Peer Group Comparison
3 Information Reporting Accuracy
4 Staff Competence and Support
5 Corporate Culture
6 Risk Management & Control Environment
7 Financial Soundness
8 Business Practices
9 Customer Satisfaction
10 Legal and Compliance Risk
11 Contagion Risk
12 Crisis Management
13 Transparency & Accountability
The scorecard is administered by the Senior Management for measuring the impact of the above
mentioned factors on the company’s reputation. A risk mapping table has been developed and
adopted by Maceen to link the score to the amount of capital that needs to be kept aside.
Pillar III – MACEEN CAPITAL 2015
23
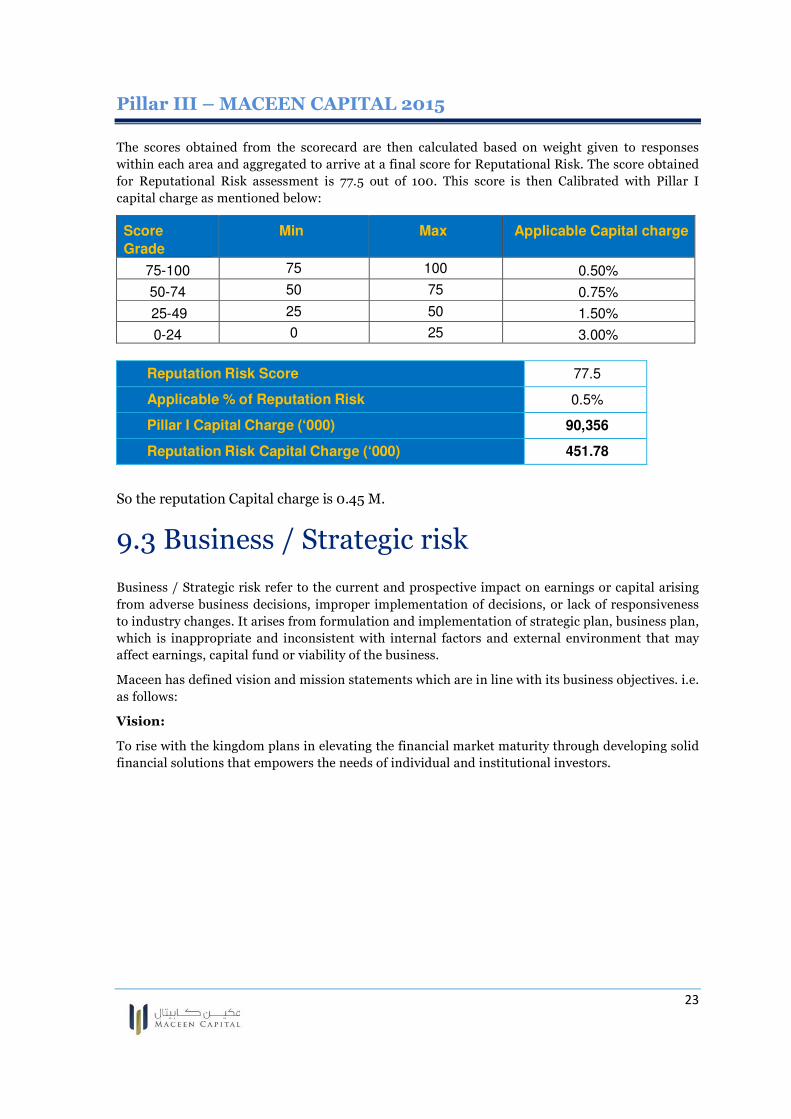
The scores obtained from the scorecard are then calculated based on weight given to responses
within each area and aggregated to arrive at a final score for Reputational Risk. The score obtained
for Reputational Risk assessment is 77.5 out of 100. This score is then Calibrated with Pillar I
capital charge as mentioned below:
Score
Grade
Min Max Applicable Capital charge
75-100 75 100 0.50%
50-74 50 75 0.75%
25-49 25 50 1.50%
0-24 0 25 3.00%
Reputation Risk Score 77.5
Applicable % of Reputation Risk 0.5%
Pillar I Capital Charge (‘000) 90,356
Reputation Risk Capital Charge (‘000) 451.78
So the reputation Capital charge is 0.45 M.
9.3 Business / Strategic risk
Business / Strategic risk refer to the current and prospective impact on earnings or capital arising
from adverse business decisions, improper implementation of decisions, or lack of responsiveness
to industry changes. It arises from formulation and implementation of strategic plan, business plan,
which is inappropriate and inconsistent with internal factors and external environment that may
affect earnings, capital fund or viability of the business.
Maceen has defined vision and mission statements which are in line with its business objectives. i.e.
as follows:
Vision:
To rise with the kingdom plans in elevating the financial market maturity through developing solid
financial solutions that empowers the needs of individual and institutional investors.

Pillar III – MACEEN CAPITAL 2015
24
Mission:
It is part of our conviction to enforce an unconventional way of thinking. Nurturing the knowledge
of our investors to identify growth and become part of it.
Strategy at Maceen is as follows:
� Strategy Planning
� Formulation of Overall Business and Corporate Objectives
� Business and Economic Environment Scan
� Investor Profiling
� Real Estate Profiling
� Technology Management Planning
� Strategy Implementation
Measurement
The factors that primarily have an impact on the strategies / business of Maceen have been
identified based on which a scorecard based methodology has been adopted. These factors are
outlined in the table below:
# Risk Drivers
1 Formulation of Overall Business and Corporate Objectives
2 Business Environment Scan
3 Economic Environment Scan
4 Investor Profiling
5 Real Estate Profiling
6 Business Planning
7 Staff Management - Strategic implementation plans
8 Technology Management - Strategic / Business implementation plans
A scorecard is used which attempts to rate the efficacy of each of the above defined areas to evaluate
the effectiveness. Each of the areas is assigned weightage to arrive at a final score.
The scores obtained from the scorecard are then calculated based on weights given to response
within each area and are aggregated to arrive at a final score for Business / Strategic Risk. The score
obtained for Business / Strategic Risk assessment is 81.25 out of 100. This score is then calibrated
with Pillar I capital charge as mentioned below:
Score Grade Min Max Applicable Capital charge
75-100 75 100 0.50%
50-74 50 75 0.75%
25-49 25 50 1.50%
0-24 0 25 3.00%
Pillar III – MACEEN CAPITAL 2015
25
The score of 81.25 calibrates to 0.50% of Pillar I Charge.
Business / Strategic Risk Score 81.25
Applicable % for Business / Strategic Risk 0.50%
Pillar I Capital Charge 90,356
Business / Strategic Risk Capital Charge 451.78
So the Business / Strategic Risk Capital Charge is 0.45 M.
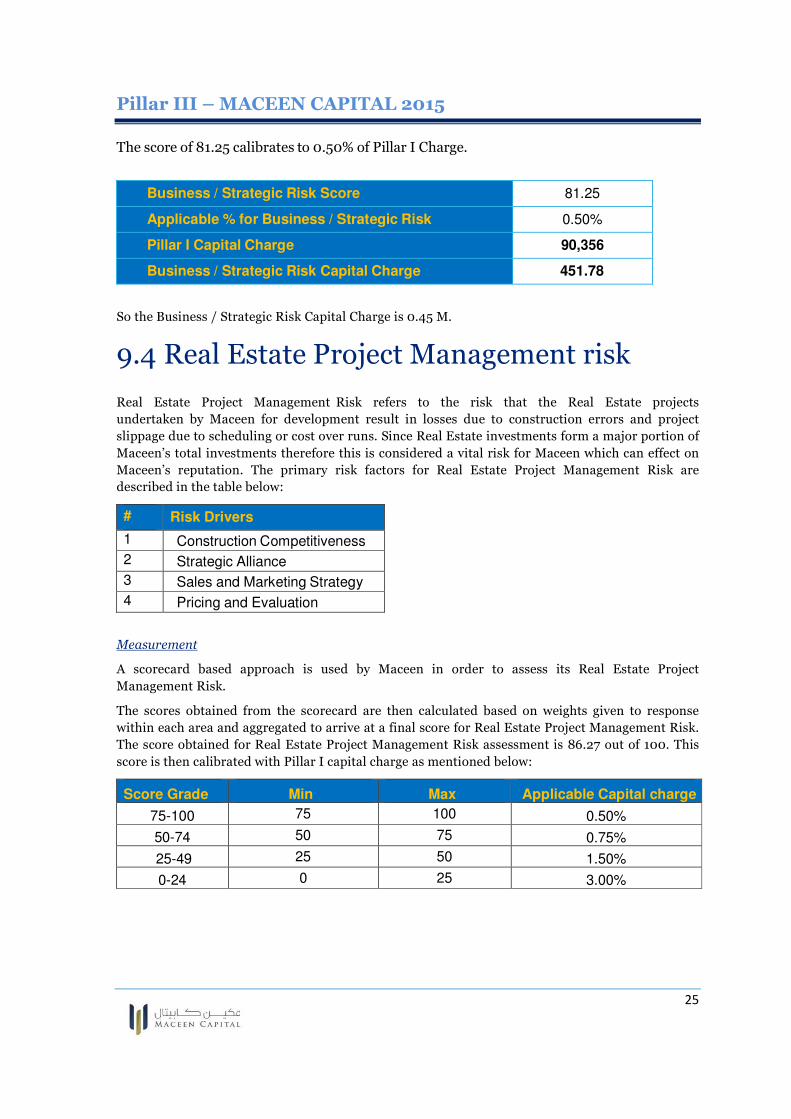
9.4 Real Estate Project Management risk
Real Estate Project Management Risk refers to the risk that the Real Estate projects
undertaken by Maceen for development result in losses due to construction errors and project
slippage due to scheduling or cost over runs. Since Real Estate investments form a major portion of
Maceen’s total investments therefore this is considered a vital risk for Maceen which can effect on
Maceen’s reputation. The primary risk factors for Real Estate Project Management Risk are
described in the table below:
# Risk Drivers
1 Construction Competitiveness
2 Strategic Alliance
3 Sales and Marketing Strategy
4 Pricing and Evaluation
Measurement
A scorecard based approach is used by Maceen in order to assess its Real Estate Project
Management Risk.
The scores obtained from the scorecard are then calculated based on weights given to response
within each area and aggregated to arrive at a final score for Real Estate Project Management Risk.
The score obtained for Real Estate Project Management Risk assessment is 86.27 out of 100. This
score is then calibrated with Pillar I capital charge as mentioned below:
Score Grade Min Max Applicable Capital charge
75-100 75 100 0.50%
50-74 50 75 0.75%
25-49 25 50 1.50%
0-24 0 25 3.00%

Pillar III – MACEEN CAPITAL 2015
26
The score of 86.27 calibrates to 0.50% of Pillar I Charge.
Real Estate Project Management Risk Score 86.27
Applicable % of Real Estate Project Management Risk 0.50%
Pillar I Capital Charge 90,356
Real Estate Project Management Risk Capital Charge 451.78
So the Real estate project management risk capital charge is 0.45 M.

Pillar III – MACEEN CAPITAL 2015
27
9.5 Capital Planning and Stress Tests
Maceen evaluates strategic options on the grounds of market attractiveness and growth possibilities
along with the assessment of internal sources to exploit the opportunities which results in an
informed decision backed by a business rationale.
Based on the evaluation of strategic options, Maceen will continue operating under the scope of
existing product/service licenses obtained from CMA but at the same time an effort will be made to
develop new products and services and enhance the client experience for the existing
products. The Board has directed the management to restructure the existing product mix so as to
explore new opportunities. With an expectation of high growth in operations, Maceen will require
continuous investment in working capital to support this growth.
As mentioned earlier, Maceen has sketched out a comprehensive business plan and has set out key
targets and milestones for its business lines to complement its growth. Maceen has aligned its
capital planning with its business plan.
Currently, the minimum capital requirement for Maceen as at December 31, 2015 was 109.3 M
(After Pillar II and stress testing scenarios) and the associated Capital Ratio was 1.08 times which is
above the minimum regulatory requirement of 1x.
Stress Testing Scenarios
Overview
Stress Testing refers to various techniques used by the APs to measure their vulnerability to
exceptional but plausible events. Stress testing is an important part of the risk management process
in Maceen and is considered as an integral part of ICAAP under Pillar II. Maceen has already
adopted CMA’s Prudential Rules, for guideline on stress testing and endeavors to improve upon by
adding further scenarios to the stress testing framework.
Maceen will apply stress tests at varying frequencies dictated by business requirements and
relevance. It will undertake fresh stress tests when there are significant modifications in the
underlying assumptions. The results of the various stress tests will be reported to the senior
management and Board of Director’s Audit and Risk Committee and will be an essential
ingredient of Maceen’s risk management systems.
The company will document the stress tests undertaken, the underlying assumptions, the results
and the corrective action to be undertaken.
Detailed Stress Testing Scenarios
The technique for stress testing employed at Maceen is according to the size, nature & profile of the
company. The method is derived from guidelines provided by CMA and comparable industry
practice. The stress testing technique employed at Maceen consists of scenario analyses, which will
be carried out for the major risks that are faced by the company’s credit risk, market risk and
operational risk.
The results of stress tests are analyzed for net change in required capital. The impact is quantified
for the purpose of stress testing only where additional capital is required under a specific scenario.

Pillar III – MACEEN CAPITAL 2015
28
Scenario 1 - Stress Testing of receivable deterioration
Stress Testing for receivable deterioration assess the impact of default by debtors of the
company resulting in a deterioration of receivable to past due receivables thereby affecting the
capital adequacy position. With respect to receivable deterioration, the company has undertaken
stress testing considering stress situations of low, medium and high intensity to assess the impact
on the capital ratio.
The following stress testing scenarios have been assumed:
� Low: 25% of the total receivables under risk bucket 150% and 300 % convert
to Past Due Receivables for which the risk bucket is 714%
� Medium:40% of the total receivables under risk bucket 150% and 300 % convert
to Past Due Receivables for which the risk bucket is 714%
� High: 50% of the total receivables 150% and 300 % convert to Past Due
Receivables for which the risk bucket is 714%
Summary Low Medium High
Receivable under investment fund exposure – 150 % Risk Weights (1)
32,506 32,506 32,506
% of Conversion of Receivables to Past Due (2)
25 % 40 % 50 %
Amount of Past Due Receivable (1*2)
8,126 13,002 16,253
Increase in Capital Charge (1*2*(714%-150%)*14%)
6,417 10,267 12,833
Receivable “other exposures – Retail Exposure” – 300 % Risk Weights (A)
3,123 3,123 3,123
% of Conversion of Receivables to Past Due (B)
25 % 40 % 50 %
Amount of Past Due Receivable (A*B)
781 1,249 1,562
Increase in Capital Charge (A*B*(714%-300%)*14%) 453 724 905
Total Increase in Capital Charge 6,869 10,991 13,738
Pillar III – MACEEN CAPITAL 2015
29
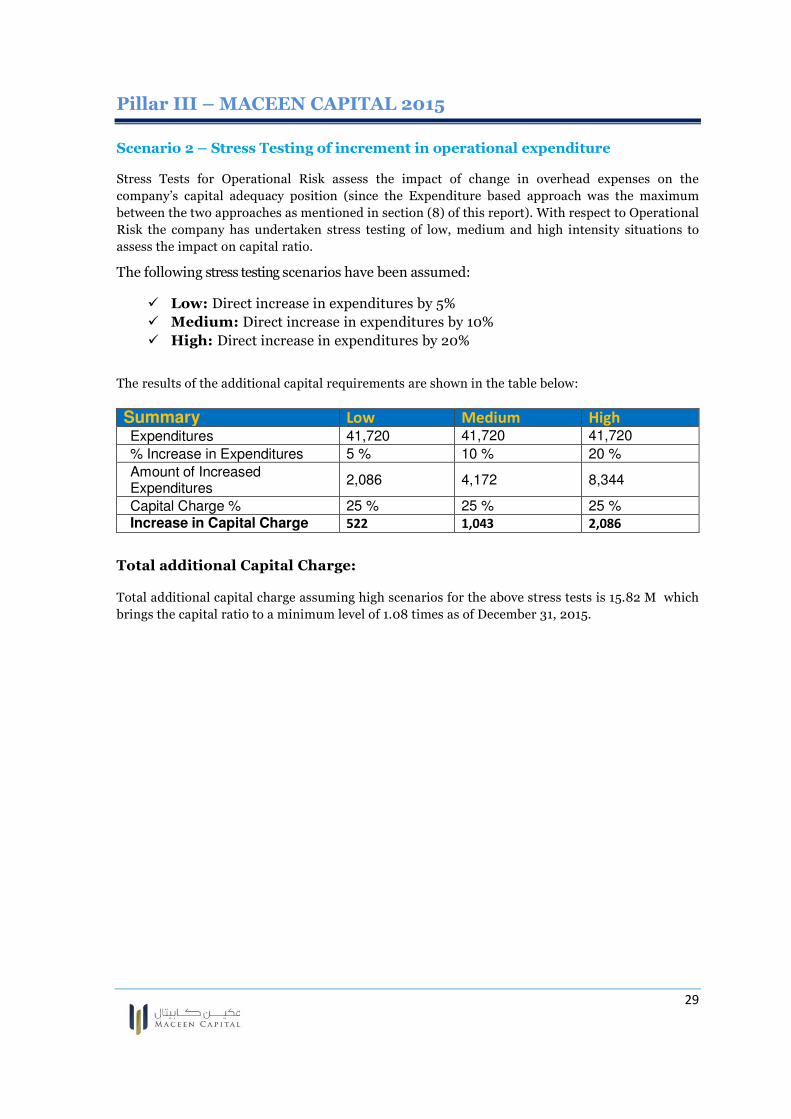
Scenario 2 – Stress Testing of increment in operational expenditure
Stress Tests for Operational Risk assess the impact of change in overhead expenses on the
company’s capital adequacy position (since the Expenditure based approach was the maximum
between the two approaches as mentioned in section (8) of this report). With respect to Operational
Risk the company has undertaken stress testing of low, medium and high intensity situations to
assess the impact on capital ratio.
The following stress testing scenarios have been assumed:
� Low: Direct increase in expenditures by 5%
� Medium: Direct increase in expenditures by 10%
� High: Direct increase in expenditures by 20%
The results of the additional capital requirements are shown in the table below:
Summary Low Medium High Expenditures 41,720 41,720 41,720
% Increase in Expenditures 5 % 10 % 20 %
Amount of Increased Expenditures
2,086 4,172 8,344
Capital Charge % 25 % 25 % 25 % Increase in Capital Charge 522 1,043 2,086
Total additional Capital Charge:
Total additional capital charge assuming high scenarios for the above stress tests is 15.82 M which
brings the capital ratio to a minimum level of 1.08 times as of December 31, 2015.