basel iii requirements and the stability of islamic and ... · basel iii requirements and the...
TRANSCRIPT

1
BASEL III REQUIREMENTS AND THE
STABILTY OF ISLAMIC AND CONVENTIONAL
BANKS1 Mohammad BITAR *
(Université Pierre Mendès France Grenoble II- CNRS)
150, rue de la Chimie
38400 Saint Martin d’Hères
Tél :(+33) 7 61 95 32 23
Preliminary version
Abstract
To date, most research concerning Islamic banking regulation has focused on theoretical aspects. This study aims to theoretically and empirically determine the Basel III regulatory relationship between Islamic and conventional banks. It particularly focuses on the impact of capital, liquidity, and leverage ratios on the probability of default in Islamic banks and in conventional banks by using parametric tests and multilevel quantile regression models. The studied sample consists of 11633 banks located in 76 countries over the period 2005-2011. The results suggest that Islamic banks orientations are not identical to those of conventional banks. We find that Islamic banks have higher capital regulatory ratio, higher maturity match and lower leverage in comparison with conventional banks. The capital, liquidity and leverage ratios affect differently Z-score, adjusted return on assets (AROA) and adjusted return on equity (AROE) in Islamic and conventional banks. The study also analyzes the impact of a combination of regulatory variables on the performance of Islamic and conventional banks. Therefore, Islamic banks are inclined to create their own regulatory frameworks rather than fully adopt Basel guidelines. We suggest that, using Basel III as a basis, Islamic regulatory organisms should develop guidelines better suited to their own specific needs concepts and principles rather than relying solely on conventional western banking financial theories.
Key Words: Basel III, Islamic banks, Banking stability, adjusted-risk, Multilevel quantile
regression
1 An earlier version of this paper was circulated under the title of “Basel III requirements for Islamic and
conventional banks: A GLOBAL PERSPECTIVE” and also under “Basel III Requirements AND STABILTY/RISK RELATIONSHIP of Islamic and Conventional banks”. Thanks to AFFI PhD workshop and the 30th International Symposiums on Money, Banking and Finance” for the constructive comments on the earlier versions of this paper. All errors of course rest with the author

2
* PhD candidate at the École Doctorale Sciences de Gestion ED 275 and CERAG (Centre
d’Études et de Recherches Appliquées à la Gestion), CNRS UMR 5820, Grenoble, Franc

3
1. Introduction In the late 1980s, the Basel committee on banking and supervision launched the first set of guidelines (Basel I) to harmonize banking regulations. It was meant to improve banking system stability and to fill the harmonization gap that had caused previous financial crises.
However, the Basel I agreement was found to be inefficient due to rapid development in the fields of financial innovation and risk management. Therefore, a new framework, Basel II, was published in 2004. This new agreement was based on three pillars: minimum capital requirement, supervisory review and market discipline. Basel II implementation was slow and difficult.
In 2007, the global financial crisis had a huge impact on the stability of the banking system. In this unpredictable climate characterized by financial perturbations, numerous questions were raised and understanding financial regulations and their impact became the top priority for researchers and policy makers. This drove the Basel Committee on banking and supervision toward implementing a new framework for banking supervision. This new framework was developed after a deep re-examination of all previous banking regulatory frameworks (especially Basel II) and resulted in the Basel III guidelines. It was put into action after being reviewed by the G20 members.
Interestingly, despite extreme instability in world financial system, it was noted that, unlike conventional banks, Islamic Financial Services Institutions were not affected by the crisis. This triggered further reflection regarding the “classic” western financial system. These reflections resulted in new lines of research discussing the role of Islamic financial institutions and explaining how and why Islamic banks survived the crisis. Previous research has analyzed the performance, efficiency, risk taking and regulations of this system by comparing it to conventional banks. The objective was to identify the key differences between the two systems to understand which system is more reliable under specific circumstances.
Since the creation of the first Islamic bank in the late 1960’s, the number of Islamic financial institutions worldwide has risen rapidly. The number has evolved from a few of dozen in 1980 to currently over 218 institutions located in more than 46 different countries (AIBIM, Association of Islamic Banking Institutions Malaysia). According to the 2012 Ernst and Young report, the total amount of assets held by Islamic banks has grown from 100 billion dollars in 1996 to more than 1100 billion dollars in 2012. In some countries, Islamic banks have become systemically important and in many cases are considered as « too big to be ignored » (Hassan and Dridi, 2010).
The purpose of this paper is to empirically evaluate the effectiveness of banking regulation imposed by Basel III. We intend to analyze and compare the impact of capital, liquidity and leverage requirements on the stability of the banking sector by emphasizing the differences and the similarities between Islamic and conventional banks. Our pulled sample consists of Islamic and conventional banks, resulting in a panel of 11633 banks (including 146 Islamic banks) located in 76 countries over the period 2005-2011. We run parametric tests of equality of means, analysis of variance and a multilevel quantile regression to assess whether Basel III requirements are applicable to both Islamic and conventional banks. Our research contributes to the existing literature in several ways. First, we utilize multilevel quantile regression to

4
determine whether Basel guidelines affect Islamic and conventional banks at different levels (quantiles) of banking stability and adjusted risk. Second, we theoretically and empirically investigate the main reasons behind the new structure of capital, liquidity and leverage ratio imposed by Basel III and whether it is reliable for the Islamic bank business model. Our paper is structured as follows. Section 2 establishes the theoretical framework used in analyzing banking regulation. In this section, the literature review is organized around three main initiatives carried out in the context of Basel III. Section 3 focuses on the choice of our methodology, our variables and describes the data set. Section 4 discusses the quantitative results, analyzes the descriptive statistics, the baseline regression and the additional tests. Section 5 concludes.
2. Theoretical background: Basel III regulatory framework After the 2007 financial crisis, the debate about implementing prudent banking regulation intensified. The concept of Basel III was both strongly criticized and supported in North America and in Europe and aimed to create barriers against banking risk exposure by focusing primarily on liquidity, leverage and capital reinforcement buffers.
Basel III does not take into consideration the particularities of the Islamic banking system. Despite (or perhaps because of) this, Islamic banks were not affected by the last financial crises, thus turning them into a valuable subject of study. Rajhi (2012) describes and empirically analyzes the risk of insolvency of Islamic and conventional banks in the Middle East, North Africa and Southeast Asian countries. Using a Z-score stability indicator as an endogenous variable, he finds that Islamic banks are more stable than conventional banks. He also finds that credit risk and income diversity ratios are a common factor of insolvency for Islamic banks, thereby demonstrating that Islamic banks can also fail. Using an array of accounting data, Beck, Demirgüç-Kunt, and Merrouche (2013) compare business models, efficiency, asset quality and stability of Islamic and conventional banks. They explain that the Islamic bank business model is very close to that of conventional banks. Using a cross-country empirical analysis, Čihák and Hesse (2010) investigate whether Islamic banks are more or less stable than commercial banks. They find that large conventional banks are more experienced and tend to be more stable than large Islamic banks. Small Islamic banks that concentrate on low-risk investments are more stable than are large Islamic banks that concentrate on profit sharing investments. This reflects the greater credit risk management challenges in large Islamic banks due to moral hazard and problems of adverse selection.
In terms of regulations, Kara (2011) explains that Islamic banks are in an advantageous position vis-à-vis Basel III. He shows that the capital in Shariah-Compliant banks is largely Tier 1 capital. Hawser (2011) agrees with Kara that Islamic banks are more capitalized than are conventional banks. Yet, he explains that the Basel III enforcement on Islamic banks is punitive. Applying Basel III liquidity requirements on Islamic banks is not an easy task. In fact, the new contribution of this reform is the introduction of two liquidity ratios: the Liquidity Coverage Ratio (LCR) and The Net Stable Funding Ratio (NSFR). Vasquez and Federico (2012) propose two proxies to compute the liquidity ratios for conventional banks, but until recently there has been no proxy to calculate the two ratios that take into consideration Islamic bank particularities.

5
2.1 Capital requirements in Islamic and conventional banks
The relationship between capital adequacy and bank stability and risk-taking has always been ambiguous2. Lee and Hsieh (2012) investigate the relationship between capital, risk and profitability. They offer an extensive literature review and explain that a change in capital gives rise to a change in bank risk. They argue that the relationship between capital and risk can be explained using the regulatory and moral hazard paradigms.
Generally, unregulated conventional banks tend to take excessive portfolio and leverage risks to maximize shareholder value, at the expense of the depositors. In fact, the reason behind this is that if high-risk loans do not pay off, depositor money is protected by deposit insurance (Benston et al., 1986; Furlong and Keely, 1989, Keely and Furlong, 1990). In addition, depositors loose interest in supervising bank investments because their money is guaranteed (Demirgüç-Kunt and Santomero, 2001). As a result, deposit insurance is no longer effective in preventing bank runs3 (Diamound and Dibvig, 1983; Brynat, 1983). Paradoxically, this situation creates incentives for managers to take more risk. To prevent this pattern of moral hazard and to support financial regulation theory, a capital-risk plan must be integrated (Kim and Santomero, 1988). This plan refers to a positive relationship between capital and risk, meaning that supervisory authorities encourage banks to increase their capital commensurably with the amount of risk taken (Altnubas et al., 2007 and Agusman et al., 2008). As a result, banks will be more prudent with their choice of riskier activities to avoid costly increases in their capital ratio. Thus, the objective of the capital adequacy ratio is to force banks to internalize losses and decrease moral hazard (Rime, 2001) namely by forcing bank shareholders to absorb a large part of the losses (Hassan and Kasyap, 2011). Consequently, the quality of assets and off-balance sheet risk exposure will be integrated into the bank capital requirement, thus strengthening the stability of the banking system (Sheldon, 1996a, 1996b; Barrios and Blanko 2003; Episcopos, 2008, Vasquez and Federico, 2012).
Alternatively, some authors argue a negative relationship between capital and risk. Using a mean-variance approach, Kahane (1977), Koehn and Santomero (1980), Kim and Santomero (1988), and Rochet (1992) find that capital requirement increases banking asset risk. They show that forcing banks to diminish their leverage reduces bank profits, leading them to take more risks by choosing higher points on the efficiency frontier. Accordingly, Blum (1999) uses a dynamic model to explain that if it is too costly for banks to raise their capital ratio to meet the capital standards in the future, banks will probably increase their risky investments today. Fronseca and González (2010) explain that this may lead to a greater probability of default. Similarly, Avery and Berger (1991) show that risk based capital damages bank
2See Pettway et al., 1976; Johankhani and Lynge, 1980; Brewerand and Lee, 1986; Shrieves, 1992; Berger, 1995; Freixas and Rochet, 1997; Jacques and Nigro, 1997; Santos, 1999; Demirgüç-Kunt and Kane, 2002; Ianotta et al., 2007; Altunbas et al., 2007; Agusman et al., 2008; Fonseca and González, 2010; Agoraki et al., 2011.
3We note that Demirgüç-Kunt and Santomero (2001) explain that to make deposit insurance a safety net for small depositors and a good way of reducing concerns about the stability of small banks, supervisory authorities must be active and efficient.

6
stability. They also demonstrate that raising capital can be accomplished either by issuance of equity or by holding excessive capital buffers to avoid regulatory penalties.
However, the resources of Islamic banks are very different from those of conventional banks. The Basel III framework is based on the balance sheet of conventional banks. Therefore, it does not take into account the particularities of Islamic banks. Islamic banks finance their activities through three funding sources: their own capital, demand deposits and profit sharing investment accounts (Boumediene, 2012; Turk-Ariss, 2007). The latter contain restricted (RPSIA) and unrestricted investment accounts (UPSIA) that are not guaranteed by the bank because account holders are considered as investors. Hence, profit and initial capital are related to the success of the investment and deposit insurance is not required. Thus, the deposit insurance risk relationship is broken. Managers will no longer take excessive risk because they know that depositors (investment account holders) will lose their money. Therefore, a manager behavior will directly impact the depositors. The latter can decide to withdraw their money. This may impact the reputation of Islamic banks who also suffer for liquidity management problems. Islamic banks should be careful when it comes to project investment decision, especially, in countries where competition with conventional banks exists. Furthermore, Islamic banks keep most of their capital in the form of Tier 14 assets which does not include profit sharing investment accounts5. Consequently, these accounts are also excluded from the calculation of the risk weighted assets of the capital adequacy ratio, making it easier for Islamic banks to comply with Basel III requirements since Basel II favored debt in the capital structure of banks (Parker, 2011; Rizwan et al., 2012).
INSERT TABLE [1] HERE
2.2 Liquidity requirements in Islamic and conventional banks
One outcome of the recent financial crises is the recognition that liquidity is as important to bank stability as are capital requirements. Liquidity risk is the result of the gap between the maturities of the two sides of a balance sheet. Liquidity can be defined as the aptitude of a financial institution to maintain balance between financial inflows and outflows over time (Vento and Ganga, 2009). Studies have shown that banks with higher liquidity and larger capital buffers are less vulnerable to failure during financial crises (Berger and Bowman, 2010; Bologna, 2011). In an IMF working paper that discusses the relationship between structure liquidity and the probability of banking default, Vasquez and Federico (2012), find that banks with weaker structural liquidity and banks with a higher leverage ratio in the pre-crisis period were more vulnerable to failure.
For Islamic banks, liquidity management is one of the most important challenges facing bank industry development (Ray, 1995; Vogel and Hayes, 1998). Authors argue that Basel III liquidity risk requirements will affect Islamic banks for multiple reasons. First, surplus
4Islamic bank capital contains Tier 1 and reserves. There are neither preferred shares nor subordinated debt.
Therefore, there is no Tier 2. 5Boumediene (2011) relates the reason behind exclusion of profit sharing investment accounts from the definition of Tier 1 assets to the fact that the latter does not meet Basel III criteria. (For more information, see: Basel III relevance for Islamic banks).

7
liquidity of Islamic banks cannot be transferred to conventional non-Shariah banks (Akhtar et al., 2011). Second, access to liquidity during stressful situations is limited due to constraints on borrowing imposed by the Shariah (no access to loans and no facilities acting as lenders of last resort). Third, Islamic banks operate within an undeveloped Islamic money market (Sundarajan and Erico, 2002; Iqbal and Llewellyn, 2002; Čihák and Hesse, 2010) and face a lack of liquid Islamic investment tools with short term maturities (Harzi, 2011). In addition, Islamic banks cannot sell their own debt6 (Anas and Mounir, 2008) using conventional securities (Beck et al, 2010).
According to Oldfield and Santomero (1997) liquidity risk arises from maturity mismatches where liabilities have a shorter turn around than assets. Islamic banks rely on long term equity tools such as Mudarabah and Musharakah (Metwali, 1997). Therefore, a sudden withdrawal that is above the expected level can lead to disparities of cash or liquid assets, making Islamic banks more vulnerable to runs than are conventional banks. Given this situation, Islamic banks need to be more cautious about the maturity structure of their assets by developing tools other than Murabaha (Ariffin, 2012) and by maintaining assets of a short term nature.
As a result, Islamic financial institutions need to adopt and incorporate some of the liquidity requirements from Basel III into their own risk management standards and practices.
INSERT TABLE [2] HERE
2.2 Leverage framework in Islamic and conventional banks
The leverage ratio formalized by the Basel III agreement can be computed by dividing the capital measure by the exposure measure. It is calibrated to act as a credible additional measure to other risk-based capital measures7. This ratio illustrates how many times banks succeed in multiplying their invested capital by attracting resources (Toumi et al., 2011). The leverage ratio was strongly associated with the massive losses that occurred during the 2007-2008 financial crises. Bashir and Hassan (2003) report a negative correlation between leverage and profitability in Islamic banks. Anginer et al. (2012) show a negative but insignificant relationship between distance to default and leverage ratio of banks. Männasoo and Myes (2008) prove that higher leverage increases bank failure risk when examining the European context. Vasquez and Federico (2012) illustrate a negative and significant relationship between equity to assets ratio and distance to default. Studying the failure risk in Islamic and conventional banks, Pappas, Izzeldin and Fuertes (2012) find that higher leverage increases the failure risk of conventional banks, whereas the same situation is favorable for
6Since Islamic banks are Shariah-Compliant, they cannot sell their own debt. Securities which are considered as liquid assets for conventional banks are considered as illiquid for Islamic banks. For example, if we compare government bonds and Sukuk, It is very clear that government bonds are very liquid and if banks are in need of cash, these securities can be easily sold. Therefore, government securities are eligible to be counted in the liquidity ratios for Basel III. Islamic bonds (Sukuk), on the other hand, cannot be traded easily and cannot be included in the liquidity calculations. This is one of the major disadvantages Islamic banks face; their liquid assets can only be equity and there is a severe shortage of liquid equity based assets (Harzi, 2011). 7BCBC (2010a)

8
Islamic banks. Their results are consistent with Srairi (2008), and Sanusi and Ismail (2005) who conclude that profitable Islamic banks possess higher levels of debt8.
INSERT TABLE [3] HERE
In the following sections we present our data, the methodology and our empirical results.
3. Data and methodology
3.1 Sample
In this section we describe the data sources used in this paper. We note that authors agree on using Bankscope9 as the primary source for obtaining bank financial information (Beck et al., 2013; Anginer et al., 2012; Pappas et al., 2012; Čihák and Hesse, 2010; Al-Muharrami et al., 2006; Viverita et al., 2007). Therefore, we chose Bankscope as our primary source of data for this study. We retrieve annual data for 11633 (including 146 Islamic banks) banks incorporated in 76 countries. Data are yearly, spanning from 2005 to 2011. The sample is described by country and by bank type in Appendix A.1.
3.2 Multilevel quantile regression model
We use quantile regression to test whether our measure of banking regulation and supervision have a homogenous effect on banking stability. Introduced by Koenker and Basset (1978), quantile regression parameter estimates the change in a specified quantile(s) of the response variable Y�Y��, Y��, … , Y��� produced by a one unit change in the predictor variables�X�, X�, … , X��. It is a generalization of median regression analysis to other quantiles of the response variable (Koenker and Hallock, 2001). As we know, least square regression is the minimization of the following optimization problem:
� = "#$%&'( ) * +,-. − �0�1.2� ,10
8According to trade-off theory (Frank and Vidhan, 2005), profitable firms tend to take more debt to benefit from tax shields. Therefore, they borrow as much money as they can, since the probability of paying back loans is greater than the risk of default. Consequently, a positive association between leverage and profitability will support the trade-off hypothesis. 9Several notes should be mentioned when using the Bankscope database: (i) Using only consolidated bank statements limits our sample. Therefore, we retrieve consolidated data when available, and unconsolidated data when consolidated data are not available, (ii) Bankscope commercial banks also contain mistakenly categorized Islamic banks so we had to separate Islamic from conventional banks manually, (iii) Bankscope does not consider the specification of Islamic banks. For example, we cannot find financial information related to Restricted and Unrestricted investment accounts or Islamic financial products (Mudarabah, Musharakah, Murabaha…), (iv) the data set does not distinguish between conventional banks with Islamic windows and conventional and Islamic banks.

9
It is the same concept as that of the sample mean, which minimizes the sum squared of residuals in the OLS. This concept can be extended to the linear conditional mean function 4,5|7 = 80 = 89: by solving10:
: ; = "#$%&'( ) *< +,-. − �,8., :00�1.2� ,20
Let us now define the median as the solution to the problem of minimizing a sum of absolute residuals (Fitzenberger, 2012; Koenker and Hallock, 2001). The median of a random sample �-�, -�, … , -1� of Y can be interpreted as the minimizer of the sum of absolute deviations (He and Chei, 2005)
>?@&"' = "#$%&' A ∈ * +|-. − C|1. 2 � ,30
Thereby, the general E th sample quantile, can be expressed as the solution of the following optimization problem11:
"#$%&' A ) * + FG,-. − C0 1.2� ,40
The linear conditional quantile function I,E|7 = 80 = 89:,E0 can be estimated by solving (Koenker and Hallock, 2001):
: ; ,E0 = "#$%&' J ) *< + FG,-. − 8.9:01.2� K&Lℎ E N ,0, 10 ,50
To sum up, the E th quantile regression is the solution of minimization of the following optimization problem:
%&'J)*< Q + |-. − 8.9:|. E + + ,1 − E0|-. − 8.9:|. ) S.:UVW XVYJZ. ) S.: UV[ XVYJZ
\ ,60
Estimating a whole set of quantile functions provides a richer description of the heterogeneous relation between bank regulation and supervision and bank soundness. Quantile regression results are robust to outliers and distributions with heavy tails. It also avoids the restrictive assumption that the error terms are identically distributed at all points of the conditional distribution. We use SAS 9.3 software to run our model. The baseline quantile regression is given by:
10 Colin Chen, An introduction to Quantile regression and the Quantreg procedure, paper 213-30, SAS institute Inc. 11
ρ�,. 0 is the absolute value function. For more details see Koenker and Hallock (2001), and Fitzenberger (2012).

10
I_`"'a.bcde4f.bcg = h i `"'a&'$ #?$jk"L&l' ,`e0`"'a&'$ ml'L#lk k?n?k ,`o0olj'L#- ml'L#lk kn?k ,oo0 (7)
Where ̀ "'a&pL is the vector of our three measures of stability and risk of bank i in country j in
year t. Our primary dependent variable is bank i’s stability (in country j in year t). The Z-score is one of the most popular measures of bank soundness (see Boyd and Graham, 1986; Boyd and Runkle, 1993; Stiroh, 2004; Mercieca, Schaeck and Wolfe, 2007, Vasquez and Federico, 2012). It is the inverse measure of overall bank risk, and equity to total assets for the bank capitalization level (Berger, Klapper and Turk-Ariss, 2009). It measures how close a bank is to insolvency. It is calculated as follows (Yeyati and Micco, 2007):
q_erss.bc ≤ −4/s.bcg ≤ v*wxxVy�_erss.bc + 4/s.bcg� ≡ 1{.bc� ; {.bc = erss.bc + 4/s.bcv*wxx.b
Where E/A is the equity to asset ratio (total equity divided by total assets), ROAA is the return on average assets and v*wxx.b is the standard deviation of ROAA for bank i in country j
over the period under study. We also include other measures of risk-adjusted return on equity and return on assets by dividing ROE and ROA by their own standard deviation12:
sers.bc = ers.bcv*wx ; ser4.bc = er4.bcv*w}
Where ROE is the ratio of net income divided by assets, and v*wxis its own standard deviation, ROE is the ratio of net income divided by total equity, and v*w}is its own standard deviation. Therefore, a higher ratio indicates good risk-adjusted profits and more banking stability (Turk-Ariss, 2010).
The vectors of exogenous variables include four groups: (i) a list of regulatory variables, (ii) bank level variables, (iii) country level variables which also include macroeconomics variables, and (iv) interaction, cross section, and time-series fixed effect variables.
BR is the vector of banking regulation. We use it to refer to the Basel guidelines for banking regulation and supervision.
In this study we use three regulatory ratios to proxy the impact of the new Basel III guidelines. We refer to Bankscope total Capital ratio13 (regulatory capital ratio, TCR) to measure the impact of capital requirement on the stability of conventional and Islamic Banks.
12We follow the work of Mercieca, Shaeck and Wolfe (2007) called: “The small European banks: benefits from diversification?”, and also the work of Turk-Ariss (2010) : “On the implication of market power in banking: Evidence from developing countries”. 13
According to Bankscope ratio definitions, the capital adequacy ratio measures Tier 1 + Tier 2 capital which includes subordinated debt, hybrid capital, loan loss reserves and the valuation reserves as a percentage of risk weighted assets and off balance sheet risks. This ratio must be maintained at a level of least 8% under Basel II rules.

11
We also use the maturity match ratio (MA) provided by Bankscope to proxy the liquidity risk related to mismatch between assets and liabilities of banks’ balance sheet (Beck et al. 2013; Rajhi, 2012). It is computed by dividing the liquid assets by deposit and short term funding. This ratio explains the risk arising from different maturity profiles of liabilities and assets in financial institutions. A higher value means that a bank is more liquid.
As for leverage ratio (TLTA), we use total liabilities to total assets (Anginer et al., 2012).
BC is the vector of bank portfolio characteristics. It includes total deposit to total assets (TDTA), bank size (LnTA) measured by the natural logarithm of total assets, the fixed assets to total assets (FATA), the assets diversity ratio (ADR), and the credit risk ratio (CR).
We use the fixed assets to total assets ratio to control for the opportunity cost that arise from havinf non-earning assets on the balance sheet of a banks (Beck et al., 2013).
Credit risk, also known as the provision ratio, studies the banks precautionary policy regarding the given credit criteria. However, the interpretation of this ratio might be ambiguous: a higher ratio might be explained as precautionary reserve policy but at the same time, an anticipation of high non-performing revenue (Anginer, Demirguc-Kunt, and Zhu, 2012; Rajhi, 2012).
We also include the assets diversity ratio as a measure of bank diversification activity. This ratio captures the degree to which banks diversify between lending and non-lending activities. According to Rajhi (2012), this ratio is very similar to the income diversity ratio. On average, it takes values between 0 and 1. The higher the value, the more activities are diversified.
A banks’ total earning assets consist of lending activities (net loans) and non-lending activities (other earning assets). According to Bankscope, net loans combine mortgages and other mortgage loans, retail, commercial and corporate loans minus the reserve of non-performing loans. Other earning assets can be classified as non-lending activities and computed from loans and advances to banks, securities, derivatives, investment in property, and insurance activities. In Islamic banks, things are quite different. The financing (lending) activities can be defined as profit/loss sharing accounts. To provide funds to companies or individuals (Mudarabah, Musharakah, Murabaha…), Islamic financial institution lending activities involve mobilizing fund transfers from savers to investors (Profit sharing investment accounts). Other earning assets for Islamic banks generally measure fee based services (Juala, Wakala, Kafala…)14.
CC is the vector of country control variables which includes the GDP growth that represents the economic development. Normally a higher value of GDP growth reflects higher financial stability (Beck, Demirgüç-Kunt, and Merrouche, 2010; Anginer, Demirgüç-Kunt, and Zhu, 2012; Vasquez, and Federico, 2012). We use the consumer price index (CPI). We also introduce the logarithm of the Official Exchange Rate (LnTCO), the London Interbank
14For more information, see: “Islamic Finance and Global Financial Stability report”, Islamic Financial Services Board IFSB, 2010.
12
Offered Rate15(LIBOR), the natural logarithm of population to control for country size (Anginer, Demirgüç-Kunt, and Zhu, 2012), and the concentration ratio (CON).
All explanatory variables are lagged by one year and winsorized at the 1 and 99 percent levels to mitigate the effect of outliers. Variables definitions and sources are explained in Appendix A.2.
4. Empirical results
4.1 Descriptive statistics
As we stressed in the introduction, this paper studies the possible impact of banking regulation on the stability and risk adjusted return on assets and adjusted return on equity of the banking system. We report the relationship between the three-pronged regulation of capital, liquidity and leverage imposed by Basel III on the stability of the banking system using proxies of the three variables and a panel of Islamic and conventional banks.
Table 4, A, B, C provides Pearson and Spearman16 correlation coefficients for our three dependent variables (table 4.A), for our main independent variables (table 4.B) and for our basic regression model (table 4.C). We find a positive and a significant correlation between ZS and AROA, between ZS and AROE, and between AROA and AROE. Thus, these three measures are a good representative for the risk-adjusted performance (Mercieca et al., 2007) and bank stability (Turk Ariss, 2010).
INSERT TABLE [4] HERE According to Table 4.B our main independent variables are highly correlated. Therefore, we regress each variable alone to avoid multi-collinearity problems.
Furthermore, we test the correlation between our bank and country control variables. Results are presented in table 4.C. Kennedy (2008) indicates that multi-collinearity is a critical problem when the correlation is above 0.80. In our model this is not the case.
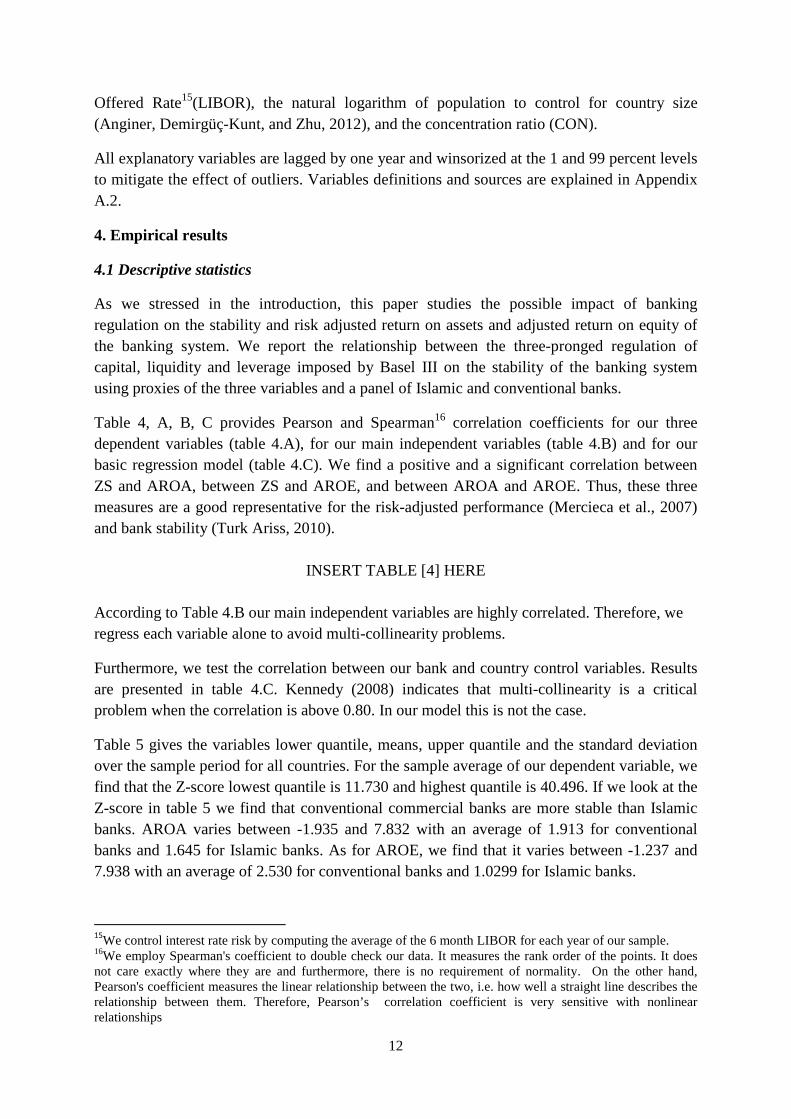
Table 5 gives the variables lower quantile, means, upper quantile and the standard deviation over the sample period for all countries. For the sample average of our dependent variable, we find that the Z-score lowest quantile is 11.730 and highest quantile is 40.496. If we look at the Z-score in table 5 we find that conventional commercial banks are more stable than Islamic
banks. AROA varies between -1.935 and 7.832 with an average of 1.913 for conventional banks and 1.645 for Islamic banks. As for AROE, we find that it varies between -1.237 and 7.938 with an average of 2.530 for conventional banks and 1.0299 for Islamic banks.
15We control interest rate risk by computing the average of the 6 month LIBOR for each year of our sample. 16We employ Spearman's coefficient to double check our data. It measures the rank order of the points. It does not care exactly where they are and furthermore, there is no requirement of normality. On the other hand, Pearson's coefficient measures the linear relationship between the two, i.e. how well a straight line describes the relationship between them. Therefore, Pearson’s correlation coefficient is very sensitive with nonlinear relationships
13
The basic descriptive statistics also indicate that Islamic banks are more capitalized than conventional banks. Total capital ratio varies between 8.320% and 31.920% across banks over our sample period with an average of 15.979% for commercial banks and 22.889% for Islamic banks.
We use the maturity match ratio to determine the impact of liquidity on the stability (risk) of the banking sector. This ratio varies from 2.320% to 93.302%, with a mean of 33.918% for conventional banks and 44.368% for Islamic ones. To gain a comprehensive understanding of how Basel III considers that on- and off- balance sheet leverage was one of the major factors to the buildup and spread of the financial crisis, we calculate liabilities divided by total assets (Anginer et al., 2012) as a proxy for excessive risk taking (when banks are highly leveraged).
INSERT TABLE [5] HERE Table 5 indicates that the leverage ratio varies between 64.35% and 96.233%, with a mean of 87.089% for conventional banks and 79.798% for Islamic banks.
To control bank size, we integrate the logarithm of assets because it is widely used in the literature. We find that conventional banks are bigger than Islamic banks with a mean of 14.695 for the former and 13.897 for the latter.
To examine whether Islamic banks possess more fixed assets than conventional banks, we adopt the ratio of fixed asset to total asset to control for fixed assets that result from engaging in banking activities. We find that Islamic banks hold more fixed assets than do conventional banks. The average is 1.390% for conventional banks and 1.677% for Shariah-Compliant banks. Our results are similar to those obtained by Demirgüç-Kunt et al. (2010) and Beck et al. (2013). Statistics also show that the assets diversity ratio average is 0.85 with an average of 0.793 for conventional banks and 0.928 for Islamic banks. Credit risk average is 17.939% for conventional banks and 21.143% for Islamic banks meaning that Islamic banks are expecting greater exposure to credit risk or this difference might represent prudent and preventive policies adopted by these financial institutions.
Descriptive statistics per country and variable are presented in appendix B.1.
4.2 Univariate analysis
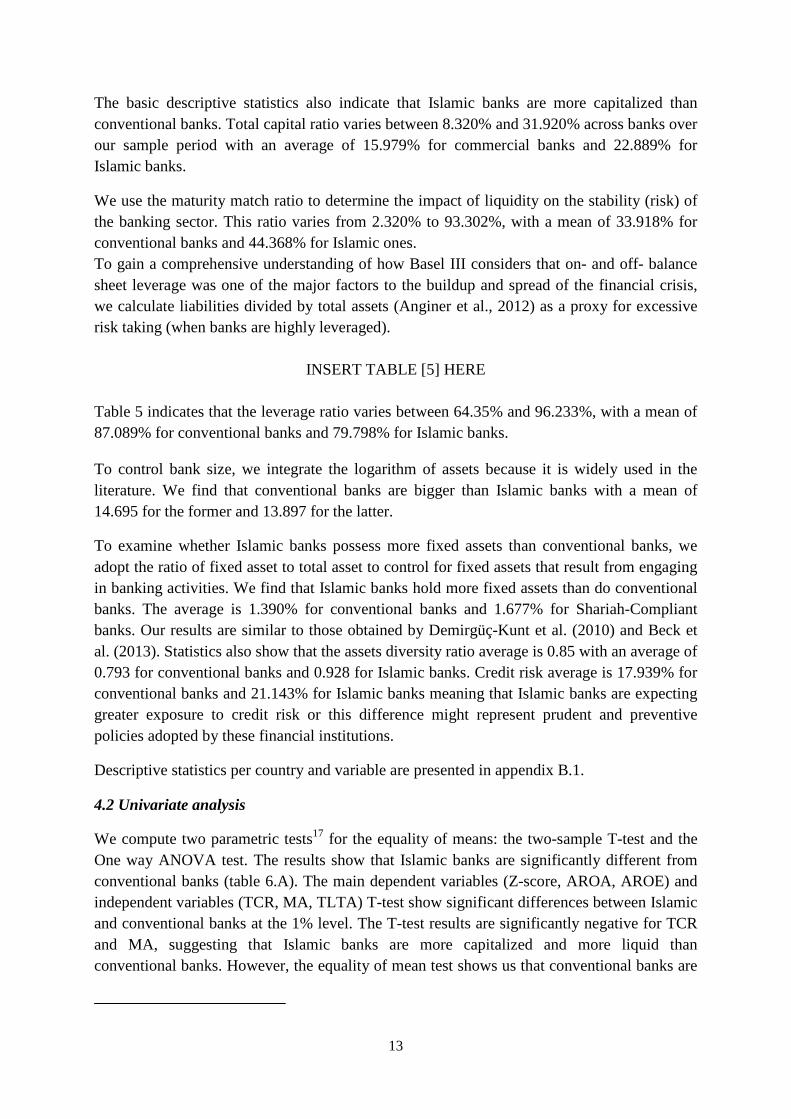
We compute two parametric tests17 for the equality of means: the two-sample T-test and the One way ANOVA test. The results show that Islamic banks are significantly different from conventional banks (table 6.A). The main dependent variables (Z-score, AROA, AROE) and independent variables (TCR, MA, TLTA) T-test show significant differences between Islamic and conventional banks at the 1% level. The T-test results are significantly negative for TCR and MA, suggesting that Islamic banks are more capitalized and more liquid than conventional banks. However, the equality of mean test shows us that conventional banks are
14
more stable and highly leveraged than their Islamic counterparts. Our results are in line with those obtained by Cihak and Hesse (2010) and Beck et al. (2013) but different from the results found by Rajhi (2012).
INSERT TABLE [6] HERE
In addition, table 6.B compares Islamic banks. For instance, we find no significant differences between Iranian banks (where the entire banking system is Islamic) and the rest of Islamic banks (where the banking system is dual). Nevertheless, the results also show a slight difference in AROE at the 10% level and TCR and MA at the 5% level, suggesting that the characteristics of the Iranian Islamic banking regime are quite different from the dual banking system in the rest of the countries of our sample.
Moreover, univariate comparisons show no significant differences between MENA’s Islamic banks and SEA’s Islamic banks. According to previous theoretical works, Southeast Asian countries and especially Malaysia enjoy a harmonized banking system, where Islamic banks are fully controlled by the Central bank of Malaysia. Indeed, Islamic banks in Malaysia are treated like conventional banks. The same regulatory framework is applied to both banking systems. On the other hand, things are not the same in Islamic banks in MENA and (especially) in GCC countries. For example, Islamic bank Shariah decisions differ from one country to another. Even within the same country and the same city, products and services delivered by Islamic banks can differ in terms of defining a product and in terms of conditions and fees. From this perspective, we conducted another test by studying the equality of means between subsamples from GCC and SEA. The results presented in table 6.B confirm the theory that Islamic banks work according to different principles and concepts in the two regions. Except for AROA, where we did not find any differences, AROE and Z-score were found to be significantly different at 5% and 10% respectively. Similarly, TCR, MA and TLTA were significantly different at the 1% level (the negative sign of AROE and TLTA suggest that Islamic banks in GCC countries are more leveraged and more stable/profitable than in SEA countries).
INSERT TABLE [7] HERE
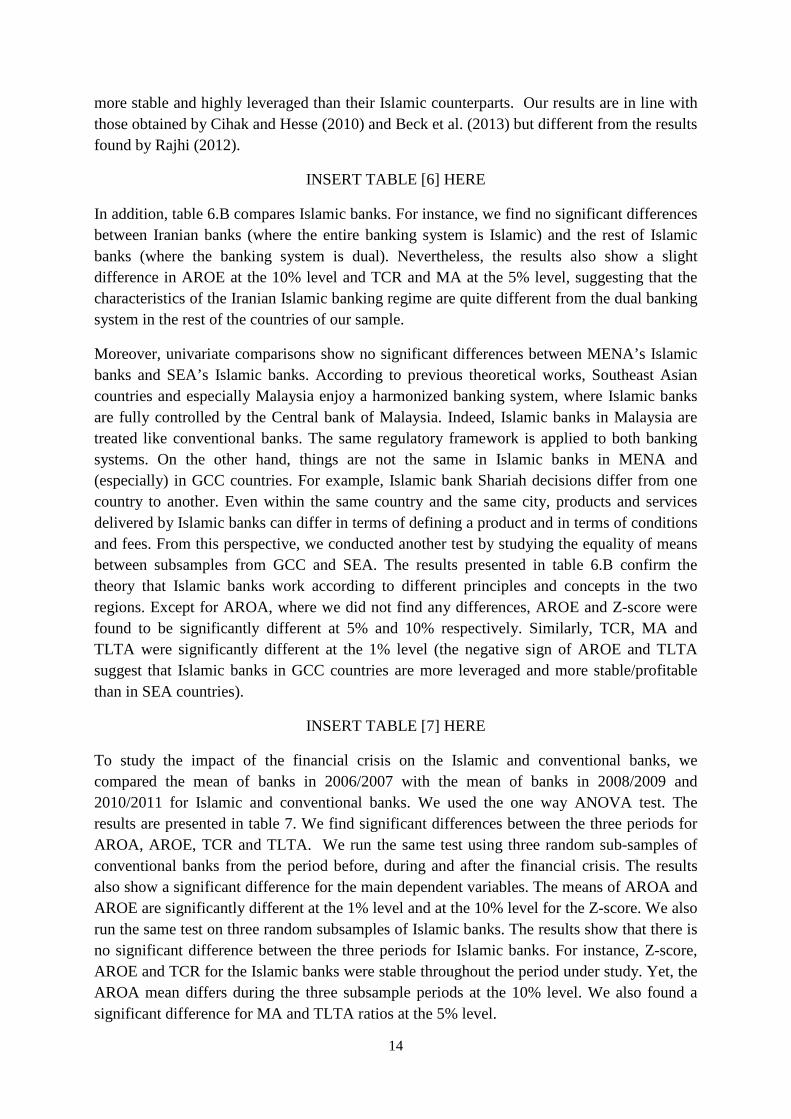
To study the impact of the financial crisis on the Islamic and conventional banks, we compared the mean of banks in 2006/2007 with the mean of banks in 2008/2009 and 2010/2011 for Islamic and conventional banks. We used the one way ANOVA test. The results are presented in table 7. We find significant differences between the three periods for AROA, AROE, TCR and TLTA. We run the same test using three random sub-samples of conventional banks from the period before, during and after the financial crisis. The results also show a significant difference for the main dependent variables. The means of AROA and AROE are significantly different at the 1% level and at the 10% level for the Z-score. We also run the same test on three random subsamples of Islamic banks. The results show that there is no significant difference between the three periods for Islamic banks. For instance, Z-score, AROE and TCR for the Islamic banks were stable throughout the period under study. Yet, the AROA mean differs during the three subsample periods at the 10% level. We also found a significant difference for MA and TLTA ratios at the 5% level.
15
INSERT TABLE [8] HERE
Finally, we conducted a series of comparisons for our Islamic and conventional bank variables between countries. We find that dependent and independent variable means differ significantly at the 1% level from one country to another for conventional banks as well as for Islamic banks.
In conclusion, univariate analysis shows us that Islamic banks and conventional banks have different characteristics. These characteristics might differ from one region to another and from one country to another. That brings us to our empirical study presented below.
4.3 Baseline quantile regression
To assess differences in stability and risk adjusted return on assets and adjusted return on equity, we conduct a series of quantile regressions. The first model is represented as follow:
I_`"'a.bcde4f.bcg = ~ + `o.bc�� + ∅ × oobc�� + � + olj'L#-1 �21�2� + � + �&%?c
�2c�2� ,80
+� × �`�� + �
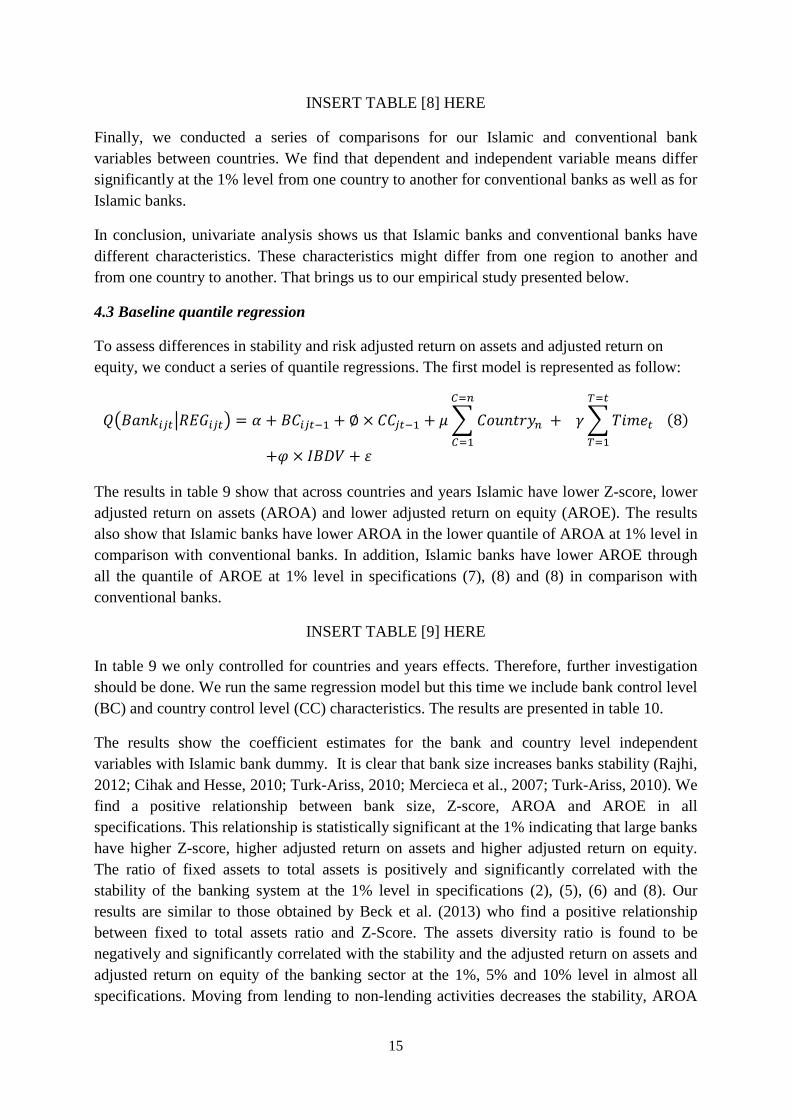
The results in table 9 show that across countries and years Islamic have lower Z-score, lower adjusted return on assets (AROA) and lower adjusted return on equity (AROE). The results also show that Islamic banks have lower AROA in the lower quantile of AROA at 1% level in comparison with conventional banks. In addition, Islamic banks have lower AROE through all the quantile of AROE at 1% level in specifications (7), (8) and (8) in comparison with conventional banks.
INSERT TABLE [9] HERE
In table 9 we only controlled for countries and years effects. Therefore, further investigation should be done. We run the same regression model but this time we include bank control level (BC) and country control level (CC) characteristics. The results are presented in table 10.
The results show the coefficient estimates for the bank and country level independent variables with Islamic bank dummy. It is clear that bank size increases banks stability (Rajhi, 2012; Cihak and Hesse, 2010; Turk-Ariss, 2010; Mercieca et al., 2007; Turk-Ariss, 2010). We find a positive relationship between bank size, Z-score, AROA and AROE in all specifications. This relationship is statistically significant at the 1% indicating that large banks have higher Z-score, higher adjusted return on assets and higher adjusted return on equity. The ratio of fixed assets to total assets is positively and significantly correlated with the stability of the banking system at the 1% level in specifications (2), (5), (6) and (8). Our results are similar to those obtained by Beck et al. (2013) who find a positive relationship between fixed to total assets ratio and Z-Score. The assets diversity ratio is found to be negatively and significantly correlated with the stability and the adjusted return on assets and adjusted return on equity of the banking sector at the 1%, 5% and 10% level in almost all specifications. Moving from lending to non-lending activities decreases the stability, AROA

16
and AROE of the banking system. Similarly, we find that credit risk ratio is negatively and significantly correlated with stability at the 1% level in all specifications. This shows that Z-score AROA and AROE are inversely related to credit risk in all specifications. Banks with higher deposits to assets have higher adjusted return on assets and adjusted return on equity. This indicates that banks with higher deposits ratio are more stable and less risky than banks with low deposit ratio. The coefficient estimate of the concentration ratio shows ambiguous results. We find no significant correlation between concentration ratio and Z-score but a negative and significant relationship with AROA and AROE in specifications (6) to (9). We also notice that concentration ratio has a significant effect on all quantile of adjusted risk. Thus, a more concentrated banking sector negatively impacts AROA and AROE of the banking system (Anginer et al. 2012; Schaeck et al. 2006; Nicoló and Jalal, 2006).
INSERT TABLE [10] HERE
Table 10 also includes an array of country level and macroeconomic control variables. For the macroeconomic variables, we find that more stable banks are positively associated with GDP (Rajhi, 2012; Demirgüç-Kunt et al. 201; and Beck et al. 2010). This means that countries with better GDP have better adjusted return on assets and adjusted return on equity. We also find that banks in countries with higher GDP have negative impact on banks with higher stability in specifications (3) at 1% level. The Consumer price index shows ambiguous results. We find that this index positively correlated with banks lower quantile of AROA and negatively correlated with the upper quantile of AROE of Islamic and conventional banks in specifications (11) and (12) at 1% level. Total exchange rate is negatively and significantly correlated with the AROA but positively and significantly associated with AROE of the banking system. Ambiguous results were also found between total exchange rate and Z-score while the coefficient estimates of LIBOR negatively impact the stability and the adjusted return on assets and adjusted return on equity of the banking system at the 1% level. We also find evidence for a negative and significant relationship between countries population and banking stability. Finally, we add a crisis variable to study the impact of the 2008 financial crisis on the stability of the banking system. We find a negative and significant relationship in specifications (1), (2), (3) and (5) for Islamic and conventional banks.
4.4 Three-pronged regulation: implication of capital, liquidity and leverage
To investigate whether regulatory variables improve financial stability, we examine the relationship between capital, liquidity, leverage ratio and the stability of the banking sector. Our dependent variables are bank i’s Z-score, adjusted return on assets and adjusted return on equity (in country j in year t). Using the quantile regression, we study the impact of regulatory variables on the different quantiles of stability measures of the banking sector. Therefore, we use the following equation:
Q_`"'a&pLdREG���g = α + θ × BC����� + ∅ × CC���� + ϑ × BR���� + � + olj'L#-' o='o=1 ,90
+� + �&%?c�2c�2� + ε

17
Breaking from the existing literature, this is the first study that uses quantile regression to compare the possible impact of regulation on various levels of stability (quantiles) of Islamic and conventional banks. Table 11 presents the results of our baseline model and three regulatory variables: Total capital ratio (TCR) known as regulatory ratio, maturity match ratio and liabilities to assets ratio. As in table 10, we include country-years fixed effects and bank-level control variables. Specification (1) shows that total capital ratio increases bank stability at the lower quantile of stability. The relationship between the capital ratio and the lower tail of stability is positive and significant at the 1% level for Z-score model, 5% level for adjusted return on assets model and adjusted return on equity model. Banks with higher capital ratios are positively associated with bank stability, adjusted return on assets and adjusted return on equity. Thus, our findings support the regulatory paradigm that regulators encourage banks to increase their capital as a result of the amount of risk taken (Shrieves and Dahl, 1992; Jacques and Nigro, 1997; Aggarwal and Jacques, 1998; Editz et al., 1998; Altunbas et al., 2007). By internalizing their own risk, they incite banks to re-consider the amount of risk taken because it engenders a higher cost (higher capital buffers). However, we find that the impact of the total capital ratio varies between quantiles. We find that TCR have a positive impact on the Z-score in specifications (1), (2) and (3) but only on specifications (1) and (2) for AROA and specification (1) for AROE.
Unlike the results obtained by Rajhi (2012), we find no impact for liquidity ratio on the corresponding stability and adjusted return on assets of the banking system. We also find a negative net effect for liquidity on the adjusted return on equity. The coefficients of our liquidity ratio are negative and significant in specifications (5) and (6) at the 1% levels. However, Vasquez and Federico (2012) investigate the relationship between the structural liquidity and the banks’ probability to default. They found that banks with weaker structural liquidity are more vulnerable to failure (Ratnovski and Huang, 2009; Berger and Bouwman, 2010; Bologna, 2011).
The ratio of total liabilities divided by total assets is negatively associated with bank stability in specifications (7) and (8) at the 1% level indicating that a higher leverage ratio (highly leveraged banks) decreases bank stability. Nerveless, we find a positive and significant relationship between leverage ratio and adjusted return on assets and adjusted return on equity. Therefore, banks with higher leverage have higher adjusted profitability.
To sum up, quantile regressions suggest that regulation has a significant effect on the stability of the banking system. However, this relationship differs from one quantile to another, reflecting the heterogeneity of Z-scores, AROA and AROE of the banks of our sample. Our results suggest that the impact of capital, liquidity and leverage ratios varies depending on the level of banking stability and adjusted risk.
INSERT TABLE [11] HERE
4.5 Three-pronged regulation: Islamic banks versus conventional banks
Table 12 investigates the interaction between banking regulation and banking sector type. We use the following equation to develop our model:
18
Q_`"'a&pLdREG���g = α + φ × BR����� + θ × BC����� + ∅ × CC���� + α∗ × Interaction ,100 +� + olj'L#-' o='
o=1 + � + �&%?L�=L�=1 + ε
The variables of interest are capital, liquidity and leverage ratios (BR�����0. We interact these
variables with Islamic bank dummies to empirically capture the specifications of each system.
First, we examine the impact of the Basel requirements on stability and on Islamic banks stability relationships. We consider three main variables: the capital adequacy ratio, the maturity match ratio and the total liabilities to assets ratio.
The quantile regression results are provided in table 12 for Islamic and conventional banks. Similar to the results obtained in specifications (1) and (2) of table 11, we find that conventional banks capital adequacy ratio positively affects the lower and the median tail of stability and adjusted return on assets for conventional banks but only the lower tail for the adjusted return on equity. Therefore, commercial banks with higher total capital ratio have higher Z-score (table 12.A), higher adjusted return on assets (Table 12.B) and higher adjusted return on equity (table 12.C). The results significantly vary from a quantile to another but they remain positive. We conclude that conventional commercial banks are in line with the capital adequacy standard where the level of a bank’s capital must be related to the bank specific risk profile, suggesting that conventional banks capital risk relation supports the financial regulation theory. Thus, the level of a bank’s capital must be related to the bank specific risk profile. Consequently, the quality of assets and off-balance sheet risk exposure should be integrated in the bank’s (Islamic and conventional) capital requirements. Hence, capital strengthens the stability of the banking system (Sheldon, 1996a, 1996b; Barrios and Blanko, 2003; Episcopos, 2008, Vasquez and Federico, 2012).
However, the coefficient estimates (α∗0 of the interaction between total capital ratio and the Islamic bank dummy show different results. We find that Islamic banks with higher total capital ratio have no impact on the Z-score in specifications (1), (2) and (3) of table 9.A, negative and significant impact on the adjusted return on assets in specifications (4), (5) and (6) of table 9.B and negative and significant impact on the adjusted return on equity in specification (2) of table 9.C; We conclude that, Islamic banks with higher capital ratio have lower adjusted return on assets and adjusted return on equity in comparison with conventional banks. Here, we should mention that the capital adequacy ratio must be calculated according to Islamic bank specifications. Islamic banks should maintain a different definition for risk weighted assets (Boumediene, 2011; Harzi, 2012, Turk Aris and Sarieddine, 2007) because the profit sharing investment accounts principle reduces the need for safety cushions as compared to conventional deposit accounts (see table 1). We should also mention that Islamic banks do not guarantee depositors money. Therefore, the deposit insurance and managers risk taking incentives relationship (Demirgüç-Kunt and Santomero, 2001) may not exist for
19
Islamic banks. Indeed, Islamic regulatory organism like IFSB18 and AAOIFI19 need to think about the reasons and theories behind implementing a capital risk ratio before adopting the ratio for it is own balance sheet.
Unlike the results obtained in table 11, maturity match is positively and significantly correlated with the stability of Islamic banks at the 1% level in specifications (4) and (6) of table 12.A. The coefficient estimates is also positive and significant for conventional banks in specification (6) at 1% level for the conventional banks upper quantile AROA of table 12.B; that confirm that conventional banks with higher maturity match have higher AROA at the upper quantile. Moreover, the coefficient estimates of the interaction between Islamic banks dummy and the total capital ratio is positive and significant at 10% and 1% level in specifications 4 and 6 respectively of table 12.C for adjusted return on equity but we find a negative impact of maturity match on the AROE of conventional banks and we also find no evidence for a significant impact of total capital ratio on Islamic banks adjusted return on assets. Therefore, managing the liquidity risk in Islamic banks is an important factor in maintaining and improving the stability of Shariah-Compliant institutions. Our results are consistent with those obtained in table 5 where Islamic banks have more liquidity than their conventional counterparts. In fact, higher maturity match of Islamic banks is related to their managerial choices (Pellegrina, 2008; Olson and Zoubi, 2008, Pappas et al., 2010). If we refer to table 2 we can clearly see why Islamic banks need to adapt NSFR and LCR (STFR) to their business model. Pappas, Izzeldin and Fuertes (2012) find that higher liquidity ratio reduces failure risk. They explain that large liquidity buffers are vital for Islamic financial institutions for two reasons. First, Islamic banks suffer from limited access to liquidity due to Shariah constraints. Second, no hedging instruments are allowed to mitigate liquidity risk (there is a lack of Shariah-Compliant short term instruments). Thus, the Islamic Financial Services Board (IFSB) must implement a framework for Islamic bank liquidity risk management similar to that of the Basel III liquidity requirements. IFSB and other Islamic financial regulatory organism should be prudent when implementing this liquidity framework. It is important to consider the specifications on Islamic bank balance sheet structure and Islamic Shariah compliant principle (Profit loss sharing paradigm, weights assigned to assets and liabilities). As for conventional banks, the results of table 12 support our descriptive statistics where we find that Islamic banks are more liquid that conventional banks and that reflects the positive impact of this ratio on the stability and adjusted return on equity of Islamic banks in comparison with their conventional peers.
The purpose of studying leverage ratio is to investigate whether the stability of Islamic banks is impacted in the same way as their conventional counterparts. Leverage liabilities to assets ratio is used to measure the degree to which a firm uses debts in its capital structure (Toumi et al., 2011). Our findings support the fact that a higher leverage ratio of conventional banks is
18
The Islamic Financial Services Board (IFSB) is an organism that was created in 2002 with the purpose of harmonizing regulatory and supervisory frameworks to ensure the soundness and stability of the Islamic financial industry. IFSB is similar to the Basel Committee for Banking and Supervision of conventional banks. 19
The Accounting and Auditing Organization for Islamic Financial Institutions (AAOIFI) is an organism that was created 1990 in order to prepares accounting, auditing, governance, ethics and Shariah standards for Islamic financial institutions

20
associated with lower stability in specifications (7) and (8) of table 12.A at the 1% level. The ratio is insignificant for Islamic banks Z-score. We are not surprised by the differences between Islamic and conventional banks regarding the leverage ratio. In fact, conventional banks have experienced massive losses on mortgages and mortgage backed securities (Pappas et al., 2012). Their leverage ratio is built on debt-backed funding rather than assets-backed investments. At the same time, conventional bank deposits are insured, motivating morally hazardous behavior. Consequently, conventional banks have high leverage ratios that destabilize the financial system Z-score leading to financial bubbles and inducing higher risk for the real economy. The negative sign of the liabilities to assets ratio for conventional banks reflects the results of our descriptive statistics where we find that conventional banks are more leveraged than Islamic ones. Toumi, Viviani and BelKacem (2011) explained that the lower value of leverage ratio of Islamic banks in comparison with conventional banks reflect the fact that Islamic financial institutions have a greater capacity to sustain shocks and assets losses.
The results also show that highly leverage banks have higher adjusted profits for conventional and Islamic banks of table 12.B and for conventional banks in table 12.C. Our results are similar to those obtained by Srairi (2005), and Sanusi and Ismail (2005) who find that more profitable Islamic banks rely more debt than less profitable ones. We also note that on reason behind the positive impact of the leverage ratio on the AROA of Islamic is that the most common source of funding for these institutions are the restricted and unrestricted investment accounts. Therefore, depositors are treated like investors. In this case, deposit insurance does not exist. Thus, depositors are always highly motivated to monitor bank activities (Oslon and Zoubi, 2008) to avoid losses. Besides, Islamic banks promote asset-backed investments making them close to the real economy, more prudent, and they do not contribute to bubbles in the same way as investments made by conventional banks (Hassan and Dridi, 2010). We conclude that this positive relationship between leverage and bank adjusted return on assets and the insignificant impact on the Z-score is associated with the business model of Islamic banks. Our results are consistent with the findings of Pappas, Izzeldin and Fuertes (2012).
INSERT TABLE [12] HERE
4.6 Comparing Islamic and conventional banks between countries
To check the robustness of our regression model, we consider a number of modifications in our empirical study. We consider a smaller sample where Islamic banks work alongside with conventional banks. Therefore, our sample is reduced to 23 countries mainly from the Middle East and North Africa region and South East Asia.
Thus, we use the following equation where we interact the Islamic banks dummy (IBDV) with country dummies (CV) to explore whether the differences between Islamic and conventional banks vary over our smaller sample.
Q_Bank���dREG���g = α + θ × BC����� + μ + �`��.�2���2� . o�b + ε ,110

21
As we interact the Islamic banks dummy with the dummies of the 23 countries, we drop the Islamic bank dummy. We also note that for some results, the interaction term with the Islamic dummy is not reported in table 13, as observations might be missing for this specific dependent variable.
As expected, the results reveal a large cross country variation in differences between Islamic financial institutions and commercial conventional banks. Beck et al. (2013) explain that one reason the Islamic bank dummy becomes insignificant in regression is the fact that it enters with opposite signs across different countries. Table 10 shows these opposite signs.
Take the example of the Z-Score; table 10 results for specification (1) suggest that Islamic banks in Iraq, Pakistan, Saudi Arabia and Tunisia have higher Z-scores than conventional banks in these countries, while they have a lower Z-score in Malaysia. However, specification (3) results are not similar. We report lower Islamic bank Z-scores in Bahrain, Iraq, Malaysia and Pakistan and a higher Z-score for Islamic banks in Saudi Arabia and Turkey. The negative and significant coefficient on the Islamic bank dummy in the Z-score ratio regression is driven by Bahrain and Syria. In addition, the insignificant sign of Islamic dummy reports in table 9 specifications (4), (5) and (6) are partially driven by the opposite sign of the interaction of the Islamic banks dummy with country dummies of our sample.
INSERT TABLE [13] HERE
There is also a large variation in the differences between Islamic and conventional banks in adjusted return on assets across our country sample. We find that Islamic banks have higher AROA than do conventional banks in Lebanon, Pakistan and Saudi Arabia and lower AROA in Bahrain, Kuwait, Malaysia and Singapore.
The differences in AROE between Islamic and conventional banks also vary across countries. We find that Islamic banks have lower adjusted return on equity than do conventional banks in specifications (7), (8) and (9).
In summary, the differences between Islamic and conventional banks vary significantly across countries; whereas the insignificant sign of Islamic banks dummy is related to the opposite signs of the interaction across countries. We also find that differences between our two groups differ between quantiles (it differs between more and less stable banking system Z-scores).
4.7 Comparing Islamic and conventional banks performance
In this final section we study the impact capital, liquidity and leverage on the performance of Islamic banks in comparison with conventional banks. We gauge their relative return on assets (Beck et al. 2013; Pappas et al. 2012; Zoubi et al. 2009; Toumi et al. 2011; Cihak and Hesse, 2010), return on equity (Pappas et al. 2012; Toumi et al., 2011; Zoubi et al. 2009), net interest margin (Toumi et al., 2011) and cost to income ratio (Beck et al., 2013) over the period 1996 and 2011, with data from Bankscope. To be more robust, we work only with listed banks in countries with dual banking system. Therefore, our sample is reduced to 203 banks in 15 countries. Here, we control for bank capital by including the equity to net loans ratio and the equity to deposit ratio (Capital model). The second step was to assess to

22
performance of Islamic banks by controlling for bank liquidity (liquidity model). We follow the work of Beck et al. (2013) and Pappas et al (2012) by using the net loans to assets and liquid assets to deposits to study the impact of the liquidity on the performance of Islamic and conventional banks. In the third step, we control Islamic bank dummy by adding equity to total assets and liabilities to total equity in model 3.
The results of table 14 show us that there are significant differences between Islamic and conventional banks. We find that Islamic banks have higher cost-income ratios than conventional banks (significant at 1% in specification 10, 11 and 12) for our 3 models. On the other hand, we find that Islamic banks have lower return on assets and return on equity (significant at 1% level in specifications 1, 2, 3 and 4) in our three models. The results also show that the net interest margin is higher for Islamic banks than for conventional ones when we control for liquidity and for leverage.
INSERT TABLE [14] HERE
For the capital model, we find that banks with higher equity to net loans have lower return on equity in all quantiles of regression (specifications 4 to 6 at 1% level) and banks with higher equity to net loans have negative influence on banks with lower interest margin (Lower quantile) and positive influence on banks with higher net interest margin (higher quantile); banks with higher equity to deposits have higher return on assets (specifications 1 to 3), higher net interest margin (specifications 7 and 8 at 1% level) and lower cost to income (specifications 10 and 12). We also find no significant relationship between the equity to deposit ratio and return on equity.
The results for liquidity model show that higher maturity match ameliorate the return on assets and the net interest margin of our banks (specifications 2, 3, 7, 8 and 9 at 1% level) but not for cost to income ratio where we find that liquid assets to deposits is negatively correlated to the efficiency lower quantile of the banking system (specification 10 at 5% level). Furthermore, banks with higher net loans to assets have higher return on assets, higher return on equity and higher net interest (specifications 1 to 9 at 1% and 5% level); however, loans to assets ratio is negatively correlated with the efficiency ratio meaning that higher liquidity reduces cost-efficiency of the banking system.
Our third model investigates the impact of leverage ratios on the banking performance. On the one hand, we find that banks with higher equity to assets ratio have higher return on assets (specifications 1 to 3 at 1% level), higher net interest margin (specifications 7 to 9 at 1% level), and lower return on assets.
In table 15 we introduce an interaction term between our regulatory variables and Islamic bank dummy variable. Therefore, the results allow us to compare between countries and years Islamic and conventional banks. Similar to the results of table 14, we find that Islamic banks have lower return on assets, lower return on equity and higher cost to income. However, we find that Islamic banks have also lower net interest income (specification 7 at 1% level for liquidity model).
23
As for the results of the interaction between Islamic banks dummy and capital ratios, we find that Islamic banks with higher equity to net loans have lower return on assets (specification 1 at 1% level), lower return on equity (specifications 5 and 6 at 1% and 10% level respectively), lower net interest margin (specification 7 at 1% level) and higher cost to income (specification 12 at 10% level) in comparison with conventional banks. We also find that Islamic banks with higher equity to deposits have higher return on assets (specifications 1 and 2 at 1%level), higher net interest margin (specifications 7 and 8 at 1% level) and lower cost to income (specifications 10 and 12 at 5% level) in comparison with conventional commercial banks.
INSERT TABLE [15] HERE
For the liquidity model, we find that Islamic banks with higher liquid assets to deposits have higher return on assets (specification 3 at 5% level) and higher net interest margin (specifications 7 and 8 at 1% level) in comparison with conventional banks. In addition, Islamic banks with higher loans to assets have lower return on assets (specification 3 at 1% level), higher net interest margin (specification 7 at 1% level) and lower cost to income (specification 11 at 1% level) in comparison with commercial banks. We also find that the impact of liquidity ratios differ from a quantile to another. For instance, specification 7 shows us that Islamic banks with higher maturity match ratio have higher return on assets at the upper quantile of return on assets in comparison with conventional banks, whereas, the effect of maturity match is insignificant for Islamic banks lower quantile of return on assets. (i.e. Islamic banks maturity match have a positive impact on Islamic banks with higher return on assets, whereas the effect is insignificant for Islamic banks with low return on assets)
Model 3 compares the impact of leverage ratio on Islamic and conventional banks. The results of table15 show us that Islamic banks with higher equity to assets ratio have higher return on assets (specifications 1, 2 and 3 at 1% level), higher net interest margin (specifications 8 and 9 at 1% level) and lower return on equity (specifications 4, 5 and 6 at 1% level) in comparison with commercial banks. Moreover, Islamic banks with higher liabilities to total assets have lower return on assets (specifications 1 and 2 at 1% level), lower net interest margin (specifications 8 and 9 at 10% and 5% level respectively) and lower cost to income (specification 11 at 1% level) in comparison with conventional banks.
5. Conclusion
In this paper about the relationship between Basel guidelines and banking stability, we use the Z-score, the adjusted return on assets and the adjusted return on equity as indicators of individual bank stability to proxy the impact of Basel III framework on the stability of Islamic and conventional banks. Using a panel of 11487 conventional commercial banks and 146 Islamic banks across 76 countries during the 2005 to 2011 period. We analyze and compare the impact of capital, liquidity and leverage requirements on the stability of the banking sector by emphasizing the differences and the similarities between Islamic and conventional banks. Our results suggest that:
24
First, capital ratio affects positively the Z-score of conventional but we find no evidence for a significant relationship between capital ratio and the stability of Islamic banks. As for sensitivity checks, the two others risk adjusted measures show us that Islamic banks with higher capital ratio have lower adjusted return on assets and lower adjusted return on equity in comparison with conventional banks. These results indicate that capital risk relationship is not the same between Islamic and conventional banks.
Second, Liquidity ratio is positively correlated with the Z-score and the adjusted return on equity of Islamic banks in comparison with conventional banks but not for the adjusted return on assets. Therefore, Islamic banks with higher maturity match have higher Z-score and higher adjusted return on equity in comparison with conventional banks.
Third, we find a positive and significant relationship between liabilities to assets ratio and the adjusted return on assets of Islamic and conventional banks but not for Z-score. The results also indicate that conventional banks with higher leverage have lower Z-score and higher adjusted return on equity.
Our results show that that there are important variations across countries and levels of different quantiles.
We also consider a set of proxies to investigate the impact of capital, liquidity and leverage on the return on assets, return on equity, net interest margin and cost to income ratios of Islamic and conventional banks. We find that banks with higher equity to deposits have higher return on assets and lower cost to income; banks with higher equity to net loans have lower return on assets, lower return on equity and higher cost to income. As for liquidity we find that Islamic banks with higher liquid assets to deposits have higher return on assets and higher net interest margin in comparison with conventional banks; Islamic banks with higher loans to assets have lower return on assets, higher net interest margin and lower cost to income in comparison with commercial banks. For leverage, we find that Islamic banks with higher equity to assets ratio have higher return on assets, higher net interest margin and lower return on equity in comparison with commercial banks; Islamic banks with higher liabilities to total assets have lower return on assets, lower net interest margin and lower cost to income in comparison with conventional banks
We find a number of limitations in our study. Firstly, we did not include a powerful variable to measure the impact of the financial crisis. Secondly, we did not split our sample between large and small banks to study the relationship between bank size, regulation and financial stability. Thirdly, the time period is very short. Finally, we find a lot of complexity when analyzing and considering our main variables especially that Bankscope data base do not take into account the particularities of Islamic banks.
As for future work, the research must be intensified when it comes to Islamic banks regulatory framework. Studies should be deepening when adapting the Basel III guidelines on Islamic banks. Islamic regulatory organizations are invited to use Islamic financial principles and concepts to create their own structure of ratios rather than imitating Basel framework.

25
Tables
20 See Vasquez and Federico, (2012), “Bank funding Structures and Risk: Evidence from the Global Financial Crisis” for more details about the calculation of NSFR. 20For more details see: Harzi (2012), IFSB (2011), Turk-Ariss and Sarieddine (2007), and IFSB (2005a)
Table 1 Basel III framework and CAR between Islamic and Conventional Banks Conventional Banks Islamic Banks
¡¢£¤ = ¥¦§¨© + ¥¦§¨£¢ª¡ ≥ ¬%
CAR�¯ = Tier1RWA − RWA²³´µ¶ − ,1 − α0 × RWA·³´µ¶¸−α × RWA·³´µ¶,PER and IRR0
- Higher and stricter conditions for Tier1 and Tier 2 requirements
- RWA is to be increased for some asset classes
- RPSIA and UPSIA represent restricted and unrestricted investments account holder
- PER and IRR are Profit Equalization Reserve and Investment Risk Reserve respectively.
- ~ Represents the proportion of assets funded by UPSIAH. Its calculation depends on the banking stability in each country
Table 2
Basel III Liquidity requirements in Islamic and Conventional banks
Conventional Banks Islamic banks
»¼½¢©¾ = .∑ ª¦À¦¦∑ ªÁ¡ÁÁ ≥ ©
¼¥½¢©¾ = À¦ÂæĦŦ§Æ < © ȧ¨ÅÉÅÂÄ À¦ÂæĦŦ§Æ
- NSFR20 is the ratio of the sum of Weighted (Wi) Liabilities (Li)
divided by the sum of Weighted (Wj) Assets (Aj)
- Weights are between 0 and 1. On the asset side larger weights
imply a less liquid position. On the liability side, larger weights
imply more stable funding sources
- A higher value of NSFR signifies that a bank is more stable
- A higher value of STFR imply a higher reliance on short-term
funding and a greater financial fragility (Vasquez and Federico,
2012)
ÊËÌe = .∑ Í.Î..∑ Íbsbb ≥ 1
Computing NSFR for Islamic banks is very different due to their
particularities:
- On the Liability side, Islamic banks use unguaranteed
investment accounts to finance their activities. Depositors may
also withdrawal their deposits in a very short period
(withdrawal risk). Also, Islamic banks possess specific
reserves (PER and IRR)
- On the asset side, Islamic banks use inventory, asset-backed
transactions, profit sharing transactions and fee based services.
Therefore, assigning weights must be different from those
calculated for conventional banks
- Basel III ignores that Islamic banks suffer from a lack of
Shariah-Compliant short term instruments. Hence, it is quite
difficult for Islamic banks to cover short term funding gaps
within a 30 day period in case of a liquidity shortage

26
Table 3 Leverage ratio in Islamic and conventional banks according to the Basel III framework Conventional Banks Islamic Banks
À¢ = ÂϦÅÂÄ Ð§ÂÆѨ§ÒÓÏÉÆѨ§ ЧÂÆѨ§ ≥ Ô% Îe = o"Õ&L"k >?"Öj#?48ÕlÖj#? >?"Öj#? ≥ 3%
- Capital measure will be computed by using regulatory Common Equity ratio, the Tier 1 Capital ratio or the Total Capital ratio
- Exposure Measure represents the on- and off-balance sheet exposures
- PSIAs must not be included in the capital measure because it does not meet Basel III requirements for capital measure
- PSIAs are also excluded from the exposure measure. Yet, assets financed by these accounts must be considered when it is the case of displaced commercial risk (Boumediene, 2012)
Table 4
Pearson and Spearman correlation matrix
Table 4.A: Dependent variables
ZS AROA AROE
ZS
0.541*** <.0001
0.569*** <.0001
AROA
0.529*** <.0001
0.552*** <.0001
AROE
0.512*** <.0001
0.631*** <.0001
*Represents significance at 10% level
** Represents significance at 10% level
*** Represents significance at 10% level
Table 4
Pearson and Spearman correlation matrix
Table 4 .B: Independent variables
TCR E_A MA TLTAP
TCR
0.613 <.0001
0.440 <.0001
-0.571 <.0001
E_A
0.677 <.0001
0.239 <.0001
-0.682 <.0001
MA
0.451 <.0001
0.348 <.0001
-0.249 <.0001
TLTAP
-0.611 <.0001
-0.683 <.0001
-0.310 <.0001
*Represents significance at 10% level
** Represents significance at 10% level
*** Represents significance at 10% level
Table 4
Pearson and Spearman correlation matrix
Table 4.C: bank specific/country control variables
Variables LnTA FATAP CRP TDTAP ADR CONP GDPG CPI LnTCO LnPOP LIBOR CRISIS
LnTA
-0.218*** <.0001
0.130*** <.0001
0.073*** <.0001
-0.035*** <.0001
-0.041*** <.0001
-0.119*** <.0001
-0.266*** <.0001
-0.041*** <.0001
0.100*** <.0001
-0.065*** <.0001
-0.061*** <.0001
FATAP
-0.267*** <.0001
0.083*** <.0001
0.156*** <.0001
-0.160*** <.0001
-0.093*** <.0001
0.144*** <.0001
0.240*** <.0001
0.362*** <.0001
0.038*** <.0001
0.016** 0.0484
0.133*** <.0001
CRP
0.074*** <.0001
0.064*** <.0001
0.002 0.7784
-0.215*** <.0001
0.002 0.7908
-0.121*** <.0001
-0.029*** 0.0006
0.044*** <.0001
0.020*** 0.0139
-0.179*** <.0001
-0.068*** <.0001
TDTAP
0.090*** <.0001
0.029*** 0.0006
-0.024*** 0.0041
-0.040*** <.0001
-0.236*** <.0001
-0.005 0.5049
-0.108*** <.0001
0.256*** <.0001
0.252*** <.0001
0.008 0.2837
-0.060*** <.0001
ADR
-0.078*** <.0001
-0.142*** <.0001
-0.181*** <.0001
-0.128*** <.0001
0.084*** <.0001
0.056*** <.0001
-0.027*** 0.0009
-0.050*** <.0001
-0.089*** <.0001
0.013 0.1043
-0.093*** <.0001
CONP
-0.042*** <.0001
-0.045*** <.0001
-0.018** 0.0326
-0.219*** <.0001
0.093*** <.0001
-0.243*** <.0001
-0.318*** <.0001
-0.049*** <.0001
0.067*** <.0001
-0.433*** <.0001
-0.295*** <.0001
GDPG
-0.087*** <.0001
0.077*** <.0001
-0.164*** <.0001
0.015* 0.0579
0.031*** 0.0001
0.074*** <.0001
0.346*** <.0001
0.310*** <.0001
-0.351*** <.0001
0.199*** <.0001
0.056*** <.0001
CPI
-0.195*** <.0001
0.272*** <.0001
-0.002 0.8154
-0.052*** <.0001
-0.044*** <.0001
0.098*** <.0001
0.412*** <.0001
0.257*** <.0001
-0.361*** <.0001
0.335*** <.0001
0.112*** <.0001
LnTCO
-0.076*** <.0001
0.234*** <.0001
0.0018 0.8706
0.178*** <.0001
-0.040*** <.0001
0.160*** <.0001
0.333*** <.0001
0.412*** <.0001
-0.057*** <.0001
0.001 0.6517
-0.016*** <.0001
LnPOP
0.086*** <.0001
0.006 0.4246
-0.001*** 0.9531
0.197*** <.0001
-0.109*** <.0001
-0.499*** <.0001
-0.179*** <.0001
-0.145*** <.0001
-0.189*** <.0001
-0.450*** <.0001
-0.132*** <.0001
LIBOR
-0.063*** <.0001
0.005 0.5040
-0.193*** <.0001
-0.004 0.5884
0.013*** 0.1103
-0.074*** <.0001
0.337*** <.0001
0.266*** <.0001
0.001*** 0.6648
-0.011*** 0.0031
0.486*** <.0001
CRISIS
-0.059*** <.0001
0.215*** <.0001
-0.028*** 0.0009
-0.056*** <.0001
-0.081*** <.0001
-0.101*** <.0001
0.105*** <.0001
0.086*** <.0001
-0.083*** <.0001
0.119*** <.0001
0.410*** <.0001
*Represents significance at 10% level
** Represents significance at 10% level
*** Represents significance at 10% level

27
Table 5
Descriptive statistics
Variables # of
obs.
Q1 Mean Q3 Standard
deviation
Minimum Maximum Islamic banks
Conventional banks
Dependent variables AROA AROE ZS
9814 9520 9558
0.084 0.485 11.730
1.900 2.434 28.408
3.207 3.973 40.496
2.069 2.266 21.009
-1.935 -1.237 3.002
7.832 7.938 95.227
1.645 1.0299 25.191
1.913 2.530 28.583
Independent variables
TCR (%) MA (%) TLTA (%) TETA (%)
9961 14468 15631 15042
11.280 11.373 84.575 6.350
16.357 34.418 86.763 12.621
19 51.841 93.576 15.406
6.779 27.741 10.454 8.796
8.320 2.320 1.176 3.137
31.920 93.302 96.233 34.830
22.889 44.368 79.798 19.512
15.979 33.918 87.089 12.280
Bank control variables
LnTA FATA (%) CR (%) TDTA (%) ADR (%)
15646 14910 13893 14508 14984
13.109 0.437 3.024 44.008 0.414
14.659 1.403 18.074 60.362 0.799
16.145 1.951 27.225 80.318 1.1158
1.807 1.393 17.595 23.812 0.459
12 0.003 0.0397 9.491 0.219
18.200 7.866 57.617 94.062 1.732
13.897 1.677 21.143 53.751 0.928
14.695 1.390 17.939 60.681 0.793
Country control variables
CON (%) GDPG CPI LnTCO LnPOP LIBOR
40.449 -0.359 1.640 0 19.504 1.1267
45.351 1.786 2.954 0.522 18.973 3.183
43.587 3.076 3.393 0 19.542 5.254
11.123 3.157 3.005 1.669 1.291 1.852
20.064 -14.800 -10.100 -1.314 12.802 0.511
98.438 18.869 53.231 9.832 21.014 5.304
Source: Bankscope and author calculations. The panel in this table provides the lowest Quantile (Q1), the Median, the Mean, the highest Quantile (Q3), the Minimum (Min), the Maximum (Max) and the standard deviation (STD). The variables are: ZS (distance from insolvency); AROA (risk Adjusted Return On Assets); AROE(risk Adjusted Return On Equity); TCR (Total Capital Ratio); TETA(Total Equity to Total Assets); MA (Liquid assets to deposit and short-term funding); TLTA(Total Liability to Total Assets); FATA(fixed assets to total assets); ADR (Assets diversity ratio); CR(credit risk); CON(Concentration ratio); TDTA(total deposit to total assets); GDPG (annual percentage of GDP growth); CPI (Consumer Price Index); LnTCO (logarithm of the Total Exchange Rate); Lnpop (logarithm of the population); LIBOR (London Interbank Offered Rate);

28
Table 6 Table 6.A: Test of means, comparing Islamic and conventional banks Main Dependent Variables
Islamic vs. Conventional Main Independent Variables
Islamic vs. Conventional Z-score AROA AROE TCR MA TLTA t valuea (3.83)*** (3.17)*** (29.33)*** (-21.57)*** (-9.70)*** (16.92)*** Pr (T ˂ t) 0.0001 0.0016 0.0000 0.0000 0.0000 0.0000 Table 6.B: Test of means, comparing Islamic banks
Iranian banks vs. Islamic banks Z-score AROA AROE TCR MA TLTA
t valuea (-1.10) (0.75) (-1.81)* (2.46)** (120.23)** (-0.79) Pr (T ˂ t) 0.2747 0.4547 0.0748 0.0142 0.0123 0.4302
MENA Islamic banks vs. SEA Islamic banks Z-score AROA AROE TCR MA TLTA t valuea (-3.43)*** (-0.29) (0.26) (-0.49) (-0.94) (0.56) Pr (T ˂ t) 0.0007 0.7715 0.7916 0.6235 0.3455 0.5751
GCC Islamic banks vs. SEA Islamic banks t valuea
Pr (T ˂ t)
Z-score AROA AROE TCR MA TLTA (1.95)* 0.0537
(-0.70) 0.4845
(-2.61)** 0.0102
(4.11)*** 0.0001
(5.08)*** 0.0000
(-5.95)*** 0.0000
aTwo sided p-value. The test allows for the variance to be different. MENA represents the Middle East and North African countries ; SEA represents Southeast Asian countries Significance levels denoted by ***, **, and * correspond to 1, 5, and 10%, respectively.
Table 7 Analysis of variance for the total sample of conventional banks and Islamic banks before, during and after the 2008 financial crisis Main Dependent Variables Main Independent Variables
Entire sample Anova Pr (F ˂ f)
Z-score AROA AROE TCR MA TLTA (1.08) (49.83)*** (65.01)*** (30.52)*** (6.52)*** (1.29) 0.3409 0.0000 0.0000 0.0000 0.0015 0.2740
Anova Pr (F ˂ f)
Conventional bank sample Z-score AROA AROE TCR MA TLTA
(11.15)* (47.41)*** (62.25)*** (35.66)*** (5.32)*** (2.15) 0.0766 0.0000 0.0000 0.0000 0.0049 0.1162
Anova Pr (F ˂ f)
Islamic bank sample Z-score AROA AROE TCR MA TLTA (0.09) (2.45)* (1.22) (1.94) (3.52)** (4.21)** 0.9098 0.0870 0.2962 0.1447 0.0301 0.0152
Significance levels denoted by ***, **, and * correspond to 1, 5, and 10%, respectively
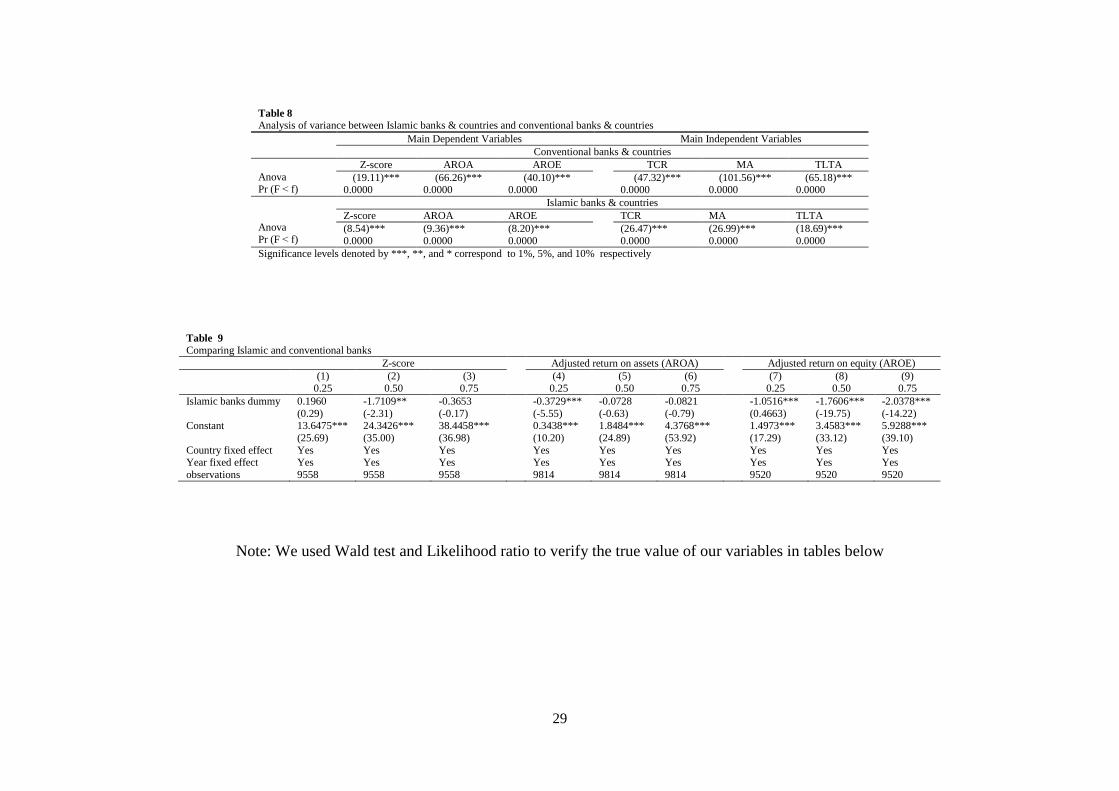
29
Note: We used Wald test and Likelihood ratio to verify the true value of our variables in tables below
Table 8 Analysis of variance between Islamic banks & countries and conventional banks & countries Main Dependent Variables Main Independent Variables
Conventional banks & countries Anova Pr (F ˂ f)
Z-score AROA AROE TCR MA TLTA (19.11)*** (66.26)*** (40.10)*** (47.32)*** (101.56)*** (65.18)***
0.0000 0.0000 0.0000 0.0000 0.0000 0.0000 Anova Pr (F ˂ f)
Islamic banks & countries Z-score AROA AROE TCR MA TLTA (8.54)*** (9.36)*** (8.20)*** (26.47)*** (26.99)*** (18.69)*** 0.0000 0.0000 0.0000 0.0000 0.0000 0.0000
Significance levels denoted by ***, **, and * correspond to 1%, 5%, and 10% respectively
Table 9 Comparing Islamic and conventional banks Z-score Adjusted return on assets (AROA) Adjusted return on equity (AROE) (1) (2) (3) (4) (5) (6) (7) (8) (9) 0.25 0.50 0.75 0.25 0.50 0.75 0.25 0.50 0.75 Islamic banks dummy 0.1960
(0.29) -1.7109** (-2.31)
-0.3653 (-0.17)
-0.3729*** (-5.55)
-0.0728 (-0.63)
-0.0821 (-0.79)
-1.0516*** (0.4663)
-1.7606*** (-19.75)
-2.0378*** (-14.22)
Constant 13.6475*** (25.69)
24.3426*** (35.00)
38.4458*** (36.98)
0.3438*** (10.20)
1.8484*** (24.89)
4.3768*** (53.92)
1.4973*** (17.29)
3.4583*** (33.12)
5.9288*** (39.10)
Country fixed effect Yes Yes Yes Yes Yes Yes Yes Yes Yes Year fixed effect Yes Yes Yes Yes Yes Yes Yes Yes Yes observations 9558 9558 9558 9814 9814 9814 9520 9520 9520
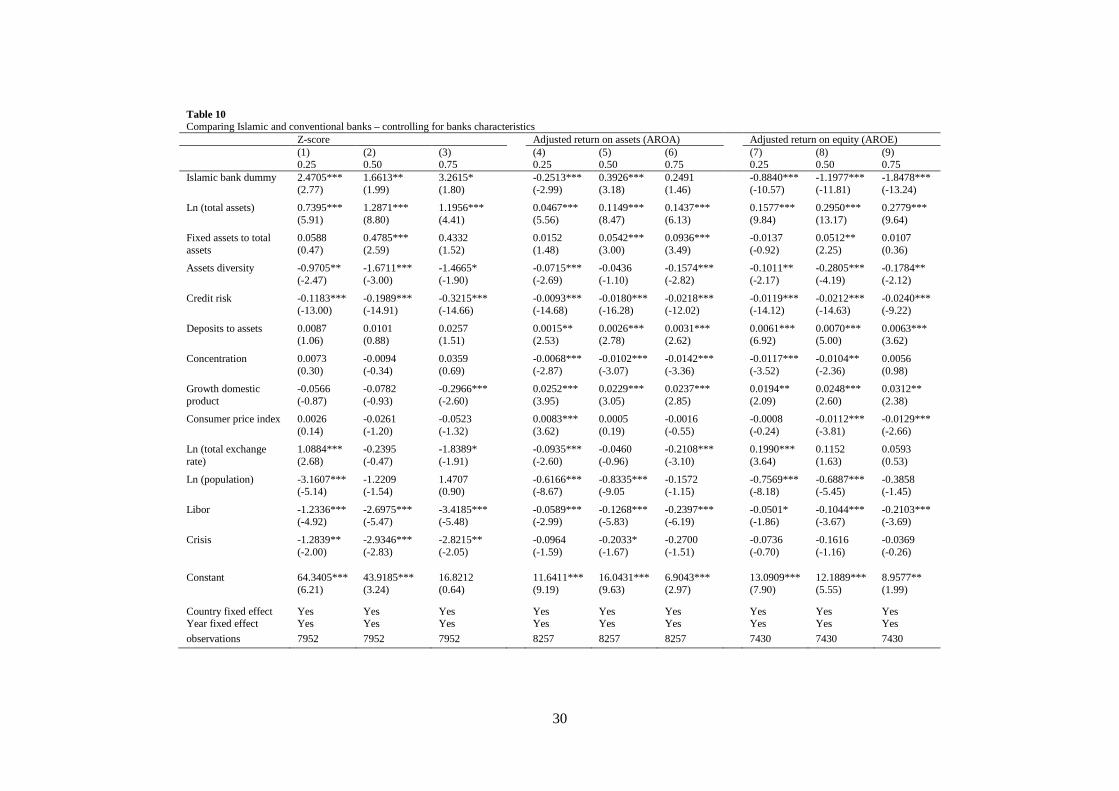
30
Table 10 Comparing Islamic and conventional banks – controlling for banks characteristics Z-score Adjusted return on assets (AROA) Adjusted return on equity (AROE) (1) (2) (3) (4) (5) (6) (7) (8) (9) 0.25 0.50 0.75 0.25 0.50 0.75 0.25 0.50 0.75 Islamic bank dummy 2.4705***
(2.77) 1.6613** (1.99)
3.2615* (1.80)
-0.2513*** (-2.99)
0.3926*** (3.18)
0.2491 (1.46)
-0.8840*** (-10.57)
-1.1977*** (-11.81)
-1.8478*** (-13.24)
Ln (total assets) 0.7395*** (5.91)
1.2871*** (8.80)
1.1956*** (4.41)
0.0467*** (5.56)
0.1149*** (8.47)
0.1437*** (6.13)
0.1577*** (9.84)
0.2950*** (13.17)
0.2779*** (9.64)
Fixed assets to total assets
0.0588 (0.47)
0.4785*** (2.59)
0.4332 (1.52)
0.0152 (1.48)
0.0542*** (3.00)
0.0936*** (3.49)
-0.0137 (-0.92)
0.0512** (2.25)
0.0107 (0.36)
Assets diversity -0.9705** (-2.47)
-1.6711*** (-3.00)
-1.4665* (-1.90)
-0.0715*** (-2.69)
-0.0436 (-1.10)
-0.1574*** (-2.82)
-0.1011** (-2.17)
-0.2805*** (-4.19)
-0.1784** (-2.12)
Credit risk -0.1183*** (-13.00)
-0.1989*** (-14.91)
-0.3215*** (-14.66)
-0.0093*** (-14.68)
-0.0180*** (-16.28)
-0.0218*** (-12.02)
-0.0119*** (-14.12)
-0.0212*** (-14.63)
-0.0240*** (-9.22)
Deposits to assets 0.0087 (1.06)
0.0101 (0.88)
0.0257 (1.51)
0.0015** (2.53)
0.0026*** (2.78)
0.0031*** (2.62)
0.0061*** (6.92)
0.0070*** (5.00)
0.0063*** (3.62)
Concentration 0.0073 (0.30)
-0.0094 (-0.34)
0.0359 (0.69)
-0.0068*** (-2.87)
-0.0102*** (-3.07)
-0.0142*** (-3.36)
-0.0117*** (-3.52)
-0.0104** (-2.36)
0.0056 (0.98)
Growth domestic product
-0.0566 (-0.87)
-0.0782 (-0.93)
-0.2966*** (-2.60)
0.0252*** (3.95)
0.0229*** (3.05)
0.0237*** (2.85)
0.0194** (2.09)
0.0248*** (2.60)
0.0312** (2.38)
Consumer price index 0.0026 (0.14)
-0.0261 (-1.20)
-0.0523 (-1.32)
0.0083*** (3.62)
0.0005 (0.19)
-0.0016 (-0.55)
-0.0008 (-0.24)
-0.0112*** (-3.81)
-0.0129*** (-2.66)
Ln (total exchange rate)
1.0884*** (2.68)
-0.2395 (-0.47)
-1.8389* (-1.91)
-0.0935*** (-2.60)
-0.0460 (-0.96)
-0.2108*** (-3.10)
0.1990*** (3.64)
0.1152 (1.63)
0.0593 (0.53)
Ln (population) -3.1607*** (-5.14)
-1.2209 (-1.54)
1.4707 (0.90)
-0.6166*** (-8.67)
-0.8335*** (-9.05
-0.1572 (-1.15)
-0.7569*** (-8.18)
-0.6887*** (-5.45)
-0.3858 (-1.45)
Libor -1.2336*** (-4.92)
-2.6975*** (-5.47)
-3.4185*** (-5.48)
-0.0589*** (-2.99)
-0.1268*** (-5.83)
-0.2397*** (-6.19)
-0.0501* (-1.86)
-0.1044*** (-3.67)
-0.2103*** (-3.69)
Crisis -1.2839** (-2.00)
-2.9346*** (-2.83)
-2.8215** (-2.05)
-0.0964 (-1.59)
-0.2033* (-1.67)
-0.2700 (-1.51)
-0.0736 (-0.70)
-0.1616 (-1.16)
-0.0369 (-0.26)
Constant 64.3405*** (6.21)
43.9185*** (3.24)
16.8212 (0.64)
11.6411*** (9.19)
16.0431*** (9.63)
6.9043*** (2.97)
13.0909*** (7.90)
12.1889*** (5.55)
8.9577** (1.99)
Country fixed effect Yes Yes Yes Yes Yes Yes Yes Yes Yes Year fixed effect Yes Yes Yes Yes Yes Yes Yes Yes Yes
observations 7952 7952 7952 8257 8257 8257 7430 7430 7430
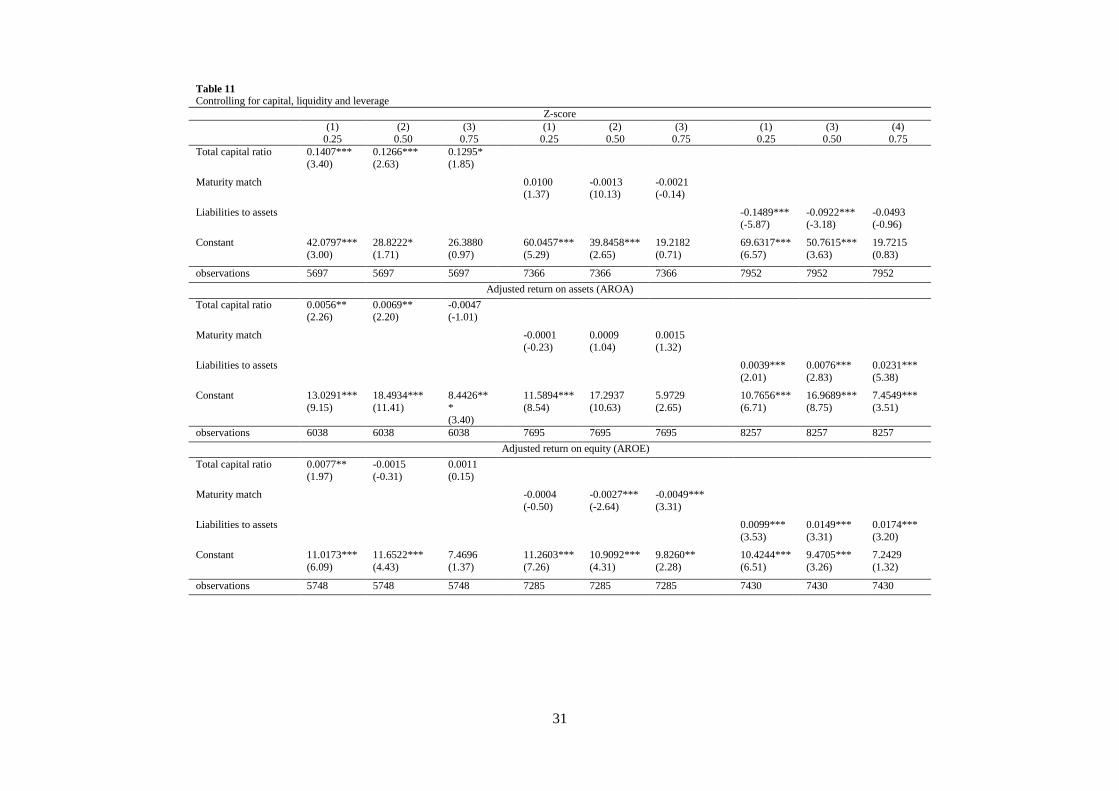
31
Table 11 Controlling for capital, liquidity and leverage
Z-score (1) (2) (3) (1) (2) (3) (1) (3) (4) 0.25 0.50 0.75 0.25 0.50 0.75 0.25 0.50 0.75 Total capital ratio 0.1407***
(3.40) 0.1266*** (2.63)
0.1295* (1.85)
Maturity match 0.0100 (1.37)
-0.0013 (10.13)
-0.0021 (-0.14)
Liabilities to assets -0.1489*** (-5.87)
-0.0922*** (-3.18)
-0.0493 (-0.96)
Constant 42.0797*** (3.00)
28.8222* (1.71)
26.3880 (0.97)
60.0457*** (5.29)
39.8458*** (2.65)
19.2182 (0.71)
69.6317*** (6.57)
50.7615*** (3.63)
19.7215 (0.83)
observations 5697 5697 5697 7366 7366 7366 7952 7952 7952
Adjusted return on assets (AROA)
Total capital ratio 0.0056** (2.26)
0.0069** (2.20)
-0.0047 (-1.01)
Maturity match -0.0001 (-0.23)
0.0009 (1.04)
0.0015 (1.32)
Liabilities to assets 0.0039*** (2.01)
0.0076*** (2.83)
0.0231*** (5.38)
Constant 13.0291*** (9.15)
18.4934*** (11.41)
8.4426*** (3.40)
11.5894*** (8.54)
17.2937 (10.63)
5.9729 (2.65)
10.7656*** (6.71)
16.9689*** (8.75)
7.4549*** (3.51)
observations 6038 6038 6038 7695 7695 7695 8257 8257 8257
Adjusted return on equity (AROE)
Total capital ratio 0.0077** (1.97)
-0.0015 (-0.31)
0.0011 (0.15)
Maturity match -0.0004 (-0.50)
-0.0027*** (-2.64)
-0.0049*** (3.31)
Liabilities to assets 0.0099*** (3.53)
0.0149*** (3.31)
0.0174*** (3.20)
Constant 11.0173*** (6.09)
11.6522*** (4.43)
7.4696 (1.37)
11.2603*** (7.26)
10.9092*** (4.31)
9.8260** (2.28)
10.4244*** (6.51)
9.4705*** (3.26)
7.2429 (1.32)
observations 5748 5748 5748 7285 7285 7285 7430 7430 7430
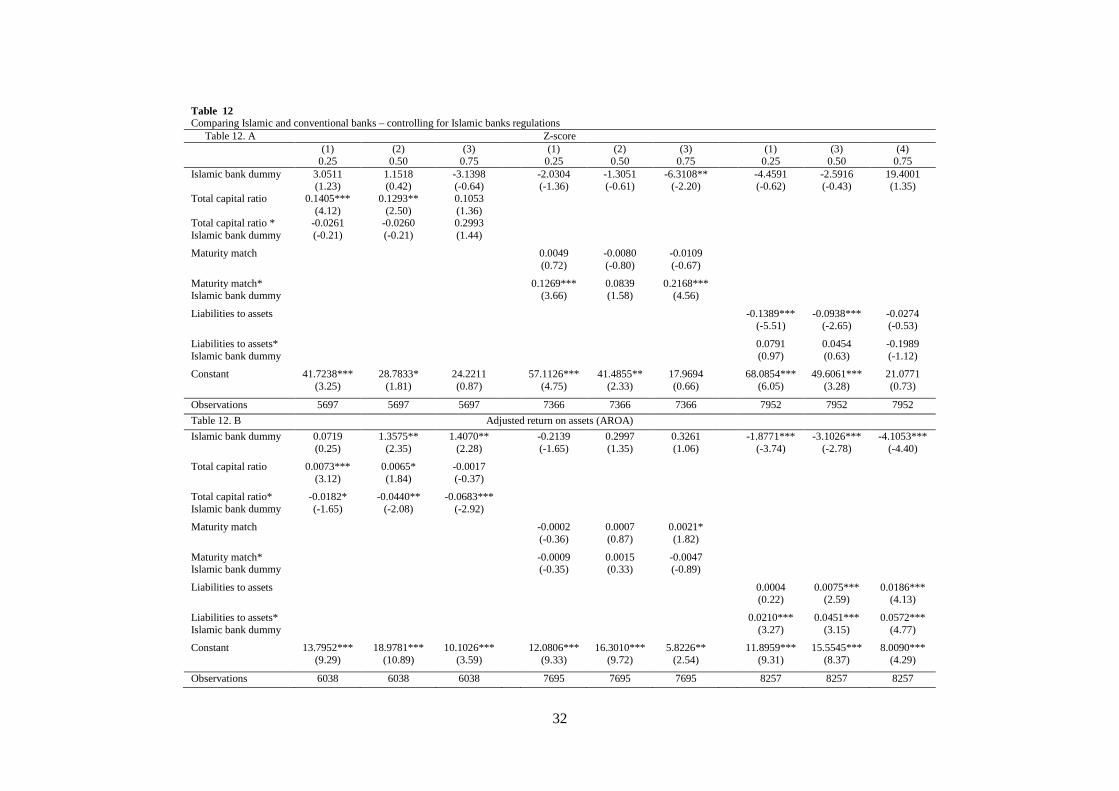
32
Table 12 Comparing Islamic and conventional banks – controlling for Islamic banks regulations Table 12. A Z-score (1) (2) (3) (1) (2) (3) (1) (3) (4) 0.25 0.50 0.75 0.25 0.50 0.75 0.25 0.50 0.75 Islamic bank dummy 3.0511
(1.23) 1.1518 (0.42)
-3.1398 (-0.64)
-2.0304 (-1.36)
-1.3051 (-0.61)
-6.3108** (-2.20)
-4.4591 (-0.62)
-2.5916 (-0.43)
19.4001 (1.35)
Total capital ratio 0.1405*** (4.12)
0.1293** (2.50)
0.1053 (1.36)
Total capital ratio * Islamic bank dummy
-0.0261 (-0.21)
-0.0260 (-0.21)
0.2993 (1.44)
Maturity match 0.0049 (0.72)
-0.0080 (-0.80)
-0.0109 (-0.67)
Maturity match* Islamic bank dummy
0.1269*** (3.66)
0.0839 (1.58)
0.2168*** (4.56)
Liabilities to assets -0.1389*** (-5.51)
-0.0938*** (-2.65)
-0.0274 (-0.53)
Liabilities to assets* Islamic bank dummy
0.0791 (0.97)
0.0454 (0.63)
-0.1989 (-1.12)
Constant 41.7238*** (3.25)
28.7833* (1.81)
24.2211 (0.87)
57.1126*** (4.75)
41.4855** (2.33)
17.9694 (0.66)
68.0854*** (6.05)
49.6061*** (3.28)
21.0771 (0.73)
Observations 5697 5697 5697 7366 7366 7366 7952 7952 7952
Table 12. B Adjusted return on assets (AROA)
Islamic bank dummy 0.0719 (0.25)
1.3575** (2.35)
1.4070** (2.28)
-0.2139 (-1.65)
0.2997 (1.35)
0.3261 (1.06)
-1.8771*** (-3.74)
-3.1026*** (-2.78)
-4.1053*** (-4.40)
Total capital ratio 0.0073*** (3.12)
0.0065* (1.84)
-0.0017 (-0.37)
Total capital ratio* Islamic bank dummy
-0.0182* (-1.65)
-0.0440** (-2.08)
-0.0683*** (-2.92)
Maturity match -0.0002 (-0.36)
0.0007 (0.87)
0.0021* (1.82)
Maturity match* Islamic bank dummy
-0.0009 (-0.35)
0.0015 (0.33)
-0.0047 (-0.89)
Liabilities to assets 0.0004 (0.22)
0.0075*** (2.59)
0.0186*** (4.13)
Liabilities to assets* Islamic bank dummy
0.0210*** (3.27)
0.0451*** (3.15)
0.0572*** (4.77)
Constant 13.7952*** (9.29)
18.9781*** (10.89)
10.1026*** (3.59)
12.0806*** (9.33)
16.3010*** (9.72)
5.8226** (2.54)
11.8959*** (9.31)
15.5545*** (8.37)
8.0090*** (4.29)
Observations 6038 6038 6038 7695 7695 7695 8257 8257 8257
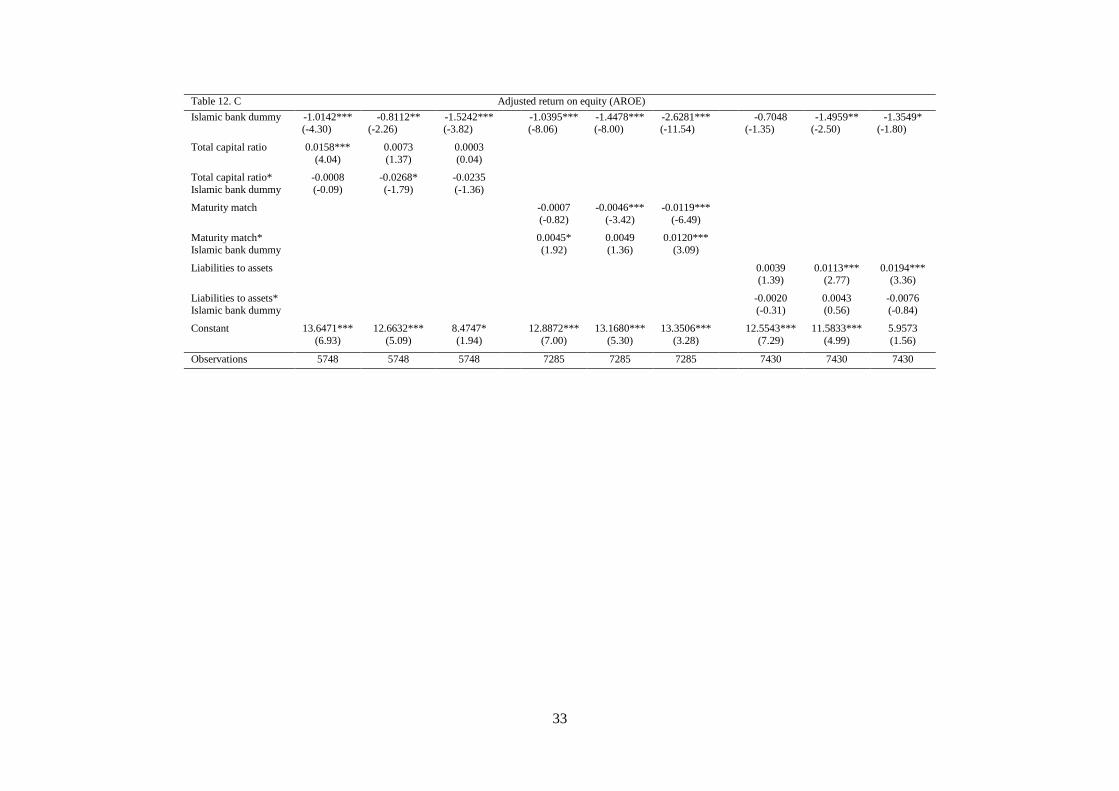
33
Table 12. C Adjusted return on equity (AROE)
Islamic bank dummy -1.0142*** (-4.30)
-0.8112** (-2.26)
-1.5242*** (-3.82)
-1.0395*** (-8.06)
-1.4478*** (-8.00)
-2.6281*** (-11.54)
-0.7048 (-1.35)
-1.4959** (-2.50)
-1.3549* (-1.80)
Total capital ratio 0.0158*** (4.04)
0.0073 (1.37)
0.0003 (0.04)
Total capital ratio* Islamic bank dummy
-0.0008 (-0.09)
-0.0268* (-1.79)
-0.0235 (-1.36)
Maturity match -0.0007 (-0.82)
-0.0046*** (-3.42)
-0.0119*** (-6.49)
Maturity match* Islamic bank dummy
0.0045* (1.92)
0.0049 (1.36)
0.0120*** (3.09)
Liabilities to assets 0.0039 (1.39)
0.0113*** (2.77)
0.0194*** (3.36)
Liabilities to assets* Islamic bank dummy
-0.0020 (-0.31)
0.0043 (0.56)
-0.0076 (-0.84)
Constant 13.6471*** (6.93)
12.6632*** (5.09)
8.4747* (1.94)
12.8872*** (7.00)
13.1680*** (5.30)
13.3506*** (3.28)
12.5543*** (7.29)
11.5833*** (4.99)
5.9573 (1.56)
Observations 5748 5748 5748 7285 7285 7285 7430 7430 7430

34
Table 13 Comparing Islamic and conventional banks, testing for cross-country variation
Z-Score Adjusted Return On Assets Adjusted Return On Equity (1) (2) (3) (4) (5) (6) (7) (8) (9) 0.25 0.50 0.75 0.25 0.50 0.75 0.25 0.50 0.75
Bahrain -2.0722 (-1.44)
-12.6085*** (-7.22)
-18.1751*** (-2.65)
-2.0722* (-1.65)
-12.6085*** (-7.38)
-18.1751*** (-2.74)
-0.7798*** (-5.80)
-1.7956*** (-9.75)
-3.1988*** (-16.51)
Bangladesh 1.8368
(0.12)
-1.4375
(-0.31)
-5.3778
(-0.13)
1.8368
(0.13)
-1.4375
(-0.40)
-5.3778
(-0.10)
0.1914
(0.10)
-0.6167
(-0.69)
-1.2583
(-0.31)
Brunei 8.0347
(0.97)
9.8763
(1.17)
17.7695
(1.01)
8.0347
(1.04)
9.8763
(1.25)
17.7695*
(1.92)
0.4086
(0.11)
-0.6851
(-0.46)
-1.8626
(-0.28)
Egypt 5.7502
(0.22)
-1.2875
(-0.10)
-8.3352
(-0.15)
5.7502
(0.12)
-1.2875
(-0.07)
-8.3352
(-0.13)
0.1564
(0.01)
-0.8379
(-0.12)
-2.2981
(-0.16)
Gambia . . . . . . 0.0897
(0.00)
-1.2683
(-0.02)
-2.8484
(-0.02)
Indonesia . . . . . . . . .
Iraq 10.5862**
(2.15)
3.1107***
(2.83)
-8.0234**
(-2.00)
10.5862**
(2.33)
3.1107
(2.63)
-8.0234**
(-2.31)
-0.5057*
(-1.79)
-1.5684***
(-10.26)
-2.7058***
(-8.11)
Jordan -6.3001
(-0.27)
-14.2647**
(-2.36)
-25.1650
(-0.30)
-6.3001
(-0.32)
-14.2647
(-0.91)
-25.1650
(-0.47)
-0.7168
(-1.23)
-1.0841**
(-2.48)
-2.0752**
(-2.54)
Kuwait -4.6180
(-0.54)
-5.6530*
(-1.73)
-14.8192
(-0.61)
-4.6180
(-0.47)
-5.6530*
(-1.69)
-14.8192
(-0.51)
-0.6223**
(-2.13)
-1.5807***
(-5.84)
-1.7463***
(-3.60)
Lebanon -5.9084
(-0.37)
20.1375***
(3.63)
21.4400
(1.32)
-5.9084
(-0.36)
20.1375***
(3.15)
21.4400
(1.33)
-0.7911**
(-2.16)
-1.8978***
(-11.37)
-2.9798***
(-4.60)
Malaysia -2.7417*
(-1.72)
-5.6221**
(-2.02)
-10.6172***
(-5.64)
-2.7417
(-1.26)
-5.6221*
(-1.94)
-10.6172***
(-4.91)
-0.4003
(-1.41)
-1.1954***
(-7.36)
-1.7113***
(-4.40)
Mauritania . . . . . . . . .
Pakistan 11.9412***
(17.21)
5.6769***
(12.73)
-4.5520**
(-2.25)
11.9412***
(10.81)
5.6769***
(12.59)
-4.5520**
(-2.34)
-0.6987***
(-5.10)
-1.5896***
(-16.51)
-2.4264***
(-9.86)
Qatar -3.3716
(-0.25)
-1.3271
(-0.29)
-8.2920
(-0.38)
-3.3716
(-0.37)
(-1.3271)
-0.27
-8.2920
-0.68
-0.8430
(-0.48)
-1.8897***
(-6.05)
-2.2056
(-0.85)
Russia . . . . . . . . .
KSA 14.8393***
(5.91)
24.6169***
(3.27)
27.8125***
(2.70)
14.8393***
(5.05)
24.6169***
(3.30)
27.8125***
(2.94)
0.2331
(0.74)
-0.8525***
(-5.03)
-1.1766***
(-4.25)
Singapore -4.6138 -10.3681** -19.0560 -4.6138 -10.3681*** -19.0560 -1.0310 -2.3690*** -2.7393
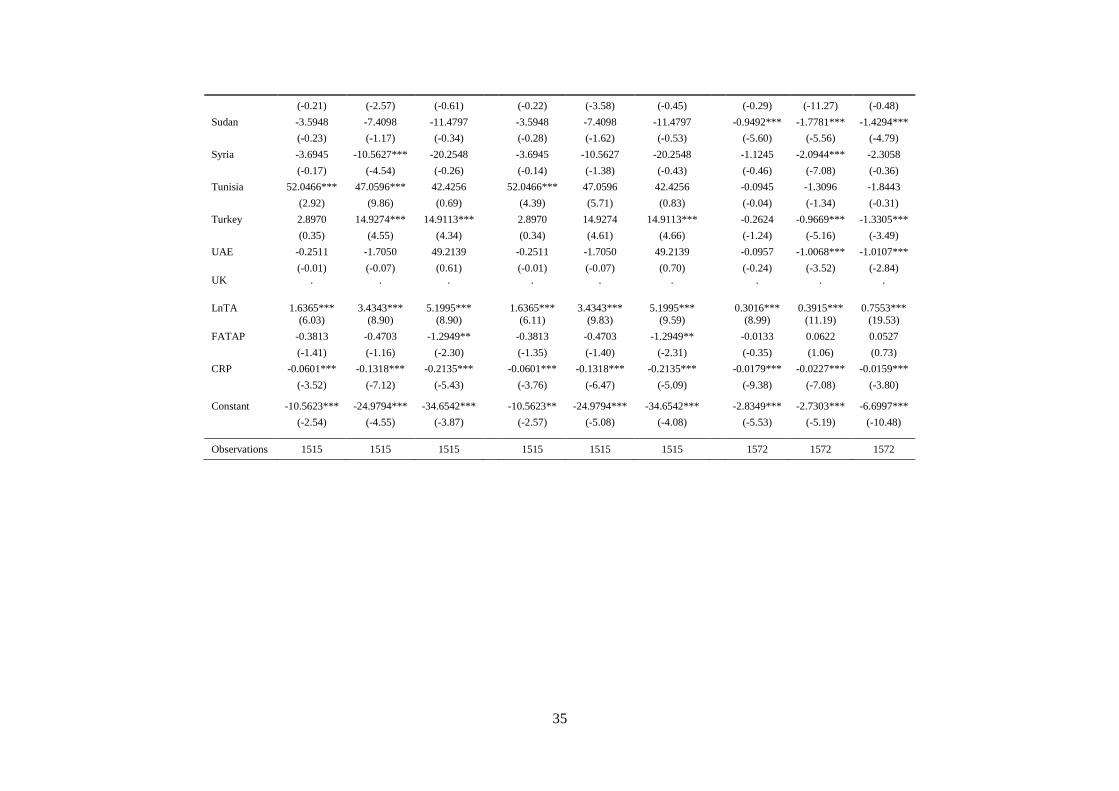
35
(-0.21) (-2.57) (-0.61) (-0.22) (-3.58) (-0.45) (-0.29) (-11.27) (-0.48)
Sudan -3.5948
(-0.23)
-7.4098
(-1.17)
-11.4797
(-0.34)
-3.5948
(-0.28)
-7.4098
(-1.62)
-11.4797
(-0.53)
-0.9492***
(-5.60)
-1.7781***
(-5.56)
-1.4294***
(-4.79)
Syria -3.6945
(-0.17)
-10.5627***
(-4.54)
-20.2548
(-0.26)
-3.6945
(-0.14)
-10.5627
(-1.38)
-20.2548
(-0.43)
-1.1245
(-0.46)
-2.0944***
(-7.08)
-2.3058
(-0.36)
Tunisia 52.0466***
(2.92)
47.0596***
(9.86)
42.4256
(0.69)
52.0466***
(4.39)
47.0596
(5.71)
42.4256
(0.83)
-0.0945
(-0.04)
-1.3096
(-1.34)
-1.8443
(-0.31)
Turkey 2.8970
(0.35)
14.9274***
(4.55)
14.9113***
(4.34)
2.8970
(0.34)
14.9274
(4.61)
14.9113***
(4.66)
-0.2624
(-1.24)
-0.9669***
(-5.16)
-1.3305***
(-3.49)
UAE -0.2511
(-0.01)
-1.7050
(-0.07)
49.2139
(0.61)
-0.2511
(-0.01)
-1.7050
(-0.07)
49.2139
(0.70)
-0.0957
(-0.24)
-1.0068***
(-3.52)
-1.0107***
(-2.84) UK . . . . . . . . .
LnTA 1.6365*** (6.03)
3.4343*** (8.90)
5.1995*** (8.90)
1.6365*** (6.11)
3.4343*** (9.83)
5.1995*** (9.59)
0.3016*** (8.99)
0.3915*** (11.19)
0.7553*** (19.53)
FATAP -0.3813
(-1.41)
-0.4703
(-1.16)
-1.2949**
(-2.30)
-0.3813
(-1.35)
-0.4703
(-1.40)
-1.2949**
(-2.31)
-0.0133
(-0.35)
0.0622
(1.06)
0.0527
(0.73)
CRP -0.0601***
(-3.52)
-0.1318***
(-7.12)
-0.2135***
(-5.43)
-0.0601***
(-3.76)
-0.1318***
(-6.47)
-0.2135***
(-5.09)
-0.0179***
(-9.38)
-0.0227***
(-7.08)
-0.0159***
(-3.80)
Constant -10.5623***
(-2.54)
-24.9794***
(-4.55)
-34.6542***
(-3.87)
-10.5623**
(-2.57)
-24.9794***
(-5.08)
-34.6542***
(-4.08)
-2.8349***
(-5.53)
-2.7303***
(-5.19)
-6.6997***
(-10.48)
Observations 1515 1515 1515 1515 1515 1515 1572 1572 1572
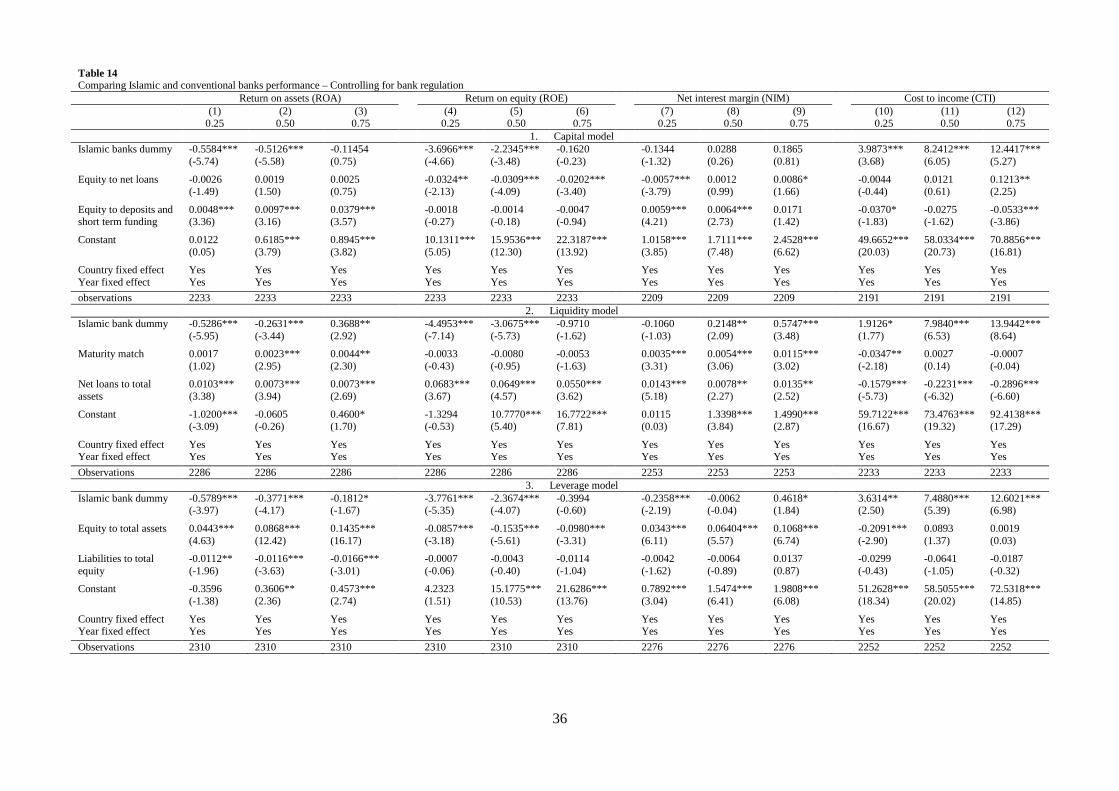
36
Table 14 Comparing Islamic and conventional banks performance – Controlling for bank regulation Return on assets (ROA) Return on equity (ROE) Net interest margin (NIM) Cost to income (CTI) (1) (2) (3) (4) (5) (6) (7) (8) (9) (10) (11) (12) 0.25 0.50 0.75 0.25 0.50 0.75 0.25 0.50 0.75 0.25 0.50 0.75
1. Capital model Islamic banks dummy -0.5584***
(-5.74) -0.5126*** (-5.58)
-0.11454 (0.75)
-3.6966*** (-4.66)
-2.2345*** (-3.48)
-0.1620 (-0.23)
-0.1344 (-1.32)
0.0288 (0.26)
0.1865 (0.81)
3.9873*** (3.68)
8.2412*** (6.05)
12.4417*** (5.27)
Equity to net loans
-0.0026 (-1.49)
0.0019 (1.50)
0.0025 (0.75)
-0.0324** (-2.13)
-0.0309*** (-4.09)
-0.0202*** (-3.40)
-0.0057*** (-3.79)
0.0012 (0.99)
0.0086* (1.66)
-0.0044 (-0.44)
0.0121 (0.61)
0.1213** (2.25)
Equity to deposits and short term funding
0.0048*** (3.36)
0.0097*** (3.16)
0.0379*** (3.57)
-0.0018 (-0.27)
-0.0014 (-0.18)
-0.0047 (-0.94)
0.0059*** (4.21)
0.0064*** (2.73)
0.0171 (1.42)
-0.0370* (-1.83)
-0.0275 (-1.62)
-0.0533*** (-3.86)
Constant 0.0122 (0.05)
0.6185*** (3.79)
0.8945*** (3.82)
10.1311*** (5.05)
15.9536*** (12.30)
22.3187*** (13.92)
1.0158*** (3.85)
1.7111*** (7.48)
2.4528*** (6.62)
49.6652*** (20.03)
58.0334*** (20.73)
70.8856*** (16.81)
Country fixed effect Yes Yes Yes Yes Yes Yes Yes Yes Yes Yes Yes Yes Year fixed effect Yes Yes Yes Yes Yes Yes Yes Yes Yes Yes Yes Yes
observations 2233 2233 2233 2233 2233 2233 2209 2209 2209 2191 2191 2191 2. Liquidity model
Islamic bank dummy -0.5286*** (-5.95)
-0.2631*** (-3.44)
0.3688** (2.92)
-4.4953*** (-7.14)
-3.0675*** (-5.73)
-0.9710 (-1.62)
-0.1060 (-1.03)
0.2148** (2.09)
0.5747*** (3.48)
1.9126* (1.77)
7.9840*** (6.53)
13.9442*** (8.64)
Maturity match 0.0017 (1.02)
0.0023*** (2.95)
0.0044** (2.30)
-0.0033 (-0.43)
-0.0080 (-0.95)
-0.0053 (-1.63)
0.0035*** (3.31)
0.0054*** (3.06)
0.0115*** (3.02)
-0.0347** (-2.18)
0.0027 (0.14)
-0.0007 (-0.04)
Net loans to total assets
0.0103*** (3.38)
0.0073*** (3.94)
0.0073*** (2.69)
0.0683*** (3.67)
0.0649*** (4.57)
0.0550*** (3.62)
0.0143*** (5.18)
0.0078** (2.27)
0.0135** (2.52)
-0.1579*** (-5.73)
-0.2231*** (-6.32)
-0.2896*** (-6.60)
Constant -1.0200*** (-3.09)
-0.0605 (-0.26)
0.4600* (1.70)
-1.3294 (-0.53)
10.7770*** (5.40)
16.7722*** (7.81)
0.0115 (0.03)
1.3398*** (3.84)
1.4990*** (2.87)
59.7122*** (16.67)
73.4763*** (19.32)
92.4138*** (17.29)
Country fixed effect Yes Yes Yes Yes Yes Yes Yes Yes Yes Yes Yes Yes Year fixed effect Yes Yes Yes Yes Yes Yes Yes Yes Yes Yes Yes Yes
Observations 2286 2286 2286 2286 2286 2286 2253 2253 2253 2233 2233 2233 3. Leverage model
Islamic bank dummy -0.5789*** (-3.97)
-0.3771*** (-4.17)
-0.1812* (-1.67)
-3.7761*** (-5.35)
-2.3674*** (-4.07)
-0.3994 (-0.60)
-0.2358*** (-2.19)
-0.0062 (-0.04)
0.4618* (1.84)
3.6314** (2.50)
7.4880*** (5.39)
12.6021*** (6.98)
Equity to total assets 0.0443*** (4.63)
0.0868*** (12.42)
0.1435*** (16.17)
-0.0857*** (-3.18)
-0.1535*** (-5.61)
-0.0980*** (-3.31)
0.0343*** (6.11)
0.06404*** (5.57)
0.1068*** (6.74)
-0.2091*** (-2.90)
0.0893 (1.37)
0.0019 (0.03)
Liabilities to total equity
-0.0112** (-1.96)
-0.0116*** (-3.63)
-0.0166*** (-3.01)
-0.0007 (-0.06)
-0.0043 (-0.40)
-0.0114 (-1.04)
-0.0042 (-1.62)
-0.0064 (-0.89)
0.0137 (0.87)
-0.0299 (-0.43)
-0.0641 (-1.05)
-0.0187 (-0.32)
Constant -0.3596 (-1.38)
0.3606** (2.36)
0.4573*** (2.74)
4.2323 (1.51)
15.1775*** (10.53)
21.6286*** (13.76)
0.7892*** (3.04)
1.5474*** (6.41)
1.9808*** (6.08)
51.2628*** (18.34)
58.5055*** (20.02)
72.5318*** (14.85)
Country fixed effect Yes Yes Yes Yes Yes Yes Yes Yes Yes Yes Yes Yes Year fixed effect Yes Yes Yes Yes Yes Yes Yes Yes Yes Yes Yes Yes
Observations 2310 2310 2310 2310 2310 2310 2276 2276 2276 2252 2252 2252

37
Table 15 Comparing Islamic and conventional banks performance – Controlling for Islamic bank regulation Return on assets (ROA) Return on equity (ROE) Net interest margin (NIM) Cost to income (CTI) (1) (2) (3) (4) (5) (6) (7) (8) (9) (10) (11) (12) 0.25 0.50 0.75 0.25 0.50 0.75 0.25 0.50 0.75 0.25 0.50 0.75
1. Capital model Islamic banks dummy -0.4035***
(-2.71) -0.5844*** (-4.65)
-0.3792 (-1.30)
-2.7796 (-1.62)
-2.2840*** (-3.02)
-0.0042 (-0.01)
0.1542 (0.4663)
-0.0094 (-0.07)
-0.0033 (-0.01)
4.5721*** (3.45)
8.3775*** (4.96)
7.5358 (1.52)
Equity to net loans *Islamic banks dummy
-0.0084*** (-3.26)
0.0018 (1.03)
0.0042 (1.31)
-0.0296 (-1.02)
-0.0147*** (-1.68)
-0.0149* (-1.89)
-0.0144*** (-3.63)
0.0007 (0.39)
0.0050 (1.05)
-0.0041 (-0.43)
0.0121 (0.5747)
0.1954* (2.05)
Equity to deposits and short term funding* Islamic banks dummy
0.0060*** (4.64)
0.0057*** (2.59)
0.0095 (1.38)
0.0005 (0.07)
-0.0024 (-0.38)
-0.0033 (-0.49)
0.0059*** (4.21)
0.0048*** (3.03)
0.0067 (1.07)
-0.0375** (-2.33)
-0.0277 (-1.16)
-0.0569** (-2.16)
Constant 0.0112 (0.05)
0.7421*** (5.29)
1.0590*** (5.00)
10.0884*** (4.82)
15.9485*** (11.86)
22.4251*** (14.12)
1.0158*** (3.85)
1.8425*** (7.28)
2.6435*** (7.15)
48.1437*** (17.95)
58.3349*** (21.21)
71.7975*** (15.19)
Country fixed effect Yes Yes Yes Yes Yes Yes Yes Yes Yes Yes Yes Yes Year fixed effect Yes Yes Yes Yes Yes Yes Yes Yes Yes Yes Yes Yes
observations 2233 2233 2233 2233 2233 2233 2209 2209 2209 2191 2191 2191 2. Liquidity model
Islamic bank dummy -0.6814* (-1.67)
-0.1970 (-0.81)
0.9157** (2.50)
-6.3601*** (-3.23)
-4.3197*** (-3.34)
-2.1828 (-1.68)
-1.1837*** (-3.69)
0.3240 (1.13)
1.1091 (1.54)
5.3710 (1.61)
12.6254*** (3.47
16.6694*** (3.46)
Maturity match* Islamic banks dummy
0.0033 (0.99)
0.0029 (1.59)
0.0077** (2.53)
0.0020 (0.23)
-0.0074 (-0.81)
-0.0054 (-1.38)
0.0044*** (2.93)
0.0045*** (2.53)
0.0076 (1.62)
-0.0227 (-0.72)
0.0153 (0.81)
0.0114 (0.39)
Net loans to total assets *Islamic banks dummy
0.0014 (0.27)
-0.0039 (-1.20)
-0.0159*** (-3.32)
0.0418 (1.28)
0.0269 (1.37)
0.0288 (1.27)
0.0161*** (3.11)
-0.0041 (-0.88)
-0.0140 (-1.43)
-0.0480 (-1.05)
-0.0874* (-1.71)
-0.0916 (-1.37)
Constant -0.3991*** (-1.50)
-0.4573** (2.28)
0.9551* (4.52)
1.2832 (-0.54)
14.9069*** (10.35)
20.8702*** (13.43)
0.8919*** (3.18)
1.8984*** (8.52)
2.6435*** (7.15)
48.7885*** (20.74)
58.6331*** (21.51)
73.1100*** (15.66)
Country fixed effect Yes Yes Yes Yes Yes Yes Yes Yes Yes Yes Yes Yes Year fixed effect Yes Yes Yes Yes Yes Yes Yes Yes Yes Yes Yes Yes
Observations 2286 2286 2286 2286 2286 2286 2253 2253 2253 2233 2233 2233 3. Leverage model
Islamic bank dummy -1.3860*** (-4.21)
-1.7517*** (-5.73)
-1.6946* (-4.35)
-3.9075** (-2.15)
-0.7789 (-0.56)
2.7204 (1.39)
-0.1045 (-0.50)
-0.1938 (-0.87)
-0.1980* (-0.58)
4.6220 (1.38)
10.0650*** (4.76)
15.0792*** (3.35)
Equity to total assets* Islamic banks dummy
0.0382*** (2.59)
0.0872*** (7.04)
0.1391*** (8.57)
-0.0626*** (-1.48)
-0.1167*** (-2.97)
-0.0992** (-2.32)
0.0075 (0.77)
0.0391*** (4.37)
0.0836*** (5.58)
-0.1198 (-1.14)
0.0681 (1.21)
0.0152 (0.12)
Liabilities to total equity* Islamic banks dummy
-0.0441*** (2.89)
-0.0327** (2.19)
0.0010 (0.06)
0.1166 (0.78)
-0.0263 (-0.25)
-0.2399 (-1.31)
-0.0127 (-1.41)
-0.0235* (-1.82)
-0.0447** (-2.34)
-0.0275 (-0.12)
-0.4325*** (-2.87)
-0.5050 (-1.49)
Constant -0.3768*** (-1.42)
0.6332** (3.35)
1.0133*** (4.62)
3.0954 (1.23)
15.2765*** (10.67)
21.0211*** (13.62)
0.8600*** (2.96)
1.8000*** (6.85)
2.6502*** (7.29)
49.4172*** (18.84)
58.8743*** (20.33)
71.6200*** (14.85)
Country fixed effect Yes Yes Yes Yes Yes Yes Yes Yes Yes Yes Yes Yes Year fixed effect Yes Yes Yes Yes Yes Yes Yes Yes Yes Yes Yes Yes
Observations 2310 2310 2310 2310 2310 2310 2276 2276 2276 2252 2252 2252

38
Appendix A
Table A.1 Banking sector structure in sample countries All sample Listed Unlisted banks Country Conventional Islamic Conventional Islamic Conventional Islamic Algeria 17 0 0 0 17 0 Australia 23 0 10 0 0 0 Austria 78 0 5 0 72 0 Bahrain 31 21 12 5 19 15 Bangladesh 24 6 24 6 0 0 Belgium 32 0 0 0 29 0 Brazil 46 0 24 0 0 0 Brunei 2 3 0 0 2 3 Cambodia 22 0 0 0 22 0 Canada 21 0 16 0 1 0 CHINA 129 0 3 0 126 0 Colombia 26 0 13 0 0 0 Croatia 30 0 15 0 0 0 Denmark 58 0 31 0 16 0 Djibouti 2 0 0 0 1 0 Egypt 36 2 11 0 11 0 El Salvador 13 0 10 0 0 0 Finland 10 0 2 0 8 0 France 136 0 9 0 121 0 Gambia 0 1 0 0 0 1 Germany 127 0 8 0 116 0 Ghana 7 0 7 0 0 0 Greece 18 0 9 0 7 0 Honduras 15 0 11 0 0 0 India 73 0 63 0 0 0 Indonesia 81 1 33 0 45 1 Iran 16 16 0 4 0 12 Iraq 16 5 11 1 5 4 Ireland 17 0 2 0 13 0 Israel 13 0 8 0 4 0 Italy 129 0 14 0 105 0 Japan 174 0 78 0 59 0 Jordan 17 3 13 2 4 1 Kazakhstan 17 0 12 0 0 0 Kenya 10 0 10 0 0 0 Kuwait 28 9 19 8 9 1 Lao republic 7 0 1 0 6 0 Lebanon 44 3 6 0 38 3 Libya 13 0 0 0 13 0 Luxembourg 85 0 0 0 81 0 Macedonia 18 0 14 0 0 0 Malaysia 82 17 13 0 58 17 Mauritania 1 0 0 0 0 1 Morocco 22 0 7 0 15 0 Myanmar 4 0 0 0 4 0 Nepal 27 0 26 0 0 0 Netherland 35 0 1 0 31 0 Oman 14 0 10 0 4 0 Pakistan 54 9 29 5 0 4 Palestine 5 1 3 1 2 0 Peru 22 0 19 0 0 0 Philippines 65 0 18 0 43 0 Poland 22 0 15 0 0 0 Portugal 25 0 2 0 20 0 Qatar 15 4 5 3 6 0 Russia 81 1 64 0 0 1 Saudi Arabia 18 4 8 3 6 1 Serbia 27 0 11 0 0 0 Singapore 54 1 11 0 46 1 South Africa 35 0 13 0 0 0 Spain 60 0 8 0 0 0 Sudan 7 12 7 4 0 8 Sweden 24 0 2 0 21 0 Switzerland 38 0 33 0 0 0 Syria 13 2 10 1 3 1 Taiwan 67 0 34 0 0 0 Thailand 45 0 23 0 14 0 Tunisia 36 1 17 0 18 1 Turkey 32 4 20 2 0 2

39
Table A.2 Definition of model variables, descriptions, and data sources Classification Variable Descriptions Sources
Dependent variables
Banking stability (Z-score)
The Bank Level Stability Index; a larger result indicates higher bank stability and less overall bank risk
Author calculation based on Bankscope data
Adjusted return on assets (AROA)
The return on equity divided by the standard deviation of ROE Author calculation based on Bankscope data
Adjusted return on equity (AROE)
Return on Assets divided by the standard deviation of ROA Author calculation based on BankScope data
Independent variables Capital Adequacy Ratio It measures Tier 1 + Tier 2 capital as a percentage of risk
weighted assets Bankscope, 2012
Regulatory variables
Maturity match (MA) This ratio measures and assesses sensitivity to bank runs; therefore, it promotes financial soundness but it could also be interpreted as excess of liquidity
Bankscope, 2012
Leverage ratio (TLTA) Total liabilities divided by total assets Bankscope, 2012
Total deposits to total
assets (TDTA) The Bank capitalization ratio, measured by dividing bank total equity by total assets ; therefore higher bank capitalization indicates lower bank risk
Bankscope, 2012
Size (LnTA) Measured by the natural logarithm value of total assets; it is used as a proxy of bank size
Bankscope, 2012
Bank control variables
Fixed assets to total assets (FATA)
Fixed assets divided by total assets Bankscope, 2012
Assets Diversity ratio (ADR)
A ratio that measures how banks diversify between lending and non-lending activities. An increased value of ADR means a higher degree of diversification
Author calculation based on Bankscope
Credit Risk (CR) Measured by dividing loan loss provision by net interest income; a higher CR might be interpreted as a bank precaution
Author calculation base on Bankscope
Concentration (CON) The concentration is the share of total banking sector assets held
by the three biggest banks in a country Author calculation based on Bankscope
Gross domestic product GDP Growth World Bank WDI, 2012
Country control variables
London Interbank Offered Rates (LIBOR)
An interest rate used between banks to borrow funds from the London interbank market
Bankrate.com
Consumer Price Index (CPI)
The consumer price index measures the changes in the price/cost of consumer goods and services at a specific period of time, such as annually
World Bank, IMF, IFS
Official exchange rate (LnTCO)
The logarithm of the official exchange rate. It represents the exchange rate calculated by national authorities
World Bank WDI, 1960 – 2011
LnPopulation (LnPOP) Logarithm of a country population in millions World Bank WDI, 1960 – 2011
Other variables Islamic banks dummy variable (IBDV)
A dummy variable that equals 1 if a bank is Islamic and 0 otherwise
Author calculation
Interaction (IBDV) Interaction of Islamic banks dummy variable and the Basel variables (Total capital ratio, liquidity ratio, and leverage ratios)
Author calculation
Ukraine 24 0 24 0 0 0 United Arab Emirates 27 10 18 7 7 3 United Kingdom 138 5 1 1 130 3 United States 8510 0 132 0 8265 0 Venezuela 22 0 13 0 0 0 Vietnam 59 0 9 0 50 0 Yemen 8 4 0 0 8 4 Total 11487 146 1110 55 9743 88

40
Table B.1
Descriptive statistics per country and per variable
Countries Dependent variables Independent variables
Stability proxies Regulatory variables Bank control variables Country control variables
AROA AROE ZS TCR MA TLTA LnTA FATA ADR CR TDTA CONGDPG CPI LnTCO LnPOP LIBOR
Conventional banks 1.91 2.53 28.58 15.98 33.92 87.09 14.69 1.39 0.79 17.94 60.68 45.27 1.74 2.90 0.50 19.01 3.18
Algeria 1.27 4.59 51.15 22.31 58.70 82.02 14.06 1.80 0.82 23.86 56.69 76.56 3.03 3.65 4.26 17.35 3.18
Australia 4.41 3.99 36.43 11.72 22.40 85.62 16.32 1.13 0.50 11.56 48.16 34.58 2.91 2.93 0.21 16.87 3.18
Austria 1.64 2.25 20.91 16.07 40.66 94.66 17.40 0.64 0.88 21.21 38.33 72.78 1.61 1.91 -0.29 15.93 3.18
Bahrain 1.54 1.68 17.46 23.28 53.97 74.05 13.93 1.15 1.19 14.20 36.50 49.55 6.12 2.69 -0.98 13.79 3.18
Bangladesh 3.43 4.82 18.88 11.24 16.30 92.35 13.69 1.61 0.43 22.38 80.71 34.58 6.17 7.56 4.22 18.79 3.18
Belgium 1.61 2.16 22.93 14.49 37.87 93.56 17.28 0.59 0.90 18.77 42.54 81.86 1.30 2.17 -0.29 16.18 3.18
Brazil 3.04 3.17 19.90 19.15 45.97 84.43 15.58 0.96 1.01 17.61 37.96 53.35 4.26 5.05 0.70 19.07 3.18
Brunei 0.01 2.27 13.01 14.91 45.45 93.02 14.08 0.97 0.50 23.79 86.31 45.35 0.64 0.98 0.41 12.85 3.18
Cambodia 0.01 3.48 18.39 29.91 66.44 76.27 12.30 2.09 0.69 16.40 56.49 63.75 7.83 8.07 8.32 16.44 3.18
Canada 4.67 5.35 33.61 13.48 29.32 84.49 16.16 1.10 0.79 9.93 57.36 51.79 1.53 1.80 0.10 17.32 3.18
China 0.00 2.93 24.47 14.00 33.86 90.55 15.06 0.97 0.83 17.61 69.86 57.18 11.23 2.77 2.00 21.00 3.18
Colombia 4.39 4.57 35.34 13.46 21.21 88.08 15.56 2.17 0.50 35.18 64.54 64.90 4.58 4.73 7.66 17.61 3.18
Croatia 2.65 1.90 32.25 16.29 34.82 86.93 13.38 2.39 0.55 17.08 68.75 74.30 1.33 3.15 1.70 15.30 3.18
Denmark 2.04 1.11 27.44 15.33 26.55 93.53 17.06 0.53 0.74 21.24 42.63 84.58 0.35 2.07 -0.29 15.52 3.18
Djibouti . . . . 80.37 94.51 12.72 0.97 1.51 4.43 66.05 45.35 4.77 4.86 5.18 13.65 3.18
Egypt 1.40 2.35 22.15 18.48 43.60 88.62 14.80 1.07 1.10 26.65 73.61 54.60 5.90 10.53 1.73 18.17 3.18
El Salvador 2.14 2.31 30.33 17.23 20.60 87.77 13.48 2.49 0.45 31.41 68.08 66.71 1.80 3.71 2.17 15.63 3.18
Finland 2.55 1.99 34.60 14.97 47.34 94.48 16.60 0.36 0.79 16.37 38.81 95.79 1.39 1.70 -0.29 15.48 3.18
France 1.63 2.65 24.27 13.49 38.43 91.88 15.94 0.64 0.92 16.51 47.88 53.01 0.84 1.56 -0.29 17.98 3.18
Germany 2.01 2.17 29.38 15.82 39.72 90.89 15.10 0.64 0.88 18.32 52.42 73.36 1.22 1.58 -0.29 18.22 3.18
Ghana 5.43 4.62 32.38 17.81 41.01 87.54 13.02 3.13 0.84 12.66 61.47 46.66 6.53 13.87 0.08 16.95 3.18
Greece 2.32 0.23 42.92 12.99 19.52 90.76 14.48 0.50 0.90 15.50 53.12 62.14 0.65 3.29 -0.29 16.23 3.18
Honduras 3.94 4.08 31.62 12.63 17.26 88.61 13.11 2.64 0.65 10.08 69.70 52.92 3.95 7.15 2.94 15.79 3.18
India 4.88 4.66 36.03 13.88 14.28 88.67 15.73 1.39 0.67 14.70 69.03 39.24 8.34 8.00 3.80 20.89 3.18
Indonesia 0.01 3.43 35.24 20.61 36.56 83.73 13.86 1.47 0.75 11.97 69.93 52.54 5.73 8.28 9.16 19.27 3.18
Iraq 0.98 2.02 15.74 26.46 81.55 76.46 12.76 2.02 0.89 16.42 54.65 88.57 3.59 17.09 7.16 17.21 3.18
Ireland 2.94 0.13 36.75 12.73 41.22 92.67 14.53 0.76 0.77 16.75 62.05 66.15 0.91 1.65 -0.29 15.29 3.18
Israel 1.06 3.29 35.72 12.78 28.95 93.88 16.22 1.25 0.69 12.38 78.01 60.78 4.29 2.43 1.40 15.80 3.18
Italy 2.32 2.57 37.82 14.46 32.12 89.63 14.18 0.69 0.83 16.07 56.19 64.60 -0.01 1.93 -0.29 17.90 3.18
Jordan 0.95 3.26 36.94 19.68 36.99 85.40 14.57 1.47 0.96 13.88 65.40 75.95 6.57 5.73 -0.34 15.56 3.18

41
Table B.1
Descriptive statistics per country and per variable
Countries Dependent variables Independent variables
Stability proxies Regulatory variables Bank control variables Country control variables
AROA AROE ZS TCR MA TLTA LnTA FATA ADR CR TDTA CONGDPG CPI LnTCO LnPOP LIBOR
Japan 1.41 1.45 35.55 10.55 6.65 94.39 16.79 1.43 0.66 17.70 88.79 42.49 0.50 -0.11 4.64 18.67 3.19
Kazakhstan 0.88 0.74 10.08 19.22 33.05 85.82 14.61 2.51 0.45 40.65 45.33 61.62 6.85 9.75 4.89 16.57 3.18
Kenya 4.38 5.24 28.79 18.92 31.60 85.98 13.65 2.94 0.69 13.10 74.59 54.38 4.88 12.33 4.29 17.45 3.18
Kuwait 1.10 0.98 11.63 20.12 51.82 72.69 14.55 1.18 1.19 16.25 45.83 44.14 3.90 5.21 -1.26 14.73 3.18
Lao 0.02 0.57 5.07 . 52.01 88.79 12.40 1.95 1.08 24.98 70.98 92.45 7.86 5.35 9.14 15.60 3.18
Lebanon 1.26 4.55 51.59 19.95 37.61 90.33 14.16 1.53 1.34 8.84 78.70 52.13 5.65 2.59 7.32 15.24 3.18
Libya . . . . 81.41 87.18 14.64 1.26 1.37 28.25 68.51 85.95 5.54 4.27 0.24 15.62 3.18
Luxembourg 2.31 2.46 37.66 18.67 61.94 88.53 13.62 0.92 0.89 15.54 56.93 30.90 2.53 2.25 -0.29 13.09 3.18
Macedonia 1.45 1.55 13.92 19.54 35.23 80.80 12.56 3.60 0.52 21.17 63.85 70.83 3.56 2.46 3.82 14.53 3.18
Malaysia 0.01 3.23 33.59 20.27 49.74 84.64 14.88 0.90 0.89 19.09 54.61 34.18 4.67 2.72 1.25 17.12 3.18
Mauritania 0.15 0.04 5.07 12.84 26.49 87.62 14.78 1.70 0.69 16.81 54.44 58.42 4.58 2.00 2.12 17.25 3.18
Morocco 0.01 0.57 6.51 . 70.01 95.00 16.14 0.60 0.93 40.93 34.91 45.35 . 16.73 1.73 17.67 3.18
Nepal 5.37 6.05 34.27 13.43 28.96 90.18 12.39 1.84 0.63 13.30 72.09 38.64 4.29 8.83 4.27 17.17 3.18
Netherlands 1.99 3.38 37.63 16.24 37.48 89.62 13.39 0.65 0.98 17.61 60.88 86.31 1.55 1.57 -0.29 16.62 3.18
Oman 3.41 3.70 26.91 18.95 83.68 78.88 14.08 1.08 0.54 10.89 56.07 66.00 5.70 5.04 -0.96 14.77 3.18
Pakistan 2.55 2.17 18.84 14.14 18.68 85.28 13.85 2.83 0.81 25.30 64.53 41.56 4.71 12.07 4.23 18.93 3.18
Palestine 1.07 2.13 37.87 18.28 63.70 82.13 12.52 2.02 1.06 10.79 56.82 71.01 . 4.36 . 15.15 3.18
Peru 5.32 5.74 32.48 11.78 25.13 85.22 13.76 2.56 0.48 17.27 59.88 75.73 7.15 2.61 1.12 17.16 3.18
Philippines 0.01 3.57 29.23 17.97 34.96 84.00 13.73 1.64 1.00 13.46 66.84 49.84 4.93 5.20 3.87 18.31 3.18
Poland 3.19 3.13 28.99 13.32 24.74 88.83 15.90 1.35 0.71 17.80 63.97 47.23 4.55 2.75 1.07 17.46 3.18
Portugal 1.56 1.41 27.22 14.52 38.70 87.30 13.18 1.05 0.88 18.05 56.66 81.26 0.51 1.83 -0.29 16.18 3.18
Qatar 4.07 4.64 42.02 19.88 77.71 77.69 15.03 1.17 0.95 8.28 58.70 65.20 15.08 7.03 1.29 14.03 3.18
Russia 1.82 1.85 19.62 16.10 43.62 85.62 13.56 4.31 0.61 20.93 39.12 68.20 4.14 10.66 3.33 18.77 3.18
Saudi Arabia 2.64 2.34 20.87 18.56 69.29 83.44 16.29 1.01 0.85 15.60 63.03 63.64 3.28 4.56 1.32 17.06 3.18
Serbia 0.80 0.86 12.61 23.93 44.67 76.13 13.05 4.73 0.44 32.17 56.21 46.65 2.61 10.15 4.18 15.81 3.18
Singapore 0.02 2.87 36.05 21.47 46.35 77.71 14.04 0.80 0.90 7.78 53.87 60.82 6.75 2.23 0.40 15.36 3.18
South Africa 3.42 3.22 19.59 20.84 40.87 75.11 15.38 1.55 0.73 19.75 50.27 59.78 3.57 6.35 1.99 17.70 3.18
Spain 1.80 2.57 32.27 13.65 28.55 85.13 12.73 1.01 0.90 17.18 56.01 80.68 1.37 2.54 -0.29 17.62 3.18
Sudan 2.54 1.95 15.43 26.82 50.71 86.39 13.04 3.91 0.69 22.03 45.22 57.15 7.61 10.37 0.80 17.29 3.18
Sweden 0.91 3.07 28.57 15.77 16.69 86.15 12.64 0.81 0.95 15.23 59.24 96.96 1.88 1.35 -0.29 16.03 3.18
Switzerland 3.91 4.20 34.79 18.24 38.31 83.28 15.78 1.59 0.74 7.91 56.32 88.76 2.26 0.93 0.14 15.85 3.18
Syria 1.27 1.63 17.74 19.09 61.17 86.65 13.91 2.25 0.97 9.00 65.92 88.71 5.10 7.37 2.42 16.78 3.18
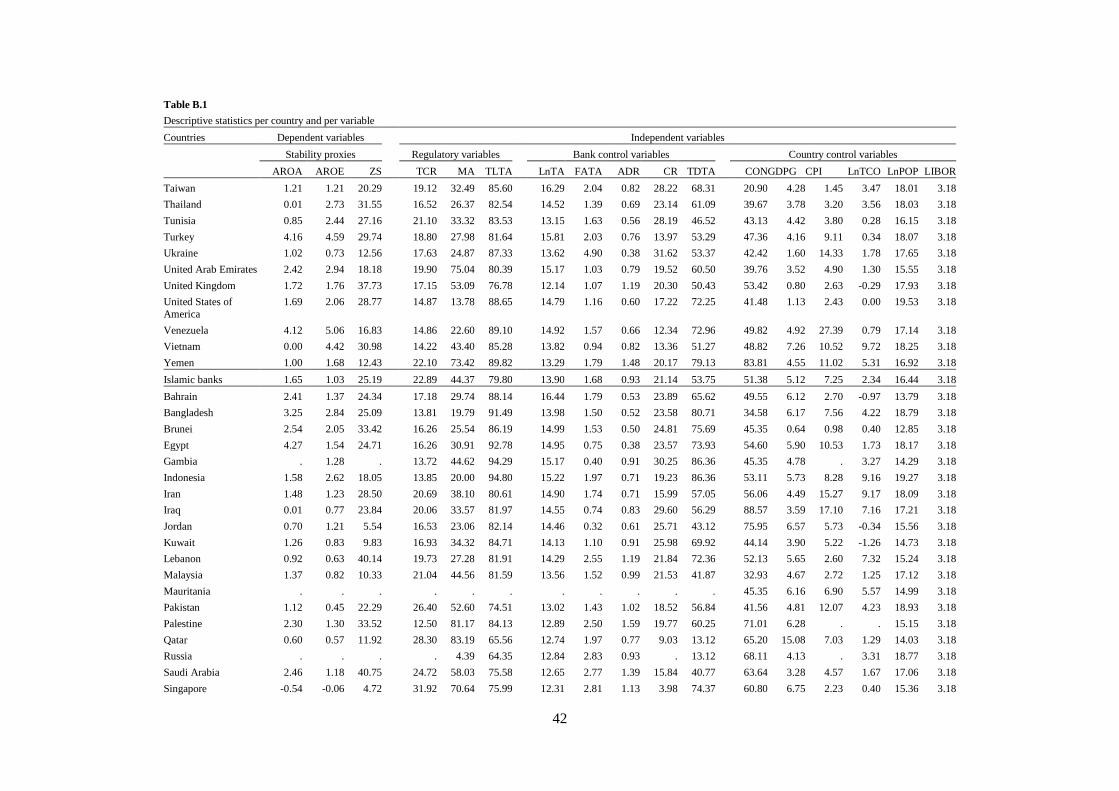
42
Table B.1
Descriptive statistics per country and per variable
Countries Dependent variables Independent variables
Stability proxies Regulatory variables Bank control variables Country control variables
AROA AROE ZS TCR MA TLTA LnTA FATA ADR CR TDTA CONGDPG CPI LnTCO LnPOP LIBOR
Taiwan 1.21 1.21 20.29 19.12 32.49 85.60 16.29 2.04 0.82 28.22 68.31 20.90 4.28 1.45 3.47 18.01 3.18
Thailand 0.01 2.73 31.55 16.52 26.37 82.54 14.52 1.39 0.69 23.14 61.09 39.67 3.78 3.20 3.56 18.03 3.18
Tunisia 0.85 2.44 27.16 21.10 33.32 83.53 13.15 1.63 0.56 28.19 46.52 43.13 4.42 3.80 0.28 16.15 3.18
Turkey 4.16 4.59 29.74 18.80 27.98 81.64 15.81 2.03 0.76 13.97 53.29 47.36 4.16 9.11 0.34 18.07 3.18
Ukraine 1.02 0.73 12.56 17.63 24.87 87.33 13.62 4.90 0.38 31.62 53.37 42.42 1.60 14.33 1.78 17.65 3.18
United Arab Emirates 2.42 2.94 18.18 19.90 75.04 80.39 15.17 1.03 0.79 19.52 60.50 39.76 3.52 4.90 1.30 15.55 3.18
United Kingdom 1.72 1.76 37.73 17.15 53.09 76.78 12.14 1.07 1.19 20.30 50.43 53.42 0.80 2.63 -0.29 17.93 3.18
United States of America
1.69 2.06 28.77 14.87 13.78 88.65 14.79 1.16 0.60 17.22 72.25 41.48 1.13 2.43 0.00 19.53 3.18
Venezuela 4.12 5.06 16.83 14.86 22.60 89.10 14.92 1.57 0.66 12.34 72.96 49.82 4.92 27.39 0.79 17.14 3.18
Vietnam 0.00 4.42 30.98 14.22 43.40 85.28 13.82 0.94 0.82 13.36 51.27 48.82 7.26 10.52 9.72 18.25 3.18
Yemen 1.00 1.68 12.43 22.10 73.42 89.82 13.29 1.79 1.48 20.17 79.13 83.81 4.55 11.02 5.31 16.92 3.18
Islamic banks 1.65 1.03 25.19 22.89 44.37 79.80 13.90 1.68 0.93 21.14 53.75 51.38 5.12 7.25 2.34 16.44 3.18
Bahrain 2.41 1.37 24.34 17.18 29.74 88.14 16.44 1.79 0.53 23.89 65.62 49.55 6.12 2.70 -0.97 13.79 3.18
Bangladesh 3.25 2.84 25.09 13.81 19.79 91.49 13.98 1.50 0.52 23.58 80.71 34.58 6.17 7.56 4.22 18.79 3.18
Brunei 2.54 2.05 33.42 16.26 25.54 86.19 14.99 1.53 0.50 24.81 75.69 45.35 0.64 0.98 0.40 12.85 3.18
Egypt 4.27 1.54 24.71 16.26 30.91 92.78 14.95 0.75 0.38 23.57 73.93 54.60 5.90 10.53 1.73 18.17 3.18
Gambia . 1.28 . 13.72 44.62 94.29 15.17 0.40 0.91 30.25 86.36 45.35 4.78 . 3.27 14.29 3.18
Indonesia 1.58 2.62 18.05 13.85 20.00 94.80 15.22 1.97 0.71 19.23 86.36 53.11 5.73 8.28 9.16 19.27 3.18
Iran 1.48 1.23 28.50 20.69 38.10 80.61 14.90 1.74 0.71 15.99 57.05 56.06 4.49 15.27 9.17 18.09 3.18
Iraq 0.01 0.77 23.84 20.06 33.57 81.97 14.55 0.74 0.83 29.60 56.29 88.57 3.59 17.10 7.16 17.21 3.18
Jordan 0.70 1.21 5.54 16.53 23.06 82.14 14.46 0.32 0.61 25.71 43.12 75.95 6.57 5.73 -0.34 15.56 3.18
Kuwait 1.26 0.83 9.83 16.93 34.32 84.71 14.13 1.10 0.91 25.98 69.92 44.14 3.90 5.22 -1.26 14.73 3.18
Lebanon 0.92 0.63 40.14 19.73 27.28 81.91 14.29 2.55 1.19 21.84 72.36 52.13 5.65 2.60 7.32 15.24 3.18
Malaysia 1.37 0.82 10.33 21.04 44.56 81.59 13.56 1.52 0.99 21.53 41.87 32.93 4.67 2.72 1.25 17.12 3.18
Mauritania . . . . . . . . . . . 45.35 6.16 6.90 5.57 14.99 3.18
Pakistan 1.12 0.45 22.29 26.40 52.60 74.51 13.02 1.43 1.02 18.52 56.84 41.56 4.81 12.07 4.23 18.93 3.18
Palestine 2.30 1.30 33.52 12.50 81.17 84.13 12.89 2.50 1.59 19.77 60.25 71.01 6.28 . . 15.15 3.18
Qatar 0.60 0.57 11.92 28.30 83.19 65.56 12.74 1.97 0.77 9.03 13.12 65.20 15.08 7.03 1.29 14.03 3.18
Russia . . . . 4.39 64.35 12.84 2.83 0.93 . 13.12 68.11 4.13 . 3.31 18.77 3.18
Saudi Arabia 2.46 1.18 40.75 24.72 58.03 75.58 12.65 2.77 1.39 15.84 40.77 63.64 3.28 4.57 1.67 17.06 3.18
Singapore -0.54 -0.06 4.72 31.92 70.64 75.99 12.31 2.81 1.13 3.98 74.37 60.80 6.75 2.23 0.40 15.36 3.18

43
Table B.1
Descriptive statistics per country and per variable
Countries Dependent variables Independent variables
Stability proxies Regulatory variables Bank control variables Country control variables
AROA AROE ZS TCR MA TLTA LnTA FATA ADR CR TDTA CONGDPG CPI LnTCO LnPOP LIBOR
Sudan -0.17 0.75 13.80 27.47 66.90 76.98 12.42 2.08 1.21 13.73 43.30 57.15 7.17 10.37 0.80 17.29 3.18
Syria 1.84 0.00 5.83 31.92 93.30 64.35 12.36 1.78 1.73 1.92 12.96 88.71 5.10 7.35 2.42 16.78 3.18
Tunisia 0.34 0.29 59.04 31.38 93.30 64.35 12.44 2.83 0.88 28.69 54.92 43.13 4.42 3.78 0.28 16.15 3.18
Turkey 0.76 0.25 22.69 24.61 37.43 73.81 12.21 1.67 0.82 41.56 68.98 47.36 4.16 6.13 0.34 18.07 3.18
United Arab Emirates 2.59 0.84 39.37 25.41 73.73 70.92 12.07 2.05 1.16 28.66 35.64 39.76 3.52 4.93 1.30 15.55 3.18
United Kingdom 2.60 1.84 39.94 31.59 52.04 66.00 12.00 1.58 1.61 8.10 17.38 53.42 0.80 2.65 -0.57 17.93 3.18
Yemen 2.03 0.96 21.36 31.03 49.11 74.36 12.00 1.17 1.58 21.34 38.85 83.81 4.55 11.02 5.31 16.92 3.18

44
REFERENCES
Altunbas, Y., Carbo, S., Gardner, E., and Molyneux P., (2007), “Examining the relationship between Capital, Risk and Efficiency in European Banking”, European Financial Management, vol. 13, No. 1, 49-70.
Allen, F., Santomero, A., (1998), “The Theory of Financial Intermediation”, Journal of Banking and Finance, 1461-1485.
Anginer, D., Demirguc-Kunt, A., and Zhu, M., (2012),“How Does Bank Competition Affect Systemic Stability?”, World Bank Working Paper, WPS5981.
Barrios, E., and Blanco, J. M., “The effectiveness of bank capital adequacy regulation: A theoretical and empirical approach”, Journal of Banking & Finance, 27, 1935 – 1958.
Beck, T., Demirgűç-Kunt, A., and Merrouche, O., (2013), “Islamic vs. Conventional Banking Business Model, Efficiency and Stability”, Journal of Banking & Finance, 37, 433 – 447.
Beck, T., Demirgűç-Kunt, A., and Merrouche, O., (2010), “Islamic vs. Conventional Banking Business Model, Efficiency and Stability”, World Bank Working Paper, WPS5446.
Blum, J., (1999), “Do capital adequacy requirements reduce risks in banking?”, Journal of Banking & Finance, 23, 755 – 771.
Boumediene, A., (2011),“Basel III: Relevance for Islamic Banks”, Pantheon-Sorbonne University.
Čihák, M., and Hesse, H., (2008); “Islamic Banks and Financial Stability: An Empirical Analysis” , International Monetary Fund Working Paper, WP/08/16.
Comité de Bâle sur le contrôle bancaire, (2011), « Bâle III : dispositif réglementaire mondial visant à renforcer la résilience des établissements et systèmes bancaires», Banque des Règlements Internationaux.
Dongcheol, Y., (2012), “The possible impacts of Basel III Liquidity Regulations on Islamic Interbank Money Market of Malaysia, and policy suggestions”, 3rd International Conference on Business and Economic Research.
Demirgüç-Kunt, A., and Kane, E. J., (2001), “Deposit Insurance around the Globe: Where does it work?”, The National Bureau of Economic Research, WP No. 8493.
Demirgüç-Kunt, A., and Detragiache E., (2011), “Basel Core Principles and Bank soundness: Does Compliance matter?”, Journal of Financial Stability, 7, 179 – 190.
Ernst & Yong, (2011), the World Islamic Banking Competiveness Report, 2011-2012.
Fakih, R., (2010), “Islamic Finance Landscape”, the Banker Summit.

45
Fonseca, A., and González F., (2010), “How bank capital buffers vary accorss countries: The influence of cost of deposits, market power and bank regulation”, 34, 892 – 902.
Hassan, M., and Dridi, J., (2010), “The effects of the Global Crisis on Islamic and Conventional Banks: A comparative Study”, International Monetary Fund Working Paper, WP/10/201
Hawary D., Grais W., et Iqbal Z., (2007), “Diversity in the Regulation of Islamic Financial Institutions”, The Quarterly Review of Economic and Finance, 46, 778-800.
Hsieb, M., and Lee C., (2012), “The Impact of Bank Capital on Profitability and Risk in Asian Banking”, Journal of International Money and Finance, 1-31.
Islamic Financial Services Board (IFSB), (2005a), “Guiding Principles of Risk Management for Institutions (other than Insurance Institutions) offering only Islamic Financial Services (IIFS)”.
Islamic Financial Services Board (IFSB), (2005b), “Capital Adequacy Standard for Institutions (other than Insurance Institutions) offering only Islamic Financial Services (IIFS)”.
Islamic Financial Services Board (IFSB), (2010), “Guidance note on the practice of smoothing the profits payout payout to investment Accounts Holders”.
Islamic Financial Services Board (ISFB), (2011), “Guidance note in connection with the IFSB Capital Adequacy Standard: the determination of Alfa in the capital adequacy ratio for institutions (other than insurance institutions) offering only financial Islamic services".
Khaldi, K., and Hamdouni A., (2011), “Islamic financial Intermediation: Equity, Efficiency and Risk”, International Research Journal of finance and Economics, 65.
Kim, D., and Santomero, A. M., (1988), “Risk in Banking and Capital Regulation”, The Journal of Finance, Vol. 43, No. 5, pp. 1219 – 1233.
Koenker, R., (1978), “Regression Quantiles”, Econometrica, Vol. 46, No. 1, pp. 33 – 50.
Koenker, R., and Hallock, K., (2001), “Quantile Regression”, Journal of Economics Perspectives, Volume 15, Number 4, page 143 – 156.
Lee, C., and Hsieh, M., (2012), The impact of capital on profitability and risk in Asian banking”, Journal of International Money and Finance, 1 – 31.
Merciaca, S., Schaeck, K.., and Wolf, S., (2007), “Small European banks: Benefits from diversification?”, Journal of Banking & Finance, 1975 – 1998.
Ongena, S., and Şendeniz-Yüncü, I., (2011), “Which firms engage small, foreign, or state banks? And who goes Islamic? Evidence from Turkey”, Journal of Banking & Finance, 35, 3213 – 3224.
46
Oslon, D., and Zoubi, T., (2008), “Using accounting ratios to distinguish between Islamic and conventional banks in the GCC region”, The International Journal of Accounting, 43, 45 – 65.
Pappas, V., Izzeldin, M., and Fuertes A., (2012), “Failure Risk in Islamic and Conventional Banks”, Lancaster University and City University, United Kingdom
Rajhi, W., (2012), “Islamic Banks and Financial Stability: A Comparative empirical Analysis between MENA and Southeast Asian Countries”, University of South Toulon-Var.
Rime, B., (2001), “Capital requirements and bank behavior: Empirical evidence from Switzerland” Journal of Banking & Finance, 25, 789 – 805.
Rizwan S., Khan N., Khan H., (2012), “Implication of Basel III on Islamic Banks”, International Conference on Excellence in Business, University of Sharjah, United Arabs Emirates.
Sanusi, N.A., and A.G., Ismail, (2005), “A panel data analysis of the determinants of Malaysian Islamic bank returns: 1995-2004”, Global finance conference, Trinity college, Dublin, Ireland.
Srairi, S., (2008), “A comparison of the profitability of Islamic and conventional banks: the case of GCC countries”, Bankers, Markets and Investors, 98, 16 – 24.
Stiroh K., (2004), “Is non-interest income the answer?”, Journal of money, Credit and Banking, Vol. 36, No. 5, PP. 853 – 882.
Toumi, K., Viviani, J. L., and Belkacem, L., (2011), “A comparison of leverage and profitability of Islamic and conventional banks”, International Conference of the French Finance Association AFFI
Turk-Ariss, R., (2010), “Competitive conditions in Islamic and conventional banking: A global perspective”, Review of Financial Economics, 19, 101 – 108.
Turk-Ariss, R., (2010), “On the implications of market power in banking: Evidence from developing countries”, Journal of Banking & Finance, 34, 765 – 775.
Turk-Ariss, R., and Sarieddine, Y., (2007), “Challenges in implementing capital adequacy guidelines to Islamic banks”, Journal of Banking Regulation, 9, 46–59.
VanHoose, D., (2007),“Theories of bank behavior under capital regulation”, Journal of Banking & Finance, 31, 3680 – 3697.
Vasquez, F., and Federico, P., (2012), “Bank funding Structures and Risk: Evidence from the Global Financial Crisis”, International Monetary Fund, WP12/29.
Zong-yi, Z., Jun, W., Qiong-fang, L., (2008), “Impact of Capital Adequacy Regulation on risk-taking Behaviors of Banking”, System Engineering – Theory & Practice, Vol. 28, Issue 8, 183 – 189.