baseline survey on the prevalence and concentration of ... survey re… · concentration of...
TRANSCRIPT
Baseline survey on the prevalence and concentration of Salmonella and
Campylobacter in chicken meat on-farm and at primary processing
A survey conducted under the Implementation Subcommittee Coordinated Food Survey Plan with participation from food regulatory
jurisdictions in New South Wales, Queensland, Western Australia, South Australia and Tasmania.
Report prepared by FSANZ and the South Australian Research and Development Institute
March 2010

1
Acknowledgements
FSANZ would like to thank:
the South Australian Research and Development Institute who assisted with the
development of this survey, compiled and analysed the results and assisted with the
writing of this report
the Australian Government Department of Health and Ageing for contributing to the
financing of this survey, assisting with the development of the survey and the preparation
of this report
the participating jurisdictions for assisting with the financing of this survey, its
development and implementation and for assisting with the preparation of this report.
They were:
o the Department of Health, Western Australia
o the New South Wales Food Authority
o Safe Food Production Queensland
o the Department of Primary Industries and Resources South Australia
o the Department of Primary Industries and Water Tasmania.
the poultry farms that participated in the on-farm biosecurity/food safety survey and those
that allowed faecal samples to be taken from their sheds
the poultry processors for providing access to relevant government officers to collect
samples from their processing plants.

2
Table of Contents
1. Executive Summary ..................................................................................... 4
2. Introduction ................................................................................................. 7
3. Survey objective ......................................................................................... 10
4. ISC Coordinated Food Survey .................................................................. 10
5. Resources spent on the survey ................................................................... 11
6. Survey design and methodology ................................................................ 11
6.1 On-farm ....................................................................................................................... 12
6.2 Prior to processing....................................................................................................... 13
6.3 Post processing ............................................................................................................ 14
7. Method of Analysis .................................................................................... 16
8. Results......................................................................................................... 17
8.1 On-farm (faecal samples) ............................................................................................ 17
8.2 Prior to processing (caecal samples) ........................................................................... 18
8.3 Post processing (rinse samples) ................................................................................... 21
8.4 Salmonella serovar testing........................................................................................... 26
9. Discussion ................................................................................................... 27
9.1 On-farm (faecal samples) ............................................................................................ 27
9.2 Prior to processing (caecal samples) ........................................................................... 29
9.3 Post processing (rinse samples) ................................................................................... 30
9.4 Salmonella serovar testing........................................................................................... 36
10. Follow up action ....................................................................................... 36
11. Conclusions ............................................................................................... 37

3
12. References ................................................................................................. 38
13. Attachments.............................................................................................. 42
Attachment 1: Form A: Sample Collection On-Farm ..................................................... 43
Attachment 2: Method of analysis for Salmonella and Campylobacter ........................... 44
Attachment 3: Form B: Sample Collection at Processing Facilities ................................ 50
Attachment 4: Salmonella single and multiple serovar isolation profiles for positive
samples .............................................................................................................................. 51

4
1. Executive Summary
Food Standards Australia New Zealand was the lead agency for a national coordinated survey
to collect baseline data on the prevalence and concentration of Salmonella and
Campylobacter on poultry and poultry meat at various stages along the supply chain. As part
of its through-chain approach to food regulation, FSANZ has developed a Primary
Production and Processing Standard for Poultry Meat (Standard for Poultry Meat). The
overall objective of this Standard is to reduce the likelihood of illness occurring from the
consumption of poultry, with a focus on measures to reduce both the prevalence and
concentration of Salmonella and Campylobacter on poultry meat. These two pathogens are
considered to be the main microbiological hazards associated with the consumption of
poultry meat. Comparison of results from this baseline survey with those from a follow up
survey, to be undertaken after the Standard for Poultry Meat is fully implemented, will be
used to assess the effectiveness of the new Standard.
The states that participated in at least one component of this survey were New South Wales,
Queensland, Western Australia, South Australia and Tasmania. Western Australia was the
only jurisdiction to participate in all three components of the survey. Neither of the territories
participated, as they do not have poultry meat farms or processors within their jurisdictions.
This study measured both the prevalence and where appropriate, concentration, of Salmonella
and Campylobacter at three points along the poultry meat supply chain, on-farm, just prior to
processing and at the end of primary processing. Microbiological samples were collected
during 2007 and 2008. All samples were collected from the chicken meat industry and the
on-farm surveys were conducted on chicken meat farms. While the Standard for Poultry
Meat will apply to poultry other than chicken, chicken meat is consumed in far greater
quantities than other poultry.
Samples that were positive for Salmonella were typed to determine the serovars. The most
common serovar was Sofia, except in Western Australia where Typhimurium was the most
common. Sofia is considered to have low virulence to humans (i.e. rarely implicated in cases
of human salmonellosis). Nationally, the most common non-Sofia serovar was
Typhimurium, followed by Infantis and Mbandaka.
The results from this survey were compared with recent overseas data on the prevalence
and/or levels of Salmonella and Campylobacter in poultry. However, caution needs to be
taken when comparing these data due to the differences in survey design, methodology and
sample sizes and therefore the comparisons are somewhat rudimentary. Comparisons were
made with similar baseline surveys, and also with studies where specific interventions are in
place to lower flock prevalence of Campylobacter and/or Salmonella.

5
On farm
As an indicator of flock prevalence of Salmonella and Campylobacter, pooled faecal samples
were collected from farms in Western Australia before first pick-up1. A total of 233 pooled
faecal samples were collected from 39 farms. Of the 233 samples collected, 46.8% were
positive for Salmonella (comprised of 46.8% positive for non-Sofia serovars and 0.9%
positive for Sofia, with some samples having multiple serovars2) and 64.4% were positive for
Campylobacter. In 21 sheds (9%), Salmonella and Campylobacter were not detected.
In some farms Salmonella or Campylobacter were not detected (15.4% and 28%,
respectively) but there were no farms where both pathogens were not detected, with at least
one shed testing positive for Salmonella or Campylobacter on every farm.
Currently in Australia there are no regulatory measures in place to lower the prevalence of
these two pathogens in poultry flocks, however, the majority of poultry growers comply with
an industry biosecurity manual, to minimise the introduction and spread of infectious diseases
generally in poultry flocks.
The results were compared with two similar on-farm baseline surveys undertaken in Canada
and Ireland. The prevalence of Campylobacter positive flocks was higher in this survey
(64.4%) compared to 35% in Canada. For Salmonella, the prevalence was very similar to
Canada (46.8% compared to 50% in Canada) but higher than Ireland where the prevalence
was 27%. A study in the Netherlands reported lower prevalences of Salmonella and
Campylobacter flock prevalence. However, specific interventions were in place to control
these two pathogens.
An on-farm biosecurity/food safety survey was also conducted to investigate the uptake and
implementation of on-farm biosecurity measures to control Salmonella and Campylobacter
infection of flocks. Forty-eight on-farm surveys were completed, 38 in Western Australia
and 10 in Tasmania. The farms surveyed account for approximately 90% of broiler meat
produced in Western Australia and Tasmania. The results of this survey will be presented in a
separate report.
Prior to processing
To determine the prevalence of Salmonella and Campylobacter in poultry entering processing
facilities, caecal3 contents of poultry were collected for testing. The concentration of
Salmonella and Campylobacter in the caeca was also quantified for positive samples. This
quantification can give an indication of the frequency of „high-shedders‟ (i.e. percentage of
birds with high concentrations of the pathogens in their caeca).
1 Chicks are placed in the broiler grow-out farm at the age of approximately 1 day and remain on the farm until
they reach slaughter weight, which is usually between 30 and 60 days. At this point depopulation occurs
whereby all, or a proportion, of birds are removed and transported to the slaughter facility for processing. 2 The two samples that were positive for Sofia were also positive for Give. 3 In poultry, the caeca are two blind-ended tubes at the junction of the small and large intestines, where
undigested food particles are subjected to microbial breakdown.

6
South Australia and Western Australia participated in this component of the survey, with a
total of 636 caecal samples collected. Overall, 12.7% of samples tested positive for
Salmonella, with 7.5% positive for non-Sofia serovars and 5.2% for Sofia. Multiple
Salmonella serovars were isolated from some samples. The mean concentration of
Salmonella was low, 1.02 log10 MPN/gm. For Campylobacter, the average prevalence was
84% and the mean concentration was 6.87 log10 cfu/gm.
A survey in Iceland tested the incoming flock prevalence of broilers for Campylobacter by
testing the contents of the caeca just prior to slaughter. The flock prevalence was low (15%),
which is comparable to that of other northern European countries. Additionally, Iceland has
an official policy of testing flocks prior to slaughter and requiring the meat derived from
Campylobacter positive flocks to be sold frozen, which motivates the industry to lower the
flock prevalence.
Post primary processing
To determine the prevalence and concentration of Salmonella and Campylobacter, post
processing, rinse samples from whole carcasses were taken from processing plants, following
the chilling step.
A total of 1112 carcass rinse samples were collected from four states (NSW, Qld, SA and
WA). For Salmonella, 36.7% of carcass rinse samples were positive with 22.1% positive for
non-Sofia serovars and 15.1% for Sofia. Multiple Salmonella serovars were isolated from
some samples. The Salmonella concentration on positive samples was on average -1.99 log10
MPN/cm2 or about 1 per 100cm
2. For Campylobacter, 84.3% of carcass rinse samples were
positive. In Western Australia and New South Wales, the Campylobacter concentration of
positive samples was, on average, 0.70 log10 cfu/cm2 or ~500 cfu/100cm
2. In Queensland,
where only counts >100 cfu/ml were quantified, the mean concentration was 1.45 log10
cfu/cm2 or ~2818 cfu/100cm
2.
The results of this survey were compared with similar baseline surveys. In a study conducted
in Canada, the prevalence of both Salmonella (37.5%) and Campylobacter (75%) were
similar to the results from this survey (Salmonella 36.7% and Campylobacter, 84.3%).
Campylobacter results were also similar to a baseline study conducted in the US in 1994-
1995, where Campylobacter prevalence was reported at 88.2%. The prevalence of
Campylobacter from this survey was higher than a baseline level of 70%, estimated for the
UK in 1995, based on the available surveillance data. The Salmonella results from this
survey were higher than those found in another baseline study conducted in the United States
(20%).
The Salmonella and Campylobacter results from this survey are higher than those found in
studies conducted after specific interventions strategies have been implemented. If the results
are compared with New Zealand for Campylobacter, Australia has a much higher prevalence
(NZ prevalence was 30.6% in second quarter of 2008) and higher concentrations. New
Zealand has successfully lowered both the prevalence and concentrations of Campylobacter
in poultry since implementing a Campylobacter reduction strategy in 2006 and setting poultry
processing targets in 2008.

7
Of the 1112 rinse samples taken, 790 were tested for Total Viable Counts (TVC) and
Escherichia coli. Unsatisfactory results can indicate that a step in the poultry processing is
not performing as expected and corrective action may need to be taken. For TVC, almost
100% of the samples were considered excellent or good and none were marginal or poor,
according to the performance criteria. For E. coli, 94.5% of samples were classified as
excellent or good, and the remainder were all acceptable. In light of the results for
Salmonella and Campylobacter, the testing of these indicator organisms in poultry at the end
of the processing is not a good indicator of the likelihood of the poultry being contaminated
with these two pathogens.
This survey has provided baseline data on the prevalence and levels of Salmonella and
Campylobacter on chicken meat at both the primary production and primary processing
stages of the chicken meat supply chain. The results from farms in Western Australia,
indicate that poultry are being infected with Salmonella and Campylobacter on farm. The
results from Western Australia and South Australia indicate that a large percentage of the live
poultry entering the processing plants are infected with Campylobacter (84%) and to a much
lesser extent, Salmonella (12.7%). At the end of primary processing, the prevalence of
poultry contaminated with Campylobacter remained relatively constant (84%). However,
there was an increase in the prevalence of Salmonella (36.7% total Salmonella, of which
22.1% were positive for non-Sofia serovars).
The results from the samples taken at the end of primary processing are similar to the results
from the retail baseline microbiological survey carried out in 2005/2006 in South Australia
and New South Wales. The results from this survey showed that 43.3% of chicken samples
tested were positive for Salmonella (12.8% being non-Sofia) and approximately 90% were
positive for Campylobacter coli/jejuni (Pointon et al, 2008). The mean counts were also
similar to the mean counts found in this survey4. This indicates that the prevalence and levels
of Salmonella and Campylobacter on chicken carcasses post processing, is similar to that
found on the fresh chicken purchased by consumers.
When compared with results from similar baseline surveys overseas, the results from this
survey were generally similar to those conducted in the US, UK and Canada. With the
exception of the UK, countries that have put in place specific intervention strategies to lower
Salmonella and Campylobacter in poultry, have achieved significant reductions.
2. Introduction
As part of its through-chain approach to food regulation, FSANZ is developing a Primary
Production and Processing Standard for Poultry Meat (Standard for Poultry Meat). This
Standard is being developed in consultation with a Standard Development Committee,
comprising representatives from the poultry industry, government agencies and a consumer
representative.
4 In the retail survey the mean counts were -1.42 to -1.6 log MPN/cm2 for Salmonella and 0.78 to 0.87 log
cfu/cm2 for Campylobacter.

8
A scientific risk assessment of the public health and safety of poultry meat in Australia was
carried out as the first step in the development of the Standard for Poultry Meat. This
scientific assessment concluded that the main microbiological hazards associated with poultry
meat are contamination with Salmonella and Campylobacter and that the prevalence and
concentration of contamination by Salmonella and Campylobacter species in poultry were
affected by a range of factors at the primary production, processing, retail and consumer
stages of the poultry meat supply chain. The scientific assessment also concluded that there
was reasonable evidence to indicate poultry was a vehicle for a proportion of salmonellosis
and Campylobacteriosis cases in Australia (FSANZ, 2005).
Salmonellosis is a notifiable disease in Australia. Campylobacteriosis is also a notifiable
disease in all states and territories except New South Wales, where it is only notifiable in the
case of an outbreak. Campylobacteriosis is the most commonly notified food-borne illness in
Australia and it is estimated that approximately 30% of cases (or 83,100 cases per year5)
could be attributed to contaminated poultry meat (Stafford et al, 2007). Salmonellosis is the
second most frequently notified illness at 9,484 notifications or 45 cases per 100,000
population (The OzFoodNet Working Group, 2008).
Based on the outcomes of the scientific assessment, risk management strategies have been
proposed to address the identified hazards. In general terms, the draft Standard for Poultry
Meat proposes that poultry primary producers and processors identify and manage the
hazards in their businesses. The overall objective is that poultry businesses put in place
strategies to reduce the likelihood of illness occurring from the consumption of poultry and in
particular, reduce the prevalence and concentration of Salmonella and Campylobacter in
poultry meat.
The Standard for Poultry Meat is expected to be finalised in 2010 and businesses will then
have two years to comply with the new Standard. It will apply to all businesses involved in
the growing or processing of poultry intended for sale for human consumption.
FSANZ is committed to undertaking a scientific and technical evaluation of the impact of
implementing new food regulatory measures. The aim of the evaluation is to assess the
effectiveness and appropriateness of food regulatory measures by assessing the long term
impact on stakeholders and to provide evidence to inform future decisions on food regulation.
As the Standard for Poultry Meat is a proposed new regulatory measure, FSANZ will be
evaluating its impact. To evaluate the impact of a new regulatory measure, benchmarking
data must be collected before the measure is introduced so that a comparison can be made
when the regulatory measure is in place. As part of the FSANZ 2004-2008 Evaluation
Strategy, FSANZ commissioned benchmark research on the poultry meat industry. This
research collected data on awareness, knowledge and behaviour of poultry meat businesses,
government officers and consumers in relation to food safety issues (Colmar Brunton Social
Research, 2005).
5 This is 30% of the estimated 277,000 total cases of campylobacteriosis that occurs each year in Australia (Hall
et al, 2005).

9
Complementary to this research, a retail baseline microbiological survey was carried out in
2005-06 jointly by South Australia (PIRSA/SARDI6), New South Wales (NSWFA), the
Australian Government Department of Health and Ageing and FSANZ to estimate the
prevalence and concentration of Salmonella and Campylobacter contamination of chicken
products available at retail in New South Wales and South Australia. The results from this
survey showed that 43.3% of chicken samples tested were positive for Salmonella (12.8%
being non-Sofia) and approximately 90% were positive for Campylobacter coli/jejuni
(Pointon et al, 2008).
During the development of the Standard for Poultry Meat, concerns have been raised about
the lack of data on the current microbiological status of poultry meat along the supply chain,
particularly chicken, as chicken is by far the main type of poultry meat consumed in
Australia. While the retail survey provides data on the microbiological status of chicken at
the end of the supply chain, only limited data is available at other parts of the chain. If data
can be obtained on the microbiological status of chicken along the entire supply chain, this
will assist in:
assessing the effectiveness of the proposed regulatory measures in the Standard for
Poultry Meat for the different parts of this chain
identifying stages along the supply chain that most impact on Salmonella and
Campylobacter prevalence and concentration.
A proposal to obtain baseline data on the prevalence and concentration of Salmonella and
Campylobacter along the poultry meat supply chain was considered at the Implementation
Subcommittee (ISC) Coordinated Food Survey Plan Workshop on 6 April 2006. At this
meeting, it was agreed that the proposal should be progressed through the ISC Coordinated
Food Survey Plan and a project team formed to assist with the proposed survey.
The project team recommended that the prevalence and (where appropriate) concentration of
Campylobacter and Salmonella be tested on-farm, prior to processing and at the end of
processing. Four states participated in this part of the survey (WA, NSW, Qld and SA). An
on-farm survey was also recommended to investigate the uptake and implementation of on-
farm biosecurity measures to control Salmonella and Campylobacter infection of flocks.
This was carried out by WA and Tas. The two territories (ACT and NT) did not participate
as their jurisdictions do not have poultry meat farms or processors.
This report presents and discusses the results from the microbiological testing of
Campylobacter and Salmonella on-farm, prior to processing and at the end of processing.
The results from the on-farm survey will be presented in a separate report.
6 Department of Primary Industries and Resources South Australia and the South Australian Research and
Development Institute
10
3. Survey objective
This survey aimed to collect baseline data on the prevalence and concentration of Salmonella
and Campylobacter species on poultry and poultry meat at various stages along the supply
chain prior to the implementation of the Standard for Poultry Meat. Comparison of results
from this baseline survey with those from a follow-up survey, to be undertaken after the
Standard for Poultry Meat has been fully implemented, will be used to assess the
effectiveness of the Standard for Poultry Meat.
The main objectives of the baseline survey were:
1) to establish the flock prevalence of Salmonella and Campylobacter on poultry by
collecting samples on-farm
2) to investigate the uptake and implementation of on-farm biosecurity measures to control
Salmonella and Campylobacter infection of flocks
3) to establish the prevalence and concentration of Salmonella and Campylobacter infected
poultry entering primary processing
4) to establish the prevalence and concentration of Salmonella and Campylobacter on
poultry carcasses by collecting samples at the end of primary processing.
4. ISC Coordinated Food Survey
On 30 October 2003, the Food Regulation Standing Committee‟s Implementation
Subcommittee (ISC) agreed to the development of a „Coordinated Food Survey Plan‟ for the
Australian jurisdictions, food regulatory partners and New Zealand. This was in recognition
that there were significant advantages in implementing agreed national survey priorities in a
prospective and coordinated manner. A national coordinated survey to obtain baseline data
on the prevalence and concentration of Salmonella and Campylobacter along the poultry
meat supply chain was agreed to by ISC in April 2006.
To progress the survey, a project team was formed with representatives from the participating
jurisdictions, the Australian Government Department of Health and Ageing, the South
Australian Research and Development Institute (SARDI) and FSANZ. FSANZ was
nominated as the lead agency and was responsible for coordinating the baseline survey. The
participating jurisdictions were:
New South Wales Food Authority
Department of Health Western Australia
Safe Food Production Queensland
Department of Primary Industries and Water Tasmania
Department of Primary Industries and Resources South Australia.
As well as participating as a member of the survey team, SARDI was contracted to undertake
statistical analysis and assist with report preparation.

11
The Poultry Survey Project Team was responsible for developing a survey proposal and for
implementing this proposal. The participating jurisdictions, in accordance with the survey
proposal, collected and tested samples and conducted on-farm surveys. The Project Team
then assisted with the compilation and analysis of the results and the writing of this report.
The Poultry Survey Project Team communicated throughout the survey period with the
poultry industry, via the FSANZ Standard Development Committee on Poultry Meat. This
survey received excellent cooperation and assistance from the poultry industry. The Poultry
Survey Project Team is grateful to the poultry industry for providing access for relevant
government officers to collect samples from poultry farms and processing plants. The Project
Team would also like to specifically thank the poultry farms that participated in the on-farm
biosecurity/food safety survey.
5. Resources spent on the survey
This survey was financed from contributions from the participating jurisdictions (~$224,000),
DoHA ($110,000) and FSANZ ($66,000). The money from DoHA and FSANZ was
distributed to the participating jurisdictions to assist with the financing of the survey. Apart
from providing a significant financial contribution, the jurisdictions also contributed many
hours of staff time. In particular, the Department of Health, Western Australia‟s contribution
was large as it was the only state to participate in all three components of the survey.
Microbiological analysis of the samples was conducted by the state laboratories. The poultry
industry also provided personnel time to assist with the survey. The total cost of the survey,
when considering cash inputs, government and industry personnel time and other expenses
such as teleconference and travel costs was approximately $500 000. This information may
assist future planning of similar national surveys for Campylobacter and Salmonella.
6. Survey design and methodology
The survey was designed to measure both the prevalence and where appropriate,
concentration, of Salmonella and Campylobacter at three points along the poultry supply
chain - on farm, just prior to processing and at the end of primary processing. An on-farm
biosecurity/food safety survey was also developed to investigate the uptake and
implementation of on-farm biosecurity measures to control Salmonella and Campylobacter
infection of flocks.
All microbiological samples were tested initially for absence/presence of Campylobacter and
Salmonella, within the limit of detection. Positive caecal and carcass rinse samples were
enumerated. Positive Salmonella samples were typed to determine the serovars. Results are
reported for „total Salmonella‟ and „Salmonella non-Sofia serovars‟. All isolated Salmonella
serovars are also listed in a table at Attachment 4. Campylobacter positives were not typed
and therefore all results are for total Campylobacter spp.
All samples for this survey were collected from the chicken meat industry. While the
Standard for Poultry Meat defines poultry as chicken, turkey, duck, squab (pigeons), geese,
pheasants, quail, guinea fowl and other avian species (except ratites), chicken meat is

12
consumed in far greater quantities than other poultry. Per capita consumption of chicken
meat was estimated to have reached 37 kg/person in 2007/2008, compared to other poultry
being 2.2 kg/person (ACMF, 2009).
Officers from the jurisdictions that participated in this survey were requested to comply with
the biosecurity measures on the farms being visited.
Each participating jurisdiction managed the way in which samples were collected over time
to suit the constraints of the participating laboratory. In South Australia samples were
collected from March – May 2007, in Western Australia, samples were collected from
October 2007 until March 2008, in New South Wales from March – July 2008 and in
Queensland from April – August 2008.
6.1 On-farm
6.1.1 Faecal samples
Western Australia was the only state to participate in this component of the survey. Fresh
faecal droppings were collected from farms just before the first pick-up.7 The droppings
were collected before the first pick-up so that the results could be compared across the sheds.
To determine the numbers of farms that needed to be tested, a prevalence estimate of 50%8
for both Salmonella and Campylobacter was used. The minimum number of farms needed to
be sampled to detect a prevalence of this level was then determined. Two hundred and thirty
three samples were collected from thirty-nine farms.
Samples were pooled to obtain at least 250gm. Information was recorded at the time of
collection in accordance with Form A: Sample Collection On-Farm (Attachment 1). Samples
were analysed to determine prevalence of Campylobacter and Salmonella on farm.
Upon receipt of the samples at the laboratory, samples were thoroughly mixed and analysed
in accordance with the following methods.
Campylobacter
Faecal droppings were cultured directly onto agar media plates as described in AS 5013.6 –
2004 “Food Microbiology Method 6: Examination for specific organisms – Campylobacter’
Salmonella
Twenty-five grams of the thoroughly mixed faecal droppings were cultured as per “AS
5013.10 - 2004: Food microbiology - Microbiology of food and animal feeding stuffs -
Horizontal method for the detection of Salmonella spp”.
For further detail on the methods used for the confirmation of Salmonella and Campylobacter,
see Attachment 2: Method of analysis for Salmonella and Campylobacter.
7 Chicks are placed in the broiler grow-out farm at the age of approximately 1 day and remain on the farm until
they reach slaughter weight, which is usually between 30 and 60 days. At this point depopulation occurs
whereby all, or a proportion, of birds are removed and transported to the slaughter facility for processing. 8 This is a worst case scenario used to calculate the number of samples required to statistically compare results.

13
6.1.2 Survey on biosecurity and food safety practices
A survey was also conducted to investigate the uptake and implementation of on-farm
biosecurity measures to control Salmonella and Campylobacter infection of flocks. The
participating farms were asked to complete a specifically designed questionnaire.
Western Australia and Tasmania participated in this component of the survey. Forty-eight
on-farm surveys were completed; 38 in Western Australia and 10 in Tasmania. In Tasmania,
the 10 farms surveyed produce approximately 90% of broiler meat produced in Tasmania.
Similarly in Western Australia, the 38 farms surveyed represent approximately 90% of the
broiler meat industry in Western Australia. As this was a qualitative survey with no
microbiological component, the results of the survey will be presented in a separate report.
6.2 Prior to processing
To determine the prevalence of Salmonella and Campylobacter in poultry entering processing
facilities, the caecal contents of poultry were randomly collected for testing. In poultry, the
caeca are two blind-ended tubes at the junction of the small and large intestines, where
undigested food particles are subjected to microbial breakdown. In chicken, the primary site
of colonisation of Campylobacter is the lower gastrointestinal tract, especially the caeca
(Beery et al, 1988).
South Australia and Western Australia participated in this component of the survey. A
proportional sampling approach was utilised within each state based on throughput at each
plant and sample numbers based on the expected prevalence of Salmonella and
Campylobacter in that state. Information was obtained about each state‟s poultry industry,
including the number of major processors, the estimated throughput at each of these
processors and an estimate of the Salmonella and Campylobacter prevalence. A total of 636
caeca samples were collected; 376 from Western Australia and 260 from South Australia.
The concentration of Salmonella and Campylobacter in the caeca was also quantified for
positive samples. Caecal samples were collected at the evisceration step in the poultry
processing plants and relevant information recorded in Form B: Sample collection at
processing facilities (Attachment 3).
The procedure used to collect the caeca was as follows:
1. After viscera were removed from the carcass, intact viscera were selected using clean
gloves.
2. Caeca from intestines at junction with hindgut were removed.
3. Caeca was placed into a clean plastic bag, sealed and labelled.
4. Sample was transported chilled to the laboratory.
The procedure for preparing the caeca samples at the laboratory was as follows:
1. Upon receipt of the caeca into the laboratory, the contents of the caeca were milked into a
suitable sterile container and the mass recorded.

14
2. Half of the contents of the container were placed into another sterile container to provide
two aliquots for testing, one for Campylobacter and one for Salmonella.
Preparation of caeca samples for Campylobacter testing
a) Culture the caecal content directly onto plates of the agar media described in Australian
Standard AS 5013.6 – 2004 “Food Microbiology Method 6: Examination for specific
organisms – Campylobacter’.
b) Perform serial dilutions on the caecal content as per AS1766.1.2 - 1991 Food
Microbiology – “General procedures and techniques – preparation of dilutions” and
spread onto one of the types of plates described in AS 5013.6 – 2004 “Food Microbiology
Method 6: Examination for specific organisms – Campylobacter” as per AS1766.1.4-
1991 “Food Microbiology – General procedures and techniques – Colony counts –surface
spread method”.
c) Incubate the plates as in AS 5013.6 – 2004 “Food Microbiology Method 6: Examination
for specific organisms – Campylobacter” and proceed with confirmation of typical
colonies as they are identified.
d) Using the dilution and colony confirmation information calculate the concentration of
Campylobacter per gram of caecal content.
Preparation of caeca samples for Salmonella testing
a) Examine for Salmonella as per the “AS 5013.10-2004: Food microbiology - Microbiology
of food and animal feeding stuffs - Horizontal method for the detection of Salmonella
spp”.
b) After making the initial dilution in Buffered Peptone Water, remove sufficient amount of
this dilution to carry out a 3 tube Most Probable Number (MPN) enumeration as
described in Attachment 2: Method of analysis for Salmonella and Campylobacter.
For further detail on the methods used for the confirmation and quantification of Salmonella
and Campylobacter, see Attachment 2: Method of analysis for Salmonella and
Campylobacter.
6.3 Post processing
To determine the prevalence and concentration of Salmonella and Campylobacter, post
processing, rinse samples from chicken carcasses were taken from processing plants,
following the chilling step. Four jurisdictions participated in this component of the survey –
WA, SA NSW and Qld. A proportional sampling approach was utilised within each state
based on throughput at each plant and sample numbers based on the expected prevalence of
Salmonella and Campylobacter in that state. A total of 1112 carcass rinse samples were
collected - 375 from Western Australia, 341 from South Australia, 246 from New South
Wales and 150 from Queensland.

15
Rinse samples were also tested for Total Viable Counts (TVC) and Escherichia coli.
The procedure for collecting the rinse samples was as follows.
1. Samples were collected at the processing facility immediately after the active chilling
process, with the weight (in grams) recorded either at the facility or at the laboratory.
2. Samples were placed into a sterile plastic bag and the temperature recorded.
3. Relevant information was recorded in Form B: Sample collection at processing
facilities (Attachment 3).
4. Samples were transported to the laboratory chilled.
5. On arrival at the laboratory, temperature of samples was measured.
Samples were prepared based on the rinse technique in the Australian Standard AS
5013.2004: Preparation of test samples for microbiological examination – Poultry and
poultry products,9 either at the processing facility or at the receiving laboratory.
The procedure used was:
1. Add 500 ml of 0.1% buffered peptone water to the carcass in plastic bag.
2. Remove approximately half the air from the bag by massaging around the sample from
the closed end to the open end. Tie the open end.
3. Shake and massage the sample vigorously for 2 minutes ensuring through rinsing of the
abdominal cavity.
4. Release the rinse fluid into a sample container by cutting of the corner of the bag with
scissors and allowing the fluid to drain into the container. This rinse fluid is the first
dilution for the sample analysis.
Rinse samples were tested for:
Salmonella using AS 5013.10-2004: Food microbiology – Microbiology of food and
animal feeding stuffs – Horizontal method for the detection of Salmonella spp.
Campylobacter using AS 5013.6 – 2004 “Food Microbiology Method 6: Examination for
specific organisms – Campylobacter’.
Total Viable Count by:
1. Preparing 1:10 dilutions in 0.1% peptone diluent;
2. Inoculating 1 ml from each dilution onto Petrifilm Aerobic Plate Count Plates (3M);
3. Incubating at 25 C for 4 days; and
4. Counting and identifying colonies as per manufacturer‟s instructions.
E. coli by:
1. Preparing 1:10 dilutions in 0.1% peptone diluent;
2. Inoculating 1 ml from each dilution onto Petrifilm E. coli Plate Count Plates (3M);
3. Incubating at 37 C for 2 days; and
9 In NSW the AS1766 series was used (AS1766.0-1995 Food Microbiology – General Introduction and List of
Methods).

16
4. Counting and identifying colonies as per manufacturers‟ instructions.
For further detail on the methods used for the confirmation and quantification of Salmonella
and Campylobacter, see Attachment 2: Method of analysis for Salmonella and
Campylobacter.
7. Method of Analysis
The pre-processing (ceacal contents) data for Campylobacter and Salmonella counts were
converted to log10 cfu/g.
The post processing (rinse) data for TVC, E. coli and Campylobacter counts were converted
to log10 cfu/cm2 and Salmonella was converted to log10 MPN/cm
2, according to the formulae
for carcasses in the Australian Standard, AS 5013.20–2004 Method 20: Preparation of test
samples for microbiological examination-Poultry and poultry products.
For the carcass rinse results for Campylobacter, the results were also calculated on a per
carcass basis to enable comparisons with overseas data. To enable the conversions, the
carcasses were all assumed to have an average weight of 1.78 kg, which was the average
dressed weight of meat chickens at the end of primary processing in 2007/0810
(ACMF,
2009). The calculations were performed multiplying the Campylobacter concentration (cfu/g)
by the average carcass weight of 1780 g. The result (cfu/carcass) was then converted to the
log10 scale.
Mean concentrations and standard errors are presented in summary tables for each state.
Standard errors are calculated from pooled variance estimates. Approximate standard
deviations could be obtained by multiplying the standard error by the square root of the
number of positives.
A censored regression (Helsel, 2005) was performed for Campylobacter and Salmonella
counts (per square centimetre) to obtain censored means for each state. By censored we refer
to data where the actual amount of Salmonella (or Campylobacter) is undetected or unknown
in positive samples because it is less or greater than the limit of detection. Consequently, all
Campylobacter (or Salmonella) samples were assumed to be positive, that is, samples where
Campylobacter (or Salmonella) were not detected were still assumed to be positive, but with
concentrations below the lower limit of detection.
10 Data on the chicken meat industry is compiled by the Australian Bureau of Agricultural and Resources
Economics and a summary is provided on the Australian Chicken Meat Federation website,
www.chicken.org.au under „Industry Facts and Figures‟.

17
8. Results
Results are presented below for the three components of the survey - on farm (Section 8.1),
just prior to processing (Section 8.2) and at the end of primary processing (Section 8.3).
Samples that were positive for Salmonella were typed to determine the serovars. The results
of this testing are presented in Section 8.4.
8.1 On-farm (faecal samples)
Pooled faecal samples were collected from 39 farms in Western Australia as an indicator of
flock prevalence on farm from October 2007 until March 2008. Samples were collected from
233 individual sheds on the farms. Each farm had between four and twelve sheds sampled
and generally each shed had between 20 to 30 thousand chickens per shed. All samples were
taken before first pick up and pooled to collect 250gm. Samples were taken before the first
pick up so that all the results could be compared.
Additional information was collected at the time of sampling in relation to the age of the
flock, whether the flock had been depopulated prior to sample collection11
and what water
source was used (see Attachment 1). This information has not been included as it was
incomplete.
Table 1 summarises the results of the testing. Samples that were positive for Salmonella
were typed to determine the serovars, and the results have been grouped into those that were
Sofia and those that were non-Sofia. Sofia is considered to have low virulence to humans
(i.e. rarely implicated in cases of human salmonellosis).
Table 1: Summary statistics for total Salmonella spp. flock/shed prevalence and
Campylobacter spp. flock/shed prevalence for faecal samples in WA
Pathogen # +’ve samples
(n=233)
% 95%CI # +’ve farms
(n=39)
% 95% CI
Salmonella 109 46.8 (40.2, 53.4) 33 84.6 (69.5, 94.1)
Non-Sofia 109 46.8 (40.2, 53.4) 33 84.6 (69.5, 94.1)
Sofia 2 0.9 (0.1, 3.1) 1
2.6 (0, 13.5)
Campylobacter 150 64.4 (57.9,70.5) 28 71.8 (55.1,85)
Key Observations
Of the 233 sheds tested, 46.8% were positive for Salmonella, comprising of 46.8%
positive for non-Sofia serovars and 0.9% of samples positive for Sofia. The two samples
that were positive for Sofia were also positive for Give (see Attachment 4 for results of
serovar testing).
64.4% of the sheds were positive for Campylobacter.
In 21 sheds (9%), Salmonella and Campylobacter were not detected.
Of the 39 farms sampled, 84.6% had at least one shed positive for Salmonella and 71.8%
had at least one shed positive for Campylobacter.
11 The method required that faecal droppings be collected from sheds just before the first pick up for
consistency.

18
In some farms Salmonella or Campylobacter were not detected (15.4% and 28%,
respectively). However, there were no farms where neither Salmonella and
Campylobacter were detected, with at least one shed testing positive for Salmonella or
Campylobacter on every farm.
8.2 Prior to processing (caecal samples)
To determine the prevalence of Salmonella and Campylobacter in poultry entering processing
facilities, the caecal contents of poultry were collected for testing. The caeca were isolated
from the viscera, following the evisceration step during processing.
South Australia and Western Australia participated in this component of the survey with a
total of 636 caecal samples collected. The concentrations of Salmonella and Campylobacter
in the caeca were also quantified for positive samples. This quantification can give an
indication of the frequency of „high-shedders‟ (i.e. percentage of birds with high
concentrations of the pathogens in their caeca).
In South Australia samples were collected from March-May 2007 and in Western Australia
from October 2007 until March 2008.
Additional information was collected at the time of sampling in relation to crate time (how
long poultry had been held in crates), the age of the flock, number of previous pick-ups from
shed and last time poultry was fed (see Attachment 3).
Where recorded, crate time varied from 5 to 22 hours, the average age of the flocks tested
was 31 days, with a range of 26-44 days. The majority of flocks tested had come from sheds
that had not previously been depopulated. The last feed time varied from 4 to 10 hours.
8.2.1 Salmonella results (caecal samples)
Table 2a: Summary statistics for total Salmonella spp. prevalence and counts by State
for caecal contents State Sample
No
Total Salmonella spp.
#
+’ve
% 95%CI mean log*
(SE) MPN/gm
Censored mean log
(SE) MPN/gm
SA 260 66 25.4 (20.2, 31.1) 0.92 (0.09) 0.008 (0.19)
WA 376 15 4.0 (2.2, 6.5) 1.56 (0.21) 1.44 (0.38)
SA/WA 636 81 12.7 (10.2, 15.6) 1.02 (0.09) 0.14 (0.18)
* Mean and standard errors were calculated for positive samples only

19
Table 2b: Summary statistics for Salmonella (non-Sofia and Sofia) serovar prevalence
and counts by state for caecal contents State Sample No Non-Sofia Sofia
#
+’ve
% 95%CI mean log*
(SE)/gm
#
+’
ve
% 95%CI mean log*
(SE)/gm
SA 260 33 12.7 (8.9, 17.4) 1.01 (0.14) 33 12.7 (8.9, 17.4) 0.85 (0.11)
WA 376 15 4.0 (2.0, 6.5) 1.56 (0.24) 0 0 (0, 0.9) NA
SA/WA 636 48 7.5 (5.6, 9.9) 1.16 (0.13) 33 5.2 (3.6, 7.2) 0.85 (0.11) * Mean and standard errors were calculated for positive samples only
Key Observations
12.7% of caecal samples were positive for Salmonella comprising of 7.5% positive for
non-Sofia serovars and 5.2% positive for Sofia. Some samples had multiple serovars, see
Section 8.4.
Salmonella prevalence was 4% in WA and 25.4% in SA.
The mean concentration of positive samples for the participating states was 1.02 log10
MPN/gm and 0.14 log10 MPN/gm using the censored approach.
The mean concentration of positive Salmonella samples for the participating states was
0.92 log10 MPN/gm in SA and 1.56 log10 MPN/gm in WA. The higher mean
concentration for WA is most likely a consequence of many of the positive SA samples
having counts below the limit of detection (i.e. <3 MPN/gm).
Figure 1: Distribution of total Salmonella spp counts from caecal contents for WA and
SA
log 10 Salmonella (MPN/gm)
0
10
20
30
40
1 2 3
Perc
en
tag
e o
f p
osit
ive s
am
ple
s

20
8.2.2 Campylobacter results (caecal samples)
Table 3: Summary statistics for Campylobacter prevalence and counts by State from
caecal contents State Sample
No
Campylobacter
#
+’ve
% 95%CI mean log*
(SE) cfu/gm
Censored mean log
(SE) cfu/gm
SA 260 217 83.5 (78.4, 87.8) 7.26 (0.08) 6.21 (0.16)
WA 376 317 84.3 (80.2, 87.8) 6.60 (0.07) 5.70 (0.13)
SA/WA 636 534 84.0 (80.9, 86.7) 6.87 (0.06) 5.91 (0.10) * Mean and standard errors were calculated for positive samples only
Key Observations
84% of caecal samples were positive for Campylobacter.
The prevalence of Campylobacter was similar in both states, 83.5% in SA and 84.3% in
WA.
The mean concentration of positive samples for the participating states was 6.87 log10
cfu/gm and 5.91 log10 cfu/gm after adjusting for samples below the limit of detection.
Campylobacter (positive) counts were somewhat higher in SA compared to WA (mean
difference 0.66).
Figure 2: Distribution of Campylobacter counts from caecal contents for WA and SA
log 10 Campylobacter (cfu/gm)
Perc
en
tag
e o
f p
osit
ive s
am
ple
s
0
5
10
15
20
2 4 6 8

21
8.3 Post processing (rinse samples)
In total, 1112 carcass rinse samples were collected from four states (NSW, QLD, SA and
WA). Samples were collected at the end of processing, after the chilling step. Additional
information was collected at the time of sampling in relation to the type of chilling system
and the pH and chlorine concentration in the spin chiller at the time of sampling (see
Attachment 3). Where recorded, the pH and chlorine concentrations were within acceptable
limits - ph 5.0-7.5 and free chlorine 3.0-5.0ppm.
In some cases, the number of samples initially planned was not feasible for that state and so a
reduced number of samples were collected or not all samples were tested. This was
particularly the case for the testing of the samples for E. coli and TVC. The emphasis was
placed on testing for Salmonella and Campylobacter. However, enough samples were
collected and tested to have a high level of confidence in the data.
8.3.1 Salmonella results (post processing)
Table 4a: Summary statistics for total Salmonella spp. prevalence and counts from
carcass rinse post spin chill
State Sample
No
Total Salmonella spp.
#
+’ve
% 95%CI mean log* (SE)
MPN/cm2
Censored mean log (SE)
MPN/cm2
NSW 246 119 48.4 (42.0, 54.8) -1.90 (0.03) -2.69 (0.08)
Qld 150 66 44.0 (35.9, 52.3) -1.98 (0.04) -3.24 (0.15)
SA 341 176 51.6 (46.2, 57.0) -2.05 (0.03) -2.89 (0.08)
WA 375 47 12.5 (9.4, 16.3) -2.03 (0.05) -3.48 (0.13)
National 1112 408 36.7 (33.9, 39.6) -1.99 (0.02) -3.04 (0.08) * Mean and standard errors were calculated for positive samples only from participating states
Table 4b: Summary statistics for Salmonella (non-Sofia and Sofia) serovar prevalence
and counts by State from carcass rinse post spin chill State Sample
No
Non-Sofia Sofia
#
+’ve
% 95%CI mean log*
(SE)/cm2
#
+’ve
% 95%CI mean
log*
(SE)/cm2
NSW 246 52 21.1 (16.2, 26.8) -1.85 (0.05) 70 28.5 (22.9,34.5) -1.93
(0.04)
Qld 150 10 6.7 (3.2, 11.9) -1.97 (0.11) 56 37.3 (29.6, 45.6) -1.98 (0.05)
SA 341 137 40.2 (34.9, 45.6) -2.04 (0.03) 42 12.3 (9.0, 16.3) -2.10
(0.06)
WA 375 47 12.5 (9.4, 16.3) -2.03 (0.05) 0 0 (0, 1.0) NA
National 1112 246 22.1 (19.7, 24.7) -1.99 (0.02) 168 15.1 (13.1, 17.3) -1.99
(0.03) * Mean and standard errors were calculated for positive samples only from participating states

22
Key Observations
36.7% of rinse samples were positive for Salmonella comprised of 22.1% positive for
non-Sofia Salmonella serovars and 15.1% positive for Sofia. Some samples had multiple
serovars, see Section 7.4.
The mean concentration for positive samples from the participating states was -1.99 log10
MPN/cm2.
The prevalence of Salmonella ranged from 12.5% in WA to 51.6% in SA.
Mean log concentrations of positive samples of Salmonella from the participating states
ranged from -2.05 log10 MPN/cm2 in SA to -1.90 log10 MPN/cm
2 in NSW.
Figure 3: Distribution of total Salmonella spp. counts (positive samples only) from
chicken rinse post spin chill across participating states (NSW, Qld, SA, WA)
8.3.2 Campylobacter results (post processing)
Table 5: Summary statistics for Campylobacter prevalence and counts from chicken
rinse post spin chill
State Sample
No
Campylobacter
# +’ve % 95%CI mean log*
(SE) cfu/cm2
Censored
mean log (SE)
cfu/cm2
Mean log* (SE)
cfu/1.78kg bird
NSW 246 234 95.1 (91.6, 97.5) 0.73 (0.03) 0.48 (0.06) 4.07 (0.05)
Qld+ 150 96 64.0 (55.8, 71.7) 1.45 (0.05) 0.39 (0.11) 4.79 (0.14)
SA 333 269 80.8 (76.1, 84.9) 0.66 (0.03) 0.20 (0.05) 4.00 (0.05)
WA 375 332 88.5 (84.9, 91.6) 0.50 (0.03) -0.05 (0.06) 3.84 (0.05)
National 1104 931 84.3 (82.0, 86.4) 0.70 (0.02) 0.18 (0.04) 4.04 (0.03)
* Mean and standard errors were calculated for positive samples only from participating states + The limit of detection in Qld was 100 cfu/ml for the quantitative test. In other states the limit of
detection was 10 cfu/ml.
log10Salmonella (MPN/cm2)
Perc
en
tag
e o
f p
osit
ive s
am
ple
s
0
20
40
60
-2 -1 0 1

23
Key observations
84.3% of rinse samples were positive for Campylobacter.
The prevalence of Campylobacter ranged from 64% in Qld to 95.1% in NSW.
The mean concentration of positive samples from the participating states was 0.70 log10
cfu/cm2 or 4.04 log10 cfu/carcass.
Qld Campylobacter counts are on average higher than other states as they only detected
counts >100 cfu/ml.
Mean log concentrations for positive Campylobacter samples from the participating states
ranged from 0.50 log10 cfu/cm2 (3.84 log10 cfu/carcass) in WA to 1.45 log10 cfu/cm
2 (4.79
log10 cfu/carcass) in Qld.
Figure 4: Distribution of Campylobacter counts from chicken rinse post spin chill across
participating states (NSW, Qld, SA, WA)
8.3.3 Total Viable Count and E. coli results
The majority of rinse samples were tested for TVC and E. coli as an indication of how
hygienically the process facilities were operating. Unsatisfactory results can indicate that a
step in the poultry processing is out of control and corrective action needs to be taken.
Table 6 below categorises counts for TVC and E. coli from excellent to poor. These
categories were used to assist with the interpretation of the data.
log10Campylobacter(cfu/cm2)
Perc
en
tag
e o
f p
osit
ive s
am
ple
s
0
10
20
30
40
50
0 1 2 3 4

24
Table 6: Performance categories for TVC and E. coli on chicken meat products
Category Descriptor TVC/cm2 E. coli/cm
2
Excellent <5,000 <10
Good 5,000-50,000 10-100
Acceptable 50,000-500,000 100-1,000
Marginal (for TVC) Action required (for E. coli)
500,000-1,500,000 >1,000
Poor12
>1,500,000
Source: Sumner et. al. (2004a)
8.3.3.1 Total Viable Count results
Of the 1112 rinse samples collected, post processing, 794 were tested for TVC
in NSW, SA and WA. None were tested in Queensland. For interpretation of
the category descriptors (excellent to poor), refer to Table 6.
Table 7: Total Viable Counts from chicken rinse post spin chill and conformance with
performance categories
State Sample No Category Number (%) Mean log
TVC cfu/cm2
(SE) Exc
* Good Accept
* Marg
* Poor
NSW 80 68 (85.0) 12 (15.0) 0 0 0 2.52 (0.09)
SA 340 290 (85.3) 48 (14.1) 2 (0.6) 0 0 2.74 (0.04)
WA 374 374 (100.0) 0 0 0 0 1.10 (0.04)
National 794 732 (92.2) 60 (7.5) 2 (0.3) 0 0 1.95 (0.04) * Exc=Excellent, Accept=Acceptable, Marg=Marginal
Key observations:
99.7% of samples were either Excellent or Good.
The remaining samples (0.3%) were classified as Acceptable.
No samples were classified as either Marginal or Poor.
Mean concentrations of TVC ranged from 1.10 log10 cfu/cm2 in WA to 2.74 log10 cfu/cm
2
in SA.
12 This category has been added.

25
Figure 5: Distribution of TVC from chicken rinse post spin chill across participating
states (NSW, SA, WA)
8.3.3.2 E. coli results
Of the 1112 rinse samples, 791 in total were tested for E. coli in NSW, SA and WA. None
were tested in Queensland. For interpretation of the category descriptors (excellent to poor),
refer to Table 6.
Table 8: E. coli (for positive samples only) from chicken rinse post spin chill and
conformance with performance categories
State # of
positive
samples
(%)
Category Number (%) Mean log*
count
cfu/cm2
(SE)
Sample
No
Exc+ Good Accept
+ Action
Required
NSW 80 77 (96.3) 57 (74.0) 17 (22.1) 3 (3.9) 0 0.55 (0.08) SA 337 311 (92.3) 163 (52.4) 117 (37.6) 31 (10.0) 0 0.93 (0.04)
WA 374 292 (78.1) 276 (94.5) 13 (4.5) 3 (1.0) 0 -0.03 (0.04)
National 791 680 (86.0) 496 (72.9) 147 (21.6) 37 (5.4) 0 0.48 (0.03) +Exc=Excellent, Accept=Acceptable *Mean and standard errors were calculated for positive samples only from participating states
Key observations
94.5% of samples were classified as Excellent or Good and the remainder were all
classified as Acceptable.
No samples were classified in the Action Required category.
86% of samples tested were positive for E. coli, with a mean concentration of 0.48 log10
cfu/cm2.
log10TVC(cfu/cm2)
Perc
en
tag
e o
f sam
ple
s
0
5
10
15
20
0 1 2 3 4 5

26
The prevalence of E. coli ranged from 78.1% in WA to 96.3% in NSW.
Mean concentrations ranged from -0.03 log10 cfu/cm2 in WA to 0.93 log10 cfu/cm
2 in SA.
Figure 6: Distribution of E. coli (positive samples only) from chicken rinse post spin
chill across participating states (NSW, SA, WA)
8.4 Salmonella serovar testing
Samples that were positive for Salmonella were typed to determine the serovars. The results
of this typing are presented in a table in Attachment 4. Multiple Salmonella serovars were
isolated from some samples.
All phage typing for Typhimurium was conducted using the Colindale International Typing
Scheme in NSW and SA with the exception of WA, where samples were tested by Pulsed
field gel electrophoresis (PFGE). This testing does not allow for phage typing of
Typhimurium serovars and therefore they are reported as Typhimurium only.
Key Observations
The most common serovar isolated was Sofia. However, this serovar was uncommon in
the positive samples from WA. Of the 171 positive Salmonella samples from the three
components of the survey in WA, only two samples tested positive for Sofia.
Following Sofia, the most common serovars were Typhimurium, Infantis and Mbandaka.
log10E. coli(cfu/cm2)
0
5
10
15
20
-1 0 1 2 3
Perc
en
tag
e o
f p
osit
ive s
am
ple
s

27
9. Discussion
9.1 On-farm (faecal samples)
9.1.1 Discussion of results (faecal samples)
Pooled faecal samples were collected from 39 farms in Western Australia as an indicator of
flock prevalence. The pooling of the samples means that there may have been a mix of
positive and negative faeces13
. Therefore the results give a general indication as to the degree
of infection within a shed and not individual bird prevalence.
Of the 233 sheds sampled, 46.8% were positive for Salmonella comprising of 46.8% positive
for non-Sofia serovars and 0.9% of samples positive for Sofia14
. For Campylobacter, 64.4%
of the sheds were positive. In 21 sheds (9%), Salmonella and Campylobacter were not
detected. In some farms Salmonella or Campylobacter were not detected (15.4% and 28%,
respectively) but there were no farms where both pathogens were not detected, with at least
one shed testing positive for Salmonella or Campylobacter on every farm.
9.1.2 Comparison with overseas surveys (faecal samples)
Table 9 below summarises results from recent overseas studies on prevalence of Salmonella
and Campylobacter in broiler flocks where prevalence was estimated by pooling faecal or
caecal samples. Caution needs to be taken when comparing studies, due to the differences in
survey design, methodology and sample sizes and therefore the comparison is somewhat
rudimentary.
The studies have been split according to whether they were baseline surveys or whether they
were surveys conducted in countries that have specific interventions in place to lower the
prevalence of these pathogens. Currently in Australia there are no specific measures to lower
the prevalence of Campylobacter and Salmonella in poultry flocks. The majority of poultry
growers comply with an industry manual, National Biosecurity Manual for Contract Meat
Chicken Farming. This manual was developed by the Australian Chicken Meat Federation in
2002 and forms part of or is directly or indirectly referred to in most contracts governing the
farming of chicken on behalf of chicken processors. This manual specifies the biosecurity
measures necessary to prevent the introduction of infectious diseases to poultry and the
spread of disease from an infected area to an uninfected area. While this includes
Campylobacter and Salmonella, these pathogens have not been specifically targeted.
There were two studies that were baseline surveys, one in Canada and one in Ireland. If the
results from this survey are compared with these, the prevalence of Campylobacter was
higher (64.4% compared to 35% in Canada) and for Salmonella, very similar to Canada
(46.8% compared to 50% in Canada) but higher than Ireland where the prevalence was 27%.
13 It is not known how many bird droppings went into each pooled sample and this may affect the prevalence. 14 The two samples that were positive for Sofia were also positive for Give.

28
In the Netherlands, a study reported lower prevalences of Campylobacter and/or Salmonella.
However, there were specific interventions in place to control these pathogens.
In the Netherlands the Salmonella flock prevalence dropped from 20% in 1999 to 11% in
2002. During this period, the Campylobacter flock prevalence remained fairly stable at 20%.
In 1997, the Dutch Products Boards for Livestock, Meat and Eggs implemented monitoring
and control programs to reduce Salmonella and Campylobacter contamination of poultry
meat. These programs include, amongst others, microbiological examination of flocks at
each stage of the production chain, application of strict hygiene measures throughout the
production chain and a logistic slaughtering procedure for broiler flocks (Van de Giessen et
al, 2006).
Table 9: Summary of recent overseas studies on prevalence of Salmonella and
Campylobacter in broiler flocks
Country Salmonella flock
prevalence15
Campylobacter
flock prevalence
Comments Reference
Baseline surveys Western
Australia (this survey)
46.8%
(95% CI: 40.2, 53.4)
64.4%
(95% CI: 57.9, 70.5)
233 sheds sampled on 39
farms. One pooled sample taken from each shed
(~250g).
This survey.
Canada
(Quebec)
50%
(95% CI: 37, 64)
35%
(95% CI: 22, 49)
Flock status was evaluated
by culturing pooled caecal contents from about 30
birds per flock in 2003/04. Sample size was 81 flocks.
Arsenault et al,
(2007a)
Ireland 27% Baseline study conducted in 2006 in a total of 362
broiler flocks, representing 80% of total broiler
population. Samples taken within last 3 weeks prior to
depopulation. A total of
five pairs of boot swabs collected per flock.
Gutierrez M et al (2009)
Specific interventions in place Netherlands From ~20% in 1999
to ~11% in 2002 From 1999-2002, prevalence roughly
averaged around 20%
Results of ongoing surveillance of broiler
flocks in period 1999-2002 – 100-200 flocks sampled
annually. Fresh faecal samples were randomly
collected and pooled. In 1997, monitoring and
control programs implemented to reduce
Salmonella and Campylobacter
contamination of poultry meat.
Van de Giessen et al (2006)
15 The Salmonella prevalences indicated in the table are for total Salmonella.

29
9.2 Prior to processing (caecal samples)
9.2.1 Discussion of results (caecal samples)
To determine the prevalence of Salmonella and Campylobacter in poultry entering processing
facilities, the caecal contents of poultry were collected for testing in South Australia and
Western Australia.
Overall, 12.7% of samples tested positive for Salmonella, with 7.5% being positive for non-
Sofia serovars. In WA, 4% of samples were positive for non-Sofia serovars and in SA,
12.7% were positive. The mean concentration of Salmonella was low, 1.02 log10 MPN/gm.
For Campylobacter, the average prevalence was 84% and the mean concentration was 6.87
log10 cfu/gm. For the two states the percentages were similar for Campylobacter, 83.5%
(SA) and 84.3% (WA).
Direct comparisons with the results in Section 9.1.1 are not possible as one was testing the
flock prevalence, whereas the caecal testing was estimating the bird prevalence across flocks.
Within flock prevalence is often variable due to many factors such as the virulence of the
Salmonella strain and immune status of birds within the flock (FAO/WHO, 2002). Only
Western Australia participated in both components in this survey. For the pooled faecal
samples, 46.8% tested positive for Salmonella, whereas only 4% of the caecal samples were
positive for Salmonella. This may be explained by the fact that the pooled faecal samples can
contain a mix of positive and negative faeces but when tested, a positive result is recorded.
The Campylobacter results are more consistent with expectations. For the pooled faecal
samples, 64.4% were positive and for the caecal samples 84%. A higher percentage would be
expected in the caecal samples as the birds tested were older. Campylobacter infections tend
to increase with the age of the birds and once Campylobacter has colonised birds in a
growing house, all birds in the flock become contaminated within a few days (Berndtson et
al, 1996).
9.2.2 Comparison with overseas surveys (caecal samples)
A study in Iceland tested poultry just prior to processing for Campylobacter prevalence by
testing the contents of the caeca (Barrios et al, 2006). Between May 2001 and Dec 2003,
1091 broiler flocks were tested by pooling caecal samples from four pooled samples of ten
from each flock. The flock prevalence was low at 15% (95% CI: 13.3, 17.7), which is
comparable to that of other northern European countries (Barrios et al, 2006). The low
prevalence of Campylobacter found in this survey is also likely to be as a result of an official
policy of testing flocks prior to slaughter and requiring that meat derived from positive flocks
be sold frozen. Positive flocks are also processed either at the end of the processing day or
week. The profit derived by the poultry industry is greatly reduced when Campylobacter-
positive flocks are frozen. Consequently the industry is highly motivated to identify cost-
effective interventions to control this pathogen by enhancing farm biosecurity measures
(Stern et al, 2005).

30
9.3 Post processing (rinse samples)
9.3.1 Salmonella and Campylobacter results
9.3.1.1 Discussion of Salmonella and Campylobacter results (rinse samples)
To determine the prevalence and concentration of Salmonella and Campylobacter, post
processing, rinse samples from carcasses were taken from processing plants, following the
chilling step. A total of 1112 carcass rinse samples were collected from four states (NSW,
Qld, SA and WA). In South Australia samples were collected from March – May 2007, in
Western Australia, samples were collected from October 2007 until March 2008, in New
South Wales from March – July 2008 and in Queensland from April – August 2008.
Positive Salmonella and Campylobacter samples were enumerated to estimate prevalence.
For Salmonella, 36.7% of rinse samples were positive with 22.1% being positive for
non-Sofia serovars. The results for total Salmonella were similar between the states (NSW
48.4%, Qld 44.0%, SA 51.6%), with the exception of Western Australia, which was much
lower at 12.5%. However, this is likely to be because Sofia serovars were not detected in the
samples from Western Australia. If the percentage of samples are compared for non-Sofia
serovars, Qld had the lowest prevalence at 6.7%, followed by WA at 12.5%, NSW 21.1% and
SA at 40.2%. The Salmonella concentrations on positive samples was low, on average -1.99
log10 MPN/cm2 or about 1 per 100cm
2.
For Campylobacter, 84.3% of rinse samples were positive. The Campylobacter results were
similar across the states, though they were lower in Queensland and highest in New South
Wales. The results were 64.0% in Queensland, 80.8% in South Australia, 88.5% in Western
Australia and 95.1% in New South Wales. While the samples in the states were taken at
different times of the year, there is no correlation between the results and peak notification
times for Campylobacteriosis. Notifications of Campylobacteriosis in Australia peak in the
months of October, November and sometimes December (FSANZ, 2005). However, NSW,
which recorded the highest results, sampled from March-July 2008.
In Western Australia and New South Wales, the Campylobacter concentrations of positive
samples was higher than for Salmonella, on average, 0.70 log10 cfu/cm2 or ~500 cfu/100cm
2.
In Queensland, where only counts >100 cfu/ml were recorded, the mean concentration was
1.45 log10 cfu/cm2 or ~2818 cfu/100cm
2. This approximate 1 log increase is consistent with
the 1 log difference in limit of detection.
The results from the samples taken at the end of primary processing are similar to the results
from the retail baseline microbiological survey carried out in 2005/2006 in South Australia
and New South Wales. Table 11 below compares the prevalence and concentrations between
the two surveys.

31
Table 11 – Comparison of results from previous retail baseline survey and this survey
Survey Prevalence Concentration
Salmonella (%) Campylobacter (%) Salmonella
(log10 MPN/cm2)
Campylobacter
(log10 cfu/cm2)
This
survey
36.7 84.3 -1.99 0.70
Retail
survey16
43.3 90.0 -1.42 to -1.617
0.78 to 0.8718
This comparison indicates that the prevalence and concentration of Salmonella and
Campylobacter on chicken carcasses post processing in this survey, was similar to the
prevalence and concentration of these two pathogens found on raw chicken in the retail
survey.
9.3.1.2 Comparison with overseas surveys (rinse samples)
Table 12 provides a summary of recent overseas studies on prevalence and concentration of
Salmonella and Campylobacter in broiler carcasses. In the table, the studies are split into two
categories, those that were baseline surveys (similar to this one) and those which were
undertaken in countries where specific interventions are in place to lower Salmonella and
Campylobacter levels and concentration, post processing. This comparison is rudimentary as
direct comparisons are not possible due to differences in survey design, methodology and
sample sizes.
In Australia, businesses that process poultry must meet the requirements of an Australian
Standard, AS 4465-2005 Construction of Premises and Hygienic Production of Poultry Meat
for Human Consumption. This Standard requires poultry processors to develop and
implement HACCP19 programs and also includes specific requirements relating to the design
and construction of the premises, the processing of poultry, health and hygiene requirements
and cleaning and sanitising (ANZFRMC, 2006).
The requirement for poultry processors to have HACCP program in place has been
mandatory since late 1997 (Sumner et al, 2004b). The Standard requires microbiological
testing to verify process control. However, the recommended test is Total Viable Count and
not for specific pathogens. While the need to minimise the contamination of poultry with
Salmonella is certainly recognised, it is not specifically targeted, and Campylobacter even
less so.
16 Pointon et al, 2008. 17 The Salmonella mean count was -1.42 log10 MPN/cm2 in New South Wales and -1.6 log10 MPN/cm2 in South Australia. 18 The Campylobacter mean count was 0.78 log10 cfu/cm2 in South Australia and 0.87 log10 cfu/cm2 in New
South Wales. 19 The Hazard Analysis and Critical Control Point (HACCP) system ensures the safety of food by requiring
potential food safety hazards to be controlled at every step of a food‟s production and to keep records to
demonstrate this is occurring.

32
Sumner et al (2004b) examined whether the introduction of mandatory HACCP in poultry
processing facilities in Australia in late 1997 had affected the prevalence of Salmonella or of
salmonellosis. This evaluation found that the trend of notification rates for salmonellosis was
generally rising over time from 31.9 cases per 100 000 in 1991 to 35.8 cases per 100 000 in
2001. Overall Salmonella prevalence on chicken carcasses had improved slightly from an
annual incidence of 25-35% since 1981 to 28-29% in 2000 and 2001, when taking into
account the fact that detection methods had improved markedly. The major difference was
that S. sofia had become the dominant strain, comprising 39% of isolated serovars in 1981-
1985 to 89% of serovars in 1991-1994. When compared to the results from this survey,
overall prevalence of Salmonella is slightly higher at 36.7%. However, with the exception of
WA, S. sofia is still the dominant strain.
When the results of this survey are compared with similar baseline surveys, there were
similarities, particularly with a baseline study conducted in Canada. In this study, the
prevalence of both Salmonella (37.5%) and Campylobacter (75%) were very similar to the
results from this survey (Salmonella 36.7% and Campylobacter, 84.3%). This is also the case
with a baseline study conducted in the US in 1994-1995, where Campylobacter prevalence
was reported at 88.2%. The prevalence for Campylobacter was higher than a baseline level
of 70% estimated for the UK in 1995, based on the available surveillance data (UKFSA,
2009a). This level was determined prior to the commencement of a Campylobacter reduction
strategy. A baseline survey in Sweden found a much lower prevalence of Campylobacter at
15%. However, the colder conditions in Sweden may account for this.
As expected, the Salmonella and Campylobacter results from this survey are somewhat
higher than those found in studies conducted after specific interventions strategies have been
implemented. These include New Zealand, United States and Sweden. The UK also has a
lower Salmonella prevalence, but unlike NZ, US and Sweden, the UK‟s Campylobacter
reduction strategy has not yet been successful at lowering Campylobacter prevalence on
chicken meat.
In NZ, the prevalence of Campylobacter on chicken carcasses in the second quarter of 2007
was 57%, which was just prior to New Zealand setting poultry processing targets for levels of
Campylobacter on carcasses. By the second quarter of 2008, this prevalence had almost
halved to 30.6% (NZFSA, Dec 2008). The levels of Campylobacter on the carcasses were
3.07 log10cfu/carcass in the second quarter of 2007, dropping to 2.41 log10cfu/carcass
(NZFSA, Dec 2008). In Australia, the Campylobacter levels on the poultry carcasses were
on average higher with a mean of 4.04 log10cfu/carcass. This estimate was calculated
assuming an average carcass weight of 1.78 kg, which in 06/07 was the average carcass
weight in Australia (ACMF, 2009). This is similar to the average carcass weight in New
Zealand, which for 07/08 was 1.73 kg (PIANZ, 2009). Therefore, the data are comparable
between the two countries.

33
The reported incidence of Campylobacteriosis in 2002 was almost 3 times higher in New
Zealand (326 cases/100,000 in 2004) (Lake, 2006) than Australia (117 cases/100,000 in
2004) (The OzFoodNet Working Group, 2005). To address the high rates of human
Campylobacteriosis in New Zealand, the New Zealand Food Safety Authority (NZFSA) set
an organisational performance target of 50% reduction in the reported annual incidence of
foodborne Campylobacteriosis after five years (NZFSA, Dec 2008). Poultry meat was
established as the primary exposure pathway in NZ and therefore a comprehensive strategy
was formalised in 2006 to reduce Campylobacter levels in chicken meat. This is primarily
being achieved by the setting of a Campylobacter performance target. Standard processors
must sample three poultry carcasses per processing day and are required to achieve
microbiological criteria of an 80th
percentile of 1200 cfu/carcass (3.08 log10 cfu/carcass)
(NZFSA, Jan 2008). When results are higher than the criteria, the processor is required to
take corrective action. There are five response levels, depending on how high the
Campylobacter levels are - the higher the count, the more comprehensive the response. The
lowest response is for the processor to review its procedures and the highest response is
government intervention at the processing plant.
The NZ Campylobacter reduction strategy has seen cases of Campylobacter infection, caused
by food, being reduced by 50 percent (NZFSA, 2009). The NZFSA has advised that these
reductions have been predominantly achieved by processors improving their good hygienic
practices during slaughter and dressing. The increased use of processing aids has also made a
significant contribution. Further activities have included broiler growers improving control
measures on farm20
, improvement in packaging and safe food messaging to food distributors,
retailers and consumers.
In the US, over the past 10 years, the poultry industry has reduced Campylobacter spp.
contamination of processed broilers by more than 10-fold – adherence to HACCP procedures
within the plants playing a large role in this reduction. During this period, the human disease
caused by Campylobacter has been substantially reduced (Stern, Pretanik (2006).
In Sweden, controls have been in place for Salmonella since 1961(Wierup et al, 1995). They
were introduced as a result of a large Salmonella epidemic in 1953 (Wierup et al, 1995). The
overall aim of the Swedish Salmonella control program is that animals sent for slaughter shall
be virtually free from Salmonella, which ensures that animal products for human
consumption will be free from Salmonella (FAO/WHO, Jan 2002). With respect to poultry,
four main factors are in place to control Salmonella-
1. The breeding pyramid is kept free from Salmonella – all grandparent animals are
imported and all are quarantined and repeatedly tested
2. Feed is free from Salmonella – import control of feed raw materials, mandatory heat
treatment of compound feeding stuffs for poultry and a HACCP-based Salmonella control
program in the feed industry
3. High hygiene and biosecurity standards are in place, preventing introduction of
Salmonella
4. Elimination of the flock is always carried out in case of Salmonella infection in poultry
irrespective of serotype (FAO/WHO, Jan 2002).
20 At the farm level, generic aspects of biosecurity have been improved but currently it is accepted that this only
results in a limited reduction in the level of contamination of slaughtered birds.

34
In 2005, the UK Food Standards Agency set a strategic target of achieving a 50% reduction
in the incidence of UK produced chicken testing positive for Campylobacter by 2010 (UK
Food Standards Agency, 2009a). The baseline, against which this target was to be measured,
was set at 70% based on the surveillance data available at the time (UKFSA, 2009a). A key
part of the strategy to achieve the 50% reduction is the „Cleaner Farms, Better Flocks‟
program which aims to improve hygiene measures on broiler farms and ensure that best
practices are followed at all times (UK Food Standards Agency, 2009b).
The key messages are:
keep livestock away from poultry houses
only allow essential visitors onto the farm
use dedicated boots for each poultry house
eliminate vermin
wash and sanitise hands before and after visiting the poultry shed
The UK‟s Campylobacter prevalence of 65% (post intervention) is similar to the baseline
level of 70%, indicating that the Campylobacter reduction strategy has not yet been
successful in lowering the prevalence of this pathogen on chicken at retail. However, the
levels are still lower than found in this survey for Campylobacter prevalence on broiler
carcasses post processing (84.3%).

35
Table 12: Summary of overseas studies on prevalence and levels of Salmonella and
Campylobacter post processing
Country Salmonella
prevalence21
Campylobacter
prevalence/levels
Comments Reference
Baseline surveys Australia
(this survey)
36.7%
(95% CI: 33.9, 39.6)
84.3%
(95% CI: 82.0,86.4)
Baseline survey. 1112
carcass rinse samples tested.
This survey
Canada 37.5% 75% Baseline survey. In 2004-
2005, 1234 poultry carcass rinse samples tested.
Bohaychuk et al
(2009)
United States
20% 88.2% 1994-1995 baseline study, 1297 chicken carcasses
sampled.
USDA, April 1996
United
Kingdom
70% Baseline level in 2005 based
on surveillance data prior to
introduction of Campylobacter reduction
strategy.
(UKFSA, 2009a)
Sweden 15%
The 10th
and 90th
percentiles of
Campylobacter numbers per carcasses
were 3.0 and 5.0 log cfu, respectively, and
the maximum was 7.1 log cfu.
Baseline study of broiler
chickens. 636 carcasses were collected from the ten
largest slaughterhouses22
.
Lindblad M et al
(2006)
Specific interventions in place New Zealand
From 57% in quarter 2 of 2007 (mean of 3.07
log10 cfu/carcass)
decreasing to 30.6% in quarter 2 of 2008
(mean of 2.41 log10 cfu/carcass)
Risk management strategy to reduce foodborne
Campylobacteriosis by 50
percent after 5 years was formalised in 2006. Poultry
processing targets set in 2008.
NZFSA (Dec 2008)
United States
26%, concentrations varied – mean of less
than 10cfu/carcass in march to 390
cfu/carcass in October.
HACCP systems required to be implemented in
processing plants. 4200 samples taken
randomly from 10 participating poultry
processors over a 13 month period.
Stern NJ, Pretanik S (2006)
United Kingdom
6.6%23
65.2% Survey conducted between May 2007 and Sep 2008 on
fresh chicken at retail sale. 3274 samples tested.
UKFSA (2009a)
Sweden 0%24
Baseline study of broiler
chickens. 636 carcasses were collected from the ten
largest slaughterhouses.
Lindblad M et al
(2006)
21 The Salmonella prevalences in the table are for total Salmonella. 22 These 10 plants are responsible for 99.9% of the ~70 million broiler chickens slaughtered each year in
Sweden. 23 Salmonella was not part of the Campylobacter reduction strategy, as the prevalence of Salmonella in chicken
meat in the UK has remained low. It was 5.7% in 2001 (UKFSA, 2009). 24 None of the sampled carcasses were positive for Salmonella. Because of measures taken in the Swedish
Salmonella control program, all Swedish red and white meat and eggs are virtually free from Salmonella.

36
9.3.2 Total Viable Count and E. coli results
Of the 1112 rinse samples taken, approximately 790 were tested for TVC and E. coli. These
tests were undertaken to give an indication of how hygienically the process facilities were
operating. Unsatisfactory results can indicate that a step in the poultry processing is out of
control and corrective action needs to be taken. For TVC, almost 100% of the samples were
considered excellent or good and none were marginal or poor. For E. coli, 94.5% of samples
were classified as excellent or good, and the remainder were all acceptable.
While the results of the TVC and E. coli were all within acceptable criteria, the testing of
these indicator organisms in poultry at the end of the processing is not a good indicator of the
likelihood of the poultry being contaminated with Salmonella and Campylobacter. While
TVC and E. coli counts may have been well within acceptable limits, the percentage of
poultry likely to be contaminated with Salmonella and Campylobacter at the end of
processing was high, particularly for Campylobacter. A similar study in Sweden estimating
the prevalence and concentrations of pathogenic and indicator bacteria on Swedish broiler
chickens reached the same conclusion – no correlation was found between numbers of any
indicator bacteria and numbers of pathogenic bacteria (Lindblad et al, 2006). The indicator
organisms tested were total aerobic organisms and E. coli.
9.4 Salmonella serovar testing
Samples that were positive for Salmonella were typed to determine the serovars. This typing
enabled the Salmonella positive samples to be grouped according to whether they were
Sofia or non-Sofia. This is important because, based on epidemiological evidence,
Sofia is not normally associated with causing illness in humans whereas the other serovars,
such as Typhimurium, are. The typing also provides an indication of the types of serovars
present in chicken and which are the most common. This can provide a useful reference
when investigating human infections with Salmonella.
The most common serovar isolated was Sofia. However, this serovar was uncommon in the
positive samples from Western Australia. Of the 171 positive Salmonella samples from the
three components of the survey in Western Australia, only two samples tested positive for
Sofia and these were from samples that were also positive for Give. Following Sofia, the
most common serovars were Typhimurium, Infantis and Mbandaka, which are associated
with human illness.
10. Follow up action
This survey provides baseline data on the prevalence and concentration of Salmonella and
Campylobacter at both the primary production and primary processing stages of the chicken
meat supply chain. When the Standard for Poultry Meat has been implemented, a follow up
survey needs to be conducted to evaluate whether the Standard has been effective in lowering
the prevalence and concentration of Salmonella and Campylobacter in poultry meat. As per
this survey, it should be an ISC coordinated national survey, preferably with all jurisdictions
participating that have chicken meat farms and/or processors within their state.

37
11. Conclusions
This survey has provided baseline data on the prevalence and levels of Salmonella and
Campylobacter on chicken meat at both the primary production and primary processing
stages of the chicken meat supply chain. The results from farms in Western Australia
indicate that poultry are being infected with Salmonella and Campylobacter on farm, with
flock prevalence from pooled faecal samples being 46.8% for Salmonella and 64.4% for
Campylobacter. The results from Western Australia and South Australia indicate that a large
percentage of the live poultry entering processing plants are infected with Campylobacter
(84%) and to a much lesser extent, Salmonella (12.7%). Results from samples taken from
four states (NSW, Qld, SA and WA) at the end of primary processing, indicated that the
prevalence of poultry contaminated with Campylobacter was 84%, consistent with the
prevalence for the poultry entering the processing plants. However, the prevalence of
Salmonella was higher at the end of processing (36.7% total Salmonella, of which 22.1%
were positive for non-Sofia serovars).
The results from the samples taken at the end of primary processing are similar to the results
from the retail baseline microbiological survey carried out in 2005/2006 in South Australia
and New South Wales. The results from this survey showed that 43.3% of chicken samples
tested were positive for Salmonella (12.8% being non-Sofia) and approximately 90% were
positive for Campylobacter coli/jejuni (Pointon et al, 2008). The mean Salmonella and
Campylobacter counts were also similar. This comparison indicates that Salmonella and
Campylobacter contamination on chicken carcasses post processing, is likely to be carried
through to the fresh chicken purchased by consumers.
When compared with results from similar baseline surveys overseas, the results from this
survey were generally similar. Where countries have implemented specific strategies to
lower Salmonella and Campylobacter in poultry, significant reductions have been reported.
The exception to this is the UK, where a strategy to reduce Campylobacter prevalence on
fresh chicken meat, has not yet been successful.
The data collected from this survey will be compared with those from a follow-up survey to
be conducted after the new Standard for Poultry Meat has been fully implemented. This will
assist in assessing the effectiveness of the new Standard for Poultry Meat in reducing the
prevalence and concentration of Salmonella and Campylobacter in poultry and poultry meat.

38
12. References
Arsenault J, Letellier A, Quessy S, Normand V, Boulianne M (2007a) Prevalence and risk
factors for Salmonella spp and Campylobacter spp. caecal colonization in broiler chicken and
turkey flocks slaughtered in Quebec, Canada, Preventive Veterinary Medicine 81 (4):250-
264, 2007.
Australia and New Zealand Food Regulation Ministerial Council (ANZFRMC), Food
Regulation Standing Committee (2006) Australian Standard for construction of premises and
hygienic production of poultry m eat for human consumption: AS 4465:2005, CSIRO
Publishing, Australia.
Australian Chicken Meat Federation (2009) Industry Facts and Figures.
http://www.chicken.org.au. Accessed on 3 March 2009.
Barrios PR, Reiersen J, Lowman R, Bisaillon JR, Michel P, Fridriksdottir V, Gunnarsson E,
Stern N, Berke O, McEwen S, Martin W (2006) Risk factors for Campylobacter spp.
colonization in broiler flocks in Iceland, Preventive Veterinary Medicine 74 (4):264-278
2006.
Beery JT, Hugdahl MB, Doyle MP (1988) Colonization of gastrointestinal tracts of chicken
by Campylobacter jejuni, Applied and Environmental Microbiology 54:2365-2370.
Berndtson E, Emanuelson U, Engvall A, Danielsson-Tham ML (1996) A 1-year
epidemiological study of Campylobacters in 18 Swedish chicken farms, Preventive
Veterinary Medicine 26, 167-185.
Bohaychuk VM, Checkley SL, Gensler GE, Barrios PR (2009) Microbiological baseline
study of poultry slaughtered in provincially inspected abattoirs in Alberta, Canada, Canadian
Veterinary Journal-Revue Veterinaire Canadienne 50 (2):173-178 2009.
Colmar Brunton Social Research (2005) Benchmark research on the poultry meat industry,
report prepared for Food Standards Australia New Zealand. Available from
www.foodstandards.gov.au.
FAO/WHO (2002) Risk Assessments of Salmonella in eggs and broiler chickens. Food and
Agriculture Organization/World Health Organization, Geneva, Switzerland.
http://www.fao.org/docrep/005/y4392e/y4392e00.htm. Accessed on 12 May 2009.
FAO/WHO (Jan, 2002) Country report on the Swedish experience relating to the control of
Salmonella in the national herd, with specific focus on the Salmonella policy related to
poultry production, and the results regarding Salmonella prevalence and human salmonellosis
incidence, FAO/WHO Global Forum of Food Safety Regulators, Marrakech, Morocco, 28-30
January, 2002. http://www.fao.org/docrep/meeting/004/ab456e.htm. Accessed on 26 May
2009.

39
FSANZ (2005) Scientific Assessment of the Public Health and Safety of Poultry Meat in
Australia,
http://www.foodstandards.gov.au/_srcfiles/P282_Poultry%20_%20DAR%20Attach3.pdf
Accessed on 11 May 2009.
Guituerrez M, Fanning J, Murphy A, Murray G, Griffin M, Flack A, Leonard N, Egan J
(2009) Salmonella in Broiler Flocks in the Republic of Ireland, Foodborne Pathogens and
disease 6(1):111-120, 2009.
Hall G, Kirk MD, Becker N, Gregory JE, Unicomb L, Millard G, Stafford R, Lalor K, the OzFoodNet
Working Group (2005) Estimating Foodborne Gastroenteritis, Australia, Emerging Infectious
Diseases, Vol 11, No 8, August 2005, pp 1257-1264.
Helsel, D.R. (2005) Nondetects and Data Analysis. Wiley Interscience.
Lake R (2006) Transmission Routes for Campylobacteriosis in New Zealand, Institute of
Environmental Science & Research Limited, May 2006.
http://www.nzfsa.govt.nz/science/research-projects/Campylobacter/Campylobacter.pdf.
Accessed on 12 May 2009.
Lindblad M, Lindmark H, Lambertz ST, Lindqvist R (2006) Microbiological baseline study
of broiler chickens at Swedish slaughterhouses, Journal of Food Protection 69 (12):2875-
2882 2006.
Lorimer MF and Kiermeier A (2007) Analysing microbiological data: Tobit or not Tobit?
International Journal of Food Microbiology 116 (3), p313-318.
SafeFood Production NSW (2001) Terms of Reference 2 of the Final Draft Outcomes of the
Meat Standards Committee Microbiological Subcommittee, 15 February 2001.
Meat Standards Committee (2002) Guidelines – Microbiological testing for process
monitoring in the poultry meat industry to the Australian Standard for Construction of
premises and hygienic production of poultry meat for human consumption AS 4465:2001.
New Zealand Food Safety Authority (NZFSA) (Jan 2008) Schedule 1 National
Microbiological Database Programme.
http://www.nzfsa.govt.nz/animalproducts/legislation/notices/animal-material-
product/nmd/schedule-1-technical-procedures-nmd-final.pdf. Accessed on 4 May 2009.
New Zealand Food Safety Authority (NZFSA) (Dec 2008) Campylobacter Risk Management
Strategy, 2008-2011. http://www.nzfsa.govt.nz/foodborne-
illness/Campylobacter/strategy/Campylobacter_risk_manage ment_strategy_2008-2011.pdf.
Accessed on 4 May 2009.
New Zealand Food Safety Authority (NZFSA) (Oct 2009) New Zealand leads world on
controlling dangerous bacteria, media release, 16 October 2009.
http://www.nzfsa.govt.nz/publications/media-releases/2009/2009-10-15-campy-codex-
work.htm. Accessed on 20 October 2009.

40
Pointon A, Sexton M, Dowsett P, Saputra T, Kiermeier A, Lorimer M, Holds G, Arnold G,
Davos D, Combs B, Krist K, Fabiansson S, Raven G, McKenzie H, Chapman A, Sumner J.
(2008) A Baseline Survey of the Microbiological Quality of Chicken Portions and Carcasses
at Retail in Two Australian States (2005 to 2006), Journal of Food Protection, Vol 71, No. 6,
2008, pp 1123-1134.
Poultry Industry Association of New Zealand (PIANZ) (2009) Personal communication, May
2009.
Stafford RJ, Schluter P, Kirk M, Wilson A, Unicomb L, Ashbolt R, Gregory J and the OzFoodNet
Working Group (2007), A multi-centre prospective case-control study of campylobacter infection in
persons aged 5 years and older in Australia, Epidemiol. Infect. 135, 978-988.
Stern NJ, Reiersen J, Lowman R, Bisaillon J-R, Fridriksdottir V, Gunnarsson E, Hiett KL,
Campy-on-ice Consortium (2005) Occurrence of Campylobacter spp. in Cecal Contents
Among Commercial Broiler in Iceland, Foodborne Pathogens and Disease, Vol 2, No. 1,
2005, pp82-89.
Stern NJ, Pretanik S (2006) Counts of Campylobacter spp. on US broiler carcasses, Journal
of Food Protection 69(5):1034-1039 2006.
Sumner J, Raven G, Dean P, Dowsett P, Petrenas E, Weiring G, West G, Lillie M, Holds G,
Pointon A (2004a) A microbiological profile of poultry processed in South Australia. Food
Australia. 56(7): 335-340.
Sumner J, Raven G, Givney R (2004b) Have changes to meat and poultry food safety
regulation in Australia affected the prevalence of Salmonella or of salmonellosis?
International Journal of Food Microbiology 92 (2): 199-205.
The OzFoodNet Working Group (2005) Reported foodborne illness and gastroenteritis in
Australia: Annual Report of the OzFoodNet network, 2004, Communicable Diseases
Intelligence, Vol 29, No 2, pp 164 –190, 2005.
The OzFoodNet Working Group, (2008) Monitoring the incidence and causes of diseases
potentially transmitted by food in Australia: Annual Report of The OzFoodNet Network,
2007, Communicable Diseases Intelligence, Vol 32, No 4, pp 400-424, 2008.
United Kingdom Food Standards Agency (2009a), A UK survey of Campylobacter and
Salmonella contamination of fresh chicken at retail sale, 6 October 2009, Food Survey
Information Sheet 04/09.
http://www.food.gov.uk/science/surveillance/fsisbranch2009/fsis0409. Accessed on 20
October 2009.
United Kingdom Food Standards Agency (2009b), Cleaner farms, better flocks.
http://www.food.gov.uk/safereating/microbiology/flocks/. Accessed on 7 Sep 2009.
United States Department of Agriculture (USDA) (1996) Nationwide Broiler Chicken
Microbiological Baseline Data Collection Program July 1994 – June 1995.
http://www.fsis.usda.gov/OPHS/baseline/broiler1.pdf. Accessed on 4 May 2009.

41
Van de Geissen AW, Bouwknegt M, Dam-Deisz WDC, van Pelt W, Wannet WJB, Visser G
(2006) Surveillance of Salmonella spp. and Campylobacter spp. in poultry production flocks
in The Netherlands, Epidemiology and Infection 134 (6):1266-1275, 2006.
Wierup M, Engström B, Engvall A, Wahlström H (1995) Control of Salmonella enteritidis in
Sweden, International Journal of Food Microbiology, Vol 25, Issue 3, May 1995, pp 219-
226.

42
13. Attachments
1. Form A: Sample Collection On-Farm.
2. Method of analysis for Salmonella and Campylobacter.
3. Form B: Sample Collection at Processing Facilities.
4. Salmonella single and multiple serovar isolation profiles for positive samples

43
Attachment 1: Form A: Sample Collection On-Farm
FORM A: SAMPLE COLLECTION ON-FARM
Baseline survey on the prevalence and levels of Salmonella and Campylobacter along the poultry meat supply chain
The following information is to be provided by all participating jurisdictions to allow analysis of data.
CONTACT DETAILS FOR PARTICIPATING JURISDICTION
Name of sample collector: Phone number:
E-mail address:
Organization:
INFORMATION ABOUT THE FARM BEING SAMPLED
Facility being sampled:
Has this facility previously
been sampled? When?
INFORMATION ABOUT THE SAMPLES Are there any circumstances whereby these
samples could be compromised?
Sample code Sample code
1. 6.
2. 7.
3. 8.
4. 9.
5. 10.
What is the approximate age of the flock?
Has the flock been depopulated25
? How many
times?
What is the water source for the chickens?
25 In Australia, a percentage of chickens are harvested from most flocks on several occasions. Harvesting, also known as „partial depopulation‟, „thinning out‟, or „multiple
pick-up‟, may be done up to four times, depending on need for light or heavy birds. Thinning out sheds allows more space for the remaining birds and reduces the natural
temperatures in the shed. The first harvest might occur as early as 30-35 days and the last at 55-60 days.

44
Attachment 2: Method of analysis for Salmonella and
Campylobacter
Sample analysis for Salmonella
Caecal and rinse samples will be tested for Salmonella using the Australian Standard
technique for Salmonella testing “AS 5013.10-2004: Food microbiology - Microbiology of
food and animal feeding stuffs - Horizontal method for the detection of Salmonella spp”.
Initial testing for Salmonella
Caecal and whole chicken rinse (collected at primary processor) samples will be analyzed for
Salmonella qualitatively as follows:
1. Decant 100 ml of rinse into a suitable container and add equal volume of double
strength buffered peptone water (BPW).
2. Mix and incubate at 37 C for 18 to 24 hours.
3. Transfer 0.1 ml of this culture to a tube containing 10 ml of Rappaport-Vassiliadis
medium with soya (RVS broth) and 1 ml of the bacterial culture into a tube containing
10 ml of Muller-Kaufmann tetrathionate novobiocin broth (MKTTn broth).
4. Incubate the inoculated RVS broth at 41 ±1 C for 24 h ±3 h and the inoculated
MKTTn broth at 37 ±1 C 24 ±3. Care should be taken that the maximum allowed
incubation temperature of (42.5 C) is not exceeded.
5. After incubation for 24 ±3 h, using the culture obtained in the RVS broth, inoculate
by means if a loop the surface of one large-size Petri dish containing the first selective
plating-out medium, Xylose lysine deoxycholate agar (XLD agar) so that well-
isolated colonies will be obtained. Proceed in the same way with the second plating-
out medium using a sterile loop and Petri dish as described. The choice of the second
selective medium is left to the specific laboratory undertaking the analysis. The
standard does specify that manufacturer‟s instructions should be followed precisely.
6. After incubation for 24 ±3 h, using the culture obtained in the MKTTn broth, repeat
the procedure described in step 5 with the two selective media.
7. Invert the dishes so that the bottom is uppermost, and place them in the incubator set
at 37 C for the XLD agar and follow manufacturer‟s instructions for the second
media.
8. After incubation for 24 ±3 h, examine the plates for the presence of typical colonies of
Salmonella and atypical colonies that may be Salmonella.26
Mark their position at the
bottom of the dish. Incubate the second selective solid medium at the appropriate
temperature and examine after the appropriate time to check for the presence of
colonies which, from their characteristics, are considered to be presumptive
Salmonella.
26 The recognition of colonies of Salmonella is to a large extent a matter of experience, and their appearance
may vary somewhat, not only from serovar, but also from batch to batch of the selective culture medium used.
Typical colonies of Salmonella grown on XLD agar have a black centre and a lightly transparent zone of reddish
colour due to the colour change of the indicator. However, Salmonella H2S negative variants (eg S. paratyphi A)
grown on XLD agar are pink with a darker pink centre. Lactose-positive Salmonella grown on XLD agar are
yellow with or without blackening.

45
Quantitative Salmonella analysis- Most Probable Number technique
This procedure was developed by SARDI and introduces a substantial saving in media and
generates results one day sooner than the traditional MPN method. The procedure is as
follows:
1. Three sets of three tubes are inoculated as follows.
a. For whole chicken:
Set one – add 3 x 10.0mL of rinse fluid to each of three tubes
containing 10mL double strength BPW.
Set two – add 3 x 1.0mL of rinse fluid to each of three tubes of single
strength BPW.
Set three – add 3 x 0.1mL of rinse fluid to each of three tubes of
single strength BPW.
b. For Caecal samples:
Set one – 3 x 1.0mL of a 1:10 dilution is added to three tubes 10mL single
strength BPW
Set two – 3 x 1.0mL of a 1:100 dilution is added to three tubes of single
strength BPW.
Set three – 3 x 1.0mL of a 1:1000 dilution is added to three tubes of single
strength BPW.
2. Incubate the inoculated tubes at 37°C for 18 to 24 hours.
3. Spot inoculate 0.1mL of the incubated BPW onto 1/3 of a Modified Semisolid
Rappaport-Vassiliadis (MSRV) medium and incubate upright at 42°C for up to and
not exceeding 24 hours.
4. Examine the plates for motile bacteria indicated by a halo of growth emanating from
the point of inoculation.
5. Where typical growth has occurred, subculture onto CLED agar from the edge of the
halo.
Confirmation test
Salmonella will be confirmed serologically and biochemically as necessary. If shown to be
reliable, commercially available identification kits for the biochemical examination of
Salmonella may be used. The identification kits concerns the biochemical confirmation of
colonies. These kits should be used following manufacturers instructions.
1. Selection of colonies for confirmation
a. For confirmation, take from each Petri dish of each selective medium at least
one colony considered to be typical or suspect and a further four colonies if
the first is negative. It is recommended that at least five colonies be identified
in the case of epidemiological studies. If on one dish there are fewer than five
typical or suspect colonies, take for confirmation all the typical or suspect
colonies.

46
b. Streak the selected colonies onto the surface of pre-dried nutrient agar plates,
in a manner which will allow well-isolated colonies to develop. Incubate the
inoculated plates at 37±1 C for 24 h ±3 h.
c. Use pure cultures for biochemical and serological confirmation.
2. Biochemical confirmation
a. Triple sugar/iron agar (TSI agar):
i. By means of an inoculating wire, streak the agar slant surface and stab
the butt.
ii. Incubate at 37±1 C for 24 h ±3 h.
iii. Interpret the changes in the medium as follows. Typical Salmonella
cultures show alkaline (red) slants and acid (yellow) buts with gas
formation (bubbles) and in about 90% of the cases formation of
hydrogen sulphide (blackening of the agar). When lactose-positive
Salmonella are isolated, the TSI slant is yellow. Thus, preliminary
confirmation of Salmonella cultures shall not be based on the results of
the TSI agar test alone.
b. Urea agar (Christensen)
i. Streak the agar slant surface.
ii. Incubate at 37±1 C for 24 h ±3 h and examine at intervals.
iii. If the reaction is positive, splitting of the urea liberates ammonia,
which changes the colour of phenol red to rose-pink and later to deep
cerise. The reaction is often apparent after 2 to 4 h.
c. L-Lysine decarboxylation medium
i. Inoculate just below the surface of the liquid medium.
ii. Incubate 37±1 C for 24 h ±3 h.
iii. Turbidity and a purple colour after incubation indicates a positive
reaction. A yellow colour indicates a negative reaction.
d. Reagent for detection of -galactosidase (or paper disks used in accordance to
manufacturer‟s instructions).
i. Suspend a loopful of the suspected colony in a tube containing 0.25 ml
of the saline solution.
ii. Add 1 drop of toluene and shake the tube. Put the tube in the water
bath set at 37 C and leave for approximately 5 min. Add 0.25 ml of the
reagent for detection of -galactosidase and mix.
iii. Replace the tube in the water bath set 37 C and leave for 24 h ±3 h,
examine the tube at intervals.
iv. A yellow colour indicates a positive reaction. The reaction is often
apparent after 20 min.
e. Medium for Voges-Proskauer (VP) reaction
i. Suspend a loopful of the suspected colony in a sterile tube containing 3
ml of the VP medium.
ii. Incubate 37±1 C for 24 h ±3 h.
iii. After incubation, add two drops of the creatine solution, three drops of
the ethanolic solution of 1-napthol and then two drops of the potassium
hydroxide solution; shake after the addition of each reagent.
iv. The formation of a pink to bright red colour within 15 minutes
indicates a positive reaction.

47
f. Medium for indole reaction
i. Incubate a tube containing 5 ml of the tryptone/tryptophan medium
with the suspended colony.
ii. Incubate at 37±1 C for 24 h ±3 h.
iii. After incubation, add 1 ml of the Kovacs reagent.
iv. The formation of a red ring indicates a positive reaction. A yellow-
brown ring indicates a negative reaction.
3. Serological confirmation and serotyping
In general, the detection of the presence of Salmonella O-, Vi- and H-antigens is
tested by slide agglutination with the appropriate sera, from pure colonies and after
auto-agglutinable strains have been eliminated. Use the antisera according to the
producers‟ instructions if different from the description below.
a. Elimination of auto-agglutinable strains
i. Place one drop of the saline solution onto a carefully cleaned glass
slide.
ii. Disperse in the drop, by means of a loop, part of the colony to be
tested, in order to obtain a homogenous and turbid suspension.
iii. Rock the slide gently for 30 s to 60 s.
iv. Observe the results against a dark background, preferably with the aid
of a magnifying glass.
v. If the bacteria have clumped into more or less distinct units, the strain
is considered auto-agglutinable and shall not be submitted to the
following tests as the detection of the antigens is not feasible.
b. Examination for O-antigens
i. Using one non-autoagglutinating pure colony, proceed as above, suing
one drop of the anti-O serum instead of the saline solution.
ii. If agglutination occurs, the reaction is considered positive.
c. Examination for Vi-antigens
i. Proceed as above but using one drop of the anti-Vi serum instead of
the saline solution.
ii. If aglutitination occurs, the reaction is considered positive.
d. Examination for H-antigens
i. Inoculate the semi-solid nutrient agar with a pure non-auto-
agglutinable colony.
ii. Incubate the medium at 37±1 C for 24 h ±3 h.
iii. Use this culture for examination for the H-antigens, proceeding as
above but using one drop of the anti-H serum instead of the saline
solution.
iv. If agglutination occurs, the reaction is considered positive.
Sample analysis for Campylobacter
Caecal and rinse samples will be tested for Campylobacter using the Australian Standard AS
5013.6 – 2004 “Food Microbiology Method 6: Examination for specific organisms –
Campylobacter’. The details of this analysis are given below.

48
Initial testing for Campylobacter
Feed, cloacal swabs and rinse fluids will be tested for Campylobacter as follows:
1. Take 50 ml of the sample solution and add to 50 ml double strength Preston broth
(without antibiotic supplement) and mix well.
2. Incubate the first dilutions and controls at 37±1 C for 2 h.
3. After the two hours incubation, add 0.4 ml of antibiotic supplement to each 100 ml of
broth culture. The selective broths shall be incubated under microaeorobic conditions
at 42±1 C for 46 h.
4. Plating out on selective agar media. Inoculate each enrichment broth culture onto
plates of preston agar and Skirrow agar as follows;
a. Using a 5 mm loop, streak the surface of each agar plate to obtain isolated
colonies.
b. Incubate the plates at 42±1 C in a microaerobic atmosphere,
c. Examine the plates after 24 h and again after 48 h incubation. If suspect
colonies27
have formed, select three well-isolated colonies for the confirmation
tests as described below.
Quantification analysis
The procedure to quantify Campylobacter numbers is as follows.
Procedure:
1. Inoculate 0.1ml of unincubated first dilution onto plates of Preston agar and plates of
Skirrow agar. Note that the two culture media are used in order to improve the
recovery of Campylobacter according to the serotype present and the sample type
being examined.
2. As controls, inoculate half plates of Preston agar and of Skirrow agar with each of the
reference cultures (Campylobacter jejuni NCTC 11351 or ACM 3393 and
Campylobacter coli NCTC 11366 or ACM 4983).
3. Incubate the plates at 42±1 C for 48 h and count the number of suspect colonies per
plate.
4. For colony counts exceeding 100, select 10 random typical colonies on the
presumptive plates; for colony counts below 100, select a number which approximates
the square root of the count. Confirm the selected colonies by the methods described
below.
5. Estimate the counts per unit mass or per unit surface are by the methods set out in AS
1766.3.1 and AS 5013.20 on both the Preston and Skirrow agars and record the higher
of two counts and the agar medium on which it was obtained.
27 Campylobacter colonies are smooth, flat, translucent and colourless to grey, with an irregular edge, pinpoint
to 4 mm in diameter, often spreading along the streak line. Microscopic examination (dark field or phase
contrast) of wet mounts from colonies of Campylobacter will show rapidly mobile, darting, curved S-shaped or
spiral cells. Non-motile, non-culturable coccal forms may also be present.
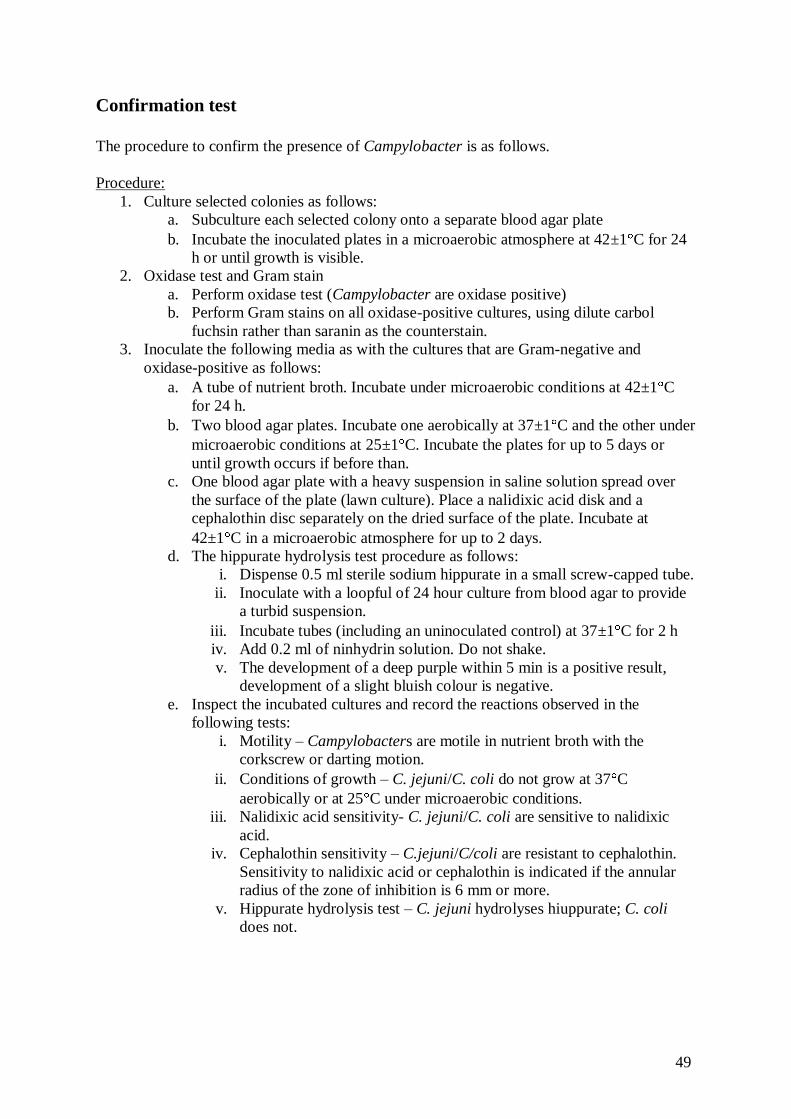
49
Confirmation test
The procedure to confirm the presence of Campylobacter is as follows.
Procedure:
1. Culture selected colonies as follows:
a. Subculture each selected colony onto a separate blood agar plate
b. Incubate the inoculated plates in a microaerobic atmosphere at 42±1 C for 24
h or until growth is visible.
2. Oxidase test and Gram stain
a. Perform oxidase test (Campylobacter are oxidase positive)
b. Perform Gram stains on all oxidase-positive cultures, using dilute carbol
fuchsin rather than saranin as the counterstain.
3. Inoculate the following media as with the cultures that are Gram-negative and
oxidase-positive as follows:
a. A tube of nutrient broth. Incubate under microaerobic conditions at 42±1 C
for 24 h.
b. Two blood agar plates. Incubate one aerobically at 37±1 C and the other under
microaerobic conditions at 25±1 C. Incubate the plates for up to 5 days or
until growth occurs if before than.
c. One blood agar plate with a heavy suspension in saline solution spread over
the surface of the plate (lawn culture). Place a nalidixic acid disk and a
cephalothin disc separately on the dried surface of the plate. Incubate at
42±1 C in a microaerobic atmosphere for up to 2 days.
d. The hippurate hydrolysis test procedure as follows:
i. Dispense 0.5 ml sterile sodium hippurate in a small screw-capped tube.
ii. Inoculate with a loopful of 24 hour culture from blood agar to provide
a turbid suspension.
iii. Incubate tubes (including an uninoculated control) at 37±1 C for 2 h
iv. Add 0.2 ml of ninhydrin solution. Do not shake.
v. The development of a deep purple within 5 min is a positive result,
development of a slight bluish colour is negative.
e. Inspect the incubated cultures and record the reactions observed in the
following tests:
i. Motility – Campylobacters are motile in nutrient broth with the
corkscrew or darting motion.
ii. Conditions of growth – C. jejuni/C. coli do not grow at 37 C
aerobically or at 25 C under microaerobic conditions.
iii. Nalidixic acid sensitivity- C. jejuni/C. coli are sensitive to nalidixic
acid.
iv. Cephalothin sensitivity – C.jejuni/C/coli are resistant to cephalothin.
Sensitivity to nalidixic acid or cephalothin is indicated if the annular
radius of the zone of inhibition is 6 mm or more.
v. Hippurate hydrolysis test – C. jejuni hydrolyses hiuppurate; C. coli
does not.

50
Attachment 3: Form B: Sample Collection at Processing Facilities
FORM B: SAMPLE COLLECTION AT PROCESSING FACILITIES
Baseline survey on the prevalence and levels of Salmonella and Campylobacter along the poultry meat supply chain
The following information is to be provided by all participating jurisdictions to allow analysis of data.
CONTACT DETAILS FOR PARTICIPATING JURISDICTION
Name of sample collector: Phone number:
E-mail address:
Organisation:
INFORMATION ABOUT THE FACILITY BEING SAMPLED Facility being sampled:
Has this facility previously
been sampled? When?
INFORMATION ABOUT THE SAMPLES Sample type (carcass rinse or carcass):
Are there any circumstances whereby these
samples could be compromised?
Sample code Sample temperature Sample code Sample temperature
1. 6.
2. 7.
3. 8.
4. 9.
5. 10.
Further information about post-spin chill samples only:
Type of wash and chill system
Critical limits for controlling these systems
pH of spin chiller at sample collection
Chlorine concentration in the spin chiller at time of sampling
Further information about caeca samples only:
Crate time/use recorded for each sampling occasion
Age of flock
Number of previous pick-ups from the shed
Time-off feed

51
Attachment 4: Salmonella single and multiple serovar isolation profiles for positive
samples
Table 4.1.Salmonella single and multiple serovar isolation profiles for positive samples
Serovar (combination) Module 1: Rinse Module 2: Caeca Module 3 - Faeces TOTAL
Single NSW QLD SA WA SA WA WA
Adelaide 10 10
Agona 2 2 16 2 22
Anatum 1 1 2
Braenderup 1 1
Give 1 3 4
Havana 2 10 12
Heidelberg 1 1
Infantis 32 13 45
Kiambu 18 9 9 36
Livingstone 1 1 16 18
Mbandaka 1 2 1 2 1 33 40
Montevideo 4 12 16
Muenchen 2 2 4
Muenster 24 3 27
Ohio 1 1 2
Reading 13 4 17
Senftenberg 1 1
Senftenberg z27 1 1

52
Sofia 67 56 41 33 197
Subsp 1 ser 16:1,v:- 7 7
Subsp 1 ser 4, 12:d 1 1
Subsp 1 ser rough:r:1,5 1 1
Tennessee 1 1 2
Typhimurium 35 9 5 49
Typhimurium 6 1 1
Typhimurium 6 var 2 2
Typhimurium 12a 1 1
Typhimurium 193 1 1
Typhimurium 29 1 1
Typhimurium 35 5 3 8
Typhimurium 135a 2 3 5
Virchow 1 1 2
Unknown 1 1
Double
Adelaide & Montevideo 3 3
Adelaide & Muenster 1 1
Adelaide & Senftenberg 1 1
Infantis & Agona 1 1
Infantis & Montevideo 5 5
Infantis & Muenster 1 1
Infantis & Typhimurium 12a
1
1
Kiambu & Livingstone 3 3
Mbandaka & Havana 2 2
Mbandaka & Kiambu 7 7

53
Mbandaka & Livingstone 2 2
Mbandaka & Muenchen 1 1
Muenster & Montevideo 1 1
Muenster & Subsp 1 ser rough:r:1,5 3 3
Sofia & Agona 1 1
Sofia & Infantis 1 1
Sofia & Mbandaka 1 1
Sofia & Muenster 1 1
Sofia & Havana 1 1
Sofia & Reading 1 1
Sofia & Tenessee 1 1
Sofia & Virginia 1 1
Sofia subsp II & Give 2 2
Typhiumurium & Mbandaka 3 3
Typhimurium 14+ & Kiambu 1 1
Typhimurium 6 & Typhirmurium 6 va 9 9
Typhimurium 193 & Typhimurium 35 1 1
Triple
Mbandaka & Kiambu & Tennessee 1 1
Mbandaka & Kiambu & Livingstone 1 1