baseline survey on uganda’s national average automotive
TRANSCRIPT

1
BASELINE SURVEY ON UGANDA’S NATIONAL AVERAGE AUTOMOTIVE FUEL
ECONOMY
By
John Mutenyo (PhD)
School of Economics Makerere University
+256-718-504217/ +256-750-504217
Margaret Banga (PhD)
School of Statistics Makerere University
+256-701-475416
Fred Matovu (PhD)
School of Economics Makerere University
+256-752643706
Eng. David Kimera
School of Engineering Makerere University
+256-712-953661/+256-701876711
Kalyowa Lawrence
P.O Box 361131
+256704882826/+256774106047
FINAL REPORT
August, 2015
Contract Ref: UNEP/SSFA/DTIE/Energy/Transport/2014/CPL-5070-3E37-1111-220700

2
LOCAL PARTNERS
Makerere University College of Business and
Management Sciences Ministry of Energy &
COBAMS Mineral Development
INTERNATIONAL DONORS
i
Acknowledgement
The success of this report is entirely attributed to the kind assistance UNEP in conjunction with
Uganda’s Ministry of Energy and Minerals development. We also acknowledge the generous
contribution from other supporting agencies namely; European Union, GEF and the Global fuel
Economy Initiative. These organisations have made this work possible through financial
contribution and coordination roles to ensure this baseline is a success.
We thank the task force team in Uganda that consisted of several private companies and public
institutions such as The Ministry of Energy and Mineral Development, Ministry of Works and
Transport, Uganda Revenue Authority, KCCA, GIZ, Uganda National Bureau of standards,
Uganda police, and car franchises in Uganda (i.e. Toyota, Mantrac, Delta, TATA, Bajaj, TVS,
Victoria Motors, Motor Care, Cooper Motors Cooperation, and Mahindra); as well as our
colleagues in Kenya.

ii
Executive Summary
More recently, the global oil demand has steadily increased, largely due to rapid motorization
taking place in developing countries. Over 50% of oil use around the world is for transport and
nearly all the recent and future expected growth in that use comes from increased transport
activity whilst the global transport sector contributes about 25% of the energy related global GHG
emissions. Due to the rapid growth in vehicle population in developing countries, especially
private passenger vehicles, controlling the fuel energy demand and greenhouse gas (GHG)
emissions has become a global concern. The process of burning fuels by driving vehicles
produces greenhouse gases such as carbon dioxide (CO2) into the atmosphere which contributes
to climate change. These emissions can be reduced by improving motor vehicle fuel efficiency,
which in turn reduces the nation’s dependence on oil and saves money.
The Global Fuel Economy Initiative (GFEI) launched in 2009 aimed at reducing localized air
pollution and Green-House Gas (GHG) emissions through the promotion of cleaner and more fuel
efficient vehicles. Globally, the motivation for implementing CO2 (GHG) emissions and fuel
economy standards emanates from the threat of climate change and potential oil shortages.
Thus, promoting fuel efficiency and reducing carbon dioxide (CO2) emissions is a key global
development agenda. The GFEI has set a target of a 50% improvement in vehicle fuel economy in
new LDVs by 2030 and across the total global car stock by 2050 as part of the post-2015
Sustainable Development Goal (SDG) framework. In Uganda, vehicle emissions are a major
contributor to poor air quality in urban areas, particularly due to increased importation of used
vehicles.
The key objective of the study was to prepare a vehicle inventory and vehicle import trend in order
to establish the Uganda’s national average fuel economy (baseline setting) and trend. This
information was then used to compute carbon emission levels arising from automobile pollution.
Information on vehicular emission was used to prepare policy recommendations to support import
of cleaner and more efficient vehicles into Uganda.
Data on vehicle inventory in Uganda were obtained from the Ministry of Works and Transport and
the Uganda Revenue Authority for public and private vehicles respectively for the period 2000 to
2014. We found that 5.63 percent and 94.37 percent of the automobiles were owned by the
state/government and private respectively. Of these automobiles 0.9 percent constituted
engineering plants (tractors, bull dozers etc) and 46. 62 percent were classified as motor vehicles
(i.e. Station wagons, saloon, etc) and 52.48 percent were motorcycles. A model was developed to
incorporate age in the fuel consumption of automobiles, the carbon dioxide emissions were
computed using the fuel consumption values after factoring in age. The harmonic average fuel
efficiency has declined from 12.52 L/100km in 2005 to 13.73 L/100Km in 2014 and this is
attributed to the increase in the average age of vehicles imported into the country. Average carbon
dioxide emission has also worsened from 465 g/km in 2005 to 503g/km in 2014. We further found
that the age of a vehicle other factors constant greatly influences carbon emission. Also, vehicles

iii
with a higher engine capacity pollute more than those with smaller capacity. In addition diesel
engine vehicles pollute more than petro engine vehicles even if they are of the same engine size.
In conducting a cost benefit analysis, we used a simple analysis involving different forms of
transport, and we found that a bus carrying 80 passengers for a distance of 21km a day for one
year would use fuel worth UGX 3.3 millions and pollute 3.2 tons of carbon dioxide. While to
carry the same number of passengers for the same distance we would need 6 commuter taxis of
capacity 14 passengers which would require 5 times more fuel and pollute 5 times more than the
buses. As for the motorcycles we would need 80 motor cycles which would consume 13 times
more than the bus in one year and pollute 6 times more.
We recommend that the line agencies should ensure that their draft policies are put into action so
as to reduce the levels of carbon dioxide emissions. Particularly, NEMA should enact the air
quality standards to guide the partner institutions in exercising their duties. Other
recommendations include differential tax rates/fees based on age of the vehicle such that a higher
tax rate is imposed on older vehicles than on newer ones; There should be periodic inspection of
all automobiles (vehicles and motorcycles) that are already registered in the country, and
government should impose a limit/ceiling of emission per category of engine capacity of the
vehicle beyond which the vehicle should either be put off the road, install a catalytic converter or
pay a fee for polluting the environment. All imported automobiles should be subjected to
compulsory testing for fuel economy and carbon emission before registration. In addition to other
specifications, vehicle inspections before importation should include carbon emission levels.
Vehicles that are to be imported into the country should be labeled with “Fuel economy and
Environmental Labels,” for easier comparison during shopping. Encourage public transportation
by providing parking places at different entry points into the city for private automobiles.
Discourage private transport into the City by increasing parking fees. Make walking and biking
safe to the users by providing walk ways, security lights and security along the City roads.

iv
Contents Acknowledgement ......................................................................................................................................... i
Executive Summary ...................................................................................................................................... ii
Contents ....................................................................................................................................................... iv
List of Tables ............................................................................................................................................... vi
List of figures .............................................................................................................................................. vii
List of Abbreviations and Acronyms ......................................................................................................... viii
INTRODUCTION ........................................................................................................................................ 1
1.1: Background ........................................................................................................................................ 1
1.2.1: Objectives ................................................................................................................................... 4
1.2.2: Study Activities ........................................................................................................................... 4
2.0: BACKGROUND ON VEHICLE FUEL EFFICIENCY POLICIES AND REGULATIONS .............. 6
2.1: Current Policies for Uganda............................................................................................................... 6
2.2: Proposed Interventions for Fuel Efficiency and Carbon Emission in Uganda. ................................. 7
2.2.1: Proposed Interventions for Fuel Efficiency and reduced Carbon Emission in Greater Kampala
Metropolitan City .................................................................................................................................. 7
2.2.2: Proposed Interventions by National Environmental Authority (NEMA) ................................. 10
2.3: A Review of Fuel Efficiency Policies in other Countries ................................................................ 12
3.0: AUTOMOBILE INVENTORY, FUEL ECONOMY & CO2 EMISSION .......................................... 16
3.2: Vehicle Distribution by Engine Capacity ........................................................................................ 18
3.3: Age Distribution of Vehicles ........................................................................................................... 19
3.4: Vehicle Fuel Economy and CO2 Emissions ..................................................................................... 24
3.5: Methodology .................................................................................................................................... 25
3.5.1: Modeling the Relationship between Age of Vehicle, and Fuel efficiency .................................. 25
3.6.2: Carbon dioxide (CO2) Emission Computations ........................................................................ 28
3.7: Results of Harmonic fuel efficiency and carbon-dioxide emissions. ............................................... 29
3.7.1 Results of Harmonic fuel efficiency of vehicle fleet.................................................................. 29
3.7.2; Results of Harmonic fuel efficiency of vehicle fleet. ............................................................... 31
3.7.3: Results of Harmonic fuel efficiency of motorcycle fleet (2000 – 2014). ................................. 37
4.0: FUEL EFFICIENCY AND CO2 FORECASTING .............................................................................. 40
5.0: COST BENEFIT ANALYSIS OF FUEL ECONOMY POLICY INTERVENTIONS ....................... 46
The Policy options to consider include: .............................................................................................. 55

v
Imposing Regulatory policies ............................................................................................................. 55
Promoting use of Bulk Public transport .............................................................................................. 59
6.0: POLICY SUGGESTION FOR IMPROVING FUEL EFFICIENCY AND REDUCING CARBON
EMISSIONS IN UGANDA .................................................................................................................... 61
6.2: Consumer Awareness Strategies ................................................................................................. 62
6.3: Policies for Ugandan Institutions; URA, KCCA, Police, Uganda Inspection Agency: ............... 64
7.0: SUMMARY, CONCLUSION, RECOMMENDATIONS AND LIMITATIONS TO THE STUDY . 66
7.4: LIMITATIONS ............................................................................................................................... 67
REFERENCES ........................................................................................................................................... 68

vi
List of Tables
Table 1: Fuel efficiency interventions in developed countries ................................................................... 13
Table 2 Vehicle Inventory by status at Registration: 2000-2014 ................................................................ 17
Table 3 Vehicle Inventory by Engine Capacity and Status at Registration ................................................ 18
Table 4: Average Age and Engine capacity by Fuel type and year of Registration ................................... 20
Table 5: Average Age and category by Fuel type and year of Registration ............................................... 21
Table 6: Average Fuel Efficiency by weight category and Year of Registration and fuel type .................. 29
Table 7: Average carbon-dioxide emissions by fuel type and year of registration. .................................... 31
Table 8: Harmonic fuel efficiency and average carbon-dioxide emissions by year of registration ............ 33
Table 9: Fuel Efficiency and Carbon Emission for Motorcycle by Year of Registration ........................... 37
Table 10: Financial costs for automobiles in 2014 ..................................................................................... 48
Table 11: Financial benefit of foregone Carbon emissions for automobiles by fuel type .......................... 49
Table 12: Financial costs of Diesel and petrol fleet in 2014 by vehicle weight. ........................................ 51
Table 13: Financial benefits of Diesel and Petrol fleet in 2014 by vehicle weight. .................................... 53
Table 14: A projected estimate of future financial cost (2050) .................................................................. 55
Table 15: A projected estimate of future financial benefit from LDV ........................................................ 56
Table 16: Analysis of financial cost after imposing a 20 year ban. ............................................................ 58
Table 17: Analysis of financial benefit after imposing a 20 year ban......................................................... 59
Table 18: Carbon Emission and cost of fuel using alternative means of Transport .................................... 60
vii
List of figures
Figure 1: Distribution of New Vehicles by Fuel Type and Engine Capacity. ............................................ 19
Figure 2: Average age of Diesel vehicles ................................................................................................... 20
Figure 3: Average age of Petrol engine vehicles ........................................................................................ 21
Figure 4: Average age of vehicles by weight category. .............................................................................. 22
Figure 5: Average age and environmental levy .......................................................................................... 23
Figure 6: Relation between Fuel Efficiency and Age of vehicle ................................................................ 27
Figure 7; Average fuel efficiency (L/100Km) for Diesel fleet. .................................................................. 29
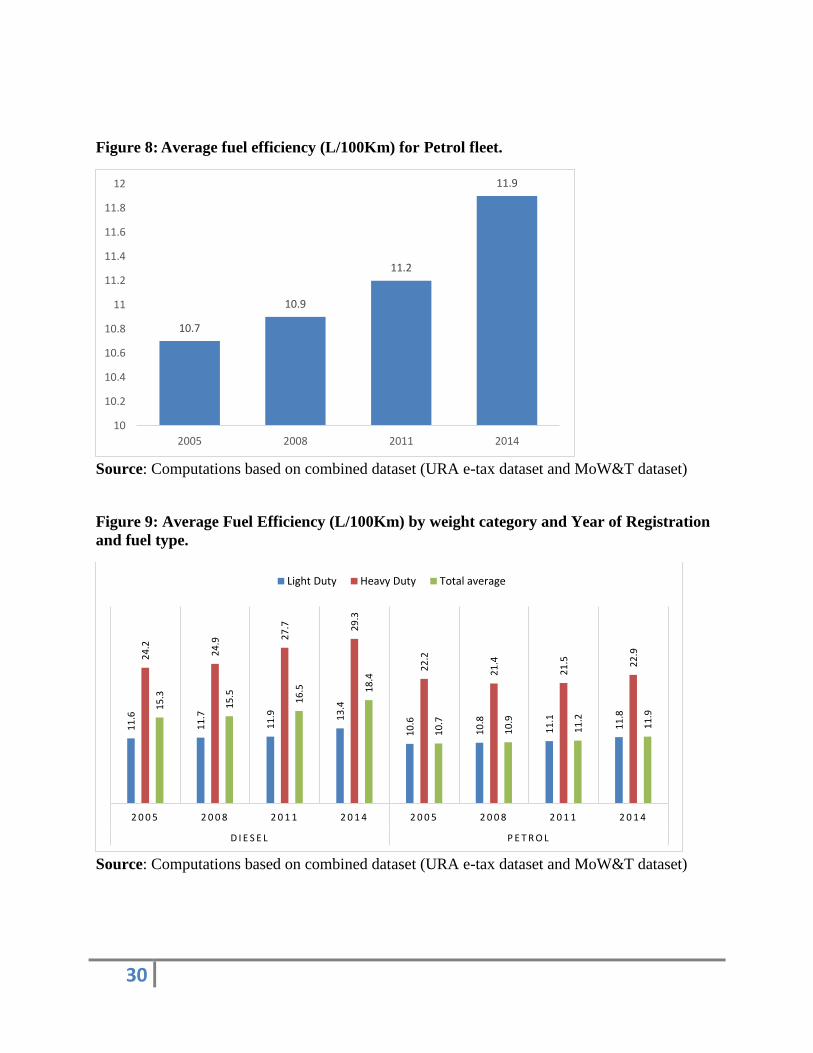
Figure 8: Average fuel efficiency (L/100Km) for Petrol fleet. ................................................................... 30
Figure 9: Average Fuel Efficiency (L/100Km) by weight and Year of Registration and fuel type. .......... 30
Figure 10: Average carbon-dioxide emissions of diesel fleet. .................................................................... 31
Figure 11: Average carbon-dioxide emissions for petrol fleet. ................................................................... 32
Figure 12: Average CO2 emission by weight category and Year of Registration and fuel type. ................ 32
Figure 13: Trend of harmonic fuel efficiency of LDV fleet by year of registration. .................................. 34
Figure 14: Trend of harmonic fuel efficiency of HDV fleet by year of registration. .................................. 34
Figure 15: Trend of annual harmonic fuel efficiency by year of registration. ............................................ 35
Figure 16: Trend of average carbon-dioxide emissions of LDV fleet by year of registration. ................... 35
Figure 17: Trend of average carbon-dioxide emissions of HDV fleet by year of registration. ................... 36
Figure 18: Trend of average carbon-dioxide emissions by year of registration. ......................................... 36
Figure 19: Average Age of Motorcycles ..................................................................................................... 38
Figure 20: Average fuel efficiency of motorcycles..................................................................................... 38
Figure 21: Average carbon dioxide emission of motor cycles ................................................................... 39
Figure 22: Petrol Vehicle Fleet Projections ................................................................................................ 41
Figure 23: Diesel Vehicle Fleet Projection ................................................................................................. 41
Figure 24: All Vehicle fleet Projection ....................................................................................................... 42
Figure 25: FE with Surcharge and FE without surcharge (WET) policy projections for Diesel fleet. ....... 43
Figure 26: FE with Surcharge and FE without surcharge policy projections for petrol fleet. .................... 44
Figure 27: CO2 Emission with Surcharge and CO2 without surcharge policy projections for Diesel fleet. 44
Figure 28: CO2 Emission with Surcharge and CO2 without surcharge policy projections for Petrol fleet. 45

viii
List of Abbreviations and Acronyms
CC Cubic Centimeter
CO2: Carbon dioxide
GFEI: Global Fuel Economy Initiative
GHG: Green House Gases.
GKMA Greater Kampala Metropolitan Authority
HDV: Heavy Duty Vehicles
IEA: International Energy Agency
KCCA Kampala Capital City Authority
LDV: Light Duty Vehicle
MDAs: Ministries, Departments and Agencies (of Government)
MDV: Medium Duty Vehicle
MEMD: Ministry of Energy & Mineral Development
MoW&T: Ministry of Works and Transport
NEDC: New European Drive Cycle
NEMA: National Environment Management Authority
NMT: Non-Motorized Transport
OECD: Organization for Economic Co-operation and Development
Ppm: Particulates per Molecule
SDG Sustainable Development Goal
ToR: Terms of Reference
UN United Nations
UNFCCC: United Nations Framework Convention on Climate Change
UNEP: United Nations Environment Programme
URA: Uganda Revenue Authority
USD United States Dollar

1
INTRODUCTION
1.1: Background
The Global Fuel Economy Initiative (GFEI) was launched in 2009 and its main aim is reducing
localized air pollution and Green-House Gas (GHG) emissions through the promotion of cleaner
and more fuel efficient vehicles. Globally, the motivation for implementing CO2 (GHG)
emissions and fuel economy standards emanates from the threat of climate change and potential
oil shortages. The United States was the first country to establish fuel economy standards for
passenger vehicles after the 1970’s oil crisis. More recently, the global oil demand has steadily
increased, largely due to rapid motorization taking place in developing countries, in particular in
countries with rapidly growing economies, such as Brazil, China, India and others. Over 50% of
oil use around the world is for transport and nearly all the recent and future expected growth in
oil use comes from increased transport activity (GFEI Plan of action 2012-2015). Due to the
rapid growth in vehicle population, especially private passenger vehicles, controlling the fuel
energy demand and greenhouse gas (GHG) emissions has become a global concern (Feng, et al
2011).
According to the GFEI report of fuel economy 2014, the global transport sector contributes about
25% of the energy related global GHG emissions. Globally, the transport sector is rising faster
than any other sector and the number of vehicles on the planet is set to triple by 2050 - the vast
majority in non-OECD countries (GFEI, 2014). Thus, promoting fuel efficiency and reducing
carbon dioxide (CO2) emissions is a key global development agenda. The GFEI has set a target
of a 50% improvement in vehicle fuel economy in new Light Duty Vehicles (LDV) by 2030 and

2
across the total global car stock by 2050 as part of the post-2015 Sustainable Development Goal
(SDG) framework.
Fuel economy standards have mostly been implemented in the developed (OECD) countries such
as the US, Canada, Japan the EU, the BRICS (Brazil, Russia, India, China and South Africa),
and a few other emerging economies. According to the GFEI 2014 report, only Mauritius has
developed and implemented the first fuel economy/CO2 based fee-bate system in the developing
world. However, through the GFEI, more countries are acknowledging the need for strong
policies on fuel efficiency, and more are investigating, developing and implementing those
policies (GFEI 2014).
In Uganda, vehicle emissions are a major contributor to poor air quality particularly in urban
areas. Vehicular emissions contribute to GHG responsible for global warming. Uganda ratified
the United Nations Framework Convention on Climate Change (UNFCCC) aimed at combating
the problem of climate change. Over 70% of Uganda’s population depends on agriculture, but
the productivity of this sector highly depends on good climate. Hence implementing the GFEI is
a civil obligation as well as a development concern.
The economic benefits of promoting fuel economy policies range from fuel savings to reductions
in respiratory tract infections (RTI) among communities. For example a recent study for the
Kenyan economy shows that with around 1.2 million cars, (about 30 vehicles per 1000 people),
Kenyans already import about USD 2 billion worth of fuel oil per year (GFEI 2014). Modest
projections show that the stock of vehicles will at least triple by 2030 and increase by as much as

3
10-fold by 2050 to around 10 million vehicles (based on UN population projections). Given the
current fuel efficiency rate of 8l/100km from the GFEI 2008 study, the USD 1.5 billion currently
spent on fuel would rise to USD 6billion in 2030 and to USD 20 billion in 2050 (in constant
dollars). These projections demonstrate the large potential financial savings from promoting fuel
efficiency in addition to the benefits accruing from cleaner environment. The savings could be
even greater if they were combined with other transport policies, such as shifting vehicles to new
fuels, non-motorized transport (cycling and walking) and curbing car travel growth through
sensible transport policies.
Uganda has not had a comprehensive policy for fuel economy and this baseline study through the
GFEI and UNEP support is the first step to developing and implementing a National fuel
economy policy. The draft Urban transport policy, the non-motorized transport policy 2012, the
draft KCCA transport management policy guidelines all include elements geared towards
improving fuel efficiency, but implementation has hitherto been weak and uncoordinated.
Globally, climate change is considered one of the most important environmental issues due to its
effects on global warming. It is caused by both natural processes and human activities.
Empirical studies have shown that human activities particularly those that lead to emission of
carbon dioxide and other greenhouse gases to the atmosphere are the greatest contributors of
global warming. The consequences of air pollution are disastrous and range from health-related
problems (respiratory, poor heart conditions and cancer), effects on landscapes, reduction in
agriculture production, global warming, acid rain, effects on wildlife and depletion of the ozone

4
layer. It is therefore every ones concern and governments, businesses and consumers to reduce
air pollution.
Researchers from Makerere University, including Economists, a Mechanical Engineer, an
environmental expert and a Statistician supported by the Ministry of Energy & Mineral
Development (MEMD) under the GFEI/ UNEP - contract
(UNEP/SSFA/DTIE/Energy/Transport/2014/CPL-5070-3E37-1111-220700) were contracted
to prepare a vehicle inventory baseline and analyze trends, and propose policy options for
Uganda that would inform the National’s fuel efficiency policy development.
1.2: Study Objectives, and Activities
1.2.1: Objectives
The key objective of the study was to prepare a vehicle inventory, vehicle import trend and
establish the Uganda’s national average fuel economy and trends. This information would then be
used to compute carbon emission levels arising from automobile pollution. Information on
vehicular emission would then be used to prepare policy recommendations to support import of
cleaner and more efficient vehicles into Uganda.
1.2.2: Study Activities
The first activity was to carry out a vehicle inventory status in Uganda. The inventory provides
the following data:
1. The stock of vehicles imported between 2000 and 2014 including both new and used;
2. The average vehicle age distribution of existing cars;

5
3. The different vehicle specifications, regarding vehicle model and make, engine size;
technology, and any other relevant information that is useful in estimating carbon
emission;
4. Fuel efficiency of the newly registered vehicle stock (second-hand and new) in 2005,
2008, 2011 and 2014;
5. Estimated carbon emission by fuel type of the vehicle and engine capacity category.
The second part of the study involves a review of government regulations and incentives to
promote cleaner and fuel efficiency vehicles. Thirdly, to conduct a socio-economic analysis
(cost-benefit analysis) of key policy interventions to promote fuel efficiency and carbon emission
reduction by the different motor vehicle categories. The fourth activity entails providing policy
recommendations that are aimed at reducing carbon emission such as regular vehicle inspection,
fiscal incentives/disincentive programs, (taxation, fee-bates), traffic control policies, consumer
awareness and other technologies.

6
2.0: BACKGROUND ON VEHICLE FUEL EFFICIENCY POLICIES AND
REGULATIONS
2.1: Current Policies for Uganda
There is little documented about the current policy interventions being implemented to promote
fuel efficiency (economy) in Uganda. This is largely because there is no national vehicle fuel
economy policy in place currently. Nonetheless, the non-motorized transport policy 2012, and
the draft Urban Transport policy (2014), contain a number of proposals for traffic management
and safety, road quality and promotion of public transport, all of which if fully implemented
would contribute to the vehicle fuel efficiency, particularly for motor vehicles within the capital
City and other major towns. For instance, according to the Uganda Vision- 2040, at least 80% of
Uganda freight transport will be carried by rail and the standard gauge rail will transport at least
10% of all persons for interurban and international trips by year 2040 (NPA 2010). The review
of documents and consultations held with stakeholders revealed that there are a few interventions
directly related to fuel efficiency. These include a 20% surcharge tax on vehicles older than 8
years; pre-shipment inspection and certification of vehicles for road worthiness and the control
of heavy metals and carbons (Lead, Sulphur and Benzene) in gasoline and Diesel.
Starting from year 2011, there has been an initiative through UNEP, to introduce low sulphur
diesel fuel in East Africa. Prior to 2011, the sulphur levels found in diesel in the East African
region ranged between 5,000 parts per million (ppm) and 10,000 ppm, compared with that in
developed countries ( US and Europe) standards of 10-15 ppm. In 2011, UNEP supported the
countries in the region and lowered the amount of sulphur allowed in diesel fuel from 5,000 ppm
to 500 ppm. The target is to achieve 50 parts per million sulphur fuels standards effective

7
January 2015 (UNEP 2014). However, there is no documentation regarding the progress that has
been made towards this goal.
Findings from this study have revealed that the 20 percent surcharge levied on automobiles that
are older than 8 years at first registration has not been deterrent enough to the importation of
older vehicles; therefore could be judged to be ineffective as an emission efficiency measure.
This could be because the cif value of older vehicles is low relative to brand new cars and with
the low national income per capita, the proportion of potential vehicle buyers/owners who can
afford brand new vehicles is very small1.
2.2: Proposed Interventions for Fuel Efficiency and Carbon Emission in Uganda.
2.2.1: Proposed Interventions for Fuel Efficiency and reduced Carbon Emission in Greater
Kampala Metropolitan City
Although still in draft form, several interventions have been designed to reduce traffic congestion
hence air pollution arising from motor vehicles. Among these include the following;
2.2.1.1: Promoting the Use of Non-Motorized Transport (NMT).
The Non-Motorized Policy 2012 clearly spells out the strategic objectives and actions required to
promote cycling and pedestrian mode of transport within the City (KCCA, 2012). The objectives
of this policy (also reflected in the Draft Urban Transport Policy) include:
1. Increasing the recognition of walking and cycling in transport, planning, design, and
infrastructure provision;
2. Providing safe infrastructure for pedestrians and cyclists;
1 The estimates in Tables 3 and 4 show that the average age of all privately owned vehicles imported between
2005 and 2014 ranged between 10 and 17 years.
8
3. Mainstreaming resources for walking and cycling in agencies’ financial planning;
Developing and adopting universal design standards that provide for access to all sectors
of the community; and
4. Improving regulation and enforcement to enhance safety for pedestrians and cyclists.
Accordingly, government intends to increase the safe space available to NMT users through the
consistent enforcement of existing regulations to prevent the encroachment of road shoulders and
footways by constructions, stationary vehicles and informal trading enterprises. Government will
also ensure that the needs of pedestrians and cyclists are adequately addressed in the planning,
implementation, regulation and enforcement of roads and urban infrastructure in KCCA and
GKMC. It is further expected that KCCA will promote the provision of adequate facilities for the
safe parking of bicycles at public buildings, markets, transport terminals, hospitals, educational
establishments, sports grounds, shopping malls and large business premises. Once implemented,
this policy will lead to reduced use of motorized transport into the capital city, thereby improving
the fuel efficiency ratings and emission reduction in the country.
2.2.1.2: Development of an Integrated Public Transport System
The draft Urban Transport Policy (2014) stipulates that government will, "develop a safe,
affordable, fast, comfortable, reliable and sustainable public transport system with a strong mass
transit network supplemented by other modes (pedestrian, cycling, minibus, bus, motor cycles
commonly known as boda-boda) that meets the needs of various socio-economic and special
interest groups in the GKMA". Under this model, government will encourage high capacity
public transport systems, and raise the profile of walking, cycling, and public transport, and the
benefits of these transport modes through the provision of information, facilities and active
promotion to drive change in travel behaviour. Implementing this policy will translate into more

9
people relying on public transport rather than driving their personal vehicles into the city on each
travel, hence translating into personal and societal cost savings (fuel and environmental
efficiency gains).
2.2.1.3: Equitable Allocation of Road Space with priority to Public Transport
Under this policy, government will ensure that priority (and preference) is given to, and right of
way to public transport modes in terms of allocating time, space and facilities along transport
corridors with high traffic flow volumes. By giving public transport vehicles priority lanes and
preference at intersections in KCCA and KMTC, and allocation of parking space at terminal and
public transport routes within the city, Use of public transport system would become more
convenient and reduce proliferation of car use for trips to and from Kampala City. It is expected
that as more travelers use public transport than personal cars and small omnibuses, fuel
efficiency gains shall significantly increase.
2.2.1.4: Enhancement of Traffic Management and Safety
Traffic congestion within the city, especially during peak hours, is a major contributor of fuel
inefficiencies, where motor vehicles stay in idling for long periods of time, emitting carbon-
gases and consuming fuel unnecessarily. In addition, most roads in the City (and major towns in
general) were designed and constructed without taking into account the needs of pedestrians and
non-motorized vehicle (NMV) transport, and many still receive irregular and inadequate
maintenance. These factors compound the fuel inefficiencies experienced in the City and major
towns currently. Government plans to ensure the construction of ring-roads as provided by the
KPDP, and flyovers in KCCA to replace the under capacity roundabouts to raise traffic flow
speeds and a more smooth traffic flow (Republic of Uganda, 2012). The construction of ring-

10
roads and flyovers, backed by regular effective road maintenance and enhanced implementation
of traffic management measures will greatly improve fuel efficiency for all types of motor
vehicles within the City.
2.2.2: Proposed Interventions by National Environmental Authority (NEMA)
The Environmental Legislation Act (2008) states that the owner or operator of a production or
storage facility, motor vehicle, motorcycle or vessel has to take mitigation measures to control
pollution, and the Authority has the powers to seize the polluting production facility, motor
vehicle or vessel. The National Environment (Air Quality) draft regulations apply to any activity
requiring a pollution licence under Section 58(4) of the Act. The regulations apply to any facility
or process that discharges or is capable of discharging air pollutants into open air; and any
activity which results in atmospheric emissions and which the Authority believes has or may
have significant detrimental effect on the environment including health, social conditions,
economic conditions, and ecological conditions.
The National Environment (Air Quality) regulations are to serve the purpose of; setting baseline
parameters on air quality and emissions based on a number of practical considerations and
acceptable limits, enforce the air quality standards, prescribe general measures for the control of
air pollution in all areas including residential, commercial areas and industrial areas, and ensure
protection of human health and the environment from various sources of air pollution. It further
states that all individuals shall be required to comply with the minimum air quality standards
prescribed in these regulations.
The regulations also provide that any person who undertakes an activity likely to pollute the air
shall be required to comply with the highest permissible quantity of emission of sulphur oxides,

11
carbon monoxide, hydrocarbon as total organic carbon, dust, nitrogen oxides or lead released
into the atmosphere from a pollution source and test methods prescribed under the second
schedule to these Regulation.
Our review shows that there is very little regulation on fuel efficiency within the existing
environmental and air quality legislations. However, with specific reference to motor vehicles,
the regulations provide that: Every automobile (motor vehicle or motorcycle) to be imported or
registered on or after the coming into force of these regulations shall conform to the standard of
exhaust emission specified in these regulations.
2.2.3: Intervention by Ministry of Works and Transport
The MoW&T has contracted a company that shall carry out a mandatory periodic inspection on
all automobiles for both road worthiness and public service worthiness, irrespective of ownership
with exception of where exemptions apply. All private automobiles are to be exempted from the
mandatory inspections for four years from the date of first registration regardless of the country
of registration. Public service vehicles, private omnibuses, trailers and goods vehicles shall be
inspected before getting licenses; while motorcycles shall be subjected to the mandatory
inspections one year after first registration regardless of the country of first registration. They
shall setup different test stations which will include; motorcycle test stations, light vehicle test
stations and heavy vehicle test stations. The test stations shall entail semi-automated or fully
automated inspection procedures. The inspection is to follow the inspection standards set by
UNBS.

12
2.3: A Review of Fuel Efficiency Policies in other Countries
Whereas the range of policies being implemented in Uganda to promote fuel efficiency is
limited, the review of literature shows that a number of policies are being implemented in
different forms, especially in the developed and middle income countries. They include:
regulatory policies such as import restrictions on used (second hand) vehicles; ban on diesel
passenger car imports; and varying registration fees based on type of vehicles (brand new versus
used or fuel type and engine capacity). Others are Vehicle inspections2 and use of catalytic
converters. A summary of the vehicle fuel efficiency interventions implemented in different
settings, mostly in developed countries, is given in the box below.
2 Inspection involves; vehicle identification, braking equipment, steering, visibility, lighting equipment
and parts of electric system; axles, wheels, tyres and suspension, chassis and chassis attachments. Others
are other equipment – safety belts, fire extinguisher, locks and anti-theft device, warning, triangle, first-
aid kit, speedometer, etc; nuisance – noise, exhaust emissions, etc; supplementary tests for public
transport vehicles – emergency exit(s), heating and ventilation systems, seat layout, interior lighting;

13
Table 1: Fuel efficiency interventions in developed countries
There are also fiscal incentive programmes aimed at improving fuel economy, especially when
implemented in combination with standards. Incentives can be directed at improving the
efficiency of the vehicle fleet, through variable registration fees or taxes, or by limiting vehicle
use, through fuel taxes and road user fees (Feng et al 2011). Likewise, traffic control measures
have been used in different settings, and these include priority lanes, parking restrictions and
road pricing. For example, Brazil has banned importation of used vehicles3 and diesel passenger
car imports (Brazil’s Developing Automotive Fuel Economy Policy, 2012). There is evidence
3 Brazil currently manufactures motor vehicles and total ban of used vehicles also serves to promote the local
industry.

14
that new cars are potentially high fuel efficient. For example, the Indian Tata Nano new model
has been certified at 4.24 L/100km (4.55 L/100km in the city and 3.85 L/ 100km highway)
which is a consumption rate 28% lower than the 2008 estimated average of 5.86 L/100 km
(India’s Developing Automotive Fuel Economy Policy, 2012). Likewise, there is a program that
obliges each car to be kept off the street within the capital (São Paulo), during rush hour for one
day each week. There are also special bus lanes that help public transport move more easily. Car
manufacturers in Brazil have also implemented a labeling system for cars which informs
consumers about the fuel efficiency of the new vehicles they might purchase. There are also
restrictions on use of 100% gasoline. Recommended fuels used are 22 percent ethanol (E-22),
100 percent ethanol (E-100), and a mixture of any blend of ethanol and gasoline from 22 percent
ethanol to 100 percent ethanol (E22/E-100).
Studies on fuel efficiency in India show a range of strategies that have been adopted and their
impact in improving fuel efficiency overtime. For instance, only second hand vehicles not older
than three years from the date of manufacturer are allowed into the country. In addition, such
vehicles should have a minimum roadworthiness for a period of 5 years from the date of being
brought into the country (India's DAFEP, 2012). Besides being less than 3 year old, second hand
cars are subjected to testing by the Automotive Research Association of India or an agency
appointed by the central government. In order to address the need for fuel efficiency of vehicles
in India, an excise rate of 12 percent is imposed on small cars as opposed to 24 percent on bigger
cars. This tax differential makes small cars, which are more fuel efficient, cheaper and more
desirable. India, also subsidizes diesel fuel and the share of diesel vehicles in the new car market
is growing rapidly. By 2013, 1/3 of passenger vehicles were diesel (GoI, 2004). Due to the

15
subsidy, diesel fuel is 33% cheaper than petrol (about 41 v. 64 Rs./Liter; GoI, 2014). Other
measures implemented in India since 2003 include improving the quality of gasoline by reducing
the Lead, sulphur and Benzene content in the gasoline. Similar improvements in the quality of
diesel have been pursued. The 2012 report of an expert committee on Fuel economy in India
shows that over the period 2003-2012, the Sulphur and Benzene content in gasoline used had
reduced by 50 percent and 80 percent respectively, while lead content in gasoline was phased
out in 6 years following the Auto fuel policy 2003 legislation (GoI, 2014).
In summary, the range of policies option available for Uganda to promote vehicle fuel efficiency
include: regulatory policies, fiscal-related incentives/disincentives, and traffic control measures.
However, the implementation of these policies depends on the level of technology, the level of
the infrastructure (e.g. road network) and the institutional capacity for enforcement of these
policies.

16
3.0: AUTOMOBILE INVENTORY, FUEL ECONOMY & CO2 EMISSION
3.1: Automobile Inventory
The data on automobiles (vehicles and motorcycles) imported into Uganda are captured by three
different agencies; namely: URA (for privately-owned automobiles), and Ministry of Works and
Transport (MoW&T-for state owned automobiles) and Ministry of Defense (armored vehicles).
A complete national vehicle inventory would constitute all vehicles and motorcycles coming
through the three channels, but the study is based on data collected from URA and MoW&T.
Data obtained from URA contained 815,382 automobiles (vehicles and motorcycles) imported
between the period 2000 and 2014. Automobile data at URA are captured under both the e-tax
and customs records. Initial analysis of datasets from these sources revealed that there were
multiple entries (in e-tax and customs data sources) based on the chassis number and engine
numbers, which are the unique identifiers for any automobile. However, the combined dataset
(from e-tax and customs records) did not have all the variables required for fuel efficiency and
CO2 analysis, and also included trailers which we had to exclude from the analysis since they do
not emit nor consume fuel. The e-tax dataset4 (of 416,412 automobiles) which contained most of
the variables of interest for this study, while the database from MoW&T included 24,848
automobiles imported over the period 2000 - 2014. After combining URA e-tax data with
MoW&T, data cleaning and editing, we obtained an inventory of 441,260 automobiles (both
vehicles and motorcycles). It appears that the switch to the e-tax system and computer-based
recording of imported vehicles could have led to loss of data, but it was not possible to verify the
4 The e-tax dataset is a collection of validated automobiles and newly registered automobiles dating 2012 – 2014.

17
particular source of anomaly with URA. Table1 gives a summary of the vehicle inventory at
registration.
Table 2 Vehicle Inventory by status at Registration: 2000-2014
Year of
Registration
DIESEL PETROL
New Old Total
New as %
of total New Old Total
New as
% of
total
2000 533 254 787 67.7 295 367 662 44.6
2001 676 391 1,067 63.4 297 502 799 37.2
2002 788 520 1,308 60.2 252 634 886 28.4
2003 850 678 1,528 55.6 268 769 1,037 25.8
2004 973 942 1,915 50.8 345 1,245 1,590 21.7
2005 1,042 1,227 2,269 45.9 392 2,071 2,463 15.9
2006 1,218 1,543 2,761 44.1 379 2,308 2,687 14.1
2007 1,540 2,306 3,846 40.0 474 3,557 4,031 11.8
2008 1,723 3,034 4,757 36.2 434 4,449 4,883 8.9
2009 1,510 3,354 4,864 31.0 380 5,007 5,387 7.1
2010 1,476 3,632 5,108 28.9 399 6,939 7,338 5.4
2011 2,507 3,274 5,781 43.4 350 7,404 7,754 4.5
2012 3,206 5,029 8,235 38.9 578 13,624 14,202 4.1
2013 4,848 12,620 17,468 27.8 967 28,770 29,737 3.3
2014 5,881 18,176 24,057 24.4 1,094 39,405 40,499 2.7
Total 28771 56980 85751 33.6 6904 117051 123955 5.6
Source: Computations based on combined dataset (URA e-tax dataset and MoW&T dataset)
From Table 2 above, we note that only 33.6% of diesel vehicles registered by URA and MoW&T
are new5 compared with only 5.6% of petrol registered vehicles for the period 2000 - 2014. Also
59.1% of the vehicle fleet, use petrol (i.e. ratio of petrol fleet to total fleet). We found that the
percentage of new vehicles to the total fleet imported by each year of registration dropped from
67.7 to 24.4 percent and 44.6 to 2.7 percent from 2000 to 2014 for Diesel and Petrol vehicle fleet
respectively.
5 According to URA definition, a vehicle is new if at registration, its age from the date of manufacture is less than
eight years.

18
3.2: Vehicle Distribution by Engine Capacity
The distribution of vehicles by vehicle weight, engine capacity and status at registration was
assessed and is presented in Table 3.
Table 3 Vehicle Inventory by Engine Capacity and Status at Registration
Source: Computations based on combined dataset (URA e-tax dataset and MoW&T dataset)
From Table 3, we observe that 36.4 percent of LDV’s using diesel are new on first registration
while those using petrol are only 5 percent. We have noticed in table 3, that most of the LDV
automobiles use petrol fuel (ie. 73.6 percent). Higher percentages of new vehicles which use
diesel fuel come in capacities of 2001_2500CC and 3001_3500CC where the new vehicles
supersede the old ones. We also note that most vehicles that use petrol in the capacity of
>5000CC are new.
6 Light Duty Vehicles (LDV) are vehicles that weigh 3500kgs.
7 Heavy Duty Vehicles (HDV) are vehicles that weigh over 3500kgs.
Category Engine_CC
DIESEL PETROL
NEW OLD Total
New as
% of
total
NEW OLD Total
New as
% of
total
Light Duty
Vehicles6
500_1200CC 77 130 207 37.2 160 4457 4617 3.5
1201_1500CC 69 121 190 36.3 1412 19188 20600 6.9
1501_2000CC 313 1185 1498 20.9 2589 75355 77944 3.3
2001_2500CC 5930 3815 9745 60.9 994 7073 8067 12.3
2501_3000CC 7055 20871 27926 25.3 625 7849 8474 7.4
3001_3500CC 2523 1740 4263 59.2 378 1961 2339 16.2
Sub total 15967 27862 43829 36.4 6158 115883 122041 5.04
Heavy
Duty
vehicles7
3501_4000CC 1075 7902 8977 12 290 478 768 37.8
4001_5000CC 3810 5539 9349 40.8 343 652 995 34.5
>5000CC 7919 15677 23596 33.6 113 38 151 74.8
Sub total 12804 29118 41922 30.5424 746 1168 1914 38.976
Grand Total 28771 56980 85751 33.6 6904 117051 123955 5.6

19
Figure 1: Distribution of New Vehicles by Fuel Type and Engine Capacity.
Source: Computations based on combined dataset (URA e-tax dataset and MoW&T dataset)
From figure1 above, majority of the new vehicles that use petrol are of lower engine capacity i.e.
<500CC – 2000CC; while the majority of new vehicles that use diesel vehicles are of higher
engine capacity (i.e. >2000CC).
3.3: Age Distribution of Vehicles
The age distribution of existing vehicles by engine capacity was assessed to provide insights into
the implications of a regulatory policy on age of vehicles imported into the country. Table4
shows the average age of vehicles by engine capacity and fuel type registered in the years; 2005,
2008, 2011 and 2014, which are the data points used in computing the fuel efficiency and CO2
emissions. Illustrations are presented in figures 2 and 3 for diesel and petrol fleet respectively.
32.5%
4.7% 10.8%
85.6% 91.9%
87% 78.8%
91.7% 98.6%
67.5%
95.3% 89.2%
14.4% 8.1%
13% 21.2%
8.3% 1.4%
Diesel Petrol

20
Table 4: Average Age and Engine capacity by Fuel type and year of Registration
Engine_CC
Diesel Petrol
2005 2008 2011 2014 2005 2008 2011 2014
500_1200CC 14.0 6.4 16.1 13.5 11.9 14.3 16.3
1201_1500CC 12.0 8.0 5.0 14.8 10.8 12.4 13.1 15.8
1501_2000CC 8.8 13.5 17.1 18.5 10.4 11.9 13.1 15.7
2001_2500CC 9.3 6.5 3.9 8.6 7.3 8.6 11.3 13.6
2501_3000CC 5.8 9.3 11.1 16.6 9.2 9.9 12.5 14.7
3001_3500CC 4.1 5.4 6.3 15.8 4.5 9.5 11.6 13.5
3501_4000CC 14.2 17.9 20.5 22.7 11.0 8.5 7.0 11.2
4001_5000CC 7.7 8.1 8.9 16.2 4.8 7.8 10.4 12.3
>5000CC 9.6 12.8 12.0 15.9 4.0 8.8 8.6 6.3
Total ave. age 8.1 10.3 10.6 16.4 10.4 11.7 12.8 15.4
Source: Computations based on combined dataset (URA e-tax dataset and MoW&T dataset)
Figure 2: Average age of Diesel vehicles
Source: Computations based on combined dataset (URA e-tax dataset and MoW&T dataset)
8.1
10.3 10.6
16.4
0
2
4
6
8
10
12
14
16
18
2005 2008 2011 2014
Ave
rage
age
Year of registration
21
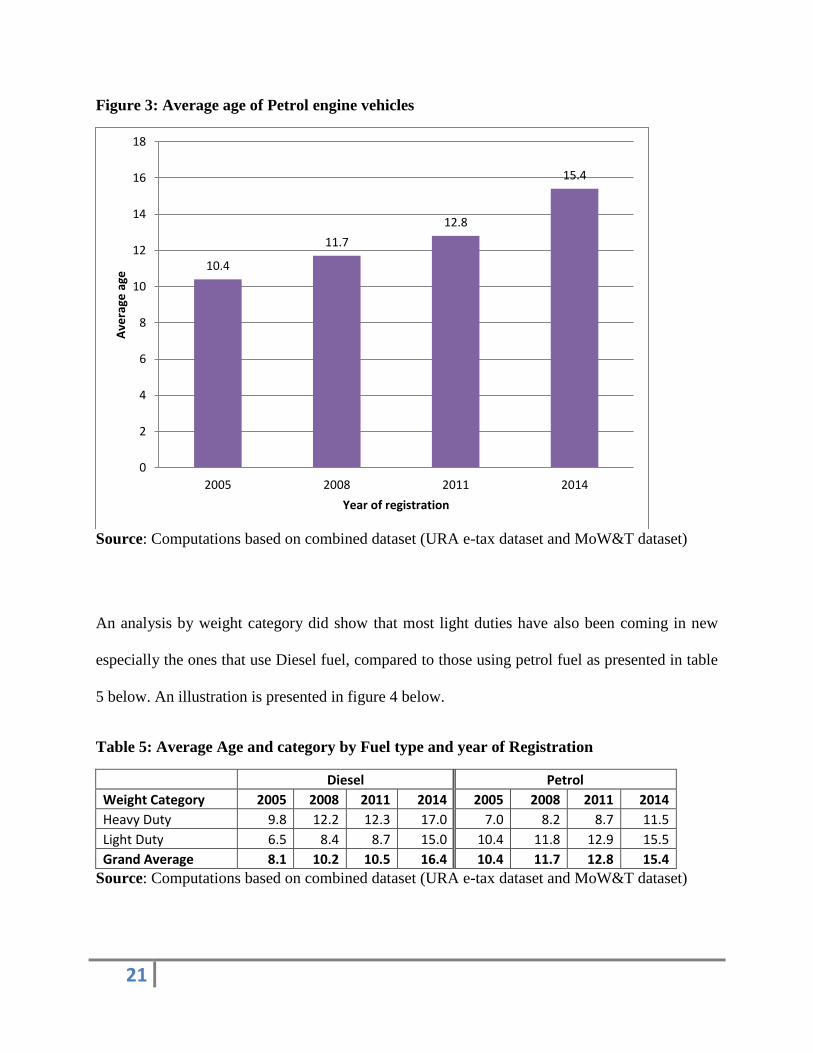
Figure 3: Average age of Petrol engine vehicles
Source: Computations based on combined dataset (URA e-tax dataset and MoW&T dataset)
An analysis by weight category did show that most light duties have also been coming in new
especially the ones that use Diesel fuel, compared to those using petrol fuel as presented in table
5 below. An illustration is presented in figure 4 below.
Table 5: Average Age and category by Fuel type and year of Registration
Diesel Petrol
Weight Category 2005 2008 2011 2014 2005 2008 2011 2014
Heavy Duty 9.8 12.2 12.3 17.0 7.0 8.2 8.7 11.5
Light Duty 6.5 8.4 8.7 15.0 10.4 11.8 12.9 15.5
Grand Average 8.1 10.2 10.5 16.4 10.4 11.7 12.8 15.4
Source: Computations based on combined dataset (URA e-tax dataset and MoW&T dataset)
10.4
11.7
12.8
15.4
0
2
4
6
8
10
12
14
16
18
2005 2008 2011 2014
Ave
rage
age
Year of registration

22
Figure 4: Average age of vehicles by weight category.
Source: Computations based on combined dataset (URA e-tax dataset and MoW&T dataset)
From Table 4, table 5 and figure 3 below; we notice that despite the imposition of the
environmental tax by URA in 2008, the average age has been worsening for all categories of
engine capacity. Over the time, the average age of diesel vehicles has been increasing from 8.1
years in 2005 to 16.4 years in 2014. Similarly the average age of petrol vehicles increased from
10.4 years to 15.4 years over the same period. The relatively high age of vehicle at registration is
of concern to promoting fuel economy national policy, since older cars for any engine capacity
and vehicle technology consume more fuel and hence emit more CO2 per kilometer. This in one
way attempts to suggest that the objective of the 20% environmental tax imposed on old vehicles
(ie vehicles first registered at age greater than 8 years), that was aimed at discouraging
9.8
12
.2
12
.3
17
.0
7.0
8.2
8.7
11
.5
6.5
8.4
8.7
15
.0
10
.4 1
1.8
12
.9
15
.5
2 0 0 5 2 0 0 8 2 0 1 1 2 0 1 4 2 0 0 5 2 0 0 8 2 0 1 1 2 0 1 4
D I E S E L P E T R O L
Heavy Duty Light Duty

23
importation of old vehicles has not been realized instead it is the case of “bad goods driving
good ones out of the market.” This however has a serious negative implication on carbon
emission. One major weakness of a flat environmental tax for instance the current 20% on the
value of the vehicle irrespective of age, is that older vehicles have a lower value hence carry a
lower charge, accordingly their purchase price is low; and the reverse is true for newer versions;
they are of a higher value and they fetch a higher environmental fee hence making their purchase
price to rise. For that matter most of the consumers would opt to purchase older cheaper vehicles
instead of the newer ones.
Figure 5: Average age and environmental levy
Source: Computations based on combined dataset (URA e-tax dataset and MoW&T dataset)
0.0
2.0
4.0
6.0
8.0
10.0
12.0
14.0
16.0
18.0
20
00
20
01
20
02
20
03
20
04
20
05
20
06
20
07
20
08
20
09
20
10
20
11
20
12
20
13
20
14
Pre-env Post-env
age
of
veh
icle
year of registration
DIESEL
PETROL

24
3.4: Vehicle Fuel Economy and CO2 Emissions
The fuel economy and CO2 emission computations were based on the GFEI methodology. Using
2005 as the baseline year, (as the GFEI preferred year of reference for ease of comparison with
estimates from other countries), average fuel efficiency rates (L/100 Km) and CO2 emission rates
(gCO2/Km) were computed for vehicles registered in 2005, 2008, 2011 & 2014, and estimates
compared with those in the base year. The vehicle fuel economy ratios are computed by fuel
type and engine capacity. The vehicle database reports data on engine capacity in cubic
centimeter (cc), horsepower (HP) or Kilowatts (KW). Since CC is displacement and HP as well
as KW are for power output, observations transformed into displacement for analysis. Using
appropriate conversion factor8, engine rates were converted to cc measure. The engine capacity
were categorized into 9 sub-groups (500cc -1200cc, 1201cc – 1500cc, 1501 – 2000cc, 2001cc -
2500cc, 2501cc – 3000cc, 3001cc – 3500cc, 3501cc – 4000cc, 4001cc -5000cc and > 5000cc).
Vehicles with engine capacity in each range are assumed to exhibit similar fuel efficiency and
CO2 emission rates and therefore comparable for the required computations.
According to the GFEI guidelines the key variables for the fuel economy and CO2 emission
computations include;
1. Vehicle make and model
2. Model production year
3. Year of first registration, if different from model year
4. Fuel type
5. Engine size
8 1HP = 0.7457 kW = 17 cc (source: http://www.rapidtables.com/convert/power/kw-to-hp.htm)

25
6. Domestically produced or imported
7. New or second hand import
8. Rated Fuel Economy per model and test cycle basis.
9. Number of sales by model
However, the data obtained from URA and MoW&T on vehicle inventory did not have Rated
Fuel Economy per model, and Test Cycle. To obtain estimates for fuel economy, we relied on
information from manufacturers available on websites for some model and information available
from the GFEI recommended websites.9 We also contacted reputable motor garages and local
automobile franchises (e.g. Toyota, Mantrac, Delta, TATA, Bajaj, TVS, Victoria Motors, Motor
Care, Cooper Motors Cooperation, and Mahindra). We then used these estimates to compute CO2
emission (Ci) for particular vehicle categories. Total sales were directly derived from the vehicle
inventory for each particular year as reported in the URA and MoW&T database, albeit for only
those observations with complete data on key variables. Vehicle fuel economy is expressed in
terms of liters of gasoline per 100 kilometers of travel (L/100km) and automobile GHG emission
in grams per kilometer (gCO2/km).
3.5: Methodology
3.5.1: Modeling the Relationship between Age of Vehicle, and Fuel efficiency
We used empirical studies to model the relationship between age of a vehicle and its related fuel
efficiency ratios. The level of vehicle emissions and fuel efficiency, are related to the age of the
vehicle either linearly or exponentially. A decreasing exponential model as used by Rajbahak, et
al (2011), was considered for the baseline survey in order to estimate the level of fuel efficiency
9
http://www.epa.gov/fueleconomy/gas-label-1.htm; http://www.carfolio.com/specifications/models;
www.edmunds.com/toyota; http://www.naamsa.co.za/ecelabels/;
http://www.totalmotorcycle.com/MotorcycleFuelEconomyGuide;

26
when the units are first registered in Uganda. The model, shows that the fuel efficiency of an
automobile decreases exponentially with time. The rate of decrease, depends on various factors
such as maintenance, type of fuel, engine capacity among others. The exponential decline is
proportional to a fractional power, of the usage rate; thus
where;
= Modelled fuel efficiency of the automobile that incorporates age
=Fuel Efficiency when the automobile is new. This is known from automobile manufactures,
= Decreasing rate factor;
= Age of the automobile unit
Fuel efficiency F0 estimates for a particular vehicle segmentation and fuel type were obtained
by contacting local automobile franchise (i.e. Toyota, Mantrac, Delta, TATA, Bajaj, TVS,
Victoria Motors, Motor Care, Cooper Motors Cooperation, and Mahindra) to provide
information on their products’ fuel efficiency and from information available from the GFEI
recommended websites10
. Figure 5 shows the relationship between fuel efficiency and age of
automobile.
10
http://www.epa.gov/fueleconomy/gas-label-1.htm; http://www.carfolio.com/specifications/models;
www.edmunds.com/toyota; http://www.naamsa.co.za/ecelabels/;
http://www.totalmotorcycle.com/MotorcycleFuelEconomyGuide;

27
Figure 6: Relation between Fuel Efficiency and Age of vehicle
The computed values of that were considered in our study in order to adjust the fuel efficiency
of the imported used automobiles were as follows:
For , = 0.017097764
For , = 0.021072103
For , = 0.020314866
For , = 0.022314355
For , = 0.019178804
For , = 0.023778329
The fuel economy computations are based on the harmonic annual average as per GFEI tool kit
and NEDC and the methodology has been included in the appendix. The average annual fuel
economy for each year (2005, 2008, 2011 and 2014) is computed as follows:
∑
C
Fuel Efficiency 𝐹𝜇
(L/100 Km)
.9 𝐹 C
.9 𝐹 C . 𝐹 C
0 3 5 8 12 15
Age of automobile

28
Where;
= Total Sales (Vehicles Registered by URA & MoW&T) in a given year
= Sales for a Particular Vehicle Segmentation and Fuel type
= Fuel Economy for a Particular Vehicle Segmentation and Fuel type
3.6.2: Carbon dioxide (CO2) Emission Computations
The CO2 emission rates are based on the annual weighted average emission per segment for
petrol and diesel vehicles and estimated for the years 2005, 2008, 2011 and 2014.
∑
where;
= Total Sales (Vehicles Registered by URA & MoW&T) in a given year
= Sales for a Particular Vehicle Segmentation and Fuel type
= CO2 Emission for a Particular Vehicle Segmentation and Fuel type
The fuel economy estimates used in the above formulae were estimated from the model,
generated above. Total sales are directly derived from the vehicle inventory for each particular
year as reported in the URA and MoW&T database, albeit for only those observations with
complete data on key variables. Vehicle fuel economy is expressed in terms of liters of fuel per
100 kilometers of travel (L/100km) and automobile GHG emission in grams per kilometer
(gCO2/km). Estimates of the annual average fuel efficiency for petrol and diesel vehicles are
presented in Tables 4 and 5 respectively.

29
3.7: Results of Harmonic fuel efficiency and carbon-dioxide emissions.
3.7.1 Results of Harmonic fuel efficiency of vehicle fleet.
Table 6 below, shows that the fuel efficiency has been declining over the years in both LDV’s
and HDV’s, where it was estimated at 11.6 L/100Km in 2005 and later increased to 13.4
L/100Km in 2014 for LDV diesel fleet, similarly for the LDV petrol fleet the fuel efficiency
increased but not by a big margin as it was for the diesel fleet, here it increased from 10.6
L/100Km in 2005 to 11.8 L/100Km in 2014. Same situation has been presented for HDV’s. The
general trends have been presented in figure 7, 8 and 9 below.
Table 6: Average Fuel Efficiency (L/100Km) by weight category and Year of Registration
and fuel type
Weight Category
Diesel Petrol
2005 2008 2011 2014 2005 2008 2011 2014
Light Duty 11.6 11.7 11.9 13.4 10.6 10.8 11.1 11.8
Heavy Duty 24.2 24.9 27.7 29.3 22.2 21.4 21.5 22.9
Total average 15.3 15.5 16.5 18.4 10.7 10.9 11.2 11.9
Source: Computations based on combined dataset (URA e-tax dataset and MoW&T dataset)
Figure 7; Average fuel efficiency (L/100Km) for Diesel fleet.
Source: Computations based on combined dataset (URA e-tax dataset and MoW&T dataset)
15.3 15.5 16.5
18.4
0
2
4
6
8
10
12
14
16
18
20
2005 2008 2011 2014
Diesel
30
Figure 8: Average fuel efficiency (L/100Km) for Petrol fleet.
Source: Computations based on combined dataset (URA e-tax dataset and MoW&T dataset)
Figure 9: Average Fuel Efficiency (L/100Km) by weight category and Year of Registration
and fuel type.
Source: Computations based on combined dataset (URA e-tax dataset and MoW&T dataset)
10.7
10.9
11.2
11.9
10
10.2
10.4
10.6
10.8
11
11.2
11.4
11.6
11.8
12
2005 2008 2011 2014
11
.6
11
.7
11
.9
13
.4
10
.6
10
.8
11
.1
11
.8
24
.2
24
.9 27
.7
29
.3
22
.2
21
.4
21
.5
22
.9
15
.3
15
.5
16
.5
18
.4
10
.7
10
.9
11
.2
11
.9
2 0 0 5 2 0 0 8 2 0 1 1 2 0 1 4 2 0 0 5 2 0 0 8 2 0 1 1 2 0 1 4
D I E S E L P E T R O L
Light Duty Heavy Duty Total average

31
3.7.2; Results of Harmonic fuel efficiency of vehicle fleet.
From the figures presented in table 7, diesel fleet averagely pollute more than petrol fleet irrespective
of the weight. But the amount of smoke greatly increases with weight this is because even the fuel
efficiency increases. The average carbon-dioxide emission has increased from 653 gCO2/Km in 2005 to
792.6 gCO2/Km in 2014 for diesel fleet. The carbon-dioxide emission for petrol fleet has also increased
from 291.8 gCO2/Km in 2005 to 331 gCO2/Km in 2014. The figures have been presented graphically in
figure 10, 11 and 12.
Table 7: Average carbon-dioxide emissions by fuel type and year of registration.
DIESEL PETROL
Category 2005 2008 2011 2014 2005 2008 2011 2014
Light Duty 363.2 367.6 376.8 431.0 287.9 294.6 304.5 325.2
Heavy Duty 986.0 1083.0 1116.7 1149.8 649.2 640.7 692.0 716.5
Grand Total 653.0 698.6 735.5 792.6 291.8 300.6 311.2 331.0
Source: Computations based on combined dataset (URA e-tax dataset and MoW&T dataset)
Figure 10: Average carbon-dioxide emissions of diesel fleet.
Source: Computations based on combined dataset (URA e-tax dataset and MoW&T dataset)
653 698.6
735.5
792.6
0
100
200
300
400
500
600
700
800
900
2005 2008 2011 2014

32
Figure 11: Average carbon-dioxide emissions for petrol fleet.
Source: Computations based on combined dataset (URA e-tax dataset and MoW&T dataset)
Figure 12: Average carbon-dioxide emission (gCO2/Km) by weight category and Year of
Registration and fuel type.
Source: Computations based on combined dataset (URA e-tax dataset and MoW&T dataset)
291.8
300.6
311.2
331
270
280
290
300
310
320
330
340
2005 2008 2011 2014
36
3.2
36
7.6
37
6.8
43
1.0
28
7.9
29
4.6
30
4.5
32
5.2
98
6.0
10
83
.0
11
16
.7
11
49
.8
64
9.2
64
0.7
69
2.0
71
6.5
65
3.0
69
8.6
73
5.5
79
2.6
29
1.8
30
0.6
31
1.2
33
1.0
2 0 0 5 2 0 0 8 2 0 1 1 2 0 1 4 2 0 0 5 2 0 0 8 2 0 1 1 2 0 1 4
D I E S E L P E T R O L
CA
RB
ON
-DIO
XID
E EM
ISSI
ON
GCO2/KM
Light Duty Heavy Duty Grand Total

33
We examined annual harmonic fuel efficiency trend and the results are presented in table 8
below. These figures have been presented for the LDV and HDV fleet registered in the period
2005, 2008, 2011 and 2014. The harmonic fuel efficiency has been steadily increasing in both
LDV’s and HDV’s from 10.94 L/100Km and 24.3 L/100Km in 2005 to 12.15 L/100Km and 29.1
L/100Km for LDV and HDV fleet respectively. In the general perspective the annual harmonic
fuel efficiency has increased from 12.52 L/100Km in 2005 to 13.73 L/100Km in 2014.
Corresponding graphical expression have been presented in figures 13, 14 and 15 showing the
trend of fuel efficiency over the years of interest (ie 2005, 2008, 2011 and 2014).
Table 8 also presents figures of the average carbon emissions over the period of interest. Since
we modeled the fuel efficiency with age factor and later used the fuel efficiency to estimate the
corresponding carbon emissions, an average increase in fuel efficiency would signal a
corresponding increase in carbon-dioxide emission. As seen in table 8 below the estimated
carbon-dioxide emissions have also increased in both LDV’s and HDV’s from 312.9 gCO2/Km
and 977.6 gCO2/Km in 2005 to 349.6 gCO2/Km and 1129.3 gCO2/Km respectively. In the
general perspective the average carbon-dioxide emissions have also been increasing from an
average of 465 gCO2/Km in 2005 to 503 gCO2/Km in 2014. Corresponding graphical
presentation of the trend in carbon-dioxide emission are given in figures 16, 17 and 18.
Table 8: Annual harmonic fuel efficiency and average carbon-dioxide emissions by year of
registration and vehicle category.
2005 2008 2011 2014
Fuel Efficiency
LDV 10.94 11.14 11.34 12.15
HDV 24.3 24.9 27.7 29.1
TOTAL AVERAGE 12.52 12.82 13.01 13.73
Carbon-dioxide emission
LDV 312.9 320 324.8 349.6
HDV 977.6 1066.8 1097.3 1129.3
TOTAL AVERAGE 465 497 492.4 503
Source: Computations based on combined dataset (URA e-tax dataset and MoW&T dataset)

34
Figure 13: Trend of harmonic fuel efficiency of LDV fleet by year of registration.
Source: Computations based on combined dataset (URA e-tax dataset and MoW&T dataset)
Figure 14: Trend of harmonic fuel efficiency of HDV fleet by year of registration.
Source: Computations based on combined dataset (URA e-tax dataset and MoW&T dataset)
10.94
11.14
11.34
12.15
2005 2008 2011 2014
24.3
24.9
27.7
29.1
2005 2008 2011 2014

35
Figure 15: Trend of annual harmonic fuel efficiency by year of registration.
Source: Computations based on combined dataset (URA e-tax dataset and MoW&T dataset)
Figure 16: Trend of average carbon-dioxide emissions of LDV fleet by year of registration.
Source: Computations based on combined dataset (URA e-tax dataset and MoW&T dataset)
12.52
12.82
13.01
13.73
11.8
12
12.2
12.4
12.6
12.8
13
13.2
13.4
13.6
13.8
14
2005 2008 2011 2014
Harmonic averages
312.9
320
324.8
349.6
2005 2008 2011 2014

36
Figure 17: Trend of average carbon-dioxide emissions of HDV fleet by year of registration.
Source: Computations based on combined dataset (URA e-tax dataset and MoW&T dataset)
Figure 18: Trend of average carbon-dioxide emissions by year of registration.
Source: Computations based on combined dataset (URA e-tax dataset and MoW&T dataset)
977.6
1066.8
1097.3
1129.3
900
950
1000
1050
1100
1150
2005 2008 2011 2014
465
497
492.4
503
440
450
460
470
480
490
500
510
2005 2008 2011 2014
Average Carbondioxide emission

37
3.7.3: Results of Harmonic fuel efficiency of motorcycle fleet (2000 – 2014).
The fleet of motor cycles has been rising as seen from Table 9. The growth picked momentum in
2012 and it has been growing at a high rate of over 17 percent. We note that although the average
level of carbon emission of motorcycles compared to vehicles is very low, the total emission
coming from motorcycles given their great number, especially in the urban centers is worrying.
Accordingly their importation and use need to be regulated specifically with regard to exhaust
emission. Findings in the Table show that the average age of motor cycles in Uganda is 1 year,
and the average fuel efficiency has improved by 24 percent between year 2000 and 2014. The
average carbon emission has improved from 60g/km to 44g/km a 26.7 percentage change in the
average emissions over the same time period.
Table 9: Fuel Efficiency and Carbon Emission for Motorcycle by Year of Registration
PETROL
Year of
registration fleet
Ave.
age
Ave. FE
(L/100Km)
Ave. CO2
emission
2000 229.0 0.9 2.5 59.9
2001 408.0 1.0 2.3 54.9
2002 1106.0 0.9 2.5 59.8
2003 919.0 0.8 2.6 60.9
2004 1287.0 0.6 2.5 59.0
2005 970.0 0.6 2.7 62.9
2006 1263.0 0.7 2.4 56.1
2007 2977.0 0.8 2.5 59.2
2008 3082.0 0.8 2.5 58.2
2009 3022.0 0.8 2.4 57.1
2010 3384.0 0.8 2.5 59.3
2011 4646.0 1.0 2.4 57.5
2012 17591.0 1.2 2.1 49.4
2013 87897.0 1.1 1.9 44.1
2014 102773.0 0.9 1.9 43.9
Source: Computations based on combined dataset (URA e-tax dataset and MoW&T dataset)

38
Corresponding graphical expressions are presented in figures, 19, 20 and 21 below for age
distribution, fuel efficiency and carbon-dioxide emissions respectively.
Figure 19: Average Age of Motorcycles
Source: Computations based on combined dataset (URA e-tax dataset and MoW&T dataset)
Figure 20: Average fuel efficiency of motorcycles.
Source: Computations based on combined dataset (URA e-tax dataset and MoW&T dataset)
0.6
0.8
1.0
0.9
0.0
0.2
0.4
0.6
0.8
1.0
1.2
2005 2008 2011 2014
Ave
rage
age
Year of registration
2.65 2.47 2.45
1.91
0.00
0.50
1.00
1.50
2.00
2.50
3.00
2005 2008 2011 2014
Fue
l eff
icie
ncy
(L/
10
0K
m)
Year of registration

39
Figure 21: Average carbon dioxide emission of motor cycles
Source: Computations based on combined dataset (URA e-tax dataset and MoW&T dataset)
62.88
58.20 57.52
43.87
0.00
10.00
20.00
30.00
40.00
50.00
60.00
70.00
2005 2008 2011 2014
CO
2 e
mis
sio
n (
gCO
2/K
m)
Year of registration

40
4.0: FUEL EFFICIENCY AND CO2 FORECASTING
4.1: Key Economic Drivers and Assumptions
Greenhouse gas (GHG) emission or carbon emission as it is commonly known is influenced by a
number of factors among which are the following; level of economic growth, household
incomes, world oil and pump price, level of technological change in the car manufacture, and
policy decision. Changing any of these factors could lead to variations in emission levels and
trends.
In constructing the emissions projections, we need to assume alternative views of changes in
certain key factors (e.g. World oil price, the rate of economic growth, policy options) that result
in a range of plausible emissions growth trajectories. In this study, the baseline fuel efficiency
and emissions projection scenarios represent the state without the environment tax on old
vehicles and without any shock in any other factors. Accordingly the following factors are
assumed fixed;
i. Economic growth projections (Gross Domestic Product)
ii. Real disposable personal income projections
iii. Consumer price index projections
iv. Labour force projections (Population growth rates)
v. World oil price projections/Pump prices
The figures 22 – 24 below, represent projections of the vehicle fleet, fuel efficiency and carbon
emission of the baseline senario and a case with imposition of an environment tax which started

41
in 2008. The figures show a steep growth both for diesel and petrol fleet, and for carbon
emissions and the fuel efficicency if no interventions are made.
Figure 22: Petrol Vehicle Fleet Projections
Source: Computations based on combined dataset (URA e-tax dataset and MoW&T dataset)
Figure 23: Diesel Vehicle Fleet Projection
Source: Computations based on combined dataset (URA e-tax dataset and MoW&T dataset)
0
20000
40000
60000
80000
100000
120000
140000
2000 2010 2020 2030 2040 2050
0
10000
20000
30000
40000
50000
60000
70000
80000
2000 2010 2020 2030 2040 2050

42
Figure 24: All Vehicle fleet Projection
Source: Computations based on combined dataset (URA e-tax dataset and MoW&T dataset)
Next we provide a comparison in the projections of average fuel efficiency for diesel and petrol
fleet with environmental levy and without the environmental levy. Figures 25 and 26 show the
projections of fuel efficiency of diesel and petrol fleet respectively, with environmental levy and
without environmental levy11
. The figures show that the projection of fuel efficiency for diesel
fleet without the environmental levy is lower than that with the environmental levy. This is
supported by our earlier findings which showed that before introduction of the environmental
levy the average age of diesel automobiles was 10.3 in 2008 while in 2014 it had increased to
16.4 years. The situation is similar to that of the petrol fleet where the average age increased
from 11.7 in 2008 to 15.4 years in 2014.
11
The environmental levy/surcharge was introduced in Uganda in financial year 2007/08.
0
50000
100000
150000
200000
250000
2000 2010 2020 2030 2040 2050
fleet

43
Figure 25: FE with Surcharge and FE without surcharge (WET) policy projections for
Diesel fleet.
Source: Computations based on combined dataset (URA e-tax dataset and MoW&T dataset)
FE_Diesel Fuel Efficiency for diesel fleet with environmental levy.
FE_Diesel_WET Fuel Efficiency for diesel fleet without environmental levy
0.00
5.00
10.00
15.00
20.00
25.00
30.00
35.00
FE (
L/1
00
Km
)
year of registration
FE_Diesel
FE_Diesel_WET

44
Figure 26: FE with Surcharge and FE without surcharge policy projections for petrol fleet.
Source: Computations based on combined dataset (URA e-tax dataset and MoW&T dataset)
Figure 27: CO2 Emission with Surcharge and CO2 without surcharge policy projections for
Diesel fleet.
Source: Computations based on combined dataset (URA e-tax dataset and MoW&T dataset)
0.00
2.00
4.00
6.00
8.00
10.00
12.00
14.00
16.00
18.00
20
00
20
02
20
04
20
06
20
08
20
10
20
12
20
14
20
16
20
18
20
20
20
22
20
24
20
26
20
28
20
30
20
32
20
34
20
36
20
38
20
40
20
42
20
44
20
46
20
48
20
50
FE (
L/1
00
Km
)
year of registration
FE_Petrol FE_Petrol_WET
0.0
100.0
200.0
300.0
400.0
500.0
600.0
700.0
800.0
900.0
20
00
20
03
20
06
20
09
20
12
20
15
20
18
20
21
20
24
20
27
20
30
20
33
20
36
20
39
20
42
20
45
20
48
gCO
2/K
m
year of registration
CO2_Diesel
CO2_Diesel WET

45
Figure 28: CO2 Emission with Surcharge and CO2 without surcharge policy projections for
Petrol fleet.
Source: Computations based on combined dataset (URA e-tax dataset and MoW&T dataset)
Figures 27 and 28 show the projections of average carbon dioxide emission for diesel and petrol
fleet respectively, with environmental levy and without environmental levy. The figure 20 shows
that between 2008 and 2014, there some slight variations in carbon emission, but after 2015, the
projections show that the trends converge; this implies that the effect of introduction of an
environmental levy is not significant. The case is different for petrol fleet as the average carbon
emission with environmental levy is less than that without environmental levy. This signifies that
the introduction of the environmental levy has a positive impact on carbon emission compared to
what the situation would be without the introduction of an environmental levy.
0.0
100.0
200.0
300.0
400.0
500.0
600.0
700.0
800.0
20
00
20
03
20
06
20
09
20
12
20
15
20
18
20
21
20
24
20
27
20
30
20
33
20
36
20
39
20
42
20
45
20
48
gCO
2/K
m
year of registration
CO2_Petrol
CO2_Petrol_WET

46
5.0: COST BENEFIT ANALYSIS OF FUEL ECONOMY POLICY INTERVENTIONS
The fourth objective of this study was to conduct a socio-economic implications analysis (cost-
benefit analysis) of the various policy interventions to promote cleaner fuels and vehicles
including vehicle fuel efficiency. Cost benefit analysis of the fuel economy interventions
involves identifying, measuring and valuing the socio-economic benefits and costs of defined
policy interventions that promote cleaner fuels (reducing CO2 emissions) and average fuel
consumption (fuel efficiency) by the different categories of vehicles.
The Cost-Benefit Analysis (CBA) framework is applied as a tool to aid in decision making. In
the analysis, we define and compare the benefits and costs of the various policy interventions
which promote cleaner fuels and fuel efficiency.
The costs and benefits are estimated over a 35 year period and adjusted to their present value
using a discounting rate of 11.3%- The current CBR for Uganda (i.e. April 2015). The choice of
the discount rate reflects the present cost of financial borrowing (the average Central Bank Rate)
in the country while the choice of the intervention period is informed by the GFEI tool kit.
There are both private and public costs and benefits associated with fuel efficiency. These are
reflected in fuel costs savings to vehicle owners, say when fuel required to cover 100 Km of
travel reduces, this on the other hand could cost government loss in tax revenues. Reductions in
CO2 emissions would have environmental benefits (improved air quality), and public health
benefits, say in form of reduced direct medical costs of treating respiratory track illnesses. Such
costs and benefits are considered from the perspective of both the private individuals and
Government. The vehicle inventory data is used to project the CO2 emission and average fuel
consumed per kilometer (fuel efficiency rates) up to the year 2050.

47
While there are a range of costs and benefits associated with improvement in fuel efficiency and
reduction in CO2 emissions, some aspects may not be easily monetized. Thus the cost benefit
analysis in this study is limited to the monetary costs and benefits of the policy interventions.
Before undertaking the CBA, policy instruments are identified and the analysis conducted
separately for each policy intervention and for each vehicle category. The CBA focuses on the
differences between the costs and benefits associated with the policy interventions; hence the
costs and benefits will be interpreted as incremental. The intervention options are compared with
the current situation, i.e. the “business as usual” case (baseline), assuming no further attempt is
made to improve the current fuel efficiency levels and to reduce the present carbon emissions by
vehicles and motorcycles. Each policy instrument is tested for its effect on fuel efficiency- liters
of fuel per 100kilometers (L/100Km) and vehicle emissions- grams of carbon dioxide emitted
per kilometer travelled (gCO2/km). For fuel efficiency, estimates of costs are based on the total
fuel consumption, and the fuel (diesel/petrol) price. The financial fuel cost is estimated based on
the formula:
Estimated Financial Cost = annual fleet in Km travelled * amount in Ug shs per Km
Where:
- Annual fleet Km = average daily Km*number of vehicles using petrol /diesel *365 (days)
- Amount in UGX per Km = Average fuel economy * average fuel price/ 100
Since the average daily Kms travelled in Uganda is not known, we have adopted the estimate for
the Kenyan GFEI country report ('i.e.' 101.6 Kms for Vehicles and 200Kms for motorcycles).
The government of Uganda gets revenue from fuel in form of taxes. The government revenue
that will be foregone due to implementation of fuel economy policies will be treated as a cost,
while the reduction in annual expenditure on fuel will be treated as a benefit. For the CO2

48
emission, the benefit to the economy is the amount of CO2 emissions avoided and the value
accrued upon registering and selling the carbon credits while the costs are those associated with
direct costs of treating patients for respiratory tract infection (RTI) illnesses. Savings on
treatment costs for RTIs due to a reduction in carbon emissions is treated as a benefit accruing
from the policy interventions for CO2 emissions efficiency.
After establishing the costs and benefits, the Net Present Value (NPV) and Internal Rate of
Return (IRR) are used as the criterion for assessing and comparing policy interventions. A policy
intervention is acceptable if NPV>0 and IRR> the discount rate and the intervention and rejected
if NPV<0 and IRR<discount rate.
Table 10: Financial costs for automobiles in 2014
Diesel Petrol Motorcycles
Average fuel economy (L/100km) 18.42 11.9 1.9
Average fuel price 3264 3674 3674
Total Amount (Ug shs/100km) 60122.88 43720.6 6980.6
Amount in Ug shs per km 601.2288 437.206 69.806
Average Daily Km travelled 101.6 101.6 200
Number of registered vehicles using diesel 24057 40499 102773
Daily fleet km travelled 2444191.2 4114698.4 20554600
Annual fleet km travelled (365 days) 892129788 1501864916 7502429000
Estimated Financial Cost (UGX) 536,374,121,883.49 656,624,352,464.7 523,714,558,774
Source: Computations based on combined dataset (URA e-tax dataset and MoW&T dataset)
In Table 10 above, we used the current estimated for 2014 where; fuel economy level was
estimated at 18.42L/100km, 11.9L/km and 1.9 L/100km for diesel, petrol vehicles and
motorcycles respectively and this would cost the economy about 536billion UGX, 656.6billion

49
UGX and 523.7billion UGX for diesel, petrol and motorcycles fleet respectively per year in fuel
consumption based on prevailing pump prices. The gross total expenditure on fuel was estimated
at 1.716 trillion UGX. Supposing a 30% of fuel cost goes to government as taxes, the
government would have UGX 515billion in revenue. Thus a policy which reduces fuel
consumption will reduce government revenue and this is treated as a cost to government but a
benefit to the private individuals (Vehicle owners) in the CBA. The CBA results are interpreted
from both perspectives. Table 11 presents similar estimates for CO2 emissions. Similar analysis
of fuel efficiency and carbon-dioxide emissions has been presented for LDV, and HDV vehicles
in tables 13 – 14 for diesel and petrol vehicles and motorcycles.
Table 11: Financial benefit of foregone Carbon emissions for automobiles by fuel type
Diesel Petrol Motorcycles
Average CO2 credit per ton (USD) 1.00 1.00 1.00
Exchange rate (1USD to UGX) 2900 2900 2900
Average CO2 emission(gCO2/km) 781.7 330.9 43.8
Average daily km travelled 101.6 101.6 200
Total number of newly registered vehicles 24057 40499 102773
Daily fleet km travelled 2444191.2 4114698.4 20554600
Annual fleet km travelled (X 365 days) 892129788 1501864916 7502429000
Average gCO2 emitted 697377855279.6 496967100704.4 328606390200
Conversion factor 1000000 1000000 1000000
Tones emitted 697377.8552796 496967.1007044 328606.3902
Average carbon credit per ton 2900 2900 2900
Estimated financial Benefit (UGX) 2,022,395,780.3108 1,441,204,592.0428 952,958,531.58
Source: Computations based on combined dataset (URA e-tax dataset and MoW&T dataset)
In table 11 above; For the registered fleet in 2014 polluting at 781.7, 330.9 and 43.8 gCO2/km
for diesel, petrol and motorcycle fleet. The total emissions would amount to 1.5million tons of
carbon dioxide emissions on top of the emissions made by the other fleet already registered in
the country.

50
The effect of reducing emissions and the benefits to the economy (the amount of CO2 emissions
avoided) are expressed in the value of carbon footprint credits which would fetch an estimate of
4.4 billion Ugshs if traded at 2900 for 1USD per ton.
The direct costs of treating patients of non-communicable respiratory illnesses is the cost to
government while savings on treatment costs for respiratory illnesses arising from the policy
intervention (reducing the emission rates) are treated as benefits. Estimates for treatment costs
for RTI illnesses were expected to be obtained from MoH records12
. The other costs include
institutional costs to implement such a policy - say the UNBS and URA may incur more
inspection costs to enforce the policy. The cost estimates are then compared with expected gains
(in terms of reduced carbon emissions). These analyses draw on the results of the fuel economy
and carbon emission estimates.
A more in-depth analysis has been done for vehicle category by fuel type to better understand the
extent of financial cost and benefit to the government by vehicle weight.
12
RTI infections could be the result of other air quality related hazards other than CO2 vehicle emissions. Reasonable assumptions are used to estimate the proportions associated with vehicle emissions.

51
Table 12: Financial costs of Diesel and petrol fleet in 2014 by vehicle weight.
Diesel
Petrol
LDV HDV Total LDV HDV Total
Average fuel economy
(L/100km) 13.4 29.3 18.4 11.8 22.9 11.9
Average fuel price (Diesel) 3264 3264 3264 13674 13674 13674
Total Amount (Ug shs/100km) 43737.6 95635.2 60057.6 43353.2 84134.6 43720.6
Amount in Ug shs per km 437.376 956.352 600.576 433.532 841.346 437.206
Average Daily km travelled 101.6 101.6 101.6 101.6 101.6 101.6
Number of vehicles using
diesel 11956 12101 24057 39900 599 40499
Daily fleet km travelled 1214729.6 1229461.6 2444191.2 4053840 60858.4 4114698.4
Annual fleet km travelled (365
days) 4363940 4416865 8780805
14563500 218635 14782135
Estimated Financial Cost
(UGX) 1,908,682,621.44 4,224,077,676.48 5,273,540,743.68 6,313,743,282.00 183,947,682.71 6,462,838,114.81
Source: Computations based on combined dataset (URA e-tax dataset and MoW&T dataset)

52
Table 12 presents the analysis of financial cost by vehicle weight, when the vehicles are
categorized into LDV, and HDV. Assuming these vehicles cover an average distance of 101.6km
daily for 365 days (ie 1 year), the total expenditure on diesel fuel would be estimated at 6.13
billion Ugshs. In the FY2014/15 the duty tax on diesel fuel was 630 Ugshs per liter. At the
prevailing average price per liter of diesel fuel estimated at 3264 Ugshs (in April 2014), an
estimate of 1,878,909.41 liters of diesel were imported and consumed by newly registered
vehicles, an estimate of 1.18 billion Ugshs. A similar analysis was conducted for petrol fleet in
table 12 above.
Table 12 also presents the analysis of financial cost by vehicle category of petrol fleet. Assuming
these vehicles cover the same distance as the diesel fleet ie. An average distance of 101.6km
daily for 365 days (ie 1 year), the total expenditure on fuel would be estimated at 6.46 billion
Ugshs. In the FY2014/15 the duty tax on diesel fuel was 950 Ugshs per liter. At the prevailing
average price per liter of petrol fuel estimated at 3674 Ugshs, an estimate of 1,768,560.42 liters
of diesel were imported an estimate of 1.68 billion Ugshs.

53
Table 13: Financial benefits of Diesel and Petrol fleet in 2014 by vehicle weight.
Diesel Petrol
LDV HDV Total LDV HDV Total
Average CO2 credit per ton (USD) 1 1 1 1 1 1
Exchange rate (1USD to UGX) 2900 2900 2900 2900 2900 2900
Average CO2 emission(gCO2/km) 431 1149 792.6 325.2 716.5 331.0
Average daily km travelled 101.6 101.6 101.6 101.6 101.6 101.6
Total number of newly registered
vehicles 11956 12101 24057 39900 599 40499
Daily fleet km travelled 1214729.6 1229461.6 2444191.2 4053840 60858.4 4114698.4
Annual fleet km travelled (X 365 days) 443376304 448753484 892129788 1479651600 22213316 1501864916
Average gCO2 emitted 191,095,187,024.0 515,617,753,116.0 707,102,069,968.8 481,137,679,453.9 15,916,002,006.9 497,053,681,460.8
Conversion factor 1000000 1000000 1000000 1000000 1000000 1000000
Tones emitted 191095.187 515617.7531 707102.07 481137.6795 15916.00201 497053.6815
Average carbon credit per ton 2900 2900 2900 2900 2900 2900
Estimated financial Benefit (UGX) 554,176,042.37 1,495,291,484.04 2,050,596,002.91 1,395,299,270.42 46,156,405.82 1,441,455,676.24
Source: Computations based on combined dataset (URA e-tax dataset and MoW&T dataset)

54
From table 13 above, we notice that the HDV are emitting more carbon-dioxide than the LDV’s
on average. The financial benefit in 2014 was estimated at 2.04 billion Ugshs from diesel fleet if
its carbon credit is traded.
Table 13 above also shows similar analysis for petrol fleet where we found out that still HDV’s
pollute more than the LDV. The financial benefit in 2014 was estimated at 1.44 billion Ugshs
from petrol fleet. In totality this gives about 1.628 billion Ugshs which can be treated as benefit
to the government against the cost of bringing the emissions down.
An attempt to conduct a CBA analysis was not successful due to the following limitations;
1. We could not obtain the exact number of vehicle population in Uganda basing on the
available vehicle registration data for the period in consideration.
2. We were unable to obtain data on cases related to RTI and their treatment costs from
Uganda’s Ministry of health and Mulago hospital-the National referral hospital. Data on
such cases was unavailable.
3. We were unable to compute the government loss in revenue which would have resulted
from the import of old vehicles due to the different variables captured in the datasets
used.
4. Data on mileage per a given period of time for each vehicle could not be obtained. This
could require a conducting a survey of automobiles that are on the road.
Because of the above limitations, we instead conducted a simple situation analysis using policy
options presented in the section below.

55
The Policy options to consider include:
1. Regulatory policies: For example import restrictions such as a ban on importation of
vehicles older than a given number of years, say 20 years.
2. Traffic control measures such as encouraging public transport as opposed to private and
commercial motorcycle (boda boda) transport within the city.
Imposing Regulatory policies
We examined a policy of banning the importation of vehicles that are over 20 years of age from
their date of first registration in Uganda. The results are presented in the tables below.
Table 14: A projected estimate of future financial cost (205013
)
Diesel Petrol
2025 2050 2025 2050
Average fuel economy
(L/100km) 12.15 12.15 11.66 11.66
Average fuel price (Diesel) 3264 3264 3674 3674
Total Amount (Ug shs/100km) 39657.6 39657.6 42838.84 42838.84
Amount in Ug shs per km 396.576 396.576 428.3884 428.3884
Average Daily km travelled 101.6 101.6 101.6 101.6
Number of vehicles using diesel 33672 74080 58021 130610
Daily fleet km travelled 3421075.2 5894933.6 5894933.6 13269976
Annual fleet km travelled (365
days) 1248692448 2151650764 2151650764 4843541240
Estimated Financial Cost
(UGX) 495,201,456,258.05 853,293,053,384.06 921,742,228,148.74 2,074,916,882,137.62
Source: Computations based on combined dataset (URA e-tax dataset and MoW&T dataset)
13
Projected estimates of fleet in 2050

56
Table 15: A projected estimate of future financial benefit from LDV
Diesel Petrol
2025 2050 2025 2050
Average CO2 credit per ton (USD) 1 1 1 1
Exchange rate (1USD to UGX) 2900 2900 2900 2900
Average CO2 emission(gCO2/km) 389.69 389.69 320.82 320.89
Average daily km travelled 101.6 101.6 101.6 101.6
Total number of newly registered vehicles 33672 74080 58021 130610
Daily fleet km travelled 3421075.2 7526528 5894933.6 13269976
Annual fleet km travelled (X 365 days) 1248692448 2747182720 2151650764 4843541240
Average gCO2 emitted 486602960061.12 1070549634156.80 690292598106.48 1554243948503.60
Conversion factor 1000000 1000000 1000000 1000000
Tones emitted 486602.9601 1070549.634 690292.5981 1554243.949
Average carbon credit per ton 2900 2900 2900 2900
Estimated financial Benefit
(UGX) 1,411,148,584.18 3,104,593,939.05 2,001,848,534.51 4,507,307,450.66
From table 14 and 15 above, The LDV fleet is projected (see Appendix 8) to grow from 11956 in
2014 to 33672 in 2025 and then 74080 by 2050 for diesel while petrol LDV fleet is estimated to
grow from 39900 in 2014 to 58021 in 2025 to 130610 in 2050. Assuming the fuel efficiency of
LDV vehicles remains at 13.4 L/100Km and 11.8L/Km for diesel and petrol fleet respectively.
The expenditure would grow from UGX 1.9 billion in 2014 to UGX 495.2 billion in 2025 and
853.29 billion in 2050 for diesel LDV fleet, while Petrol LDV fleet would grow from UGX 6.49
billion in 2014 to UGX 921.74 billion in 2025 and 2.074 trillion in 2050.

57
The financial benefit would increase from 554 million tons in 2014 to 1.4 billion tons in 2025
and 3.1 billion tons in 2050. While the carbon emissions from petrol LDV fleet is expected to
grow from 1.39 billion tons in 2014 to 2 billion tons in 2025 and 4.5 billion tons in 2050. This is
so as a result of an increase in the annual carbon-dioxide emissions.
Supposing that we imposed ban of no importation of vehicles that are over 20 year old, on all
LDV’s. We projected the fleet of vehicles that will be imported into the country using the figures
of vehilces that have been registered into the country that are 20 years and below.
We re-estimated the fuel efficiency rate at 12.15 L/100km and 11.66 L/100Km for diesel and
petrol fleet respectively. The corresponding carbon emissions were estimated at 389.7 gCO2/Km
and 334.4 gCO2/Km for diesel and petrol fleet respectively.
The future expenditure on fuel would be expected to fall to UGX 242 billion in 2025 and 530.8
billion in 2050 for diesel LDV fleet while that of petrol LDV fleet would fall to 573.4 billion in
2025 and 2.04 trillion in 2050. As presented in table 16.
A corresponding fall in annual carbon emissions estimated at 237,867.8 tons in 2025 and
825,051.56 tons in 2050 for diesel fleet while for petrol fleet, 429,396.95 tons in 2025 and
1,529,396.99 tons in 2050. Would lead to a reduction in financial benefit for trading carbon
emission estimated at 689.8 million in 2025 and 2.392 billion in 2050 for diesel LDV fleet, and
1.24 billion in 2025 and 4.43 billion in 2050. As presented in table 17.

58
Table 16: Analysis of financial cost after imposing a 20 year ban.
Diesel Petrol
2025 2050 2025 2050
Average fuel economy (L/100km) 12.15 12.15 11.66 11.66
Average fuel price (Diesel) 3264 3264 3674 3674
Total Amount (Ug shs/100km) 39657.6 39657.6 42838.84 42838.84
Amount in Ug shs per km 396.576 396.576 428.3884 428.3884
Average Daily km travelled 101.6 101.6 101.6 101.6
Number of vehicles using diesel 16460 57092 36092 128522
Daily fleet km travelled 1672336 3666947.2 3666947.2 13057835.2
Annual fleet km travelled (365 days) 610402640 1338435728 1338435728 4766109848
Estimated Financial Cost (UGX) 242,071,037,360.64 530,791,487,267.33 573,370,340,020.76 2,041,746,172,008.96
Source: Computations based on combined dataset (URA e-tax dataset and MoW&T dataset)

59
Table 17: Analysis of financial benefit after imposing a 20 year ban.
Diesel Petrol
2014 2050 2014 2050
Average CO2 credit per ton (USD) 1 1 1 1
Exchange rate (1USD to UGX) 2900 2900 2900 2900
Average CO2 emission(gCO2/km) 389.69 389.69 320.82 320.89
Average daily km travelled 101.6 101.6 101.6 101.6
Total number of newly registered vehicles 16460 57092 36092 128522
Daily fleet km travelled 1672336 5800547.2 3666947.2 13057835.2
Annual fleet km travelled (X 365 days) 610402640 2117199728 1338435728 4766109848
Average gCO2 emitted 237867804781.60 825051562004.32 429396950256.96 1529396989124.72
Conversion factor 1000000 1000000 1000000 1000000
Tones emitted 237867.8048 825051.562 429396.9503 1529396.989
Average carbon credit per ton 2900 2900 2900 2900
Estimated financial Benefit (UGX) 689,816,633.87 2,392,649,529.81 1,245,251,155.75 4,435,251,268.46
Source: Computations based on combined dataset (URA e-tax dataset and MoW&T dataset)
Promoting use of Bulk Public transport
Large carriers are believed to be a solution to the heavy traffic especially in the city centers. A
large carrier say a bus can save us tons of carbon-dioxide emissions which could have been
caused by use of small saloon cars and motorcycles or any other motorized means of transport on
road.

60
Table 18: Showing Comparative Carbon Emission and cost of fuel using alternative means
of Transport
Bus Coaster Taxi Saloon Motorcycle
Seat capacity 80 30 14 4 1
Fleet 1 3 6 20 80
FE (L/100Km) 13.3 12.7 10.3 9 1.8
CO2 (gCO2/Km) 420.6 398 319.4 275.5 41.02
Cost of fuel 326414
326411
326411
326411
367415
Cost (L/Km) 434.112 414.528 336.192 293.76 66.132
Ave. cost for 21km 9116.352 26,115.264 42360.192 123,379.2 111,101.76
Total financial cost 3,327,468.48 9,532,071.36 15,461,470.08 45,033,408 40,552,142.4
Daily emissions 88326 25074 42360.192 129548.16 68913.6
Annual CO2 emission 3223899 9152010 15461470.08 47285078.4 25153464
Tons of carbon 3.223899 9.15201 15.46147008 47.2850784 25.153464
Source: Computations based on combined dataset (URA e-tax dataset and MoW&T dataset)
The Table 18, shows five different means of transport ferrying 80 people over 21Km. We notice
that one bus is equivalent to 3 min-buses or 14 taxis or 80 boda-bodas. Over the same distance
and ferrying same number of people an equivalent number of motorcycles’ (boda-bodas) would
pollute over 8 times the emission by a bus, while saloon cars would produce emission that is 18
times that of a bus; taxis would emit 5 times and coasters/min-buses would pollute 3 times the
emissions of a bus. So basing on this simple analysis, we find that it is more beneficial to society
in terms of least cost and least amount of pollution, to use a bus other than any other means of
transport.
14
Average price of diesel as at April 2015 15
Average price of petrol as at April 2015
61
6.0: POLICY SUGGESTION FOR IMPROVING FUEL EFFICIENCY AND REDUCING
CARBON EMISSIONS IN UGANDA
6.1: Introduction:
The process of burning fuels by driving vehicles produces greenhouse gases such as carbon
dioxide (CO2) into the atmosphere which contributes to climate change. These emissions can be
reduced by improving motor vehicle fuel efficiency, which in turn reduces the nation’s
dependence on oil and saves money. In this section we suggest some policies and strategies that
could be implemented by the drivers, tax authority, City Council Authorities, Inspection
Authority, Police and enforcement agencies to reduce carbon emission in Uganda. Basing on the
study findings and on the global policies, strategies aimed at reducing emissions shall include
fiscal, regulatory (total ban, inspections), traffic control and consumer awareness campaign.
Our findings show that older vehicles and larger engine capacity vehicles emit more pollution
than newer and smaller ones respectively. In addition, diesel engine emit more than petrol engine
much as they might be of the same engine capacity. Accordingly, in line with “Polluter Pay
Principle,” those that pollute more should pay more. We would therefore expect older vehicles,
lager engine vehicles and diesel powered ones or a combination to be charged more than the rest.
Broadly, policy options for Uganda, should include; total ban on importation of vehicles beyond
a given age, annual inspection for road worthiness in terms of emissions, differential vehicle fees
and charges/taxes on old vehicles and diesel engine vehicles proportional to the engine capacity
and age, regulatory measures and consumer awareness.
62
6.2: Consumer Awareness Strategies16
The following strategies apply mostly to the consume/driver/motor-vehicle owner. These
strategies may not be easy to enforce but if adhered to, may lead to significant reduction in
carbon emission.
i) Purchase of fuel efficient vehicle
When buying a new or used vehicle (or even renting a vehicle), one should look for the most
fuel-efficient one. This is good because it enables one to save on fuel costs and also saves the
nation from carbon emission.
ii) Smart driving
While driving, one should ensure improving fuel economy in order to reduce greenhouse gas
emissions, by avoiding hard accelerations, reducing one’s time spent idling while the engine is
running, and unload unnecessary items to reduce weight; obeying highway speed limits can save
fuel, as well as prevent pollution. Avoid rapid accelerations and braking, because these processes
burn more fuel. If driving an automatic engine car, use over-drive and cruise control. Avoid
using four-wheel drive instead consider operating in two-wheel drive mode when road conditions
make it safe to do so.
iii) Ensure regular vehicle maintenance
Every vehicle is designed to perform best when maintained according to the instructions found in
the owner's manual. A poorly maintained vehicle can pollute more and be less fuel-efficient than
one that's well maintained. Therefore make sure the vehicle is regularly maintained and well-
tuned, follow the manufacturer’s maintenance schedule, and use the recommended grade of
motor oil. Replace the air filter regularly: A clogged air filter can reduce fuel economy
16
http://www.epa.gov/climatechange/wycd/road.html

63
significantly. A well-maintained car is more fuel-efficient, produces fewer greenhouse gas
emissions, is more reliable, and is safer.
iv) Check the status of the tyres
Check the tire conditions and tire pressure regularly. Make sure the tyres are of good status well
inflated because under-inflation increases tire wear, reduces fuel economy, and hence leads to
higher greenhouse gas emissions. If there is need to replace the tyres, purchase those that have
“low rolling resistance”- an energy-saving feature.
v) Use alternative transport means if possible and drive less
When possible, consider using other means of transport such as public transport, a bike or
walking say twice a week. Bicycle riding can improve one’s health, saves money, and helps to
protect the environment. It is also advisable that when driving, try combining your errands and
activities into one trip. It is estimated that resting a car for just two days a week, can reduce
greenhouse gas emissions by an average of two tons per year.
vi) Use high efficient fuels and refuel wisely
1. Always consider using more efficient fuels that contain less sulphur, less lead and
particulate matter such as; unleaded fuel.
2. While refueling, ensure that you do not cause fuel spills because fuel fumes are harmful
to you and the environment.
3. Also, during very hot weather try to refuel early in the morning or late evening hours to
limit your exposure to fumes.
vii) Car pooling:

64
For the purpose of reducing congestion and emission, people living together and working in the
same area, are encouraged to use same vehicle other than driving different vehicles.
6.3: Policies for Ugandan Institutions; URA, KCCA, Police, Uganda Inspection Agency:
Until recently, the environment levy was 20% of the value of the vehicle, however, the problem
with such a fee is that it is un-equitable and regressive in nature. It is common knowledge that
older vehicles are of much less value than newer ones and also they pollute much more than the
newer ones other factors constant. The underlying principle should be the “Polluter pay
principle,” i.e. those that pollute more should pay more. Accordingly, a flat percentage fee
regardless of the age of the vehicle would imply that those that pollute more pay less than those
that pollute less. This leads to the situation where “bad goods drive good goods out of the
market”. Indeed since the imposition of the environment levy, more old vehicles have been
imported than newer ones, (see appendix 2). We notice that age, engine size and type of fuel
matter a lot with regard to emission. For instance vehicles of the same engine capacity but with
differences in the age pollute differently. Similarly, vehicles with same engine size but of
different fuel type, pollute differently. And also, there are differences in carbon emission arising
from differences in engine size. We therefore suggest the following general policies;
1. In line with the polluter pay principle, there should be differential tax rates/fees based on
age of the vehicle. In other words, the tax should be targeted in such a way that a higher
tax rate is imposed on older vehicles than on newer ones.
2. From our findings, vehicles of same age but different engine capacities pollute
differently, such that those with higher engine capacity pollute more than those with

65
lower capacity (See Appendix 4). For the purpose of equity, a tax based on engine
capacity should be imposed such that those that pollute more pay more.
3. There should be periodic inspection of all automobiles (vehicles and motorcycles) that
are already registered in the country, and government should impose a limit/ceiling of
emission per category of engine capacity of the vehicle beyond which the vehicle should
either be put off the road, install a catalytic converter or pay a fee for polluting the
environment.
4. All imported automobiles should be subjected to compulsory testing for fuel economy
and carbon emission before registration.
5. In addition to other specifications, vehicle inspections before importation should include
carbon emission levels.
6. Vehicles that are to be imported into the country should be labeled with “Fuel economy
and Environmental Labels,” for easier comparison during shopping. These window
stickers provide fuel economy and environmental rating for all newly imported vehicles.
7. Encourage public transportation by providing parking spaces at different entry points into
the city for private automobiles.
8. Discourage private transport into the City by increasing parking fees;
9. Make it a mandatory for every new building to have parking space.
10. Make walking and biking safe to the users by providing security lights and security along
the City roads.
11. Discourage daytime loading and offloading of both goods/merchandize and garbage
trucks in the Kampala City.

66
7.0: SUMMARY, CONCLUSION, RECOMMENDATIONS AND LIMITATIONS TO
THE STUDY
7.1: Summary
The process of burning fuels by driving vehicles produces greenhouse gases such as carbon
dioxide (CO2) into the atmosphere which contributes to climate change. These emissions can
be reduced by improving motor vehicle fuel efficiency, which in turn reduces the nation’s
dependence on oil and saves money that could be used in other investment ventures that
would lead to economic growth.
7.2: Conclusion
The unavailability of air pollution policies in Uganda could lead to disastrous environmental
situations in the country. The study has also shown that fuel efficiency and carbon emissions
are worsening in Uganda despite the imposition of an environment levy. This therefore calls
for strict policies that should also be enforced in a bid to reduce emission of green house
gases in Uganda.
7.3: Recommendations
The following recommendations arise from the difficulties we encountered while under
taking this study. We are therefore opportunistic that if adhered to, a comprehensive study
could be undertaken;
1. URA needs to harmonize its datasets i.e. e-tax and customs.
2. URA and MoW&T need to build a strong business intelligence to check consistency of
entries made by custom and importing agency.

67
3. Among the important variables that should be captured by URA, UNBS, MoW&T should
include; automobile type, fuel type, make name, model, chassis and engine numbers.
Others are power/displacement in cubic centimeters (CC), Transmission (i.e
manual/automatic), weight, year of manufacture, year of registration, status of the vehicle
(new or second hand), rated fuel economy per model and test cycle basis i.e. (Fuel
efficiency and carbon emission for each vehicle registered).
4. A comprehensive study with physical tests on used automobiles to estimate more
accurate fuel efficiency rates and carbon emissions rates and generate factor.
5. The government through MoW&T should ensure that car franchise in Uganda publish
their automobile efficiency rates and carbon emissions.
7.4: LIMITATIONS
1. Incomplete data on privately owned vehicles.
2. Insufficient and unavailable data in government institutions.
3. Limited or no documentation on environmental policies issues from NEMA, KCCA and
the Ministry of energy related to vehicle -related pollution (emissions) has been obtained.
4. Lack of access to data on government vehicles that belong to Ministry of Defense

68
REFERENCES
Background Paper No.3 CSD19/2011/BP3): Global Overview on Fuel Efficiency and Motor
Vehicle Emission Standards: Policy Options and Perspectives for International Cooperation).
Brazil’s Developing Automotive Fuel Economy Policy, 2012
Feng An Robert Earley, Lucia Green-Weiskel (2011) Global Overview On Fuel Efficiency And
Motor Vehicle Emission Standards: Policy Options And Perspectives For International
Cooperation, A paper prepared for the UN Commission on Sustainable Development Nineteenth
Session New York, 2-13 May
GFEI (2014). Cleaner, more efficient Vehicles Tool, Global Fuel Economy Initiative,
(http://www.unep.org/transport/gfei/autotool/basic.asp)
Global Fuel Economy Initiative Plan of Action 2012-2015
Government of India (GoI), Auto Fuel Vision and Policy 2025, Report of the Expert Committee,
May 2014.
http://www.epa.gov/fueleconomy/gas-label-1.htm;
http://www.carfolio.com/specifications/models;
www.edmunds.com/toyota;
http://www.naamsa.co.za/ecelabels/;
http://www.totalmotorcycle.com/MotorcycleFuelEconomyGuide;
http://www.theicct.org/info/data/GlobalStdReview_Conversionfactor.xlsx.
http://www.unep.org/transport/gfei/autotool
http://www.unep.org/transport/PCFV/PDF/GFEIAfricaSummary_30%20November2010.pdf
India’s Developing Automotive Fuel Economy Policy, 2012
Ministry of Works & Transport (2014/5), Motor Vehicle Registry Department. Kampala –
Uganda
National Environment Management Authority (2008), Environmental Legislation Act.
National Environment Management Authority (2013), The national Environment (Air Quality)
draft.

69
NPA 2010, Uganda Vision 2040.
Rajbahak. H. L, Joshi K. M and Ale. B. B.,(2011); Report On Vehicular Exhaust Emission With
Reference To Age of Vehicles, Road Conditions and Fuel Quality Aspects, Society of
Mechanical Engineers Nepal (SOMEN).
Republic of Uganda, Non-Motorized Transport Policy, 2012; Ministry of Works and Transport,
Kampala, Uganda, October, 2012
Uganda Revenue Authority (2014/5), Research and Development Department, (IT) Vehicle
Inventory Section
Uganda National Bureau of Standards (2008), Road vehicles — Code of practice for inspection
and testing of used motor vehicles for road worthiness, (US 845:2008), Uganda Bureau of
Standards, Kampala, Uganda
United Nations Environment Fund (2014), Introducing Low sulphur diesel in East Africa
(http://www.unep.org/ccac/Portals/50162/docs/Low_Sulfur_Fuel_in_East_Africa.pdf).
United Nations Environment Fund (2011) Methodological Guide on Developing Vehicle fuel
Economy Databases, Climate XL Africa. Prepared for Transport Unit Division of Technology,
Industry and Economics, UNEP

70
APPENDICES
Appendix 1: Conversion factor used to generate Fuel Economy ratios
Table 1: NEDC standard conversion factors
Source: Methodological Guide on Developing Vehicle fuel Economy Databases
Appendix 2: Vehicle fleet registered in 2005 and 2014.
2005 2014
Year of
Manufacture Fleet Percent
Year of
Manufacture Fleet Percent
1912 1 0.02 1949 1 0
1948 1 0.02 1956 1 0
1967 1 0.02 1959 2 0
1973 3 0.06 1960 1 0
1976 1 0.02 1965 1 0
1978 1 0.02 1967 3 0
1979 3 0.06 1968 1 0
1980 2 0.04 1969 3 0
1981 6 0.13 1970 8 0.01
1982 4 0.08 1971 7 0.01
1983 4 0.08 1972 3 0
1984 7 0.15 1973 2 0
1985 13 0.27 1974 17 0.03
1986 29 0.61 1975 16 0.02
1987 44 0.93 1976 9 0.01
1988 76 1.61 1977 12 0.02
1989 150 3.17 1978 16 0.02
1990 199 4.21 1979 24 0.04
1991 312 6.59 1980 28 0.04

71
1992 469 9.91 1981 19 0.03
1993 427 9.03 1982 33 0.05
1994 504 10.65 1983 48 0.07
1995 524 11.08 1984 118 0.18
1996 517 10.93 1985 182 0.28
1997 192 4.06 1986 357 0.55
1998 113 2.39 1987 597 0.92
1999 77 1.63 1988 1,382 2.14
2000 48 1.01 1989 1,602 2.48
2001 34 0.72 1990 1,734 2.69
2002 14 0.3 1991 1,751 2.71
2003 35 0.74 1992 1,781 2.76
2004 342 7.23 1993 1,709 2.65
2005 578 12.22 1994 2,077 3.22
1995 2,630 4.07
1996 4,830 7.48
1997 5,922 9.17
1998 7,732 11.98
1999 8,009 12.41
2000 6,055 9.38
2001 5,672 8.79
2002 902 1.4
2003 720 1.12
2004 510 0.79
2005 1,054 1.63
2006 676 1.05
2007 551 0.85
2008 524 0.81
2009 153 0.24
2010 156 0.24
2011 296 0.46
2012 378 0.59
2013 2,072 3.21
2014 2,169 3.36
Total 4,731 100 Total 64,556 100

72
Appendix 3: Average CO2 emission and FE for Toyota17
cars by Age, Engine capacity and
Fuel type
a. Diesel Engine
Engine CC Age = 5 Age = 10 Age = 15 Age = 20
CO2 FE CO2 FE CO2 FE CO2 FE
500-1200
1201-1500 280.73 9.19 273.16 8.96 369.62 11.82
1501-2000 301.201 9.8 339.13 10.81 411.42 13.05
2001-2500 248.57 8.21 312.54 10.14 358.12 11.49 505.41 15.77
2501-3000 293.39 9.27 373.90 11.95 401.1 12.79 529.32 16.45
3001-4000 441.14 13.93 534.37 16.61
4001-5000 342.511 11.03 531.56 16.52 502.36 15.68 784.71 23.65
>5000 605 18.61 1065.01 31.36
b. Petrol Engine
Engine CC Age = 5 Age = 10 Age = 15 Age = 20
CO2 FE CO2 FE CO2 FE CO2 FE
500-1200 141.15 5.56 202.57 7.73 205.52 7.84
1201-1500 240.17 9.04 262.19 9.8 303.25 11.2 372.06 13.52
1501-2000 230.58 8.7 283.77 10.53 304.43 11.24 387.07 14.02
2001-2500 308.04 11.36 386.61 14 414.71 14.93 450.12 16.1
2501-3000 358.65 13.07 403.28 14.56 432.59 15.15 566.94 19.92
3001-4000 490.31 17.42 721.87 24.89 884.7 30.04
4001-5000 490.31 17.42 519.48 18.37 1179.94 39.2 1970.85 63.07
>5000 761.04 26.13
17
The most common type of vehicles in Uganda is the Toyota

73
Appendix 4: Total C02 emissions by year in Uganda from the available data
CO2
DIESEL
CO2
PETROL
CO2
MOTORCYCLES
2000 15823.19 6788.207 1001.878
2001 20551.42 8397.881 1635.136
2002 26813.08 9272.734 4826.109
2003 31509.6 11002.16 4088.883
2004 38292.87 17116.44 5545.694
2005 53390.05 26582.85 4452.799
2006 67606.21 29035.84 5170.719
2007 91007.26 43992.03 12863.09
2008 116168 54427.72 13093.85
2009 130705.8 60981.31 12590.57
2010 138401.5 82440.22 14639.46
2011 142180.9 89460.52 19509.83
2012 219918.7 163713 63465.26
2013 471462.9 356205.5 283158.7
2014 669656.8 497013.7 329153.3
Appendix 5: C02 emission by fuel type
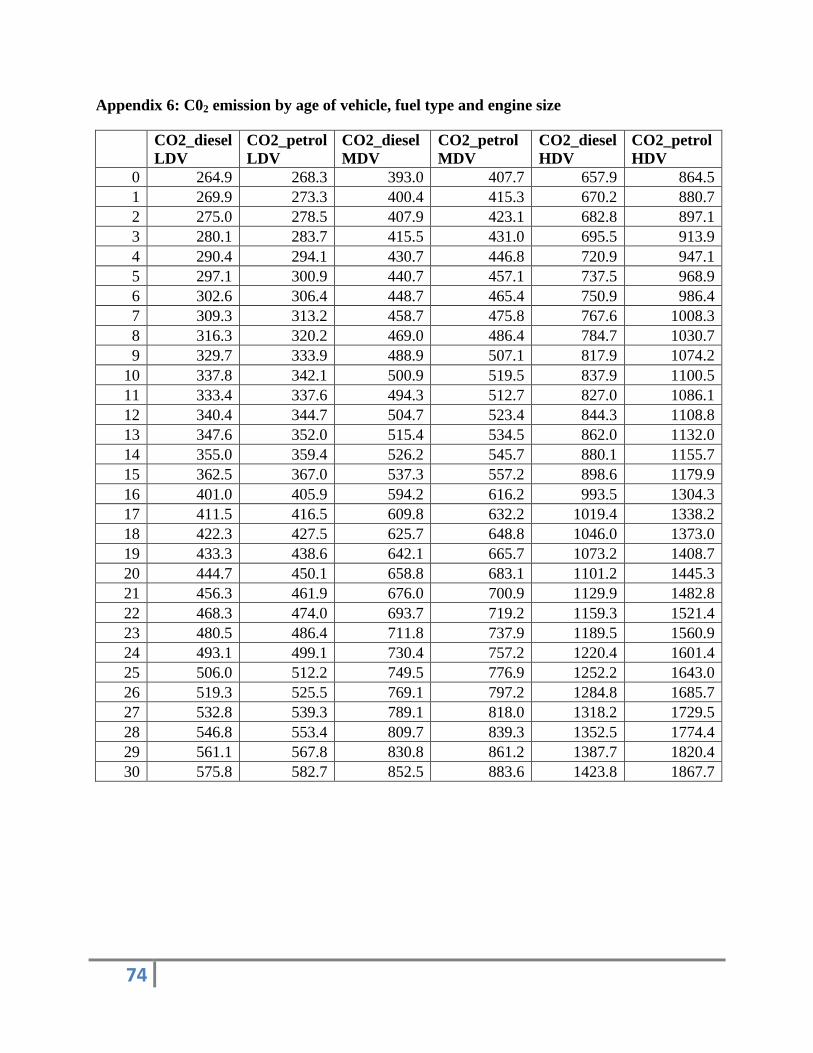
74
Appendix 6: C02 emission by age of vehicle, fuel type and engine size
CO2_diesel
LDV
CO2_petrol
LDV
CO2_diesel
MDV
CO2_petrol
MDV
CO2_diesel
HDV
CO2_petrol
HDV
0 264.9 268.3 393.0 407.7 657.9 864.5
1 269.9 273.3 400.4 415.3 670.2 880.7
2 275.0 278.5 407.9 423.1 682.8 897.1
3 280.1 283.7 415.5 431.0 695.5 913.9
4 290.4 294.1 430.7 446.8 720.9 947.1
5 297.1 300.9 440.7 457.1 737.5 968.9
6 302.6 306.4 448.7 465.4 750.9 986.4
7 309.3 313.2 458.7 475.8 767.6 1008.3
8 316.3 320.2 469.0 486.4 784.7 1030.7
9 329.7 333.9 488.9 507.1 817.9 1074.2
10 337.8 342.1 500.9 519.5 837.9 1100.5
11 333.4 337.6 494.3 512.7 827.0 1086.1
12 340.4 344.7 504.7 523.4 844.3 1108.8
13 347.6 352.0 515.4 534.5 862.0 1132.0
14 355.0 359.4 526.2 545.7 880.1 1155.7
15 362.5 367.0 537.3 557.2 898.6 1179.9
16 401.0 405.9 594.2 616.2 993.5 1304.3
17 411.5 416.5 609.8 632.2 1019.4 1338.2
18 422.3 427.5 625.7 648.8 1046.0 1373.0
19 433.3 438.6 642.1 665.7 1073.2 1408.7
20 444.7 450.1 658.8 683.1 1101.2 1445.3
21 456.3 461.9 676.0 700.9 1129.9 1482.8
22 468.3 474.0 693.7 719.2 1159.3 1521.4
23 480.5 486.4 711.8 737.9 1189.5 1560.9
24 493.1 499.1 730.4 757.2 1220.4 1601.4
25 506.0 512.2 749.5 776.9 1252.2 1643.0
26 519.3 525.5 769.1 797.2 1284.8 1685.7
27 532.8 539.3 789.1 818.0 1318.2 1729.5
28 546.8 553.4 809.7 839.3 1352.5 1774.4
29 561.1 567.8 830.8 861.2 1387.7 1820.4
30 575.8 582.7 852.5 883.6 1423.8 1867.7

75
Appendix 7: An Extrapolation of Carbon emission by classification of engine size and fuel
type
a. Light Duty Vehicle
b. Medium Duty Vehicle
0
100
200
300
400
500
600
700
-2 4 6 8 10 12 14 16 18 20 22 24 26 28 30
CO
2 e
mis
sio
n (
ton
s)
Age of vehicle in years
LDV carbon emissions and age
CO2_dieselLDV
CO2_petrollLDV
0100200300400500600700800900
1000
-2 4 6 8 10 12 14 16 18 20 22 24 26 28 30
CO
2 e
mis
sio
ns
(to
ns)
Age of vehicle in years
MDV carbon emissions and age
CO2_dieselMDV
CO2_petrollMDV

76
c. High Duty Vehicle
0200400600800
100012001400160018002000
-2 4 6 8 10 12 14 16 18 20 22 24 26 28 30
CO
2 e
mis
sio
n (
ton
s)
Age of vehicle in years
HDV carbon emissions and age
CO2_dieselHDV
CO2_petrollHDV

77
Appendix 8; Projection of LDV fleet with 20year ban policy and without policy
without policy with 20 year ban
year of registation DIESEL PETROL DIESEL PETROL
2000 787 662 477 651
2001 1067 799 688 787
2002 1308 886 832 882
2003 1528 1037 914 1029
2004 1915 1590 1115 1569
2005 2269 2463 1213 2436
2006 2761 2687 1415 2658
2007 3846 4031 2069 3968
2008 4757 4883 2556 4799
2009 4864 5387 2413 5291
2010 5108 7338 2700 7259
2011 5781 7754 2978 7620
2012 8235 14202 3675 13949
2013 17468 29737 8756 29232
2014 24057 40499 11956 39900
2015 15137 24584 7475 24193
2016 16851 27706 8295 27264
2017 18657 30998 9169 30502
2018 20533 34414 10081 33863
2019 22449 37905 11012 37298
2020 24396 41462 11961 40798
2021 26333 45072 12897 44352
2022 28233 48567 13807 47792
2023 30143 52000 14739 51171
2024 32012 55215 15662 54333
2025 33672 58021 16460 57093
2026 35039 60469 17139 59506
2027 36063 62188 17651 61198
2028 36921 63904 18008 62883
2029 38707 67221 18883 66142
2030 41481 72189 20245 71036
2031 43133 75142 21048 73942
2032 44749 78028 21832 76781
2033 46337 80861 22602 79569
2034 47908 83658 23364 82321
2035 49470 86440 24121 85059

78
2036 51037 89232 24881 87806
2037 52619 92068 25648 90596
2038 54225 94965 26425 93447
2039 55871 97947 27221 96381
2040 57571 101017 28046 99402
2041 59311 104139 28889 102474
2042 61054 107262 29735 105547
2043 62733 110248 30555 108485
2044 64286 113020 31306 111213
2045 65804 115745 32040 113894
2046 67445 118691 32835 116793
2047 69096 121658 33636 119712
2048 70755 124638 34440 122645
2049 72418 127625 35246 125584
2050 74080 130611 36053 128522