basf investor day 2015
TRANSCRIPT
We create chemistryfor a sustainable future
150 years
Kurt BockChairman of the Board of Executive Directors
Hans-Ulrich EngelChief Financial Officer
BASF Investor Day
Ludwigshafen September 28, 2015
BASF Investor Day 2015 – Keynote Speech 2
150 years
Cautionary note regarding forward-looking statements
This presentation may contain forward-looking statements that are subject to risks and uncertainties, including those pertaining to the anticipated benefits to be realized from the proposals described herein. Forward-looking statements may include, in particular, statements about future events, future financial performance, plans, strategies, expectations, prospects, competitive environment, regulation and supply and demand. BASF has based these forward-looking statements on its views and assumptions with respect to future events and financial performance. Actual financial performance could differ materially from that projected in the forward-looking statements due to the inherent uncertainty of estimates, forecasts and projections, and financial performance may be better or worse than anticipated. Given these uncertainties, readers should not put undue reliance on any forward-looking statements. The information contained in this presentation is subject to change without notice and BASF does not undertake any duty to update the forward-looking statements, and the estimates and assumptions associated with them, except to the extent required by applicable laws and regulations.
BASF Investor Day 2015 – Keynote Speech 3
150 years
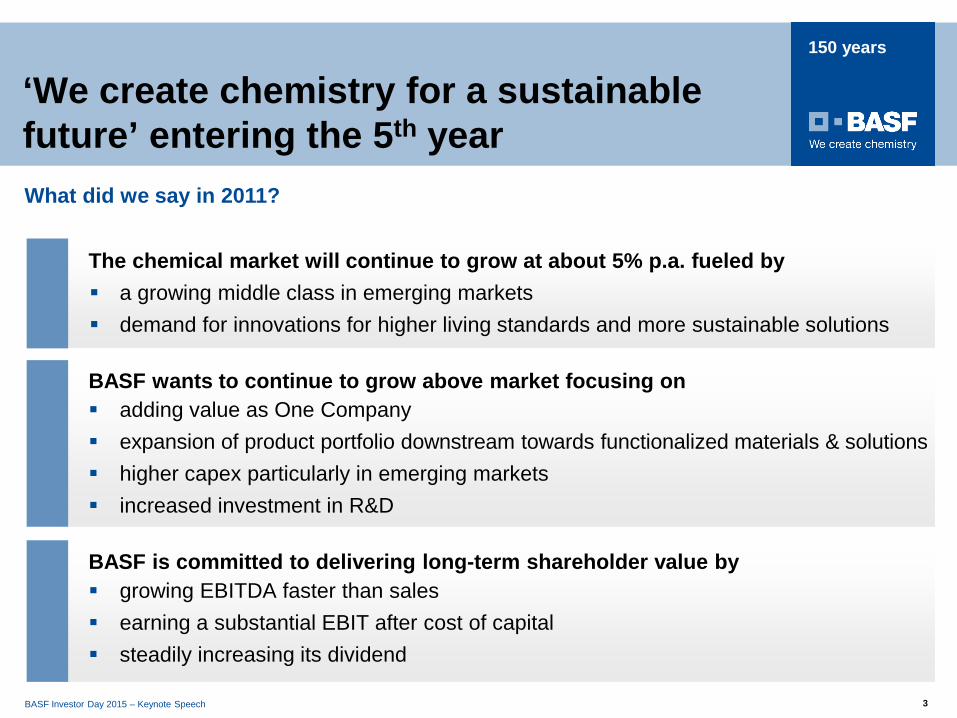
‘We create chemistry for a sustainable future’ entering the 5th year
The chemical market will continue to grow at about 5% p.a. fueled by a growing middle class in emerging markets demand for innovations for higher living standards and more sustainable solutions
BASF wants to continue to grow above market focusing on adding value as One Company expansion of product portfolio downstream towards functionalized materials & solutions higher capex particularly in emerging markets increased investment in R&D
BASF is committed to delivering long-term shareholder value by growing EBITDA faster than sales earning a substantial EBIT after cost of capital steadily increasing its dividend
What did we say in 2011?
BASF Investor Day 2015 – Keynote Speech 4
150 years
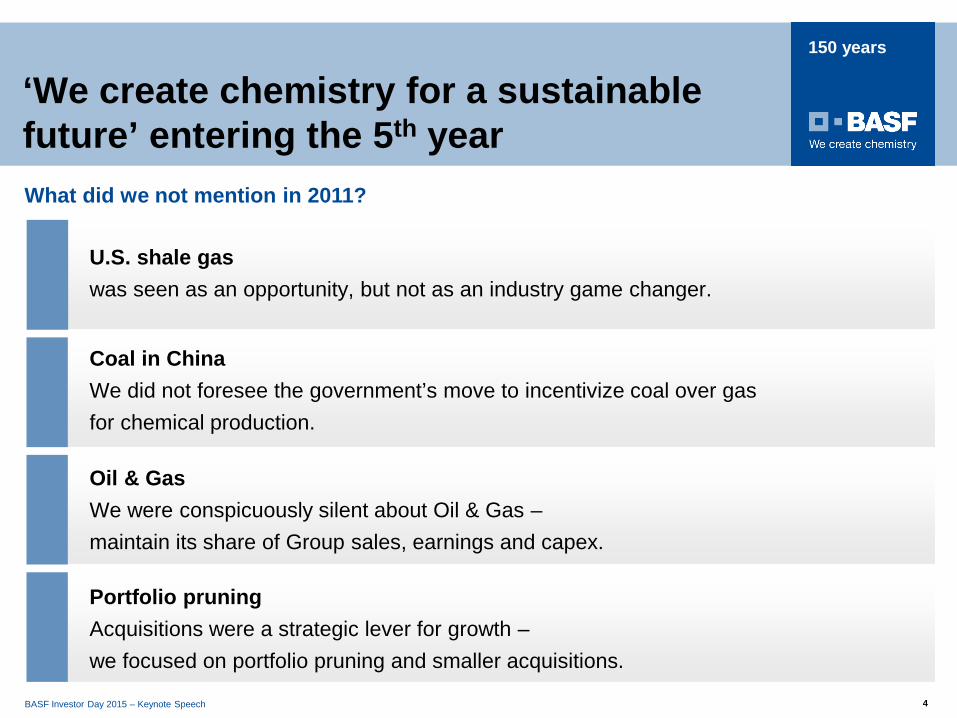
‘We create chemistry for a sustainable future’ entering the 5th year
U.S. shale gas was seen as an opportunity, but not as an industry game changer.
Portfolio pruningAcquisitions were a strategic lever for growth –we focused on portfolio pruning and smaller acquisitions.
What did we not mention in 2011?
Coal in ChinaWe did not foresee the government’s move to incentivize coal over gas for chemical production.
Oil & GasWe were conspicuously silent about Oil & Gas –maintain its share of Group sales, earnings and capex.
BASF Investor Day 2015 – Keynote Speech 5
150 years
What do we want to achieve today and tomorrow?
Enable you to deep dive into our business portfolio and introduce our business leaders to you
Demonstrate how we drive value
Highlight our approach to innovation and showcase specific examples
Provide a medium-term outlook
BASF Investor Day 2015 – Keynote Speech 6
150 years
BASF Investor Day 2015 – Keynote Speech 6
► Review of chemical industry’s landscape
► BASF growth and earnings review
► The way forward: Our priorities
BASF Investor Day 2015 – Keynote Speech 6
BASF Investor Day 2015 – Keynote Speech 7
150 years
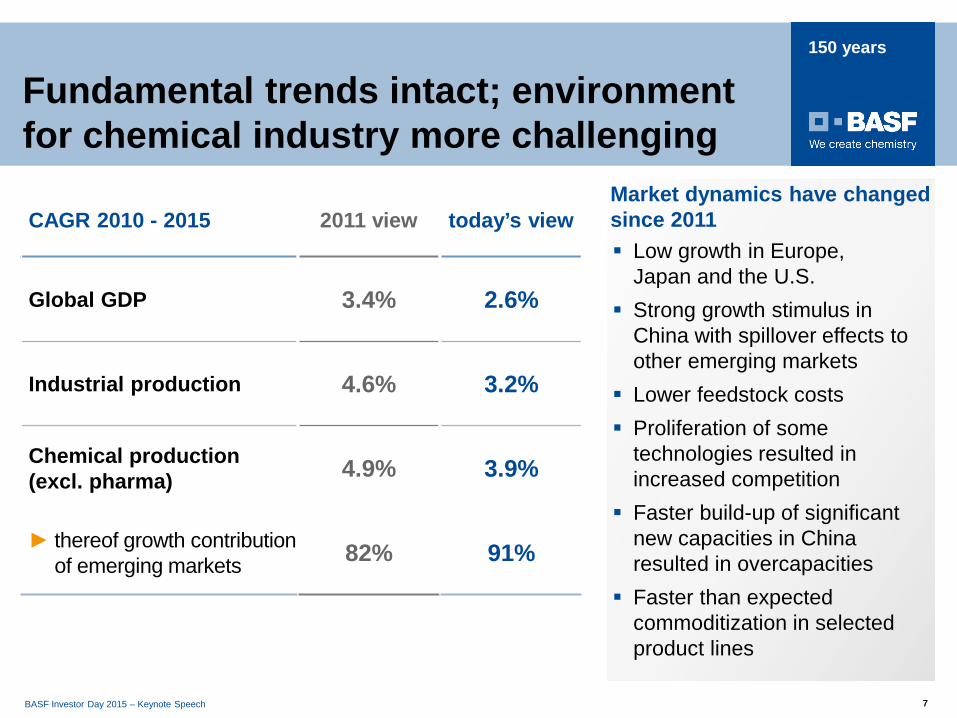
Low growth in Europe, Japan and the U.S.
Strong growth stimulus in China with spillover effects to other emerging markets
Lower feedstock costs Proliferation of some
technologies resulted in increased competition
Faster build-up of significant new capacities in China resulted in overcapacities
Faster than expected commoditization in selected product lines
Market dynamics have changed since 2011
Fundamental trends intact; environment for chemical industry more challenging
CAGR 2010 - 2015 2011 view today’s view
Global GDP 3.4% 2.6%
Industrial production 4.6% 3.2%
Chemical production (excl. pharma) 4.9% 3.9%
► thereof growth contribution of emerging markets 82% 91%
BASF Investor Day 2015 – Keynote Speech 8
150 years
BASF Investor Day 2015 – Keynote Speech 8
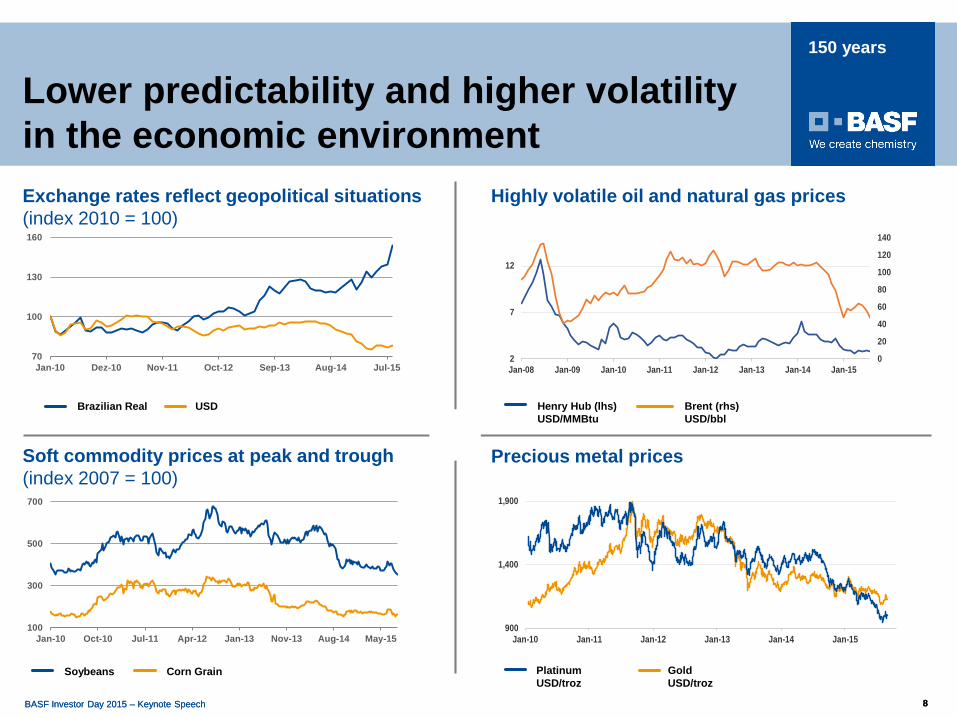
Lower predictability and higher volatility in the economic environment
Soft commodity prices at peak and trough(index 2007 = 100)
Precious metal prices
Exchange rates reflect geopolitical situations(index 2010 = 100)
Highly volatile oil and natural gas prices
Brent (rhs) USD/bbl
Henry Hub (lhs) USD/MMBtu
PlatinumUSD/troz
900
1,400
1,900
Jan-10 Jan-11 Jan-12 Jan-13 Jan-14 Jan-15
GoldUSD/troz
0
20
40
60
80
100
120
140
2
7
12
Jan-08 Jan-09 Jan-10 Jan-11 Jan-12 Jan-13 Jan-14 Jan-15
Brazilian Real USD
70
100
130
160
Jan-10 Dez-10 Nov-11 Oct-12 Sep-13 Aug-14 Jul-15
100
300
500
700
Jan-10 Oct-10 Jul-11 Apr-12 Jan-13 Nov-13 Aug-14 May-15
Soybeans Corn Grain
BASF Investor Day 2015 – Keynote Speech 9
150 years
BASF Investor Day 2015 – Keynote Speech 9
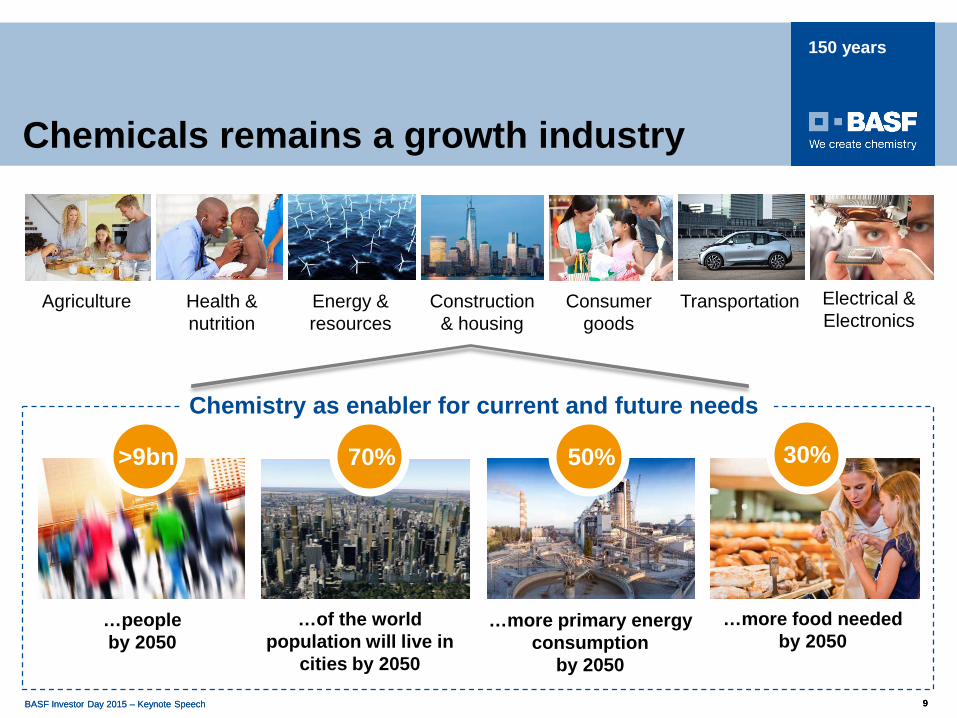
Chemicals remains a growth industry
…more food neededby 2050
…more primary energyconsumption
by 2050
…of the worldpopulation will live in
cities by 2050
Agriculture Health & nutrition
Energy & resources
Transportation Construction& housing
Consumer goods
Chemistry as enabler for current and future needs
…peopleby 2050
70% 50% >9bn
Electrical & Electronics
30%
BASF Investor Day 2015 – Keynote Speech 10
150 years
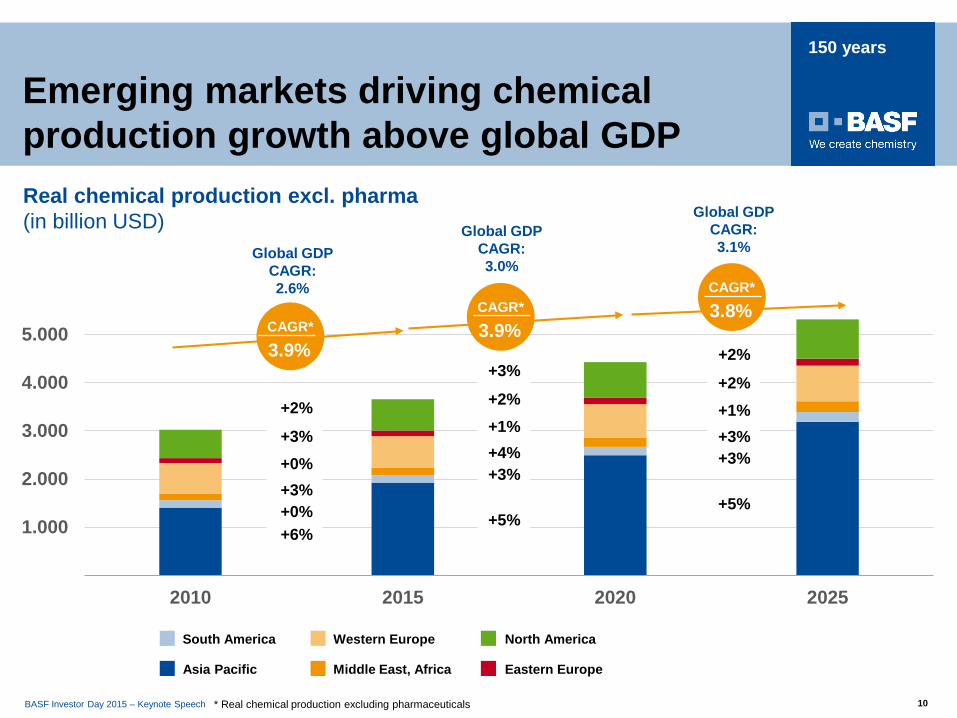
Emerging markets driving chemicalproduction growth above global GDP
0
1.000
2.000
3.000
4.000
5.000
2010 2015 2020 2025
+0%+3%+0%+3%
+2%
+5%
+3%+4%+1%+2%
+3%
Global GDP CAGR:2.6%
Global GDP CAGR:3.0%
Real chemical production excl. pharma(in billion USD)
CAGR*
3.9%
CAGR*
3.9%
CAGR*
3.8%
+5%
+3%+3%+1%+2%
+2%
Global GDP CAGR:3.1%
+6%
Asia Pacific
South America
Middle East, Africa
Western Europe
Eastern Europe
North America
* Real chemical production excluding pharmaceuticals
BASF Investor Day 2015 – Keynote Speech 11
150 years
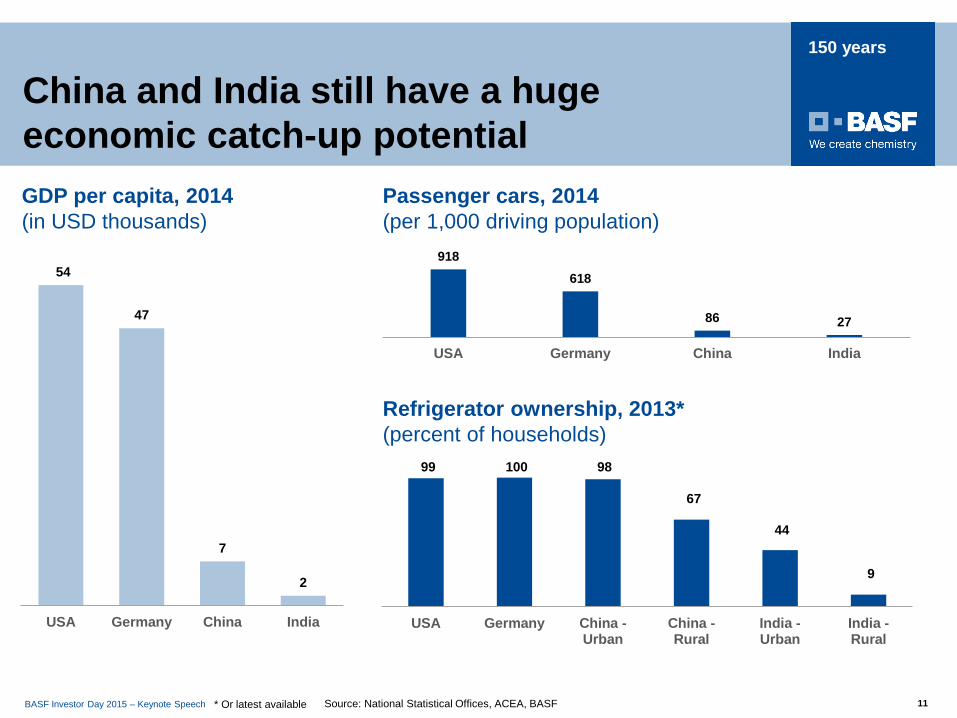
China and India still have a huge economic catch-up potentialGDP per capita, 2014(in USD thousands)
54
47
7
2
USA Germany China India
Refrigerator ownership, 2013*(percent of households)
* Or latest available
Passenger cars, 2014(per 1,000 driving population)
918618
86 27
USA Germany China India
Source: National Statistical Offices, ACEA, BASF
99 100 98
67
44
9
USA Germany China -Urban
China -Rural
India -Urban
India -Rural
BASF Investor Day 2015 – Keynote Speech 12
150 years
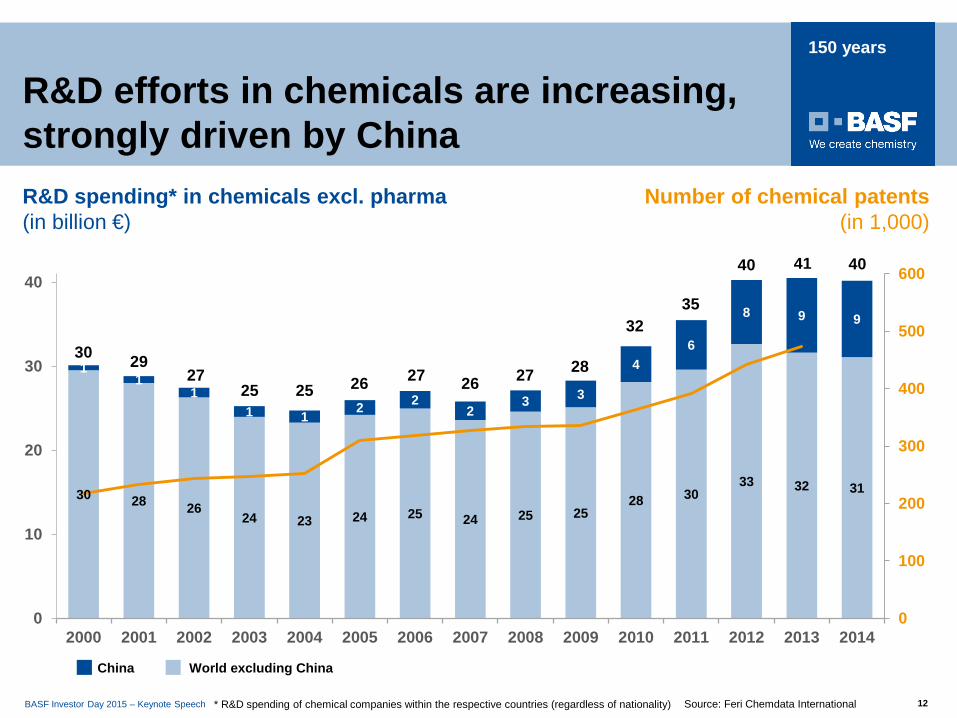
R&D efforts in chemicals are increasing, strongly driven by ChinaR&D spending* in chemicals excl. pharma(in billion €)
Source: Feri Chemdata International* R&D spending of chemical companies within the respective countries (regardless of nationality)
30 28 2624 23 24 25 24 25 25
28 3033 32 31
11
11 1 2 2
23 3
46
8 9 9
0
100
200
300
400
500
600
0
10
20
30
40
2000 2001 2002 2003 2004 2005 2006 2007 2008 2009 2010 2011 2012 2013 2014
4140
3532
2827262726252527
2930
40
World excluding ChinaChina
Number of chemical patents (in 1,000)
BASF Investor Day 2015 – Keynote Speech 13
150 years
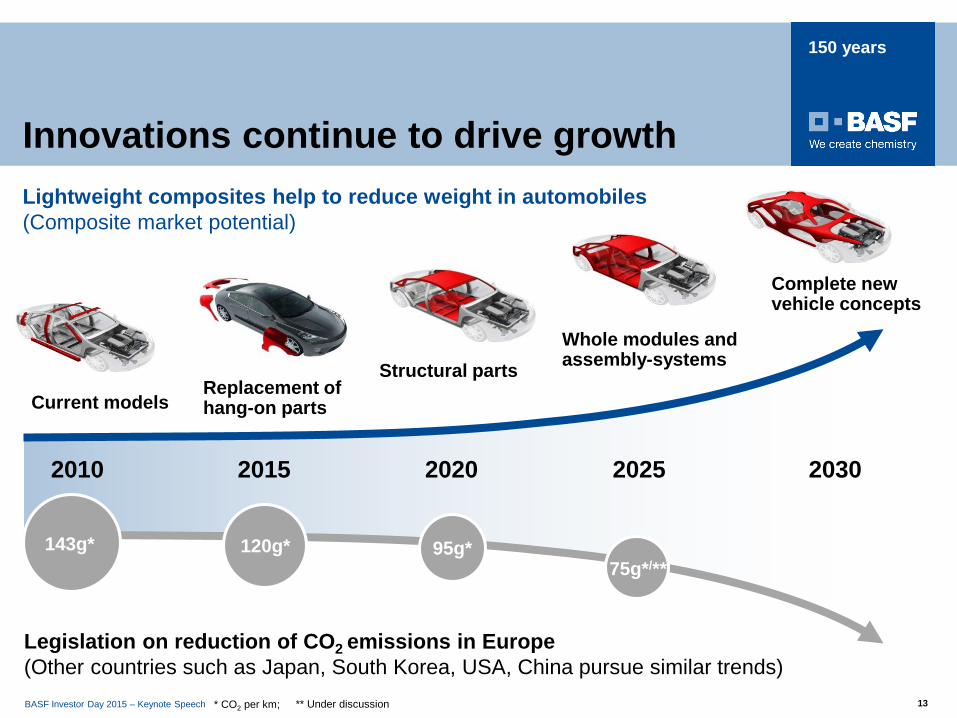
Innovations continue to drive growth
Replacement of hang-on parts
Whole modules and assembly-systemsStructural parts
Complete new vehicle concepts
Current models
2010
* CO2 per km;
2015 2020 2025 2030
Lightweight composites help to reduce weight in automobiles(Composite market potential)
Legislation on reduction of CO2 emissions in Europe(Other countries such as Japan, South Korea, USA, China pursue similar trends)
143g* 120g* 95g*75g*/**
** Under discussion
BASF Investor Day 2015 – Keynote Speech 14
150 years
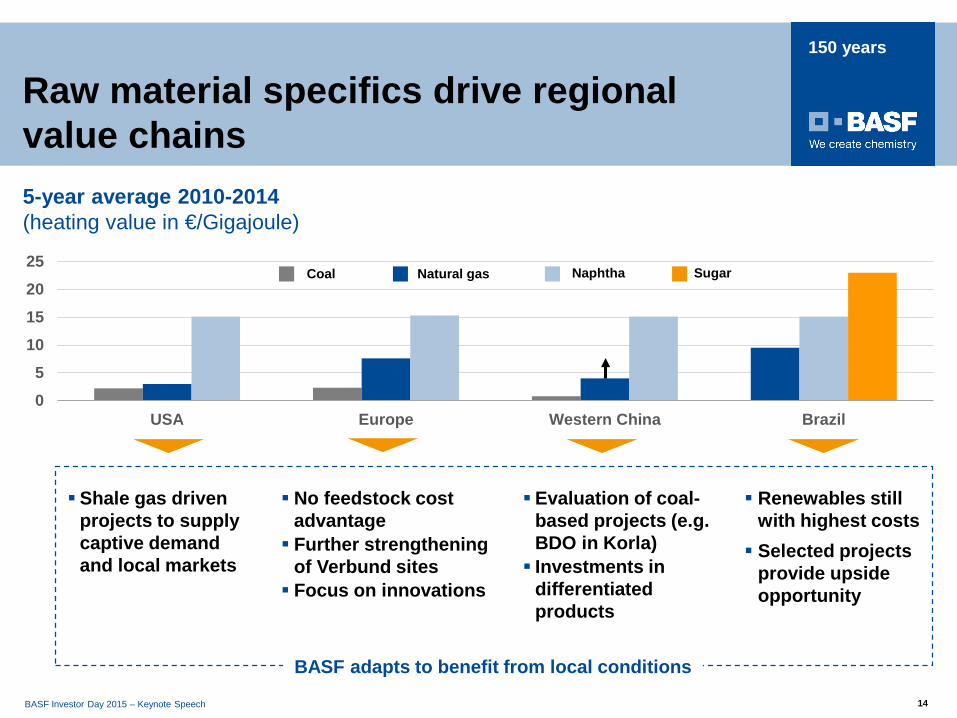
Raw material specifics drive regional value chains
Coal Natural gas Naphtha Sugar
5-year average 2010-2014(heating value in €/Gigajoule)
0
5
10
15
20
25
USA Europe Western China Brazil
Shale gas drivenprojects to supply captive demand and local markets
Renewables still with highest costs Selected projects
provide upside opportunity
No feedstock cost advantage Further strengthening
of Verbund sites Focus on innovations
BASF adapts to benefit from local conditions
Evaluation of coal-based projects (e.g. BDO in Korla) Investments in
differentiated products
BASF Investor Day 2015 – Keynote Speech 15
150 years
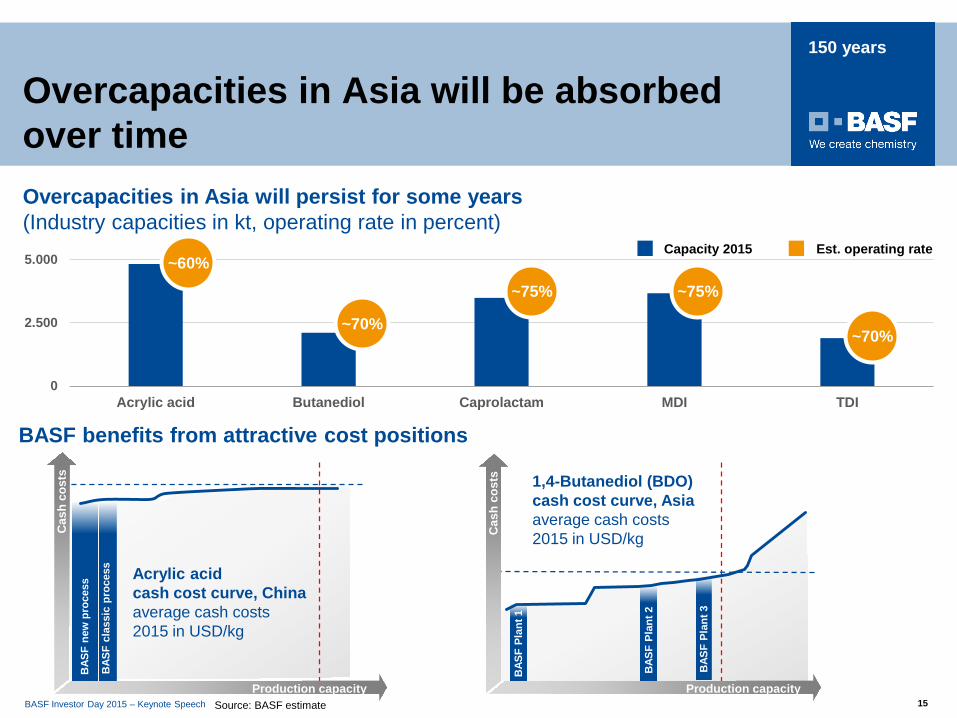
Overcapacities in Asia will be absorbedover time
BASF benefits from attractive cost positions
Source: BASF estimate
0
2.500
5.000
Acrylic acid Butanediol Caprolactam MDI TDI
Cas
h co
sts
BAS
F cl
assi
c pr
oces
s
BAS
F ne
w p
roce
ss
Production capacity
Acrylic acid cash cost curve, China average cash costs 2015 in USD/kg
Overcapacities in Asia will persist for some years(Industry capacities in kt, operating rate in percent)
~60%
~70%
~75% ~75%
~70%
BAS
F Pl
ant 3
BAS
F Pl
ant 2
Cas
h co
sts
Production capacity
BAS
F Pl
ant 1
1,4-Butanediol (BDO) cash cost curve, Asia average cash costs 2015 in USD/kg
Capacity 2015 Est. operating rate
BASF Investor Day 2015 – Keynote Speech 16
150 years
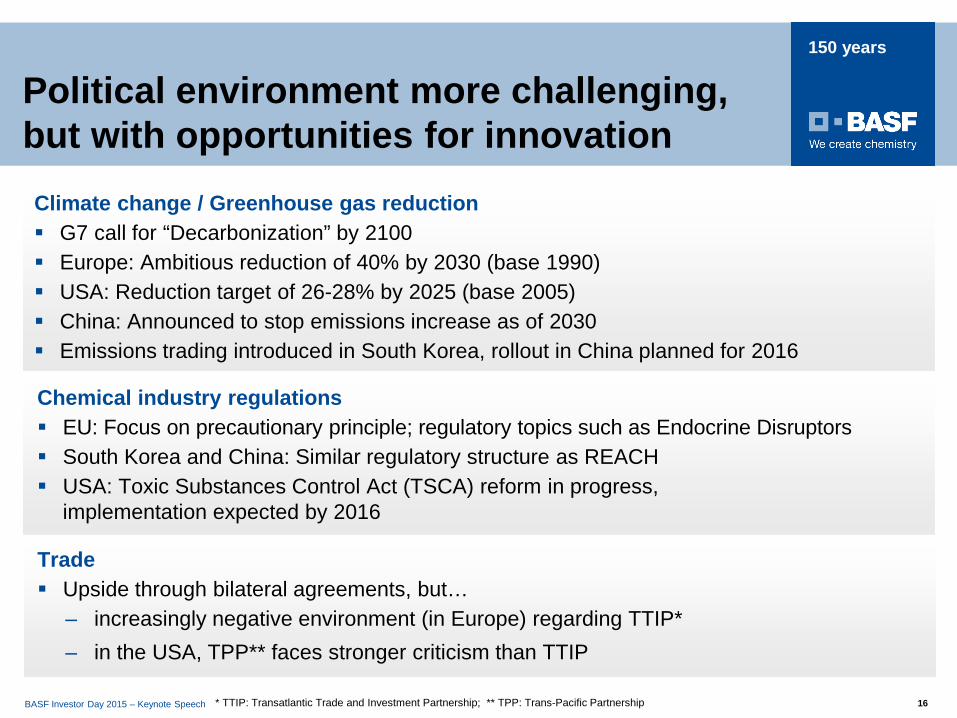
Climate change / Greenhouse gas reduction G7 call for “Decarbonization” by 2100 Europe: Ambitious reduction of 40% by 2030 (base 1990) USA: Reduction target of 26-28% by 2025 (base 2005) China: Announced to stop emissions increase as of 2030 Emissions trading introduced in South Korea, rollout in China planned for 2016
* TTIP: Transatlantic Trade and Investment Partnership; ** TPP: Trans-Pacific Partnership
Political environment more challenging, but with opportunities for innovation
Chemical industry regulations EU: Focus on precautionary principle; regulatory topics such as Endocrine Disruptors South Korea and China: Similar regulatory structure as REACH USA: Toxic Substances Control Act (TSCA) reform in progress,
implementation expected by 2016
Trade Upside through bilateral agreements, but…
– increasingly negative environment (in Europe) regarding TTIP*– in the USA, TPP** faces stronger criticism than TTIP
BASF Investor Day 2015 – Keynote Speech 17
150 years
BASF Investor Day 2015 – Keynote Speech 17
► Review of chemical industry’s landscape
► BASF growth and earnings review
► The way forward: Our priorities
BASF Investor Day 2015 – Keynote Speech 17
BASF Investor Day 2015 – Keynote Speech 18
150 years
BASF Investor Day 2015 – Keynote Speech 18
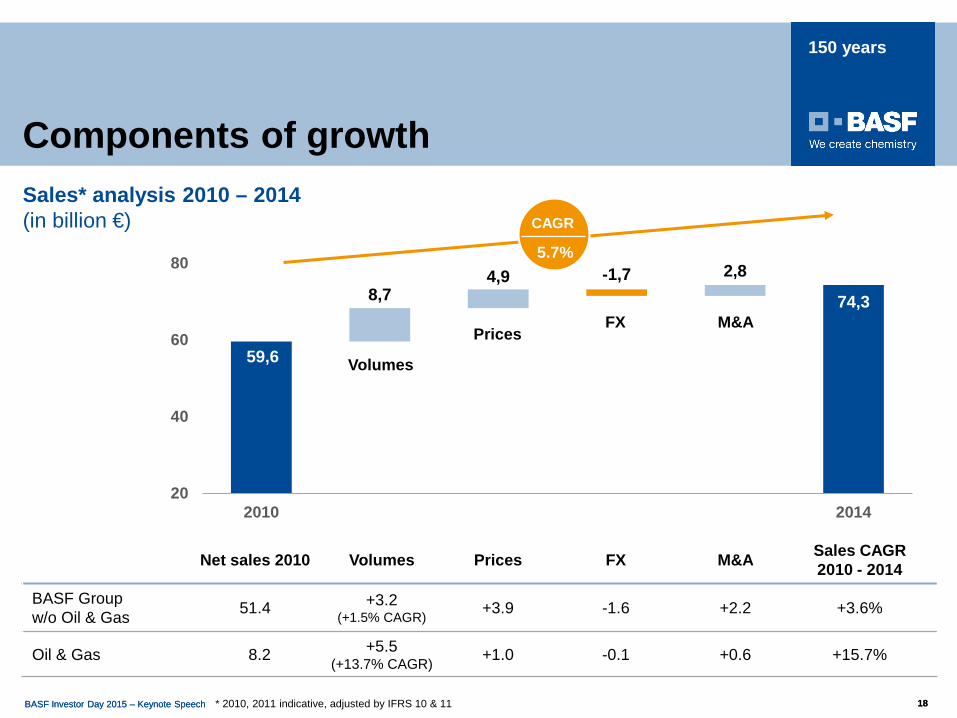
Components of growth
* 2010, 2011 indicative, adjusted by IFRS 10 & 11
59,6
74,38,74,9 -1,7 2,8
20
40
60
80
2010 2014
Volumes
PricesFX M&A
Sales* analysis 2010 – 2014 (in billion €)
Net sales 2010 Volumes Prices FX M&A Sales CAGR 2010 - 2014
BASF Group w/o Oil & Gas 51.4 +3.2
(+1.5% CAGR) +3.9 -1.6 +2.2 +3.6%
Oil & Gas 8.2 +5.5 (+13.7% CAGR) +1.0 -0.1 +0.6 +15.7%
5.7%
CAGR
BASF Investor Day 2015 – Keynote Speech 19
150 years
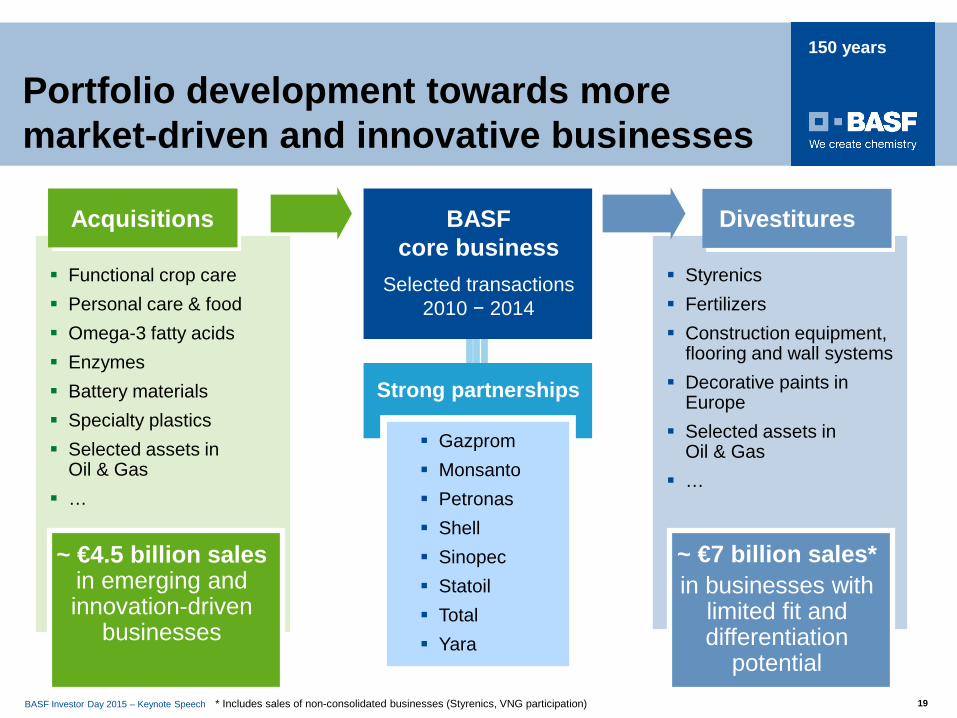
Functional crop care Personal care & food Omega-3 fatty acids Enzymes Battery materials Specialty plastics Selected assets in
Oil & Gas …
BASFcore business
Strong partnerships
Gazprom Monsanto Petronas Shell Sinopec Statoil Total Yara
Selected transactions 2010 − 2014
Acquisitions
~ €4.5 billion salesin emerging andinnovation-driven
businesses
Divestitures
Styrenics Fertilizers Construction equipment,
flooring and wall systems Decorative paints in
Europe Selected assets in
Oil & Gas …
~ €7 billion sales*in businesses with
limited fit and differentiation
potential
Portfolio development towards more market-driven and innovative businesses
* Includes sales of non-consolidated businesses (Styrenics, VNG participation)
BASF Investor Day 2015 – Keynote Speech 20
150 years
BASF Investor Day 2015 – Keynote Speech 20
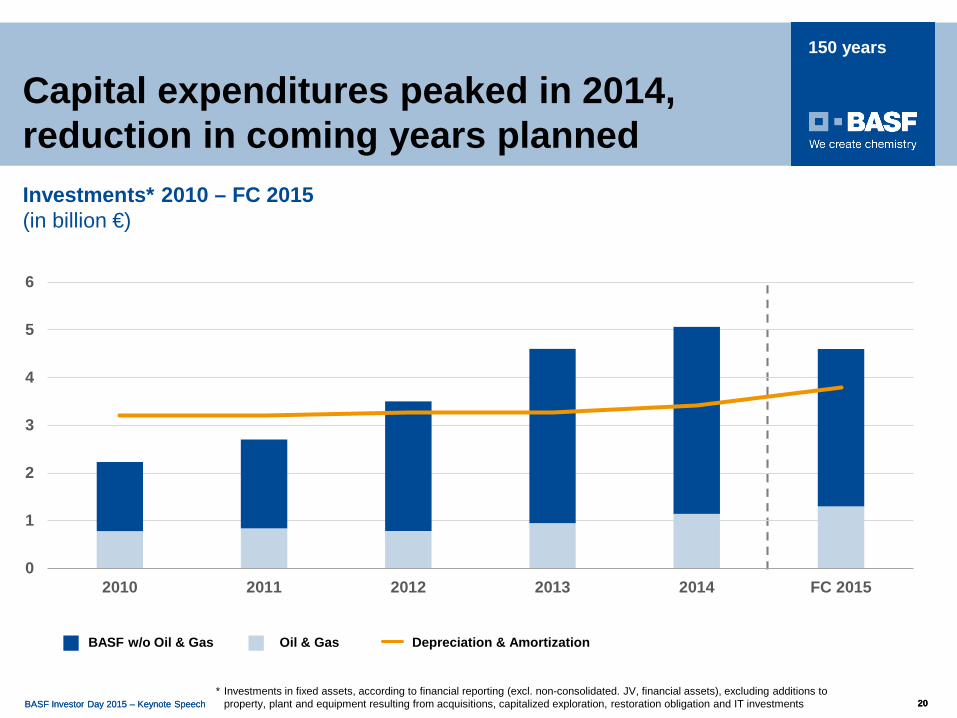
Capital expenditures peaked in 2014, reduction in coming years planned
* Investments in fixed assets, according to financial reporting (excl. non-consolidated. JV, financial assets), excluding additions toproperty, plant and equipment resulting from acquisitions, capitalized exploration, restoration obligation and IT investments
Investments* 2010 – FC 2015 (in billion €)
Oil & GasBASF w/o Oil & Gas Depreciation & Amortization
0
1
2
3
4
5
6
2010 2011 2012 2013 2014 FC 2015
BASF Investor Day 2015 – Keynote Speech 21
150 years
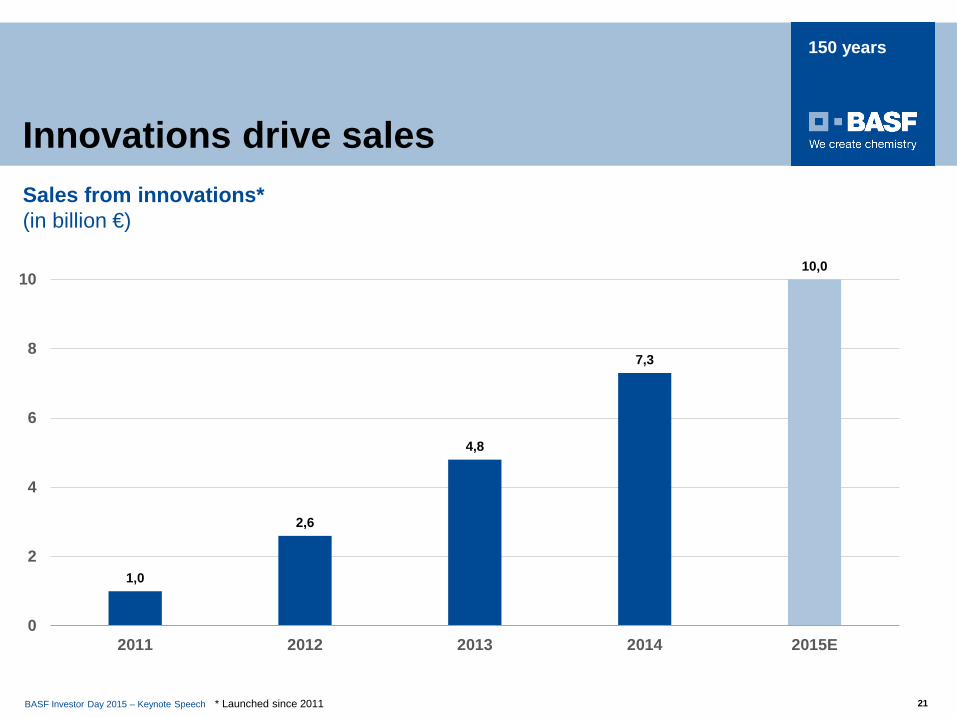
Innovations drive salesSales from innovations*(in billion €)
* Launched since 2011
1,0
2,6
4,8
7,3
10,0
0
2
4
6
8
10
2011 2012 2013 2014 2015E
BASF Investor Day 2015 – Keynote Speech 22
150 years
BASF Investor Day 2015 – Keynote Speech 22
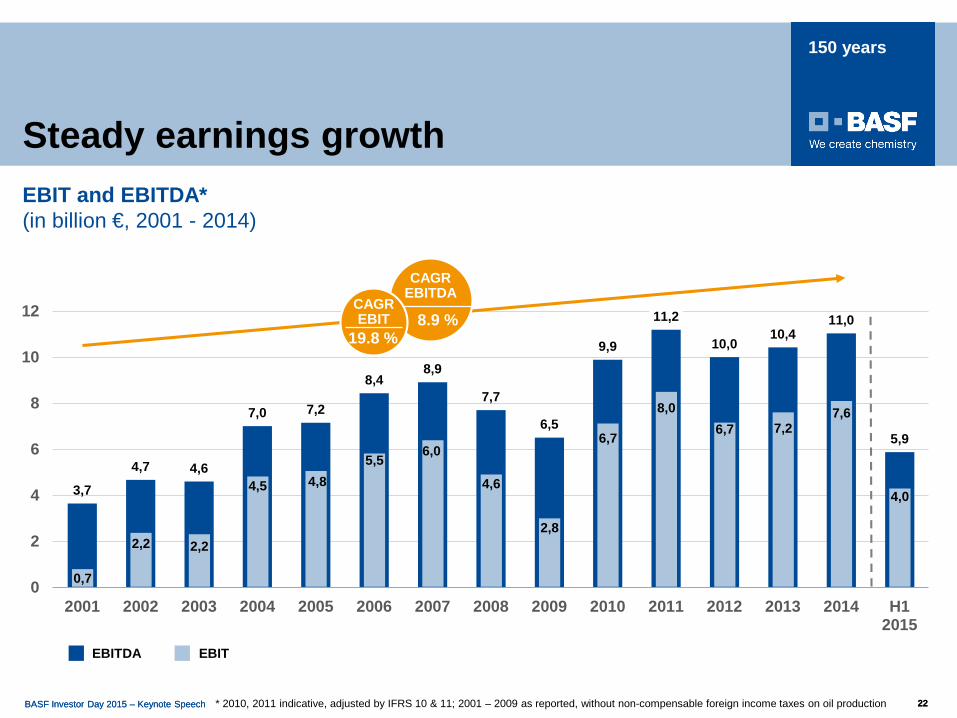
Steady earnings growth
* 2010, 2011 indicative, adjusted by IFRS 10 & 11; 2001 – 2009 as reported, without non-compensable foreign income taxes on oil production
EBIT and EBITDA*(in billion €, 2001 - 2014)
3,7
4,7 4,6
7,0 7,2
8,48,9
7,7
6,5
9,9
11,2
10,010,4
11,0
5,9
0
2
4
6
8
10
12
2001 2002 2003 2004 2005 2006 2007 2008 2009 2010 2011 2012 2013 2014 H12015
EBITEBITDA
0,7
2,2 2,2
4,5 4,85,5
6,0
4,6
2,8
6,7
8,06,7 7,2
7,6
4,0
CAGREBITDA
8.9 %CAGREBIT
19.8 %
BASF Investor Day 2015 – Keynote Speech 23
150 years
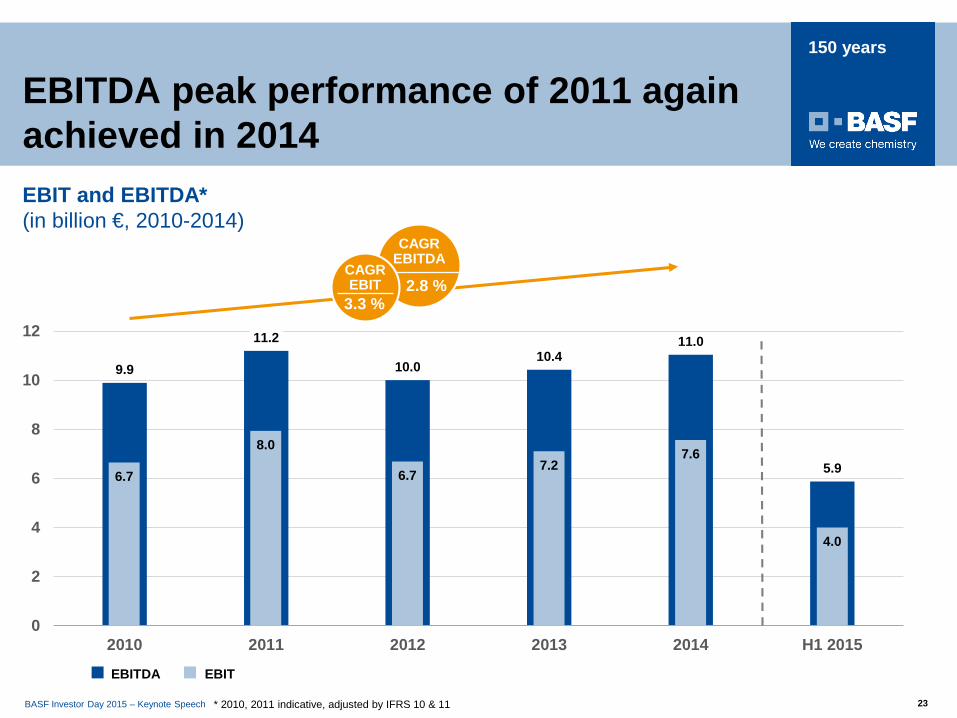
EBITDA peak performance of 2011 again achieved in 2014
* 2010, 2011 indicative, adjusted by IFRS 10 & 11
EBIT and EBITDA*(in billion €, 2010-2014)
CAGREBITDA
2.8 %CAGREBIT
3.3 %
9.9
11.2
10.010.4
11.0
5.9
0
2
4
6
8
10
12
2010 2011 2012 2013 2014 H1 2015
EBITEBITDA
6.7
8.0
6.77.2
7.6
4.0
BASF Investor Day 2015 – Keynote Speech 24
150 years
50
100
150
200
250
300
350
2001 2002 2003 2004 2005 2006 2007 2008 2009 2010 2011 2012 2013 2014
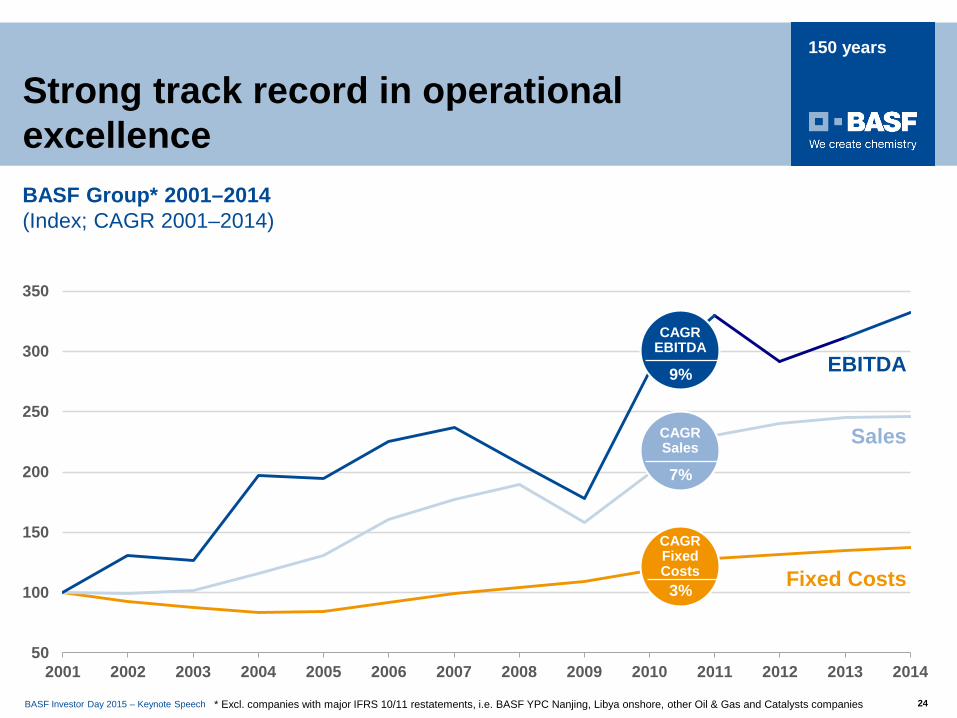
Strong track record in operational excellence
EBITDA
Sales
* Excl. companies with major IFRS 10/11 restatements, i.e. BASF YPC Nanjing, Libya onshore, other Oil & Gas and Catalysts companies
BASF Group* 2001–2014(Index; CAGR 2001–2014)
Fixed Costs
CAGREBITDA
9%
CAGRSales
7%
CAGRFixed Costs3%
BASF Investor Day 2015 – Keynote Speech 25
150 years
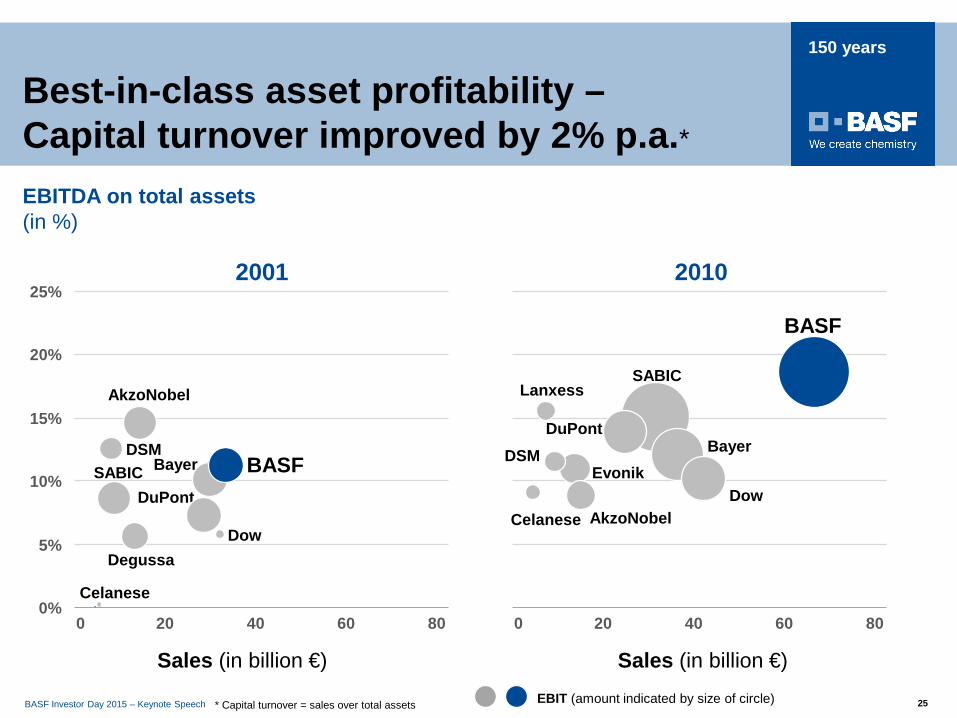
Best-in-class asset profitability –Capital turnover improved by 2% p.a.*EBITDA on total assets(in %)
2001
DuPont
DSM
Dow
Celanese
Bayer
AkzoNobel
25%
20%
15%
10%
5%
0%806040200
BASFSABIC
Degussa
Sales (in billion €)
2010
806040200
BASF
SABICLanxess
Evonik
DuPontDSM
DowCelanese
Bayer
AkzoNobel
EBIT (amount indicated by size of circle)* Capital turnover = sales over total assets
Sales (in billion €)
BASF Investor Day 2015 – Keynote Speech 26
150 years
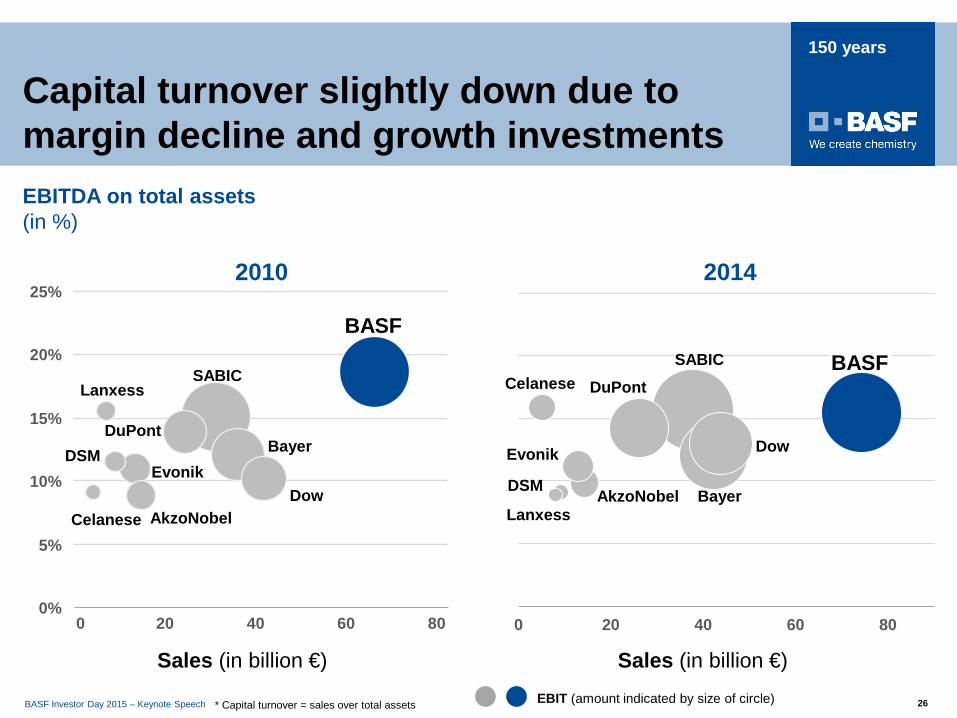
25%
20%
15%
10%
5%
0%806040200
2010
BASF
SABICLanxess
Evonik
DuPontDSM
DowCelanese
Bayer
AkzoNobel
2014
0 20 40 60 80
BASF
Sales (in billion €)
* Capital turnover = sales over total assets
Sales (in billion €)
SABICCelanese
Dow
Bayer
DuPont
AkzoNobel
Evonik
Lanxess
DSM
Capital turnover slightly down due to margin decline and growth investments
EBIT (amount indicated by size of circle)
EBITDA on total assets(in %)
BASF Investor Day 2015 – Keynote Speech 27
150 years
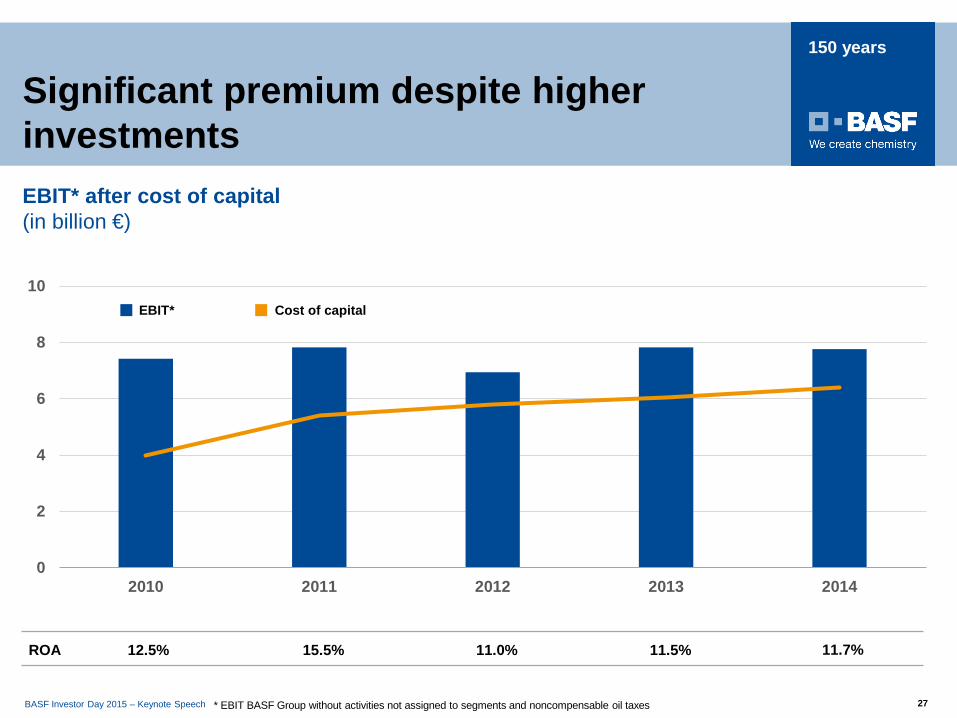
0
2
4
6
8
10
2010 2011 2012 2013 2014
* EBIT BASF Group without activities not assigned to segments and noncompensable oil taxes
Cost of capitalEBIT*
EBIT* after cost of capital(in billion €)
ROA 12.5% 15.5% 11.0% 11.5% 11.7%
Significant premium despite higher investments
BASF Investor Day 2015 – Keynote Speech 28
150 years
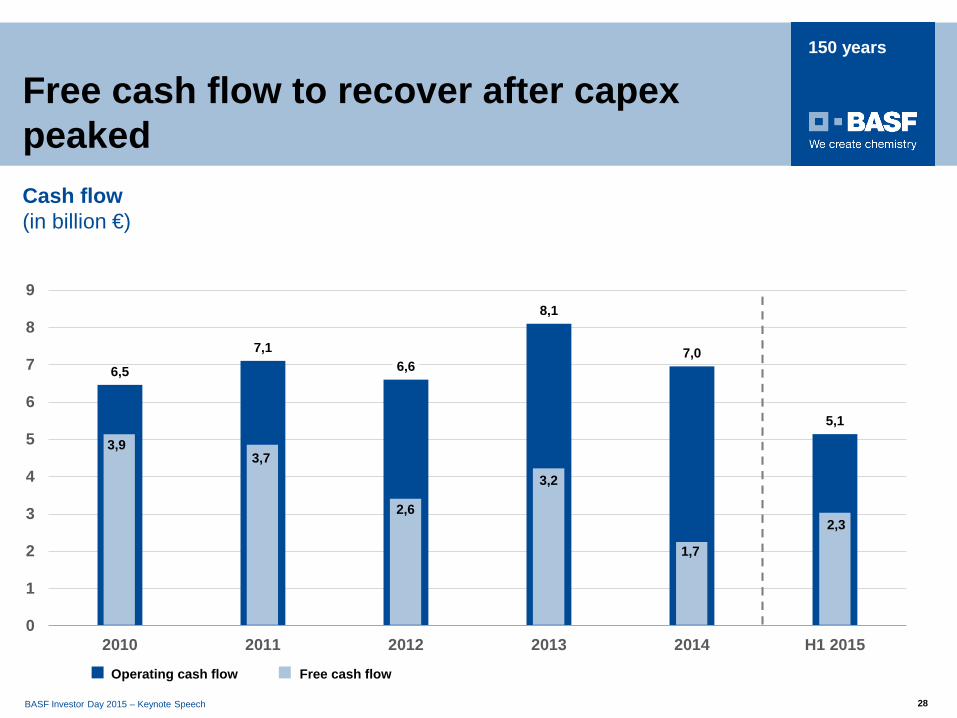
Free cash flow to recover after capex peakedCash flow(in billion €)
6,5
7,16,6
8,1
7,0
5,1
0
1
2
3
4
5
6
7
8
9
2010 2011 2012 2013 2014 H1 2015
Free cash flowOperating cash flow
3,93,7
2,6
3,2
1,7
2,3
BASF Investor Day 2015 – Keynote Speech 29
150 years
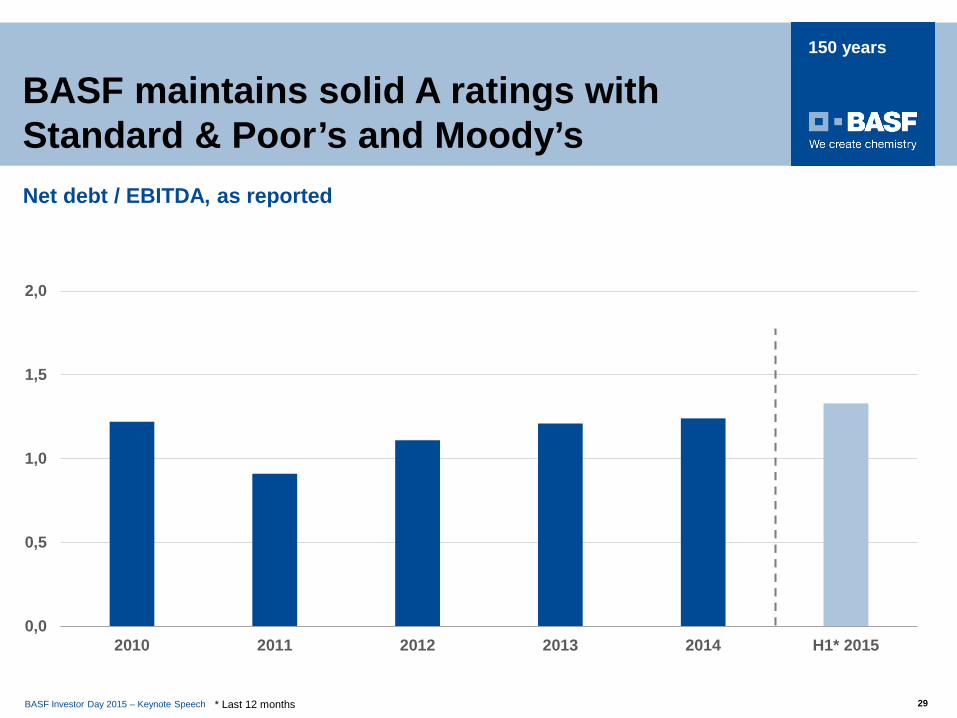
BASF maintains solid A ratings with Standard & Poor’s and Moody’s
0,0
0,5
1,0
1,5
2,0
2010 2011 2012 2013 2014 H1* 2015
* Last 12 months
Net debt / EBITDA, as reported
BASF Investor Day 2015 – Keynote Speech 30
150 years
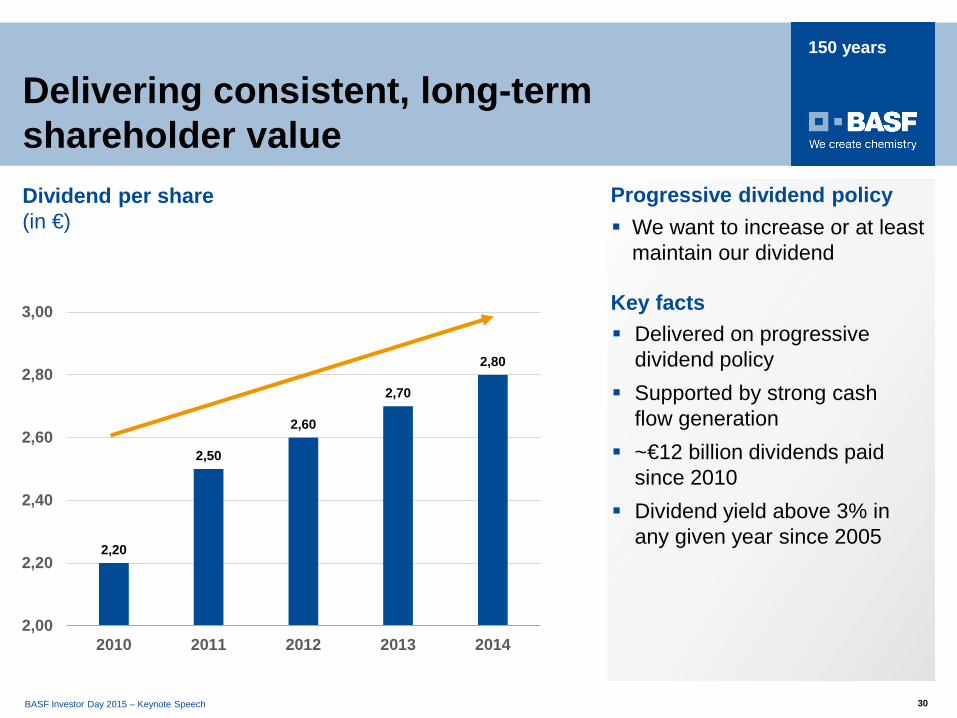
2,20
2,50
2,60
2,70
2,80
2,00
2,20
2,40
2,60
2,80
3,00
2010 2011 2012 2013 2014
Delivered on progressive dividend policy
Supported by strong cash flow generation
~€12 billion dividends paid since 2010
Dividend yield above 3% in any given year since 2005
Delivering consistent, long-term shareholder valueDividend per share(in €) We want to increase or at least
maintain our dividend
Key facts
Progressive dividend policy
BASF Investor Day 2015 – Keynote Speech 31
150 years
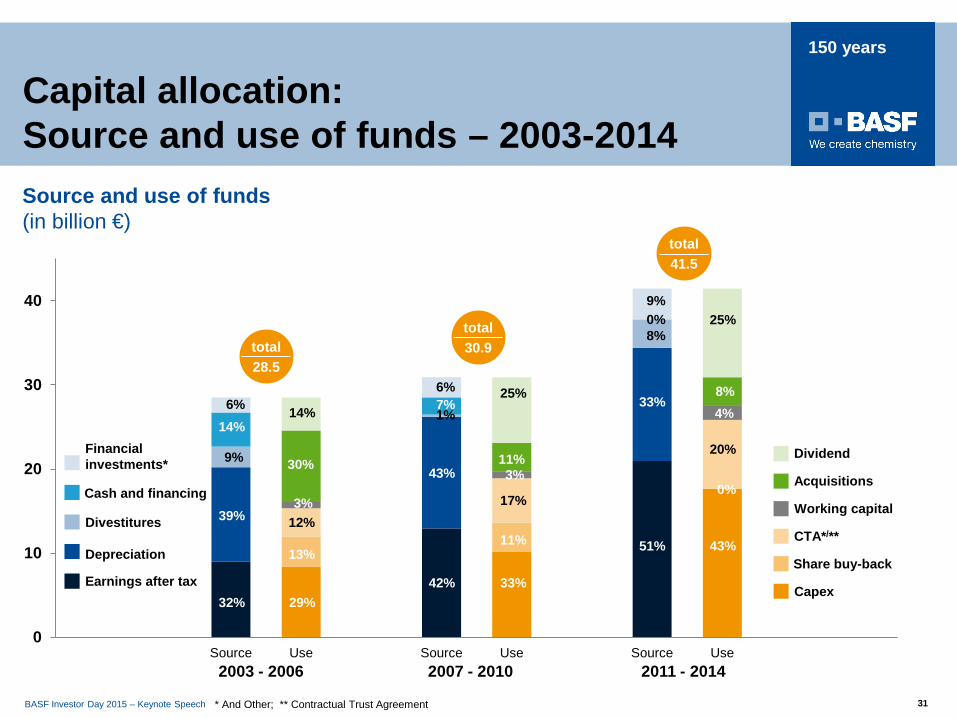
Capital allocation: Source and use of funds – 2003-2014
0
10
20
30
40
Source Use Source Use Source Use
Source and use of funds(in billion €)
Cash and financing
Depreciation
Financial investments*
Divestitures
Earnings after tax
2003 - 2006 2007 - 2010 2011 - 2014
* And Other; ** Contractual Trust Agreement
total28.5
total30.9
total41.5
32%
39%
9%
14%6%
29%
12%3%
30%
14%
13%
42%
43%
1%7%6%
33%
17%
3%11%
25%
11% 51%
33%
8%0%9%
43%
20%
4%8%
25%
0%
Dividend
Working capital
Share buy-back
Acquisitions
CTA*/**
Capex
BASF Investor Day 2015 – Keynote Speech 32
150 years
BASF Investor Day 2015 – Keynote Speech 32
► Review of chemical industry’s landscape
► BASF growth and earnings review
► The way forward: Our priorities
BASF Investor Day 2015 – Keynote Speech 32
BASF Investor Day 2015 – Keynote Speech 33
150 years
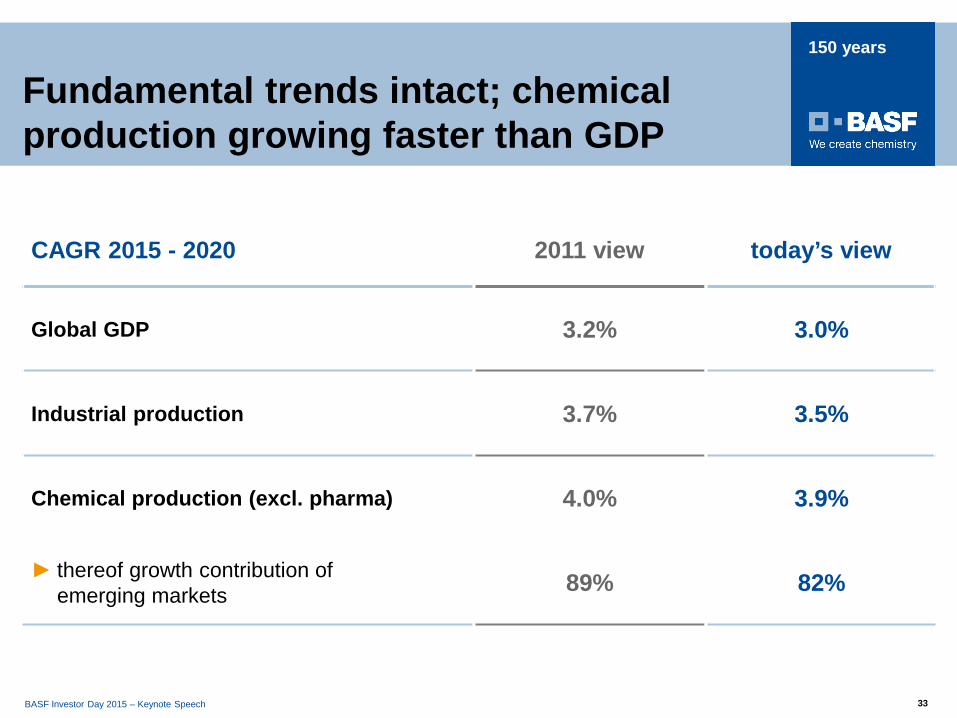
Fundamental trends intact; chemical production growing faster than GDP
CAGR 2015 - 2020 2011 view today’s view
Global GDP 3.2% 3.0%
Industrial production 3.7% 3.5%
Chemical production (excl. pharma) 4.0% 3.9%
► thereof growth contribution of emerging markets 89% 82%
BASF Investor Day 2015 – Keynote Speech 34
150 years
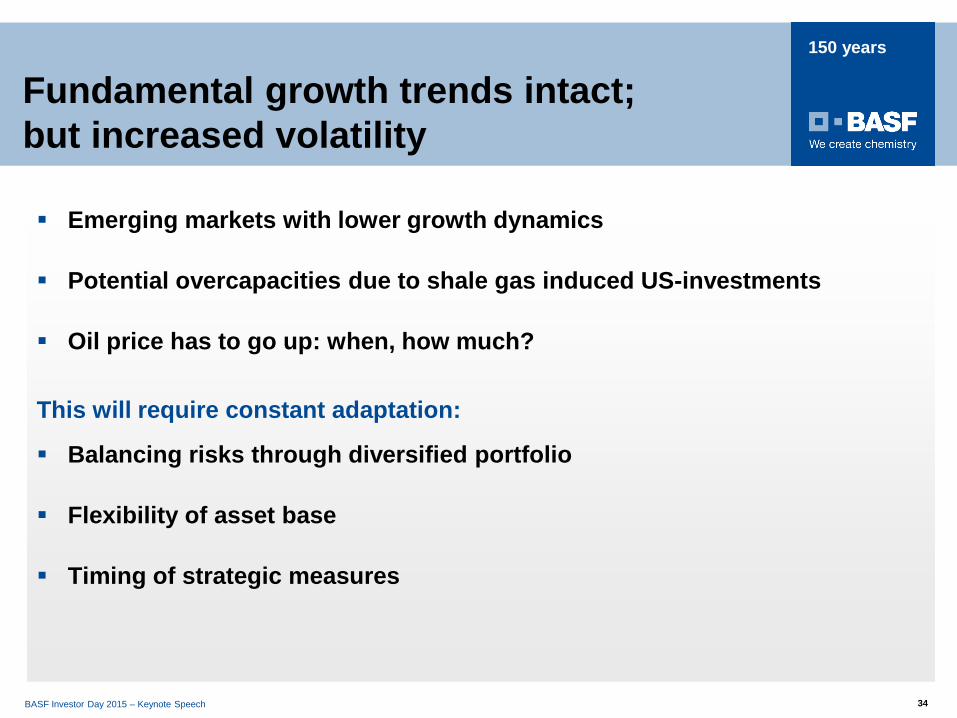
Emerging markets with lower growth dynamics
Potential overcapacities due to shale gas induced US-investments
Oil price has to go up: when, how much?
This will require constant adaptation:
Balancing risks through diversified portfolio
Flexibility of asset base
Timing of strategic measures
Fundamental growth trends intact; but increased volatility
BASF Investor Day 2015 – Keynote Speech 35
150 years
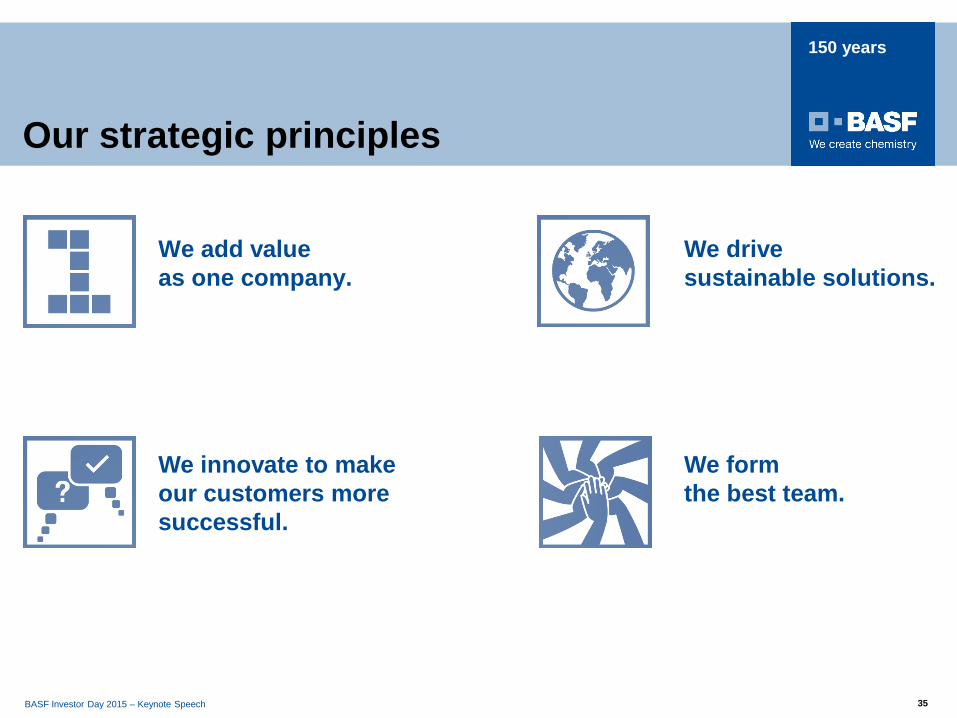
Our strategic principles
We add value as one company.
We innovate to make our customers more successful.
We drive sustainable solutions.
We form the best team.
BASF Investor Day 2015 – Keynote Speech 36
150 years
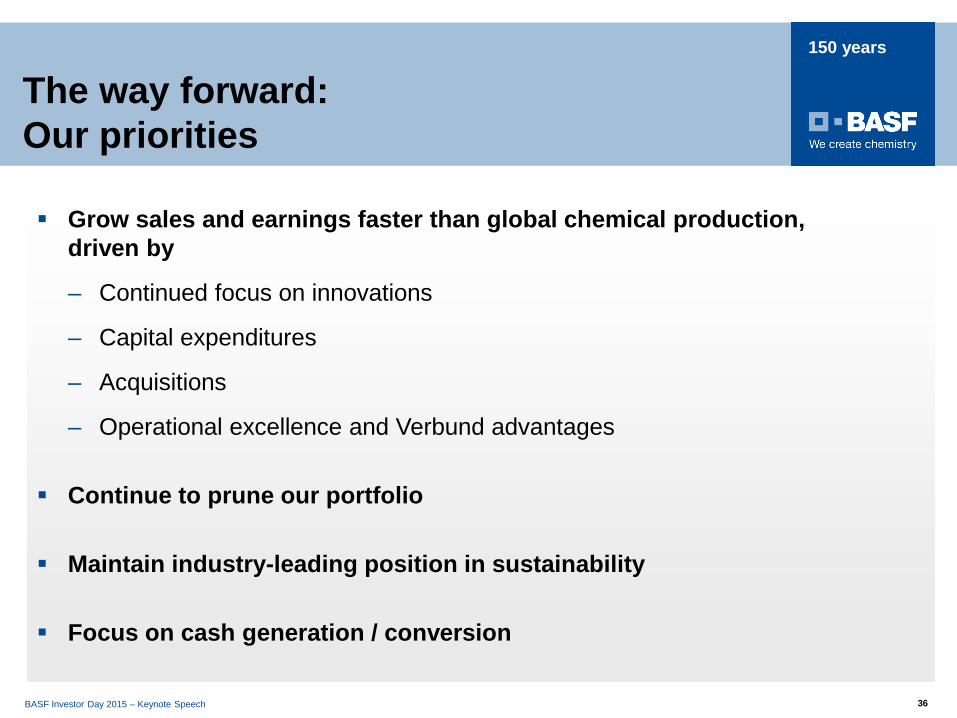
Grow sales and earnings faster than global chemical production, driven by
– Continued focus on innovations
– Capital expenditures
– Acquisitions
– Operational excellence and Verbund advantages
Continue to prune our portfolio
Maintain industry-leading position in sustainability
Focus on cash generation / conversion
The way forward: Our priorities
BASF Investor Day 2015 – Keynote Speech 37
150 years
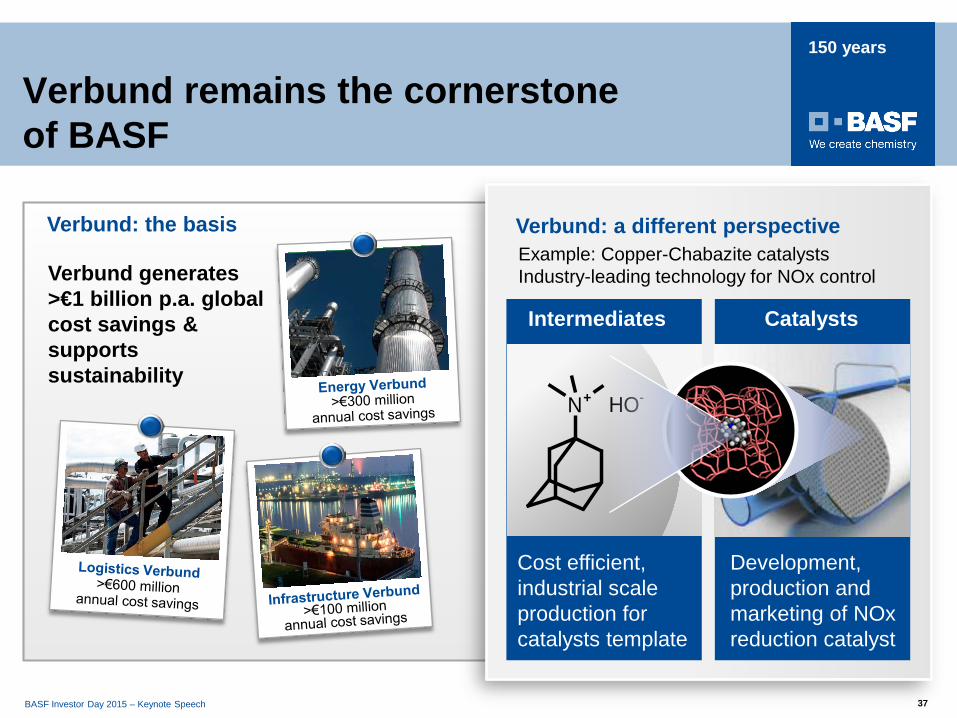
Verbund remains the cornerstoneof BASF
Verbund generates >€1 billion p.a. global cost savings & supports sustainability
Intermediates
Cost efficient, industrial scaleproduction forcatalysts template
Catalysts
Development, production andmarketing of NOxreduction catalyst
Example: Copper-Chabazite catalystsIndustry-leading technology for NOx control
HO-N+
Verbund: the basis Verbund: a different perspective
BASF Investor Day 2015 – Keynote Speech 38
150 years
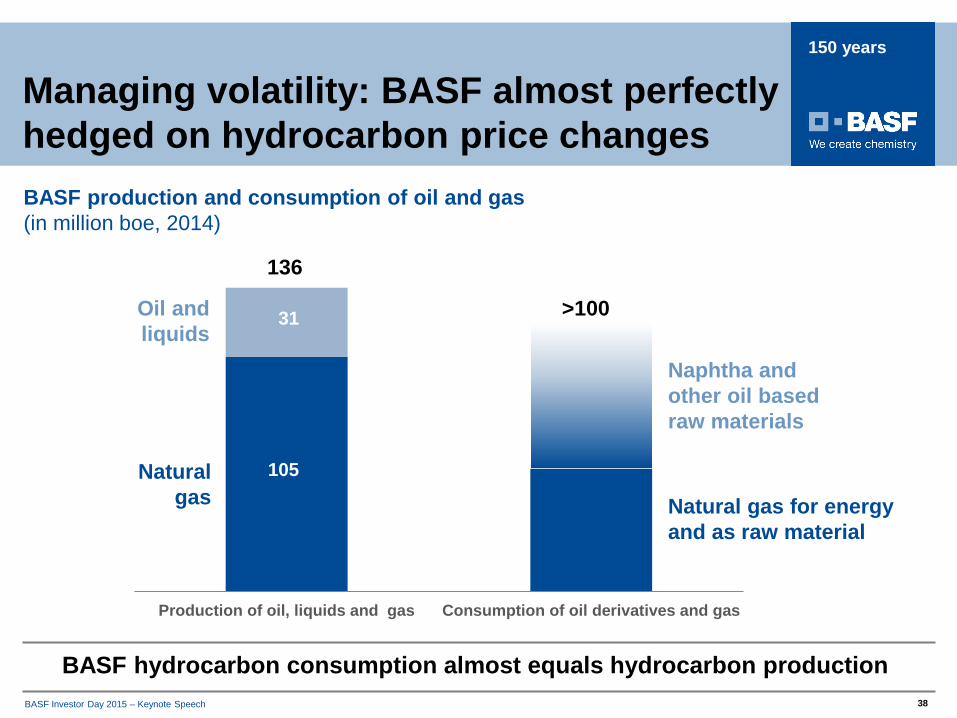
Managing volatility: BASF almost perfectlyhedged on hydrocarbon price changesBASF production and consumption of oil and gas(in million boe, 2014)
BASF hydrocarbon consumption almost equals hydrocarbon production
Production of oil, liquids and gas Consumption of oil derivatives and gas
136
>100
Naturalgas
Oil andliquids
Natural gas for energyand as raw material
Naphtha andother oil basedraw materials
31
105
BASF Investor Day 2015 – Keynote Speech 39
150 years
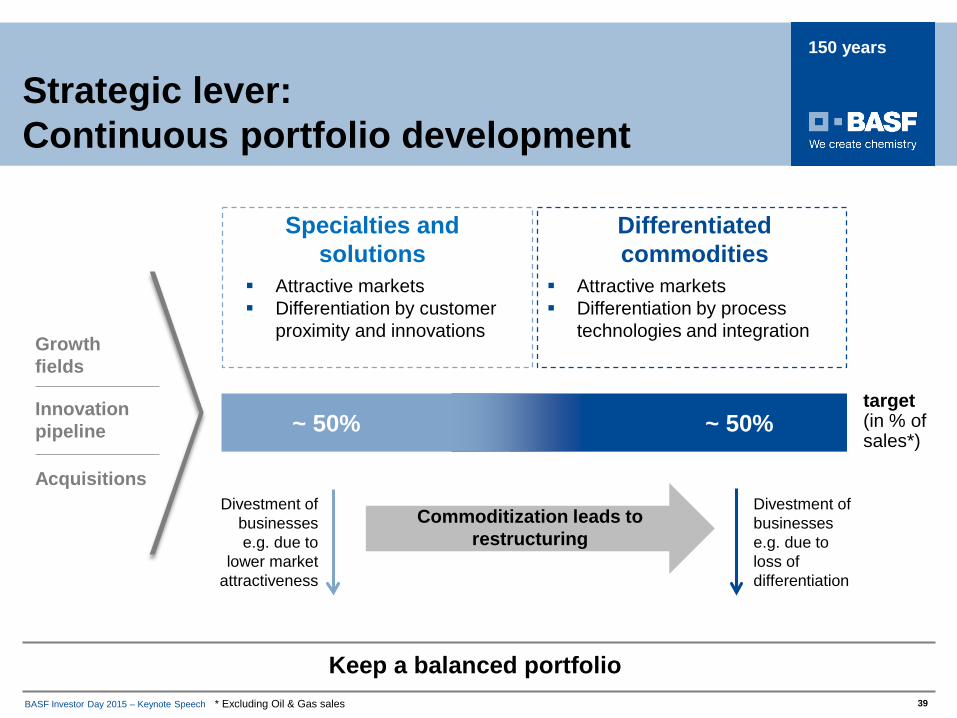
Strategic lever: Continuous portfolio development
Specialties and solutions
Differentiated commodities
target(in % of sales*)
~ 50% ~ 50%
Keep a balanced portfolio
Divestment of businessese.g. due to loss of differentiation
Divestment of businesses e.g. due to
lower market attractiveness
Commoditization leads to restructuring
Growth fields
Innovation pipeline
Acquisitions
* Excluding Oil & Gas sales
Attractive markets Differentiation by process
technologies and integration
Attractive markets Differentiation by customer
proximity and innovations
BASF Investor Day 2015 – Keynote Speech 40
150 years
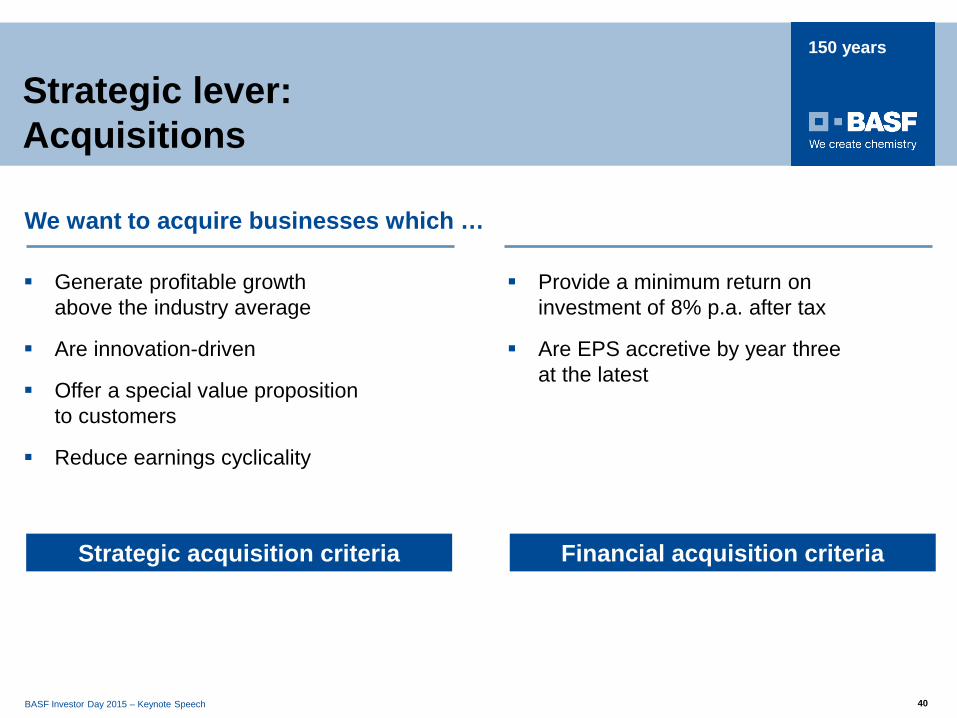
Provide a minimum return on investment of 8% p.a. after tax
Are EPS accretive by year three at the latest
Financial acquisition criteria
Generate profitable growth above the industry average
Are innovation-driven
Offer a special value proposition to customers
Reduce earnings cyclicality
Strategic acquisition criteria
We want to acquire businesses which …
Strategic lever: Acquisitions
BASF Investor Day 2015 – Keynote Speech 41
150 years
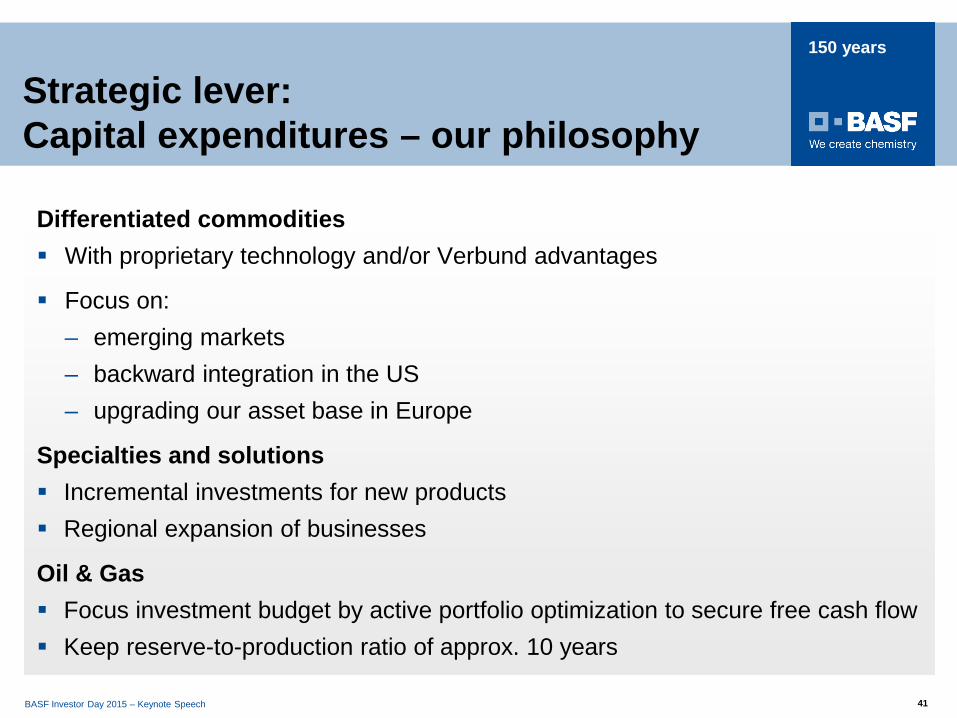
Strategic lever:Capital expenditures – our philosophy
Differentiated commodities With proprietary technology and/or Verbund advantages
Focus on:– emerging markets – backward integration in the US– upgrading our asset base in Europe
Specialties and solutions Incremental investments for new products Regional expansion of businesses
Oil & Gas Focus investment budget by active portfolio optimization to secure free cash flow Keep reserve-to-production ratio of approx. 10 years
BASF Investor Day 2015 – Keynote Speech 42
150 years
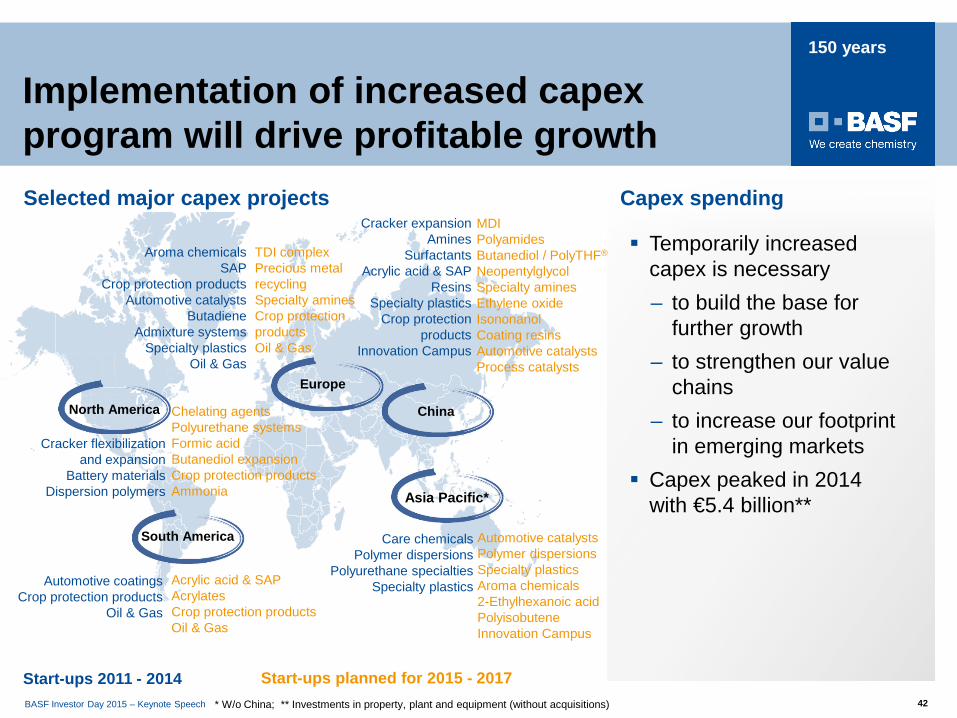
Selected major capex projects
Implementation of increased capexprogram will drive profitable growth
Temporarily increased capex is necessary – to build the base for
further growth– to strengthen our value
chains– to increase our footprint
in emerging markets Capex peaked in 2014
with €5.4 billion**
Capex spending
* W/o China; ** Investments in property, plant and equipment (without acquisitions)
.
Care chemicals Polymer dispersions
Polyurethane specialtiesSpecialty plastics
North America
Cracker flexibilizationand expansion
Battery materialsDispersion polymers Asia Pacific*
South America
Automotive coatingsCrop protection products
Oil & Gas
Europe
Aroma chemicalsSAP
Crop protection productsAutomotive catalysts
ButadieneAdmixture systems
Specialty plasticsOil & Gas
China
Cracker expansionAmines
SurfactantsAcrylic acid & SAP
ResinsSpecialty plastics
Crop protectionproducts
Innovation Campus
Start-ups 2011 - 2014 Start-ups planned for 2015 - 2017
TDI complexPrecious metalrecyclingSpecialty aminesCrop protectionproductsOil & Gas
Acrylic acid & SAPAcrylatesCrop protection productsOil & Gas
Chelating agentsPolyurethane systemsFormic acidButanediol expansionCrop protection productsAmmonia
MDIPolyamidesButanediol / PolyTHF®
NeopentylglycolSpecialty aminesEthylene oxideIsononanolCoating resinsAutomotive catalystsProcess catalysts
Automotive catalystsPolymer dispersionsSpecialty plasticsAroma chemicals2-Ethylhexanoic acidPolyisobuteneInnovation Campus
BASF Investor Day 2015 – Keynote Speech 43
150 years
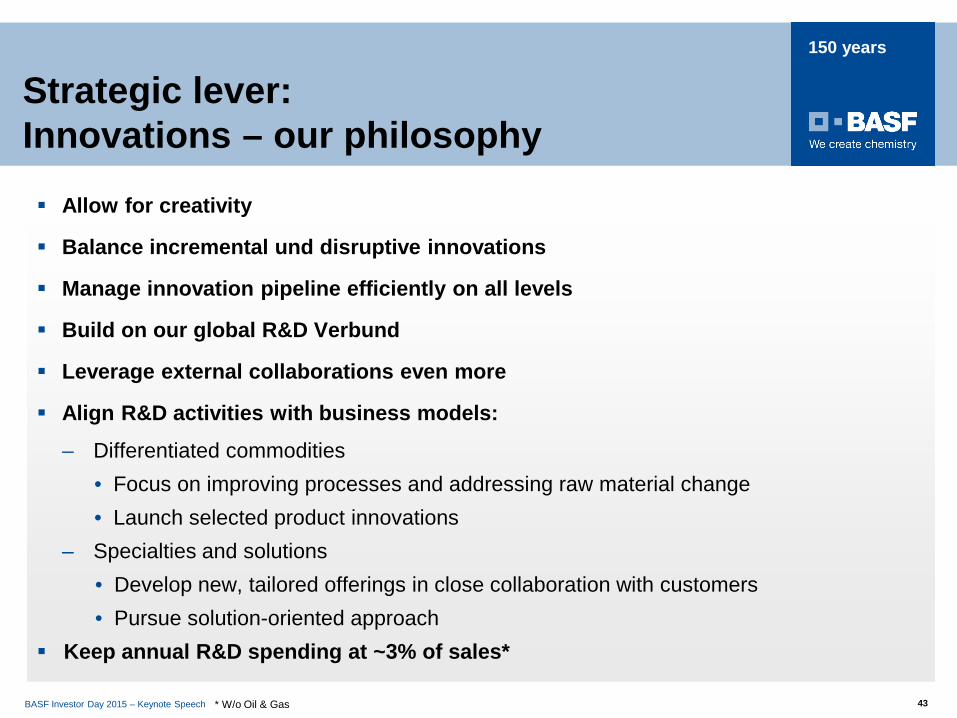
Strategic lever: Innovations – our philosophy
Allow for creativity
Balance incremental und disruptive innovations
Manage innovation pipeline efficiently on all levels
Build on our global R&D Verbund
Leverage external collaborations even more
Align R&D activities with business models:
– Differentiated commodities• Focus on improving processes and addressing raw material change • Launch selected product innovations
– Specialties and solutions• Develop new, tailored offerings in close collaboration with customers• Pursue solution-oriented approach
Keep annual R&D spending at ~3% of sales*
* W/o Oil & Gas
BASF Investor Day 2015 – Keynote Speech 44
150 years
BASF Investor Day 2015 – Keynote Speech 44
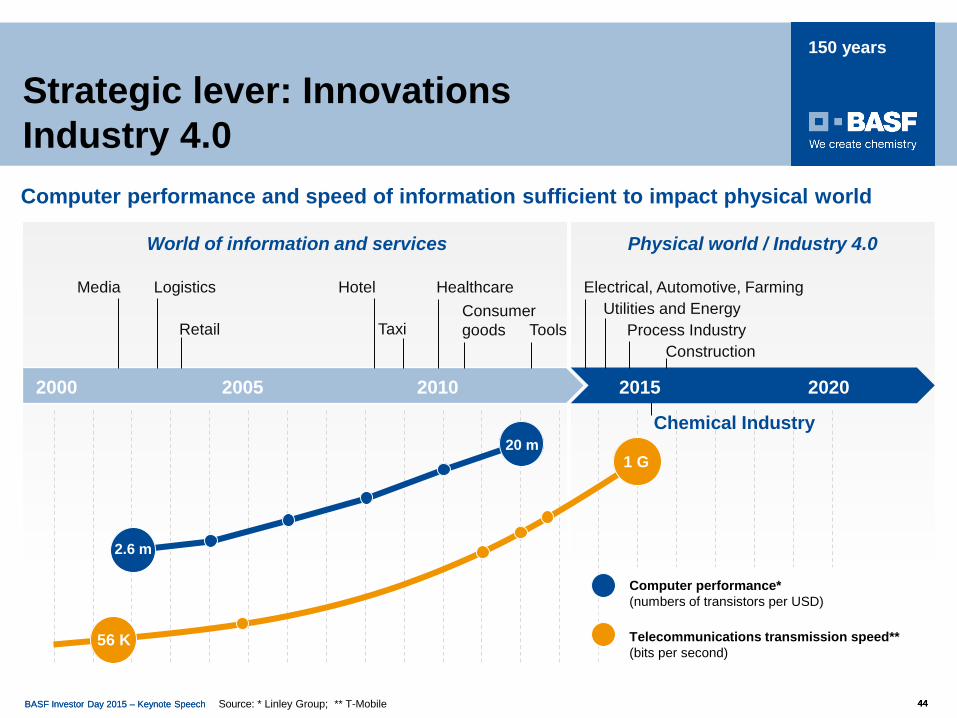
Strategic lever: InnovationsIndustry 4.0
World of information and services Physical world / Industry 4.0
Media
Retail
Hotel
Taxi
2010 2015 20202000 2005
Logistics
ToolsUtilities and Energy
Process IndustryConsumer goods
Electrical, Automotive, Farming
Construction
Healthcare
Computer performance and speed of information sufficient to impact physical world
Source: * Linley Group; ** T-Mobile
Chemical Industry
Computer performance*(numbers of transistors per USD)
Telecommunications transmission speed**(bits per second)
1 G
56 K
20 m
2.6 m
BASF Investor Day 2015 – Keynote Speech 45
150 years
BASF Investor Day 2015 – Keynote Speech 4545BASF Investor Day 2015 – Keynote Speech
BASF Investor Day 2015 – Keynote Speech 46
150 years
BASF Investor Day 2015 – Keynote Speech 46
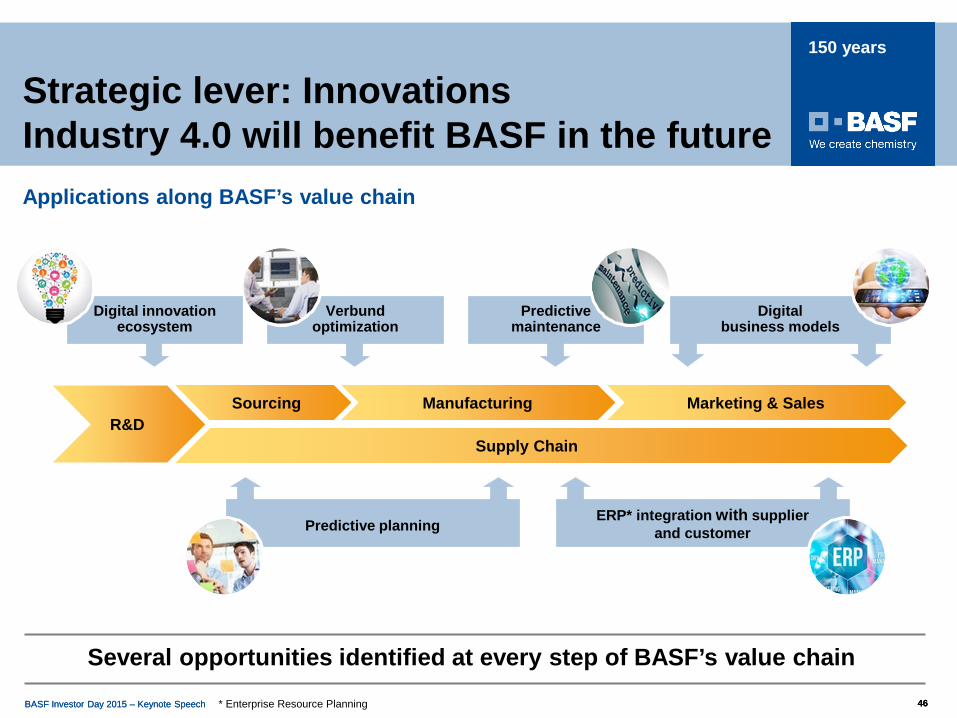
Strategic lever: InnovationsIndustry 4.0 will benefit BASF in the futureApplications along BASF’s value chain
Several opportunities identified at every step of BASF’s value chain
* Enterprise Resource Planning
Sourcing Marketing & Sales
Supply Chain
Manufacturing
Digitalbusiness models
R&D
Predictivemaintenance
Verbund optimization
ERP* integration with supplierand customerPredictive planning
Digital innovationecosystem
BASF Investor Day 2015 – Keynote Speech 47
150 years
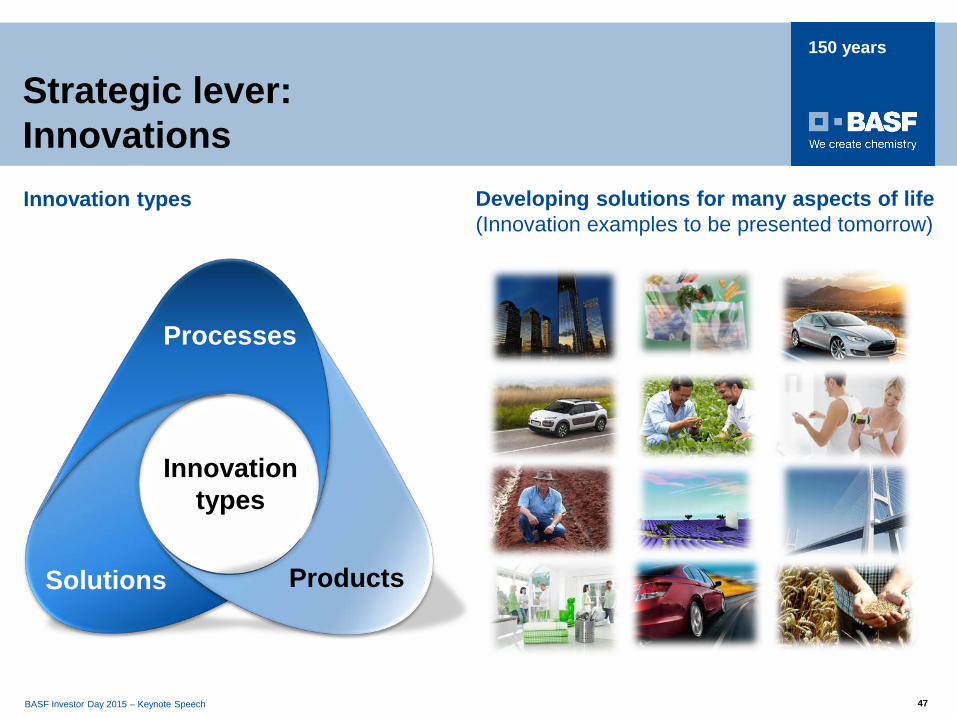
Strategic lever: Innovations
Processes
ProductsSolutions
Innovationtypes
Developing solutions for many aspects of life(Innovation examples to be presented tomorrow)
Innovation types
BASF Investor Day 2015 – Keynote Speech 48
150 years
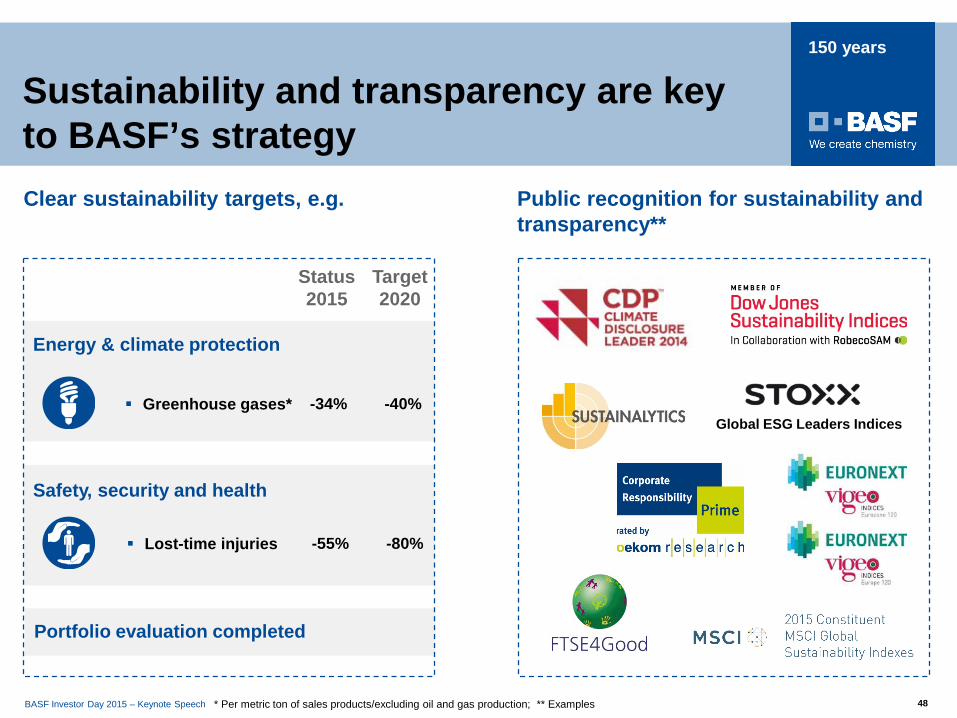
Sustainability and transparency are key to BASF’s strategy
Public recognition for sustainability and transparency**
Clear sustainability targets, e.g.
Greenhouse gases*
Target 2020
Status 2015
-34% -40%
* Per metric ton of sales products/excluding oil and gas production; ** Examples
Lost-time injuries -55% -80%
Energy & climate protection
Safety, security and health
Portfolio evaluation completed
Global ESG Leaders Indices
BASF Investor Day 2015 – Keynote Speech 49
150 years
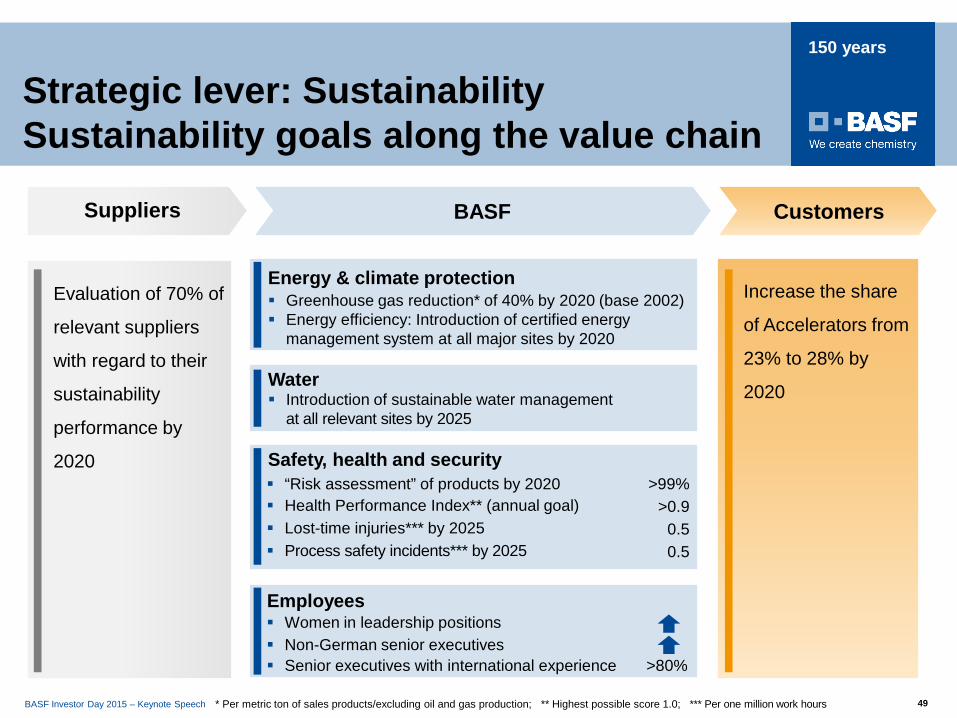
CustomersBASFSuppliers
Energy & climate protection Greenhouse gas reduction* of 40% by 2020 (base 2002) Energy efficiency: Introduction of certified energy
management system at all major sites by 2020
Water Introduction of sustainable water management
at all relevant sites by 2025
Safety, health and security “Risk assessment” of products by 2020 >99% Health Performance Index** (annual goal) >0.9 Lost-time injuries*** by 2025 0.5 Process safety incidents*** by 2025 0.5
Employees Women in leadership positions Non-German senior executives Senior executives with international experience >80%
Evaluation of 70% of
relevant suppliers
with regard to their
sustainability
performance by
2020
Increase the share
of Accelerators from
23% to 28% by
2020
Strategic lever: SustainabilitySustainability goals along the value chain
* Per metric ton of sales products/excluding oil and gas production; ** Highest possible score 1.0; *** Per one million work hours
BASF Investor Day 2015 – Keynote Speech 50
150 years
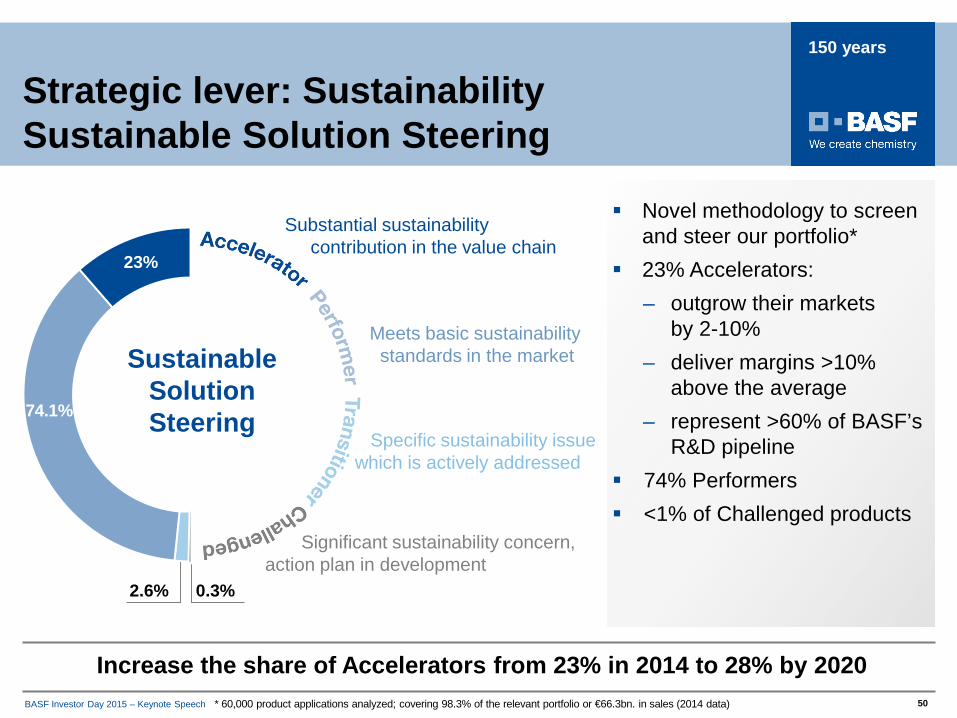
2.6% 0.3%
Novel methodology to screen and steer our portfolio*
23% Accelerators:– outgrow their markets
by 2-10%– deliver margins >10%
above the average– represent >60% of BASF’s
R&D pipeline 74% Performers <1% of Challenged products
* 60,000 product applications analyzed; covering 98.3% of the relevant portfolio or €66.3bn. in sales (2014 data)
Increase the share of Accelerators from 23% in 2014 to 28% by 2020
Strategic lever: Sustainability Sustainable Solution Steering
23%
74.1%
Substantial sustainability contribution in the value chain
Meets basic sustainability standards in the market
Specific sustainability issue which is actively addressed
Significant sustainability concern,action plan in development
SustainableSolutionSteering
BASF Investor Day 2015 – Keynote Speech 51
150 years
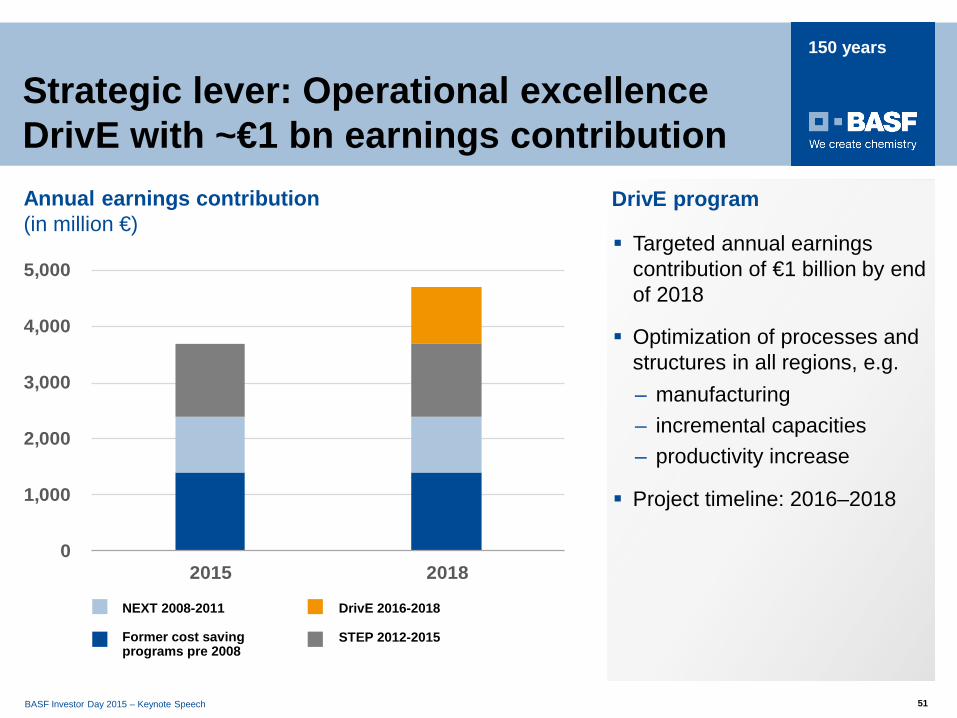
0
1,000
2,000
3,000
4,000
5,000
2015 2018
Annual earnings contribution(in million €)
Targeted annual earnings contribution of €1 billion by end of 2018
Optimization of processes and structures in all regions, e.g.– manufacturing– incremental capacities– productivity increase
Project timeline: 2016–2018
DrivE program
Strategic lever: Operational excellenceDrivE with ~€1 bn earnings contribution
Former cost saving programs pre 2008
NEXT 2008-2011 DrivE 2016-2018
STEP 2012-2015
BASF Investor Day 2015 – Keynote Speech 52
150 years
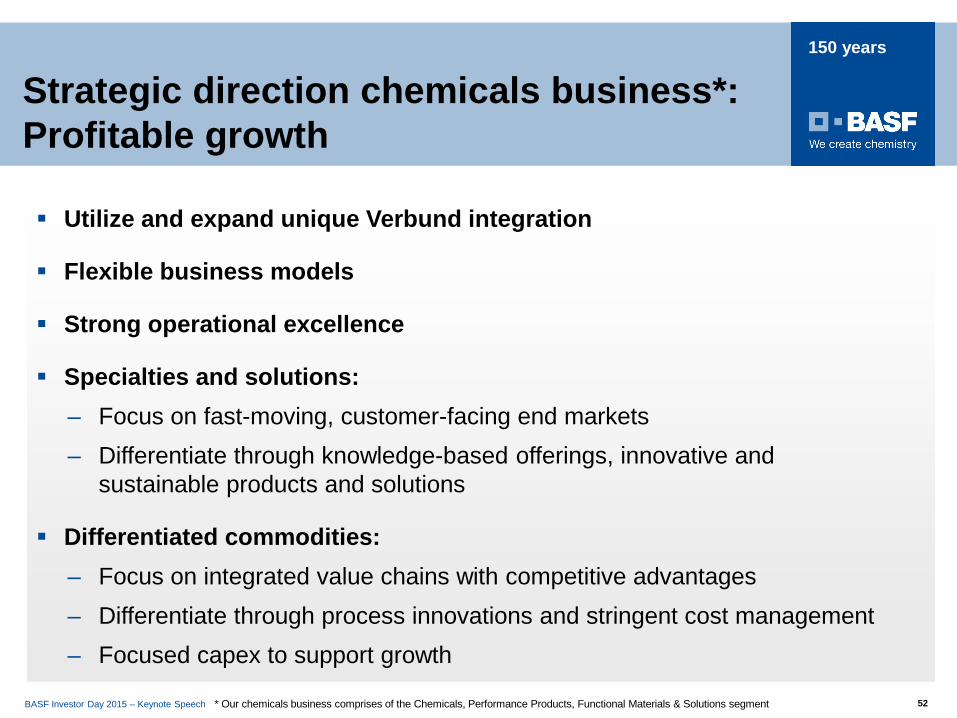
Utilize and expand unique Verbund integration
Flexible business models
Strong operational excellence
Specialties and solutions:– Focus on fast-moving, customer-facing end markets– Differentiate through knowledge-based offerings, innovative and
sustainable products and solutions
Differentiated commodities:– Focus on integrated value chains with competitive advantages– Differentiate through process innovations and stringent cost management– Focused capex to support growth
Strategic direction chemicals business*:Profitable growth
* Our chemicals business comprises of the Chemicals, Performance Products, Functional Materials & Solutions segment
BASF Investor Day 2015 – Keynote Speech 53
150 years
Continue profitable growth in all indications
Differentiate through strong innovation pipeline
Continue to expand our portfolio to Innovations beyond Crop Protection
Net sales target of €6 billion in 2015 and €8 billion in 2020
25% average annual EBITDA* margin target
Strategic direction Agricultural Solutions: Feeding a growing population
* Before special items
BASF Investor Day 2015 – Keynote Speech 54
150 years
Continue to generate industry-leading profit margins
Continue to provide hydrocarbon hedge
Strengthen E&P activities in core regions and activities with limited exploration risk
Focus on – key partnerships– operational excellence– active portfolio management
Keep ambitious production growth target for 2018 of ~190 million boe
Generate strong free cash flow
Strategic direction Oil & Gas: Selective growth in E&P
BASF Investor Day 2015 – Keynote Speech 55
150 years
Profitability of BASF will grow faster thanglobal chemical production
Sales growth*Slightly faster than the global chemical production
EBITDA growthWell above global chemical production
Remain a strong cash providerContinuously generate high levels of free cash flow
Financial targets for next years
Deliver attractive returnsEarn a significant premium on cost of capital
* Without considering Natural Gas Trading and Storage business
Progressive dividend policy We want to grow or at least maintain our dividend
BASF Investor Day 2015 – Keynote Speech 56
150 years
Grow sales and earnings faster than global chemical production, driven by
– Continued focus on innovations (R&D spending about 3% of sales*)
– Capital expenditures (slightly above depreciation levels)
– Acquisitions
– Operational excellence and Verbund advantages (€1 billion program; 2016-2018)
Continue to prune our portfolio
Maintain industry-leading position in sustainability
Focus on cash generation / conversion
The way forward: Our priorities
* Excluding Oil & Gas sales
BASF Investor Day 2015 – Keynote Speech 57
150 years
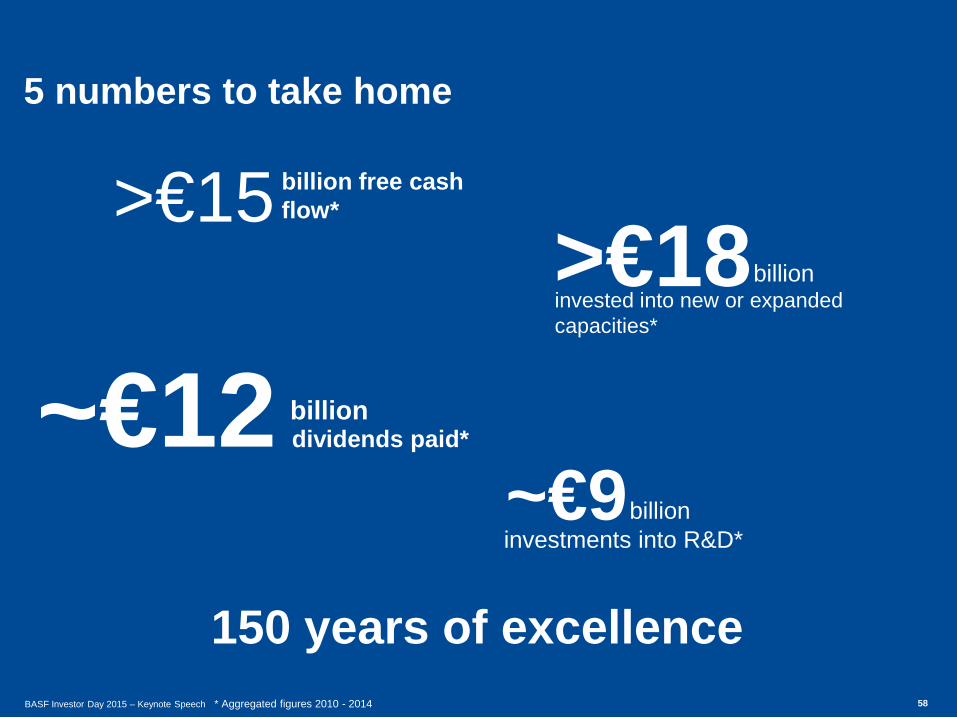
5 numbers to take home
150 years of excellence
billion free cash flow*
billion
~€12
>€15
~€9
>€18
investments into R&D*
billion
billion
invested into new or expandedcapacities*
dividends paid*
* Aggregated figures 2010 - 2014BASF Investor Day 2015 – Keynote Speech 58
BASF Investor Day 2015 – Keynote Speech 58
150 years
150 years