basic demand and supply analysis
DESCRIPTION
ecTRANSCRIPT
BASIC DEMAND AND SUPPLY
ANALYSIS

A market is an institutional arrangement under which buyers and sellers can exchange some quantity of a ..good or service at a mutually agreeable price.

Market Demand A market demand schedule is a table
showing the quantity of a commodity that consumers are willing and able to purchase over a given period of time at each price of the commodity while holding constant all other relevant economic variables on which demand depends(the ceteris paribus assumption)
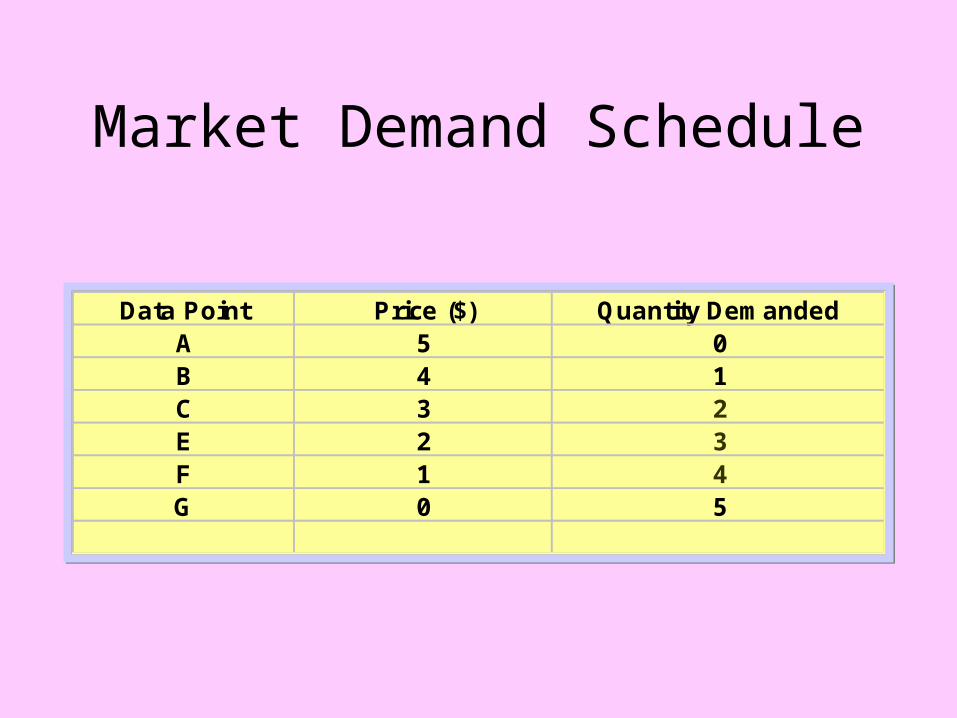
Market Demand Schedule
Data Point Price ($) Quantity DemandedA 5 0B 4 1C 3 2E 2 3F 1 4G 0 5
Data Point Price ($) Quantity DemandedA 5 0B 4 1C 3 2E 2 3F 1 4G 0 5
The inverse price –quantity relationship (indicating that a greater quantity of the commodity is demanded at lower prices and a smaller quantity at a higher prices) is called the Low of Demand.
BY plotting on a graph the various price- quantity combination given by market demand schedule , we obtain the market demand curve for the commodity .The price per unit of the commodity usually measured along the vertical axis,while the quantity demanded of the commodity per unit of time is measured along the horizontal axis.
The demand curve has a
negative slope ,that is , it slopes
downward to the right. The
negative slop is a reflection of
the low of demand or inverse
price- quantity relationship.

The demand curve The demand curve slopes downwardslopes downwardbecause price and because price and
quantity demandedquantity demandedare inversely are inversely
related. related.
Reasons for the Application of the Rule of Demand
Income EffectSubstitution Effect
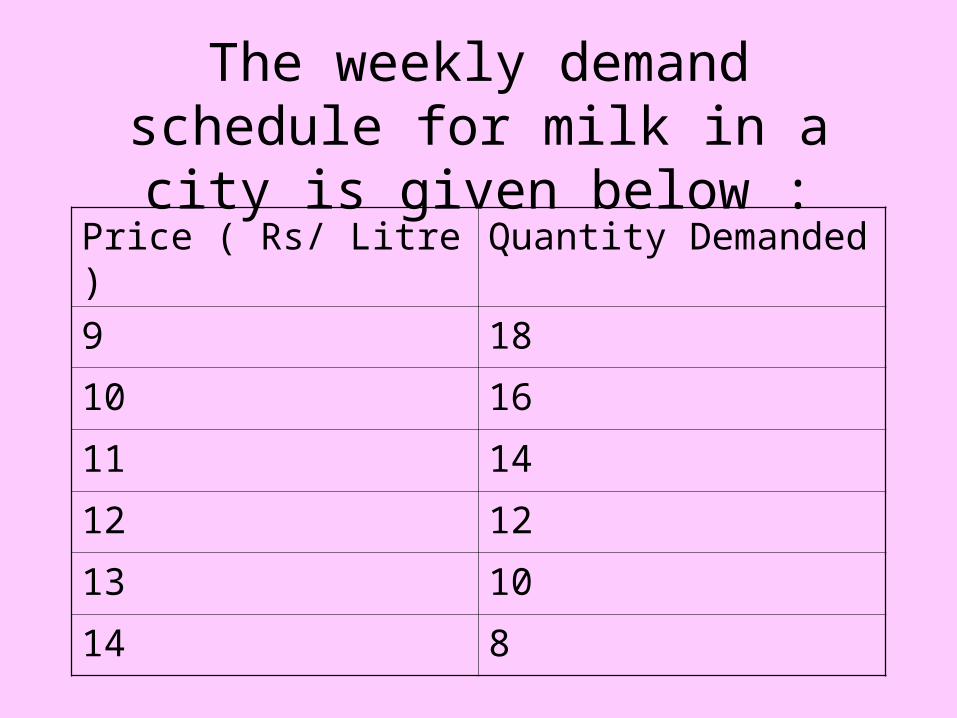
The weekly demand schedule for milk in a city is given below :
Price ( Rs/ Litre ) Quantity Demanded
9 18
10 16
11 14
12 12
13 10
14 8
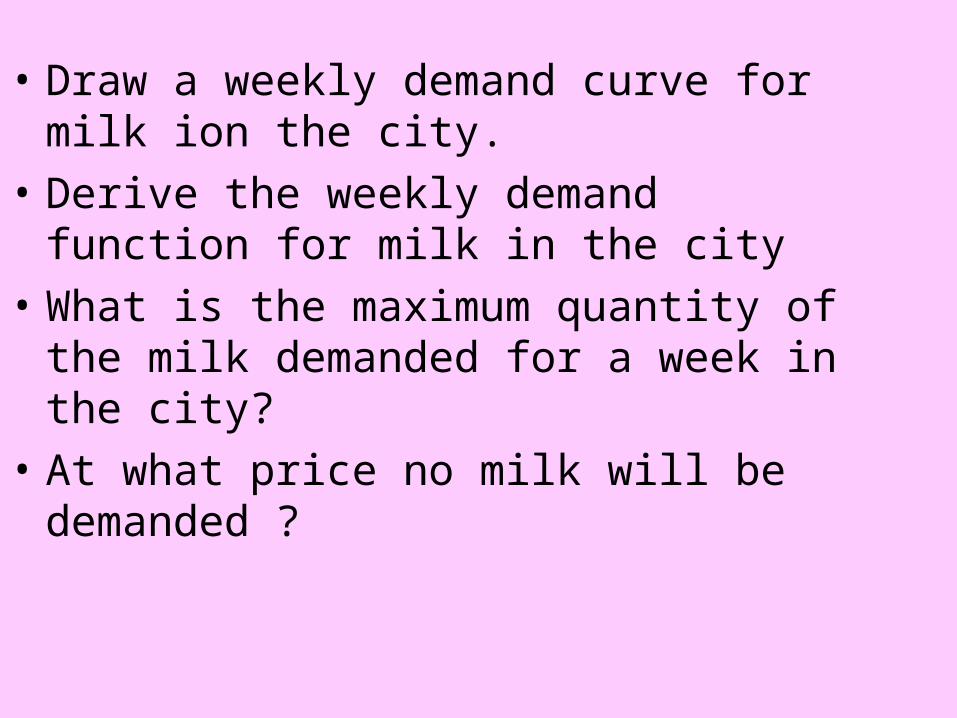
• Draw a weekly demand curve for milk ion the city.
• Derive the weekly demand function for milk in the city
• What is the maximum quantity of the milk demanded for a week in the city?
• At what price no milk will be demanded ?
Answers
• Maximum Quantity Demanded= 36 Litre
• When price is Rs 18/Liter , no milk will be demanded

Shifting Demand versus Shifting Demand versus Movements along a Demand Movements along a Demand
CurveCurve• A change in the price of a good A change in the price of a good
causes a change in the causes a change in the quantity demanded, quantity demanded,
• but does not shiftbut does not shift demanddemand
Changes in Demand vs. Changes in Changes in Demand vs. Changes in Quantity DemandedQuantity Demanded
• A price change would A price change would change the quantity change the quantity demanded which demanded which involves movement involves movement along the demand curve.along the demand curve.
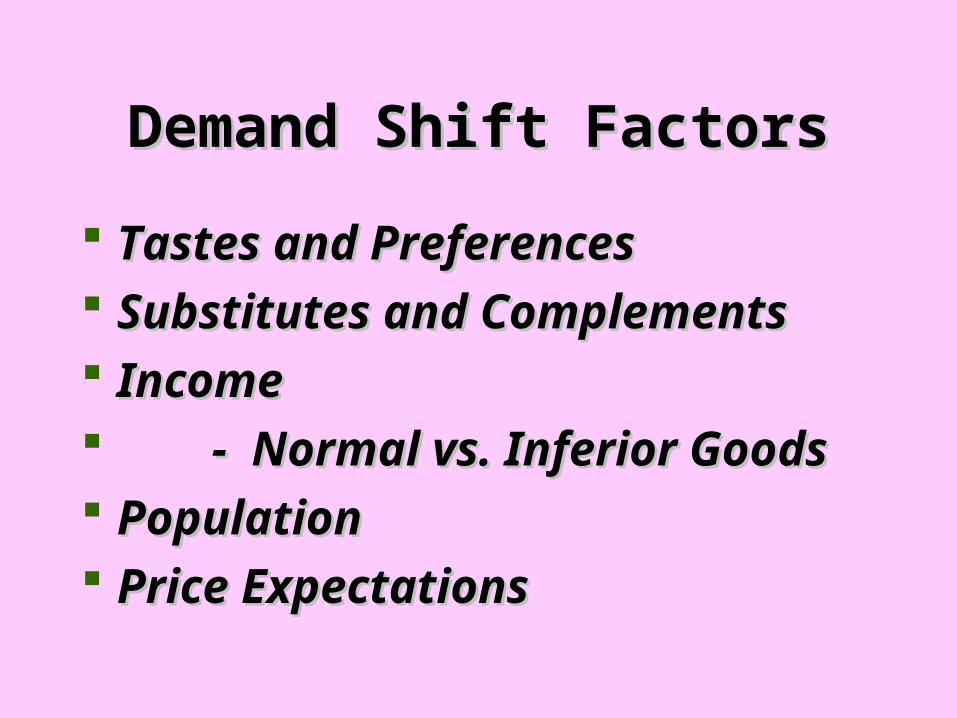
Demand Shift FactorsDemand Shift Factors
Tastes and PreferencesTastes and Preferences Substitutes and ComplementsSubstitutes and Complements IncomeIncome - Normal vs. Inferior Goods- Normal vs. Inferior Goods PopulationPopulation Price ExpectationsPrice Expectations

Changes in Demand - DecreaseChanges in Demand - Decrease
Demand Shifts Demand Shifts LEFTLEFT When:When: Prices of substitutes decreasePrices of substitutes decrease Prices of complements increasePrices of complements increase Normal good-income decreasesNormal good-income decreases Inferior good-income increasesInferior good-income increases Population decreasesPopulation decreases Tastes & preferences turn against the Tastes & preferences turn against the
productproduct

Changes in Demand - IncreaseChanges in Demand - Increase
Demand Shifts Demand Shifts RIGHTRIGHT When: When: Prices of substitutes increasePrices of substitutes increase Prices of complements decreasePrices of complements decrease Normal good-income increasesNormal good-income increases Inferior good-income decreasesInferior good-income decreases Population increasesPopulation increases Tastes & preferences turn in favor of Tastes & preferences turn in favor of
the productthe product
SUPPLYSUPPLY
SupplySupply relates the quantity of a relates the quantity of a good that will be offered for sale good that will be offered for sale at each of various possible prices, at each of various possible prices, over some period of time,over some period of time, ceteris ceteris paribusparibus..

Supply ScheduleSupply Schedule
Data Point Price ($) Quantity SuppliedH 5 4I 4 3J 3 2K 2 1L 1 0M 0 0

Supply CurveSupply Curve
The supply curve The supply curve slopesslopes
upward because priceupward because priceand quantity suppliedand quantity suppliedare directly related.are directly related.
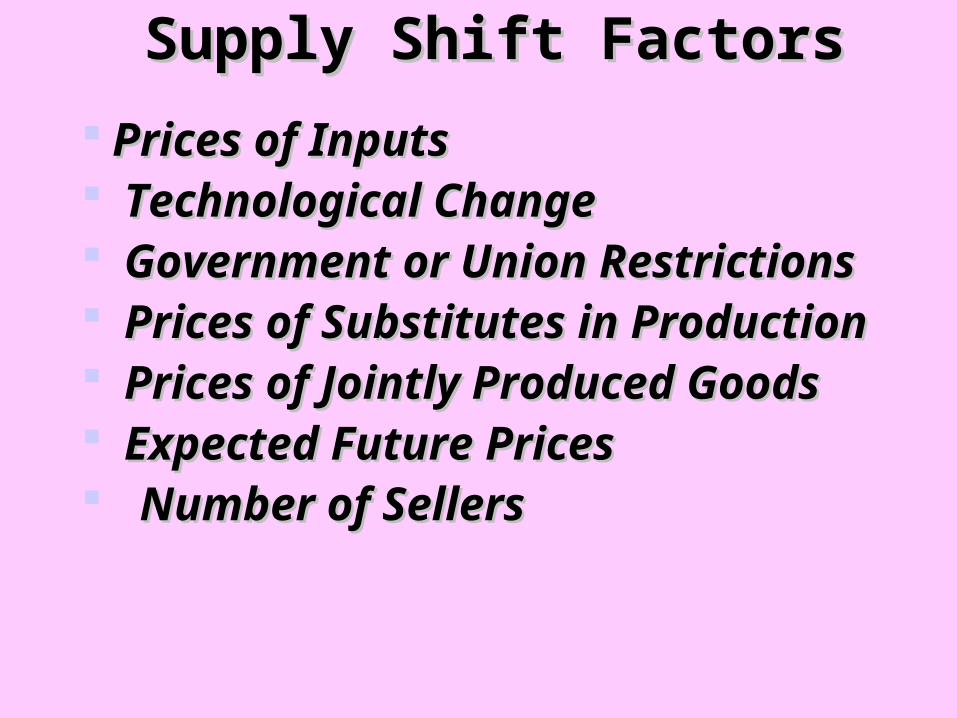
Supply Shift FactorsSupply Shift Factors
Prices of InputsPrices of Inputs Technological ChangeTechnological Change Government or Union RestrictionsGovernment or Union Restrictions Prices of Substitutes in ProductionPrices of Substitutes in Production Prices of Jointly Produced GoodsPrices of Jointly Produced Goods Expected Future PricesExpected Future Prices Number of SellersNumber of Sellers
Changes in Supply vs. Changes in Changes in Supply vs. Changes in Quantity SuppliedQuantity Supplied
A price change causes A price change causes movement from one movement from one point to another along point to another along the same supply the same supply curve.curve.
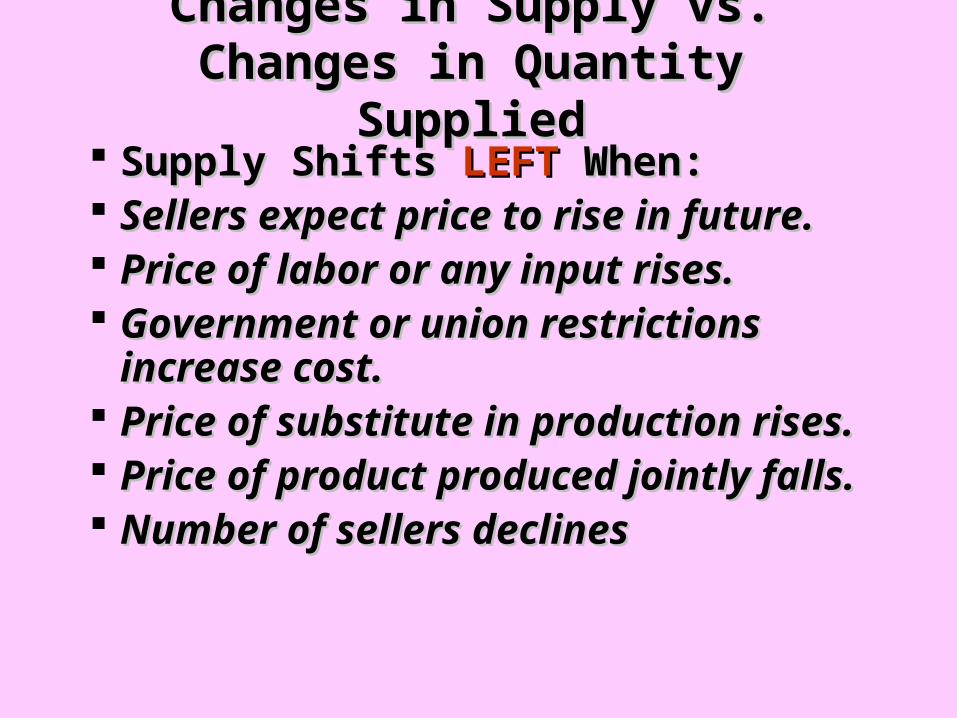
Changes in Supply vs. Changes in Changes in Supply vs. Changes in Quantity SuppliedQuantity Supplied
Supply Shifts Supply Shifts LEFTLEFT When: When: Sellers expect price to rise in future.Sellers expect price to rise in future. Price of labor or any input rises.Price of labor or any input rises. Government or union restrictions increase Government or union restrictions increase
cost.cost. Price of substitute in production rises.Price of substitute in production rises. Price of product produced jointly falls.Price of product produced jointly falls. Number of sellers declinesNumber of sellers declines
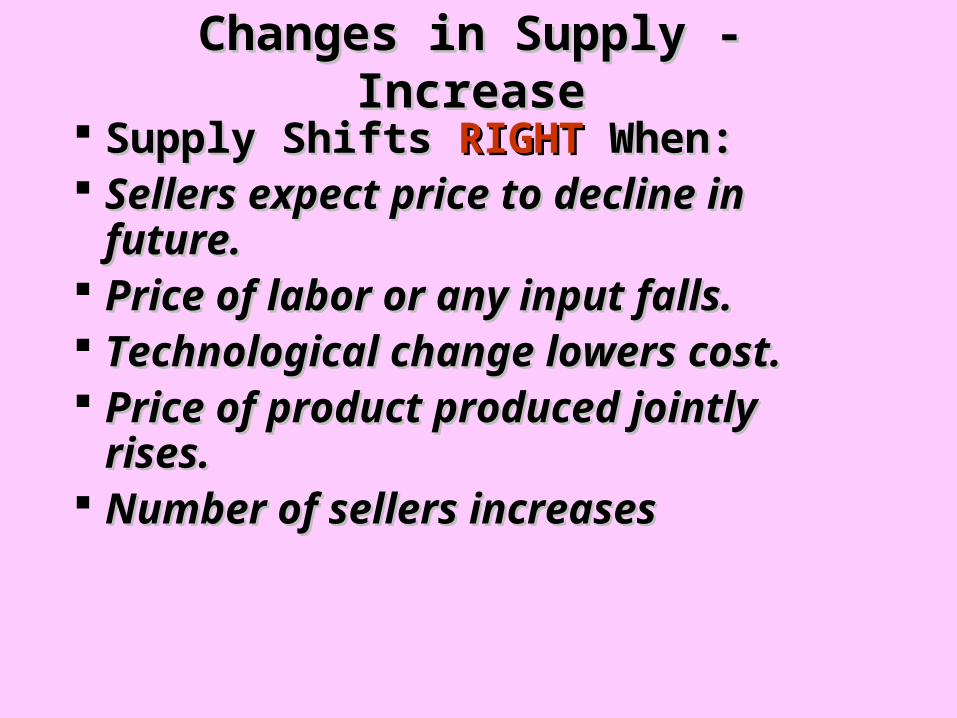
Changes in Supply - IncreaseChanges in Supply - Increase
Supply Shifts Supply Shifts RIGHTRIGHT When: When: Sellers expect price to decline in future.Sellers expect price to decline in future. Price of labor or any input falls.Price of labor or any input falls. Technological change lowers cost.Technological change lowers cost. Price of product produced jointly rises.Price of product produced jointly rises. Number of sellers increasesNumber of sellers increases

Determination of equilibrium price
This occurs when the quantity of the commodity demanded in a market per unit of time equals the quantity of the commodity supplied to the market over the same time period . Geometrically equilibrium occurs at the interaction of the commodity’s market demand curve and market supply curve .
The price and quantity at which equilibrium exists are known respectively ,as the equilibrium price and the equilibrium quantity or market clearing quantity .
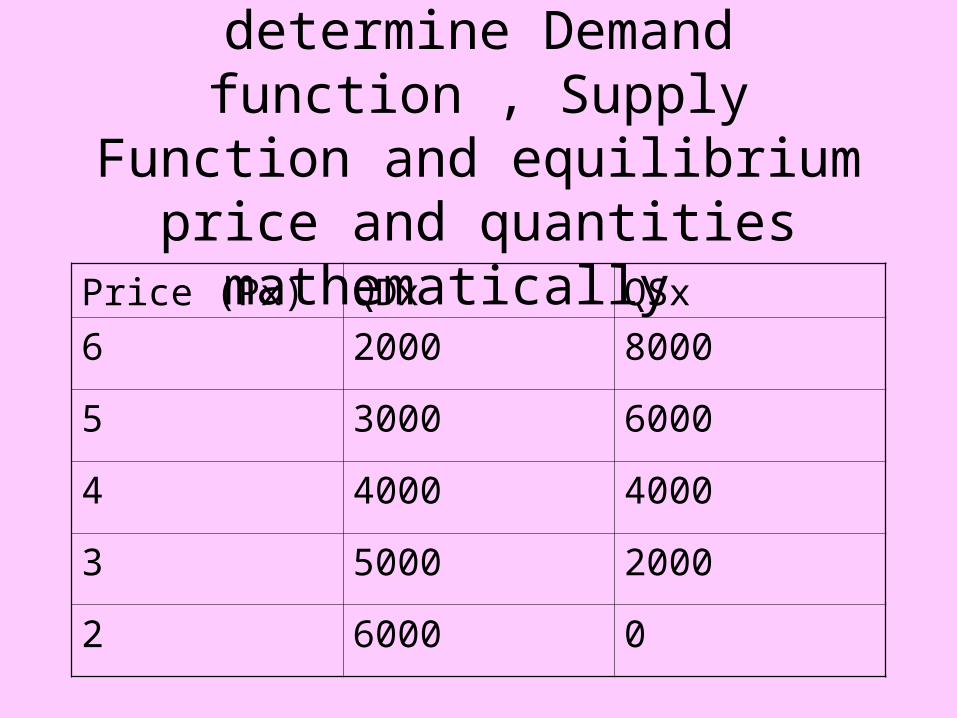
With the following table determine Demand function , Supply Function and equilibrium price and quantities
mathematically Price (Px) QDx QSx
6 2000 8000
5 3000 6000
4 4000 4000
3 5000 2000
2 6000 0
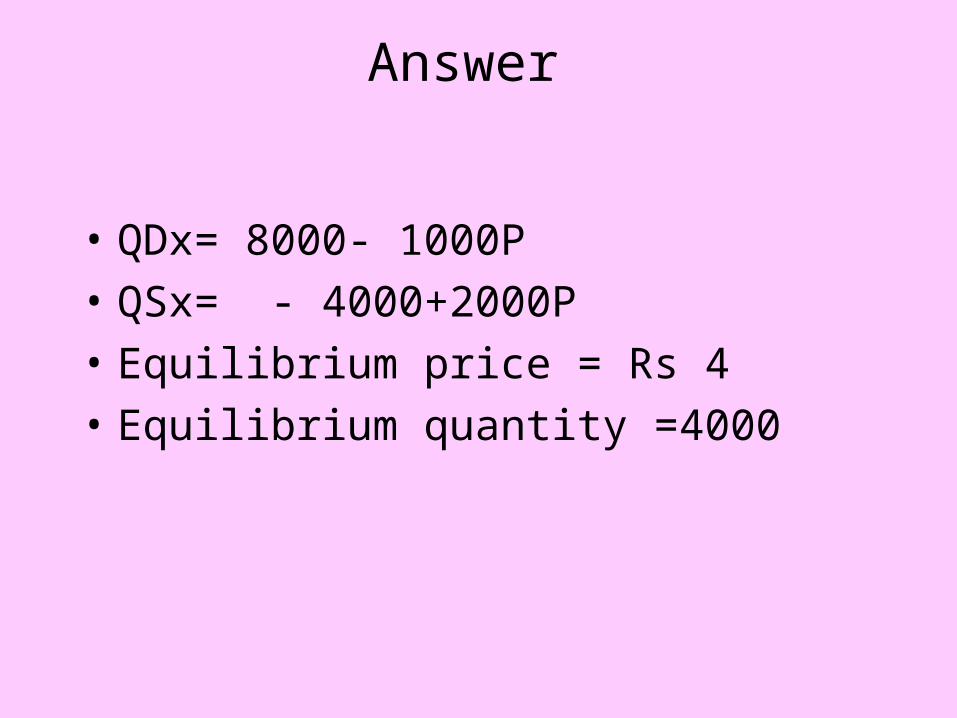
Answer
• QDx= 8000- 1000P
• QSx= - 4000+2000P
• Equilibrium price = Rs 4
• Equilibrium quantity =4000

A farm product has the following demand and supply functions :
Demand : Q= 13500- 500P
Supply: Q = 3000+ 200P
Required
Determine the equilibrium price and quantity under each of the following situation
• Govt imposes a specific sales tax at the rate of Rs 10.00 per unit
• Govt imposes a lump sum tax of Rs 1000 .

Effects of changes in Demand and Supply
• Change in Demand ,if Supply is unchanged
• Change in supply ,if demand is unchanged
• Simultaneous change in demand and supply
• Rationing by Prices
• Maximum Ceiling
• Minimum Floors

CLASS OF 2007The Reynolds company is trying to capitalize on the booming market for ballpoint pens .It has been selling 500 numbers of ballpoint pen per week at Rs 15.00 each. However it is considering lowering the price to Rs 12.00. The outside consultants they hired estimated that its price elasticity of demand to be - 5 over this price range .

A. What would be the new quantity sold if the price were lowered to Rs 12.00?

B.What would be the level of the new revenue ?

C. What additional information does Reynolds Company needs to know before it can determine whether or not a price decrease to Rs 12.00 will increase its profits ?
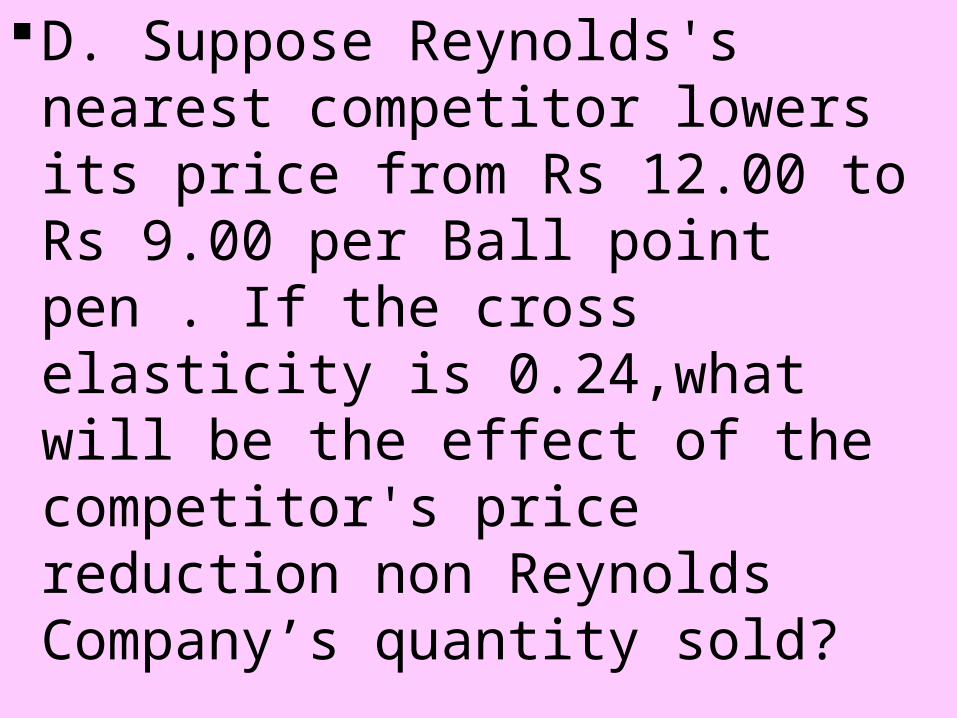
D. Suppose Reynolds's nearest competitor lowers its price from Rs 12.00 to Rs 9.00 per Ball point pen . If the cross elasticity is 0.24,what will be the effect of the competitor's price reduction non Reynolds Company’s quantity sold?
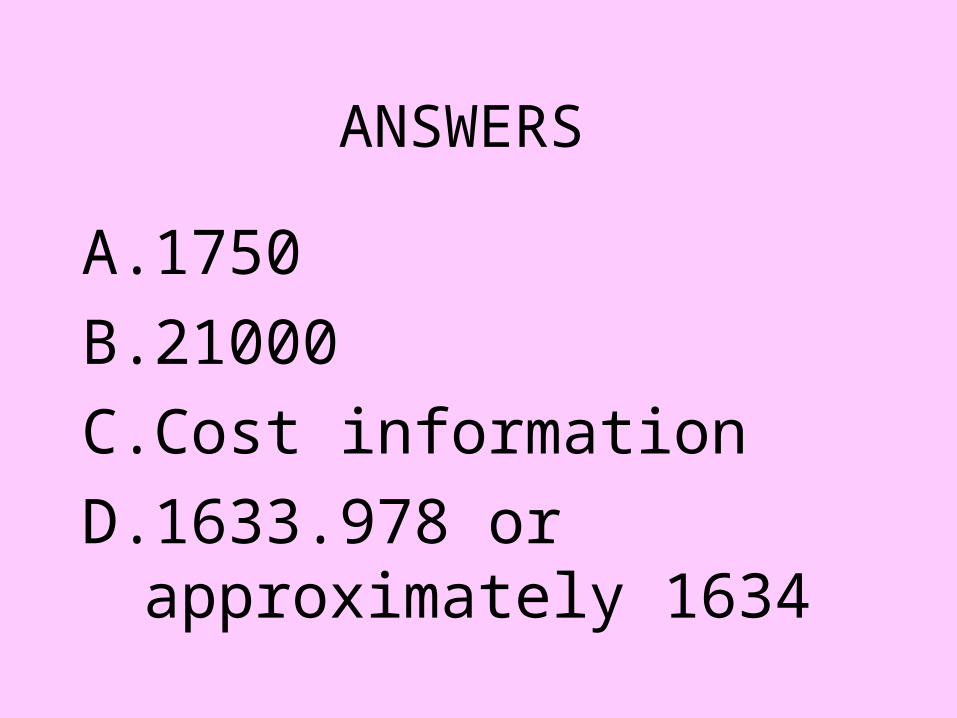
ANSWERS
A.1750
B.21000
C.Cost information
D.1633.978 or approximately 1634

CLASS OF 2006The following table gives the estimated price ,cross,
and income elasticities for selected commodities in USA or UK
Required • Indicate from the price elasticity if the demand is
elastic or inelastic, From the cross elasticity if the commodities are substitutes or complements and from income elasticity whether the commodity is a luxury , necessity or an inferior good
• Indicate in the change in the amount purchased of each good if the commodity price or the consumer’s income rose by 10 %

Price elasticity of demand
Commodity ep
Beef 0.92
Potatoes 0.31
Sugar 0.31
Electricity 1.20
Restaurant Meal 2.27
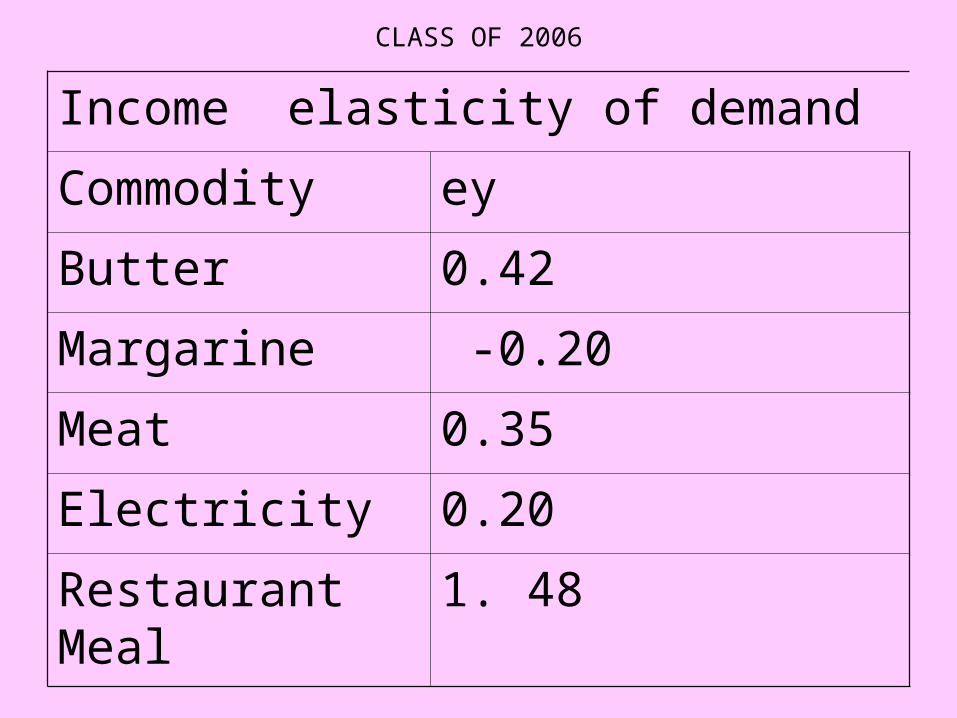
CLASS OF 2006
Income elasticity of demand
Commodity ey
Butter 0.42
Margarine -0.20
Meat 0.35
Electricity 0.20
Restaurant Meal 1. 48

Cross elasticity of demand
Commodity exy
Beef, pork 0.28
Butter , Margarine 0.67
Cheese , Butter - 0.61
Sugar , Fruits - 0.28
Electricity, Natural Gas 0. 20

Demand schedule for product X for the last five years is given below:
Year Px Qx Py Y A
1 10 1000 9 15000 50000
2 10 950 10 15000 50000
3 10 1050 9 16000 50000
4 10 1100 9 15000 60000
5 15 900 9 15000 50000

Required • Using arc elasticity estimate price,
income and promotional elasticities of demand
• Based on the above answer ,comment on
i. The nature of the product Xii. The relation between product X and Yiii. The effect of an increase in the price of
product X on total revenue
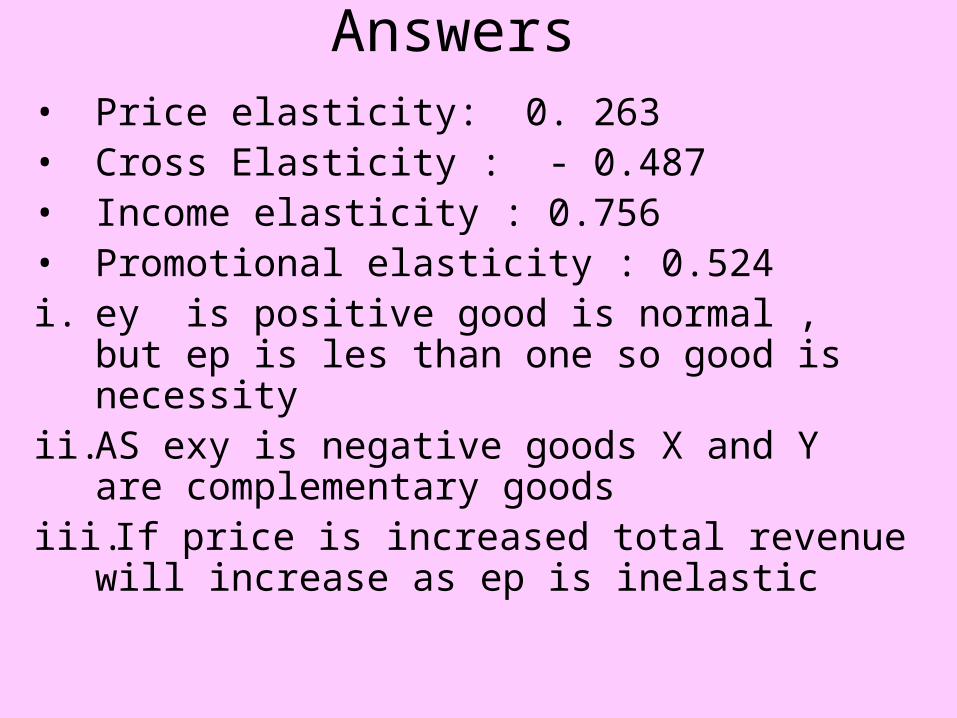
Answers • Price elasticity: 0. 263• Cross Elasticity : - 0.487• Income elasticity : 0.756• Promotional elasticity : 0.524i. ey is positive good is normal , but ep is les
than one so good is necessity ii. AS exy is negative goods X and Y are
complementary goods iii. If price is increased total revenue will increase
as ep is inelastic

Moonlight ,a domestic appliance manufacturer, has estimated its demand function for its fully automatic washing machine to be
Q= 166000- 100Pm+ 75Pc +2.5Y+0.02A- 200CQ=Demand for Moonlight fully automatic washing
machine PM =Price of Moonlight Washing machine Pc= Price of a competing brand Y= Per capita income of the country A= Annual promotional expenditure on this model by
Moonlight C= Operating cost per load of wash for this model
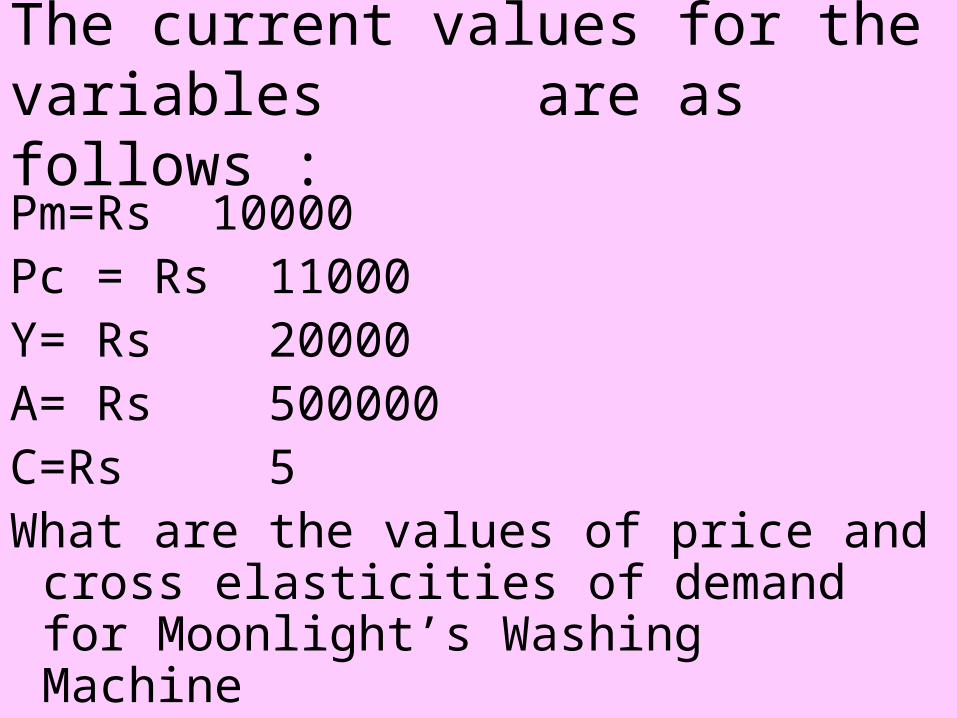
The current values for the variables are as follows :
Pm=Rs 10000Pc = Rs 11000Y= Rs 20000A= Rs 500000C=Rs 5What are the values of price and cross
elasticities of demand for Moonlight’s Washing Machine
Answers
- 20 and 16.5 respectively