basic facts about stroud · 2015-11-30 · basic facts about stroud geography and population here...
TRANSCRIPT
Basic facts about Stroud
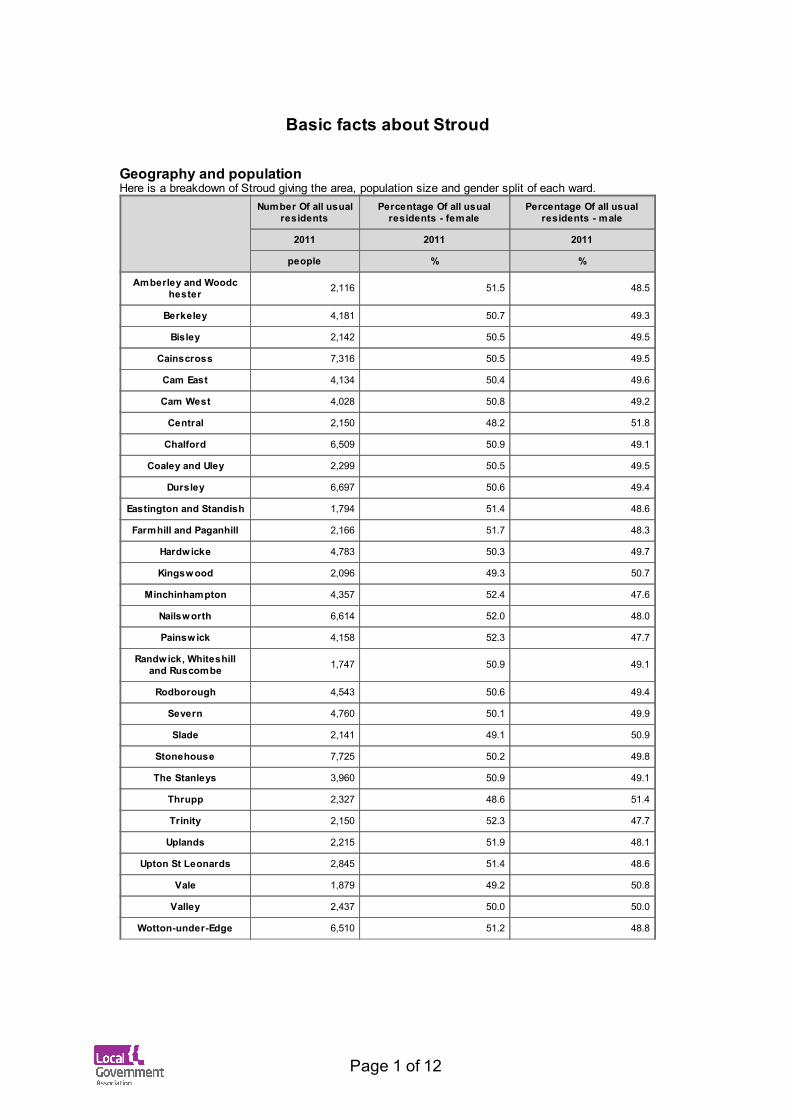
Geography and populationHere is a breakdown of Stroud giving the area, population size and gender split of each ward.
Number Of all usualresidents
Percentage Of all usualresidents - female
Percentage Of all usualresidents - male
2011 2011 2011
people % %
Amberley and Woodchester 2,116 51.5 48.5
Berkeley 4,181 50.7 49.3
Bisley 2,142 50.5 49.5
Cainscross 7,316 50.5 49.5
Cam East 4,134 50.4 49.6
Cam West 4,028 50.8 49.2
Central 2,150 48.2 51.8
Chalford 6,509 50.9 49.1
Coaley and Uley 2,299 50.5 49.5
Dursley 6,697 50.6 49.4
Eastington and Standish 1,794 51.4 48.6
Farmhill and Paganhill 2,166 51.7 48.3
Hardwicke 4,783 50.3 49.7
Kingswood 2,096 49.3 50.7
Minchinhampton 4,357 52.4 47.6
Nailsworth 6,614 52.0 48.0
Painswick 4,158 52.3 47.7
Randwick, Whiteshilland Ruscombe 1,747 50.9 49.1
Rodborough 4,543 50.6 49.4
Severn 4,760 50.1 49.9
Slade 2,141 49.1 50.9
Stonehouse 7,725 50.2 49.8
The Stanleys 3,960 50.9 49.1
Thrupp 2,327 48.6 51.4
Trinity 2,150 52.3 47.7
Uplands 2,215 51.9 48.1
Upton St Leonards 2,845 51.4 48.6
Vale 1,879 49.2 50.8
Valley 2,437 50.0 50.0
Wotton-under-Edge 6,510 51.2 48.8
Page 1 of 12
In terms of area, Stroud is ranked 10 out of the 25 District authorities within South West, and ranked123 out of all 201 District authorities in England.
The total area of Stroud is 47,604.57 hectares. The ward with the largest area is Severn, representing12.10% of the total area of the council.
The total resident population of Stroud is 112,779. The ward with the largest population is Stonehouse,representing 6.85% of the total resident population of the area.
Page 2 of 12

AgeThis table gives the age breakdown by ward in Stroud.
Age0 to
4percent
Age5 to
7percent
Age8 to
9percent
Age10to14
percent
Age15
percent
Age16to17
percent
Age18to19
percent
Age20to24
percent
Age25to29
percent
Age30 to
44percent
Age45 to
59percent
Age60to64
percent
Age65 to
74percent
Age75 to
84percent
Age85to89
percent
Age90
andoverpercent
2011 2011 2011 2011 2011 2011 2011 2011 2011 2011 2011 2011 2011 2011 2011 2011
% % % % % % % % % % % % % % % %
Amberleyand
Woodchester
4.40 3.45 2.03 5.58 1.42 2.36 1.75 3.12 2.60 15.36 22.16 9.31 14.51 8.22 2.32 1.42
Berkeley 5.48 2.85 2.13 5.07 1.08 2.27 1.75 4.95 4.33 19.28 23.61 7.22 10.52 7.18 1.72 0.57
Bisley 3.78 2.80 1.96 5.56 1.03 2.71 1.26 2.57 2.33 16.20 23.39 9.52 15.41 8.36 2.43 0.70
Cainscross 6.23 3.83 2.42 6.07 1.24 2.77 2.53 5.52 5.30 20.74 20.31 6.12 8.39 5.88 1.65 0.98
Cam East 4.93 2.66 2.06 5.88 0.99 2.54 2.08 4.35 4.26 17.63 21.79 7.98 11.34 8.37 1.98 1.14
Cam West 5.19 2.71 2.28 5.46 1.46 2.86 2.16 4.72 4.42 17.40 22.77 7.22 11.52 7.20 1.74 0.89
Central 5.72 2.60 1.53 4.33 1.30 1.95 2.47 8.56 8.19 22.47 17.95 6.33 7.63 5.35 2.23 1.40
Chalford 5.85 4.06 2.38 7.16 1.54 2.77 1.83 3.75 3.95 19.82 22.75 7.02 9.46 5.81 1.29 0.57
Coaleyand Uley 3.65 3.18 1.70 6.39 1.44 3.44 1.57 4.18 2.83 14.66 25.97 8.70 11.70 8.39 1.30 0.91
Dursley 6.75 3.93 2.36 5.60 1.02 2.49 1.93 5.26 5.82 23.08 19.11 5.38 9.05 5.61 1.45 1.16
Eastingtonand Stand
ish5.02 3.18 1.84 5.85 1.56 2.73 2.01 4.63 4.46 17.34 22.80 8.81 10.31 6.47 2.01 1.00
Farmhilland Pagan
hill4.34 3.19 2.45 5.91 1.48 2.63 2.35 5.08 4.39 19.71 19.39 7.94 11.31 6.93 1.85 1.06
Hardwicke 6.29 3.24 2.36 5.94 1.23 2.49 1.88 5.71 6.31 21.79 22.60 7.02 7.13 4.60 1.05 0.36
Kingswood 5.82 4.15 3.20 8.06 1.29 2.96 1.91 4.34 2.53 18.08 24.67 6.58 9.92 3.72 1.62 1.15
Minchinhampton 4.29 3.14 2.20 5.42 1.31 2.16 1.86 3.03 2.62 15.74 20.63 8.58 13.33 10.40 3.65 1.63
Nailsworth 5.79 2.98 2.07 5.93 1.59 2.57 2.42 4.60 4.32 18.57 22.69 7.86 9.87 5.46 2.10 1.18
Painswick 4.43 3.08 1.97 5.10 0.77 2.14 1.44 2.55 2.31 14.53 22.80 9.04 15.82 9.57 2.98 1.47
Randwick,Whiteshilland Rusco
mbe
4.12 2.63 2.12 7.56 1.20 3.43 2.75 2.40 2.00 18.55 23.76 9.67 11.10 7.21 1.09 0.40
Rodborough 6.01 2.77 2.22 5.90 1.17 2.88 1.87 4.69 3.76 21.29 21.92 6.47 11.09 6.34 1.17 0.44
Severn 5.13 3.53 2.31 6.64 1.24 2.46 1.79 3.82 3.34 18.68 24.45 7.88 10.19 6.18 1.58 0.80
Slade 5.56 3.78 2.99 6.91 0.98 3.18 3.04 6.54 5.79 21.21 22.28 5.60 7.19 3.88 0.75 0.33
Stonehouse 5.44 3.46 2.41 6.67 1.57 3.72 2.65 5.54 5.40 19.79 20.61 6.17 8.61 5.26 1.71 1.01
The Stanleys 4.85 2.60 1.67 5.83 1.39 2.50 1.89 4.39 3.51 15.98 22.78 9.75 13.16 6.69 1.99 1.01
Thrupp 4.56 3.57 2.97 6.88 1.33 2.49 2.06 3.27 2.79 19.17 26.69 8.21 10.01 4.81 0.95 0.26
Trinity 5.95 2.88 1.77 6.14 1.49 3.21 2.70 4.84 4.56 19.49 24.23 6.47 7.95 5.63 1.63 1.07
Uplands 5.55 3.25 2.30 5.55 0.90 2.80 2.26 5.51 5.24 21.17 22.93 4.79 8.76 5.91 2.21 0.86
Page 3 of 12

Upton StLeonards 6.57 2.85 1.86 5.03 1.37 2.99 1.97 5.87 7.21 17.82 18.56 7.52 10.83 6.50 2.18 0.88
Vale 4.15 3.03 1.81 6.60 1.70 2.77 1.97 4.47 3.25 15.81 24.64 8.57 12.40 6.01 1.92 0.90
Valley 5.95 2.34 2.09 5.79 1.60 3.16 2.75 6.44 6.16 23.39 22.98 5.99 6.16 3.90 0.78 0.53
Wotton-under-Edge
5.42 3.33 2.38 6.07 1.20 2.40 2.20 4.30 3.50 18.20 21.89 7.91 11.04 7.00 2.01 1.14
Cainscross has the highest number of 0-4 year olds representing 7.46% of that age group within thecouncil.
Wotton-under-Edge has the highest number of 65-74 year olds representing 6.16% of that age groupwithin the council.
This map shows wards of low and high numbersof households with dependent children comparedwith other wards in England.
Cainscross has the highest number of dependentchildren in the Stroud.
Page 4 of 12

Ethnic mixThis table shows the ethnic mix of each ward in Stroud.
Residents whoare
Asian/AsianBritish
Residents who areBlack/African/Caribbean/Black British
Residents who areMixed/multipleethnic groups
Residents whoare White
Residents whoare Other
ethnic group
2011 2011 2011 2011 2011
people people people people people
Amberley andWoodchester 3 0 9 2,102 2
Berkeley 25 2 37 4,111 6
Bisley 12 2 10 2,118 0
Cainscross 48 17 84 7,157 10
Cam East 25 8 40 4,060 1
Cam West 5 8 38 3,969 8
Central 22 9 40 2,077 2
Chalford 21 9 57 6,417 5
Coaley andUley 8 1 14 2,274 2
Dursley 48 32 84 6,528 5
Eastington andStandish 14 0 12 1,767 1
Farmhill andPaganhill 8 6 33 2,118 1
Hardwicke 29 21 49 4,677 7
Kingswood 11 1 18 2,064 2
Minchinhampton 29 4 34 4,285 5
Nailsworth 63 15 91 6,438 7
Painswick 24 2 31 4,099 2
Randwick,Whiteshill and
Ruscombe11 4 24 1,707 1
Rodborough 27 14 78 4,415 9
Severn 20 5 32 4,699 4
Slade 11 16 30 2,075 9
Stonehouse 95 26 100 7,497 7
The Stanleys 14 3 31 3,912 0
Thrupp 8 0 21 2,296 2
Trinity 20 6 37 2,077 10
Uplands 24 8 22 2,160 1
Upton StLeonards 32 18 49 2,743 3
Vale 6 1 14 1,857 1
Valley 28 14 53 2,340 2
Wotton-under-Edge 60 8 44 6,387 11
Total forStroud Admin
istrative 751 260 1,216 110,426 126
Page 5 of 12
istrativeWards
Stonehouse has the highest number of Asian / Asian British residents in Stroud.
Dursley has the highest number of Black / African / Caribbean /Black British residents in Stroud.
Page 6 of 12
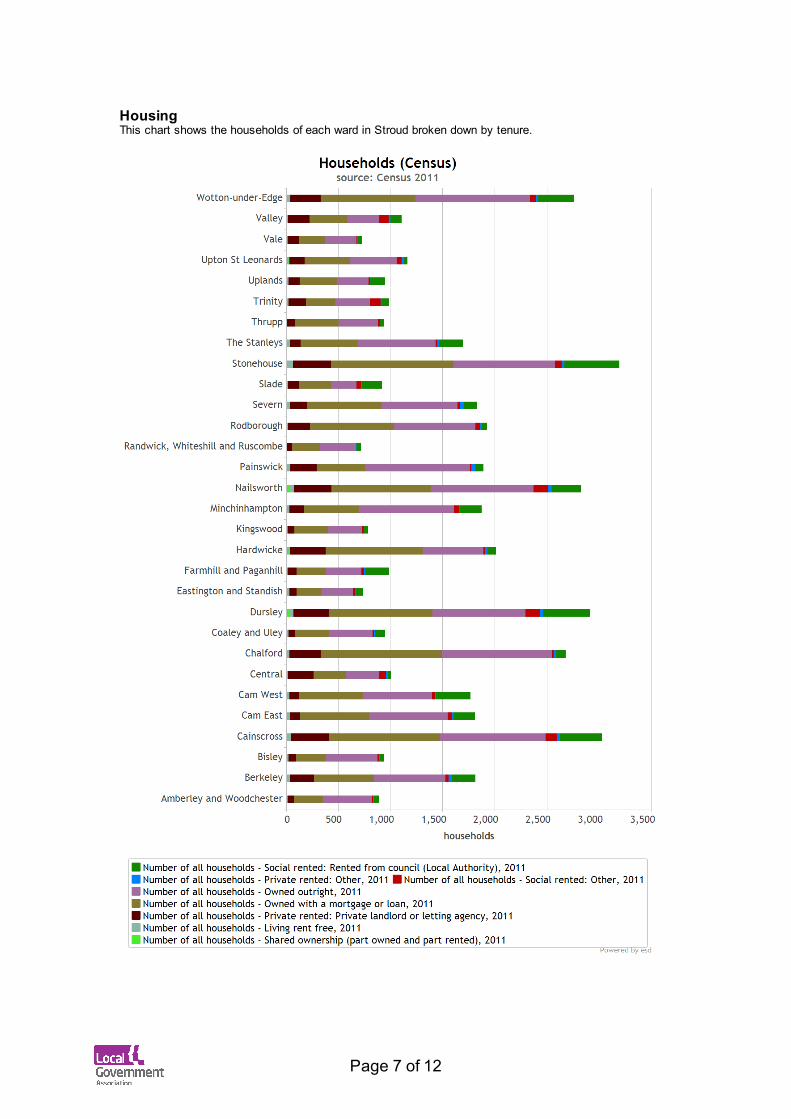
HousingThis chart shows the households of each ward in Stroud broken down by tenure.
Page 7 of 12

Stonehouse has 525 households rented from the council, which is the highest number for any ward inStroud.
Nailsworth has 143 households of other types of social renting, which is the highest number for anyward in Stroud.
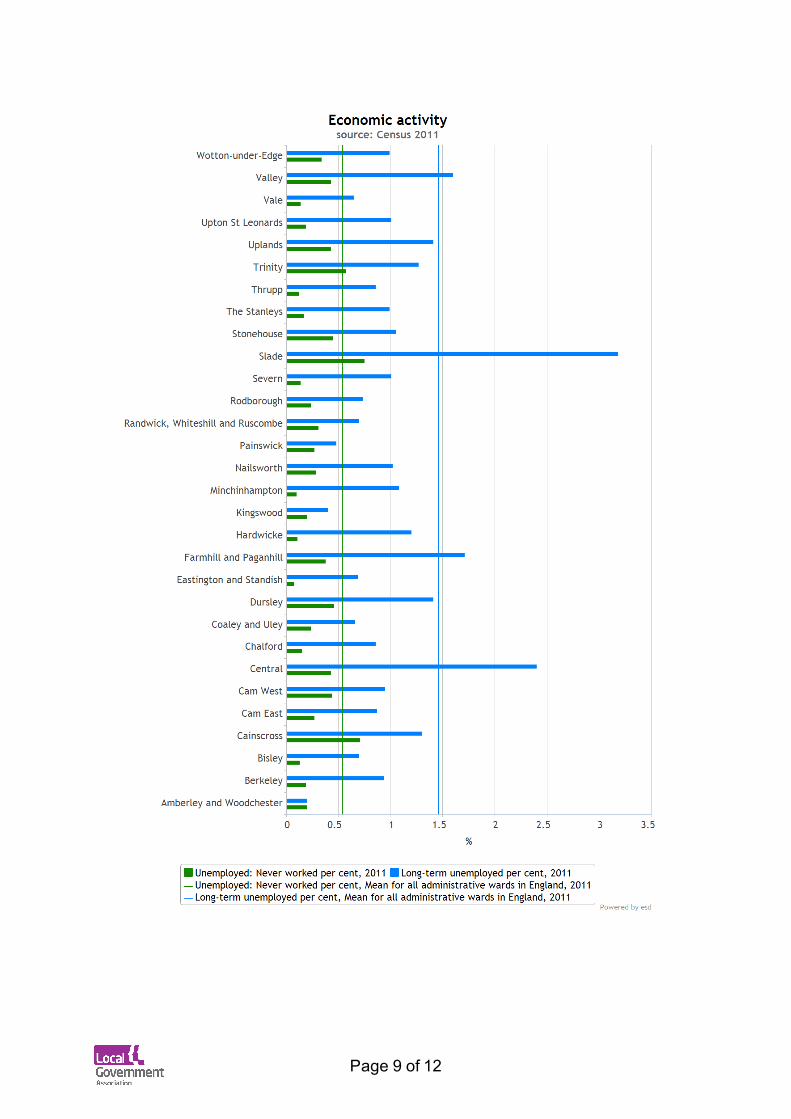
EmploymentSlade has the highest percentage of residents in Stroud who are long term unemployed or who havenever worked.
The bar chart below shows the size of these two groups separately for each ward in Stroud against theaverage for England.
Page 8 of 12
Page 9 of 12

EducationThis chart shows the split of each ward by the highest level of educational achievement of each resident.
Berkeley has the highest percentage of residents in Stroud who have no qualifications.
Page 10 of 12

HealthThis chart shows the split of each ward by the health of its residents.
Cam West has the highest percentage of residents in Stroud who are in very bad health.
Page 11 of 12
Further informationThis report provides a small selection of information about your ward. To get more information and authorcharts, tables and maps for your own reports, take a look at LG Inform Plus and contact esd-toolkit'sLG Inform Plus team with any queries.
Page 12 of 12