basic information document - world banksiteresources.worldbank.org/intlsms/resources/3358986... ·...
TRANSCRIPT

Federal Republic of Nigeria National Bureau of Statistics
General Household Survey –Panel
(Post Planting‐2010)
Basic Information Document June 28, 2011
ACRONYMS
BMGF Bill and Melinda Gates Foundation
CAPI Computer Assisted Personal Interviewing
EA Enumeration Area
FCT, Abuja Federal Capital Territory, Abuja
FMA&RD Federal Ministry of Agriculture and Rural Development
FMWR Federal Ministry of Water Resources
GHS General Household Survey
GHS‐Panel General Household Survey‐Panel (panel subcomponent of GHS)
GHS‐Cross General Household Survey‐Cross (annual cross section of GHS)
LGA Local Government Area
LSMS‐ISA Living Standards Measurement Study – Integrated Surveys on
Agriculture
MSF Master Sample Frame
NBS National Bureau of Statistics
NFRA National Food Reserve Agency
NISH National Integrated Survey of Households
NpopC National Population Commission
PSU Primary Sampling Unit
SAE Small Area Estimation
WB World Bank
Table of Contents (GHS‐Panel) .................................................................................................................................. 1
1.0 Introduction ....................................................................................................................... 1
1.1 Expected Benefits ................................................................................................................. 3
1.2 Innovations ....................................................................................................................... 3
1.3 Coverage ........................................................................................................................... 3
1.4 Scope ................................................................................................................................ 4
2.0 The Survey Questionnaires ............................................................................................. 5
2.1 Contents of Household Questionnaire .............................................................................. 5
2.2 Contents of the Agricultural Questionnaire ..................................................................... 7
2.3 Survey Concepts and Definitions ..................................................................................... 8
2.4 Pilot Test ........................................................................................................................ 11
3.0 Sample Design ................................................................................................................. 12
3.1 Sample Framework ........................................................................................................ 13
3.2 Sample Selection ............................................................................................................ 19
4.0 Organization of the Survey ............................................................................................ 19
4.1 Survey Management ........................................................................................................... 19
4.2 Training of Field staff and Data Entry Operators ............................................................... 20
4. 3 Organization of Fieldwork ................................................................................................. 20
4.3.1 Roles and Responsibilities of Field staff ..................................................................... 21
4.3.2 Fieldwork Monitoring and Evaluation ......................................................................... 22
4.4 Field Work Problems, Challenges, Lessons Learned and Proffered Solutions .............. 23
5.0 Data Entry and Data Management ..................................................................................... 24
5.1 Data Entry ...................................................................................................................... 24
5.2 Data Cleaning ................................................................................................................. 25
5.2.1 Data Cleaning Challenges ....................................................................................... 25
5.3 Weighting of Data .......................................................................................................... 26
5.4 Description of the Datasets ................................................................................................. 26
6.0 Using the Data.................................................................................................................... 28
6.1 File Structure .................................................................................................................. 28
6.2 Variable Naming Scheme ........................................................................................... 29
7.0 Overall Problems and Challenges Faced During the Survey ............................................. 29

1
General Household Survey –Panel (Post Planting‐2010) (GHS‐Panel)
1.0 Introduction Nigeria has made substantial strides in providing household, farm and enterprise data
to policy makers and researchers. In spite of these efforts, there are still gaps in the
production of adequate and timely data to inform policy making. One special concern
is the need to produce sufficient and accurate agricultural production statistics. The
current set of farm and household surveys conducted by the National Bureau of
Statistics (NBS) does provide data on a wide range of sectors. But, typically, different
sectors (or topics) are covered in separate surveys. The one exception to this is the
Harmonized Nigerian Living Standard Survey (HNLSS) which covers multiple topics
and thus allows one to understand the linkages between various characteristics of
households and their level of well‐being.
To date, however, detailed agricultural data have been collected separately from other
information on the households engaged in agriculture. While the HNLSS does collect
agricultural data this is not at the level of detail that the National Agricultural Sample
survey does. Given the dependence on agriculture of large numbers of households in
the country, the country needs information on household agricultural activities along
with other information on the households (e.g. human capital, all economic activities,
access to services and resources). Additionally, to truly understand the role of
agriculture in household welfare over time, panel data is needed. To date, in the
country, only cross‐sectional surveys have been collected. In a panel survey, the same
set of households is re‐interviewed over time. This allows analyses to be made of how
households add to their human and physical capital, how education affects earnings
and the role of government policies and programs on poverty As part of the efforts to
continue to improve data collection and usability in the country, the NBS has partnered
with the Federal Ministry of Agriculture and Rural Development (FMA&RD), the
National Food Reserve Agency (NFRA), the Bill and Melinda Gates Foundation (BMGF)
and the World Bank (WB to develop a method to collect agricultural and household
data in such a way as to allow the study of agriculture’s role in household welfare over
time. To do this NBS, with its partners, has revised substantially one of its core surveys
(the General Household Survey‐GHS) and added a panel component to it. The GHS is a
cross‐sectional survey of 22,000 households throughout the country. The panel
component (GHS‐Panel) is now being applied to 5,000 households of the GHS and
covers multiple agricultural activities. The focus of this panel component is to improve

2
data from the agriculture sector and link this to other facets of household behavior and
characteristics. The GHS‐Panel drew heavily on the HNLSS and the NASS to create a
new survey instrument and method to shed light on the role of agriculture in
households’ economic wellbeing. The NBS implemented the first stage (Post Planting)
of the first wave of the GHS‐Panel in 2010. This panel is a subset of the full GHS (or
GHS‐Cross Section) that will be finished in 2011.) It is envisaged that the GHS‐Panel
will be carried out every two years while the GHS‐Cross Section will be carried out
annually. A schematic of data collection is shown in Figure 1.
Figure 1: Schematic of GHS
2010 2011 2012 2013
GHS‐Cross Sectional 22,000
GHS‐Cross Section (17,000)
GHS‐Cross
Sectional 22,000
GHS‐Cross Section (17,000)
GHS‐Panel Post
Planting 5.000
GHS‐Panel Post
Harvest 5,000
GHS‐Panel Post
Planting 5.000
GHS‐Panel Post
Harvest 5,000
This revised and expanded GHS survey (Cross and Panel) forms part of a larger,
regional project is Sub‐Saharan Africa to improve agricultural statistics. Nigeria is one
of seven countries being supported by the World Bank, through funding from the Bill
and Melinda Gates Foundation (BMGF), to strengthen the production of household‐
level data on agriculture. This regional project, the Living Standards Measurement
Study‐Integrated Surveys on Agriculture (LSMS_ISA)0 has the over‐arching objective of
the improving our understanding of agriculture in Sub‐Saharan Africa – specifically, its
role in household welfare and poverty reduction‐‐ and how innovation and efficiency
can be fostered in the sector.
The present document is designed to provide a brief overview of the first round of data
collection under the revised GHS. This first visit was done on the panel households in
the post‐planting period (August‐October) of 2010. The second visit will be done in the
Post Harvest Period (February‐March) 2012 and will include both panel and cross‐
sectional households. A separate document will provide information on the second
visit.

3
1.1 Expected Benefits
The specific outputs and outcomes of the revised GHS with panel component are: Development of an innovative model for collecting agricultural data in
conjunction with household data;
Development of a model of inter‐institutional collaboration between NBS and the
FMA&RD and NFRA, inter alia, to ensure the relevance and use of the new GHS;
Building the capacity to generate a sustainable system for the production of
accurate and timely information on agricultural households in Nigeria.
Comprehensive analysis of poverty indictors and socio‐economic characteristics.
1.2 Innovations
The revised GHS with panel component contains several innovative features.
Integration of agricultural data at the plot level with household welfare data;
Creation of a panel data set that can be used to study poverty dynamics, the role
of agriculture in development and the changes over time in health, education
and other labor activities, inter alia.
Use of small area estimation techniques (SAE) to generate state level poverty
data by taking advantage of the integration of the panel households into the full
GHS.
Collection of information on the network of buyers and sellers of goods that
household interact with;
Use of GPS units for measuring agricultural land areas;
Involvement of multiple actors in government, academia and the donor
community in the development of the survey and its contents as well as its
implementation and analysis;
Use of concurrent data entry in Wave 1. In later Waves the project will develop
and implement a Computer Assisted Personal Interview (CAPI) application for
the paperless collection of the GHS;
Use of direct respondents for all sections of the questionnaires where individual
level data or specific economic activity data are collected;
Creation of a publicly available micro data sets for researchers and policy
makers;
Active dissemination of agriculture statistics.
1.3 Coverage The revised GHS with the panel component, while having an intensive focus on agriculture, is a national survey.
4
The survey covered all the 36 states and the Federal Capital Territory (FCT), Abuja
Both urban and rural enumeration areas (EAs) were canvassed
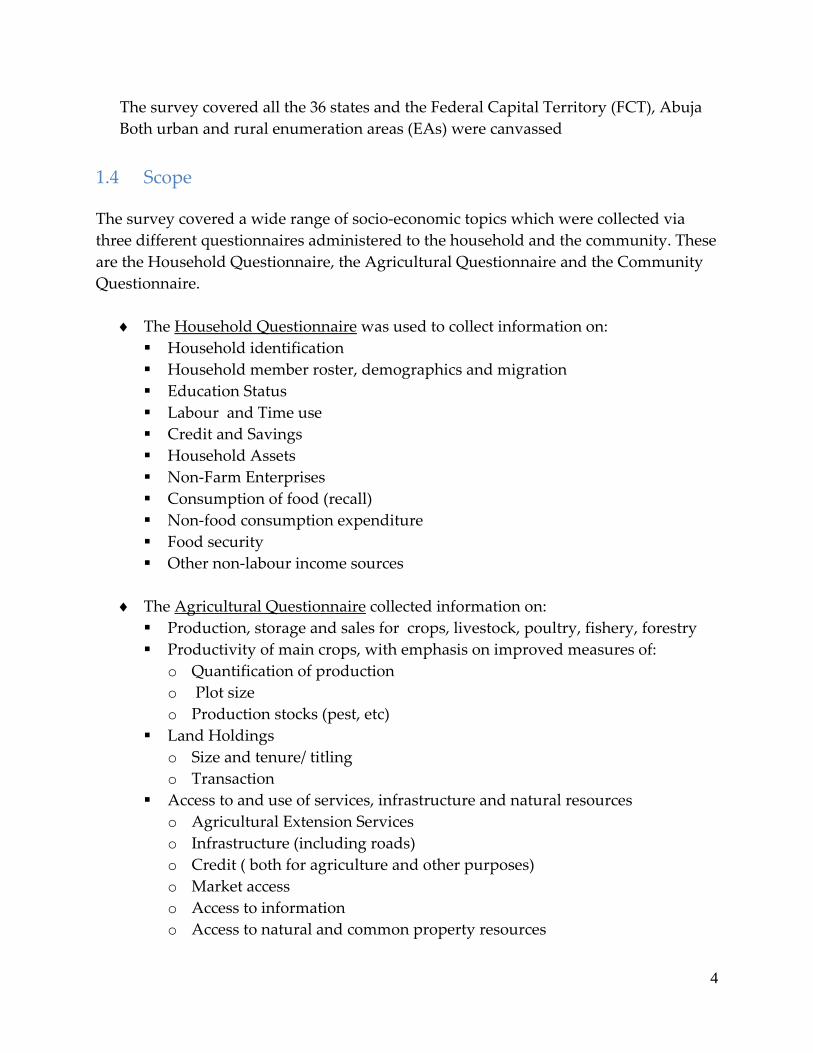
1.4 Scope The survey covered a wide range of socio‐economic topics which were collected via
three different questionnaires administered to the household and the community. These
are the Household Questionnaire, the Agricultural Questionnaire and the Community
Questionnaire.
The Household Questionnaire was used to collect information on:
Household identification
Household member roster, demographics and migration
Education Status
Labour and Time use
Credit and Savings
Household Assets
Non‐Farm Enterprises
Consumption of food (recall)
Non‐food consumption expenditure
Food security
Other non‐labour income sources
The Agricultural Questionnaire collected information on:
Production, storage and sales for crops, livestock, poultry, fishery, forestry
Productivity of main crops, with emphasis on improved measures of:
o Quantification of production
o Plot size o Production stocks (pest, etc)
Land Holdings
o Size and tenure/ titling
o Transaction
Access to and use of services, infrastructure and natural resources
o Agricultural Extension Services
o Infrastructure (including roads)
o Credit ( both for agriculture and other purposes)
o Market access
o Access to information
o Access to natural and common property resources
5
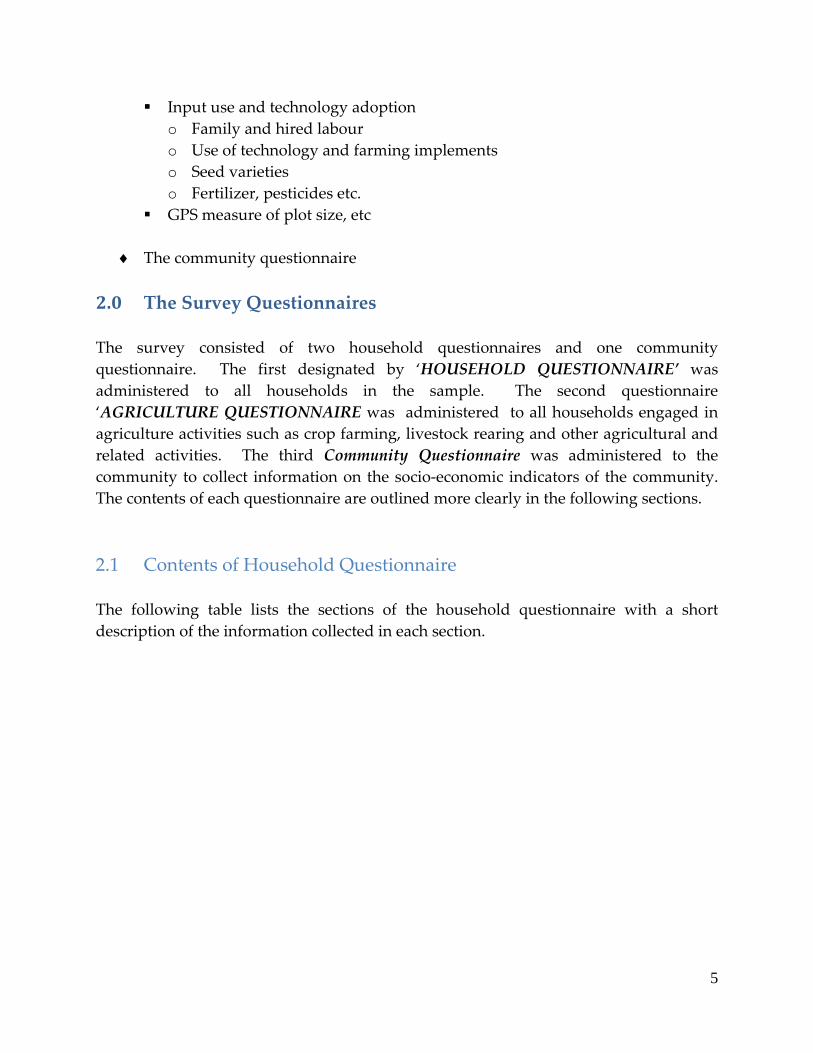
Input use and technology adoption
o Family and hired labour
o Use of technology and farming implements
o Seed varieties
o Fertilizer, pesticides etc.
GPS measure of plot size, etc
The community questionnaire
2.0 The Survey Questionnaires
The survey consisted of two household questionnaires and one community
questionnaire. The first designated by ‘HOUSEHOLD QUESTIONNAIRE’ was
administered to all households in the sample. The second questionnaire
‘AGRICULTURE QUESTIONNAIRE was administered to all households engaged in
agriculture activities such as crop farming, livestock rearing and other agricultural and
related activities. The third Community Questionnaire was administered to the
community to collect information on the socio‐economic indicators of the community.
The contents of each questionnaire are outlined more clearly in the following sections.
2.1 Contents of Household Questionnaire
The following table lists the sections of the household questionnaire with a short
description of the information collected in each section.

6
Table 2.1: Description of Household Questionnaire
Section Section Name Description of Areas Covered
Cover Cover Identification of household and location. Administrative data
about field staff and conducting survey in the household
1 Roster This section provides a list of household members and is used
to record basic demographic information about these members
2 Education This section collects Education and qualification of household
members five years and older. This section also collects
information about student in school including the type of
school, distance and mode of transportation, class level and
costs.
3 Labour This section collects information on the labour activities of all
household members five years and older. Information on the
type of work that individuals do, either on their own account
(as their own boss), for others, or in household enterprises will
be collected. The hours and income earned will also be recorded
in this section.
4 Credit and
Savings
This section collects information on the use and type of credit
that household members 15 years and older have taken.
Information about individuals’ savings practices are also
collected from these persons.
5 Household
Assets
In this section the household report the assets owned and who
owns these assets and their values.
6 Non‐farm
Enterprises
Description of non‐farm activities owned and /or operated by
household members. The information collected includes the
type of activity, the revenue from these activities, and the costs
of operating these enterprises.
7A Meals Away
From Home
This section collects information on expenditure on food
purchased and consumed outside the home by household
members during the past seven days.
7B Household Food
Expenditures
Food consumption of household members over the past 7 days,
including food consumed, food purchased, food consumed
from own‐production, and food received as gifts.
8 Household Non‐
food
Expenditures
Non‐food expenditures of household members including
frequent and non‐frequent purchases.
9 Food Security Information regarding the regularity of food consumption and
vulnerability of household to food insecurity.
10 Other Income Sources and amounts of non‐labor income, including interest on
savings.
Contact
Information
Information to follow up with the household on subsequent
visits.

7
2.2 Contents of the Agricultural Questionnaire The following table lists the sections of the household questionnaire with a short
description of the information collected in each section. Table 2.2: Description of Agricultural Questionnaire
Section Section Name Description of Areas Covered
Cover Cover Identification of household and location. Administrative
data about field staff and conducting the survey in the
household
11a Plot Roster Information of agriculture plots owned and/or operated
by household members.
11b Land Inventory Identification of the land holdings of the household, the
use of the land and the characteristics of the land
including size and water source for irrigation.
11c Input Costs The inputs used for cultivation and their costs are
collected in this section, specifically pesticides and
herbicides.
11d Fertilizer
Acquisition
This section asks specific questions about fertilizer use
and acquisition.
11e Seed Acquisition Information about seeds and how they were acquired is
collected in this section.
11f Planting Field
Crops
Information about the field crops grown by the household
on each plot during the last planting season.
11g Planting Tree
Crops
Information about the tree crops grown by the household
over the last planting season.
11h Marketing of
Agricultural
Surplus
This section collects information on the income generated
when agricultural surpluses are sold. Also collects
information on the characteristics of the sales and buyers.
11i Animal Holdings Information on the animal holdings by the household
including livestock, fish, and other animals such as draft
animals.
11j Animal Costs The costs of holding these animals, including vaccinations
and the cost of food supply to animals.
11k Agriculture by‐
product
Information on other agriculture products that is not
reported under crop production and animal production of
the household
11l Extension Information on where households receive agricultural
information.
12 Network Roster Characteristics of the business networks of households.

8
2.3 Survey Concepts and Definitions Concepts and main definitions: In order to manage the survey properly, a list of key
terms has been established, which should help interviewers in carrying out their work.
Detailed definitions are provided in relevant Chapters of the Interviewer’s Manuals.
Population: Set of elements which make the whole. That could be all the people
in a country or an entity, all households, all household, etc.
Sample: a part of population representing the whole population. Sample
selection is a subject of statistical methods that take into account characteristics of
both the population and individual members of the population.
Direct interview: Procedure by which information on each person is collected
directly from that person. The person giving information on him/herself is a
“direct respondent”.
Reference period: Period about which the respondent is asked questions. The
survey uses different reference periods depending on the type of required
information, the respondent’s ability to remember and the objectives of each
topic to be analyzed.
Household is a social unit consisting of one or more persons who use joint
accommodation and food. In other words, a household is a group of people who
normally live in the same household unit (“live under the same roof”), who are
or are not related and who eat together (“eat from the same pot”).
Head of the household: is a person defined as such by the household for the purpose of the survey, irrespective of reason (the oldest by age, decision maker
in the household, a person who earns the most income, based on tradition, etc.).
Guest: a person who uses the joint accommodation and food free of charge
together with household members. A guest who stays longer than six months is
then considered to be a household member.
Tenant of the household: a person who pays for accommodation in a part of a
dwelling. This person is not a member of the household whether he/she eats
with the household or prepares food separately. Such a tenant is considered a
separate household.
Students who study in another town, but who are supported by the household
are treated as household members, although they may be absent more than six
months.
Household members: Anybody who meets the following criteria:

9
Table 2.3: Main Rules for Household Membership
Members Non‐members
An individual who is present at the moment
of interview and has spent at least 6 months
of the previous 12 months living in the
household. The household head should be
listed as a member even if he or she did not
spend 6 of the previous 12 months in the
household.
Person who would normally reside in the
household but who is currently absent
from the household longer than 6 months
(including those serving military service, in
prison, religious service, etc.)
Person who usually lives in the household
even if he or she is absent at the moment of
the interview, if he/she is absent less than six
months during the previous 12 months.
Persons present in the household at the
time of the interview who usually live
elsewhere; visitors or tourists who are in
the household less than six months.
Guests or other persons who live in the
household longer than six months during the
previous 12 months.
Tenants, i.e. those paying the household
for accommodation, whether or not they
eat with the household.
Newborn babies irrespective of the duration
of their stay in the household.
Those who eat in the household but live
elsewhere or live in the household but eat
elsewhere.
Students who reside in a different location
longer than six months but are supported by
household members.
Students who pay the household for
accommodation and food.
The GHS‐Panel uses direct informants extensively. Thus for all individual sections
(education, labor and the like) each person aged 15 and older is interviewed directly.
For children, parents or guardians provide the data. For specific topics such as
agriculture or non‐farm businesses, the person(s) in the household who is(are) best
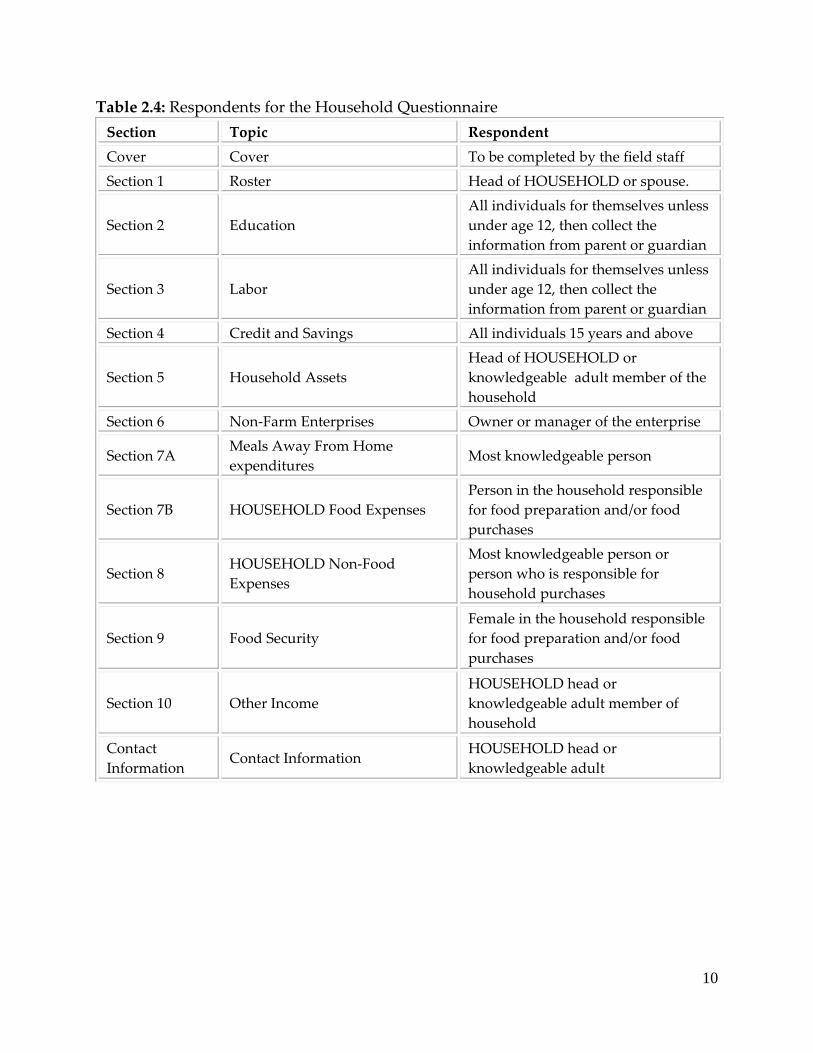
informed provide the data. The following table describes in detail the respondent(s) for
each section of the questionnaire.
10
Table 2.4: Respondents for the Household Questionnaire
Section Topic Respondent
Cover Cover To be completed by the field staff
Section 1 Roster Head of HOUSEHOLD or spouse.
Section 2 Education
All individuals for themselves unless
under age 12, then collect the
information from parent or guardian
Section 3 Labor
All individuals for themselves unless
under age 12, then collect the
information from parent or guardian
Section 4 Credit and Savings All individuals 15 years and above
Section 5 Household Assets
Head of HOUSEHOLD or
knowledgeable adult member of the
household
Section 6 Non‐Farm Enterprises Owner or manager of the enterprise
Section 7A Meals Away From Home
expenditures Most knowledgeable person
Section 7B HOUSEHOLD Food Expenses
Person in the household responsible
for food preparation and/or food
purchases
Section 8 HOUSEHOLD Non‐Food
Expenses
Most knowledgeable person or
person who is responsible for
household purchases
Section 9 Food Security
Female in the household responsible
for food preparation and/or food
purchases
Section 10 Other Income
HOUSEHOLD head or
knowledgeable adult member of
household
Contact
Information Contact Information
HOUSEHOLD head or
knowledgeable adult
11
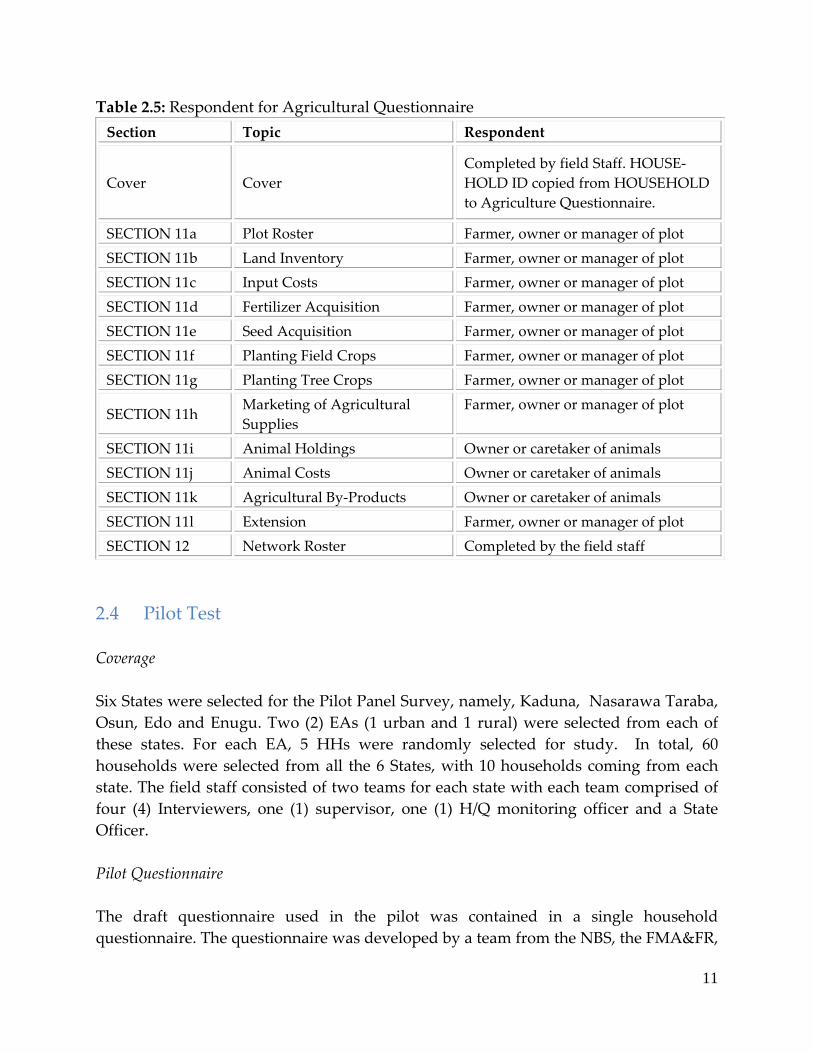
Table 2.5: Respondent for Agricultural Questionnaire
Section Topic Respondent
Cover Cover
Completed by field Staff. HOUSE‐
HOLD ID copied from HOUSEHOLD
to Agriculture Questionnaire.
SECTION 11a Plot Roster Farmer, owner or manager of plot
SECTION 11b Land Inventory Farmer, owner or manager of plot
SECTION 11c Input Costs Farmer, owner or manager of plot
SECTION 11d Fertilizer Acquisition Farmer, owner or manager of plot
SECTION 11e Seed Acquisition Farmer, owner or manager of plot
SECTION 11f Planting Field Crops Farmer, owner or manager of plot
SECTION 11g Planting Tree Crops Farmer, owner or manager of plot
SECTION 11h Marketing of Agricultural
Supplies
Farmer, owner or manager of plot
SECTION 11i Animal Holdings Owner or caretaker of animals
SECTION 11j Animal Costs Owner or caretaker of animals
SECTION 11k Agricultural By‐Products Owner or caretaker of animals
SECTION 11l Extension Farmer, owner or manager of plot
SECTION 12 Network Roster Completed by the field staff
2.4 Pilot Test
Coverage
Six States were selected for the Pilot Panel Survey, namely, Kaduna, Nasarawa Taraba,
Osun, Edo and Enugu. Two (2) EAs (1 urban and 1 rural) were selected from each of
these states. For each EA, 5 HHs were randomly selected for study. In total, 60
households were selected from all the 6 States, with 10 households coming from each
state. The field staff consisted of two teams for each state with each team comprised of
four (4) Interviewers, one (1) supervisor, one (1) H/Q monitoring officer and a State
Officer.
Pilot Questionnaire
The draft questionnaire used in the pilot was contained in a single household
questionnaire. The questionnaire was developed by a team from the NBS, the FMA&FR,

12
NFRA and the World Bank. The pilot questionnaire covered 22 different topics
including, Education, Labour, Credit and Savings, Assets, Non‐farm enterprises, Plot
Roster, Land Inventory, Input Costs, Fertilizer Acquisition, Seed Acquisition, Planting
Field Crops, Planting Tree Crops, Marketing of Agricultural Surplus, Extension, Animal
Holdings, Animal Costs, Household Food Expenditures, Household Non‐Food
Expenditures, Food Security, Other Income and Network Roster.
Training Workshop for Pilot Panel Survey
Two zonal centres were chosen for conducting the Pilot Panel Survey’s training
workshop. Kaduna centre served as the training location for teams from Nasarawa,
Taraba and Kaduna States while Enugu centre served as the training location for teams
from Osun, Edo and Enugu States. The training in each center lasted for 4 days and was
offered on a staggered basis. The training at the Kaduna centre was conducted April 15
through to April 18, while Enugu centre was between April 20 and 24, 2010. The
decision was taken to stagger the training days at the centres in order to allow the
World Bank team and the FMA&RD and NFRA counterparts to supervise and monitor
both centres during the training.
3.0 Sample Design
The GHS‐Panel (Post Planting 2010), like all household surveys in the country, is based
on the Master Sample Frame, This Frame is based on the 2006 Housing and Population
Census conducted by the National Population Commission (NpopC). The census
includes approximately 662,000 enumeration areas (EAs) throughout the country. From
the census, the Master Frame was constructed at the local government area (LGA). In
668 LGAs, 30 EAs were scientifically selected. The remaining six LGAs are found in
FCT, Abuja. Forty EAs were scientifically selected in each of these 6 LGAs.. This gives
a total of 23,280 EAs selected nationally. This is the Master Frame.
From the Master Frame a master sample frame, called the National Integrated Survey of
Households 2007/2012 Master Sample Frame (NISH‐MSF) was developed. The NISH‐
MSF was constructed by pooling the LGAs in the Master Frame by state. Thereafter, a
systematic sample of 200 EAs was selected with equal probability across all LGAs
within the state. Furthermore, the NISH EAs in each state were divided into 20
replicates of 10 EAs each. However, the sample EAs for most national household
surveys such as the GHS are based on a sub‐sample of the NISH‐MSF, selected as a
combination of replicates from NISH‐MSF frame. For the GHS‐Panel, the sample is a
subset of the EAs selected for the GHS.
13
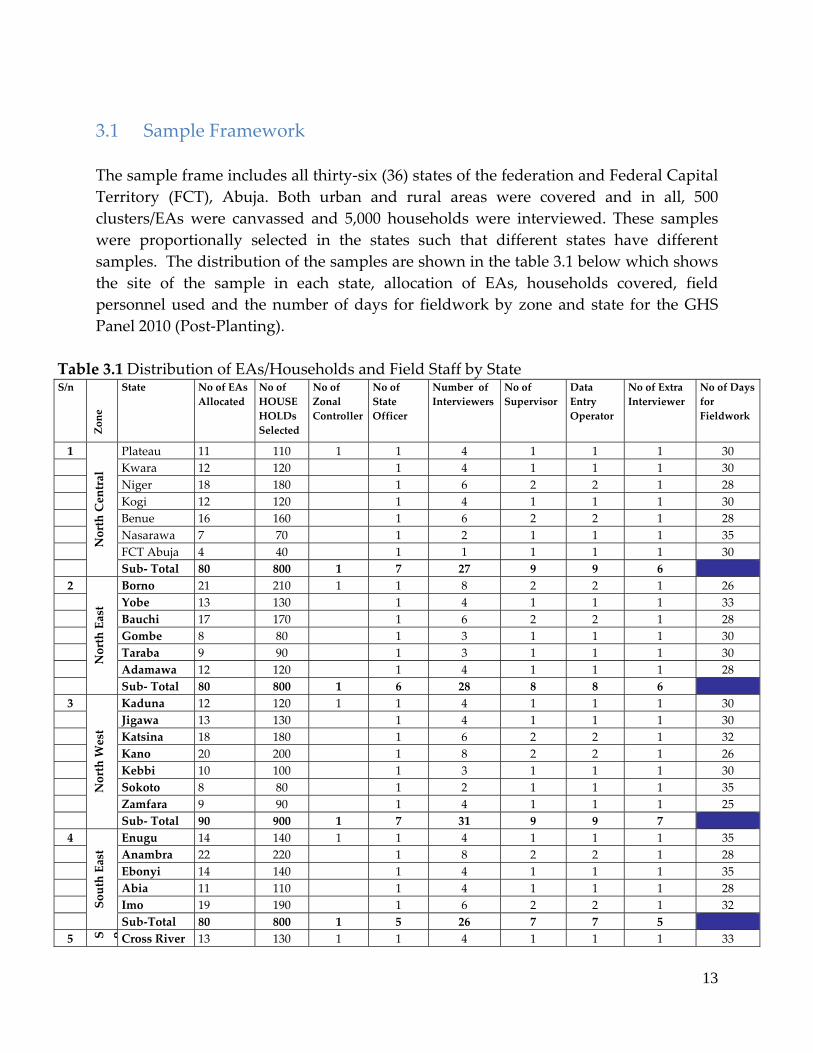
3.1 Sample Framework
The sample frame includes all thirty‐six (36) states of the federation and Federal Capital
Territory (FCT), Abuja. Both urban and rural areas were covered and in all, 500
clusters/EAs were canvassed and 5,000 households were interviewed. These samples
were proportionally selected in the states such that different states have different
samples. The distribution of the samples are shown in the table 3.1 below which shows
the site of the sample in each state, allocation of EAs, households covered, field
personnel used and the number of days for fieldwork by zone and state for the GHS
Panel 2010 (Post‐Planting).
Table 3.1 Distribution of EAs/Households and Field Staff by State S/n
Zone
State No of EAs
Allocated
No of
HOUSE
HOLDs
Selected
No of
Zonal
Controller
No of
State
Officer
Number of
Interviewers
No of
Supervisor
Data
Entry
Operator
No of Extra
Interviewer
No of Days
for
Fieldwork
1
North Central
Plateau 11 110 1 1 4 1 1 1 30
Kwara 12 120 1 4 1 1 1 30
Niger 18 180 1 6 2 2 1 28
Kogi 12 120 1 4 1 1 1 30
Benue 16 160 1 6 2 2 1 28
Nasarawa 7 70 1 2 1 1 1 35
FCT Abuja 4 40 1 1 1 1 1 30
Sub‐ Total 80 800 1 7 27 9 9 6
2
North East
Borno 21 210 1 1 8 2 2 1 26
Yobe 13 130 1 4 1 1 1 33
Bauchi 17 170 1 6 2 2 1 28
Gombe 8 80 1 3 1 1 1 30
Taraba 9 90 1 3 1 1 1 30
Adamawa 12 120 1 4 1 1 1 28
Sub‐ Total 80 800 1 6 28 8 8 6
3
North West
Kaduna 12 120 1 1 4 1 1 1 30
Jigawa 13 130 1 4 1 1 1 30
Katsina 18 180 1 6 2 2 1 32
Kano 20 200 1 8 2 2 1 26
Kebbi 10 100 1 3 1 1 1 30
Sokoto 8 80 1 2 1 1 1 35
Zamfara 9 90 1 4 1 1 1 25
Sub‐ Total 90 900 1 7 31 9 9 7
4
South East
Enugu 14 140 1 1 4 1 1 1 35
Anambra 22 220 1 8 2 2 1 28
Ebonyi 14 140 1 4 1 1 1 35
Abia 11 110 1 4 1 1 1 28
Imo 19 190 1 6 2 2 1 32
Sub‐Total 80 800 1 5 26 7 7 5
5 S o Cross River 13 130 1 1 4 1 1 1 33
14
S/n Zone
State No of EAs
Allocated
No of
HOUSE
HOLDs
Selected
No of
Zonal
Controller
No of
State
Officer
Number of
Interviewers
No of
Supervisor
Data
Entry
Operator
No of Extra
Interviewer
No of Days
for
Fieldwork
Akwa‐Ibom 15 150 1 4 1 1 1 35
Rivers 21 210 1 8 2 2 1 25
Bayelsa 7 70 1 2 1 1 1 35
Edo 10 100 1 4 1 1 1 28
Delta 14 140 1 6 2 2 1 25
Sub‐ Total 80 800 1 6 28 8 8 6
6
South West
Oyo 23 230 1 1 8 2 2 1 28
Osun 18 180 1 6 2 2 1 32
Ogun 11 110 1 3 1 1 1 30
Lagos 17 170 1 6 2 2 1 30
Ekiti 8 80 1 3 1 1 1 27
Ondo 13 130 1 4 1 1 1 35
Sub‐Total 90 900 1 6 30 9 9 6
Total 500 5000 6 37 170 50 50 37
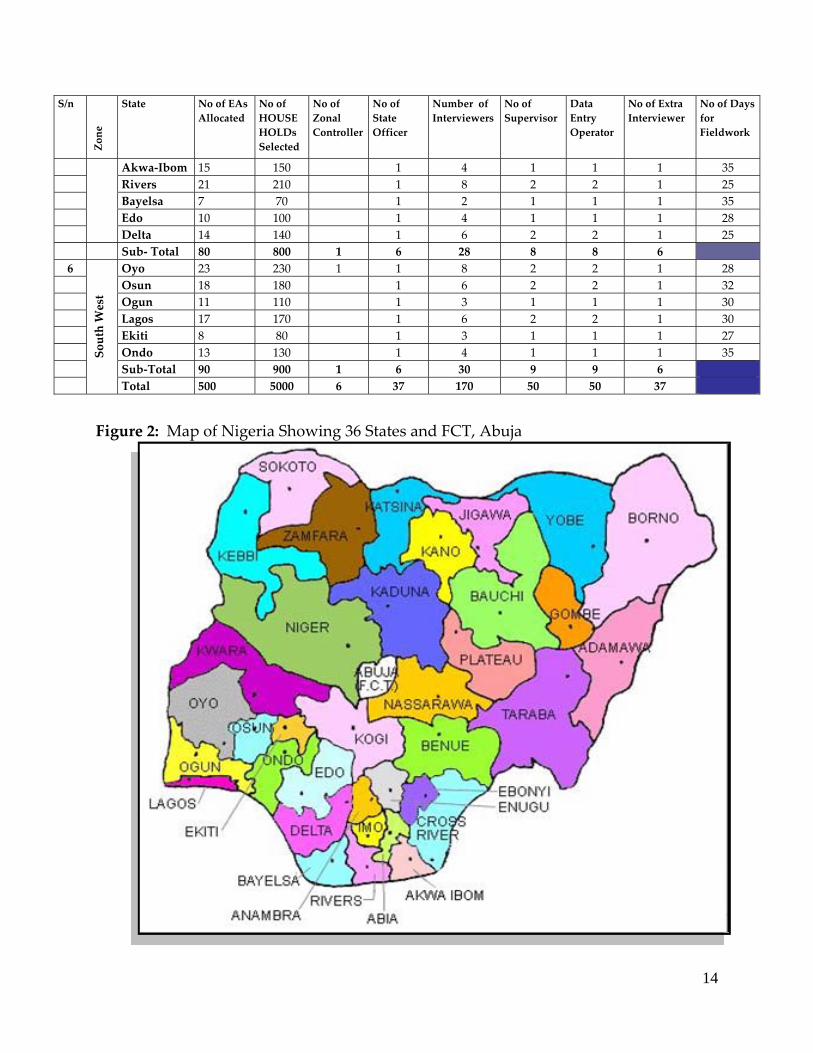
Figure 2: Map of Nigeria Showing 36 States and FCT, Abuja

15
Table 3.2 Distribution of the Population of Nigeria by State and Gender
2006 Nigeria Population Census State Male Female Total Population % Population
Abia 1,430,298 1,415,082 2,845,380 2.0%
Adamawa 1,607,270 1,571,680 3,178,950 2.3%
Akwa‐Ibom 1,983,202 1,918,849 3,902,051 2.8%
Anambra 2,117,984 2,059,844 4,177,828 3.0%
Bauchi 2,369,266 2,283,800 4,653,066 3.3%
Bayelsa 874,083 830,432 1,704,515 1.2%
Benue 2,144,043 2,109,598 4,253,641 3.0%
Borno 2,163,358 2,007,746 4,171,104 3.0%
Cross River 1,471,967 1,421,021 2,892,988 2.1%
Delta 2,069,309 2,043,136 4,112,445 2.9%
Ebonyi 1,064,156 1,112,791 2,176,947 1.6%
Edo 1,633,946 1,599,420 3,233,366 2.3%
Ekiti 1,215,487 1,183,470 2,398,957 1.7%
Enugu 1,596,042 1,671,795 3,267,837 2.3%
Gombe 1,244,228 1,120,812 2,365,040 1.7%
Imo 1,976,471 1,951,092 3,927,563 2.8%
Jigawa 2,198,076 2,162,926 4,361,002 3.1%
Kaduna 3,090,438 3,023,065 6,113,503 4.4%
Kano 4,947,952 4,453,336 9,401,288 6.7%
Katsina 2,948,279 2,853,305 5,801,584 4.1%
Kebbi 1,631,629 1,624,912 3,256,541 2.3%
Kogi 1,672,903 1,641,140 3,314,043 2.4%
Kwara 1,193,783 1,171,570 2,365,353 1.7%
Lagos 4,719,125 4,394,480 9,113,605 6.5%
Nasarawa 943,801 925,576 1,869,377 1.3%
Niger 2,004,350 1,950,422 3,954,772 2.8%
Ogun 1,864,907 1,886,233 3,751,140 2.7%
Ondo 1,745,057 1,715,820 3,460,877 2.5%
Osun 1,734,149 1,682,810 3,416,959 2.4%
Oyo 2,802,432 2,778,462 5,580,894 4.0%
Plateau 1,598,998 1,607,533 3,206,531 2.3%
Rivers 2,673,026 2,525,690 5,198,716 3.7%
Sokoto 1,863,713 1,838,963 3,702,676 2.6%
Taraba 1,171,931 1,122,869 2,294,800 1.6%
Yobe 1,205,034 1,116,305 2,321,339 1.7%
Zamfara 1,641,623 1,637,250 3,278,873 2.3%
Abuja FCT 733,172 673,067 1,406,239 1.0%
Nigeria 71,345,488 69,086,302 140,431,790 100.0%
16
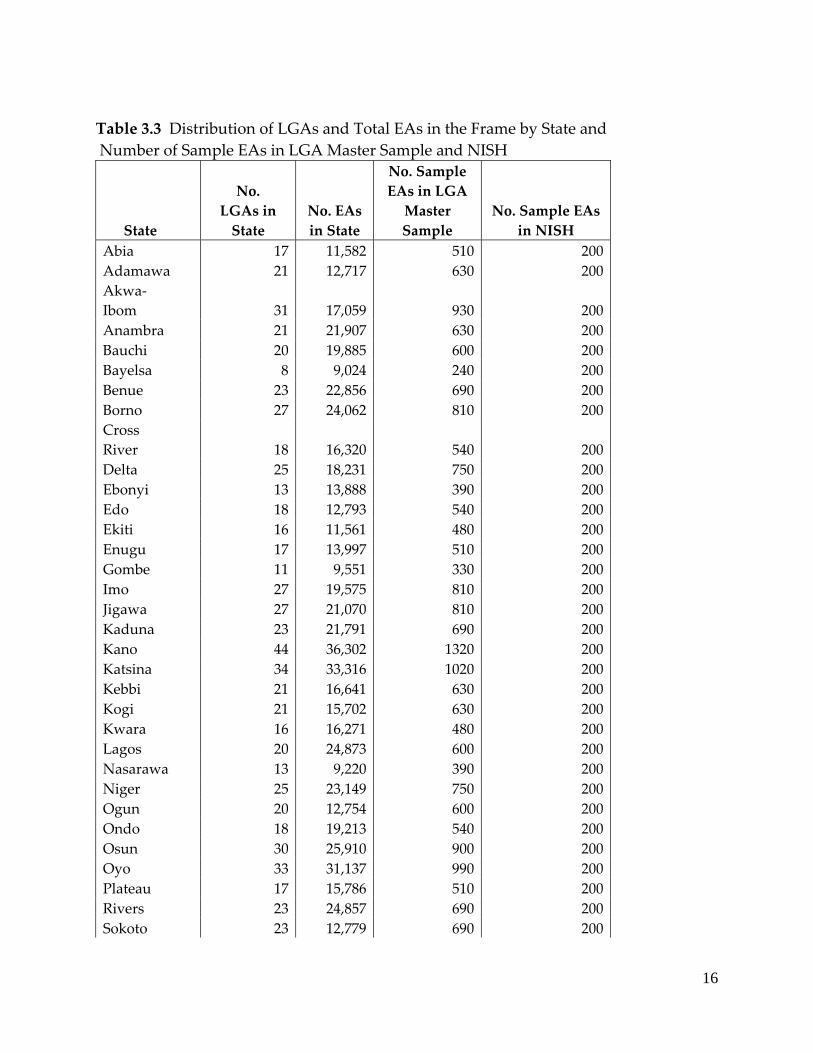
Table 3.3 Distribution of LGAs and Total EAs in the Frame by State and
Number of Sample EAs in LGA Master Sample and NISH
State
No.
LGAs in
State
No. EAs
in State
No. Sample
EAs in LGA
Master
Sample
No. Sample EAs
in NISH
Abia 17 11,582 510 200
Adamawa 21 12,717 630 200
Akwa‐
Ibom 31 17,059 930 200
Anambra 21 21,907 630 200
Bauchi 20 19,885 600 200
Bayelsa 8 9,024 240 200
Benue 23 22,856 690 200
Borno 27 24,062 810 200
Cross
River 18 16,320 540 200
Delta 25 18,231 750 200
Ebonyi 13 13,888 390 200
Edo 18 12,793 540 200
Ekiti 16 11,561 480 200
Enugu 17 13,997 510 200
Gombe 11 9,551 330 200
Imo 27 19,575 810 200
Jigawa 27 21,070 810 200
Kaduna 23 21,791 690 200
Kano 44 36,302 1320 200
Katsina 34 33,316 1020 200
Kebbi 21 16,641 630 200
Kogi 21 15,702 630 200
Kwara 16 16,271 480 200
Lagos 20 24,873 600 200
Nasarawa 13 9,220 390 200
Niger 25 23,149 750 200
Ogun 20 12,754 600 200
Ondo 18 19,213 540 200
Osun 30 25,910 900 200
Oyo 33 31,137 990 200
Plateau 17 15,786 510 200
Rivers 23 24,857 690 200
Sokoto 23 12,779 690 200

17
State
No.
LGAs in
State
No. EAs
in State
No. Sample
EAs in LGA
Master
Sample
No. Sample EAs
in NISH
Taraba 17 10,647 510 200
Yobe 17 14,921 510 200
Zamfara 14 17,025 420 200
FCT Abuja 6 4,157 240 200
Total 775 662,529 23,310 7,400
18
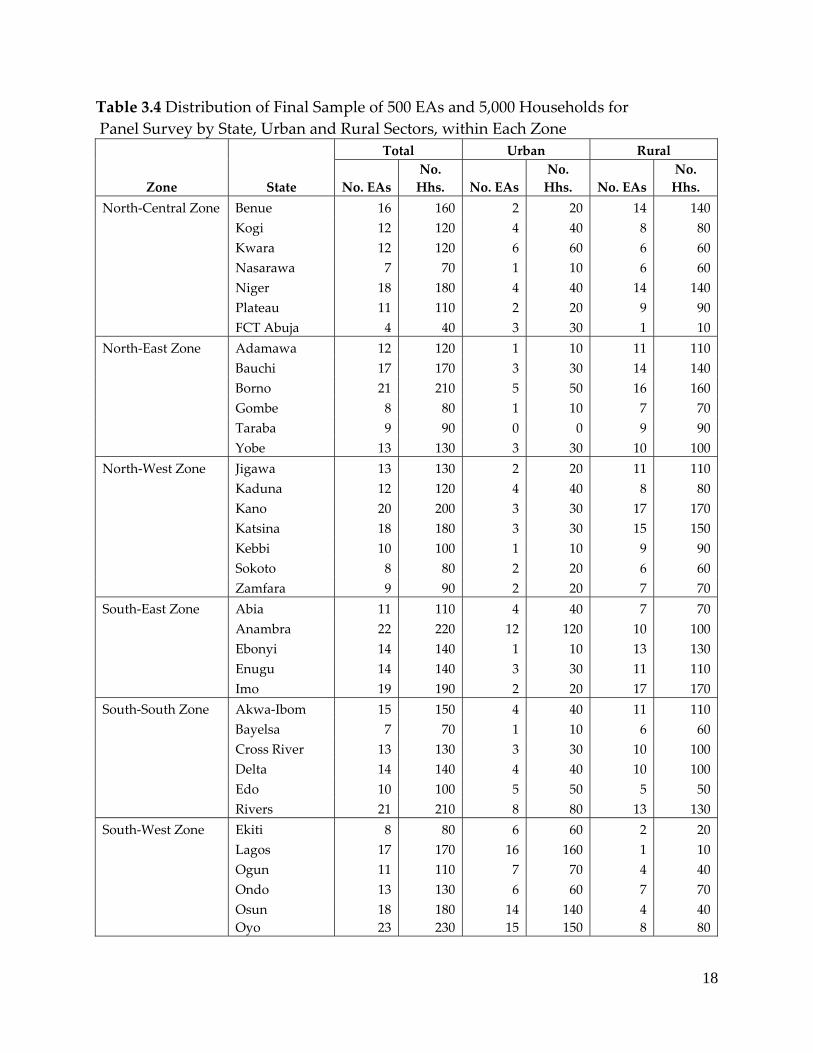
Table 3.4 Distribution of Final Sample of 500 EAs and 5,000 Households for
Panel Survey by State, Urban and Rural Sectors, within Each Zone
Zone
State
Total Urban Rural
No. EAs
No.
Hhs. No. EAs
No.
Hhs. No. EAs
No.
Hhs.
North‐Central Zone Benue 16 160 2 20 14 140
Kogi 12 120 4 40 8 80
Kwara 12 120 6 60 6 60
Nasarawa 7 70 1 10 6 60
Niger 18 180 4 40 14 140
Plateau 11 110 2 20 9 90
FCT Abuja 4 40 3 30 1 10
North‐East Zone Adamawa 12 120 1 10 11 110
Bauchi 17 170 3 30 14 140
Borno 21 210 5 50 16 160
Gombe 8 80 1 10 7 70
Taraba 9 90 0 0 9 90
Yobe 13 130 3 30 10 100
North‐West Zone Jigawa 13 130 2 20 11 110
Kaduna 12 120 4 40 8 80
Kano 20 200 3 30 17 170
Katsina 18 180 3 30 15 150
Kebbi 10 100 1 10 9 90
Sokoto 8 80 2 20 6 60
Zamfara 9 90 2 20 7 70
South‐East Zone Abia 11 110 4 40 7 70
Anambra 22 220 12 120 10 100
Ebonyi 14 140 1 10 13 130
Enugu 14 140 3 30 11 110
Imo 19 190 2 20 17 170
South‐South Zone Akwa‐Ibom 15 150 4 40 11 110
Bayelsa 7 70 1 10 6 60
Cross River 13 130 3 30 10 100
Delta 14 140 4 40 10 100
Edo 10 100 5 50 5 50
Rivers 21 210 8 80 13 130
South‐West Zone Ekiti 8 80 6 60 2 20
Lagos 17 170 16 160 1 10
Ogun 11 110 7 70 4 40
Ondo 13 130 6 60 7 70
Osun 18 180 14 140 4 40
Oyo 23 230 15 150 8 80
19
3.2 Sample Selection
The GHS Panel Survey used a two stage stratified sample selection process.
First Stage
The Primary Sampling Units (PSUs) were the Enumeration Areas (EAs). These were
selected based on probability proportional to size (PPS) of the total EAs in each state
and FCT, Abuja and the total households listed in those EAs.
Second Stage
The second stage involved the systematic selection of ten (10) households per EA. This
involved obtaining the total number of households listed in a particular EA, and then
calculating a Sampling Interval (S.I) by dividing the total households listed by ten (10).
The next step is to generate a random start ‘r’ from the table of random numbers which
stands as the 1st selection. The second selection is obtained by adding the sampling
interval to the random start. For each of the next selections, the sampling interval was
added to the value of the previous selection until the 10th selection is obtained.
Determination of the sample size at the household level was based on the experience
gained from previous rounds of the GHS, in which 10 HHs per EA are usually selected
and give robust estimates.
4.0 Organization of the Survey
4.1 Survey Management The GHS Panel Survey was executed by the National Bureau of Statistics and some
technical staff from the Federal Ministry of Agriculture and Rural Development
(FMA&RD), the Federal Ministry of Water Resources (FMWR) and the National Food
Reserve Agency (NFRA). Other stakeholders from Academia, Ministries, Departments,
Agencies (MDAs) and Development Partners contributed immensely in the
development of the survey instruments. Also, some staff and consultants assisted
greatly throughout the duration of the survey implementation under the direction of
the Statistician General and the Management Team which included the Technical
Committee members. The Management Team was responsible for questionnaire
design, recruitment of personnel, training of personnel and the implementation of the
survey.

20
4.2 Training of Field staff and Data Entry Operators Two (2) levels of training were mounted for the survey. The 1st level was organized at
NBS Headquarters in Abuja and was called the Training of trainers (TOT). The
participants at the TOT were the trainers for the 2nd level training. The top
management team of the survey participated in the TOT. The persons trained in the
TOT were then sent to carry out the level 2 training: four (4) resource persons were sent
to each of the three training centers, Ibadan (Oyo State) for North Central (NC) and
South West (SW) zones Kaduna (Kaduna State) for North East NE and North West
(NW) and Calabar (Cross‐River State) for South‐South (SS) and South East (SE) zones to
perform the training. Included in the team was one (1) resource person per training
venue who served as IT trainer. The TOT lasted for five (5) days. The core training
materials for the 2nd level training were harmonized and finalized during the TOT.
The 2nd level training was held at the three (3) designated centres. This training was
provided to the Zonal Controllers, State Officers, Field Officers, Field Interviewers and
Data Entry Operators and lasted for sixteen days. Training instructions were given to
the field staff by the resource persons from the management team with help from
World Bank technical missions. The training consisted of (i) classroom instruction on
the questionnaire, concepts and definitions, (ii) interview techniques, and (iii) methods
and field practices in performing actual interviews to ensure that field interviewers
fully understood the questionnaire. Most of the training instructions are detailed in the
interviewer’s and supervisor’s manuals which are also available.
At the end of the training session, trainees were assessed according to a test that was
administered on the material covered in the training process, and an evaluation by the
resource persons. The data entry operators were trained along with the field staff and
separate training sessions were conducted for them throughout the duration of the
training. At the end of the training, field teams were formed of interviewers,
supervisors and data entry operators. An additional person, per state was kept on the
reserve list in case any interviewer needed to be replaced.. The data Entry Operators
underwent additional one (1) week training in the course of the fieldwork.
4. 3 Organization of Fieldwork Fieldwork started on 31st of August, 2010 and was carried out simultaneously
throughout the country till mid October, 2010. All three (3) questionnaires; Household,
Agriculture and Community were used to collect information on Post‐Planting
activities. Data were collected by teams comprised of a supervisor, 2‐4 interviewer(s)

21
and a data entry operator. The number of team(s) varied from state to state depending
on the sample size (number of EAs selected. The teams moved in a roving manner and
data collection lasted for between 25 – 35 days. (See table 3.1 above.)
4.3.1 Roles and Responsibilities of Field staff
Interviewers:
Among the roles and responsibilities of interviewers were:
To participate actively in training and complete the training course
To study the manual and other instructions carefully in order to understand
them fully
To comply with instructions and recommendations contained in the manual and
any instructions given by persons responsible for the survey, including
supervisors and management/technical team
To carry out interviews through personal visits to households to interview each
individual as specified in each questionnaire module and to collect information
directly. It should be noted that the interviewer’s task cannot be delegated or
transferred to anybody else.
To complete interviews with all household members. To visit as many times as
necessary, in order to find direct respondents, to correct inaccurate information
or to complete incomplete information. The interviewer is obliged to make
himself/herself fully available for work in the panel survey, thus he/she must be
available for carrying out the survey tasks at anytime the respondent specifies as
the most convenient for him/her; weekends, holidays, evenings etc.
During the interviews, to behave professionally and formally in accordance with
the important work he/she performs
To visit households in decent and professional outfit, bearing in mind that this is
an important aspect of ensuring cooperation from the household and good
quality data
To come to work on time according to the supervisor’s instructions
To insert occupation and other codes after the interview as instructed in the
manual
To complete the given assignment on a daily basis and to hand over to the
supervisor all completed questionnaires with the information properly recorded
To perform all scheduled interviews at the time they are planned. Where it is not
possible to interview any of the selected households, the interviewer should

22
inform his/her supervisor, who will take the decision on necessary changes in
accordance with appropriate procedures
Supervisors
Among the tasks and responsibilities of the supervisors were:
Examining questionnaires in order to make sure that each interview has been
carried out correctly and in full. If reports from data entry require returning to
the household, the supervisor must communicate the necessary information that
is missing from the questionnaire.
Visiting some of the households that the interviewers had visited. He/she must
repeat some sections of the questionnaire in order to verify that the interviewer
recorded that household’s answers correctly
Observe interviewers during the interview process in order to evaluate the
method of asking questions
Discuss the work with the interviewers and evaluate the work from the data
entry reports
The supervisor is the link between the interviewer and the field management
team. Hence, he/she must be informed of any difficulties or problems that the
interviewer may encounter. If the interviewer does not understand a procedure,
he/she must ask the supervisor for advice.
4.3.2 Fieldwork Monitoring and Evaluation
To ensure that good quality data are collected, a monitoring exercise was mounted.
Monitoring and evaluation guidelines and formats for fieldwork were developed. One
(1) monitor was assigned to 2 – 4 states and all the states and FCT, Abuja were covered.
There were three levels of monitoring and evaluation, the first and the third levels were
carried out by NBS state officers and zonal controllers while the second level was
carried out by the technical team which was comprised of the National Bureau of
Statistics (NBS), the Federal Ministry of Agriculture and Rural Development
(FMA&RD), the National Food Reserve Agency (NFRA) headquarter staff, World Bank
officials and consultants.
The monitors made sure that proper compliance with the laid down procedures as
contained in the manual were followed, effected necessary corrections and tackled
problems that arose. The monitoring exercise was arranged such that the first level took
place at the commencement of the fieldwork, and the third level not later than a week

23
before the end of the data collection exercise. In‐between these two, the technical team
visited all the states of the federation and FCT, Abuja. While NBS state officers
monitored in their state, the zonal controllers monitored in at least two (2) states (the
zonal headquarters state and one other state of the same zone). The 1st and 2nd rounds
of the monitoring exercise lasted for nine (9) days while the 2nd round by the technical
team lasted for eight (8) days. Monitoring instruments were developed and discussed
during both training of trainers and zonal training.
4.4 Field Work Problems, Challenges, Lessons Learned and Proffered Solutions Some of the problems, challenges, lessons learned and some solutions proffered are
highlighted below:
Data entry: As would be expected when introducing new field methods such as the
concurrent data entry in the field, some problems arose. Overall the data entry in the
field served as a useful quality control mechanism and improved the quality of the data.
However, some issues that will need to be addressed going forward are;
Some of the data entry operators found the new system challenging: it is
recommended to add more training time to this process.
Provision of field vehicles with charging facilities for the data entry equipment
was an added advantage
Challenges on how to send data via internet to NBS headquarters, in part due to
poor connections but also due to inexperience of data entry operators with the
use of the internet. Specific training on this aspect will be needed in the next
round along with alternative connection methods.
The concurrent data entry system requires that the data from each questionnaire
be entered electronically and a list of errors, inconsistencies and missing data
produced. This list is then used by the supervisor to determine if a household
needs to be re‐visited and the interviewer is responsible for correcting any errors
on the list. There were some problems in effective managing of data problems
while the teams were in the field like in regards to printing and the correct
reading of error messages. Again, additional training will need to be provided in
the training for the second visit.
Sampling: Each interviewer was provided a list of addresses of the households in the
sample that they were responsible to interview. There were some problems of EA
and HH replacement that were not done according to plan. One cause of this may
have been the fact that the EAs listing had been done with a substantial gap between
it and the actual field work.
A re‐listing exercise is suggested before the next survey is done
24
It will also be important to improve the training on and the supervision of the
method of replacement used in the field.
Geographical codes: The statistical system of the country is decentralized to some
extent, with the central office of the NBS working with six zonal offices and 36 state
(plus FCT) offices. It was discovered during the field work that there is different
codes are in use in the states and headquarters for LGAs, EAs and replicate
identification codes (RIC)
It is recommended that work be done to harmonize all geographic codes
before another round of field work is done. This will benefit all surveys, not
just the GHS.
GPS: The GHS‐Panel used GPS equipment to take the coordinates of both the
dwelling and each plot owned by the household. Additionally, the GPS units were
used to measure the area of the plots. One GPS unit was allocated to each field
team. Given the number of plots of land and the needs of 2‐4 interviewers to
measure all of this, it was determined that one GPS unit per team is not sufficient to
collect the amount of data required.
It may be necessary to procure additional GPS units for the next wave,
depending on many households in the GHS‐Panel relocate or how many new
plots need to be measured.
5.0 Data Entry and Data Management
5.1 Data Entry
This survey used the concurrent data entry approach. In this method, the fieldwork and
data entry was handled by one or two teams assigned to the state. Each team consisted of
a field supervisor, 2‐4 interviewers and a data entry operator. Immediately after the data
were collected in the field by the interviewers, the questionnaires were handed over to the
supervisor to be checked and documented. The questionnaires were then passed to the
data entry operator at the end of each day of fieldwork for entry. After the questionnaires
were entered the data entry operator generated an error report which reported issues
including out of range values and inconsistencies in the data. The supervisor then checked
the report, determined what should be corrected, and decided if the field team needed to
revisit the household to obtain additional information. The benefits of this method were:
To capture errors that might have been overlooked by a visual inspection only,
To identify errors early during the field work so that if any correction required a
revisit to the household, it could be done while the team was still in the EA.
25
The CSPro software was used to design the specialised data entry program that was used
for the data entry of the questionnaires.
5.2 Data Cleaning The data cleaning process was done in a number of stages. The first step was to ensure
proper quality control during the fieldwork. This was achieved in part by using the
concurrent data entry system which was, as explained above, designed to highlight many
of the errors that occurred during the fieldwork. At this stage errors that are caught at the
fieldwork stage are corrected based on re‐visits to the household on the instruction of the
supervisor. The data that had gone through this first stage of cleaning was then sent from
the state to the head office of NBS where a second stage of data cleaning was undertaken.
During the second stage the data were examined for out of range values and outliers. The
data were also examined for missing information for required variables, sections,
questionnaires and EAs. This problem was then reported back to the state where the
correction was then made. This was an ongoing process until all data were delivered to
the head office.
After all the data were received by the head office, there was an overall review of the data
to identify outliers and other errors on the complete set of data. Where problems were
identified, this was reported to the state. There the questionnaires were checked and
where necessary the relevant households were revisited and a report sent back to the head
office with the corrections.
The final stage of the cleaning process was to ensure that the households and individuals
were correctly merged across all sections of the household questionnaire. Special care was
taken to see that the households included in the data matched with the selected sample
and where there were differences these were properly assessed and documented. The
agriculture data were also checked to ensure that the plot identified in the main sections
merged with the plot information identified in the other sections. This was also done for
crop by plot information as well.
5.2.1 Data Cleaning Challenges The cleaning process at the head office was impeded by the fact that the questionnaires
were not immediately available for inspection when problems were identified in the
data. The questionnaires were retained by the state in case there was the need for
household revisits. So whenever problems were identified at the head office, the state

26
office had to be contacted in order to determine if the suspect data were the same as the
information on the questionnaire, and to ensure that changes were captured in both
places. This was a very cumbersome and time consuming process since communication
was difficult and in many instances the response was not timely. However, this is a
necessary process to ensure that the households can be re‐visited to provide the correct
information to avoid having to make imputations. Also, this process allows the state
officers to understand the key issues that arose during field work and will serve to
enhance further rounds of data collection. It will be important, nonetheless, to find a
mechanism to facilitate this process in the next round of data collection and cleaning.
A second challenge in data management and cleaning was the difficulty faced by state
offices in sending the data from the state to the head office. There were difficulties in
accessing internet facilities in many of the EAs and surrounding areas where the field
teams were active. The consequence of this was that the data were not sent to the head
office until the teams returned to state capitals where, due to the distance, it was
difficult to return to the EAs for household revisits when requested by the head office.
This issue will need to be addressed for future rounds of the survey.
5.3 Weighting of Data When a sample of households is selected for a survey, these households represent the
entire population of the country. To accurately use the data sets, the data must be
weighted to reflect the distribution of the full population in the country. A population
weight was calculated for the panel households. This weight variable (WGHT) has
been included in the household dataset: Section A (SECTA). When applied, this weight
will raise the sample households and individuals to national values adjusting for
population concentrations in various areas.
5.4 Description of the Datasets The data from the GHS‐Panel (Post Planting 2010) are available free of charge to any
individual or organization interested in carrying out analyses of them. At present, two
data sets are available: the household data set which corresponds to the Household
Questionnaire and the agricultural data set which corresponds to the Agricultural
Questionnaire. An additional data set will be available when the GHS‐Panel (Post
Harvest 2011) data are finalized. These additional data are those that correspond to the
Community Questionnaire. Also, the consumption data in the Household
Questionnaire will be released once the Post‐Harvest data are analyzed.

27
Note that, for purposes of maintaining the confidentiality of the data all names and
addresses have been removed from the data set. Additionally, the GPS coordinates have
also been removed as these could be used to locate households and plots with accuracy.
Various approaches to use of the GPS data are available: the user who is interested in
these data is requested to contact NBS directly to discuss how these can be used.
The two sets of data correspond with one of the two questionnaires. In the case of the
household questionnaire, there is total of 16 data files of which 13 are available (the
remaining three on consumption will be available with the Post Harvest data in October
of 2011). Table 5.1 shows the sections of the questionnaire and the data set that
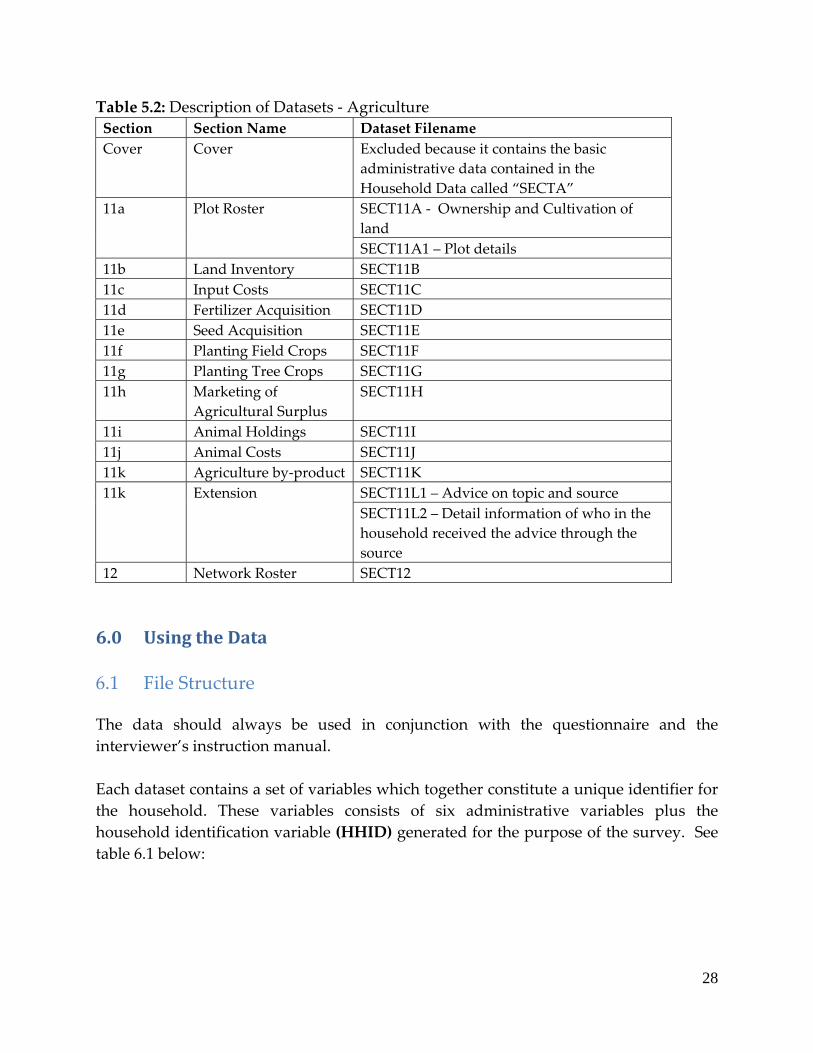
correspond to these. In the case of the agriculture questionnaire, there are a total of 13
data files. Table 5.2 shows the sections of the questionnaire and the data set that
correspond to these.
As seen from Table 5.1 and Table 5.2, the file naming scheme is a combination of the
prefix ʹSECTʹ followed Section number. For example, the data set that corresponds with
the section 1 of the household questionnaire is called ‘SECT1’. The exception to this
rule is in section 8 of the household questionnaire where the files have been broken into
5 files with each file corresponding with the reference period collected in the section.
Table 5.1: Household Datasets
Section Section Name Dataset Filename
Cover Cover SECTA
1 Roster SECT1
2 Education SECT2
3 Labour SECT3
4 Credit and Savings SECT4
5 Household Assets SECT5
6 Non‐farm Enterprises SECT6
7A Meals Away From Home SECT7A
7B Household Food Expenditures SECT7B
8 Household Non‐food
Expenditures
SECT81 – Expenditure in the past 7 days
SECT82 – Expenditure in the past month
SECT83 – Expenditure in the past six months
SECT84 – Expenditure in the past twelve months
SECT85 – Expenditure on twelve months recall
9 Food Security SECT9
10 Other Income SECT10
28
Table 5.2: Description of Datasets ‐ Agriculture
Section Section Name Dataset Filename
Cover Cover Excluded because it contains the basic
administrative data contained in the
Household Data called “SECTA”
11a Plot Roster SECT11A ‐ Ownership and Cultivation of
land
SECT11A1 – Plot details
11b Land Inventory SECT11B
11c Input Costs SECT11C
11d Fertilizer Acquisition SECT11D
11e Seed Acquisition SECT11E
11f Planting Field Crops SECT11F
11g Planting Tree Crops SECT11G
11h Marketing of
Agricultural Surplus
SECT11H
11i Animal Holdings SECT11I
11j Animal Costs SECT11J
11k Agriculture by‐product SECT11K
11k Extension SECT11L1 – Advice on topic and source
SECT11L2 – Detail information of who in the
household received the advice through the
source
12 Network Roster SECT12
6.0 Using the Data
6.1 File Structure The data should always be used in conjunction with the questionnaire and the
interviewer’s instruction manual.
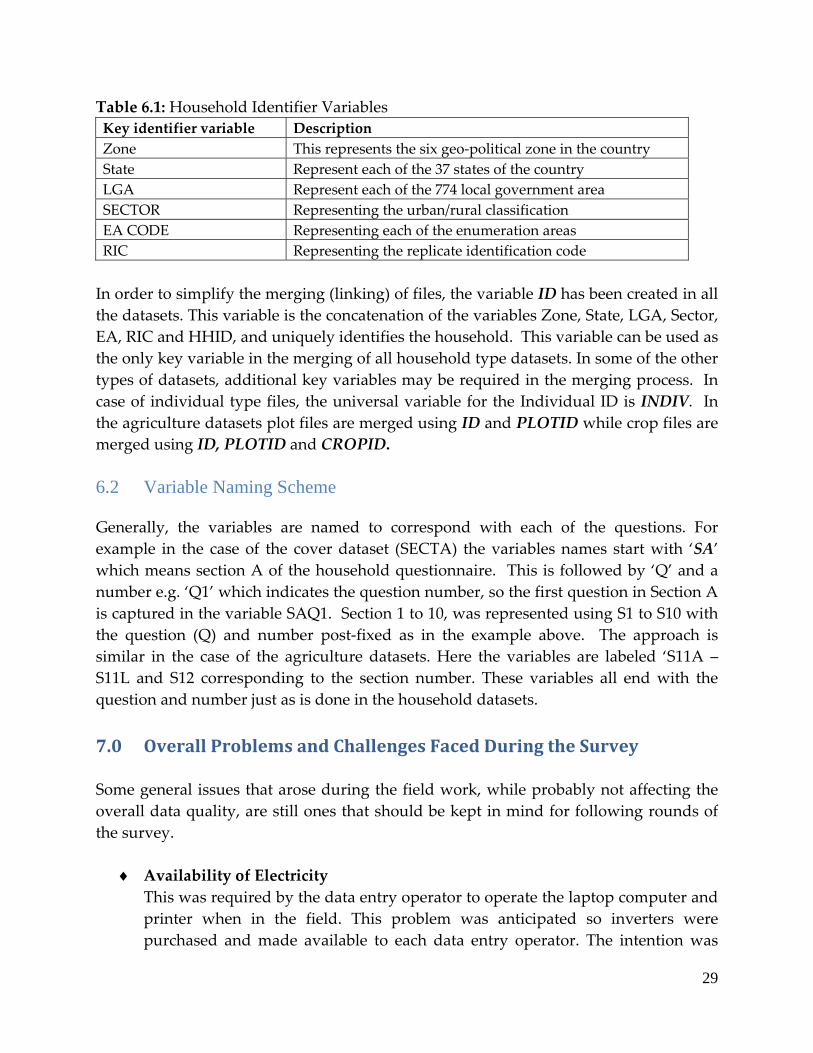
Each dataset contains a set of variables which together constitute a unique identifier for
the household. These variables consists of six administrative variables plus the
household identification variable (HHID) generated for the purpose of the survey. See
table 6.1 below:
29
Table 6.1: Household Identifier Variables
Key identifier variable Description
Zone This represents the six geo‐political zone in the country
State Represent each of the 37 states of the country
LGA Represent each of the 774 local government area
SECTOR Representing the urban/rural classification
EA CODE Representing each of the enumeration areas
RIC Representing the replicate identification code
In order to simplify the merging (linking) of files, the variable ID has been created in all
the datasets. This variable is the concatenation of the variables Zone, State, LGA, Sector,
EA, RIC and HHID, and uniquely identifies the household. This variable can be used as
the only key variable in the merging of all household type datasets. In some of the other
types of datasets, additional key variables may be required in the merging process. In
case of individual type files, the universal variable for the Individual ID is INDIV. In
the agriculture datasets plot files are merged using ID and PLOTID while crop files are
merged using ID, PLOTID and CROPID.
6.2 Variable Naming Scheme Generally, the variables are named to correspond with each of the questions. For
example in the case of the cover dataset (SECTA) the variables names start with ‘SA’
which means section A of the household questionnaire. This is followed by ‘Q’ and a
number e.g. ‘Q1’ which indicates the question number, so the first question in Section A
is captured in the variable SAQ1. Section 1 to 10, was represented using S1 to S10 with
the question (Q) and number post‐fixed as in the example above. The approach is
similar in the case of the agriculture datasets. Here the variables are labeled ‘S11A –
S11L and S12 corresponding to the section number. These variables all end with the
question and number just as is done in the household datasets.
7.0 Overall Problems and Challenges Faced During the Survey
Some general issues that arose during the field work, while probably not affecting the
overall data quality, are still ones that should be kept in mind for following rounds of
the survey.
Availability of Electricity This was required by the data entry operator to operate the laptop computer and
printer when in the field. This problem was anticipated so inverters were
purchased and made available to each data entry operator. The intention was

30
that these inverters would be connected to the cigarette lighter socket or battery
of the vehicle that was providing transportation for the team. By so doingʹ
electrical power would be generated to run the laptop and printer.
Unfortunately, in most cases, no vehicle was available since the team was simply
transported and left at the location. In addition some of the locations could only
be accessed by motorcycles which did not have the facility to operate the
inverters.
In order to alleviate this problem, special provision had to be made for the
purchase or renting of portable generators. This proved to be a satisfactory
solution to the problem.
Flooding Many roads leading to the rural EAs were very bad and were flooded during the
rainy season. In rural areas, movement was difficult as only motorcycles were
able to access some of the rural EAs. Using these motorcycles turned out to be
more expensive than the taxis or vans that normally travelled those routes. In
addition, in the flooded areas it was not possible to collect any information about
the farms since these farms were under water.
Malfunctioning of GPS: In some states, a number of the allocated GPS units malfunctioned and
consequently reduced the number of farms that it was anticipated would have
been covered in a given period of time. These GPS units were eventually
replaced but unfortunately not before some delays were incurred.