basic market feasibility analysis steps & tools feasibility... · changing behavior source: ny...
TRANSCRIPT

ChangingBehavior
Source: NY Times
Basic Market Feasibility Analysis
Steps & Tools
Wednesday, May 8, 2013
NEDA SPRING CONFERENCE PRE‐SESSION WORKSHOP
presented byShawn Kaskie

Topics
1. UNK, CRRD, and our outreach services2. Marketing Overview – Focus on Feasibility3. Sales Forecasting Methods and Resources4. Sources of Success/Innovative Practices5. Key Industries Trends and Data Sources
Synergy: Individual businesses working together to be more successful than if they were working alone.
2

1. Our Focus
COLLEGE OF BUSINESS & TECHNOLOGY
Providing student‐centered educational opportunities including experiential learning;
Advancing knowledge through applied and pedagogical scholarship;
Providing service to our stakeholders

What we doLocal Experts in Many Fields ‐ Faculty Consulting
Software development
Economic impact studies
Pricing studies
Marketing research
Marketing planning
Sales training
Strategic planning
Feasibility analysis
Leadership development
Statistical analysis
Transportation efficiency
Web marketing
Quality control and improvement
Process analysis and improvement
IT training

Student Consulting“We value experiential, hands‐on learning”
Marketing research studies
Advertising plans
Marketing plans
Web marketing projects
• New venture plans
• Habitat for Humanity
• Translators
• Quality improvement projects
• Database projects

CRRD Gov’t
EconomicDevelopers
Business University
STAGE 1
NASCENT ENTREPRENEUR
STAGE 2
NASCENT ENTREPRENEUR ACQUIRES ENTREPRENURIAL KNOWLEDGE AND SKILL‐SETS
STAGE 3
NASCENT ENTREPRENEUR BECOMES A NEBRASKAN ENTREPRENEUR DOING BUSINESS IN A GLOBAL MARKETPLACE
Role of CRRD in Encouraging Rural Entrepreneurship in Global Marketplace

Other Programs & Activities: Entrepreneurship EducationBaldwin Free Enterprise
Seminar Series
Nebraska State Agency Director Lecture Series
EntrepreneurshipNetworking Group facilitation• UNK Business Innovation Summit •Eship CONTESTS• SPEAKER SERIES
• STATE FAIR•Marketplace CFRA• ENTRENEUR IN RESIDENCE•RURAL SOURCINGGlobal Scholars
Seminar Series
& International Business
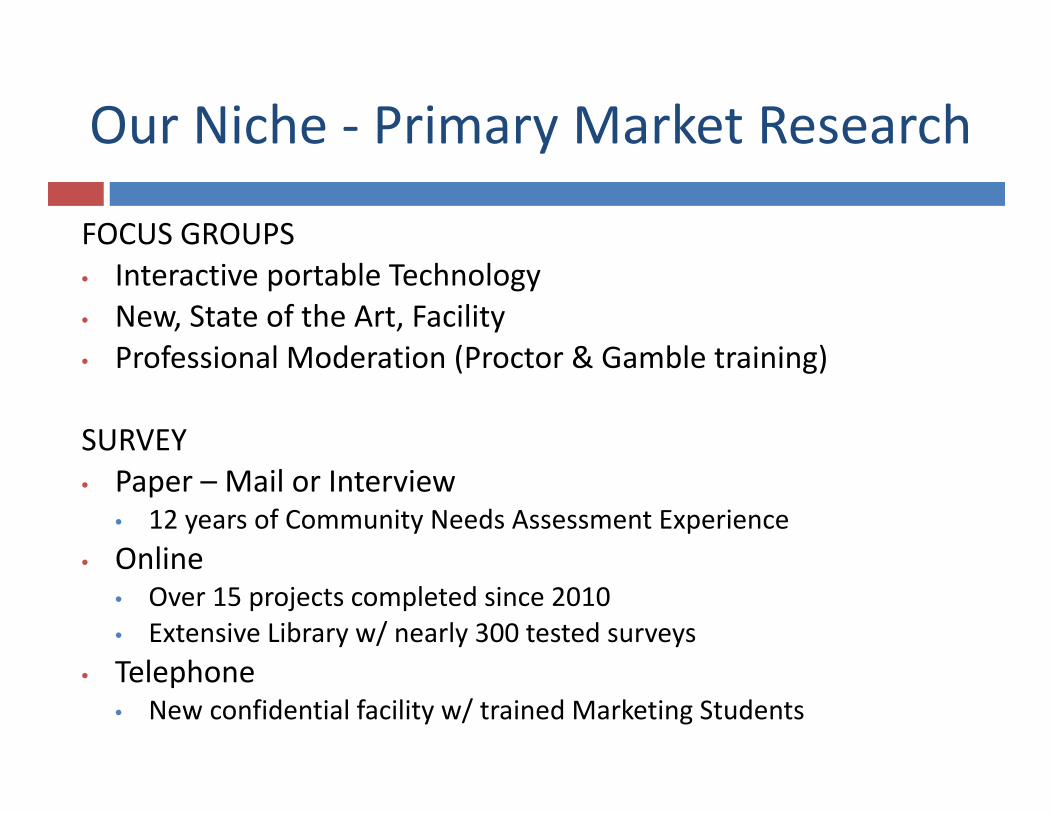
Our Niche ‐ Primary Market Research
FOCUS GROUPS• Interactive portable Technology• New, State of the Art, Facility• Professional Moderation (Proctor & Gamble training)
SURVEY• Paper – Mail or Interview
• 12 years of Community Needs Assessment Experience • Online
• Over 15 projects completed since 2010• Extensive Library w/ nearly 300 tested surveys
• Telephone• New confidential facility w/ trained Marketing Students

2. What is Marketing?
Marketing is EVERYTHINGentrepreneur do to promote thebusiness, from the moment
entrepreneur conceive of it to the pointat which customers buy theproduct or service and beginto patronize the business on
a regular basis.
The key words to rememberare everything and regular basis.
‐ Jay Conrad Levinson

Traditional Marketing Elements
Three “parts” to the marketing process:RESEARCHANALYSIS
STRATEGIES and TACTICS
The “P’s of Marketing” that will guide the research, analysis and strategies:
PRODUCTPRICE
PROMOTIONPLACEMENT(& PEOPLE!)

Determining the MARKET POTENTIAL
Research > Industry Trends, potential issues
Analysis > What’s the best chance to access to this industry based on these trends, issues, and typical customer profile

3. Parts of Market Analysis
1. Determine the “PROFILE” of the customer
2. Determine the MARKET AREA‐geographic boundaries and size
3. Determine the number of people (or businesses) in the trade territory who potentially “FIT” the customer profile
4. Determine the MARKET POTENTIAL for the business in the trade area
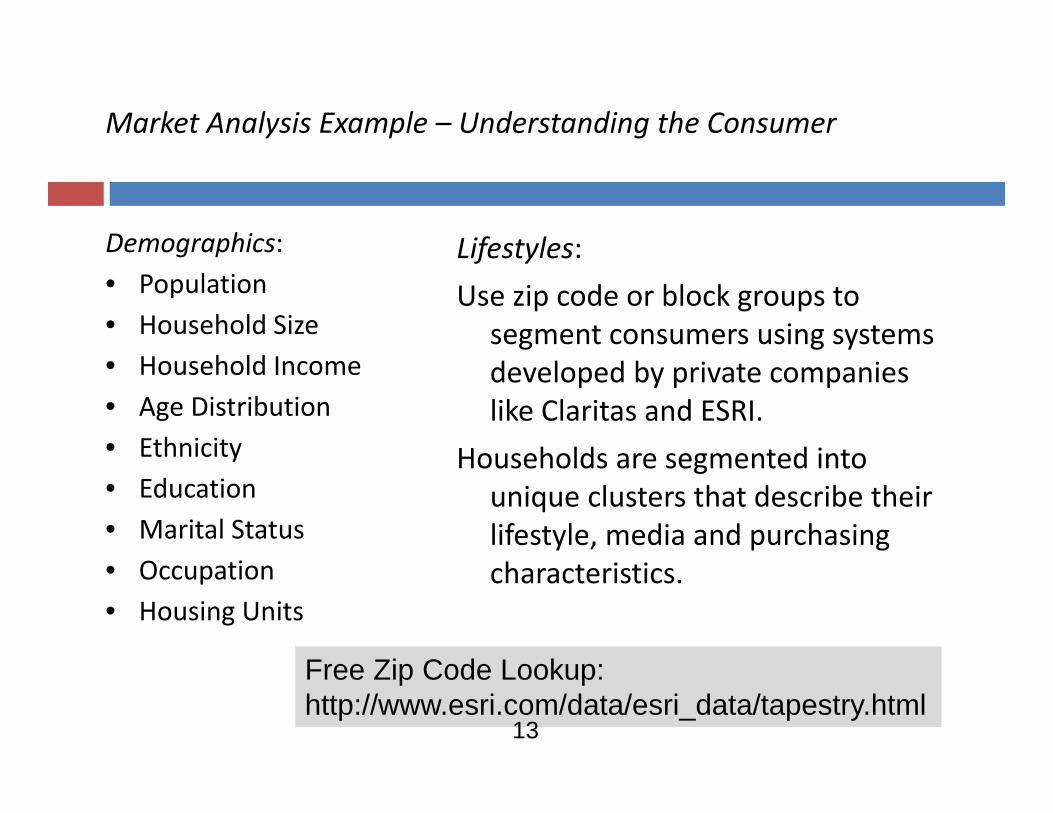
Demographics:• Population• Household Size• Household Income• Age Distribution• Ethnicity• Education• Marital Status• Occupation• Housing Units
Lifestyles:Use zip code or block groups to
segment consumers using systems developed by private companies like Claritas and ESRI.
Households are segmented into unique clusters that describe their lifestyle, media and purchasing characteristics.
Free Zip Code Lookup:http://www.esri.com/data/esri_data/tapestry.html
Market Analysis Example – Understanding the Consumer
13

Free Sources
For Secondary Market Research

Free Sources
For Secondary Market Research

Market Analysis Example –Defining the Trade Area
16

Sample Market Research
B2B EXAMPLE: Top Employers in Industry within 50m 68847.xls
Sample Company Report (Little Mexico of Kearney‐HANDOUT)
HOW TO USE THIS DATA (SAMPLE HANDOUT FROM KEARNEY MEXICAN RESTAURANTS)

USE SEVERAL METHODS OF ANALYSIS
AVERAGE SALE PRICE PER UNIT X UNITS SOLD PER TIME PERIOD
SOCIO DEMOGRAPHIC POTENTIAL…SALES PER HOUSEHOLD
COMPEITITIVE MARKET SHARE
INDUSTRY SALES PER SQUARE FOOT AVG (BIZ MINER HANDOUT)
Percent Capture Rate (traffic or foot count)
OTHER INDUSTRY RATIOS

AVERAGE SALE PRICE PER UNIT X UNITS SOLD PER TIME PERIOD
Target Market Total # in your trade
area
# that fit your profile
Estimated Market Share
Of those that fit, to
how many
can you actually
sell?
Quantity per sale
# of times per year customer
would buy
Expected price per
unit
Expected Sales Volume
(A) (B) (C) (D) (multiply A x B x C x D)
Individuals
0 0
0
0Businesses
0
0
0TOTAL 0
Annual Sales Volume Projection Worksheet
Determining Market Potential--Projecting Sales Volume

SOCIO DEMOGRAPHIC POTENTIAL…SALES PER HOUSEHOLD
Example of: Kearney Mexican Restaurant36,00014,000
TIMES/X annual amount spent eating out per home for area $2,671 37,398,340$ Filter: TIMES/X % choosing Mexican when eating out (0.047)** 4.7% 1,757,722$ Filter: DIVIDE BY # of other Mexcan restaurants in area(competitors)* 13 135,209$ *ASSUMPTIONS: This is based on ALL types of Mexican restaurants. But limiting the number of competitors to FULL‐Service Mexican restaurants (5 in this example), total revenue estimated would remain under $300,000 assuming average(7.7%) market share. Due to an assumption of market saturation. A new venture must "take" market share from most likely competitors (indepenedent owned full service restaurants)** The assumption of 4.7% choosing Mexican when eating is based on a national study. This percentage will vary based on target market socio‐economic preferences.
Population w/in 15 minute drive (area/target market geography) of site/locationFilter: # of Households
Sample Method for Estimating Gross Sales:

COMPEITITIVE MARKET SHARE Analysis
SAMPLE DATA OUTPUT FROM REFERENCE USA, HOOVERS (15 MILE RADIUS OF LOCATION/COUNTY): KEARNEY MEXICAN RESTAURANTSCompany Name City Location Sales Volume Actual % Market Share Location Type Last Updated On Years In DatabaseAmigos/Kings Classic Kearney $739,000 9.3% Branch 201302 27Amigos/Kings Classic Kearney $972,000 12.3% Branch 201302 22Big City Burrito Kearney $350,000 4.4% Single Loc 201302 6Fiesta Mexicana II Gibbon $77,000 1.0% Single Loc 201302 17La Mexicana Gibbon $39,000 0.5% Single Loc
Little Mexico Kearney $1,361,000 17.2% Single Loc 201302 19Qdoba Mexican Grill Kearney $583,000 7.4% Branch 201302 3Taco Bell Kearney $622,000 7.9% Branch 201210 18Taco John's Kearney $778,000 9.8% Branch 201302 30Taco John's Kearney $661,000 8.3% Branch 201302 4
Carlos O Kelly's Kearney $1,361,000 17.2% Branch
El Poprero Kearney $311,000 3.9% Single LocSan Pedro's Mexican Kearney $63,000 0.8% Single LocTOTAL OR AVERAGE $7,917,000 7.7% Chipolte Sales per Sq. ft $719
SOURCE: BIZ MINER… ASK UNK NBDC OFFICE

INDUSTRY SALES PER SQUARE FOOT AVG
Example
$400 sq. ft.
x
2,800 ft.
= $1.12 mil
In annual $

Capture Rate (traffic or foot
count)
23,000 carsx
.02% capture…

What do I do with this consumer info:
BUILD A SALES LIST!

Online Clearinghouse
Case studies of retail and service businesses that are Innovative
Searchable by Type of business Size of community
Eventually include hundreds of businesses from small to medium sized downtowns
http://www.uwex.edu/ces/cced/downtowns/innovative/
4. Encouraging Innovative Businesses
25

• Retail will be impacted by a slow economic recovery.• How some downtown retailers have/will respond:Add value – quality goods and more attentive serviceExhaust alternative markets (e‐commerce, business‐to‐business)
Cultivate niche marketsFind customers who are not price sensitiveDevelop customer loyalty programs
Drawn from: N David Milder
26
5. Changing Consumers & KEY STRATEGIES to adapt
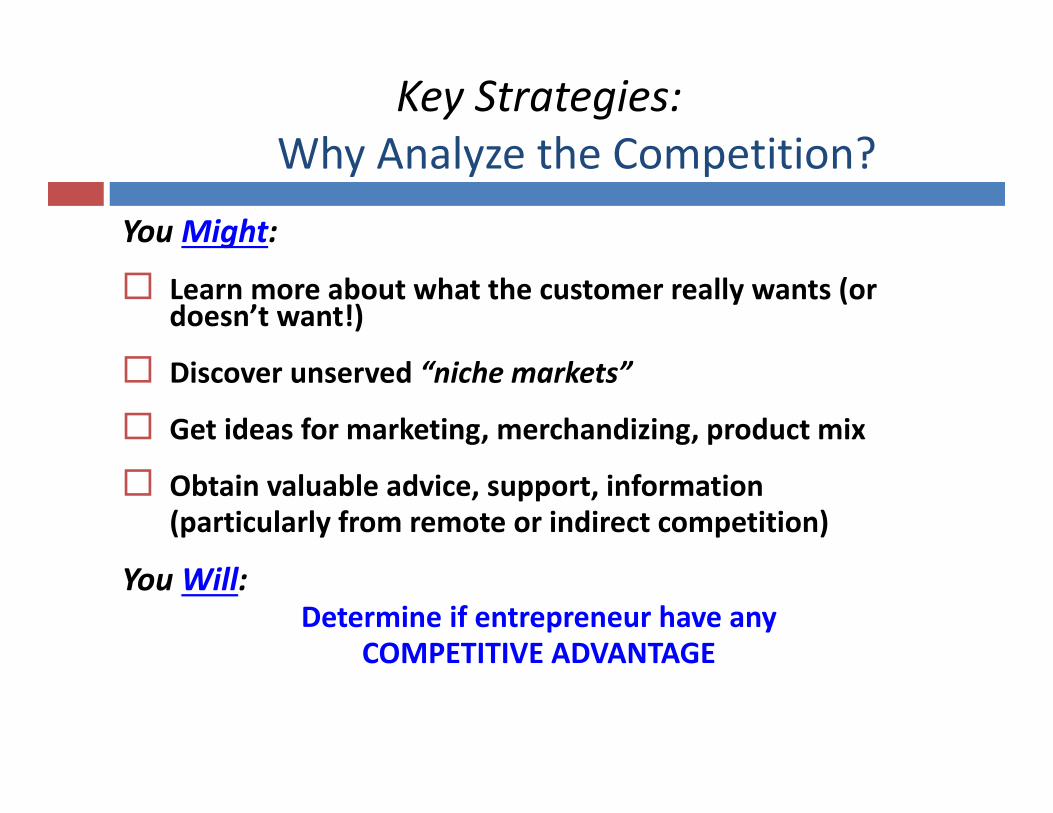
Key Strategies: Why Analyze the Competition?
You Might:
Learn more about what the customer really wants (or doesn’t want!)
Discover unserved “niche markets”
Get ideas for marketing, merchandizing, product mix
Obtain valuable advice, support, information (particularly from remote or indirect competition)
You Will:Determine if entrepreneur have any
COMPETITIVE ADVANTAGE

Key Strategies: Market Potential
What percent can entrepreneur Really get (TAKE AS MARKET SHARE) from the competition in saturated market?
And
Even better, be the first in the market to discover what entrepreneur customer WILL WANT IN THE FUTURE!
And
Use common sense…perceptions lead to behavior &Start free or low cost, test small markets, get objective feedback, and
retry if necessary. 28

Contact Information
Shawn Kaskie‐Director, PCED, MA [email protected] Office: (308) 865‐8135
Center for Rural Research and Development College of Business and TechnologyUniversity of Nebraska at Kearney1917 West 24th Street, WSTC 131EKearney, NE, 68849 www.unk.edu/crrd
Based in part on educational materials available through the University of Nebraska & Wisconsin‐Extension