basic qcm-d and q-sense product range - ata scientific · basic qcm-d and q-sense product range...
TRANSCRIPT

Basic QCM-D and Q-Sense Product range
Malin Edvardsson, PhD
Product manager, Q-Sense
P A G E 1 P A G E 1
O U T L I N E
• Background
• Basic QCM-D Theory
• What can QCM-D Characterize
• Application examples
• Q-Sense Product Offering
P A G E 2 P A G E 2
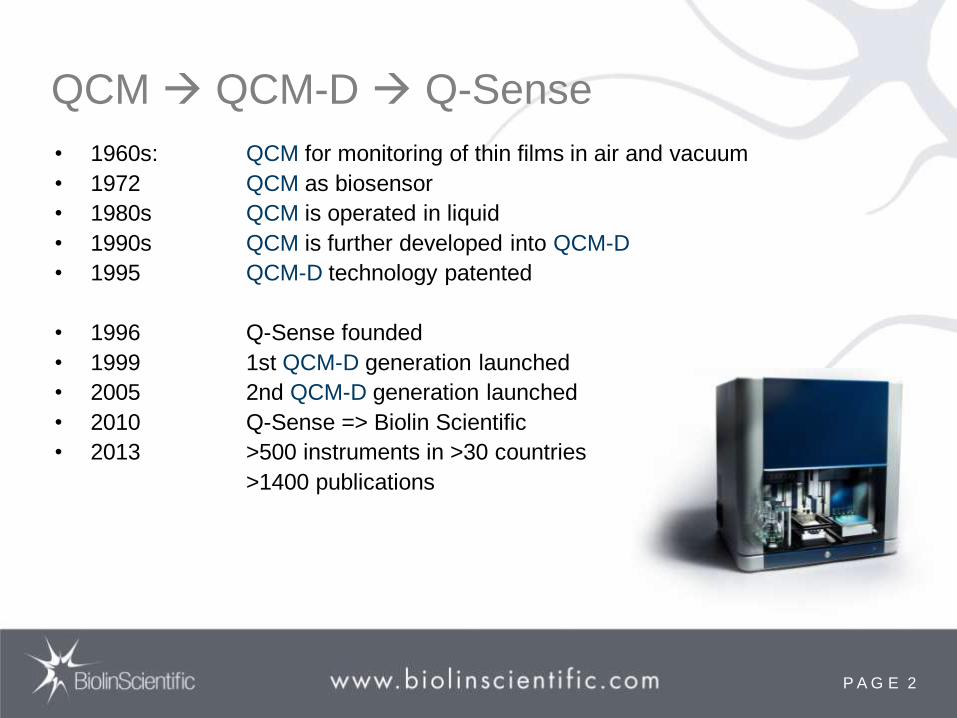
QCM QCM-D Q-Sense
• 1960s: QCM for monitoring of thin films in air and vacuum
• 1972 QCM as biosensor
• 1980s QCM is operated in liquid
• 1990s QCM is further developed into QCM-D
• 1995 QCM-D technology patented
• 1996 Q-Sense founded
• 1999 1st QCM-D generation launched
• 2005 2nd QCM-D generation launched
• 2010 Q-Sense => Biolin Scientific
• 2013 >500 instruments in >30 countries
>1400 publications

P A G E 3 P A G E 3
M E A S U R E M E N T
P R I N C P L E
P A G E 4 P A G E 4
What does QCM-D offer?
• Follow molecular events in real-time, in liquid or in air
• Measure mass (ng) and thickness of molecular layers
(resolution 1Å-1 µm)
• Analyze structural and mechanical properties of molecular layers
• Water content info, swelling/contraction etc
• Flexible choice of surfaces/samples
HOW?

P A G E 5 P A G E 5
QCM-D: a sensor-based, acoustic technique
Top View Bottom View
electrodes
Quartz Crystal covered with Au layer
Sensor Diameter 14 mm
Acoustic= based on increases/decrease in oscillation frequencies
(Quartz Crystal Microbalance with Dissipation monitoring)

P A G E 6 P A G E 6
How does the sensor oscillate?
f = Change in frequency (Hz)
tq= thickness of quartz
Vq= 3420 m/s
n =1,3, 5….13
Overtones
n = 1
n = 3
If fundamental frequency 5MHz:
5, 15, 25,… 65 MHz
q
t
vn
vnf
2
Resonance condition
~ tq λ tq
dtq

P A G E 7 P A G E 7
Rigid film
large τ → Low D
Soft film
small τ→ High D
QCM - D
Δf (→film mass)
ΔD (→ film viscoelastic properties)
Monitoring:
Rodahl, M. et al.; Review of Scientific Instruments 1995, 66, 3924-3930 Rodahl, M. and Kasemo, B. Review of Scientific Instruments 1996, 67, 3238-3241
The ”D” in QCM-D: Dissipation

P A G E 8 P A G E 8
U
Rodahl, M. et al.; Review of Scientific Instruments 1995, 66, 3924-3930 Rodahl, M. and Kasemo, B. Review of Scientific Instruments 1996, 67, 3238-3241
Find
resonance
~ ms
decay
recording
~ ms
data
communication
~ ms
τ Umax
Umax/e
t
QCM-D
f
Q-Sense sensor excited to resonance
Drive voltage is perodically swithced on and off

P A G E 9 P A G E 9
Schematic QCM-D measurement
Δfn1, ΔDn1
Δfn2, ΔDn2
…
ΔD
time
Δf Δf ΔD ΔD
t
U ~1V
I(t)=I0·e-t/τ sin (2πft-φ)
Mass coupled to the surface
+
viscoelasticity of the coupled layer

P A G E 10 P A G E 10
Systems that QCM-D can characterize
Surface adsorption/desorption • Biomolecules (protein, vitamin, antibody, DNA, ...)
• Polymers/polyelectrolytes
• Cells
Surface reaction • Conformation change (protein, DNA, polymer, cells)
• Crosslinking (protein, polymer, ...)
• Hydration (polymer)
Bulk characterization • Viscoelastic properties of fluids (protein solutions, ...)

P A G E 11 P A G E 11
QCM-D Application overview

P A G E 12 P A G E 12
APPLICATION EXAMPLES
P A G E 13 P A G E 13
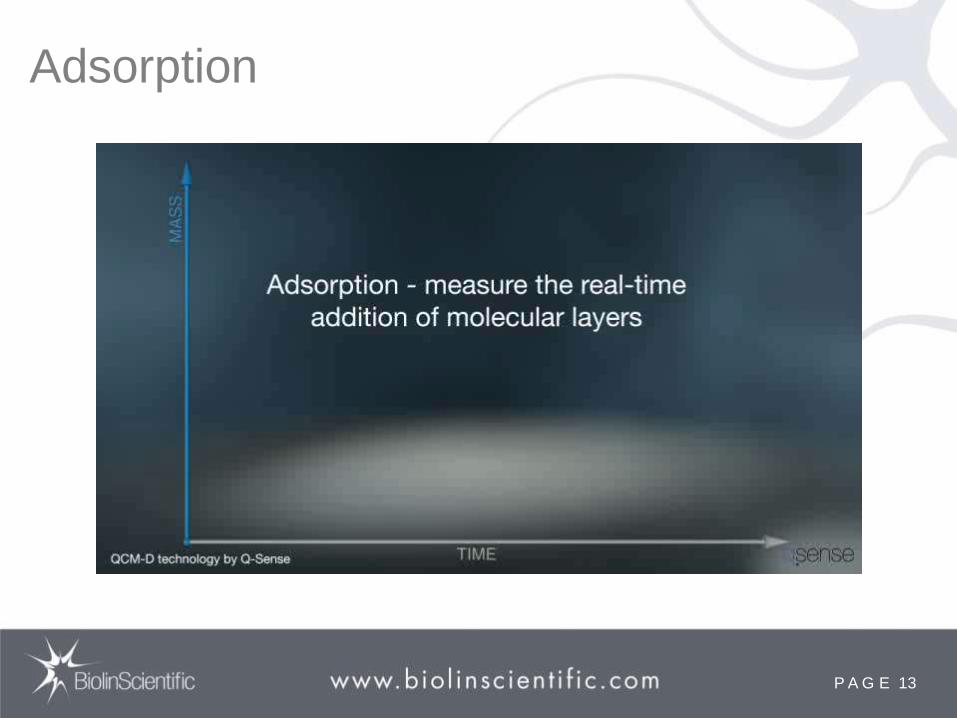
Adsorption

P A G E 14 P A G E 14
QCM-D in protein drug formulation and storage
Protein in contact with surfaces
(concentrators, filters, containers, syringes, tubing, beakers)
Risk of protein unfolding and aggregation
Surface interactions poorly understood
P A G E 15 P A G E 15
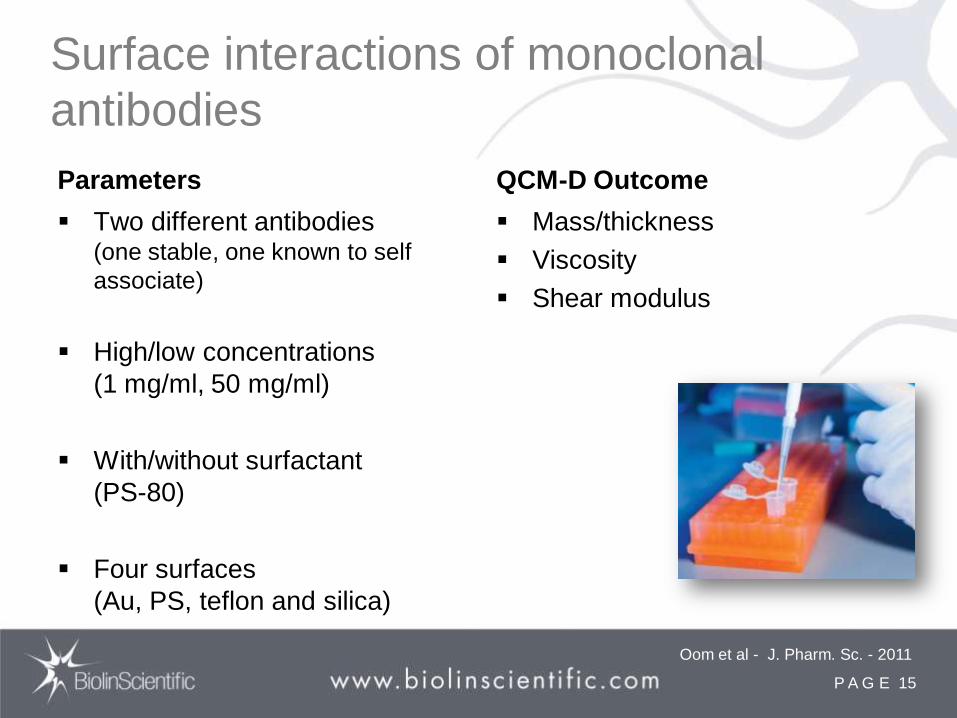
Surface interactions of monoclonal
antibodies
Parameters
Two different antibodies (one stable, one known to self
associate)
High/low concentrations
(1 mg/ml, 50 mg/ml)
With/without surfactant
(PS-80)
Four surfaces
(Au, PS, teflon and silica)
QCM-D Outcome
Mass/thickness
Viscosity
Shear modulus
Oom et al - J. Pharm. Sc. - 2011

P A G E 16 P A G E 16
Effect of surface and surfactant
mAb2 generally adsorbs
stronger than mAb1
Addition of PS-80 reduces
protein aggregation for both
antibodies
Adsorption of protein onto different surfaces from 1 mg/ml (low conc)
solutions of mAb1 and mAb2
Oom et al - J. Pharm. Sc. - 2011

P A G E 17 P A G E 17
Swelling
P A G E 18 P A G E 18
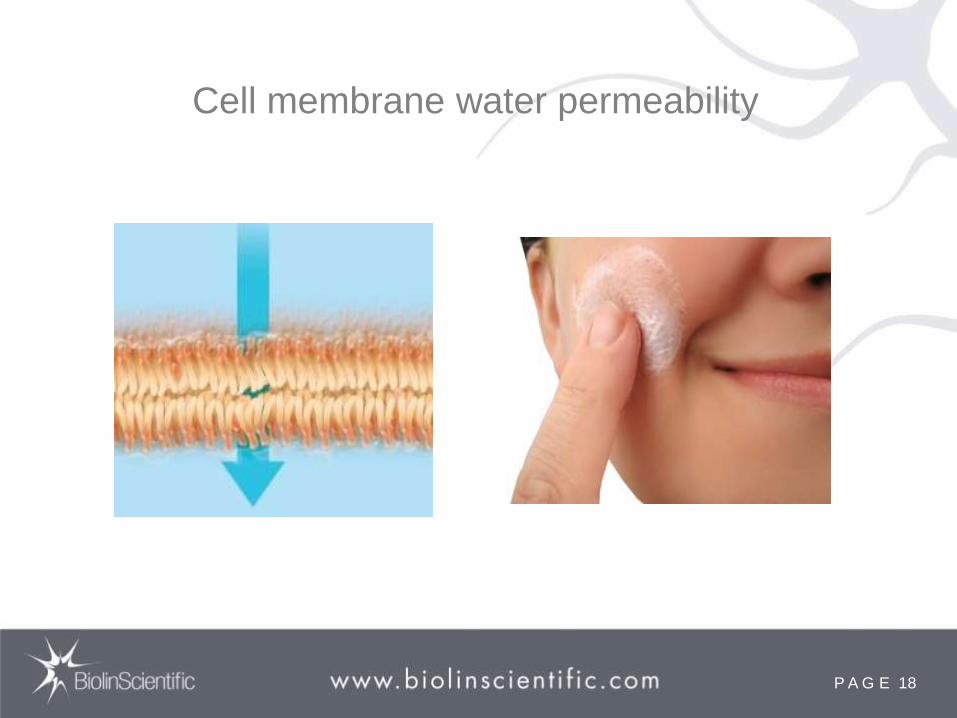
Cell membrane water permeability

P A G E 19 P A G E 19
Effect of composition on water permeability of
model stratum corneum lipid membranes
Myung Han Lee et al: Soft Matter, 2012, 1539-1546
Deposition and swelling of a supported
membrane under introduced humidity
The swelling kinetics correlates to
diffusion of water molecules

P A G E 20 P A G E 20
Permeability (P), diffusivity (D) and solubility (S) of water vapour in the membrane as a
function of membrane thickness, FFA chain length, saturation level, and CER structure
Myung Han Lee et al: Soft Matter, 2012, 1539-1546
P A G E 21 P A G E 21
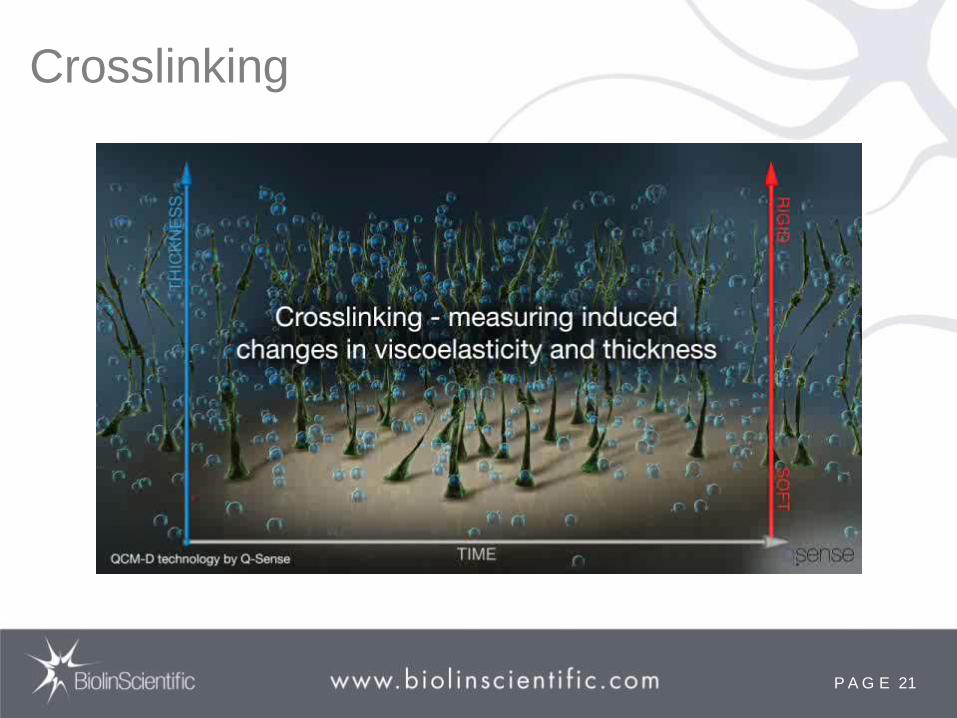
Crosslinking
P A G E 22 P A G E 22
Adsorption
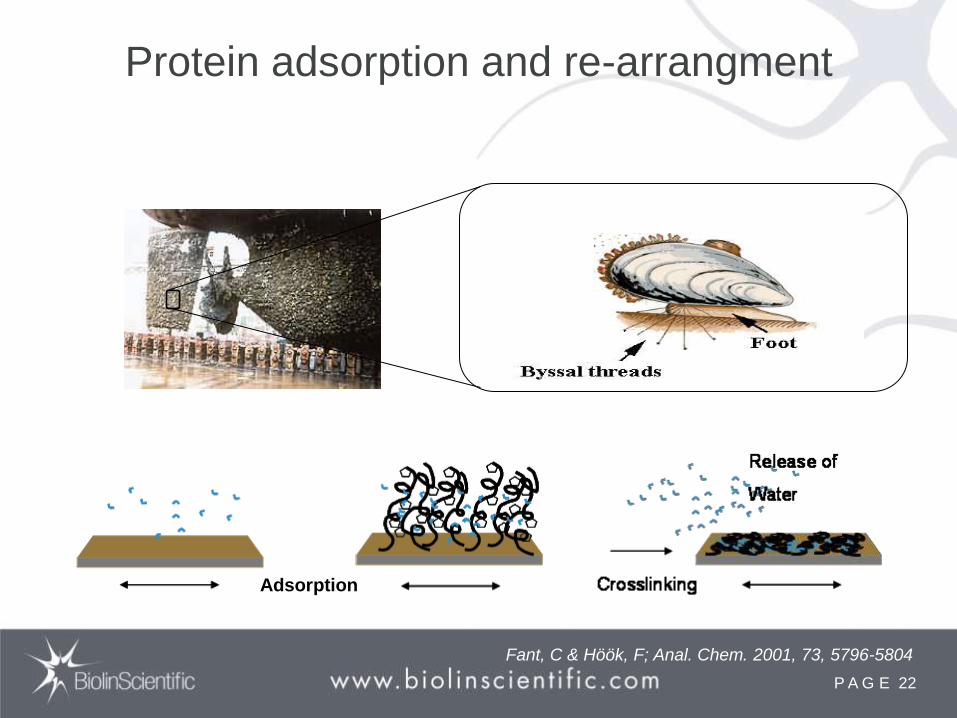
Protein adsorption and re-arrangment
Fant, C & Höök, F; Anal. Chem. 2001, 73, 5796-5804

P A G E 23 P A G E 23
Protein adsorption and re-arrangment
MefP-1 mussle adhesive protein- elongated structure
NaI04- crosslinker- release of water
Fant, C & Höök, F; Anal. Chem. 2001, 73, 5796-5804

P A G E 24 P A G E 24
Fant, C & Höök, F; Anal. Chem. 2001, 73, 5796-5804
Modeling results
before after
x 1.04103
1.18103 kgm
-3
x (QCM-D) 22.4 7.3 nm
x (QCM-D) 1.8 x10
-3 6 x10
-3 Nsm
-2
x (QCM-D) 6.6 x10
4 3 x10
5 Nm
-2
NaIO4
Release of Water
Protein adsorption and re-arrangment
before
after
P A G E 25 P A G E 25
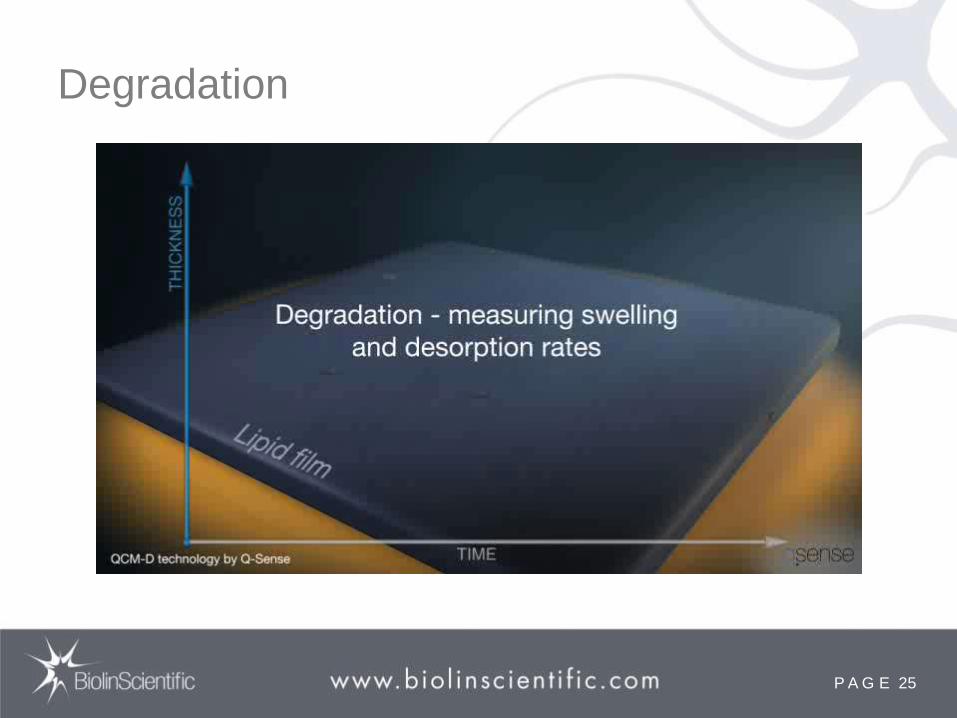
Degradation
P A G E 26 P A G E 26
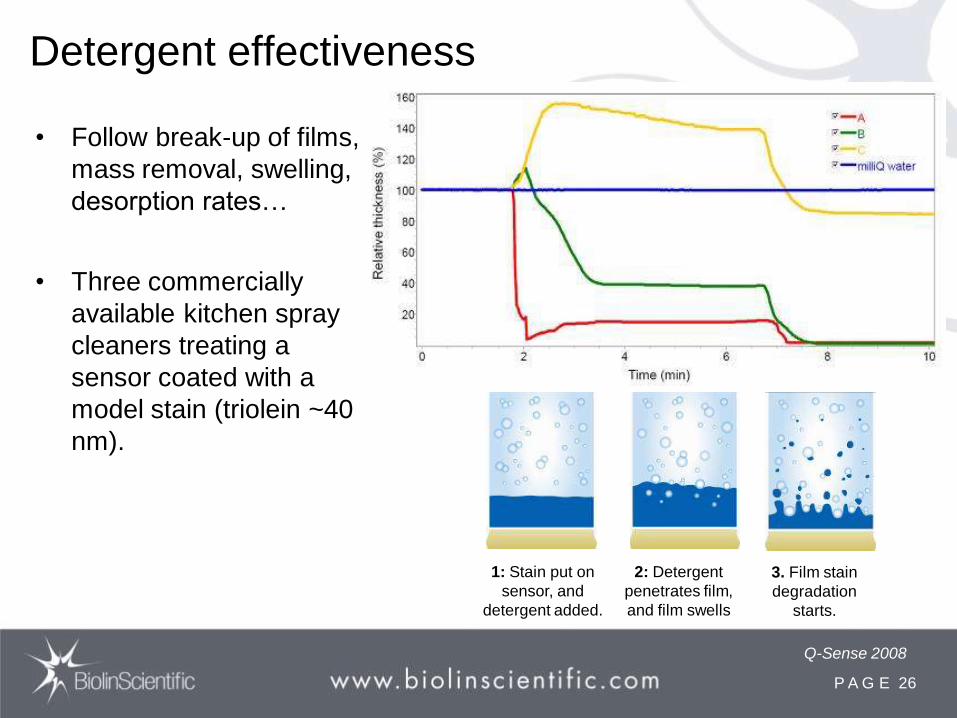
• Follow break-up of films,
mass removal, swelling,
desorption rates…
• Three commercially
available kitchen spray
cleaners treating a
sensor coated with a
model stain (triolein ~40
nm).
1: Stain put on
sensor, and
detergent added.
2: Detergent
penetrates film,
and film swells
3. Film stain
degradation
starts.
Q-Sense 2008
Detergent effectiveness

P A G E 27 P A G E 27
Polyelectrolytes & Nanoparticles
P A G E 28 P A G E 28
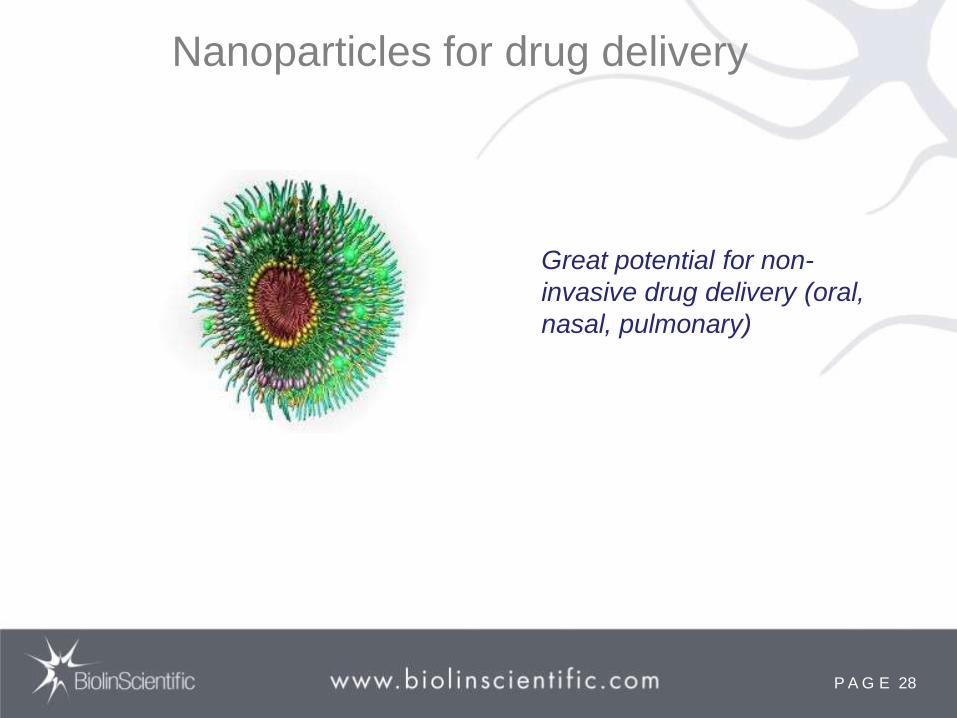
Nanoparticles for drug delivery
Great potential for non-
invasive drug delivery (oral,
nasal, pulmonary)

P A G E 29 P A G E 29
Structural rearrangements of polymeric Insulin-loaded
Nanoparticles Interacting with Surface-Supported Model Lipid
Membranes
Frost et al. J. Biomat. and Nanobiotech., 2011, 2, 181 - 193
(Anionic)
Polyelectrolyte
complexes
P A G E 30 P A G E 30
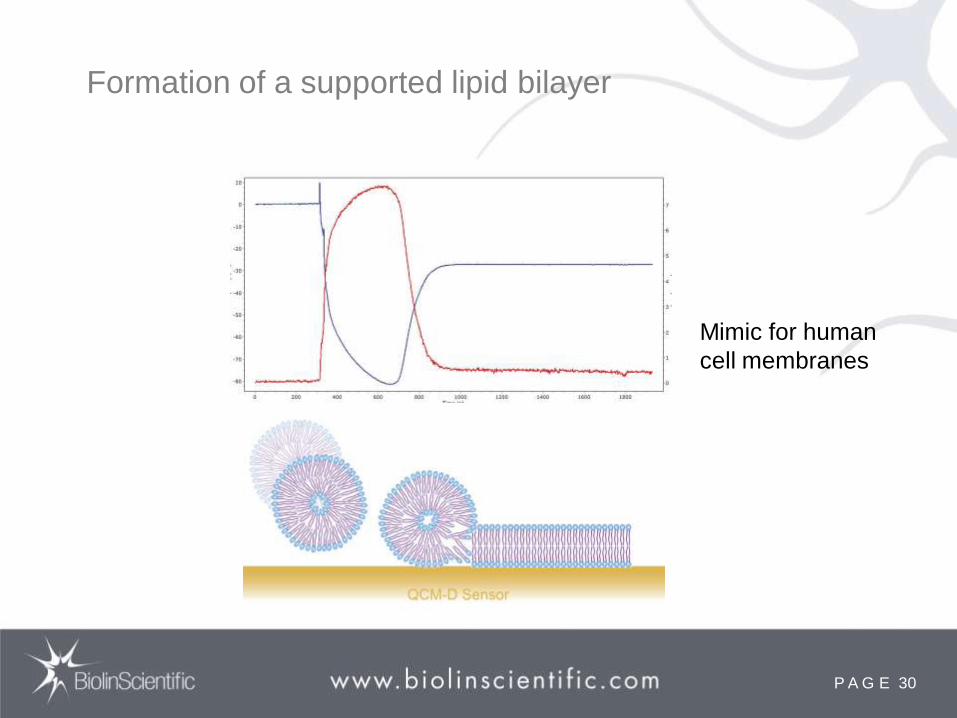
Formation of a supported lipid bilayer
Mimic for human
cell membranes
P A G E 31 P A G E 31
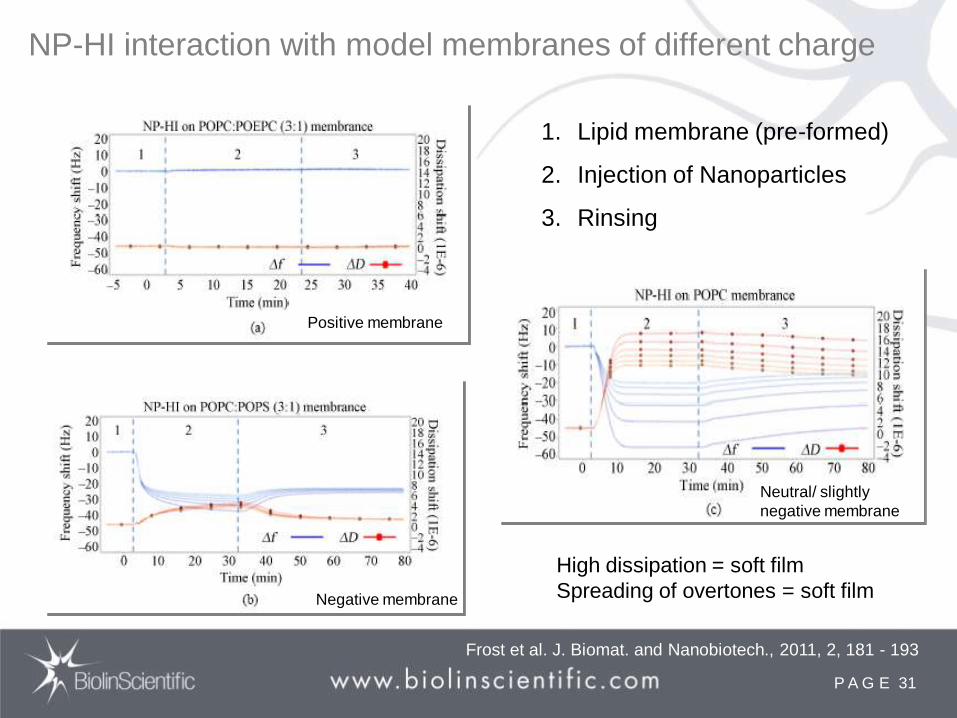
NP-HI interaction with model membranes of different charge
Positive membrane
Negative membrane
Neutral/ slightly
negative membrane
High dissipation = soft film
Spreading of overtones = soft film
Frost et al. J. Biomat. and Nanobiotech., 2011, 2, 181 - 193
1. Lipid membrane (pre-formed)
2. Injection of Nanoparticles
3. Rinsing

P A G E 32 P A G E 32
Schematics of possible NP adsorption
Frost et al. J. Biomat. and Nanobiotech., 2011, 2, 181 - 193

P A G E 33 P A G E 33
Follow-up study: Release of three NP/Insulin complexes
with reducing agent (glutathione)
Frost et al. J. Coll. Int. Sci. (2011) 362(2) 575-583
1. Pre-formed bilayer
POPC:POPS (3:1)
2. Three diffrerent NP
complexes (fused to insulin via S-S
bond)
3. Reducing environment a
mimic for intra cellular
conditions

P A G E 34 P A G E 34
Mesuring cell attachement
P A G E 35 P A G E 35
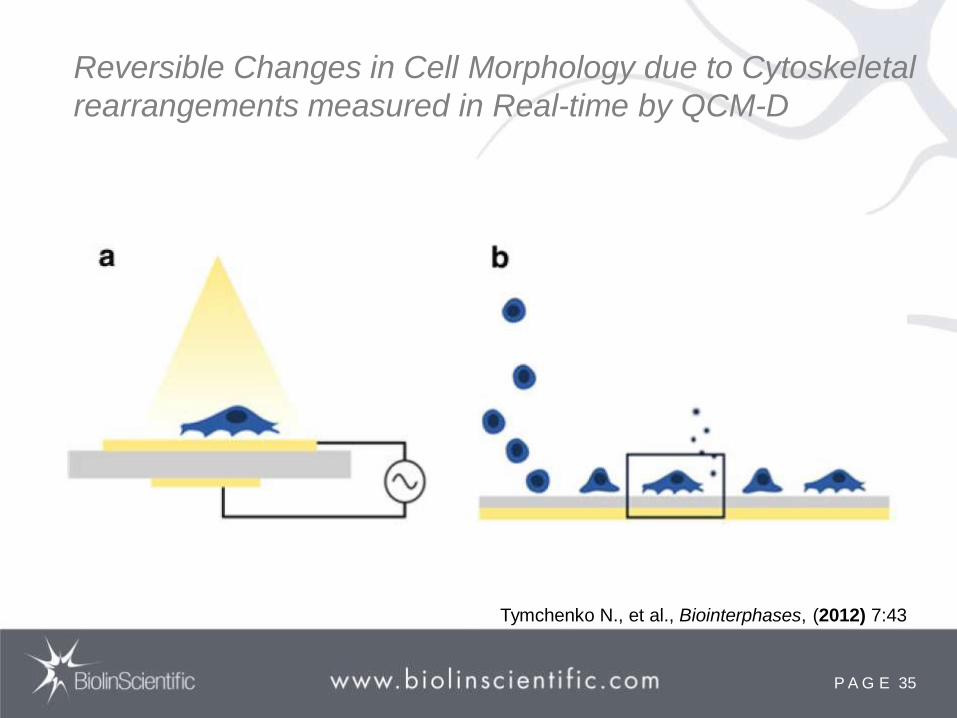
Reversible Changes in Cell Morphology due to Cytoskeletal
rearrangements measured in Real-time by QCM-D
Tymchenko N., et al., Biointerphases, (2012) 7:43

P A G E 36 P A G E 36
Tymchenko N., et al., Biointerphases, (2012) 7:43
Protocol SiO2-surface, 37ºC, Flow 50µl/min
Coat surface with ECM protein
• Adsorb Collagen I
• Expose to serum containing medium
Seed cells in situ
A. Flow cells over surface
Fibroblasts (NIH3T3 or HS483.T)
B. Let attach...
C. ...and spread
Induce morphological changes
D. Add cytomorphic agent
Cytochalasin D
D’ Remove Cytomorphic agent

P A G E 37 P A G E 37
MICROSCOPY
Tymchenko N., et al., Biointerphases, (2012) 7:43
Live cell images of HS 483, T on collagen and serum coated sensors
Cell spreading prior
to Cytochalasin D
exposure
Cell retraction after
20 in exposure to
Cytochalasin D
Cell recovery after
Cytochalasin D removal
P A G E 38 P A G E 38
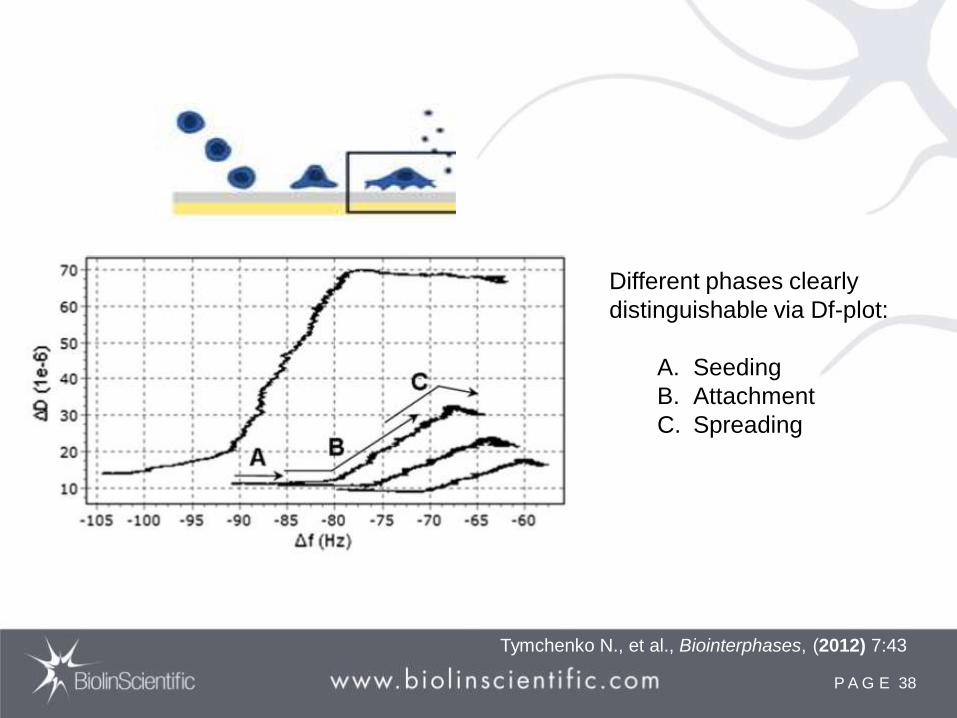
Tymchenko N., et al., Biointerphases, (2012) 7:43
Different phases clearly
distinguishable via Df-plot:
A. Seeding
B. Attachment
C. Spreading

P A G E 39 P A G E 39
Q – SENSE PRODUCT OFFERING

P A G E 40 P A G E 40
Q-SENSE PRODUCT FAMILY
Q-Sense E4 Q-Sense E1 Q-Sense Omega Auto

P A G E 41 P A G E 41
Q-Sense E4
• 4 sensors
• Controlled one-direction flow
• High chemical compatibility
• HPLC fittings
• Complete software package
• Sample volume ~200µl
• Temp range 15-65° C
• Temp stability +/- 0.02°C
• Sensitivity 0.5 ng/cm2
• Stability ≤ 1 Hz/h

P A G E 42 P A G E 42
The E4 Measurement Chamber
parallel 2 by 2 parallel
serial 2 by 2 serial
Examples of
Experimental Design
P A G E 43 P A G E 43
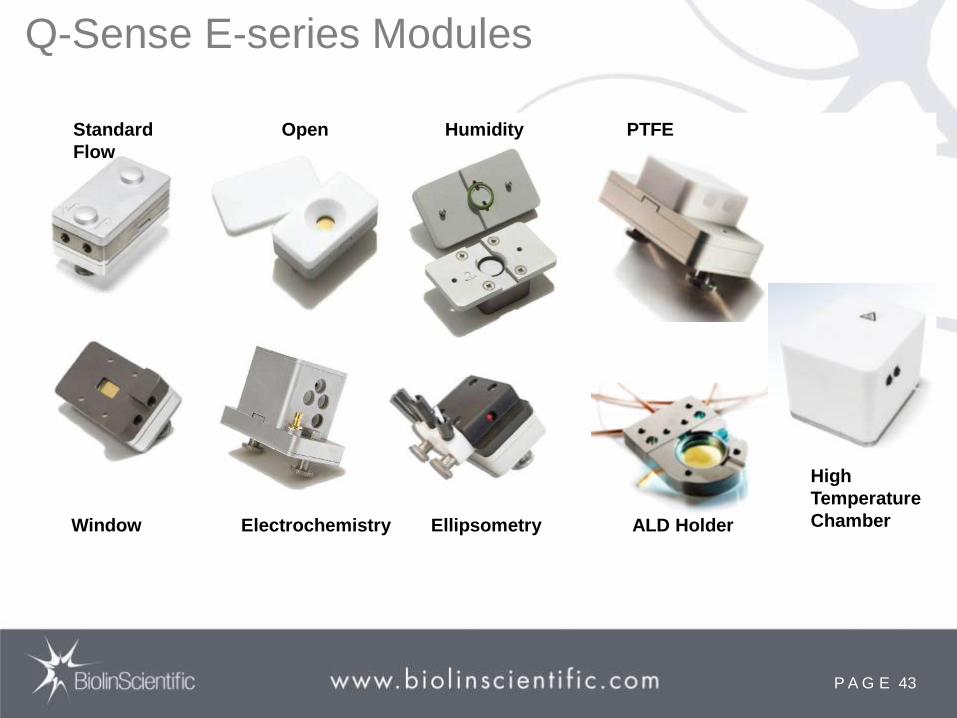
Q-Sense E-series Modules
High
Temperature
Chamber
Humidity
Electrochemistry Window Ellipsometry
Open PTFE
ALD Holder
Standard
Flow

P A G E 44 P A G E 44
Q-Sense E1
• Same characteristics
as E4, but one module
• Especially suitable for
combinations with
ellipsometry and
microscopy

P A G E 45 P A G E 45
Launched 2012
Key words
• Ease of Use
• Integration
• Automation
− Save time
− Reproducibility
147 kEuro
The next Generation Q-Sense Instrument
Q-Sense Omega Auto

P A G E 46 P A G E 46
Features at a Glance
• Integrated turn-key system
• Automated sample handling
• FlexiFlow
• 2 x 4 sensor module
• Versatile sample tray
• Waste and rinse station
• 4 - 70°C
• 30 µl/sensor
• Same sensors
• E1 & QHTC
P A G E 47 P A G E 47
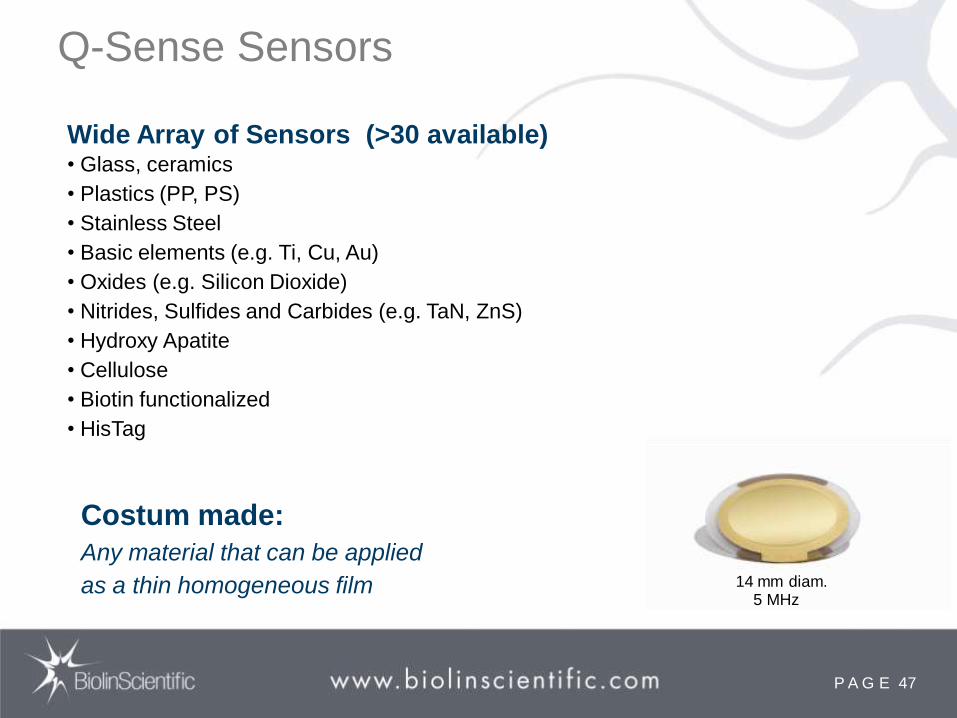
Q-Sense Sensors
Costum made:
Any material that can be applied
as a thin homogeneous film
Wide Array of Sensors (>30 available) • Glass, ceramics
• Plastics (PP, PS)
• Stainless Steel
• Basic elements (e.g. Ti, Cu, Au)
• Oxides (e.g. Silicon Dioxide)
• Nitrides, Sulfides and Carbides (e.g. TaN, ZnS)
• Hydroxy Apatite
• Cellulose
• Biotin functionalized
• HisTag
14 mm diam. 5 MHz
P A G E 48 P A G E 48
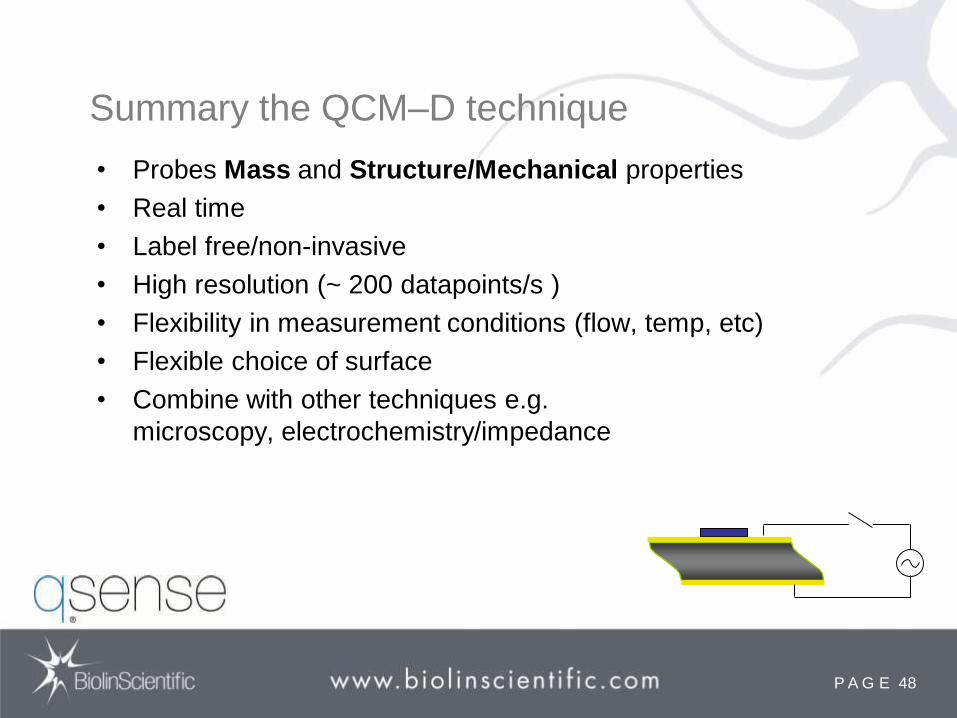
Summary the QCM–D technique
• Probes Mass and Structure/Mechanical properties
• Real time
• Label free/non-invasive
• High resolution (~ 200 datapoints/s )
• Flexibility in measurement conditions (flow, temp, etc)
• Flexible choice of surface
• Combine with other techniques e.g.
microscopy, electrochemistry/impedance
