basics of demand and supply - ppiaf · assume that electricity has a price of $0.045/kwh. how would...
TRANSCRIPT

1
Basics of Demand and Supply
Material from the Public Utility Research Center (PURC) and World Bank’s International Training Program on Utility Regulation and Strategy.
2004

2
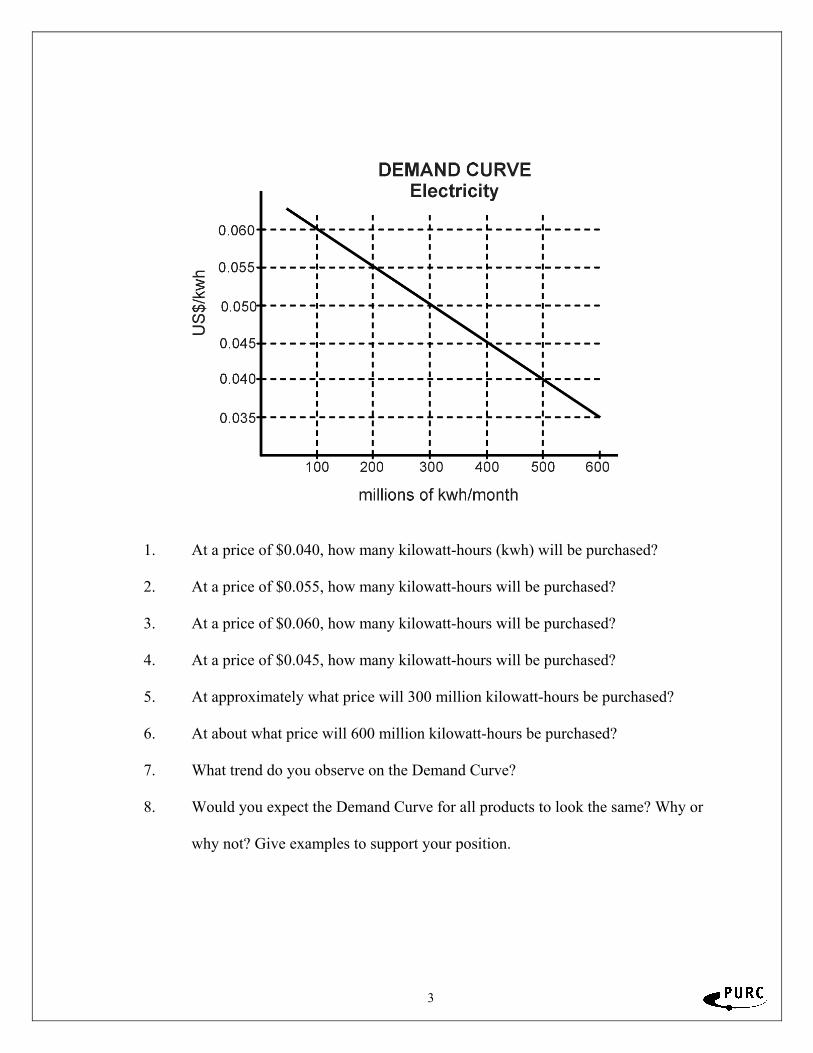
DEMAND
3
1. At a price of $0.040, how many kilowatt-hours (kwh) will be purchased?
2. At a price of $0.055, how many kilowatt-hours will be purchased?
3. At a price of $0.060, how many kilowatt-hours will be purchased?
4. At a price of $0.045, how many kilowatt-hours will be purchased?
5. At approximately what price will 300 million kilowatt-hours be purchased?
6. At about what price will 600 million kilowatt-hours be purchased?
7. What trend do you observe on the Demand Curve?
8. Would you expect the Demand Curve for all products to look the same? Why or
why not? Give examples to support your position.
4
CHANGES IN DEMAND Assume that electricity has a price of $0.045/kwh. How would the demand or quantity demanded for electricity change if: a. the price of electricity dropped by $0.010/kwh?
b. the price of gas (a substitute) decreased?
c. a recession hits the country and people’s incomes decrease?
d. the electricity distribution grid expands into a new region?
5
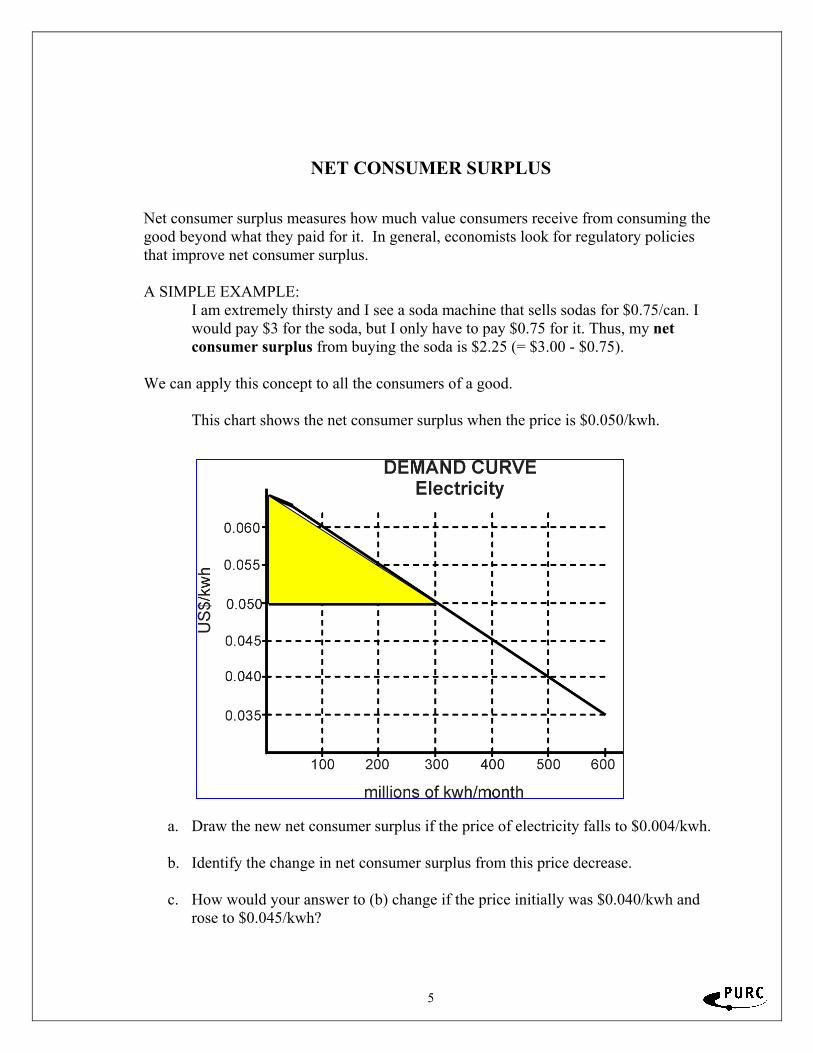
NET CONSUMER SURPLUS Net consumer surplus measures how much value consumers receive from consuming the good beyond what they paid for it. In general, economists look for regulatory policies that improve net consumer surplus. A SIMPLE EXAMPLE:
I am extremely thirsty and I see a soda machine that sells sodas for $0.75/can. I would pay $3 for the soda, but I only have to pay $0.75 for it. Thus, my net consumer surplus from buying the soda is $2.25 (= $3.00 - $0.75).
We can apply this concept to all the consumers of a good. This chart shows the net consumer surplus when the price is $0.050/kwh.
a. Draw the new net consumer surplus if the price of electricity falls to $0.004/kwh.
b. Identify the change in net consumer surplus from this price decrease.
c. How would your answer to (b) change if the price initially was $0.040/kwh and
rose to $0.045/kwh?
6
Price Elasticity of Demand You have already learned that when price rises, the quantity demanded falls and when price falls, the quantity demanded rises. While it is useful to know the direction of movement of quantity as price changes, it is also important to know the magnitude of the change. A firm may decide to increase the price of a product if customers consume only slightly less at a higher price, but not to increase the price if customers consume much less at the higher price. This magnitude of change in quantity demanded with change in price is known as price elasticity of demand. A good or service has an elastic demand when the quantity demanded is extremely responsive to changes in price. A good or service has an inelastic demand when the quantity demanded responds little to changes in price. To ascertain whether or not a good or service has an elastic or inelastic demand curve, we examine several determinants. Items that are considered necessities tend to have very inelastic demand schedules. Even when the price of a necessity increases, people are unable to easily consume less of the product. For example, in the United States, gasoline is considered a necessity. When the price of gasoline rises, the quantity consumed does not significantly decrease. Luxury items often have very elastic demand curves. As the price of these items rise, consumers tend to purchase much less of them. Goods and services with very close substitutes have elastic demand because as the price of these goods rises, consumers will purchase goods that function as their substitutes. For example, if customers consider hot dogs and hamburgers reasonable substitutes, then if the price of hot dogs increases significantly customers will purchase much fewer hot dogs and more hamburgers. Instructions: Try to determine whether the demand for the following items is price elastic or inelastic. Try to justify your answer with a reason in the space provided. 1. Water
2. New watch
3. Popcorn
4. Vacation to Florida
5. Insulin
6. Pizza from Pizza Hut in Gainesville

7
Elasticity of Demand and Changes in Total Revenue One of the ways economists use the elasticity of demand is to predict what will happen to total revenue if we change the price. (Recall total revenue is simply the price we charge multiplied by the number of units we sell.) Specifically, If we increase the price: ● if demand is inelastic, total revenue will increase ● if demand is elastic, total revenue will decrease If we decrease the price: ● if demand is inelastic, total revenue will decrease ● if demand is elastic, total revenue will increase Directions: For each problem, calculate the initial total revenue, the new total revenue, indicate the direction of the change in price and total revenue (↑, ↓, or no change) and write whether the demand for the item is elastic or inelastic. Ex: Price rises from $5 to $6. Quantity demanded decreases from 15 to 10. Old total revenue: $5 X 15 = 75 New total revenue: $6 X 10 = 60 P ↑ TR ↓ elastic .
1. Price falls from $10 to $9. Quantity demanded increases from 100 to 110. Old total revenue: $___ X ____ = _____ New total revenue: $___ X ____ = _____ P ____ TR ____ ___________ 2. Price rises from $6 to $9. Quantity demanded decreases from 60 to 50. Old total revenue: $___ X ____ = _____ New total revenue: $___ X ____ = _____ P ____ TR ____ ___________ 3. Price falls from $6.50 to $6.00. Quantity demanded increases from 100 to 200. Old total revenue: $___ X ____ = _____ New total revenue: $___ X ____ = _____ P ____ TR ____ ___________ 4. Price falls from $4.00 to $3.75. Quantity demanded increases from 300 to 340. Old total revenue: $___ X ____ = _____ New total revenue: $___ X ____ = _____ P ____ TR ____ ___________ 5. Why do price and total revenue go in opposite directions when the demand for the good is elastic and
in the same direction when the demand is inelastic?

8
APPLYING ELASTICITY TO THE REAL WORLD INSTRUCTIONS: Each of the following stories contains an assumption about elasticity of demand. For each story:
a State whether you believe the assumption made about the elasticity of demand is correct or wrong.
b Justify your answer. 1. I. M. Politico, a candidate for the parliament, is proposing a large increase in the
tax on cigarettes and liquor. He says, “I’m not proposing these taxes to raise revenue but to discourage reckless drinking and the filthy smoking habit. If the prices of cigarettes and booze go up, most people will quit using them. After all, no one needs to drink or smoke.”
2. U.R. Kool, also a candidate for parliament, proposes freezing the price of
electricity. “There is no substitute for electricity,” he says. “People have to light their houses and run their machinery. Economists who say higher prices will discourage people from buying as much electricity as before don’t live in the real world.”
3. Domestic Services Minister Vic Acqua opposed a price increase for water during
a recent drought. He claimed that there is no substitute for water, and that therefore the demand for water is inelastic. He believes an increase in the price of water (water taxes) will result in the same quantity of water used as before the price went up.
4. Sky King, world traveler, says if the airlines want to attract more passengers, they
should lower fares for business travelers as well as for vacationers. Both groups should respond equally to a price decrease.
9
HOW COMPETITION AFFECTS ELASTICITY OF DEMAND As we saw above, one of the main determinants of the price elasticity of demand is the extent to which substitutes are available. For example, one of the reasons why the demand for insulin is very inelastic is that there are no substitute goods available for those who have diabetes. If there were a substitute available for insulin, one would imagine the demand for insulin would be more elastic (although it could still be inelastic on whole). Competition by many producers has a similar effect. Until recently, BellSouth was the only provider of local phone service for Gainesville and consumers consider local phone service to be essential. In the days before cellular phone service, there were very few substitutes for BellSouth local phone service. Therefore, the demand for BellSouth local phone service was inelastic. However, now there are other companies that provide local phone service and furthermore cellular phones are available and reasonably priced. In effect, there are now substitutes available to BellSouth’s local phone service. As a result, the demand for BellSouth’s local phone service is more elastic even though the market demand for local phone service in general (wireline plus wireless) remains inelastic. Generally, we expect competition to increase the elasticity of demand. Competition generates substitutes for a firm’s product and therefore tends to make the demand for it more elastic. We will see later that this is one of the beneficial aspects of competition.

10
SUPPLY
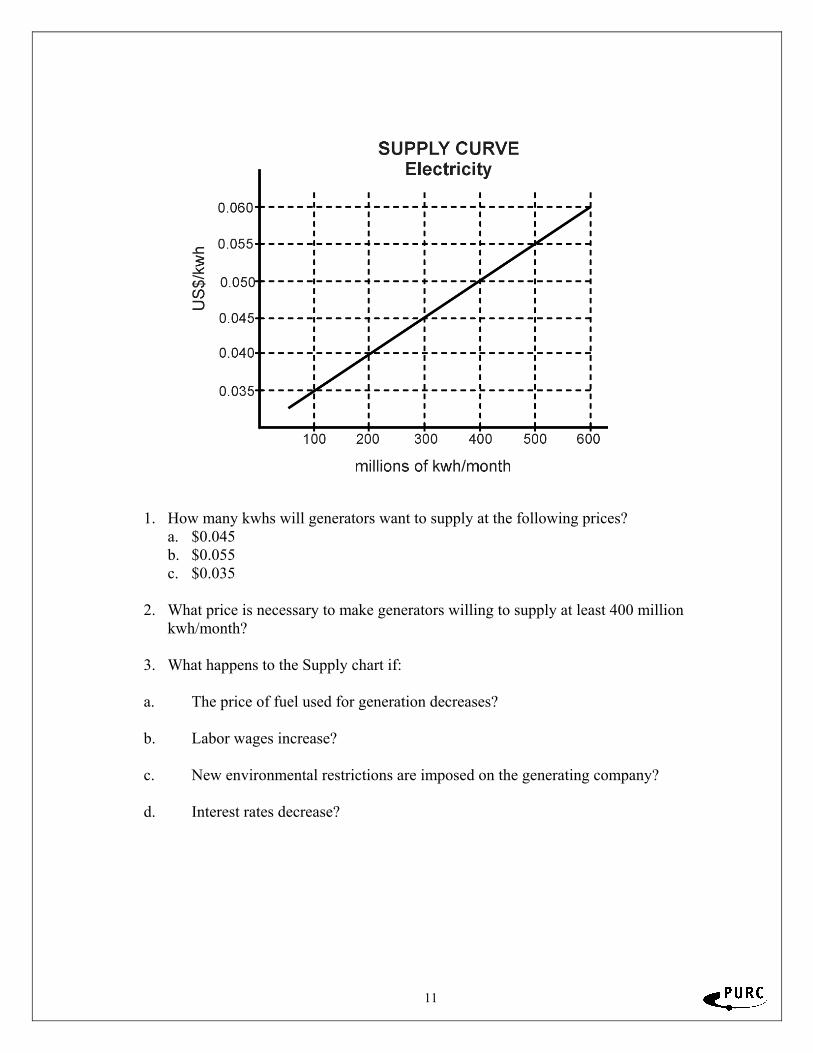
11
1. How many kwhs will generators want to supply at the following prices?
a. $0.045 b. $0.055 c. $0.035
2. What price is necessary to make generators willing to supply at least 400 million
kwh/month? 3. What happens to the Supply chart if: a. The price of fuel used for generation decreases?
b. Labor wages increase?
c. New environmental restrictions are imposed on the generating company?
d. Interest rates decrease?

12
NET PRODUCER SURPLUS The net producer surplus measures how much firms are receiving for the good beyond what it cost them to make it. (If you think this sounds very much like profits, you’re right. We’ll make the connection later.) This chart shows the net producer surplus when the price is $0.050/kwh.
a. Now assume that the price of electricity falls to $0.040/kwh. Draw the new net producer surplus.
b. Identify the change in net producer surplus from the decrease in price.
c. How would your answer to (b) change if the price was initially $0.040/kwh and rose to $0.045/kwh?

13
COMBINING SUPPLY AND DEMAND

14
1. Identify the equilibrium price and quantity.
2. A surplus is shown on the graph at a point _______ the equilibrium. a. below c. at the right of b. above d. at the left of
3. A shortage is shown on the graph at a point ______ the equilibrium. a. below c. at the right of b. above d. at the left of
4. In what direction will the surplus force prices?
5. In what direction will the shortage cause prices to move?
What happens to the equilibrium price if:
a. The price of fuel used for generation decreases?
b. Labor wages for the electricity operator increase?
c. A recession hits the country and people’s incomes decrease?
d. The price of gas ( a substitute) decreases?

15
NET CONSUMER AND PRODUCER SURPLUS We can also now combine net consumer surplus and net producer surplus on the same graph.
Net Consumer Surplus
Net Producer Surplus
16
COST CONCEPTS

17
Cost Concepts Definitions of cost and methods of relating prices and costs total cost -- Generally refers to the value of all the inputs consumed by the company, but is sometimes used to refer to only an enterprise, service, or increment of output for the company. • When the term is used for something less than the whole company, there should be a
modifier attached, such as “the total cost of producing an additional megawatt of electricity.”
• Total cost may be defined in accounting terms or economic terms. This is explained next.
embedded cost -- the money actually expended by the company; also called original cost, historical cost, or accounting cost in some contexts. • Embedded costs are generally found in the company’s accounting records. • Embedded costs are the foundation of the accounting approach to costing. current or forward looking cost -- the money that would be expended if the inputs were purchased in the current time period, or some future time period. This is also often referred to as economic cost. Economic cost is the foundation for the economic approach to costing. • Economic costs are opportunity costs. Opportunity costs are money that a company
or person gives up, whether they ever physically had the money or not. Opportunity costs include explicit costs plus, for example, money a company could have made by producing services that have higher value.
profit • Accountant definition -- In normal business usage, profit is revenues minus explicit
costs. Explicit costs are out-of-pocket costs such as wages, utility expenses, interest, and rent.
• Economist definition -- Profits over and above a normal earnings level. Also called economic rents.
Basic approaches to pricing fully distributed cost (FDC) -- The allocation and assignment of costs by account to service categories. • Assignments are generally restricted to direct costs. Allocations are based on
allocators that are believed to be related to cost causation, or are reasonable. direct cost -- Generally used in the context of accounting costs, but some people are starting to use this term when referring to economic costs. Refers to the cost of inputs that are only needed to provide a specific service or set of services. Generally is limited to resources that have their own identity for accounting purposes; i.e., their own account or subaccount.

18
common costs • accounting definition -- the cost of inputs that are shared by more than one output;
e.g., a telecommunications central office switch • economic definition -- costs that are not avoided by some difference1 in output; does
not include joint costs joint costs -- The cost of inputs that, once placed into production, necessarily produce more than one product in fixed proportions. There are very few joint costs. shared costs -- joint and common costs. There are two major types: • shared incremental costs -- shared costs that are specific to only some services. For
example, some consumer services may have shared costs in consumer billing, but these costs are not shared with business services.
• overhead shared costs -- shared costs that are shared by all services. These are costs that do not change or go away unless the company goes out of business. The classic example is the president's desk, but it's not a perfect example because the desk's cost tends to grow with the company.
Shared costs result from economies of scope. Economy of scope is one of four forms of production economies. • A company has economies of scope if it is less expensive for a single company to
produce two or more products than for 2 or more companies to produce them. • A company has economies of scale if increases in production create decreases in
average cost. • A company has economies of vertical integration if it is less expensive for the
company to produce both the input and the final product than to produce either: (1) the input only and sell the input to another company; or (2) the final product only, purchasing the input from another source.
• Economies of scope and economies of vertical integration are two forms of economies of joint production.
• Economies of density exist when customers are sufficiently close to each other (such as in the case of urban customers) to make their marginal costs lower than the marginal cost of the average customer.
Understanding these economies of production is important for regulating prices that affect which companies will be in which markets and each company’s market share. incremental cost pricing -- prices that are equal to incremental cost. When prices are equal to short-run marginal cost, also called first-best pricing or marginal cost pricing. • incremental costs -- Costs that can be avoided with some difference in output. That is
to say, the extra cost of doing something versus not doing it. The term has little 1The term "difference" is used rather than "change" to ensure that the focus is on the burden an increment places on the resources of the firm. If a cost could be avoided, it is part of the incremental cost for purposes of regulatory costing.

19
meaning without a modifier saying what that something is. Generally it is meant to describe the extra cost of providing a service versus not providing it.
• A related concept is avoided cost -- the costs that are avoided, or can be avoided, by changing the business in some way. Avoided cost is generally applied to a change in the service -- for example, for estimating the costs avoided because of IPP power. Avoided cost is often used to establish differences between wholesale and retail prices, establish USO costs, and set prices for IPP power.
Long run versus short run Economists differentiate between cost measures by differentiating between long-run costs and short-run costs. • long run means that everything about the company can be changed. For example, in
the long run, new fiber optic cables and all associated facilities can be added in response to increased sales of local loops. So a cost measure that assumes that the company can optimize all of these facilities is a long-run cost.
• short run means that something about the company is fixed -- i.e., it cannot be changed by the company to lower its costs. What this something is must be defined for the term short run to have a precise meaning.
• total service long run incremental cost (TSLRIC) -- the costs that would not be incurred were the firm not offering the service or services in question. TSLRIC is the same as the economist definition of direct cost.
• TSLRIC is the sum of the usage sensitive costs caused by the service and service-specific fixed costs. This is also called long run service incremental cost (LRSIC), total service incremental cost (TSIC), long run incremental cost-total service (LRIC-TS) or direct incremental cost.
volume sensitive costs or usage costs -- costs that vary with output. fixed costs -- costs that do not vary with output. Fixed costs are higher in the short run than in the long run because more costs can be varied in the short run. Long-run fixed costs are sometimes called getting started costs or first unit costs. Service-specific fixed costs are fixed costs that are caused by only one service. sunk costs -- costs that cannot be avoided. Sometimes used to describe embedded costs because these are monies already spent. Other times used to describe monies that have not been spent, but that will be even if the company goes out of business. An example would be termination clauses on contracts. service-specific fixed costs -- fixed costs are costs that do not vary with output. Service-specific fixed costs are fixed costs that are caused by only one service. The FCC in the USA has developed the term total element long run incremental cost (TELRIC) to describe the TSLRIC of a network component. stand-alone cost -- The total cost of a specialized company producing only the service or services in question.

20
• For example, the stand-alone cost of providing water to residential customers would be the total cost of a company that provided only sufficient pumping, processing, distribution, etc., to serve residential customers and produced nothing else.
• Stand-alone costs include all of the usage costs and service-specific fixed costs for the service or services in question, the shared costs that are needed only by the service or services in question, and the shared costs that are needed by the service or services in question plus those that may be shared with other services not included in the stand-alone cost estimate. In other words, if we were estimating the stand-alone cost of services A and B, and companies also tend to offer service C, then the stand-alone cost of A and B is:
Usage costs of A Usage costs of B Fixed costs of A Fixed costs of B Costs shared by A & B, but not C
+ Costs shared by A or B with C Stand-alone cost of A & B

21
Part B. Marginal Cost Problem.
Fill in the blanks.
Output, Total Cost, and Marginal Cost
Output Total Cost (TC) Marginal Cost (MC)
0 55
1 85
2 110
3 130
4 160
5 210
Part C. Graphing Problem.
Graph these marginal costs on the graph Plotting Marginal Cost of Mobile Phones. MC is
on the vertical axis, and output of mobile phones is on the horizontal axis. Plot MC
between output levels.
Plotting Marginal Cost of Mobile Phones
60 55 50 45 40 Cost 35 30 25 20 15 10 5
0 1 2 3 4 5 6
Output of Mobile Phones
1. What is the relationship between MC and output as shown on your graph?
2. Explain why MC falls and then rises as output increases.

22
Part D. Charting and Graphing Costs.
Complete the chart Fixed and Variable Costs of Mobile Phones. Assume that the firm
has a total fixed cost (FC) of $60 and total variable costs (VC) as shown below. Part of
the chart has been completed for you. Fixed and Variable Costs of Mobile Phones
Total Product
FC VC TC MC AFC AVC ATC
0 $60 $0 $60 1 $60 $45 $105 $45 $60.00 $45.00 $105.00 2 $60 $85 $145 $40 $30.00 $42.50 $72.50 3 $120 4 $150 5 $185 6 $225 7 $270 8 $325 9 $390
10 $465 1. Graph FC, VC, and TC on the graph Total Fixed, Total Variable, and Total Costs.
Graph all three cost curves on one graph. Cost is on the vertical axis, and output of mobile phones is on the horizontal axis. Label each curve.
a. What is the difference between fixed and total costs? b. Why does VC rise as output increases?
c. Why is FC a horizontal line?
d. Why does the TC curve have the same slope as the VC curve?

23
FINANCIAL VALUATION

24
Basic Steps in Valuation:
1. Estimate future cash flows. 2. Determine appropriate risk-adjusted discount rate. 3. Find value by discounting expected CFs.
Value =
k = investor’s required return. Depends on risk, general level of interest rates, etc. An Example: Privatization
Government is contemplating the privatization of utility services.
Bidding firms will receive cash flows that are based on the strength of
the market, the firm’s operating strength, and the regulatory climate. These elements also affect the timing and risk of the cash flows.
nn
kCF
kCF
kCF
)1(...
)1()1( 22
11
+++
+
25
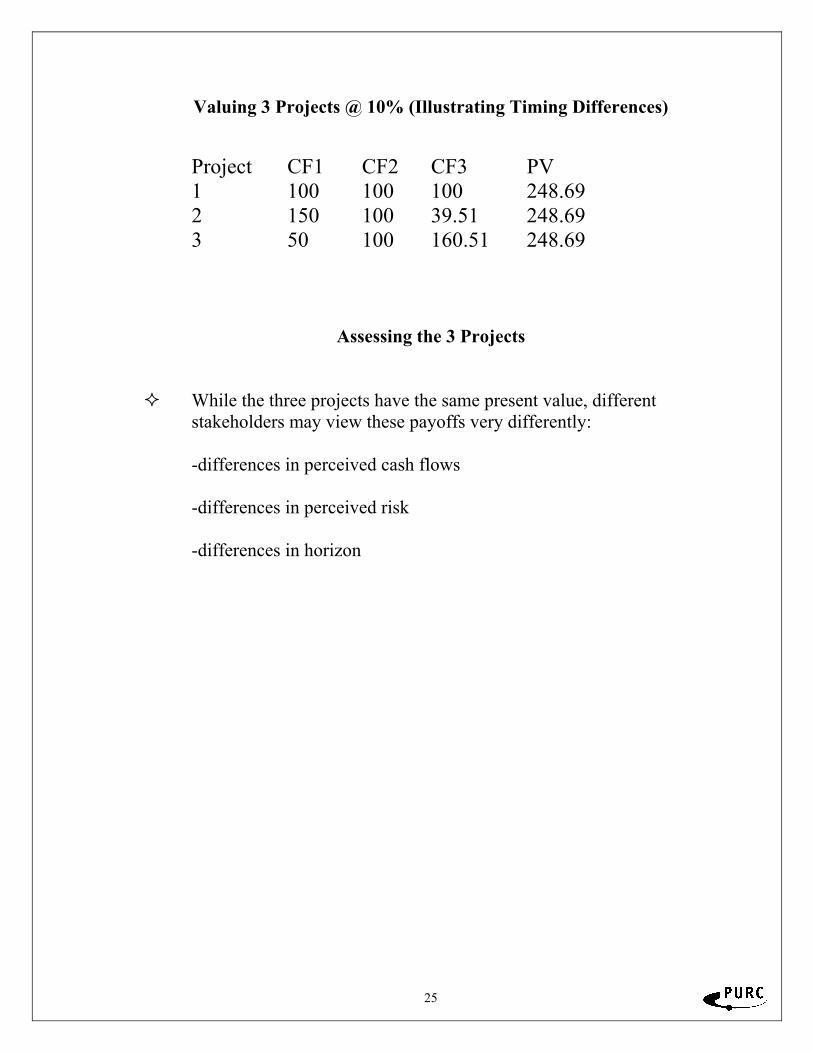
Valuing 3 Projects @ 10% (Illustrating Timing Differences)
Project CF1 CF2 CF3 PV 1 100 100 100 248.69 2 150 100 39.51 248.69 3 50 100 160.51 248.69
Assessing the 3 Projects
While the three projects have the same present value, different stakeholders may view these payoffs very differently:
-differences in perceived cash flows
-differences in perceived risk
-differences in horizon

26
APPENDIX

27
Appendix 1
DEFINITIONS Pure/Perfect Price Competition. This is an idealized market with so many buyers and sellers that no one buyer or seller can have a noticeable influence on the market. All firms make or produce the same product (the same quality) and the only reason to buy one product over another is the price. Each buyer and seller is so small in the total picture that no one acting alone can create any noticeable change in total supply or demand. Pure or perfect competition seldom exists. It is difficult to find producers who sell exactly the same standard product to a large number of buyers at a standard price. Certain agricultural products are examples of pure price competition. In a pure-competition market, suppliers can only decide the best quantity to offer at the market-determined price. Monopolistic Competition. There are a large number of firms of different sizes offering very similar products (or services). This term—combining monopoly with competition—means there are many firms, yet they seek to offer their products for sale by appeals so unique or special that consumers will buy only their brand. Monopolistic competitors have some price control (depending upon their ability to differentiate or distinguish their product), yet they must operate in a market where there are many others eager to duplicate or improve these product qualities. With monopolistic competition, there is both price and nonprice competition. By nonprice competition we mean service, convenience, trading stamps, attractive facilities, improved quality, etc. Oligopoly. This is where a few large firms produce most—or all—of the output of an industry. (An example is the aluminum industry.) A large percentage of a commodity or service of a total industry is produced by a few large firms. In the aluminum industry in the United States, for example, 100% of the aluminum is produced by four firms. This kind of concentration causes each firm to react to what rival firms do. Oligopolies often try to avoid competing on the basis of price, but rely on nonprice competition or cartel agreements. Monopoly. A monopoly exists where there is only one active seller in a market. Some firms are called “natural monopolies”. The reasoning behind this concept is that one single, larger company may provide better service at a lower cost to the public than multiple, smaller companies.

28
Appendix 2 Characteristics of the Four Basic Market Models
CHARACTERISTICS PURE MONOPOLY OLIGOPOLY MONOPOLISTIC
COMPETITION PERFECT
COMPETITION
Number of Firms One Few Many A Very Large Number
Type of Product Unique, no close substitutes
Standardized or Differentiated Differentiated Standardized
Control over Price Considerable Mutual Interdependence
Some, within narrow limits None
Ease of Entry Blocked Significane obstacles Relatively Easy Very easy, no
obstacles
Non-price Competition
Mostly Public Relations
Advertising
Large amount, with product
differentiation paramount
Considerable emphasis on advertising, brand
names, etc. None
Degree of Regulation May be regulated
by the government
Competition Law Very little Very little
Examples Electricity Distribution
Steel, shipping, aluminum, chemicals
Retail trade, automobiles,
appliances, and fast food
Agriculture

29
Appendix 3 Calculating the Rate of Return on Investments
Let's say you invest $100 in stock, which is called your capital. One year later, your investment yields $110. What is the rate of return of your investment? We calculate it by using the following formula: ((Return - Capital) / Capital) × 100% = Rate of Return Therefore, (($110 - $100) / $100) × 100% = 10% Your rate of return is 10%. There are two ways to measure the rate of return on an investment. • Average annual rate of return (also known as average annual arithmetic return) • Compound rate of return (also called average annual geometric return) A simple example below will show what these two yardsticks measure.
You initially invest $100. One year later, your investment grows to $200 in value. The year after that, the investment drops back to $100. The rate of return after the first year is ((Return - Capital) / Capital) × 100% = Rate of Return (($200 - $100) / $100) × 100% = 100% The rate of return after the second year is (($100 - $200) / $200) × 100% = -50%

30
By using the formulas for calculating the average annual rate of return, we get a percentage that measures gains accurately over only a short period. Whereas, the geometric or compound rate of return is a better yardstick to measure your investment over the long run. The arithmetic mean or average return should be used to calculate return on investment only in the short-term. Average annual return (arithmetic mean) = (Rate of Return for Year 1 + Rate of
Return for Year 2) / 2 = (100% + (-50%)) / 2 = 25% (Arithmetic return = 25%) Compound return (geometric mean) = (capital / return) ^ (1 / n) - 1 where n =
number of years. The formula is (100 / 100) ^ .5 - 1 = 0%. (Geometric return = 0%)
Note : Mutual fund managers report the average annual rate of return (arithmetic) on the investments they manage. As shown in the above example, the arithmetic return of the investment is 25%, even though the value of the investment is the same as it was two years ago. Thus, mutual fund reports are somewhat deceptive.
31
GLOSSARY OF FINANCE TERMS A annual report: The write-ups and financial statements given every year to investors and inquiring members of the public concerning a corporation's business asset: A resource of money value, including cash, accounts receivable, inventory, real estate, machinery, collectibles, and securities B balance sheet: A firm's financial statement that provides a picture of its assets, debts, and net worth at a specific time bankruptcy: A term that describes the legal process governed by the U.S. bankruptcy code for companies unable to meet financial obligations beta: The indicator used by Value Line to measure a stock's risk relative to the market, in this case the NYSE Index. The market's beta is always 1.0 (Based on past statistical records, a beta higher than 1.0 indicates that when the market rises, the stock will rise to a greater extent than that of the market; likewise, when the market falls, the stock will fall to a greater extent. A beta lower than 1.0 indicates that the stock will usually change to a lesser extent than that of the market. The higher the beta, the greater the investment risk.) bid price: The price one is willing to pay for a security book value per share: The accounting value of a share of common stock, determined by dividing the company's net worth by the number of shares that are circulating buy-and-hold: A strategy in which the stock portion of one's portfolio is fully invested, including dividends reinvestments, at all times. buy and sell orders: An intent to buy or sell a security C call option: The right given a buyer to buy stock at a specified price within a certain time period callable bond: A bond that can be officially repaid by the issuer prior to its maturity date (Out of courtesy, a premium is usually paid when the bond is repaid.) capital gain: An increase from the purchase price to the selling price of common stock or any other capital asset; profit from the sale of investments or property (A capital gain that persists for one year or less is called a short-term capital gain. Likewise, one that persists for more than one year is called a long-term capital gain.) capital loss: A decrease from the purchase price to the selling price of common stock or any other capital asset; a loss from the sale of investments or property cash flow per share:

32
Earnings after taxes and depreciation, divided by the number of a firm's shares certificate of deposit (CD): An interest-bearing bank receipt for a specified amount of money (CD's usually mature between three months and three years. The interest rate depends on the amount of money and length of time of the deposit.) commission: A broker's fee is given for assisting in buying or selling securities common stock: Shares in a company that represent part ownership of that company compounding: The paying of interest on the accrued interest as well as on the principal corporation: An association of individuals, under authority of law, whose powers and liabilities are distinct from those of its individual members current assets: Assets that can be converted to cash within a year current liabilities: Liabilities that must be paid within a year current ratio: The worth of a company (contained as current assets, including cash, accounts receivable and inventory,) divided by current financial liabilities, including all short-term debts (This ratio roughly measures a company's financial risk: logically, the more the financial liabilities, the riskier the company. Thus, small current ratios indicate high risk.) current yield: The amount produced by dividing the annual income, both from interest and dividends, by the current price of the security (Stocks do not gain interest; the current yield for stocks is equal to the dividend yield.) cyclical industry: An industry whose success is closely linked to the rise and fall of the general economy (The auto industry is a cyclical industry.) D debt-to-equity ratio: The ratio found by dividing long-term debt by the equity (all assets minus debts) held in stock (This is a measure of financial risk.) default: A term that denotes the failure to pay the principal or interest on a financial obligation (such as a bond). default risk: The risk that a company will default, or fail to meet its financial obligations, i.e., fail to pay the interest or principal on its bonds depreciation: The decrease in value due to wear and tear, decay, decline in price, e.g., a new car purchased at $20,000 depreciates to $5,000 in five years discount bond: A bond whose value is less than its face amount discount broker: A stockbroker who charges a smaller commission than other brokers, but provides no counsel in investment diversification: The process of buying securities in different investment types, industry types, risk levels, and companies in order to reduce the loss from a possible company-local or industry-local loss of business (Diversification is illustrated
33
by a famous saying, "Don't put all your eggs in one basket.") dividend payout ratio: The ratio found by dividing the annual dividends per share by the annual earnings per share. dividend yield: The yield found by dividing the annual dividends per share by the price per share (This yield is an indication of the income from a share of stock. Since return on a stock is comprised of capital gain plus dividends, the total return is comprised of dividend yield plus the capital gains percentage for stock.) dividend: A sum of money, determined by a company's directors, paid to shareholders of a corporation out of earnings dollar cost averaging (DCA): A system of buying securities at regular intervals, using a fixed amount of cash over a considerable period of time regardless of the prevailing prices of the securities (DCA protects against the risk of losing a sum of money invested all at once at an inopportune time, e.g., right before a price drop.) Dow Jones industrial average (DJIA): An indicator showing generally how well the market is going, found by averaging the prices of 30 industrial blue-chip stocks trading in the New York Stock Exchange E earnings per share: Earnings found by dividing the net income of the company by the number of shares of common outstanding stock earnings yield: Yield found by dividing the earnings per share for the last 12 months by the market price per share equity: (1) Value determined by subtracting debts from assets (2) An alternate term for stock or similar securities which denote a partial ownership F face value: The value printed on the face of a stock, bond, or other financial instrument or document financial strength: A company's financial condition as seen by its analysts (Value Line rates financial strength on a scale from A++ to C.) financial planner: An investment professional who helps with financial plans for specific goals and assists in the coordination of financial concerns fixed assets: Any long-term asset, such as a building, tract of land, or patent that will not be converted to cash within a year fundamental analysis: An analysis of stocks based on fundamental factors, such as company earnings, growth potential, etc., to determine a company's worth, strength, and potential for growth G
34
going public: An expression used to describe the first public selling of shares of an institution that previously sold shares privately gross domestic product (GDP): The total value of goods and services produced by a nation. In the U.S. it is calculated by the Commerce Department, and it is the main measure of U.S. economic output (In other countries, the GDP is called the gross national product (GNP).) H holding period return/yield: The yield calculated by dividing the income plus price appreciation during a specified time period by the cost of the investment I income statement: The financial statement of a firm that presents both revenues and expenses during a specified time period index: A quantity whose variation represents market fluctuation (The Standard & Poor's 500 index measures the overall change in the value of 500 stocks of the largest firms in the US.) industry rank: Value Line's ranking of a company within its own industry inflation risk: The uncertainty of the future real (after-inflation and -tax) value of an investment investment adviser: A professional who, for a fee, manages an investment portfolio issuer: One who under writes (issues) and distributes a company's securities J junk bond: A weak bond, rated BB or lower, that has a high default risk, and thus carries a high interest rate K L liabilities: The claims of those who have loaned to a company; debts limit order: An order to buy stock once the price has dropped below the price limit liquidity: The ability or ease with which assets can be converted into cash; also the degree to which one can obtain the full cash value of an investment long-term debt: A debt owed over a relatively long period of time M

35
market capitalization: The value found by multiplying the number of outstanding common stock shares by the share price; indicates firm size and total value held in stock market order: An order to purchase or sell stock at a current price market risk: The movement of a stock price relative to the overall market; indicated by beta market timing: The selecting of the best time for leaving or reentering the market in order to achieve the maximum result maturity: The time a note or bill of exchange becomes due money-market fund: A type of mutual fund that invests in short-term securities such as Certificates of Deposits and Treasury Bills N National Association of Securities Dealers Automated Quotations System (NASDAQ): A "virtual stock exchange"--that is, a stock market without a trading floor whose orders are made through a computer network (Usually, high-tech stocks are listed here.) net income: Profit after taxes net profit margin: A measure of a company's profitability and efficiency, calculated by dividing a measure of net profits (operating profit minus depreciation and income taxes) by sales net sales: Amount of sales found by subtracting returns and allowances from money collected for goods and services net worth: Value found by subtracting all liabilities from all assets New York Stock Exchange (NYSE): The largest stock exchange in the U.S. located in New York City (Also known as "Wall Street," this stock exchange carries stocks of well-established companies on its trading floor.) New York Stock Exchange index: A market-value-weighted measure that indicates stock market changes for all NYSE stocks O odd lot: A lot that is less than 100 shares, or less than a round lot over-the-counter market: A communications network, supervised by the National Association of Securities Dealers (NASD), which trades bonds, non-listed stocks, and other securities operating costs and expenses: The costs and expenses necessary to operate a company; includes manufacturing, marketing, research and development operating costs operating income: The income derived after subtracting operating costs and expenses from net

36
sales operating margin: A measure of a company's profitability and efficiency, calculated by dividing a measure of operating profit (sales minus cost of producing goods and operating expenses) by sales P par value (bond): The face value of a bond, usually $1,000 for corporate bonds, and generally higher denominations for many government bonds payout ratio: The ratio found by dividing the dividends per share by earnings per share (Shows how well earnings support dividends, or how secure the dividend is. The lower the ratio, the more secure the dividend.) portfolio: The securities an investor holds premium bond: A bond whose value is greater than its face value preferred stock: Stock whose holders have precedence over common stock in claiming dividends and assets present value: The amount invested at a certain interest rate price-earnings ratio (P/E): The ratio found by dividing market price per share by earnings per share (This ratio indicates what investors think of the firm's earnings' growth and risk prospects.) price-earnings ratio to earnings per share growth (P/E to EPS growth): The ratio found by dividing a stock's price-earnings ratio by its earnings per share growth rate, indicating the company's profits relative to investors' expectations price-earnings relative: The relative amount found by dividing a stock's price-earnings ratio by that of the market as given by a widespread market yardstick such as the S&P 500 or the Value Line index (This relative suggests to the investor whether his investment's price is reasonable compared to the market. Also can be used for historical comparison with P/E relatives of recent years.) price-to-book ratio: The ratio found by dividing a stock's market price per share by its book value (defined as being assets minus all liabilities) per share (This ratio measures the stock's value relative to its net assets. A high ratio, for instance, might suggest that a stock is overvalued.) price-to-cash-flow ratio: The ratio found by dividing a stock's price per share by its cash flow per share (This ratio, similar in type to the price-earnings ratio, serves as a measure of investors' expectations on a firm's future financial success.) principal: The amount owed, invested, or the face value of a debt private corporation: A corporation which does not offer stock for public sale (Private corporations are not required by law to provide information about their financial conditions.) public corporation: A corporation which offers stock for public sale (Public corporations are required by law to provide information about their financial condition,

37
operations, and such.) profit margin: The margin found by dividing a firm's post-tax net earnings by sales (Profit margin measures how well a firm can earn money from sales relative to others.) prospectus: The written statement disclosing the terms of a mutual fund or the offering of securities put option: The right given a buyer to sell stock at a specified price within a specified period of time Q R real rate of return: The percentage of return on an investment over one year after adjustments for inflation or deflation retention ratio: The percent of a firm's earnings kept for investment purposes return: The sum of the income plus capital gains return on equity (ROE): The value found by dividing the company's net income by its net assets (ROE measures the amount a company earns on investments). revenue bond: A municipal bond (muni) backed by the revenue gained from a specific project such as the building of a stadium risk/return trade-off: The compromise made between high- and low-risk investments (High-risk investments generally generate more earnings, while low-risk ones generate a lower rate of return.) risk: The chance that an original investment might lose value round lot: Generally 100 shares, the basic trading unit for stock S safety: Value Line's measure of stock volatility (magnitude of beta), measured from 1 to 5, 5 being most volatile securities: A financial that indicated the holder owns a share or shares of a company (stock) or has loaned money to a company or government organization (bond) Securities and Exchange Commission (SEC): The federal agency that regulates the sale of securities security analyst: A person who specializes in evaluating information regarding stocks and bonds shareholder: See stockholder shareholders' equity: The sum of preferred and common stock equity held by shareholders

38
Standard & Poor's 500 index (S&P 500): A well-known, value-rated index of 500 major US companies: 400 industrial firms, 20 transportation firms, 40 utilities firms, and 40 financial firms stock dividend: A dividend paid in shares of stock as a substitute for cash (Stock dividends allow dividends to make money on themselves.) stock split: The splitting or dividing of shares to reduce the price needed for the formation of a round lot (To illustrate, in a 2-for-1 split, when 1 shares splits into 2, an investor would receive one additional share for each he formerly owned.) stockbroker: A broker who buys and sells stocks and other securities for his customers, charging commission stockholder: A holder or owner of shares of stock; also referred to as shareholder stop-limit order: An order placed with a stockbroker to buy or sell at a certain price or better during a limited period of time stop-loss order: An order placed with a stockbroker to buy or sell a designated stock once a designated price has been reached (This order limits the amount an investor can lose on that investment.) T technical analysis: The analysis of historical trends of price, volume, and other related market indicators to aid in predicting future trends; commonly includes tables and graphs timeliness: Value Line's measure of a stock's price performance for the upcoming year total assets: The sum found by adding property, plant, and equipment asset values to current asset values total debt to total assets: The ratio found by dividing short- and long-term debts by the total assets of the firm (This ratio measures a company's financial risk, showing how much of the firm's property has been financed by debt.) total liabilities: The liabilities found by adding current liabilities to long-term debts trading range: The range of prices within which a stock is normally traded transaction costs: The costs that are brought about by the buying or selling of securities, including broker commissions and the difference between dealer buying and selling price (called a dealers' spread) Treasury bill (T-bill): A certificate representing a short-term loan to the federal government for periods not exceeding one year Treasury bond (T-bond): A certificate representing a long-term loan to the federal government for periods exceeding ten years Treasury note (T-note): A certificate representing a median-term loan to the federal government for a duration of between two and ten years

39
U V valuation: The process of determining the current value of stock or other assets Value Line index: An index representing 1700 equally-weighted companies from the NYSE, AMEX, and the over-the-counter markets W Wilshire 5000 equity index: A stock market index composed of approximately 7000 securities, including most issues from NYSE, AMEX, and the over-the-counter markets (This index formerly consisted of only 5000 securities.) X Y yield to maturity: The return expected on a bond held until the maturity date yield: The value found by dividing the amount of interest paid on a bond by the price, thus measuring the income from a bond (The term also refers to the dividend from stock divided by its price. Yield, however, is not a measure of total return since it does not include capital gains or losses.) Z