basis of cost estimates
DESCRIPTION
Basis of Cost EstimatesTRANSCRIPT

7182019 Basis of Cost Estimates
httpslidepdfcomreaderfullbasis-of-cost-estimates 167
Detroit Water and Sewerage Department
Wastewater Master PlanDWSD Project No CS-1314
Basis of Cost Estimates
Technical MemorandumOriginal Date May 8 2003 Revision Date September 2003 Author Tucker Young Jackson Tull Inc
7182019 Basis of Cost Estimates
httpslidepdfcomreaderfullbasis-of-cost-estimates 267
September 2003 i
Table of Contents
1 Purpose 1 2 Methodology 1
21 Wastewater Conveyance Facilities 1 22 Wastewater Treatment Facilities 2
3 Limitations3 4 Allowances and Contingencies3 5 Cost Index5 6 Program 1 Sewer Infrastructure Program7
61 Subprogram No 1A Lateral and Connector Sewers ndash Cleaning Sediment Disposal ampCondition Assessment 7 62 Subprogram No 1B Interceptor and Trunk Sewer Cleaning Disposal and ConditionAssessment 8 63 Subprogram No 1C Lateral amp Connector Sewer Improvements 9 64 Subprogram No 1D Interceptor and Trunk Sewer Improvements10 65 Subprogram No 1E Manholes and Catch Basin Improvements13 66 Subprogram No 1F Regulators Outfalls Backwater Gates Diversion Dams and In-System Storage 14 67 Subprogram No 1G Pump Stations19 68 Subprogram No 1H Meters 20
7 Program 2 CSO and SSO Control Program 21 71 Ongoing CIP Projects 21 72 New Projects21 73 CSO Rehabilitation 22
8 Program 3 System Control and Wastewater Treatment Program22 81 Wastewater Treatment Plant Ongoing and Major Rehabilitation 22
Appendix A Data Tables Used for CIP Appendix A ndash Data Tables Used for CIP 26 Appendix B ndash Data Tables Not Used for CIP 38
B1 Alternate Data Category Tables38
B15 Historical References 47 B16 Means and Manufacturersrsquo Estimates 48 B17 Meanrsquos Unit Cost Estimates53
Appendix C Unit Costs for Treatment Facilities56 Appendix D Wastewater Treatment Plant Ongoing Repair and Replacement CostEstimates64 Link to Complete Spreadsheets 65
7182019 Basis of Cost Estimates
httpslidepdfcomreaderfullbasis-of-cost-estimates 367
September 2003 1
Basis of Cost Estimates
1 PurposeIn the development of a Master Plan for wastewater conveyance and treatment thatextends 50 years into the future it is necessary to utilize a set of common assumptionsas to the capital cost of facility construction The cost assumptions provide the basisfor establishing the estimated annual expenditure in the capital improvement plan(CIP) that was developed as a component of the Detroit Wastewater Master Plan(WWMP)
The guidelines are intended to provide unit costs for construction and rehabilitationof conveyance and treatment facilities These unit costs can then be used to establishtotal costs of planning alternatives for comparative purposes Unit costs can also beapplied to recommended system upgrades improvements and rehabilitation projectsto develop total project costs for CIP development
While conveyance facilities are common elements of the DWSD system the treatmentfacilities being investigated are each somewhat unique in nature and thus not asreadily subjected to the application of generalized unit cost factors For this reason adifferent approach to cost development has been employed for treatment facilities
2 MethodologyDevelopment of component costs for a Master Plan covering the range of potentialproject types anticipated within the DWSD planning area over a 50-year time framerequired evaluation of historic costs as well as ldquoground uprdquo estimates These costscan be applied to proposed projects with varying site conditions and complexities
throughout the planning area
21 Wastewater Conveyance Facilities
To better account for a range of conditions if possible the unit costs were derivedfrom a convergence of two sources The cost estimates for wastewater conveyancefacilities are based on an assembly and comparison of historical construction costsfrom multiple cost estimates and reports compiled from 1971 to present andconstruction estimates using the RS Means Sitework and Landscaping Data andmethodology
Since in many cases the two methods produced differing results final unit costs
were established within the range of estimated costs through review by experienceddesign construction professionals Section B15 in Appendix B presents the historicalcost development Section B16 in Appendix B presents the Means method costdevelopment In some cases one of the two estimating methods was applicable forconveyance facilities
7182019 Basis of Cost Estimates
httpslidepdfcomreaderfullbasis-of-cost-estimates 467
Detroit Water and Sewerage DepartmentBasis of Cost Estimates
September 2003 2
It was necessary to establish a time reference for historical data reviewed as part ofthe cost evaluation The year 2003 was selected as this reference point for the CIPdevelopment
The CIP developed for the Wastewater Master Plan (WWMP) used 2003 as the baseyear Section 2 contains the base data for the CIP estimates Cost data tables thatwere used for the CIP estimates are contained in Appendix A The 2000 costs fromthese tables were escalated to 2003 costs using the ENR Construction Cost Index (CCI)shown in Table 1
Both Means estimates and historical costs were calculated to use the year 2003 as abase Historical sources which are taken from the year in which they were reportedwere adjusted to 2003 unit costs using the ENR Construction Cost Index (CCI) Costsfor specific items were then averaged to determine the historical unit cost in year 2003dollars It should be noted that some projects with costs that were extremely high orlow compared to the others for the same type of facility were excluded from theaverage Some assumptions were made for the historical data due to a lack of detail
in the original estimates For example many of the pipe depths were assumed basedon size For sections where variable depths are shown the original estimate which isbased upon a shallower depth is multiplied by a factor to obtain a number for thedeeper depths
These factors were obtained from the RS Means estimates and then applied to thehistorical data Where historical costs were not available manufacturers estimateswere used
Section B16 in Appendix B shows the estimates based on RS Means costs for thesame material and the same assumed conditions as in the cost guidelines section The
RS Means numbers were taken from the 2002 Means data then converted to the year2000 using the suggested Means factors for year and location (Detroit) adjustmentFor example an item costing $23 in 2002 would be multiplied by the index in 2000(959) then divided by the index for 2002 (100) to obtain $2206 then adjusted for thelocation by multiplying by 962 the Means city cost index to give an adjusted 2000price of $2122 These 2000 values were then escalated to 2003 values for the unitcosts used in the CIP development
22 Wastewater Treatment Facilities
To address the treatment needs within the planning area over the 50-year planningperiod a series of treatment alternatives were developed by Tetra Tech MPS Theseranged from expansion of treatment capacity at the existing Detroit WWTP toutilization of existing outlying (satellite) facilities with upgrade and expansion inPontiac Warren andor Mt Clemens to construction of dedicated facilities to treatwet weather flow and the dewatered flows from CSO and SSO storage facilities Eachof these alternatives has been documented in technical memoranda specific to thealternative type
7182019 Basis of Cost Estimates
httpslidepdfcomreaderfullbasis-of-cost-estimates 567
Detroit Water and Sewerage DepartmentBasis of Cost Estimates
September 2003 3
The three technical memoranda describing alternativesndash Expanded Facilities withinthe City of Detroit Technical Feasibility of Satellite Treatment and TechnicalFeasibility of a Wet Weather Flow Treatment Facility- contain detailed descriptions ofthe proposed facilities and include as appendices the complete cost estimates foreach facility
As part of the alternatives development conceptual (planning level) cost estimateswere developed for the facilities being proposed These estimates would be based onspecific facility locations preliminary facility layouts and defined treatment processcapacities Because this additional detail is available more detailed estimates couldbe prepared than could be expected for conveyance facilities
These estimates used standard construction cost estimating procedures and formatsDesigners broke down facilities by each component process and prepared costestimates at the process level for the specific size and configuration appropriate foreach facility
Appendix C contains the treatment facility unit cost tables derived from thealternatives Any unit costs for conveyance items used in these alternative estimatessuch as pipes were used with other data in calculating the CIP costs
3 LimitationsEvery construction project presents unique conditions with respect to location siteconstraints and soil or geotechnical considerations Also construction industrymarket conditions can greatly affect project costing By considering both historicalcosts as well as current cost estimating methods an attempt was made to account forthe range of potential costs However no estimates can be considered final until
complete construction plans and specifications have been prepared At the MasterPlanning stage these unit costs as well project costs derived from them need to beevaluated appropriately Thus these generalized costs are appropriate forcomparison of alternative approaches to providing service but additional detailshould be provided for site-specific construction estimates
4 Allowances and ContingenciesAt every stage of construction cost estimating certain unknown factors need to beaccounted for in the development of estimated costs This is even true at the timefinal plans and specifications are completed for a specific project It is especiallycritical at the planning stage The unit costs presented throughout this technical
memorandum are base construction costs for the most part This means that in mostcases no allowances or contingencies of any type have been applied Contingenciesneed to be added to cost estimates prior to inclusion in the CIP
The following cost categories need to be considered in the development of completecost estimates Contractor Overhead and Profit Contingency and Engineering LegalAdministrative and Management
7182019 Basis of Cost Estimates
httpslidepdfcomreaderfullbasis-of-cost-estimates 667
Detroit Water and Sewerage DepartmentBasis of Cost Estimates
September 2003 4
Contractor Overhead and Profit accounts for the markup that contractors employ tocover costs such as mobilization and the profit they would expect to garner from theproject
The Contingency markup has two main parts Planning Level Contingency andContractor Contingency The Planning Level Contingency accounts for theuncertainty of the cost estimate due to the basic level of design developmentappropriate at the planning level This contingency should decrease significantly aseach project proceeds from the Master Plan stage through the Project Plan stage thePreliminary Design Stage and the Final Design Stage For a Master Plan looking 50years into the future the contingency will be a considerable portion of the total costsThe contractor contingency allows for uncertainty in the final contract cost due tomarket conditions at the time the project is bid and for potential changes to theproject during the construction stage (change orders)
Engineering Legal Administrative and Management markups account for severalaspects of the projects These include providing funds for performing the engineering
design calculations preparing plans and specifications bidding the constructioncontract and awarding the work contractor oversight shop drawing review andapproval on site inspection services change order development development ofrecord drawings and contract close out They also account for the costs associatedwith legal review of construction contracts and when necessary the involvement offinancial professionals in preparation of bond statements and the sale of bonds
A review of contingencies used in other recent DWSD projects led to the use of thefollowing multipliers For new construction (replacement) or major rehabilitation themultipliers applied are
Contractor Overhead and Profit 25 of base construction costs
Contingency 30 of total construction cost includingcontractor overhead and profit
Engineering Legal 20 of total construction cost includingAdministrative and Management contractor overhead and profit
For all other categories (inspection cleaning rehabilitation etc) the multipliersapplied are
Contractor Overhead and Profit 25 of base construction costs
Contingency 15 of total construction cost includingcontractor overhead and profit
Engineering Legal 10 of total construction cost includingAdministrative and Management contractor overhead and profit
7182019 Basis of Cost Estimates
httpslidepdfcomreaderfullbasis-of-cost-estimates 767
Detroit Water and Sewerage DepartmentBasis of Cost Estimates
September 2003 5
Most unit costs presented in this technical memorandum are basic construction costswithout contingencies The above contingencies needed to be added to the base costsas project specific estimates are developed The estimates that are based on actualcosts from past projects already include these contingencies
5 Cost IndexHistorical costs have been adjusted using data from the Engineering News Record(ENR) Construction Cost Index History which provides annual cost indices from1913 to present Table 1 shows the annual cost indices from 1969 to 2002Extrapolation of this data gives the annual indices for the year 2003
The cost estimates developed for the CIP used a 2003 cost The 2003 costs wereobtained by escalating any base data used from their base year to 2003 using the CCIUsing the example for a 1990 estimated cost for 12 sanitary line of $212 per linearfoot convert it to 2003 cost by dividing the unit price by the yearrsquos index (2124732)Then multiply by the year 2003 index (6698) to get the escalated 2003 unit cost of $300
7182019 Basis of Cost Estimates
httpslidepdfcomreaderfullbasis-of-cost-estimates 867
Detroit Water and Sewerage DepartmentBasis of Cost Estimates
September 2003 6
Table 1ENR Construction Cost Index (CCI)
Year Index Year Index
1969 1269 1986 4295
1970 1381 1987 4406
1971 1581 1988 4519
1972 1753 1989 4615
1973 1895 1990 4732
1974 2020 1991 4835
1975 2212 1992 4985
1976 2401 1993 5210
1977 2576 1994 5408
1978 2776 1995 5471
1979 3003 1996 5620
1980 3237 1997 5825
1981 3535 1998 5920
1982 3825 1999 6060
1983 4066 2000 6221
1984 4146 2001 6342
1985 4195 2002 6538
2003 6698
Index for 2002 was averaged in 1202 using 11 months of data This number was forecasted
7182019 Basis of Cost Estimates
httpslidepdfcomreaderfullbasis-of-cost-estimates 967
Detroit Water and Sewerage DepartmentBasis of Cost Estimates
September 2003 7
Cost Guideline SummariesThe following pages contain cost guidelines for those items included in the CIP andrate model including pipe installation special structures and manholes pumpstations pipe rehabilitation miscellaneous repair and pipeline inspection andcleaning The categories and layout correspond to the CIP cost estimating
spreadsheets
For each category the material and assumed construction conditions are identifiedThese include type and depth of excavation utility and pavement restorationanticipated and number of manholes or other structures included in the estimateAdditionally a useful life expectancy for the specific type of facility is provided foruse in CIP development
6 Program 1 Sewer Infrastructure ProgramThis section of the CIP development includes the inspection cleaning rehabilitation
and replacement of DWSD sewers
61 Subprogram No 1A Lateral and Connector Sewers ndashCleaning Sediment Disposal amp Condition AssessmentLateral and Connector sewers were defined previously in consultation with DWSDA lateral sewer collects flows from homes and businesses for discharge into trunksewers These sewers range in size from 6rdquo to 24rdquo in diameter with an average size of18rdquo A connector sewer is a pipe that carries the wastewater flow from a lateral sewerto a trunk sewer Connector sewers range from 24rdquo in diameter to a 4rsquo by 6rsquo eggshape with an average size of 30rdquo in diameter An assessment of DWSD sewers fromthe technical memorandum Lateral Sewers and Connection Sewers indicates that
there are 2258 miles of laterals and 559 miles of connector sewers in the DWSD sewersystem
611 Inspection
The CIP costs for inspection of lateral and connector sewers were developed with theassumption that this inspection would be accomplished through sewer televisingSewer televising consists of remote televising of sewers using robotically controlledcameras The estimate includes mobilization set up for camera entry and furnishingof all incidentals
The actual CIP cost estimation was derived from the technical memorandum entitled
Physical Inspection of Lateral and Connector Sewers revised May 2003 whichdescribes a recent pilot project performed by Inland Waters Pollution Control Inc forDWSD Inspections occurred in June July and October of 2002 This projectinspected several DWSD sewers in the lateral and connector categories using TVinspection methods The selected sewers for these inspections included varying pipediameters as well as material types The average inspection costs from the pilotproject are used for the CIP Table A-1 in Appendix A shows an alternate costestimation for sewer inspections based on historical data These unit costs in Table A
7182019 Basis of Cost Estimates
httpslidepdfcomreaderfullbasis-of-cost-estimates 1067
Detroit Water and Sewerage DepartmentBasis of Cost Estimates
September 2003 8
do not include contingencies Note that the pilot project costs are within the rangesset in Table A
2003 Lateral and Connector Sewer Inspection Costs = $211 per linear foot ($11141 per mile)
612 Cleaning
Sewer Cleaning consists of preparatory cleaning (also called light cleaning) or heavycleaning utilizing a hydraulic sewer jetvacuum unit The estimate includesmobilization set up for jetvacuum truck and furnishing of all incidentals
The CIP costs for the cleaning of lateral and connector sewers were taken from thetechnical memorandum entitled Physical Inspection of Lateral and Connector Sewersrevised May 2003 which describes a recent pilot project performed by Inland WatersPollution Control Inc for DWSD Table A-2 in Appendix A shows an alternate costestimation for sewer cleaning based on historical data
The unit costs do not include contingencies
2003 Lateral and Connector Sewer Light Cleaning Costs = $325 per linear foot ($17160 permile)
2003 Lateral and Connector Sewer Heavy Cleaning Costs = $900 per linear foot ($47520 permile)
613 Sediment Testing
A concern regarding the pipes in the DWSD system is that the buildup of sludgecontains toxic materials such as PCBs or mercury This sludge should be removedand disposed of in a different manner than the current sewer jet vacuum unit
practices (washing sludgedown the sewers to the WWTP) Sludge removal shouldtherefore include a sampling station to test the sludge components If sludge testsindicate hazardous materials the sludge will need to be disposed of in an apporpiatelandfill The cost per truckload comes from CDM and assumes two tests one forPCBrsquos and one for mercury would be performed on each load
2003 Lateral and Connector Sewer Sediment Testing Costs = $200 per truck load (10 truckloads per mile)
62 Subprogram No 1B Interceptor and Trunk Sewer Cleaning
Disposal and Condition AssessmentInterceptor and trunk sewers are defined previously in the Interceptor and TrunkSewers technical memorandum A trunk sewer collects flows from lateral andconnector sewers for discharge into interceptor sewers These sewers are generallylarger than laterals ranging in size from 18rdquo to 10rsquo in diameter An interceptor seweris a large sewer that carries the wastewater flow from a number of trunk sewers to thewastewater treatment plant These sewers do not connect to any homes buildings or
7182019 Basis of Cost Estimates
httpslidepdfcomreaderfullbasis-of-cost-estimates 1167
Detroit Water and Sewerage DepartmentBasis of Cost Estimates
September 2003 9
catch basins Interceptor sewers are generally larger than trunk sewers (10rsquo or larger)An assessment of DWSD sewers indicated that there are 483 miles of trunk sewersand 83 miles of interceptors (39 miles serving Macomb County only) in the DWSDsewer system
621 Inspection
The CIP costs for inspection of interceptor and trunk sewers were developed with theassumption that inspection would be accomplished through sewer televising Othermethods such as diving may be more effective because of the larger sizes of pipesSewer televising consists of remote televising of sewers using robotically controlledcameras The estimate includes mobilization set up for camera entry and furnishingof all incidentals The estimate is unit cost per mile of pipe The CIP costs for theinspection of interceptor and trunk sewers were taken from Table A-1 which is basedon historical data This unit cost does not include contingencies
2003 Interceptor and Trunk Sewer Inspection Costs = $431 per linear foot ($22747 per mile)
63 Subprogram No 1C Lateral amp Connector SewerImprovements
Costs for improvements to the lateral and connector sewers in the DWSD system werederived These improvements can include the rehabilitation of the existing sewers orthe construction of new sewers to replace existing sewers to enhance the sewer systemwhere there are deficiencies This memorandum only considers the rehabilitation oflateral and connector sewers
631 Rehabilitation - Lateral and Connector Relining
There are a few different methods of rehabilitating sewers that were considered for
lateral and connector sewers These include chemical grouting of joints slipliningand cured-in-place-pipe (CIPP) CIPP was the preferred method used for the CIPestimates
CIPP Lining
CIPP lining is considered to be major rehabilitation CIPP installation includes theinstallation of Cured-In-Place Pipe mobilization sewer preparation and furnishing ofall incidentals
The service life of CIPP Lining is 50 years The CIP cost estimation for lateral andconnector sewer rehabilitation was derived from the recent pilot project performed by
Inland Waters for DWSD This information is found in the technical memorandumentitled Physical Inspection of Lateral and Connector Sewers For this project CIPPwas installed for several lengths of laterals and connectors within the DWSD systemThese unit costs do not include contingencies
2003 Lateral Sewer CIPP Rehabilitation Costs = $12235 per linear foot ($646000 per mile)
2003 Connector Sewer CIPP Rehabilitation Costs = $22030 per linear foot ($1163184 permile)
7182019 Basis of Cost Estimates
httpslidepdfcomreaderfullbasis-of-cost-estimates 1267
Detroit Water and Sewerage DepartmentBasis of Cost Estimates
September 2003 10
Table A-3 in Appendix A shows an alternate cost estimation for CIPP Lining based onhistorical data
64 Subprogram No 1D Interceptor and Trunk SewerImprovementsCosts for improvements to the interceptor and trunk sewers in the DWSD systemwere derived These improvements include the rehabilitation of the existing sewersand the construction of new sewers to replace existing sewers or to enhance thesewer system where there are deficiencies
641 Rehabilitation ndash Structural Repairs
The rehabilitation of the larger interceptor and trunk sewers requires methodsdifferent than for lateral and connector sewers In addition to a CIPP relining specificstructural repairs can be accomplished because the sewers are large enough to be
entered As a result of recent inspections of some of the interceptors and trunk sewersin the DWSD system some structural repairs were identified These can be found inthe CS-1158 report called Long Term CSO Plan for the Detroit and Rouge Rivers 1996These inspections covered approximately 886400 linear feet or about 30 of thesystem with structural repair costs (mostly CIPP lining) estimated at $18000000
Table A-3 shows the CIPP lining cost estimation based on historical data This tablehowever only goes up to 48rdquo pipe while the pipes used in this structural repaircalculation range from 24rdquo to 177rdquo The unit cost below is an extrapolation of Table A-3 and does not include contingencies
2003 Interceptor and Trunk Sewer Structural Repair Costs = $1000 per linear foot
642 Cleaning
Sewer Cleaning of the interceptor and trunk sewers consists of heavy cleaningutilizing a hydraulic sewer jetvacuum unit The estimate includes mobilization setup for jetvacuum truck and furnishing of all incidentals The CIP costs for thecleaning of interceptor and trunk sewers were taken from Table A-2 which is basedon historical data This unit cost does not include contingencies
2003 Interceptor and Trunk Sewer Heavy Cleaning Costs = $1641 per linear foot
643 Sludge RemovalAn analysis of inspection reports on interceptor and trunk sewers by TYJT calculatedthat sludge removal and disposal for 30 of the system would cost approximately$1867043 These can be found in the CS-1158 report called Long Term CSO Plan forthe Detroit and Rouge Rivers 1996 This sludge removal is considered to be heavycleaning and uses the costs from the historical data in Table A-2
2003 Interceptor and Trunk Sewer Sludge Removal Costs = $1641 per linear foot
7182019 Basis of Cost Estimates
httpslidepdfcomreaderfullbasis-of-cost-estimates 1367
Detroit Water and Sewerage DepartmentBasis of Cost Estimates
September 2003 11
644 Sediment Testing
A concern regarding the pipes in the DWSD system is that the buildup of sludgecontains toxic materials such as PCBs or mercury This sludge should be removedand disposed of in a different manner than the current sewer jet vacuum unitpractices (washing sludge down the sewers to the WWTP) Sludge removal should
therefore include a sampling station to test the sludge components and disposal ofhazardous material in a landfill Sludge amounts were obtained from inspectionreports found in the CS-1158 report called Long Term CSO Plan for the Detroit andRouge Rivers 1996 The cost per truckload comes from CDM and assumes two testsone each for PCBs and mercury would be performed on each load
2003 Interceptor and Trunk Sewer Sediment Testing Costs $200 per truck load (10 cu yds)
645 New Relief Sewers
DWSD previously identified areas of the system where relief sewers were neededThese areas were defined in Status Report on Storm Relief Sewer Program by DWSD
issued July 1975 reissued July 1978 The Wastewater Master Plan (WWMP) team hasreviewed these relief sewers (Local Alternatives for SSO Control technicalmemorandum) and concluded that the following may be needed pending furthersystem inspections and cleaning
7 Mile Road Reliefo 7920 ft of 120rdquo at depth of 30rsquoo 13200 ft of 120rdquo at depth of 25rsquo
Fenkell Reliefo 7920 ft of 156rdquo at depth of 25rsquoo 13200 ft of 192rdquo at depth of 10rsquo
Schoolcraft Reliefo 10560 ft of 192rdquo at depth of 15rsquo
Hubbell Reliefo 10660 ft of 144rdquo at depth of 10rsquoo 7920 ft of 144rdquo at depth of 20rsquo
Joy Clark Reliefo 6833 ft of 192rdquo at depth of 25rsquoo 27216 ft of 192rdquo at depth of 15rsquoo 169 ft of 120rdquo at depth of 10rsquo
The cost of construction of relief sewers was estimated in 1978 and again in 1996 forthe CS-1158 Long Term CSO Control Plan for the Detroit and Rouge Rivers Volume3 1004 C1 Alternative Evaluations (Table C4 in Alternative 6) Table A-4 shows the1996 estimates as well as the 2003 costs derived by escalation using the CCI Thecosts from this table used for the new relief sewer cost are shown here
120rdquo at depth of 10rsquo Costs = $1289 per linear foot
120rdquo at depth of 25rsquo Costs = $1557 per linear foot
7182019 Basis of Cost Estimates
httpslidepdfcomreaderfullbasis-of-cost-estimates 1467
Detroit Water and Sewerage DepartmentBasis of Cost Estimates
September 2003 12
120rdquo at depth of 30rsquo Costs = $1712 per linear foot
144rdquo at depth of 10rsquo Costs = $1389 per linear foot
144rdquo at depth of 20rsquo Costs = $1579 per linear foot
156rdquo at depth of 25rsquo Costs = $1938 per linear foot
192rdquo at depth of 10rsquo to 15rsquo Costs = $2399 per linear foot
192rdquo at depth of 25rsquo Costs = $2771 per linear foot
646 Future Modeling
The CIP cost estimation has included future modeling of the DWSD sewer systemThis modeling of data from the Segmented Facilities plan is scheduled to take placefrom 2008 to 2010 The estimate from CDM includes contingencies
2003 Future Modeling Costs = $100000
647 Oakwood Interceptor
A cost estimate was prepared for the installation of a new redundant sewer systemparallel to the Oakwood Interceptor section of the NW Interceptor This estimate wasperformed by Tetra Tech MPS and can be found in the CS-1314 technicalmemorandum entitled Conceptual Plan for Oakwood Northwest Interceptor revisedMay 2003 The estimate does not include contingencies
2003 Oakwood Redundant Interceptor Costs = $8700000
648 Macomb Meter Stop Gates
A project is proposed to install stop gates at meters CV-3 and MB-25 in MacombCounty The estimate from SDA and found in the technical memorandum entitledCapital Improvement Programs for Macomb County does not include contingencies
2003 Stop Gate Installation Costs = $1700000 each
649 North Gratiot Interceptor
This project will install the new North Gratiot Interceptor Sewer (NGIS) in MacombCounty The estimate from SDA and found in the technical memorandum entitled
Capital Improvement Program for Macomb County includes contingencies
2003 NGIS Installation Costs = $40000000
6410 Northwest Interceptor Improvements
This project includes improvements to the Northwest Interceptor Sewer (NWIS) from8 Mile Road to the WWTP This estimate was performed by Tetra Tech MPS and can
7182019 Basis of Cost Estimates
httpslidepdfcomreaderfullbasis-of-cost-estimates 1567
Detroit Water and Sewerage DepartmentBasis of Cost Estimates
September 2003 13
be found in the technical memorandum entitled Conceptual Plan for OakwoodNorthwest Interceptor The estimate does not include contingencies
2003 10rsquo Diameter Lining Costs = $1000 per linear foot
2003 10rsquo Diameter Replacement Sewer Costs = $2500 per linear foot
65 Subprogram No 1E Manholes and Catch BasinImprovements
Inspection and repair of sewer structures in the DWSD system are required to ensurethe system operates efficiently Therefore the CIP estimated costs for the inspectionand repair of manholes and catch basins
651 Manhole Inspections
Manhole inspection consists of either topside inspection or full inspection Table A-5
in Appendix A shows the estimate in unit cost per manhole inspection based onhistorical data The CIP estimate for manhole inspections assumes 5 of themanholes in the system will undergo topside inspection every year This unit costdoes not include contingencies
2003 Manhole Inspection Costs = $52 per structure
652 Manhole Repairs
Manhole repairs can consist of
Manhole wrapping
External chemical grout Manhole shelf repair Manhole channel repair Pipe connection repair Raising replacing manhole frames
Each repair is separate The CIP estimate assumes that the quantity of manholesneeding the above categories of repairs varies with the amounts per inspection cycleas follows
5 need manhole wrapping 8 need external chemical grout 10 need manhole shelf repair 10 need manhole channel repair 10 need pipe connection repair 15 need raising replacing manhole frames
2003 Manhole Wrapping Costs = $215 per structure
2003 External Chemical Grouting Costs = $1938 per structure
7182019 Basis of Cost Estimates
httpslidepdfcomreaderfullbasis-of-cost-estimates 1667
Detroit Water and Sewerage DepartmentBasis of Cost Estimates
September 2003 14
2003 Manhole Shelf Repair Costs = $646 per structure
2003 Manhole Channel Repair Costs = $646 per structure
2003 Pipe Connection Repair Costs = $538 per structure
2003 Manhole Frame Replacement Repair Costs = $646 per structure
653 Manhole Replacement
Manhole installation (replacement) includes
Pre-cast reinforced concrete manholes risers and cones cast-in-place basesframes castings steps
Excavation and backfill of common earth Sheeting shoring bracing and dewatering Up to 6rdquo of bituminous pavement removal and replacement
And furnishing of all incidentals
Table A-6 in Appendix A shows the estimate in unit cost per vertical linear foot ofinstallation based on historical information This estimate for manhole replacementassumes that manholes are 4 in diameter and 15 deep and that 2 would need to bereplaced for each inspection cycle (20 years) This unit cost does not includecontingencies
2003 Manhole Replacement Costs = $6053 per manhole
654 Catch Basin Cleaning
The CIP cost estimations assume that all 200000 catch basins will be cleaned everycycle Table A-7 in Appendix A shows the cost per catch basin Catch basin cleaningincludes labor trucks and disposal This unit cost does not include contingencies
2003 Catch Basin Cleaning Costs = $59 per catch basin
655 Catch Basin Repair
The CIP cost estimation for catch basin repair assumes that the repairs will be pipeconnection repair and frame replacement as shown in Section 652 for manholesThese unit costs do not include contingencies
2003 Catch Basin Pipe Connection Repair Costs = $538 per catch basin
2003 Catch Basin Frame Replacement Costs = $646 per catch basin
66 Subprogram No 1F Regulators Outfalls Backwater GatesDiversion Dams and In-System Storage661 Outfall Flow Regulators Inspection
Outfall regulator inspection includes inspection and report writing
7182019 Basis of Cost Estimates
httpslidepdfcomreaderfullbasis-of-cost-estimates 1767
Detroit Water and Sewerage DepartmentBasis of Cost Estimates
September 2003 15
The cost estimate assumes that a five-person crew can dive and inspect two outfallregulators each day The cost per day for a five-person crew is $6000day as shownin an invoice for the installation of backwater gate sensors for the Baby Creek outfallIt should be noted that some outfall regulators might cost more to inspect than othersdepending on regulator accessibility and condition This unit cost does not includecontingencies
2003 Outfall Regulator Inspection Costs = $3000 per average outfall regulator
662 Outfall Flow Regulators Rehabilitation
Outfall regulator rehabilitation includes cleaning and inspection of the regulatorfloat and sump chamber removal of existing regulator gates and associatedcomponents removal of flap gates and sluice gates rehabilitation of regulator floatreplacement of access manhole frames and covers installation of new slide gates andflexible flap gates and temporary diversion of sewage flow
Regulator rehabilitation was performed under Contract PC-695 Regulator RemoteFlow Control Structures and Dam Rehabilitation This project rehabilitated 40 gatesfor a total cost of $7708000 The average cost of $192700 per gate is rounded to$200000 per gate This contract ended in 2000 so the cost is escalated to $218000using a CCI escalation factor of 1077 It should be noted that some outfall regulatorsmight cost more to rehabilitate than others depending on regulator accessibility andcondition This cost estimate includes any contingencies
2003 Outfall Regulator Rehabilitation Costs = $218000 per average outfall regulator
663 Outfall Flow Regulators Replacement
Outfall regulator replacement includes the mechanical work described in the outfallregulator rehabilitation work described above and additionally replacement of theconcrete regulator chamber
As noted above the cost for the mechanical equipment replacement is $218000 peroutfall regulator It is assumed that the regulator junction chamber replacement costswould be similar to the influent junction chamber construction costs for the St AubinScreening and Disinfection Facility Contract PC-731 The contractor has provided adetailed cost estimate which indicates that the construction cost for this junctionchamber would be $105000 An additional $10000 is added for destruction andremoval of the existing regulator chamber In summary the regulator replacementcosts are
Installation of mechanical components = $218000
Construction of new regulator chamber = $105000
Destructionremoval of existing regulator chamber = $10000
Total = $333000
7182019 Basis of Cost Estimates
httpslidepdfcomreaderfullbasis-of-cost-estimates 1867
Detroit Water and Sewerage DepartmentBasis of Cost Estimates
September 2003 16
Although the mechanical components portion includes some contingencies the unitcost here does not include contingencies
2003 Outfall Regulator Replacement Costs = $333000 per average outfall regulator
664 Outfall Backwater Gate and Diversion Dam Inspection
Outfall inspection includes inspection and report writing Backwater gates anddiversion dams are inspected at the same time as outfalls and do not require anyadditional costs The cost estimate assumes that a five-person crew can dive andinspect two outfalls each day
The cost per day for a five-person crew is $6000day as shown in an invoice for theinstallation of backwater gate sensors for the Baby Creek outfall It should be notedthat some outfalls might cost more to inspect than others depending on outfall sizedepth number of conduits and condition This unit cost does not includecontingencies
2003 Outfall Inspection Costs = $3000 per average outfall
665 Outfall Rehabilitation
Outfall rehabilitation includes repair work at each outfall as needed
The cost estimate is based on outfall rehabilitation costs budgeted for the DWSDcontract DWS 849850 Inspection and In-place Rehabilitation of Outfalls The costfor this project is $15540000 for rehabilitation of twelve outfalls This results in anaverage cost of $1295000 per outfall The cost shown is an average amount for alloutfalls Outfall rehabilitation costs can vary widely because the work involvedcould range from nothing to significant structural repairs This unit cost does include
contingencies
2003 Outfall Rehabilitation Costs = $1295000 per average outfall
666 Outfall Replacement
Outfall replacement includes removal of the existing outfall and installation of a newoutfall from the junction chamber to the river
Outfall replacement costs are estimated based on the equivalent installation of a sewerline for the average size length and depth outfall The average outfall calculationsassume that outfalls with multiple barrels can be represented by a longer length of
single barrel outfall For example a double barrel outfall with a length of 15 ft can beconsidered a single barrel outfall with length 30 ft Similarly outfalls with box eggor arch shapes are converted to cylinders with equivalent diameters For example a10 ft x 10 ft box sewer is considered equivalent to an 113 ft diameter cylinder Theseconsiderations are used to calculate the average length and diameter for all outfallsThe average outfall is 85 ft in diameter and 1280 ft in length Outfall depth is notreadily available and is assumed to be 10 ft
7182019 Basis of Cost Estimates
httpslidepdfcomreaderfullbasis-of-cost-estimates 1967
Detroit Water and Sewerage DepartmentBasis of Cost Estimates
September 2003 17
The replacement cost for the average size and length outfall can then be calculatedbased on the cost of installation of a new sewer with these dimensions The costs forsewer installation as a function of size and depth are displayed in Table A-4 Thistable indicates that the replacement cost for an 85 ft diameter 1280 ft long and 10 ftdeep outfall would be about $12600000 It should be noted that outfall replacementcosts would vary significantly because of differences in size number of conduits anddepth below the surface This unit cost does not include contingencies
2003 Outfall Replacement Costs = $12619680 per average outfall
667 Backwater Gate Rehabilitation
Backwater gate rehabilitation includes cleaning leak repair repairreplacement ofrotted or deteriorated timber and repairreplacement of hardware
The estimated total cost for repair of twelve backwater gates under Contract CS-1158Long Term CSO Control Plan for the Detroit and Rouge Rivers (1996) is $182000This results in an average cost of $15200 per gate This cost is then multiplied by aCCI escalation factor resulting in an average 2003 cost of $18100 per gate This cost isthen rounded to $20000 for the estimate Actual backwater gate rehabilitation costswill vary considerably depending on the condition and accessibility of the gate Thisunit cost does include contingencies
2003 Backwater Gate Rehabilitation Costs = $20000 per average backwater gate
668 Backwater Gate Replacement
Backwater gate replacement includes replacement of the backwater gates andassociated stop logs
The cost for installation of two backwater gates and associated stop logs at the StAubin Screening and Disinfection Facility is $336000 according to the detailed costbreakdown for Contract PC-731 St Aubin Screening and Disinfection Facility It isassumed that removal of the existing gates and other site work would costapproximately $14000 This results in a total cost of $350000 for the installation oftwo gates at one location There are 154 gates at 54 locations or an average of 281gates per location It is assumed that the cost of gate replacement is proportional tothe total number of gates Hence the cost for replacing all of the gates would be
$350000 2 gates 154 gates all locations = $26460000
$26460000 54 locations = $490000 per location
This cost was then multiplied by a CCI escalation factor to obtain a 2003 average costof $517000 per location It should be noted that the cost at each location would varybased on the number and size of backwater gates and stop logs This unit cost doesnot include contingencies
2003 Backwater Gate Replacement Costs = $517000 per average backwater gate
7182019 Basis of Cost Estimates
httpslidepdfcomreaderfullbasis-of-cost-estimates 2067
Detroit Water and Sewerage DepartmentBasis of Cost Estimates
September 2003 18
669 Diversion Dam Rehabilitation
Diversion dam rehabilitation includes cleaning and repair of deteriorated damsurfaces restoration of connection between dam surface and bottom of flashboardsand repairreplacement of associated stop logs
The needed repairs are identified in the CS-1314 Review of Collection SystemRegulators and Outfalls technical memorandum revised May 2003 The cost fordiversion dam rehabilitation is based on simple cost estimates for a three man crewworking two days The average cost for diversion dam rehabilitation based on threelocations is $1000 per dam It should be noted that diversion dam rehabilitation costswill vary based on the size type and condition of the diversion dam This unit costdoes not include contingencies
2003 Diversion Dam Rehabilitation Costs = $1000 per average diversion dam
6610 Diversion Dam Replacement
Diversion dam replacement includes the installation of a new inflatable dam at theexisting location This cost also includes the cost of removing the existing diversiondam
The cost for diversion dam replacement is based on the detailed cost breakdown forContract PC-731 St Aubin Screening and Disinfection Facility The installation costfor an inflatable diversion dam according to this contract is $70000 This cost ismultiplied by a CCI escalation factor to get a 2003 installation cost of $74000 It isassumed that there is an additional cost of $10000 for destruction and removal of theexisting diversion dam and other site work The total cost for diversion damreplacement is $84000 per dam The cost of each diversion dam will vary based on
dam size and accessibility This unit cost does not include contingencies
2003 Diversion Dam Replacement Costs = $84000 per average diversion dam
6611 In-System Storage Devices amp System Gate Inspection
In-system storage device (ISSD) inspection includes inspection and report writingThe cost estimate assumes that a three-person crew can inspect one ISSD each dayThe cost for one three-person crew should be about $3000 This unit cost does notinclude contingencies
2003 ISSD Inspection Costs = $3000 per ISSD
6612 In-System Storage Devices amp System Gate Rehabilitation
ISSD rehabilitation includes removal of existing regulator gates and associatedcomponents removal of existing operating systems for the regulator gatesinstallation of new slide gates with self-enclosed hydraulic operating systemsinstallation of instrumentation and control systems for remote operation of the slidegates from the SCC
7182019 Basis of Cost Estimates
httpslidepdfcomreaderfullbasis-of-cost-estimates 2167
Detroit Water and Sewerage DepartmentBasis of Cost Estimates
September 2003 19
This type of work was performed under Contract PC-695 Regulator Remote FlowControl Structures and Dam Rehabilitation This project rehabilitated 40 gates for atotal cost of $7708000 The average cost of $192700 per gate was rounded to$200000 per gate This contract ended in 2000 so the cost was then escalated to$218000 using a construction cost escalation factor It should be noted that someISSDs cost more to rehabilitate than others depending on ISSD type accessibility andcondition This unit cost does include contingencies
2003 ISSD Rehabilitation Costs = $218000 per ISSD
6613 In-System Storage Devices amp System Gate Replacement
ISSD replacement includes removal of all existing ISSD mechanical electrical andinstrumentation components and replacement with new components
ISSD replacement costs are based on Contract PC-747 In-System Storage Under thiscontract thirteen new ISSDs were installed for a total cost of $26400000 This wouldresult in an average cost of $2030000 per ISSD It is assumed that this installationcost is comparable to the average ISSD replacement cost It should be noted that ISSDreplacement costs would vary depending on the size type and accessibility of thedevice This unit cost does include contingencies
2003 ISSD Replacement Costs = $2030000 per ISSD
67 Subprogram No 1G Pump Stations671 Inspections
Pump station inspection includes inspection of the structural condition of the stationand wet well (if equipped) pump testing and inspection of the instrumentation and
control devices
The pump station inspection costs are estimated to run about $1000 per pump fortesting based on a cost breakdown from Contract PC-744 Wastewater TreatmentPlant Rehabilitation and Program Management It was assumed that it would take anengineer about 25 weeks to inspect the pump station and write a report At $100 perhour this would cost $10000 per pump station This unit cost does not includecontingencies In summary pump station inspection costs include
Pump testing = $1000 per pump
Pump station inspection and report writing = $10000 per pump station
2003 Pump Station Inspection Costs = $10000 per pump station + $1000 per pump
672 Rehabilitation
Pump station rehabilitation includes pump and motor testing station cleaningpainting and repair repairreplacement of damaged pump motor control panelparts and minor pump station structural repairs
7182019 Basis of Cost Estimates
httpslidepdfcomreaderfullbasis-of-cost-estimates 2267
Detroit Water and Sewerage DepartmentBasis of Cost Estimates
September 2003 20
The pump station rehabilitation costs can be estimated based on the total pumpstation rehabilitation costs estimated for Contract PC-744 Wastewater TreatmentPlant Rehabilitation and Program Management In the PC-744 report the total costfor immediate short-term and long term rehabilitation routine and long lead timespare parts CMMS system and motor repairreplacement was $7737500 It isassumed that this cost is representative of pump rehabilitation needs for each five-year interval This cost does not include contingencies
2003 Pump Station Rehabilitation Costs = $7737500 for rehabilitation of all pump stations
673 Major Rehabilitation
Major rehabilitation of pump stations includes the capital cost of renovating awastewater pump station including all pumps and related equipment
The cost for pump station major rehabilitation was estimated by CDM and for theTetra Tech MPS alternatives development (technical memoranda Expanded Facilitieswithin the City of Detroit Technical Feasibility of Satellite Treatment and TechnicalFeasibility of a Wet Weather Flow Treatment Facility) and is found in Table A-9aPump station major rehabilitation will vary considerably depending on pump stationand wet well condition number and capacity of pumps and instrumentation andcontrol requirements Table A-9b shows the breakdown of these costs into low orhigh flow categories The average flow of DWSD pump stations is more than 500MGD so the high flow cost is used for the CIP This unit cost does not includecontingencies
2003 Pump Station Major Rehabilitation Costs (500 + MGD)= $20000000 for the average pump station
674 Energy ManagementThe CIP estimates reflect the need for better energy management in terms of pumps atthe pump stations This is expected to be accomplished through the installation ofvariable-frequency drives (VFD) on these pumps The CIP includes VFD installationat the Clintondale and Woodmere Pump Stations The estimate based on thetechnical memorandum entitled Energy Management was made by TYJT and did notinclude contingencies The following estimate has had contingencies added
2003 Energy Management Costs (VFD installation at Clintondale and Woodmere) =$682500
68 Subprogram No 1H Meters681 Inspection and Maintenance
Flow meter maintenance includes maintenance repair and some replacement (mostlymechanical but some structural) of current meters billing and database managementand dye testingflow accuracy The costs shown are based on the maintenancebudget for CS-1249 Greater Detroit Regional Sewer System Model ndash Billing Meter
7182019 Basis of Cost Estimates
httpslidepdfcomreaderfullbasis-of-cost-estimates 2367
Detroit Water and Sewerage DepartmentBasis of Cost Estimates
September 2003 21
Program This project maintains 50 meters with an annual budget of $2000000 Thisunit cost does include contingencies
2003 Meter Maintenance Costs = $40000average meter
682 Replacement
Flow meter replacement includes meter equipment and installation costs as well asmeter vault replacement The CIP cost is based on a CDM estimate from the CS-1249Greater Detroit Regional Sewer System Model ndash Billing Meter Program and isrepresentative of the average meter Meter replacement costs may vary considerablydepending on the type and location of the meter This unit cost does not includecontingencies
2003 Meter Replacement Costs = $500000average meter
683 Macomb Odor Control
Some additional specific projects were included in the CIP estimation These involveodor control measures at 12 Macomb County meter chambers through the installationof carbon adsorption units The estimates are based on the CS-1292 Task Order Nos33 and 34 Final Draft Report that did not include contingencies The followingestimate has had contingencies added
2003 Macomb County Odor Control Costs = $772500
7 Program 2 CSO and SSO Control Program
71 Ongoing CIP Projects
The WWMP CIP estimation has identified several projects included in the current CIP
that have carry-over costs These rollover CIP costs are as shown in Table A-8 andinclude any contingencies
2003 Ongoing CIPRollover Costs = $617759000
72 New ProjectsThe WWMP CIP estimation has identified some new CSO projects These CIP costsare as shown below and include any contingencies The Detroit River CSO is basedon an estimate of $25000000 per outfall assuming the construction of a screening anddisinfection facility
Table 2 New CSO Project Costs
Project CIP Cost
Lower Rouge River Outfalls $25000000
Detroit River CSOs ndash Upper Range $750000000
Detroit River CSOs ndash Lower Range $375000000
Based on half as many outfalls constrd
7182019 Basis of Cost Estimates
httpslidepdfcomreaderfullbasis-of-cost-estimates 2467
Detroit Water and Sewerage DepartmentBasis of Cost Estimates
September 2003 22
73 CSO RehabilitationThe WWMP also considered the rehabilitation of the CSOrsquos in the DWSD system Theupper range estimate assumes that the rehabilitation costs would be approximately1 of the CSO construction costs The table below shows the construction and CIPrehabilitation costs without contingencies It is assumed that each facility will be
rehabilitated annually from 2008 to 2050 The lower range estimate assumes a yearlyrehabilitation cost
Table 3 Upper Range CSO Rehabilitation Costs
Facility Construction Cost RehabilitationCost (each)
Conner Creek CSO $199049172 $1990492
Fox Creek CSO $11582891 $ 115829Leib CSO $31327898 $ 313279
St Aubin CSO $21540250 $ 215403Upper Rouge CSO $418000000 $4180000
Baby Creek CSO $50389000 $ 503890
7 Mile CSO $17638861 $ 176389Fenkell CSO $22281777 $ 222818
Hubbell Southfield CSO $67975783 $ 679758
Belle Isle CSO $14960000 $ 149600
2003 Lower Range CSO Rehab Costs = $6000000 per year
8 Program 3 System Control and Wastewater Treatment
Program81 Wastewater Treatment Plant Ongoing and MajorRehabilitationThe DWSD Wastewater Treatment Plant (WWTP) is the largest facility in the DWSDsewer system An overall assessment of funding needed for the WastewaterTreatment Plant Program was first estimated for planning purposes by summarizingthe current yearly funding for wastewater treatment plant programs This data issummarized in Table 61 and additional information is presented in Table A11 inAppendix A
Table 4 shows that current proposed expenditures have increased from about $99million from the 1997-2002 CIP to $175 million in the 2002-07 CIP However thisamount includes many projects that are not directly related to the WastewaterTreatment Plant such as work at system pump stations Deleting these projects thetotal is closer to $134 million per year
7182019 Basis of Cost Estimates
httpslidepdfcomreaderfullbasis-of-cost-estimates 2567
Detroit Water and Sewerage DepartmentBasis of Cost Estimates
September 2003 23
Table 4 Summary of CIP Proposed Expenditures on the DWSD WastewaterTreatment Plant and System Control
CIP
Total Proposed WWTP CIP
Expenditures (over 5 years)
Yearly WWTP Expenditure
Average
(over 5 years)
20023 to 20067 $878M $175M
20023 to 20067 (deleting
non-WWTP projects)
$670M $134M
20012 to 20056 $973M $194M
19978 to 20012 $493M $99M
Source Sewage Disposal System Capital Improvement Program Descriptions Financial Planning Division
DWSD
Detroit Wastewater Partners the program managers for the PC-744 wastewater plant
upgrade reviewed this initial information in a meeting on January 31 2003Expenditures on renewal and replacement of wastewater treatment plant componentsare typically 3 of the value of the wastewater plant per year for large plants Anestimated value for the Detroit Wastewater Plant is about $5 billion Expenditures of3 of the plant value result in an estimate of $150 million per year as a reasonabletarget to maintain a functioning plant including replacement and upgrade oftreatment processes as technology improves This estimate is summarized in the firstcolumn in Table 5
Table 5 Summary of CIP Proposed Funding Estimates for the DWSDWastewater Treatment Plant and System Control
Original Estimate
Proposed WWTP CIP Yearly
Funding Requirements
(including Process
Improvements)
Revised Estimate from
DWP and DWSD Plant
Staff of Proposed WWTP
Yearly Funding
Requirements
Wastewater Treatment Plant -
Ongoing Renovation and Repairs
$80M $55-70M
Major Renovation of the Wastewater
Treatment Plant
$40M --
System Controls and RegionalOperations
$30M $15M
TOTAL $150M $70-85M
A successful ongoing program of repair and replacement at the WastewaterTreatment Plant cannot be conducted without periodic inspections and updates to theNeeds Assessment The cost of this program is estimated at $100 - 200000 ifconducted yearly If not completed yearly the cost would be higher
7182019 Basis of Cost Estimates
httpslidepdfcomreaderfullbasis-of-cost-estimates 2667
Detroit Water and Sewerage DepartmentBasis of Cost Estimates
September 2003 24
For the 50-year Capital Improvements Program the estimate of $150M for theWastewater Treatment Plant and System Controls was used for assessing rateimpacts as it is a realistic (see Volume 5 Customer Service and Technical SupportProgram) Subsequently in July 2003 a more detailed review of facility needs for theWastewater Treatment Plant and System Controls by Detroit Wastewater Partnersand the Wastewater Treatment Plant staff resulted in a revised estimate shown in thesecond column in Table 5 Note that this estimate includes a much lower cost forongoing renovations to System Controls Also this estimate does not include majorrenovations that would change the treatment process
The Detroit Wastewater Partners estimate of yearly funding requirements was basedon an assessment of the anticipated life and replacement cost of assets at theWastewater Treatment Plant This estimate is summarized in Table D1 in AppendixD of this report Background data from this analysis is included in the spreadsheetslinked to Appendix D
Historical information summarizing expenditures on the plant over the last ten yearswas compared to the $150M estimate Figure 1 shows the magnitude of the dramaticincrease in project expenditures at the Wastewater Treatment Plant in the last fouryears to address the requirements of the Federal Court Upgrades were required totreatment units that were last renovated more than 20 years ago These upgrades didnot include totally new treatment technologies
While this level of expenditure is not expected to continue indefinitely the averagelevel of expenditures over the next fifty years may approach $150M if new treatmenttechnologies are required to replace the current system This would become
necessary if 1) permit limits or other regulatory requirements change or 2) if spaceconstraints and growth in the amount of wastewater treated made expansion of theplant necessary Even without these changes another major renovation of the plant islikely 20 years after the current renovation or in the decade 2020-2030 If onlyongoing replacement and repair of the Wastewater Plant and System Controls isrequired however the estimated CIP requirements for the Wastewater TreatmentPlant and System Controls may be considerably less
7182019 Basis of Cost Estimates
httpslidepdfcomreaderfullbasis-of-cost-estimates 2767
Detroit Water and Sewerage DepartmentBasis of Cost Estimates
September 2003 25
Figure 1
Detroit Wastewater Treatment Plant
Capital Expenditures - 10 Years
$-
$50
$100
$150
$200
$250
1992-1993
1993-1994
1994-1995
1995-1996
1996-1997
1997-1998
1998-1999
1999-2000
2000-2001
2001-2002
Fiscal Year
M i l l i o n s
7182019 Basis of Cost Estimates
httpslidepdfcomreaderfullbasis-of-cost-estimates 2867
Detroit Water and Sewerage DepartmentBasis of Cost Estimates
September 2003 26
Appendix A
Data Tables Used for CIP
7182019 Basis of Cost Estimates
httpslidepdfcomreaderfullbasis-of-cost-estimates 2967
Detroit Water and Sewerage DepartmentBasis of Cost Estimates
September 2003 27
Appendix A ndash Data Tables Used for CIPThe April 2002 version of this technical memo contained several tables that were usedfor the actual CIP cost estimates for the WWMP These tables use 2000 costssometimes based on historical data escalated using the BCI instead of the CCI TheCIP estimates use 2003 data with CCI escalations This section contains these original
tables as well as the recalculated tables The sources listed in these tables are shownin table B-10 in section B15
Sewer Inspection Costs
The only number from Table A-1 used for the CIP estimation is the unit cost for the54-90rdquo category Table A-1 shows this data escalated using the CCI The averagesfrom the 2003 CCI category are used for the CIP
Table A-1Historical Sewer Inspection Costs
SizeSource Unit
CostLF Year2003 Unit CostLF
(CCI) Source
8 - 24 $130 1982 $228 5
$125 2000 $135 15
$080 1988 $119 8
$150 2000 $162 21
Avg $161
27 - 48 $100 1999 $111 2
$225 1999 $249 11
$225 1996 $268 13
$200 2000 $215 21
Avg $211
54 - 90 $300 2000 $323 21
$500 2000 $538 21
Avg $431
Sewer Cleaning CostsAll 2000 data used for Table A-2 comes from historical sources from 1988 to 2000 Theaverages from the 2003 CCI category are used for the CIP
7182019 Basis of Cost Estimates
httpslidepdfcomreaderfullbasis-of-cost-estimates 3067
Detroit Water and Sewerage DepartmentBasis of Cost Estimates
September 2003 28
Table A-2Historical Sewer Cleaning Costs
TaskSource Unit
CostLF Year2003 Unit
CostLF (CCI) Source
PrepCleaning $085 1988 $126 8
$125 2000 $135 15
$200 2000 $215 21
$300 2000 $323 21
$400 2000 $431 21
$500 2000 $538 21
Avg $295
HeavyCleaning $1750 1999 $1934 2
$1200 2000 $1292 20
$1500 2000 $1615 20
$1600 2000 $1723 20
Avg $1641
CIPP Lining CostsAll 2000 data used for Table A-3 comes from historical sources from 1988 to 2000 and
was escalated to 2000 using the BCI The averages from the 2003 CCI category areused for the CIP
Table A-3Historical CIPP Lining Costs
SizeSource Unit
CostLF Year2003 Unit CostLF
(CCI) Source
8 $5800 1982 $10156 5
$6000 1982 $10507 5
$6500 1999 $7184 6
Avg $9282
10 $8000 1999 $8842 6
$8600 1988 $12747 8
Avg $10795
7182019 Basis of Cost Estimates
httpslidepdfcomreaderfullbasis-of-cost-estimates 3167
Detroit Water and Sewerage DepartmentBasis of Cost Estimates
September 2003 29
SizeSource Unit
CostLF Year2003 Unit CostLF
(CCI) Source
12 $6000 1982 $10507 5
$9500 1999 $10500 6
$12800 1988 $18972 8
$9400 1988 $13933 8
Avg $13478
15 $12800 1988 $18972 8
$10800 1988 $16008 8
Avg $17490
18 $12800 1988 $18972 8
Avg $18972
21 $10500 1982 $18387 5
$23000 2000 $24764 20
Avg $21575
24 $16300 1988 $24160 8
$27300 2000 $29393 20
Avg $26776
27 $30000 2000 $32300 20
Avg $32300
30 $36000 2000 $38760 20
Avg $38760
36 $44500 2000 $47912 20
Avg $47912
42 $53300 2000 $57387 20
Avg $57387
48 $62000 2000 $66754 20
Avg $66754
7182019 Basis of Cost Estimates
httpslidepdfcomreaderfullbasis-of-cost-estimates 3267
Detr
September 2003
Table A-4New Relief Sewer Installation Costs
Cost of Sewers-in-Place per Linear Foot at Various Depth Ranges
D e p t h
0 ndash 10 Ft 10 ndash 15 Ft 15 ndash 20 Ft 20 ndash 25 Ft 25 ndash
Size 1996 2003 1996 2003 1996 2003 1996 2003 1996
21 $174 $207 $226 $269 $281 $335 $341 $406 $395
24 $218 $260 $278 $331 $333 $397 $393 $468 $470
27 $262 $312 $330 $393 $385 $459 $445 $530 $503
30 $306 $365 $382 $455 $437 $521 $497 $592 $557
36 $350 $417 $434 $517 $489 $583 $549 $654 $611
42 $394 $470 $486 $579 $541 $645 $601 $716 $665
48 $438 $522 $538 $641 $593 $707 $653 $778 $719
54 $482 $574 $590 $703 $645 $769 $705 $840 $773
60 $530 $632 $641 $764 $698 $832 $755 $900 $830
66 $567 $676 $686 $818 $744 $887 $802 $956 $882
72 $604 $720 $731 $871 $790 $942 $849 $1012 $934
78 $641 $764 $776 $925 $836 $996 $896 $1068 $986
84 $678 $808 $821 $978 $882 $1051 $943 $1124 $1037
90 $715 $852 $866 $1032 $928 $1106 $990 $1180 $1089
7182019 Basis of Cost Estimates
httpslidepdfcomreaderfullbasis-of-cost-estimates 3367
Detr
September 2003
Cost of Sewers-in-Place per Linear Foot at Various Depth Ranges
D e p t h
0 ndash 10 Ft 10 ndash 15 Ft 15 ndash 20 Ft 20 ndash 25 Ft 25 ndash
Size 1996 2003 1996 2003 1996 2003 1996 2003 1996
96 $753 $897 $911 $1086 $974 $1161 $1037 $1236 $1140
102 $953 $1136 $1018 $1213 $1084 $1292 $1181
108 $995 $1186 $1063 $1267 $1131 $1348 $1222
114 $1037 $1236 $1107 $1319 $1178 $1404 $1263
120 $1081 $1288 $1153 $1374 $1225 $1460 $1306
132 $1123 $1338 $1197 $1427 $1272 $1516 $1372
144 $1165 $1388 $1245 $1484 $1325 $1579 $1439
156 $1407 $1677 $1497 $1784 $1626
168 $1590 $1895 $1692 $2017 $1837
180 $1797 $2142 $1912 $2279 $2076
192 $2013 $2399 $2141 $2552 $2325
204 $2254 $2686 $2398 $2858 $2604
7182019 Basis of Cost Estimates
httpslidepdfcomreaderfullbasis-of-cost-estimates 3467
Detroit Water and Sewerage DepartmentBasis of Cost Estimates
September 2003 33
Table A-5Manhole Inspection Costs
Repair Type 2000 UnitCost
2003 UnitCost
TopsideInspection $50 $52
Full Inspection $150 $162
Manhole Replacement Costs
All 2000 data used for Table A-6 comes from historical sources from 1971 to 2000 andwas escalated to 2003 for the CIP
Table A-6Historical Manhole Replacement Costs
SizeSource UnitCostVLF Year
2003 Unit CostVLF(CCI)
4 $12000 1985 $19160
$22500 1999 $24869
$16250 1999 $17961
$10000 1971 $42366
$18000 1999 $19895
$10400 1971 $44060
$10900 1971 $46178
$10300 1971 $43637$18750 1990 $26540
$12500 1990 $17693
$16250 1971 $68844
$17500 1971 $74140
$18700 1971 $79224
Avg $40351
5 $25000 1990 $35387
$18750 1990 $26540$18750 1999 $20724
$22000 1999 $24316
Avg $26742
7182019 Basis of Cost Estimates
httpslidepdfcomreaderfullbasis-of-cost-estimates 3567
Detroit Water and Sewerage DepartmentBasis of Cost Estimates
September 2003 34
SizeSource UnitCostVLF Year
2003 Unit CostVLF(CCI)
6 $29000 1999 $32053
$21250 1999 $23487
Avg $27770
7 $26000 1998 $29417
$35000 1998 $39600
$18750 1985 $29937
$25000 1985 $39917
$37000 1999 $40895
Avg $35953
8 $118750 1999 $131252
$95000 1996 $113222
Avg $122237
The manhole replacement for the CIP assumes the average manhole is 4 in diameterand 15 deep This calculates as follows Each manhole installation = $40351 X 15 =$605265
Table A-7Catch Basin Cleaning Costs
Item Quantity Unit Cost Total Per Year
Labor Cost 33 each $50 per hour $3432000 $3432000
Truck Cost 12 each $350000 $4200000 $420000
Disposal Cost 66667 each $1 $66667 $66667
Cost per Catch Basin $59
7182019 Basis of Cost Estimates
httpslidepdfcomreaderfullbasis-of-cost-estimates 3667
Detroit Water and Sewerage DepartmentBasis of Cost Estimates
September 2003 35
Table A-8CSO CIP Rollover Costs
Project Total Cost CIP RolloverCost
Upper Rouge River Complete CSO Facility $481000000 $362000000
City of Detroit Downspout Disconnects (current CIP runsthrough 2008 estimate for 2008 to 2050)
$208000000 $165000000
Oakwood Pump StationCSO Basin NA $86000000
LTCSO Program Management (current CIP runs through2008 estimate for 2008 to 2050)
NA $4759000
Pump Station Replacement Major RehabilitationPump Stations installation includes the capital cost of constructing a wastewaterpump station including all pumps and related equipment The CIP estimate does notreflect the replacement of any pump station as major rehabilitation is thought to be
adequate Tables A-9a shows the major rehabilitation estimate in unit cost x $1000per pump station dependent on the size of the station Table A-9b shows thebreakdown of these costs into low or high flow categories
Table A-9aPump Station Replacement Costs
Size 2000 Unit Cost 2003 Unit Cost
175 GPM
$65 $70
300 GPM
$65 $70
350 GPM
$65 $70
700 GPM
$85 $92
750 GPM
$90 $97
1250 GPM
$140 $151
1800 GPM
$190 $205
2400 GPM
$250 $269
4200 GPM
$395 $425
5700 GPM
$495 $533
18056 GPM $359
27778 GPM
$512
33333 GPM
$615
34722 GPM
$666
38889 GPM
$717
7182019 Basis of Cost Estimates
httpslidepdfcomreaderfullbasis-of-cost-estimates 3767
Detroit Water and Sewerage DepartmentBasis of Cost Estimates
September 2003 36
Size 2000 Unit Cost 2003 Unit Cost
49000 GPM
$1080 $2380
59722 GPM
$1127
66667 GPM $1229
78472 GPM
$1434
700000 GPM
$12000 $12920
Table A-9bPump Station Replacement Costs
Size 2003 Unit Cost
0 - 500 GPM $1567000
500 + GPM $20000000
7182019 Basis of Cost Estimates
httpslidepdfcomreaderfullbasis-of-cost-estimates 3867
Detroit Water and Sewerage DepartmentBasis of Cost Estimates
September 2003 37
Appendix B
Data Tables Not Used for CIP
7182019 Basis of Cost Estimates
httpslidepdfcomreaderfullbasis-of-cost-estimates 3967
Detroit Water and Sewerage DepartmentBasis of Cost Estimates
September 2003 38
Appendix B ndash Data Tables Not Used for CIPThe April 2002 version of this technical memo contained several tables that were notused for the actual CIP cost estimates for the WWMP The CIP either used differentdata sources or did not include the categories covered in these tables
B1 Alternate Data Category TablesB11 Chemical Grouting of JointsChemical Grouting of Joints consists of utilizing chemical products to eliminate leaksin pipe joints The estimate includes mobilization set up and furnishing of allincidentals The estimate is shown and is in unit cost per pipe joint All 2000 dataused for Table B-1 comes from historical sources from 1982 to 1999 and was escalatedto 2003 using the CCI
Table B-1Historical Chemical Grouting of Joints Costs
SizeSource UnitCostJoint Year
2003 Unit CostJoint(CCI) Source
Al l $6000 1985 $9580 1
$3500 1982 $6129 5
$2400 1988 $3557 8
$3500 1999 $3868 11
$3500 1996 $4171 13
Avg $5461
B12 SlipliningSliplining is considered to be a light rehabilitation method Sliplining installationincludes
Installation of HPDE Pipe into existing sewer pipe Excavation and backfill of insertion pits in common earth Annular space grouting Mobilization Sewer preparation And furnishing of all incidentals
The service life of Sliplining is 50 years Sizes are the ID of the Slipliner pipe forexample to reline a 20rdquo sewer use the cost for the 16rdquo Slipliner The estimate in TableB-2 is unit cost x $1000 per mile of installation
7182019 Basis of Cost Estimates
httpslidepdfcomreaderfullbasis-of-cost-estimates 4067
Detroit Water and Sewerage DepartmentBasis of Cost Estimates
September 2003 39
Table B-2Sliplining Costs
Size 2003 UnitCost Mile
4rdquo $20
6rdquo $50
8rdquo $90
10rdquo $130
12rdquo $190
14rdquo $230
16rdquo $290
18rdquo $370
20rdquo $460
22rdquo $56024rdquo $660
26rdquo $780
28rdquo $900
30rdquo $1040
32rdquo $1180
36rdquo $1490
42rdquo $2030
48rdquo $2650
52rdquo $3060
54rdquo $3360
B13 Sewer Pipe ReplacementIt has been determined that the improvements to the DWSD sewer system would notinclude the replacement of any sewer pipes However the costs for the constructionof new sewers were investigated The results of this investigation follow Note thatthe costs included in these tables (Table B-3 through B-13) are the recommended costsfrom Table 51-1
Ductile Iron Force Main
Ductile Iron Force Main installation includes
Cement lined ductile iron pipe (6-24) Excavation and backfill of common earth 3 ndash 35 feet of cover to crown of the pipe Minimum utility relocation Up to 6rdquo of bituminous pavement removal and replacement Furnishing of all incidentals
7182019 Basis of Cost Estimates
httpslidepdfcomreaderfullbasis-of-cost-estimates 4167
Detroit Water and Sewerage DepartmentBasis of Cost Estimates
September 2003 40
Table B-3 shows the ductile iron force main installation estimate in unit cost x $1000per mile of pipe installation escalated using the CCI The service life of ductile ironforce mains is 30 years
Table B-3Historical New Ductile Iron Force Main Installation Costs
Size
SourceUnitCostLF Year 2003 Unit CostLF (CCI) Source
4 $1000 1985 $1597 1
$1500 1985 $2395 1
Avg $1996
6 $1600 1985 $2555 1
$1900 1985 $3034 1
$2700 2000 $2907 10
$1840 1971 $7795 14
$1600 1971 $6778 14
Avg $4614
8 $3000 2000 $3230 10
Avg $3230
10 $3300 2000 $3553 10
Avg $3553
12 $3700 2000 $3984 10
$1600 1971 $6778 14
$2800 1990 $3963 16
Avg $4909
14 $4100 2000 $4414 10
Avg $4414
16 $4500 2000 $4845 10
Avg $4845
7182019 Basis of Cost Estimates
httpslidepdfcomreaderfullbasis-of-cost-estimates 4267
Detroit Water and Sewerage DepartmentBasis of Cost Estimates
September 2003 41
Size
SourceUnitCostLF Year 2003 Unit CostLF (CCI) Source
18 $4200 1990 $5945 16
Avg $5945
20 $5300 2000 $5706 10
$4750 1971 $20124 14
Avg $12915
24 $6000 2000 $6460 10
Avg $6460
48 $10700 2000 $11520 10
Avg $11520
Service Leads Service Lead installation includes
6 SDR 35 PVC pipe and fittings Excavation and backfill of common earth Min 4rsquo cover to crown of the pipe Tie-in to existing sewer Reseeding
Furnishing of all incidentals
Table B-4 shows the estimate for service lead installation in unit cost per foot of pipewith the historical data escalated using the CCI The service life of service leads is 25years
Table B-4Historical New Service Lead Installation Costs
SizeSource unitCostLF Year
2003 Unit CostLF(CCI) Source
6 $1400 1971 $5931 14
$1560 1971 $6609 14
Avg $6270
7182019 Basis of Cost Estimates
httpslidepdfcomreaderfullbasis-of-cost-estimates 4367
Detroit Water and Sewerage DepartmentBasis of Cost Estimates
September 2003 42
Sanitary Laterals
Sanitary Lateral installation includes
Plain concrete pipe (8-12)
Excavation and backfill of common earth including trench shield or box 48rdquo diameter manholes at 300 feet Minimum utility relocation Up to 6rdquo of bituminous pavement removal and replacement Furnishing of all incidentals
Table B-5 shows the estimate for sanitary laterals in unit cost x $1000 per mile of pipeinstallation with the historical data escalated using the CCI The service life ofsanitary laterals is 50 years
Table B-5
Historical New Sanitary Lateral Installation Costs
SizeSource UnitCostLF Year
2003 Unit CostLF(CCI) Source
8 $2250 1985 $3592 1
$3500 1999 $3868 6
$2900 1971 $12286 14
$2600 1971 $11015 14
$2540 1971 $10761 14
$3260 1971 $13811 14
$3500 1990 $4954 16
$3500 1990 $4954 19
Avg $7706
10 $2400 1985 $3832 1
$2500 1985 $3992 1
$4000 1999 $4421 6
$5600 2000 $6029 10
$3000 1971 $12710 14
$5700 1971 $24148 14
Avg $9189
12 $5500 1999 $6079 6
$4500 1990 $6370 16
Avg $6224
7182019 Basis of Cost Estimates
httpslidepdfcomreaderfullbasis-of-cost-estimates 4467
Detroit Water and Sewerage DepartmentBasis of Cost Estimates
September 2003 43
Storm and Combined LateralsStorm and combined lateral installation includes
Reinforced concrete pipe (12-24) Excavation and backfill of common earth Sheeting shoring and bracing Trench shield or box at 8rsquo 48rdquo Diameter manholes at 300 feet Min bury to the crown of the pipe as listed below Minimum utility relocation Up to 6rdquo of bituminous pavement removal and replacement And furnishing of all incidentals
Tables B-6 shows the estimates for storm and combined laterals in unit cost x $1000per mile of pipe installation at various depths with the historical data escalated usingthe CCI However the depth of installation is unknown The service life of storm andcombined laterals is 50 years
Table B-6Historical New Storm and Combined Lateral Installation Costs
SizeSource Unit
CostLF Year2003 Unit CostLF
(CCI) Source
12 $2500 1985 $3992 1
$3000 1985 $4790 1
$4500 1989 $6531 9
$6100 2000 $6568 10
$4350 1971 $18429 14
$3900 1971 $16523 14
$2700 1990 $3822 16
$4890 1971 $20717 14
$4500 1990 $6370 16
$4500 1990 $6370 19
$2700 1990 $3822 19
Avg $8161
15 $2750 1985 $4391 1$6700 2000 $7214 10
$4900 1971 $20759 14
$3375 1990 $4777 16
$5625 1990 $7962 16
$3375 1990 $4777 19
7182019 Basis of Cost Estimates
httpslidepdfcomreaderfullbasis-of-cost-estimates 4567
Detroit Water and Sewerage DepartmentBasis of Cost Estimates
September 2003 44
SizeSource Unit
CostLF Year2003 Unit CostLF
(CCI) Source
15 $5625 1990 $7962 19
$3100 1999 $3426 11
Avg $6808
18 $3000 1985 $4790 1
$7300 2000 $7860 10
$3255 1990 $4607 16
$4050 1990 $5733 16
$4050 1990 $5733 19
$6750 1990 $9554 19
Avg $6379
21 $8000 2000 $8613 10
$5200 1971 $22030 14
$4800 1971 $20335 14
$4700 1971 $19912 14
$4725 1990 $6688 16
$4720 1990 $6681 19
Avg $14043
24 $8800 2000 $9475 10
$5400 1971 $22877 14
$5060 1971 $21437 14
$4430 1990 $6271 16
$5400 1990 $7644 19
$5400 1990 $7644 16
Avg $12558
Trunk SewersTrunk Sewer installation includes
Reinforced concrete pipe (27-66) Excavation and backfill of common earth Sheeting shoring and bracing Manholes at 300 feet Diameters as follows
o Pipe size 27rdquo ndash 36rdquo 60rdquo diameter manholes
7182019 Basis of Cost Estimates
httpslidepdfcomreaderfullbasis-of-cost-estimates 4667
Detroit Water and Sewerage DepartmentBasis of Cost Estimates
September 2003 45
o Pipe size 42rdquo- 48rdquo 72rdquo diameter manholeso Pipe size 54rdquo ndash 66rdquo 84rdquo diameter manholes
Min bury to the crown of the pipe as listed below Minimum utility relocation Up to 6rdquo of bituminous pavement removal and replacement And furnishing of all incidentals
Table B-7 shows the estimates in unit cost x $1000 per mile of pipe installation atvarious depths with the historical data escalated using the CCI However the depthof installation is unknown The service life of trunk sewers is 50 years
Table B-7Historical New Trunk Sewer Installation Costs
Size Source Unit CostLF Year 2003 Unit CostLF (CCI) Source
27 $9600 2000 $10336 10
$5000 1971 $21183 14
Avg $15759
30 $10400 2000 $11197 10
$13500 1996 $16090 13
Avg $13643
36 $9300 1982 $16285 5
$27500 1998 $31114 3
$27500 1997 $31621 7$27000 1999 $29843 11
$14500 1996 $17281 13
Avg $25229
42 $29000 1997 $33346 7
$33000 1999 $36474 11
$13200 2000 $14212 10
Avg $28011
48 $30000 1997 $34496 7
$28500 1999 $31500 11
Avg $32998
Size Source Unit CostLF Year 2003 Unit CostLF (CCI) Source
54 $31000 1997 $35646 7
7182019 Basis of Cost Estimates
httpslidepdfcomreaderfullbasis-of-cost-estimates 4767
Detroit Water and Sewerage DepartmentBasis of Cost Estimates
September 2003 46
Avg $35646
60 $34000 1997 $39096 7
Avg $39096
66 $47000 1998 $53177 3
$50000 1998 $56571 3
Avg $54874
Interceptors TunnelsInterceptor tunnel installation includes
Reinforced concrete pipe (78-120) Excavation and backfill of common earth Sheeting shoring and bracing 8rsquo Diameter manholes at 600 feet Min bury to the crown of the pipe as listed below Minimum utility relocation Up to 6rdquo of bituminous pavement removal and replacement And furnishing of all incidentals
Table B-8 shows the estimates in unit cost x $1000 per mile of pipe installation atvarious depths with the historical data escalated using the CCI However the depthof installation is unknown The service life of interceptors tunnels is 50 years
Table B-8Historical New Interceptors Tunnels Installation Costs
Size Source Unit CostLF Year 2003 Unit CostLF (CCI) Source
78 $60000 1998 $67885 3
Avg $67885
84 $62000 1998 $70148 3
Avg $70148
96 $70000 1998 $79199 3
Avg $79199
Size Source Unit CostLF Year 2003 Unit CostLF (CCI) Source
102 $75000 1998 $84856 3
7182019 Basis of Cost Estimates
httpslidepdfcomreaderfullbasis-of-cost-estimates 4867
Detroit Water and Sewerage DepartmentBasis of Cost Estimates
September 2003 47
Avg $84856
108 80000 1998 $90514 3
Avg $90514
120 $90000 1985 $143700 1
Avg $143700
B14 Miscellaneous RepairsThis cost estimating technical memorandum reviewed the costs for various sewersystem repairs that were not scheduled or included in the WWMP CIP developmentThis section contains the results of this repair cost review
Sump Pump Disconnection
Sump Pump Disconnection consists of removal of sump valves electrical connectionsand restoration These costs in unit cost per connection are estimated at $6720 in2000 dollars
Root Control
Root Control consists of utilizing chemical methods The estimate includesmobilization set up and furnishing of all incidentals Table B-9 shows the estimate inunit cost per linear foot of pipe with the historical data escalated using the CCI
Table B-9Historical Root Control Costs
SizeSource Unit
CostLF Year 2003 Unit CostLF (CCI) Source
Al l $200 1982 $350 5
$200 1988 $296 8
$140 1989 $203 9
$200 2000 $215 20
$225 2000 $242 20
$275 2000 $296 20
Avg $267
B15 Historical ReferencesShown on each spreadsheet is a reference code to the source of individual unit pricesTable B-10 shows the references used for the historical estimates in Appendices A andB
7182019 Basis of Cost Estimates
httpslidepdfcomreaderfullbasis-of-cost-estimates 4967
Detroit Water and Sewerage DepartmentBasis of Cost Estimates
September 2003 48
Table B-10Historical References
Source Title Date
1 Unidentified CDM Documents 1985
2Beaconsfield Relief Sewer Cleaning Manholes Inspection forSouth Macomb Sanitary District 1999
3 SOCSDS Project Plan 1998
4 Cost Effective Analysis 1998
5 Grosse Pointe Infrastructure 1982
6 City of Rochester Hills SDA 1999
7 HRC Detailed Cost Estimates 1997
8 Beverly Hills Local Sewer Study Rehabilitation Program 1988
9 Unidentified CDM Documents 1989
10 Unidentified Construction Cost Estimate
11 South Macomb Sanitary District 1999
12 City of Rochester Hills Sanitary Sewer Evaluation Survey 1996
13 South Macomb Sanitary District Appendix J 1996
14 Clinton-Oakland Sewage Disposal System 1971
15 City of Hazel Park MI
16 Farmington MI Sewer Seperation Improvements 1990
17 Basic Requirements Report Evergreen-Farmington Relief 1985
18 Cost Estimate 1975
19 Pre-Rehabilitation Local Sewer Costs 1990
20 Ann Arbor SSO Prevention Task Force 2000
B16 Means and Manufacturersrsquo EstimatesThe calculation of construction costs using the RW Means methodology requiresprices for component materials and construction activities (ie excavation orbackfilling) The following table presents the component costs used in the
development of construction cost guidelines
7182019 Basis of Cost Estimates
httpslidepdfcomreaderfullbasis-of-cost-estimates 5067
Detroit Water and Sewerage DepartmentBasis of Cost Estimates
September 2003 49
Table B-11Component Costs for Means and Manufacturersrsquo Estimates
Item Size Description Unit Cost Units Source
Excavation
Excavation common earth hauling
away fill up to 4 mi $1549 CY Means
BackfillCommon earth front-end loaderCompaction 12 lifts $882 CY Means
Select FillCrushed bank run gravelcompaction 6 lifts $2650 CY Means
Sheeting 8 DeepWood solid sheeting incl Walesbraces and spacers Drive amp Extract $668 SF Means
16 DeepWood solid sheeting incl Walesbraces and spacers Drive amp Extract $876 SF Means
24 DeepWood solid sheeting incl Walesbraces and spacers Drive amp Extract $1074 SF Means
32 DeepWood solid sheeting incl Walesbraces and spacers Drive amp Extract $1199 SF Means
Pavement Removal Bituminous 4 to 6 thick $572 SY Means
Saw Cutting Asphalt 6 thick $281 LF Means
Pavement Replacement Over Trench 6 thick $4333 SY Means
Non-Reinforced ConcretePipe 8 Bell and Spigot Joints Extra strength $1231 LF Means
10 Bell and Spigot Joints Extra strength $1305 LF Means
12 Bell and Spigot Joints Extra strength $1480 LF Means
Reinforced Concrete Pipe 12
Class 3 BampS or TampG Joints
wgaskets $1890 LF Means
15Class 3 BampS or TampG Jointswgaskets $2167 LF Means
18Class 3 BampS or TampG Jointswgaskets $2536 LF Means
7182019 Basis of Cost Estimates
httpslidepdfcomreaderfullbasis-of-cost-estimates 5167
Detroit Water and Sewerage DepartmentBasis of Cost Estimates
September 2003 50
Item Size Description Unit Cost Units Source
Reinforced Concrete Pipe 21Class 3 BampS or TampG Joints wogaskets $3135 LF Means
24Class 3 BampS or TampG Jointswgaskets $3504 LF Means
27Class 3 BampS or TampG Joints wogaskets $5302 LF Means
30Class 3 BampS or TampG Jointswgaskets $6592 LF Means
36Class 3 BampS or TampG Jointswgaskets $8990 LF Means
42
Class 3 BampS or TampG Joints wo
gaskets $9220 LF Means
48Class 3 BampS or TampG Jointswgaskets $13185 LF Means
54Class 3 BampS or TampG Jointswgaskets $14845 LF Means
60Class 3 BampS or TampG Joints wogaskets $16504 LF Means
66Class 3 BampS or TampG Joints wogaskets $23004 LF Means
72Class 3 BampS or TampG Jointswgaskets $29504 LF Means
78Class 3 BampS or TampG Joints wogaskets $32500 LF Means
84Class 3 BampS or TampG Joints wogaskets $35497 LF Means
96Class 3 BampS or TampG Jointswgaskets $43795 LF Means
102
Class 3 BampS or TampG Joints wo
gaskets $46000 LF Means
108Class 3 BampS or TampG Joints wogaskets $48300 LF Means
120Class 3 BampS or TampG Joints wogaskets $53000 LF Means
7182019 Basis of Cost Estimates
httpslidepdfcomreaderfullbasis-of-cost-estimates 5267
Detroit Water and Sewerage DepartmentBasis of Cost Estimates
September 2003 51
Item Size Description Unit Cost Units Source
Ductile Iron Pipe 4 Class 50 Cement Lined Mech Joint $1982 LF Means
6 Class 50 Cement Lined Mech Joint $2305 LF Means
8 Class 50 Cement Lined Mech Joint $2812 LF Means
10 Class 50 Cement Lined Mech Joint $3458 LF Means
12 Class 50 Cement Lined Mech Joint $4103 LF Means
14 Class 50 Cement Lined Mech Joint $4656 LF Means
16 Class 50 Cement Lined Mech Joint $5670 LF Means
18 Class 50 Cement Lined Mech Joint $6731 LF Means
20 Class 50 Cement Lined Mech Joint $7745 LF Means
24 Class 50 Cement Lined Mech Joint $9958 LF Means
48 Class 50 Cement Lined Mech Joint $23234 LF Est
PVC Pipe (SDR35) 6 SDR 35 BampS $512 LF Means
6 SDR 35 BampS 45 Degree Bend $7376 LF Means
HDPEPipe for Sliplining 4HDPE Pipe PE3408 DR21 (80 psi)price installed $442 LF Manufact
6HDPE Pipe PE3408 DR21 (80 psi)price installed $958 LF Manufact
8
HDPE Pipe PE3408 DR21 (80 psi)
price installed $1623 LF Manufact
10HDPE Pipe PE3408 DR21 (80 psi)price installed $2521 LF Manufact
12HDPE Pipe PE3408 DR21 (80 psi)price installed $3547 LF Manufact
7182019 Basis of Cost Estimates
httpslidepdfcomreaderfullbasis-of-cost-estimates 5367
Detroit Water and Sewerage DepartmentBasis of Cost Estimates
September 2003 52
Item Size Description Unit Cost Units Source
HDPEPipe for Sliplining 14HDPE Pipe PE3408 DR21 (80 psi)price installed $4276 LF Manufact
16HDPE Pipe PE3408 DR21 (80 psi)price installed $5586 LF Manufact
18HDPE Pipe PE3408 DR21 (80 psi)price installed $7069 LF Manufact
20HDPE Pipe PE3408 DR21 (80 psi)price installed $8728 LF Manufact
22HDPE Pipe PE3408 DR21 (80 psi)price installed $10560 LF Manufact
24
HDPE Pipe PE3408 DR21 (80 psi)
price installed $12567 LF Manufact
26HDPE Pipe PE3408 DR21 (80 psi)price installed $14749 LF Manufact
28HDPE Pipe PE3408 DR21 (80 psi)price installed $17106 LF Manufact
30HDPE Pipe PE3408 DR21 (80 psi)price installed $19637 LF Manufact
32HDPE Pipe PE3408 DR21 (80 psi)price installed $22342 LF Manufact
36HDPE Pipe PE3408 DR21 (80 psi)price installed $28277 LF Manufact
42HDPE Pipe PE3408 DR21 (80 psi)price installed $38488 LF Manufact
48HDPE Pipe PE3408 DR21 (80 psi)price installed $50270 LF Manufact
52HDPE Pipe PE3408 DR21 (80 psi)price installed $57869 LF Manufact
54
HDPE Pipe PE3408 DR21 (80 psi)
price installed $63623 LF Manufact
Manholes 4 DiaPrecast Concrete not incl Excavbackfill frame cover sheeting $17979 VLF Means
5 DiaPrecast Concrete not incl Excavbackfill frame cover sheeting $18809 VLF Means
7182019 Basis of Cost Estimates
httpslidepdfcomreaderfullbasis-of-cost-estimates 5467
Detroit Water and Sewerage DepartmentBasis of Cost Estimates
September 2003 53
Item Size Description Unit Cost Units Source
Manholes 6 DiaPrecast Concrete not incl Excavbackfill frame cover sheeting $28582 VLF Means
7 DiaPrecast Concrete not incl Excavbackfill frame cover sheeting $38355 VLF Means
8 DiaPrecast Concrete not incl Excavbackfill frame cover sheeting $48128 VLF Means
B17 Meanrsquos Unit Cost Estimates
Table B-12 contains a sample estimating sheet for calculating each component costusing the material and labor costs identified in the previous section
7182019 Basis of Cost Estimates
httpslidepdfcomreaderfullbasis-of-cost-estimates 5567
Detroit Water and Sewerage DepartmentBasis of Cost Estimates
September 2003 54
Table B-12Sample Component Costs Estimator
Quick Sewer Estimator
Force Mains
Dimensions
Pipe Size 14 in
Trench Width 4 Ft not less than 32
Trench Depth 6 Ft
Length 1 Ft
Material Costs
Pipe CostLF 66 $LF
Excav CostCY 13 $CYBackfill Cost CY 10 $CY
Select Fill CostCY 12 $CY
Pavament DemoCost SY 7 $SY
New Pavement Cost SY 29 $SY
Saw Cut Per LF 4 $LF
Sheeting Cost SF 0 $SF
May not be required for excavations under 5 deep
Pavement A (sy)= 044
Vexcav (cy) = Vbfill (cy) =
089 049
Hbfill (ft)
Sheeting (sf) Common Fill 333333
12
Vsfill (cy) =
036 Hsfill (ft)
Select Fill 266667
W (ft) = 4
Total Costs
7182019 Basis of Cost Estimates
httpslidepdfcomreaderfullbasis-of-cost-estimates 5667
Detroit Water and Sewerage DepartmentBasis of Cost Estimates
September 2003 55
Pipe $6600
Excav $622
Backfill $494
Select Fill $427
Pavement Demo $311New Pavement $1289
Saw Cut $800
Sheeting Cost $000
Total Price $10543
Price Per Foot $10543 LF
7182019 Basis of Cost Estimates
httpslidepdfcomreaderfullbasis-of-cost-estimates 5767
Detroit Water and Sewerage DepartmentBasis of Cost Estimates
September 2003 56
Appendix C
Unit Costs for Treatment Facilities
7182019 Basis of Cost Estimates
httpslidepdfcomreaderfullbasis-of-cost-estimates 5867
Detroit Water and Sewerage DepartmentBasis of Cost Estimates
September 2003 57
Appendix C ndash Unit Costs for Treatment FacilitiesThe following tables outline the unit costs for treatment facilities derived from projectcost estimates These unit costs are provided for future estimating of these facilitiesand are the total cost X 1000 They are base construction costs only and do notinclude engineering fees allowances or contingencies
Table C-1Influent Pump Station Unit Cost
Capacity 2000 2010 2020 2030 2040 2050
394 mgd $1960 $2320 $2820 $3320 $3820 $4320
400 mgd $3810 $4520 $5490 $6460 $7430 $8400
491 mgd $2060 $2440 $2970 $3490 $4010 $4530
615 mgd $2510 $2980 $3620 $4260 $4900 $5540
615 mgd $2510 $2980 $3620 $4260 $4900 $5540
615 mgd $3050 $3620 $4400 $5180 $5960 $6740
619 mgd $3150 $3740 $4550 $5350 $6150 $6950
860 mgd $4440 $5270 $6410 $7540 $8670 $9800
1040 mgd $5940 $7040 $8560 $10070 $11580 $13090
1080 mgd $3790 $4490 $5460 $6420 $7380 $8340
1130 mgd $6090 $7220 $8780 $10330 $11880 $13420
1260 mgd $4510 $5350 $6500 $7650 $8800 $9940
1580 mgd $6020 $7140 $8680 $10210 $11740 $13270
1890 mgd $6350 $7530 $9150 $10770 $12390 $14000
2535 mgd $7030 $8340 $10140 $11930 $13720 $15500
3105 mgd $7030 $8340 $10140 $11930 $13720 $15500
Table C-2
Screening and Grit Chamber Unit Cost Capacity 2000 2010 2020 2030 2040 2050
116 mgd $1530 $1810 $2200 $2590 $2980 $3370
143 mgd $2030 $2410 $2930 $3450 $3970 $4490
216 mgd $2210 $2620 $3180 $3740 $4300 $4860
221 mgd $3490 $4140 $5030 $5920 $6810 $7700
226 mgd $3490 $4140 $5030 $5920 $6810 $7700
322 mgd $4500 $5340 $6490 $7640 $8790 $9930
322 mgd $4500 $5340 $6490 $7640 $8790 $9930
368 mgd $3240 $3840 $4670 $5490 $6320 $7140
409 mgd $3700 $4390 $5340 $6280 $7220 $8160
471 mgd $6190 $7340 $8920 $10500 $12080 $13650471 mgd $5940 $7040 $8560 $10070 $11580 $13090
554 mgd $4520 $5360 $6510 $7660 $8810 $9960
576 mgd $5190 $6160 $7490 $8810 $10130 $11450
636 mgd $5600 $6640 $8070 $9500 $10930 $12350
1000 mgd $9770 $11590 $14090 $16580 $19070 $21550
1250 mgd $11300 $13400 $16290 $19170 $22050 $24920
7182019 Basis of Cost Estimates
httpslidepdfcomreaderfullbasis-of-cost-estimates 5967
Detroit Water and Sewerage DepartmentBasis of Cost Estimates
September 2003 58
Table C-3 Aeration Bas in wi th Nit ri ficat ion Unit Cost
Capacity 2000 2010 2020 2030 2040 2050
113 mgd $10400 $12330 $14990 $17640 $20290 $22930
140 mgd $11200 $13280 $16140 $18990 $21840 $24680
211 mgd $17300 $20520 $24940 $29350 $33760 $38150
211 mgd $17300 $20520 $24940 $29350 $33760 $38150211 mgd $16000 $18980 $23070 $27150 $31230 $35290
308 mgd $22600 $26800 $32570 $38320 $44080 $49810
308 mgd $22600 $26800 $32570 $38320 $44080 $49810
359 mgd $24200 $28700 $34880 $41040 $47210 $53350
400 mgd $22600 $26800 $32570 $38320 $44080 $49810
450 mgd $32300 $38310 $46560 $54780 $63010 $71200
450 mgd $31800 $37710 $45830 $53930 $62040 $70110
540 mgd $35300 $41860 $50880 $59870 $68870 $77830
563 mgd $36800 $43640 $53040 $62410 $71790 $81130
622 mgd $39300 $46610 $56650 $66660 $76680 $86650
Table C-4Primary Clarifiers Unit Cost
Capacity 2000 2010 2020 2030 2040 2050
116 mgd $1530 $1810 $2200 $2590 $2980 $3370
143 mgd $2030 $2410 $2930 $3450 $3970 $4490
216 mgd $2210 $2620 $3180 $3740 $4300 $4860
221 mgd $3490 $4140 $5030 $5920 $6810 $7700
226 mgd $3490 $4140 $5030 $5920 $6810 $7700
322 mgd $4500 $5340 $6490 $7640 $8790 $9930
322 mgd $4500 $5340 $6490 $7640 $8790 $9930
368 mgd $3240 $3840 $4670 $5490 $6320 $7140
409 mgd $3700 $4390 $5340 $6280 $7220 $8160
471 mgd $6190 $7340 $8920 $10500 $12080 $13650
471 mgd $5940 $7040 $8560 $10070 $11580 $13090
554 mgd $4520 $5360 $6510 $7660 $8810 $9960
576 mgd $5190 $6160 $7490 $8810 $10130 $11450
636 mgd $5600 $6640 $8070 $9500 $10930 $12350
1000 mgd $9770 $11590 $14090 $16580 $19070 $21550
1250 mgd $11300 $13400 $16290 $19170 $22050 $24920
Table C-5Complete Mix Activated Sludge Unit Cost
Capacity 2000 2010 2020 2030 2040 2050
100 mgd $21800 $25850 $31420 $36970 $42530 $48060
125 mgd $25300 $30000 $36460 $42900 $49350 $55770
7182019 Basis of Cost Estimates
httpslidepdfcomreaderfullbasis-of-cost-estimates 6067
Detroit Water and Sewerage DepartmentBasis of Cost Estimates
September 2003 59
Table C-6Iron Feed System Unit Cost
Capacity 2000 2010 2020 2030 2040 2050
113 mgd $152 $180 $220 $260 $300 $340
140 mgd $152 $180 $220 $260 $300 $340
211 mgd $152 $180 $220 $260 $300 $340
211 mgd $152 $180 $220 $260 $300 $340211 mgd $152 $180 $220 $260 $300 $340
308 mgd $156 $190 $230 $270 $310 $350
308 mgd $156 $190 $230 $270 $310 $350
359 mgd $175 $210 $260 $310 $360 $410
400 mgd $164 $190 $230 $270 $310 $350
450 mgd $182 $220 $270 $320 $370 $420
450 mgd $182 $220 $270 $320 $370 $420
540 mgd $208 $250 $300 $350 $400 $450
563 mgd $189 $220 $270 $320 $370 $420
622 mgd $197 $230 $280 $330 $380 $430
1000 mgd $205 $240 $290 $340 $390 $440
1250 mgd $225 $270 $330 $390 $450 $510
Table C-7Coagulation-Flocculation Unit Cost
Capacity 2000 2010 2020 2030 2040 2050
100 mgd $19700 $23360 $28390 $33410 $38430 $43430
125 mgd $24100 $28580 $34740 $40880 $47020 $53130
Table C-8Secondary Clarifiers Unit Cost
Capacity 2000 2010 2020 2030 2040 2050
113 mgd $3050 $3620 $4400 $5180 $5960 $6740140 mgd $3800 $4510 $5480 $6450 $7420 $8380
211 mgd $4430 $5250 $6380 $7510 $8640 $9760
211 mgd $4430 $5250 $6380 $7510 $8640 $9760
211 mgd $4870 $5780 $7030 $8270 $9510 $10750
308 mgd $5800 $6880 $8360 $9840 $11320 $12790
308 mgd $5800 $6880 $8360 $9840 $11320 $12790
359 mgd $7120 $8440 $10260 $12070 $13880 $15680
400 mgd $6280 $7450 $9050 $10650 $12250 $13840
450 mgd $8070 $9570 $11630 $13680 $15740 $17790
450 mgd $8070 $9570 $11630 $13680 $15740 $17790
540 mgd $10400 $12330 $14990 $17640 $20290 $22930
563 mgd $11500 $13640 $16580 $19510 $22440 $25360
622 mgd $12400 $14710 $17880 $21040 $24200 $27350
1000 mgd $13700 $16250 $19750 $23240 $26730 $30210
1250 mgd $15200 $18030 $21910 $25780 $29650 $33510
7182019 Basis of Cost Estimates
httpslidepdfcomreaderfullbasis-of-cost-estimates 6167
Detroit Water and Sewerage DepartmentBasis of Cost Estimates
September 2003 60
Table C-9Intermediate Pumping Unit Cost
Capacity 2000 2010 2020 2030 2040 2050
253 mgd $734 $870 $1060 $1250 $1440 $1630
350 mgd $1060 $1260 $1530 $1800 $2070 $2340
400 mgd $1220 $1450 $1760 $2070 $2380 $2690
446 mgd $1380 $1640 $1990 $2340 $2690 $3040452 mgd $1410 $1670 $2030 $2390 $2750 $3110
529 mgd $1680 $1990 $2420 $2850 $3280 $3710
611 mgd $1680 $1990 $2420 $2850 $3280 $3710
669 mgd $1860 $2210 $2690 $3170 $3650 $4120
743 mgd $2090 $2480 $3010 $3540 $4070 $4600
849 mgd $2430 $2880 $3500 $4120 $4740 $5360
942 mgd $2470 $2930 $3560 $4190 $4820 $5450
1040 mgd $2770 $3290 $4000 $4710 $5420 $6120
1050 mgd $2810 $3330 $4050 $4770 $5490 $6200
1130 mgd $3040 $3610 $4390 $5170 $5950 $6720
Table C-10Filtration Unit Cost
Capacity 2000 2010 2020 2030 2040 2050
113 mgd $3930 $4660 $5660 $6660 $7660 $8660
140 mgd $5040 $5980 $7270 $8550 $9830 $11110
211 mgd $6210 $7360 $8950 $10530 $12110 $13680
211 mgd $6220 $7380 $8970 $10550 $12140 $13720
308 mgd $7900 $9370 $11390 $13400 $15410 $17410
359 mgd $8440 $10010 $12170 $14320 $16470 $18610
400 mgd $9190 $10900 $13250 $15590 $17930 $20260
450 mgd $10400 $12330 $14990 $17640 $20290 $22930
540 mgd $11800 $13990 $17000 $20000 $23010 $26000563 mgd $12200 $14470 $17590 $20700 $23810 $26910
622 mgd $13500 $16010 $19460 $22900 $26340 $29770
7182019 Basis of Cost Estimates
httpslidepdfcomreaderfullbasis-of-cost-estimates 6267
Detroit Water and Sewerage DepartmentBasis of Cost Estimates
September 2003 61
Table C-11Ultraviolet Disinfection Unit Cost
Capacity 2000 2010 2020 2030 2040 2050
259 mgd $912 $1080 $1310 $1540 $1770 $2000
351 mgd $1280 $1520 $1850 $2180 $2510 $2840
400 mgd $1530 $1810 $2200 $2590 $2980 $3370
452 mgd $2040 $2420 $2940 $3460 $3980 $4500452 mgd $3310 $3930 $4780 $5620 $6460 $7300
452 mgd $1750 $2080 $2530 $2980 $3430 $3880
619 mgd $1750 $2080 $2530 $2980 $3430 $3880
619 mgd $2280 $2700 $3280 $3860 $4440 $5020
679 mgd $2550 $3020 $3670 $4320 $4970 $5620
860 mgd $3830 $4540 $5520 $6500 $7480 $8450
860 mgd $3060 $3630 $4410 $5190 $5970 $6750
956 mgd $3400 $4030 $4900 $5770 $6640 $7500
1036 mgd $3830 $4540 $5520 $6500 $7480 $8450
1126 mgd $4100 $4860 $5910 $6950 $7990 $9030
1750 mgd $8270 $9810 $11920 $14030 $16140 $18240
2000 mgd $8620 $10220 $12420 $14610 $16810 $19000
Table C-12Post Aeration Unit Cost
Capacity 2000 2010 2020 2030 2040 2050
113 mgd $114 $140 $170 $200 $230 $260
140 mgd $134 $160 $190 $220 $250 $280
211 mgd $142 $170 $210 $250 $290 $330
211 mgd $142 $170 $210 $250 $290 $330
211 mgd $167 $200 $240 $280 $320 $360
308 mgd $182 $220 $270 $320 $370 $420308 mgd $182 $220 $270 $320 $370 $420
359 mgd $260 $310 $380 $450 $520 $590
400 mgd $273 $320 $390 $460 $530 $600
450 mgd $237 $280 $340 $400 $460 $520
450 mgd $237 $280 $340 $400 $460 $520
540 mgd $363 $430 $520 $610 $700 $790
563 mgd $358 $420 $510 $600 $690 $780
622 mgd $388 $460 $560 $660 $760 $860
1000 mgd $455 $540 $660 $780 $900 $1020
1250 mgd $554 $660 $800 $940 $1080 $1220
7182019 Basis of Cost Estimates
httpslidepdfcomreaderfullbasis-of-cost-estimates 6367
Detroit Water and Sewerage DepartmentBasis of Cost Estimates
September 2003 62
Table C-13Blower System Unit Cost
Capacity 2000 2010 2020 2030 2040 2050
170 mgd $718 $850 $1030 $1210 $1390 $1570
210 mgd $786 $930 $1130 $1330 $1530 $1730
317 mgd $1120 $1330 $1620 $1910 $2200 $2490
317 mgd $1120 $1330 $1620 $1910 $2200 $2490317 mgd $1060 $1260 $1530 $1800 $2070 $2340
462 mgd $7440 $8820 $10720 $12610 $14510 $16400
462 mgd $7440 $8820 $10720 $12610 $14510 $16400
539 mgd $7440 $8820 $10720 $12610 $14510 $16400
600 mgd $6430 $7630 $9270 $10910 $12550 $14180
675 mgd $8920 $10580 $12860 $15130 $17400 $19660
675 mgd $8840 $10480 $12740 $14990 $17240 $19480
810 mgd $8950 $10610 $12900 $15180 $17460 $19730
845 mgd $8600 $10200 $12400 $14590 $16780 $18960
933 mgd $8950 $10610 $12900 $15180 $17460 $19730
1500 mgd $6370 $7550 $9180 $10800 $12420 $14040
1875 mgd $7670 $9100 $11060 $13010 $14970 $16920
Table C-14Gravity Thickening Unit Cost
Capacity 2000 2010 2020 2030 2040 2050
113 mgd $278 $330 $400 $470 $540 $610
140 mgd $319 $380 $460 $540 $620 $700
211 mgd $693 $820 $1000 $1180 $1360 $1540
211 mgd $555 $660 $800 $940 $1080 $1220
211 mgd $396 $470 $570 $670 $770 $870
308 mgd $708 $840 $1020 $1200 $1380 $1560308 mgd $723 $860 $1050 $1240 $1430 $1620
359 mgd $609 $720 $880 $1040 $1200 $1360
400 mgd $581 $690 $840 $990 $1140 $1290
450 mgd $927 $1100 $1340 $1580 $1820 $2060
450 mgd $944 $1120 $1360 $1600 $1840 $2080
540 mgd $830 $980 $1190 $1400 $1610 $1820
563 mgd $768 $910 $1110 $1310 $1510 $1710
622 mgd $830 $980 $1190 $1400 $1610 $1820
1000 mgd $723 $860 $1050 $1240 $1430 $1620
1250 mgd $845 $1000 $1220 $1440 $1660 $1880
7182019 Basis of Cost Estimates
httpslidepdfcomreaderfullbasis-of-cost-estimates 6467
Detroit Water and Sewerage DepartmentBasis of Cost Estimates
September 2003 63
Table C-15Centrifugation Unit Cost
Capacity 2000 2010 2020 2030 2040 2050
113 mgd $2050 $2430 $2950 $3470 $3990 $4510
14 mgd $2440 $2890 $3510 $4130 $4750 $5370
211 mgd $2930 $3470 $4220 $4970 $5720 $6460
211 mgd $2220 $2630 $3200 $3770 $4340 $4900211 mgd $4160 $4930 $5990 $7050 $8110 $9160
308 mgd $2990 $3550 $4310 $5070 $5830 $6590
308 mgd $3040 $3610 $4390 $5170 $5950 $6720
359 mgd $6200 $7350 $8930 $10510 $12090 $13660
40 mgd $6150 $7290 $8860 $10430 $12000 $13560
45 mgd $4420 $5240 $6370 $7500 $8630 $9750
45 mgd $4500 $5340 $6490 $7640 $8790 $9930
54 mgd $9210 $10920 $13270 $15610 $17960 $20300
563 mgd $10700 $12690 $15420 $18140 $20870 $23580
622 mgd $11900 $14110 $17150 $20180 $23210 $26230
100 mgd $15000 $17790 $21620 $25440 $29260 $33060
125 mgd $17900 $21230 $25800 $30360 $34920 $39460
Table C-16Hauling and Landfilling Unit Cost
Capacity 2000 2010 2020 2030 2040 2050
113 mgd $438 $520 $630 $740 $850 $960
140 mgd $546 $650 $790 $930 $1070 $1210
211 mgd $1060 $1260 $1530 $1800 $2070 $2340
211 mgd $788 $930 $1130 $1330 $1530 $1730
211 mgd $810 $960 $1170 $1380 $1590 $1800
308 mgd $1090 $1290 $1570 $1850 $2130 $2410308 mgd $1100 $1300 $1580 $1860 $2140 $2420
359 mgd $1400 $1660 $2020 $2380 $2740 $3100
400 mgd $1370 $1620 $1970 $2320 $2670 $3020
450 mgd $1530 $1810 $2200 $2590 $2980 $3370
450 mgd $1560 $1850 $2250 $2650 $3050 $3450
540 mgd $2150 $2550 $3100 $3650 $4200 $4750
563 mgd $2030 $2410 $2930 $3450 $3970 $4490
622 mgd $2220 $2630 $3200 $3770 $4340 $4900
1000 mgd $2360 $2800 $3400 $4000 $4600 $5200
1250 mgd $2950 $3500 $4250 $5000 $5750 $6500
7182019 Basis of Cost Estimates
httpslidepdfcomreaderfullbasis-of-cost-estimates 6567
Detroit Water and Sewerage DepartmentBasis of Cost Estimates
September 2003 64
Appendix D
Wastewater Treatment Plant Ongoing Repair andReplacement Cost Estimates
7182019 Basis of Cost Estimates
httpslidepdfcomreaderfullbasis-of-cost-estimates 6667
Detroit Water and Sewerage DepartmentBasis of Cost Estimates
September 2003 65
SUMMARY OF CAPITAL IMPROVEMENT PROJECT COSTS
Explanation of Capital Improvement Costs
NOTE This analysis was provided by the staff of the Detroit Wastewater Partners (DWSDProject PC-744 - Wastewater Treatment Plant Upgrade) and DWSD Wastewater Plant staff Itwas completed in July 2003
General
1 Capital costs are presented by major process and non-process areas The project costsassume a major capital improvement project for the specified life cycle based on recent capitalimprovements performed under PC-744 other recent capital improvement projects (ie PC-740 PC-720 etc) and best engineering judgment The line items listed in each area areintended to provide a basis for the cost estimate to give an understanding of the level of costestimate assumptions used and items includednot included in the cost estimate It is unlikelyand not intended that the major capital projects would include all of the items listed at thespecified cycle Rather it is more likely that the overall cost would be broken into smallerprojects spread across a ~10 year period at the specified cycle
2 The percentages listed below were applied to each of the base construction costs Theseare similar to the percentages used in the Wastewater Master Plan (see Master Plan TechnicalMemo Basis of Cost Estimates dated August 15 2003)
- 30 Contingency (for miscellaneous items not included in the general cost estimate)
- 25 Contractor Overhead and Profit and General Conditions
- 20 Engineering Legal Administration and Management
3 Capital costs presented assume continued use of the existing processes in place at the
WWTP It does not assume major changes to the treatment process such as a new form ofprimary treatment or biological treatment The costs also do not include potentially newprocesses that may be required for regulatory or other reasons such as filtration of thesecondary effluent sludge digestion or major change to the type of effluent disinfection
4 Capital costs presented for each process area do not include maintenance related costs forroutine maintenance between the major capital improvement cycles It is assumed thatmaintenance activities will be performed on the equipment at the required frequencies tomaintain the equipment in good worknig order between major rehabilitation or replacementprojects
Link to Complete Spreadsheets is found on the Wastewater Master Plan
CD DWP Est of Capital Improvements for WWTP - 50-yrxls
7182019 Basis of Cost Estimates
httpslidepdfcomreaderfullbasis-of-cost-estimates 6767
Detroit Water and Sewerage DepartmentBasis of Cost Estimates
Table D1
SUMMARY OF CAPITAL IMPROVEMENT PROJECT COSTS
Area Life Cycle Start of Cycle 2003 Costs ($M)PROCESS RELATED
Pump Station No 1 20 2025 $ 63Pump Station No 2 20 2006 $ 66
Chemical Addition 20 2023 $ 9Rectangular Primary Clarifiers 20 2013 $ 86Circular Primary Clarifiers 20 2025 $ 84ILP Nos 1 2 3 4 7 20 2025 $ 29
Aeration Basins 20 2025 $ 55Cryo Plants 10 2015 $ 1Secondary Clarifiers 20 2020 $ 140SFE Pump Station 20 2010 $ 13
Chlorination 20 2022 $ 16
Dechlorination 20 2023 $ 12Hydraulic Structures 20 2020 $ 7Complex A and B 20 2025 $ 32
C-I Dewatering 15 2020 $ 31C-II Lower Level Dewatering 15 2019 $ 35C-II Upper Level Dewatering 15 2015 $ 42
C-I and C-II Incineration 15 2009 $ 139Sludge Offloading 20 2025 $ 19NON-PROCESS RELATED
AdminRagland Buildings 20 2025 $ 10Plant Security 10 2015 $ 10Plant-wide Paving 15 2020 $ 6Parking Structure 20 2025 $ 7Work Environment Improvements 10 2015 $ 5
Rehab of OampM Bldgs Warehouses 20 2007 $ 40Plant-wide Instrumentation 15 2020 $ 100General Electrical 20 2045 $ 29Plant-wide Secondary Water 15 2025 $ 6
Plant-wide Steam System 15 2023 $ 6Plant-wide Potable Water 15 2010 $ 2Plant -wide Drainage 15 2010 $ 2
Fire Protection Improvements 20 2006 $ 4Plant-Wide JOCs As-Needed Eng 1 2005 $ 3
Total $ 1107

7182019 Basis of Cost Estimates
httpslidepdfcomreaderfullbasis-of-cost-estimates 367
September 2003 1
Basis of Cost Estimates
1 PurposeIn the development of a Master Plan for wastewater conveyance and treatment thatextends 50 years into the future it is necessary to utilize a set of common assumptionsas to the capital cost of facility construction The cost assumptions provide the basisfor establishing the estimated annual expenditure in the capital improvement plan(CIP) that was developed as a component of the Detroit Wastewater Master Plan(WWMP)
The guidelines are intended to provide unit costs for construction and rehabilitationof conveyance and treatment facilities These unit costs can then be used to establishtotal costs of planning alternatives for comparative purposes Unit costs can also beapplied to recommended system upgrades improvements and rehabilitation projectsto develop total project costs for CIP development
While conveyance facilities are common elements of the DWSD system the treatmentfacilities being investigated are each somewhat unique in nature and thus not asreadily subjected to the application of generalized unit cost factors For this reason adifferent approach to cost development has been employed for treatment facilities
2 MethodologyDevelopment of component costs for a Master Plan covering the range of potentialproject types anticipated within the DWSD planning area over a 50-year time framerequired evaluation of historic costs as well as ldquoground uprdquo estimates These costscan be applied to proposed projects with varying site conditions and complexities
throughout the planning area
21 Wastewater Conveyance Facilities
To better account for a range of conditions if possible the unit costs were derivedfrom a convergence of two sources The cost estimates for wastewater conveyancefacilities are based on an assembly and comparison of historical construction costsfrom multiple cost estimates and reports compiled from 1971 to present andconstruction estimates using the RS Means Sitework and Landscaping Data andmethodology
Since in many cases the two methods produced differing results final unit costs
were established within the range of estimated costs through review by experienceddesign construction professionals Section B15 in Appendix B presents the historicalcost development Section B16 in Appendix B presents the Means method costdevelopment In some cases one of the two estimating methods was applicable forconveyance facilities
7182019 Basis of Cost Estimates
httpslidepdfcomreaderfullbasis-of-cost-estimates 467
Detroit Water and Sewerage DepartmentBasis of Cost Estimates
September 2003 2
It was necessary to establish a time reference for historical data reviewed as part ofthe cost evaluation The year 2003 was selected as this reference point for the CIPdevelopment
The CIP developed for the Wastewater Master Plan (WWMP) used 2003 as the baseyear Section 2 contains the base data for the CIP estimates Cost data tables thatwere used for the CIP estimates are contained in Appendix A The 2000 costs fromthese tables were escalated to 2003 costs using the ENR Construction Cost Index (CCI)shown in Table 1
Both Means estimates and historical costs were calculated to use the year 2003 as abase Historical sources which are taken from the year in which they were reportedwere adjusted to 2003 unit costs using the ENR Construction Cost Index (CCI) Costsfor specific items were then averaged to determine the historical unit cost in year 2003dollars It should be noted that some projects with costs that were extremely high orlow compared to the others for the same type of facility were excluded from theaverage Some assumptions were made for the historical data due to a lack of detail
in the original estimates For example many of the pipe depths were assumed basedon size For sections where variable depths are shown the original estimate which isbased upon a shallower depth is multiplied by a factor to obtain a number for thedeeper depths
These factors were obtained from the RS Means estimates and then applied to thehistorical data Where historical costs were not available manufacturers estimateswere used
Section B16 in Appendix B shows the estimates based on RS Means costs for thesame material and the same assumed conditions as in the cost guidelines section The
RS Means numbers were taken from the 2002 Means data then converted to the year2000 using the suggested Means factors for year and location (Detroit) adjustmentFor example an item costing $23 in 2002 would be multiplied by the index in 2000(959) then divided by the index for 2002 (100) to obtain $2206 then adjusted for thelocation by multiplying by 962 the Means city cost index to give an adjusted 2000price of $2122 These 2000 values were then escalated to 2003 values for the unitcosts used in the CIP development
22 Wastewater Treatment Facilities
To address the treatment needs within the planning area over the 50-year planningperiod a series of treatment alternatives were developed by Tetra Tech MPS Theseranged from expansion of treatment capacity at the existing Detroit WWTP toutilization of existing outlying (satellite) facilities with upgrade and expansion inPontiac Warren andor Mt Clemens to construction of dedicated facilities to treatwet weather flow and the dewatered flows from CSO and SSO storage facilities Eachof these alternatives has been documented in technical memoranda specific to thealternative type
7182019 Basis of Cost Estimates
httpslidepdfcomreaderfullbasis-of-cost-estimates 567
Detroit Water and Sewerage DepartmentBasis of Cost Estimates
September 2003 3
The three technical memoranda describing alternativesndash Expanded Facilities withinthe City of Detroit Technical Feasibility of Satellite Treatment and TechnicalFeasibility of a Wet Weather Flow Treatment Facility- contain detailed descriptions ofthe proposed facilities and include as appendices the complete cost estimates foreach facility
As part of the alternatives development conceptual (planning level) cost estimateswere developed for the facilities being proposed These estimates would be based onspecific facility locations preliminary facility layouts and defined treatment processcapacities Because this additional detail is available more detailed estimates couldbe prepared than could be expected for conveyance facilities
These estimates used standard construction cost estimating procedures and formatsDesigners broke down facilities by each component process and prepared costestimates at the process level for the specific size and configuration appropriate foreach facility
Appendix C contains the treatment facility unit cost tables derived from thealternatives Any unit costs for conveyance items used in these alternative estimatessuch as pipes were used with other data in calculating the CIP costs
3 LimitationsEvery construction project presents unique conditions with respect to location siteconstraints and soil or geotechnical considerations Also construction industrymarket conditions can greatly affect project costing By considering both historicalcosts as well as current cost estimating methods an attempt was made to account forthe range of potential costs However no estimates can be considered final until
complete construction plans and specifications have been prepared At the MasterPlanning stage these unit costs as well project costs derived from them need to beevaluated appropriately Thus these generalized costs are appropriate forcomparison of alternative approaches to providing service but additional detailshould be provided for site-specific construction estimates
4 Allowances and ContingenciesAt every stage of construction cost estimating certain unknown factors need to beaccounted for in the development of estimated costs This is even true at the timefinal plans and specifications are completed for a specific project It is especiallycritical at the planning stage The unit costs presented throughout this technical
memorandum are base construction costs for the most part This means that in mostcases no allowances or contingencies of any type have been applied Contingenciesneed to be added to cost estimates prior to inclusion in the CIP
The following cost categories need to be considered in the development of completecost estimates Contractor Overhead and Profit Contingency and Engineering LegalAdministrative and Management
7182019 Basis of Cost Estimates
httpslidepdfcomreaderfullbasis-of-cost-estimates 667
Detroit Water and Sewerage DepartmentBasis of Cost Estimates
September 2003 4
Contractor Overhead and Profit accounts for the markup that contractors employ tocover costs such as mobilization and the profit they would expect to garner from theproject
The Contingency markup has two main parts Planning Level Contingency andContractor Contingency The Planning Level Contingency accounts for theuncertainty of the cost estimate due to the basic level of design developmentappropriate at the planning level This contingency should decrease significantly aseach project proceeds from the Master Plan stage through the Project Plan stage thePreliminary Design Stage and the Final Design Stage For a Master Plan looking 50years into the future the contingency will be a considerable portion of the total costsThe contractor contingency allows for uncertainty in the final contract cost due tomarket conditions at the time the project is bid and for potential changes to theproject during the construction stage (change orders)
Engineering Legal Administrative and Management markups account for severalaspects of the projects These include providing funds for performing the engineering
design calculations preparing plans and specifications bidding the constructioncontract and awarding the work contractor oversight shop drawing review andapproval on site inspection services change order development development ofrecord drawings and contract close out They also account for the costs associatedwith legal review of construction contracts and when necessary the involvement offinancial professionals in preparation of bond statements and the sale of bonds
A review of contingencies used in other recent DWSD projects led to the use of thefollowing multipliers For new construction (replacement) or major rehabilitation themultipliers applied are
Contractor Overhead and Profit 25 of base construction costs
Contingency 30 of total construction cost includingcontractor overhead and profit
Engineering Legal 20 of total construction cost includingAdministrative and Management contractor overhead and profit
For all other categories (inspection cleaning rehabilitation etc) the multipliersapplied are
Contractor Overhead and Profit 25 of base construction costs
Contingency 15 of total construction cost includingcontractor overhead and profit
Engineering Legal 10 of total construction cost includingAdministrative and Management contractor overhead and profit
7182019 Basis of Cost Estimates
httpslidepdfcomreaderfullbasis-of-cost-estimates 767
Detroit Water and Sewerage DepartmentBasis of Cost Estimates
September 2003 5
Most unit costs presented in this technical memorandum are basic construction costswithout contingencies The above contingencies needed to be added to the base costsas project specific estimates are developed The estimates that are based on actualcosts from past projects already include these contingencies
5 Cost IndexHistorical costs have been adjusted using data from the Engineering News Record(ENR) Construction Cost Index History which provides annual cost indices from1913 to present Table 1 shows the annual cost indices from 1969 to 2002Extrapolation of this data gives the annual indices for the year 2003
The cost estimates developed for the CIP used a 2003 cost The 2003 costs wereobtained by escalating any base data used from their base year to 2003 using the CCIUsing the example for a 1990 estimated cost for 12 sanitary line of $212 per linearfoot convert it to 2003 cost by dividing the unit price by the yearrsquos index (2124732)Then multiply by the year 2003 index (6698) to get the escalated 2003 unit cost of $300
7182019 Basis of Cost Estimates
httpslidepdfcomreaderfullbasis-of-cost-estimates 867
Detroit Water and Sewerage DepartmentBasis of Cost Estimates
September 2003 6
Table 1ENR Construction Cost Index (CCI)
Year Index Year Index
1969 1269 1986 4295
1970 1381 1987 4406
1971 1581 1988 4519
1972 1753 1989 4615
1973 1895 1990 4732
1974 2020 1991 4835
1975 2212 1992 4985
1976 2401 1993 5210
1977 2576 1994 5408
1978 2776 1995 5471
1979 3003 1996 5620
1980 3237 1997 5825
1981 3535 1998 5920
1982 3825 1999 6060
1983 4066 2000 6221
1984 4146 2001 6342
1985 4195 2002 6538
2003 6698
Index for 2002 was averaged in 1202 using 11 months of data This number was forecasted
7182019 Basis of Cost Estimates
httpslidepdfcomreaderfullbasis-of-cost-estimates 967
Detroit Water and Sewerage DepartmentBasis of Cost Estimates
September 2003 7
Cost Guideline SummariesThe following pages contain cost guidelines for those items included in the CIP andrate model including pipe installation special structures and manholes pumpstations pipe rehabilitation miscellaneous repair and pipeline inspection andcleaning The categories and layout correspond to the CIP cost estimating
spreadsheets
For each category the material and assumed construction conditions are identifiedThese include type and depth of excavation utility and pavement restorationanticipated and number of manholes or other structures included in the estimateAdditionally a useful life expectancy for the specific type of facility is provided foruse in CIP development
6 Program 1 Sewer Infrastructure ProgramThis section of the CIP development includes the inspection cleaning rehabilitation
and replacement of DWSD sewers
61 Subprogram No 1A Lateral and Connector Sewers ndashCleaning Sediment Disposal amp Condition AssessmentLateral and Connector sewers were defined previously in consultation with DWSDA lateral sewer collects flows from homes and businesses for discharge into trunksewers These sewers range in size from 6rdquo to 24rdquo in diameter with an average size of18rdquo A connector sewer is a pipe that carries the wastewater flow from a lateral sewerto a trunk sewer Connector sewers range from 24rdquo in diameter to a 4rsquo by 6rsquo eggshape with an average size of 30rdquo in diameter An assessment of DWSD sewers fromthe technical memorandum Lateral Sewers and Connection Sewers indicates that
there are 2258 miles of laterals and 559 miles of connector sewers in the DWSD sewersystem
611 Inspection
The CIP costs for inspection of lateral and connector sewers were developed with theassumption that this inspection would be accomplished through sewer televisingSewer televising consists of remote televising of sewers using robotically controlledcameras The estimate includes mobilization set up for camera entry and furnishingof all incidentals
The actual CIP cost estimation was derived from the technical memorandum entitled
Physical Inspection of Lateral and Connector Sewers revised May 2003 whichdescribes a recent pilot project performed by Inland Waters Pollution Control Inc forDWSD Inspections occurred in June July and October of 2002 This projectinspected several DWSD sewers in the lateral and connector categories using TVinspection methods The selected sewers for these inspections included varying pipediameters as well as material types The average inspection costs from the pilotproject are used for the CIP Table A-1 in Appendix A shows an alternate costestimation for sewer inspections based on historical data These unit costs in Table A
7182019 Basis of Cost Estimates
httpslidepdfcomreaderfullbasis-of-cost-estimates 1067
Detroit Water and Sewerage DepartmentBasis of Cost Estimates
September 2003 8
do not include contingencies Note that the pilot project costs are within the rangesset in Table A
2003 Lateral and Connector Sewer Inspection Costs = $211 per linear foot ($11141 per mile)
612 Cleaning
Sewer Cleaning consists of preparatory cleaning (also called light cleaning) or heavycleaning utilizing a hydraulic sewer jetvacuum unit The estimate includesmobilization set up for jetvacuum truck and furnishing of all incidentals
The CIP costs for the cleaning of lateral and connector sewers were taken from thetechnical memorandum entitled Physical Inspection of Lateral and Connector Sewersrevised May 2003 which describes a recent pilot project performed by Inland WatersPollution Control Inc for DWSD Table A-2 in Appendix A shows an alternate costestimation for sewer cleaning based on historical data
The unit costs do not include contingencies
2003 Lateral and Connector Sewer Light Cleaning Costs = $325 per linear foot ($17160 permile)
2003 Lateral and Connector Sewer Heavy Cleaning Costs = $900 per linear foot ($47520 permile)
613 Sediment Testing
A concern regarding the pipes in the DWSD system is that the buildup of sludgecontains toxic materials such as PCBs or mercury This sludge should be removedand disposed of in a different manner than the current sewer jet vacuum unit
practices (washing sludgedown the sewers to the WWTP) Sludge removal shouldtherefore include a sampling station to test the sludge components If sludge testsindicate hazardous materials the sludge will need to be disposed of in an apporpiatelandfill The cost per truckload comes from CDM and assumes two tests one forPCBrsquos and one for mercury would be performed on each load
2003 Lateral and Connector Sewer Sediment Testing Costs = $200 per truck load (10 truckloads per mile)
62 Subprogram No 1B Interceptor and Trunk Sewer Cleaning
Disposal and Condition AssessmentInterceptor and trunk sewers are defined previously in the Interceptor and TrunkSewers technical memorandum A trunk sewer collects flows from lateral andconnector sewers for discharge into interceptor sewers These sewers are generallylarger than laterals ranging in size from 18rdquo to 10rsquo in diameter An interceptor seweris a large sewer that carries the wastewater flow from a number of trunk sewers to thewastewater treatment plant These sewers do not connect to any homes buildings or
7182019 Basis of Cost Estimates
httpslidepdfcomreaderfullbasis-of-cost-estimates 1167
Detroit Water and Sewerage DepartmentBasis of Cost Estimates
September 2003 9
catch basins Interceptor sewers are generally larger than trunk sewers (10rsquo or larger)An assessment of DWSD sewers indicated that there are 483 miles of trunk sewersand 83 miles of interceptors (39 miles serving Macomb County only) in the DWSDsewer system
621 Inspection
The CIP costs for inspection of interceptor and trunk sewers were developed with theassumption that inspection would be accomplished through sewer televising Othermethods such as diving may be more effective because of the larger sizes of pipesSewer televising consists of remote televising of sewers using robotically controlledcameras The estimate includes mobilization set up for camera entry and furnishingof all incidentals The estimate is unit cost per mile of pipe The CIP costs for theinspection of interceptor and trunk sewers were taken from Table A-1 which is basedon historical data This unit cost does not include contingencies
2003 Interceptor and Trunk Sewer Inspection Costs = $431 per linear foot ($22747 per mile)
63 Subprogram No 1C Lateral amp Connector SewerImprovements
Costs for improvements to the lateral and connector sewers in the DWSD system werederived These improvements can include the rehabilitation of the existing sewers orthe construction of new sewers to replace existing sewers to enhance the sewer systemwhere there are deficiencies This memorandum only considers the rehabilitation oflateral and connector sewers
631 Rehabilitation - Lateral and Connector Relining
There are a few different methods of rehabilitating sewers that were considered for
lateral and connector sewers These include chemical grouting of joints slipliningand cured-in-place-pipe (CIPP) CIPP was the preferred method used for the CIPestimates
CIPP Lining
CIPP lining is considered to be major rehabilitation CIPP installation includes theinstallation of Cured-In-Place Pipe mobilization sewer preparation and furnishing ofall incidentals
The service life of CIPP Lining is 50 years The CIP cost estimation for lateral andconnector sewer rehabilitation was derived from the recent pilot project performed by
Inland Waters for DWSD This information is found in the technical memorandumentitled Physical Inspection of Lateral and Connector Sewers For this project CIPPwas installed for several lengths of laterals and connectors within the DWSD systemThese unit costs do not include contingencies
2003 Lateral Sewer CIPP Rehabilitation Costs = $12235 per linear foot ($646000 per mile)
2003 Connector Sewer CIPP Rehabilitation Costs = $22030 per linear foot ($1163184 permile)
7182019 Basis of Cost Estimates
httpslidepdfcomreaderfullbasis-of-cost-estimates 1267
Detroit Water and Sewerage DepartmentBasis of Cost Estimates
September 2003 10
Table A-3 in Appendix A shows an alternate cost estimation for CIPP Lining based onhistorical data
64 Subprogram No 1D Interceptor and Trunk SewerImprovementsCosts for improvements to the interceptor and trunk sewers in the DWSD systemwere derived These improvements include the rehabilitation of the existing sewersand the construction of new sewers to replace existing sewers or to enhance thesewer system where there are deficiencies
641 Rehabilitation ndash Structural Repairs
The rehabilitation of the larger interceptor and trunk sewers requires methodsdifferent than for lateral and connector sewers In addition to a CIPP relining specificstructural repairs can be accomplished because the sewers are large enough to be
entered As a result of recent inspections of some of the interceptors and trunk sewersin the DWSD system some structural repairs were identified These can be found inthe CS-1158 report called Long Term CSO Plan for the Detroit and Rouge Rivers 1996These inspections covered approximately 886400 linear feet or about 30 of thesystem with structural repair costs (mostly CIPP lining) estimated at $18000000
Table A-3 shows the CIPP lining cost estimation based on historical data This tablehowever only goes up to 48rdquo pipe while the pipes used in this structural repaircalculation range from 24rdquo to 177rdquo The unit cost below is an extrapolation of Table A-3 and does not include contingencies
2003 Interceptor and Trunk Sewer Structural Repair Costs = $1000 per linear foot
642 Cleaning
Sewer Cleaning of the interceptor and trunk sewers consists of heavy cleaningutilizing a hydraulic sewer jetvacuum unit The estimate includes mobilization setup for jetvacuum truck and furnishing of all incidentals The CIP costs for thecleaning of interceptor and trunk sewers were taken from Table A-2 which is basedon historical data This unit cost does not include contingencies
2003 Interceptor and Trunk Sewer Heavy Cleaning Costs = $1641 per linear foot
643 Sludge RemovalAn analysis of inspection reports on interceptor and trunk sewers by TYJT calculatedthat sludge removal and disposal for 30 of the system would cost approximately$1867043 These can be found in the CS-1158 report called Long Term CSO Plan forthe Detroit and Rouge Rivers 1996 This sludge removal is considered to be heavycleaning and uses the costs from the historical data in Table A-2
2003 Interceptor and Trunk Sewer Sludge Removal Costs = $1641 per linear foot
7182019 Basis of Cost Estimates
httpslidepdfcomreaderfullbasis-of-cost-estimates 1367
Detroit Water and Sewerage DepartmentBasis of Cost Estimates
September 2003 11
644 Sediment Testing
A concern regarding the pipes in the DWSD system is that the buildup of sludgecontains toxic materials such as PCBs or mercury This sludge should be removedand disposed of in a different manner than the current sewer jet vacuum unitpractices (washing sludge down the sewers to the WWTP) Sludge removal should
therefore include a sampling station to test the sludge components and disposal ofhazardous material in a landfill Sludge amounts were obtained from inspectionreports found in the CS-1158 report called Long Term CSO Plan for the Detroit andRouge Rivers 1996 The cost per truckload comes from CDM and assumes two testsone each for PCBs and mercury would be performed on each load
2003 Interceptor and Trunk Sewer Sediment Testing Costs $200 per truck load (10 cu yds)
645 New Relief Sewers
DWSD previously identified areas of the system where relief sewers were neededThese areas were defined in Status Report on Storm Relief Sewer Program by DWSD
issued July 1975 reissued July 1978 The Wastewater Master Plan (WWMP) team hasreviewed these relief sewers (Local Alternatives for SSO Control technicalmemorandum) and concluded that the following may be needed pending furthersystem inspections and cleaning
7 Mile Road Reliefo 7920 ft of 120rdquo at depth of 30rsquoo 13200 ft of 120rdquo at depth of 25rsquo
Fenkell Reliefo 7920 ft of 156rdquo at depth of 25rsquoo 13200 ft of 192rdquo at depth of 10rsquo
Schoolcraft Reliefo 10560 ft of 192rdquo at depth of 15rsquo
Hubbell Reliefo 10660 ft of 144rdquo at depth of 10rsquoo 7920 ft of 144rdquo at depth of 20rsquo
Joy Clark Reliefo 6833 ft of 192rdquo at depth of 25rsquoo 27216 ft of 192rdquo at depth of 15rsquoo 169 ft of 120rdquo at depth of 10rsquo
The cost of construction of relief sewers was estimated in 1978 and again in 1996 forthe CS-1158 Long Term CSO Control Plan for the Detroit and Rouge Rivers Volume3 1004 C1 Alternative Evaluations (Table C4 in Alternative 6) Table A-4 shows the1996 estimates as well as the 2003 costs derived by escalation using the CCI Thecosts from this table used for the new relief sewer cost are shown here
120rdquo at depth of 10rsquo Costs = $1289 per linear foot
120rdquo at depth of 25rsquo Costs = $1557 per linear foot
7182019 Basis of Cost Estimates
httpslidepdfcomreaderfullbasis-of-cost-estimates 1467
Detroit Water and Sewerage DepartmentBasis of Cost Estimates
September 2003 12
120rdquo at depth of 30rsquo Costs = $1712 per linear foot
144rdquo at depth of 10rsquo Costs = $1389 per linear foot
144rdquo at depth of 20rsquo Costs = $1579 per linear foot
156rdquo at depth of 25rsquo Costs = $1938 per linear foot
192rdquo at depth of 10rsquo to 15rsquo Costs = $2399 per linear foot
192rdquo at depth of 25rsquo Costs = $2771 per linear foot
646 Future Modeling
The CIP cost estimation has included future modeling of the DWSD sewer systemThis modeling of data from the Segmented Facilities plan is scheduled to take placefrom 2008 to 2010 The estimate from CDM includes contingencies
2003 Future Modeling Costs = $100000
647 Oakwood Interceptor
A cost estimate was prepared for the installation of a new redundant sewer systemparallel to the Oakwood Interceptor section of the NW Interceptor This estimate wasperformed by Tetra Tech MPS and can be found in the CS-1314 technicalmemorandum entitled Conceptual Plan for Oakwood Northwest Interceptor revisedMay 2003 The estimate does not include contingencies
2003 Oakwood Redundant Interceptor Costs = $8700000
648 Macomb Meter Stop Gates
A project is proposed to install stop gates at meters CV-3 and MB-25 in MacombCounty The estimate from SDA and found in the technical memorandum entitledCapital Improvement Programs for Macomb County does not include contingencies
2003 Stop Gate Installation Costs = $1700000 each
649 North Gratiot Interceptor
This project will install the new North Gratiot Interceptor Sewer (NGIS) in MacombCounty The estimate from SDA and found in the technical memorandum entitled
Capital Improvement Program for Macomb County includes contingencies
2003 NGIS Installation Costs = $40000000
6410 Northwest Interceptor Improvements
This project includes improvements to the Northwest Interceptor Sewer (NWIS) from8 Mile Road to the WWTP This estimate was performed by Tetra Tech MPS and can
7182019 Basis of Cost Estimates
httpslidepdfcomreaderfullbasis-of-cost-estimates 1567
Detroit Water and Sewerage DepartmentBasis of Cost Estimates
September 2003 13
be found in the technical memorandum entitled Conceptual Plan for OakwoodNorthwest Interceptor The estimate does not include contingencies
2003 10rsquo Diameter Lining Costs = $1000 per linear foot
2003 10rsquo Diameter Replacement Sewer Costs = $2500 per linear foot
65 Subprogram No 1E Manholes and Catch BasinImprovements
Inspection and repair of sewer structures in the DWSD system are required to ensurethe system operates efficiently Therefore the CIP estimated costs for the inspectionand repair of manholes and catch basins
651 Manhole Inspections
Manhole inspection consists of either topside inspection or full inspection Table A-5
in Appendix A shows the estimate in unit cost per manhole inspection based onhistorical data The CIP estimate for manhole inspections assumes 5 of themanholes in the system will undergo topside inspection every year This unit costdoes not include contingencies
2003 Manhole Inspection Costs = $52 per structure
652 Manhole Repairs
Manhole repairs can consist of
Manhole wrapping
External chemical grout Manhole shelf repair Manhole channel repair Pipe connection repair Raising replacing manhole frames
Each repair is separate The CIP estimate assumes that the quantity of manholesneeding the above categories of repairs varies with the amounts per inspection cycleas follows
5 need manhole wrapping 8 need external chemical grout 10 need manhole shelf repair 10 need manhole channel repair 10 need pipe connection repair 15 need raising replacing manhole frames
2003 Manhole Wrapping Costs = $215 per structure
2003 External Chemical Grouting Costs = $1938 per structure
7182019 Basis of Cost Estimates
httpslidepdfcomreaderfullbasis-of-cost-estimates 1667
Detroit Water and Sewerage DepartmentBasis of Cost Estimates
September 2003 14
2003 Manhole Shelf Repair Costs = $646 per structure
2003 Manhole Channel Repair Costs = $646 per structure
2003 Pipe Connection Repair Costs = $538 per structure
2003 Manhole Frame Replacement Repair Costs = $646 per structure
653 Manhole Replacement
Manhole installation (replacement) includes
Pre-cast reinforced concrete manholes risers and cones cast-in-place basesframes castings steps
Excavation and backfill of common earth Sheeting shoring bracing and dewatering Up to 6rdquo of bituminous pavement removal and replacement
And furnishing of all incidentals
Table A-6 in Appendix A shows the estimate in unit cost per vertical linear foot ofinstallation based on historical information This estimate for manhole replacementassumes that manholes are 4 in diameter and 15 deep and that 2 would need to bereplaced for each inspection cycle (20 years) This unit cost does not includecontingencies
2003 Manhole Replacement Costs = $6053 per manhole
654 Catch Basin Cleaning
The CIP cost estimations assume that all 200000 catch basins will be cleaned everycycle Table A-7 in Appendix A shows the cost per catch basin Catch basin cleaningincludes labor trucks and disposal This unit cost does not include contingencies
2003 Catch Basin Cleaning Costs = $59 per catch basin
655 Catch Basin Repair
The CIP cost estimation for catch basin repair assumes that the repairs will be pipeconnection repair and frame replacement as shown in Section 652 for manholesThese unit costs do not include contingencies
2003 Catch Basin Pipe Connection Repair Costs = $538 per catch basin
2003 Catch Basin Frame Replacement Costs = $646 per catch basin
66 Subprogram No 1F Regulators Outfalls Backwater GatesDiversion Dams and In-System Storage661 Outfall Flow Regulators Inspection
Outfall regulator inspection includes inspection and report writing
7182019 Basis of Cost Estimates
httpslidepdfcomreaderfullbasis-of-cost-estimates 1767
Detroit Water and Sewerage DepartmentBasis of Cost Estimates
September 2003 15
The cost estimate assumes that a five-person crew can dive and inspect two outfallregulators each day The cost per day for a five-person crew is $6000day as shownin an invoice for the installation of backwater gate sensors for the Baby Creek outfallIt should be noted that some outfall regulators might cost more to inspect than othersdepending on regulator accessibility and condition This unit cost does not includecontingencies
2003 Outfall Regulator Inspection Costs = $3000 per average outfall regulator
662 Outfall Flow Regulators Rehabilitation
Outfall regulator rehabilitation includes cleaning and inspection of the regulatorfloat and sump chamber removal of existing regulator gates and associatedcomponents removal of flap gates and sluice gates rehabilitation of regulator floatreplacement of access manhole frames and covers installation of new slide gates andflexible flap gates and temporary diversion of sewage flow
Regulator rehabilitation was performed under Contract PC-695 Regulator RemoteFlow Control Structures and Dam Rehabilitation This project rehabilitated 40 gatesfor a total cost of $7708000 The average cost of $192700 per gate is rounded to$200000 per gate This contract ended in 2000 so the cost is escalated to $218000using a CCI escalation factor of 1077 It should be noted that some outfall regulatorsmight cost more to rehabilitate than others depending on regulator accessibility andcondition This cost estimate includes any contingencies
2003 Outfall Regulator Rehabilitation Costs = $218000 per average outfall regulator
663 Outfall Flow Regulators Replacement
Outfall regulator replacement includes the mechanical work described in the outfallregulator rehabilitation work described above and additionally replacement of theconcrete regulator chamber
As noted above the cost for the mechanical equipment replacement is $218000 peroutfall regulator It is assumed that the regulator junction chamber replacement costswould be similar to the influent junction chamber construction costs for the St AubinScreening and Disinfection Facility Contract PC-731 The contractor has provided adetailed cost estimate which indicates that the construction cost for this junctionchamber would be $105000 An additional $10000 is added for destruction andremoval of the existing regulator chamber In summary the regulator replacementcosts are
Installation of mechanical components = $218000
Construction of new regulator chamber = $105000
Destructionremoval of existing regulator chamber = $10000
Total = $333000
7182019 Basis of Cost Estimates
httpslidepdfcomreaderfullbasis-of-cost-estimates 1867
Detroit Water and Sewerage DepartmentBasis of Cost Estimates
September 2003 16
Although the mechanical components portion includes some contingencies the unitcost here does not include contingencies
2003 Outfall Regulator Replacement Costs = $333000 per average outfall regulator
664 Outfall Backwater Gate and Diversion Dam Inspection
Outfall inspection includes inspection and report writing Backwater gates anddiversion dams are inspected at the same time as outfalls and do not require anyadditional costs The cost estimate assumes that a five-person crew can dive andinspect two outfalls each day
The cost per day for a five-person crew is $6000day as shown in an invoice for theinstallation of backwater gate sensors for the Baby Creek outfall It should be notedthat some outfalls might cost more to inspect than others depending on outfall sizedepth number of conduits and condition This unit cost does not includecontingencies
2003 Outfall Inspection Costs = $3000 per average outfall
665 Outfall Rehabilitation
Outfall rehabilitation includes repair work at each outfall as needed
The cost estimate is based on outfall rehabilitation costs budgeted for the DWSDcontract DWS 849850 Inspection and In-place Rehabilitation of Outfalls The costfor this project is $15540000 for rehabilitation of twelve outfalls This results in anaverage cost of $1295000 per outfall The cost shown is an average amount for alloutfalls Outfall rehabilitation costs can vary widely because the work involvedcould range from nothing to significant structural repairs This unit cost does include
contingencies
2003 Outfall Rehabilitation Costs = $1295000 per average outfall
666 Outfall Replacement
Outfall replacement includes removal of the existing outfall and installation of a newoutfall from the junction chamber to the river
Outfall replacement costs are estimated based on the equivalent installation of a sewerline for the average size length and depth outfall The average outfall calculationsassume that outfalls with multiple barrels can be represented by a longer length of
single barrel outfall For example a double barrel outfall with a length of 15 ft can beconsidered a single barrel outfall with length 30 ft Similarly outfalls with box eggor arch shapes are converted to cylinders with equivalent diameters For example a10 ft x 10 ft box sewer is considered equivalent to an 113 ft diameter cylinder Theseconsiderations are used to calculate the average length and diameter for all outfallsThe average outfall is 85 ft in diameter and 1280 ft in length Outfall depth is notreadily available and is assumed to be 10 ft
7182019 Basis of Cost Estimates
httpslidepdfcomreaderfullbasis-of-cost-estimates 1967
Detroit Water and Sewerage DepartmentBasis of Cost Estimates
September 2003 17
The replacement cost for the average size and length outfall can then be calculatedbased on the cost of installation of a new sewer with these dimensions The costs forsewer installation as a function of size and depth are displayed in Table A-4 Thistable indicates that the replacement cost for an 85 ft diameter 1280 ft long and 10 ftdeep outfall would be about $12600000 It should be noted that outfall replacementcosts would vary significantly because of differences in size number of conduits anddepth below the surface This unit cost does not include contingencies
2003 Outfall Replacement Costs = $12619680 per average outfall
667 Backwater Gate Rehabilitation
Backwater gate rehabilitation includes cleaning leak repair repairreplacement ofrotted or deteriorated timber and repairreplacement of hardware
The estimated total cost for repair of twelve backwater gates under Contract CS-1158Long Term CSO Control Plan for the Detroit and Rouge Rivers (1996) is $182000This results in an average cost of $15200 per gate This cost is then multiplied by aCCI escalation factor resulting in an average 2003 cost of $18100 per gate This cost isthen rounded to $20000 for the estimate Actual backwater gate rehabilitation costswill vary considerably depending on the condition and accessibility of the gate Thisunit cost does include contingencies
2003 Backwater Gate Rehabilitation Costs = $20000 per average backwater gate
668 Backwater Gate Replacement
Backwater gate replacement includes replacement of the backwater gates andassociated stop logs
The cost for installation of two backwater gates and associated stop logs at the StAubin Screening and Disinfection Facility is $336000 according to the detailed costbreakdown for Contract PC-731 St Aubin Screening and Disinfection Facility It isassumed that removal of the existing gates and other site work would costapproximately $14000 This results in a total cost of $350000 for the installation oftwo gates at one location There are 154 gates at 54 locations or an average of 281gates per location It is assumed that the cost of gate replacement is proportional tothe total number of gates Hence the cost for replacing all of the gates would be
$350000 2 gates 154 gates all locations = $26460000
$26460000 54 locations = $490000 per location
This cost was then multiplied by a CCI escalation factor to obtain a 2003 average costof $517000 per location It should be noted that the cost at each location would varybased on the number and size of backwater gates and stop logs This unit cost doesnot include contingencies
2003 Backwater Gate Replacement Costs = $517000 per average backwater gate
7182019 Basis of Cost Estimates
httpslidepdfcomreaderfullbasis-of-cost-estimates 2067
Detroit Water and Sewerage DepartmentBasis of Cost Estimates
September 2003 18
669 Diversion Dam Rehabilitation
Diversion dam rehabilitation includes cleaning and repair of deteriorated damsurfaces restoration of connection between dam surface and bottom of flashboardsand repairreplacement of associated stop logs
The needed repairs are identified in the CS-1314 Review of Collection SystemRegulators and Outfalls technical memorandum revised May 2003 The cost fordiversion dam rehabilitation is based on simple cost estimates for a three man crewworking two days The average cost for diversion dam rehabilitation based on threelocations is $1000 per dam It should be noted that diversion dam rehabilitation costswill vary based on the size type and condition of the diversion dam This unit costdoes not include contingencies
2003 Diversion Dam Rehabilitation Costs = $1000 per average diversion dam
6610 Diversion Dam Replacement
Diversion dam replacement includes the installation of a new inflatable dam at theexisting location This cost also includes the cost of removing the existing diversiondam
The cost for diversion dam replacement is based on the detailed cost breakdown forContract PC-731 St Aubin Screening and Disinfection Facility The installation costfor an inflatable diversion dam according to this contract is $70000 This cost ismultiplied by a CCI escalation factor to get a 2003 installation cost of $74000 It isassumed that there is an additional cost of $10000 for destruction and removal of theexisting diversion dam and other site work The total cost for diversion damreplacement is $84000 per dam The cost of each diversion dam will vary based on
dam size and accessibility This unit cost does not include contingencies
2003 Diversion Dam Replacement Costs = $84000 per average diversion dam
6611 In-System Storage Devices amp System Gate Inspection
In-system storage device (ISSD) inspection includes inspection and report writingThe cost estimate assumes that a three-person crew can inspect one ISSD each dayThe cost for one three-person crew should be about $3000 This unit cost does notinclude contingencies
2003 ISSD Inspection Costs = $3000 per ISSD
6612 In-System Storage Devices amp System Gate Rehabilitation
ISSD rehabilitation includes removal of existing regulator gates and associatedcomponents removal of existing operating systems for the regulator gatesinstallation of new slide gates with self-enclosed hydraulic operating systemsinstallation of instrumentation and control systems for remote operation of the slidegates from the SCC
7182019 Basis of Cost Estimates
httpslidepdfcomreaderfullbasis-of-cost-estimates 2167
Detroit Water and Sewerage DepartmentBasis of Cost Estimates
September 2003 19
This type of work was performed under Contract PC-695 Regulator Remote FlowControl Structures and Dam Rehabilitation This project rehabilitated 40 gates for atotal cost of $7708000 The average cost of $192700 per gate was rounded to$200000 per gate This contract ended in 2000 so the cost was then escalated to$218000 using a construction cost escalation factor It should be noted that someISSDs cost more to rehabilitate than others depending on ISSD type accessibility andcondition This unit cost does include contingencies
2003 ISSD Rehabilitation Costs = $218000 per ISSD
6613 In-System Storage Devices amp System Gate Replacement
ISSD replacement includes removal of all existing ISSD mechanical electrical andinstrumentation components and replacement with new components
ISSD replacement costs are based on Contract PC-747 In-System Storage Under thiscontract thirteen new ISSDs were installed for a total cost of $26400000 This wouldresult in an average cost of $2030000 per ISSD It is assumed that this installationcost is comparable to the average ISSD replacement cost It should be noted that ISSDreplacement costs would vary depending on the size type and accessibility of thedevice This unit cost does include contingencies
2003 ISSD Replacement Costs = $2030000 per ISSD
67 Subprogram No 1G Pump Stations671 Inspections
Pump station inspection includes inspection of the structural condition of the stationand wet well (if equipped) pump testing and inspection of the instrumentation and
control devices
The pump station inspection costs are estimated to run about $1000 per pump fortesting based on a cost breakdown from Contract PC-744 Wastewater TreatmentPlant Rehabilitation and Program Management It was assumed that it would take anengineer about 25 weeks to inspect the pump station and write a report At $100 perhour this would cost $10000 per pump station This unit cost does not includecontingencies In summary pump station inspection costs include
Pump testing = $1000 per pump
Pump station inspection and report writing = $10000 per pump station
2003 Pump Station Inspection Costs = $10000 per pump station + $1000 per pump
672 Rehabilitation
Pump station rehabilitation includes pump and motor testing station cleaningpainting and repair repairreplacement of damaged pump motor control panelparts and minor pump station structural repairs
7182019 Basis of Cost Estimates
httpslidepdfcomreaderfullbasis-of-cost-estimates 2267
Detroit Water and Sewerage DepartmentBasis of Cost Estimates
September 2003 20
The pump station rehabilitation costs can be estimated based on the total pumpstation rehabilitation costs estimated for Contract PC-744 Wastewater TreatmentPlant Rehabilitation and Program Management In the PC-744 report the total costfor immediate short-term and long term rehabilitation routine and long lead timespare parts CMMS system and motor repairreplacement was $7737500 It isassumed that this cost is representative of pump rehabilitation needs for each five-year interval This cost does not include contingencies
2003 Pump Station Rehabilitation Costs = $7737500 for rehabilitation of all pump stations
673 Major Rehabilitation
Major rehabilitation of pump stations includes the capital cost of renovating awastewater pump station including all pumps and related equipment
The cost for pump station major rehabilitation was estimated by CDM and for theTetra Tech MPS alternatives development (technical memoranda Expanded Facilitieswithin the City of Detroit Technical Feasibility of Satellite Treatment and TechnicalFeasibility of a Wet Weather Flow Treatment Facility) and is found in Table A-9aPump station major rehabilitation will vary considerably depending on pump stationand wet well condition number and capacity of pumps and instrumentation andcontrol requirements Table A-9b shows the breakdown of these costs into low orhigh flow categories The average flow of DWSD pump stations is more than 500MGD so the high flow cost is used for the CIP This unit cost does not includecontingencies
2003 Pump Station Major Rehabilitation Costs (500 + MGD)= $20000000 for the average pump station
674 Energy ManagementThe CIP estimates reflect the need for better energy management in terms of pumps atthe pump stations This is expected to be accomplished through the installation ofvariable-frequency drives (VFD) on these pumps The CIP includes VFD installationat the Clintondale and Woodmere Pump Stations The estimate based on thetechnical memorandum entitled Energy Management was made by TYJT and did notinclude contingencies The following estimate has had contingencies added
2003 Energy Management Costs (VFD installation at Clintondale and Woodmere) =$682500
68 Subprogram No 1H Meters681 Inspection and Maintenance
Flow meter maintenance includes maintenance repair and some replacement (mostlymechanical but some structural) of current meters billing and database managementand dye testingflow accuracy The costs shown are based on the maintenancebudget for CS-1249 Greater Detroit Regional Sewer System Model ndash Billing Meter
7182019 Basis of Cost Estimates
httpslidepdfcomreaderfullbasis-of-cost-estimates 2367
Detroit Water and Sewerage DepartmentBasis of Cost Estimates
September 2003 21
Program This project maintains 50 meters with an annual budget of $2000000 Thisunit cost does include contingencies
2003 Meter Maintenance Costs = $40000average meter
682 Replacement
Flow meter replacement includes meter equipment and installation costs as well asmeter vault replacement The CIP cost is based on a CDM estimate from the CS-1249Greater Detroit Regional Sewer System Model ndash Billing Meter Program and isrepresentative of the average meter Meter replacement costs may vary considerablydepending on the type and location of the meter This unit cost does not includecontingencies
2003 Meter Replacement Costs = $500000average meter
683 Macomb Odor Control
Some additional specific projects were included in the CIP estimation These involveodor control measures at 12 Macomb County meter chambers through the installationof carbon adsorption units The estimates are based on the CS-1292 Task Order Nos33 and 34 Final Draft Report that did not include contingencies The followingestimate has had contingencies added
2003 Macomb County Odor Control Costs = $772500
7 Program 2 CSO and SSO Control Program
71 Ongoing CIP Projects
The WWMP CIP estimation has identified several projects included in the current CIP
that have carry-over costs These rollover CIP costs are as shown in Table A-8 andinclude any contingencies
2003 Ongoing CIPRollover Costs = $617759000
72 New ProjectsThe WWMP CIP estimation has identified some new CSO projects These CIP costsare as shown below and include any contingencies The Detroit River CSO is basedon an estimate of $25000000 per outfall assuming the construction of a screening anddisinfection facility
Table 2 New CSO Project Costs
Project CIP Cost
Lower Rouge River Outfalls $25000000
Detroit River CSOs ndash Upper Range $750000000
Detroit River CSOs ndash Lower Range $375000000
Based on half as many outfalls constrd
7182019 Basis of Cost Estimates
httpslidepdfcomreaderfullbasis-of-cost-estimates 2467
Detroit Water and Sewerage DepartmentBasis of Cost Estimates
September 2003 22
73 CSO RehabilitationThe WWMP also considered the rehabilitation of the CSOrsquos in the DWSD system Theupper range estimate assumes that the rehabilitation costs would be approximately1 of the CSO construction costs The table below shows the construction and CIPrehabilitation costs without contingencies It is assumed that each facility will be
rehabilitated annually from 2008 to 2050 The lower range estimate assumes a yearlyrehabilitation cost
Table 3 Upper Range CSO Rehabilitation Costs
Facility Construction Cost RehabilitationCost (each)
Conner Creek CSO $199049172 $1990492
Fox Creek CSO $11582891 $ 115829Leib CSO $31327898 $ 313279
St Aubin CSO $21540250 $ 215403Upper Rouge CSO $418000000 $4180000
Baby Creek CSO $50389000 $ 503890
7 Mile CSO $17638861 $ 176389Fenkell CSO $22281777 $ 222818
Hubbell Southfield CSO $67975783 $ 679758
Belle Isle CSO $14960000 $ 149600
2003 Lower Range CSO Rehab Costs = $6000000 per year
8 Program 3 System Control and Wastewater Treatment
Program81 Wastewater Treatment Plant Ongoing and MajorRehabilitationThe DWSD Wastewater Treatment Plant (WWTP) is the largest facility in the DWSDsewer system An overall assessment of funding needed for the WastewaterTreatment Plant Program was first estimated for planning purposes by summarizingthe current yearly funding for wastewater treatment plant programs This data issummarized in Table 61 and additional information is presented in Table A11 inAppendix A
Table 4 shows that current proposed expenditures have increased from about $99million from the 1997-2002 CIP to $175 million in the 2002-07 CIP However thisamount includes many projects that are not directly related to the WastewaterTreatment Plant such as work at system pump stations Deleting these projects thetotal is closer to $134 million per year
7182019 Basis of Cost Estimates
httpslidepdfcomreaderfullbasis-of-cost-estimates 2567
Detroit Water and Sewerage DepartmentBasis of Cost Estimates
September 2003 23
Table 4 Summary of CIP Proposed Expenditures on the DWSD WastewaterTreatment Plant and System Control
CIP
Total Proposed WWTP CIP
Expenditures (over 5 years)
Yearly WWTP Expenditure
Average
(over 5 years)
20023 to 20067 $878M $175M
20023 to 20067 (deleting
non-WWTP projects)
$670M $134M
20012 to 20056 $973M $194M
19978 to 20012 $493M $99M
Source Sewage Disposal System Capital Improvement Program Descriptions Financial Planning Division
DWSD
Detroit Wastewater Partners the program managers for the PC-744 wastewater plant
upgrade reviewed this initial information in a meeting on January 31 2003Expenditures on renewal and replacement of wastewater treatment plant componentsare typically 3 of the value of the wastewater plant per year for large plants Anestimated value for the Detroit Wastewater Plant is about $5 billion Expenditures of3 of the plant value result in an estimate of $150 million per year as a reasonabletarget to maintain a functioning plant including replacement and upgrade oftreatment processes as technology improves This estimate is summarized in the firstcolumn in Table 5
Table 5 Summary of CIP Proposed Funding Estimates for the DWSDWastewater Treatment Plant and System Control
Original Estimate
Proposed WWTP CIP Yearly
Funding Requirements
(including Process
Improvements)
Revised Estimate from
DWP and DWSD Plant
Staff of Proposed WWTP
Yearly Funding
Requirements
Wastewater Treatment Plant -
Ongoing Renovation and Repairs
$80M $55-70M
Major Renovation of the Wastewater
Treatment Plant
$40M --
System Controls and RegionalOperations
$30M $15M
TOTAL $150M $70-85M
A successful ongoing program of repair and replacement at the WastewaterTreatment Plant cannot be conducted without periodic inspections and updates to theNeeds Assessment The cost of this program is estimated at $100 - 200000 ifconducted yearly If not completed yearly the cost would be higher
7182019 Basis of Cost Estimates
httpslidepdfcomreaderfullbasis-of-cost-estimates 2667
Detroit Water and Sewerage DepartmentBasis of Cost Estimates
September 2003 24
For the 50-year Capital Improvements Program the estimate of $150M for theWastewater Treatment Plant and System Controls was used for assessing rateimpacts as it is a realistic (see Volume 5 Customer Service and Technical SupportProgram) Subsequently in July 2003 a more detailed review of facility needs for theWastewater Treatment Plant and System Controls by Detroit Wastewater Partnersand the Wastewater Treatment Plant staff resulted in a revised estimate shown in thesecond column in Table 5 Note that this estimate includes a much lower cost forongoing renovations to System Controls Also this estimate does not include majorrenovations that would change the treatment process
The Detroit Wastewater Partners estimate of yearly funding requirements was basedon an assessment of the anticipated life and replacement cost of assets at theWastewater Treatment Plant This estimate is summarized in Table D1 in AppendixD of this report Background data from this analysis is included in the spreadsheetslinked to Appendix D
Historical information summarizing expenditures on the plant over the last ten yearswas compared to the $150M estimate Figure 1 shows the magnitude of the dramaticincrease in project expenditures at the Wastewater Treatment Plant in the last fouryears to address the requirements of the Federal Court Upgrades were required totreatment units that were last renovated more than 20 years ago These upgrades didnot include totally new treatment technologies
While this level of expenditure is not expected to continue indefinitely the averagelevel of expenditures over the next fifty years may approach $150M if new treatmenttechnologies are required to replace the current system This would become
necessary if 1) permit limits or other regulatory requirements change or 2) if spaceconstraints and growth in the amount of wastewater treated made expansion of theplant necessary Even without these changes another major renovation of the plant islikely 20 years after the current renovation or in the decade 2020-2030 If onlyongoing replacement and repair of the Wastewater Plant and System Controls isrequired however the estimated CIP requirements for the Wastewater TreatmentPlant and System Controls may be considerably less
7182019 Basis of Cost Estimates
httpslidepdfcomreaderfullbasis-of-cost-estimates 2767
Detroit Water and Sewerage DepartmentBasis of Cost Estimates
September 2003 25
Figure 1
Detroit Wastewater Treatment Plant
Capital Expenditures - 10 Years
$-
$50
$100
$150
$200
$250
1992-1993
1993-1994
1994-1995
1995-1996
1996-1997
1997-1998
1998-1999
1999-2000
2000-2001
2001-2002
Fiscal Year
M i l l i o n s
7182019 Basis of Cost Estimates
httpslidepdfcomreaderfullbasis-of-cost-estimates 2867
Detroit Water and Sewerage DepartmentBasis of Cost Estimates
September 2003 26
Appendix A
Data Tables Used for CIP
7182019 Basis of Cost Estimates
httpslidepdfcomreaderfullbasis-of-cost-estimates 2967
Detroit Water and Sewerage DepartmentBasis of Cost Estimates
September 2003 27
Appendix A ndash Data Tables Used for CIPThe April 2002 version of this technical memo contained several tables that were usedfor the actual CIP cost estimates for the WWMP These tables use 2000 costssometimes based on historical data escalated using the BCI instead of the CCI TheCIP estimates use 2003 data with CCI escalations This section contains these original
tables as well as the recalculated tables The sources listed in these tables are shownin table B-10 in section B15
Sewer Inspection Costs
The only number from Table A-1 used for the CIP estimation is the unit cost for the54-90rdquo category Table A-1 shows this data escalated using the CCI The averagesfrom the 2003 CCI category are used for the CIP
Table A-1Historical Sewer Inspection Costs
SizeSource Unit
CostLF Year2003 Unit CostLF
(CCI) Source
8 - 24 $130 1982 $228 5
$125 2000 $135 15
$080 1988 $119 8
$150 2000 $162 21
Avg $161
27 - 48 $100 1999 $111 2
$225 1999 $249 11
$225 1996 $268 13
$200 2000 $215 21
Avg $211
54 - 90 $300 2000 $323 21
$500 2000 $538 21
Avg $431
Sewer Cleaning CostsAll 2000 data used for Table A-2 comes from historical sources from 1988 to 2000 Theaverages from the 2003 CCI category are used for the CIP
7182019 Basis of Cost Estimates
httpslidepdfcomreaderfullbasis-of-cost-estimates 3067
Detroit Water and Sewerage DepartmentBasis of Cost Estimates
September 2003 28
Table A-2Historical Sewer Cleaning Costs
TaskSource Unit
CostLF Year2003 Unit
CostLF (CCI) Source
PrepCleaning $085 1988 $126 8
$125 2000 $135 15
$200 2000 $215 21
$300 2000 $323 21
$400 2000 $431 21
$500 2000 $538 21
Avg $295
HeavyCleaning $1750 1999 $1934 2
$1200 2000 $1292 20
$1500 2000 $1615 20
$1600 2000 $1723 20
Avg $1641
CIPP Lining CostsAll 2000 data used for Table A-3 comes from historical sources from 1988 to 2000 and
was escalated to 2000 using the BCI The averages from the 2003 CCI category areused for the CIP
Table A-3Historical CIPP Lining Costs
SizeSource Unit
CostLF Year2003 Unit CostLF
(CCI) Source
8 $5800 1982 $10156 5
$6000 1982 $10507 5
$6500 1999 $7184 6
Avg $9282
10 $8000 1999 $8842 6
$8600 1988 $12747 8
Avg $10795
7182019 Basis of Cost Estimates
httpslidepdfcomreaderfullbasis-of-cost-estimates 3167
Detroit Water and Sewerage DepartmentBasis of Cost Estimates
September 2003 29
SizeSource Unit
CostLF Year2003 Unit CostLF
(CCI) Source
12 $6000 1982 $10507 5
$9500 1999 $10500 6
$12800 1988 $18972 8
$9400 1988 $13933 8
Avg $13478
15 $12800 1988 $18972 8
$10800 1988 $16008 8
Avg $17490
18 $12800 1988 $18972 8
Avg $18972
21 $10500 1982 $18387 5
$23000 2000 $24764 20
Avg $21575
24 $16300 1988 $24160 8
$27300 2000 $29393 20
Avg $26776
27 $30000 2000 $32300 20
Avg $32300
30 $36000 2000 $38760 20
Avg $38760
36 $44500 2000 $47912 20
Avg $47912
42 $53300 2000 $57387 20
Avg $57387
48 $62000 2000 $66754 20
Avg $66754
7182019 Basis of Cost Estimates
httpslidepdfcomreaderfullbasis-of-cost-estimates 3267
Detr
September 2003
Table A-4New Relief Sewer Installation Costs
Cost of Sewers-in-Place per Linear Foot at Various Depth Ranges
D e p t h
0 ndash 10 Ft 10 ndash 15 Ft 15 ndash 20 Ft 20 ndash 25 Ft 25 ndash
Size 1996 2003 1996 2003 1996 2003 1996 2003 1996
21 $174 $207 $226 $269 $281 $335 $341 $406 $395
24 $218 $260 $278 $331 $333 $397 $393 $468 $470
27 $262 $312 $330 $393 $385 $459 $445 $530 $503
30 $306 $365 $382 $455 $437 $521 $497 $592 $557
36 $350 $417 $434 $517 $489 $583 $549 $654 $611
42 $394 $470 $486 $579 $541 $645 $601 $716 $665
48 $438 $522 $538 $641 $593 $707 $653 $778 $719
54 $482 $574 $590 $703 $645 $769 $705 $840 $773
60 $530 $632 $641 $764 $698 $832 $755 $900 $830
66 $567 $676 $686 $818 $744 $887 $802 $956 $882
72 $604 $720 $731 $871 $790 $942 $849 $1012 $934
78 $641 $764 $776 $925 $836 $996 $896 $1068 $986
84 $678 $808 $821 $978 $882 $1051 $943 $1124 $1037
90 $715 $852 $866 $1032 $928 $1106 $990 $1180 $1089
7182019 Basis of Cost Estimates
httpslidepdfcomreaderfullbasis-of-cost-estimates 3367
Detr
September 2003
Cost of Sewers-in-Place per Linear Foot at Various Depth Ranges
D e p t h
0 ndash 10 Ft 10 ndash 15 Ft 15 ndash 20 Ft 20 ndash 25 Ft 25 ndash
Size 1996 2003 1996 2003 1996 2003 1996 2003 1996
96 $753 $897 $911 $1086 $974 $1161 $1037 $1236 $1140
102 $953 $1136 $1018 $1213 $1084 $1292 $1181
108 $995 $1186 $1063 $1267 $1131 $1348 $1222
114 $1037 $1236 $1107 $1319 $1178 $1404 $1263
120 $1081 $1288 $1153 $1374 $1225 $1460 $1306
132 $1123 $1338 $1197 $1427 $1272 $1516 $1372
144 $1165 $1388 $1245 $1484 $1325 $1579 $1439
156 $1407 $1677 $1497 $1784 $1626
168 $1590 $1895 $1692 $2017 $1837
180 $1797 $2142 $1912 $2279 $2076
192 $2013 $2399 $2141 $2552 $2325
204 $2254 $2686 $2398 $2858 $2604
7182019 Basis of Cost Estimates
httpslidepdfcomreaderfullbasis-of-cost-estimates 3467
Detroit Water and Sewerage DepartmentBasis of Cost Estimates
September 2003 33
Table A-5Manhole Inspection Costs
Repair Type 2000 UnitCost
2003 UnitCost
TopsideInspection $50 $52
Full Inspection $150 $162
Manhole Replacement Costs
All 2000 data used for Table A-6 comes from historical sources from 1971 to 2000 andwas escalated to 2003 for the CIP
Table A-6Historical Manhole Replacement Costs
SizeSource UnitCostVLF Year
2003 Unit CostVLF(CCI)
4 $12000 1985 $19160
$22500 1999 $24869
$16250 1999 $17961
$10000 1971 $42366
$18000 1999 $19895
$10400 1971 $44060
$10900 1971 $46178
$10300 1971 $43637$18750 1990 $26540
$12500 1990 $17693
$16250 1971 $68844
$17500 1971 $74140
$18700 1971 $79224
Avg $40351
5 $25000 1990 $35387
$18750 1990 $26540$18750 1999 $20724
$22000 1999 $24316
Avg $26742
7182019 Basis of Cost Estimates
httpslidepdfcomreaderfullbasis-of-cost-estimates 3567
Detroit Water and Sewerage DepartmentBasis of Cost Estimates
September 2003 34
SizeSource UnitCostVLF Year
2003 Unit CostVLF(CCI)
6 $29000 1999 $32053
$21250 1999 $23487
Avg $27770
7 $26000 1998 $29417
$35000 1998 $39600
$18750 1985 $29937
$25000 1985 $39917
$37000 1999 $40895
Avg $35953
8 $118750 1999 $131252
$95000 1996 $113222
Avg $122237
The manhole replacement for the CIP assumes the average manhole is 4 in diameterand 15 deep This calculates as follows Each manhole installation = $40351 X 15 =$605265
Table A-7Catch Basin Cleaning Costs
Item Quantity Unit Cost Total Per Year
Labor Cost 33 each $50 per hour $3432000 $3432000
Truck Cost 12 each $350000 $4200000 $420000
Disposal Cost 66667 each $1 $66667 $66667
Cost per Catch Basin $59
7182019 Basis of Cost Estimates
httpslidepdfcomreaderfullbasis-of-cost-estimates 3667
Detroit Water and Sewerage DepartmentBasis of Cost Estimates
September 2003 35
Table A-8CSO CIP Rollover Costs
Project Total Cost CIP RolloverCost
Upper Rouge River Complete CSO Facility $481000000 $362000000
City of Detroit Downspout Disconnects (current CIP runsthrough 2008 estimate for 2008 to 2050)
$208000000 $165000000
Oakwood Pump StationCSO Basin NA $86000000
LTCSO Program Management (current CIP runs through2008 estimate for 2008 to 2050)
NA $4759000
Pump Station Replacement Major RehabilitationPump Stations installation includes the capital cost of constructing a wastewaterpump station including all pumps and related equipment The CIP estimate does notreflect the replacement of any pump station as major rehabilitation is thought to be
adequate Tables A-9a shows the major rehabilitation estimate in unit cost x $1000per pump station dependent on the size of the station Table A-9b shows thebreakdown of these costs into low or high flow categories
Table A-9aPump Station Replacement Costs
Size 2000 Unit Cost 2003 Unit Cost
175 GPM
$65 $70
300 GPM
$65 $70
350 GPM
$65 $70
700 GPM
$85 $92
750 GPM
$90 $97
1250 GPM
$140 $151
1800 GPM
$190 $205
2400 GPM
$250 $269
4200 GPM
$395 $425
5700 GPM
$495 $533
18056 GPM $359
27778 GPM
$512
33333 GPM
$615
34722 GPM
$666
38889 GPM
$717
7182019 Basis of Cost Estimates
httpslidepdfcomreaderfullbasis-of-cost-estimates 3767
Detroit Water and Sewerage DepartmentBasis of Cost Estimates
September 2003 36
Size 2000 Unit Cost 2003 Unit Cost
49000 GPM
$1080 $2380
59722 GPM
$1127
66667 GPM $1229
78472 GPM
$1434
700000 GPM
$12000 $12920
Table A-9bPump Station Replacement Costs
Size 2003 Unit Cost
0 - 500 GPM $1567000
500 + GPM $20000000
7182019 Basis of Cost Estimates
httpslidepdfcomreaderfullbasis-of-cost-estimates 3867
Detroit Water and Sewerage DepartmentBasis of Cost Estimates
September 2003 37
Appendix B
Data Tables Not Used for CIP
7182019 Basis of Cost Estimates
httpslidepdfcomreaderfullbasis-of-cost-estimates 3967
Detroit Water and Sewerage DepartmentBasis of Cost Estimates
September 2003 38
Appendix B ndash Data Tables Not Used for CIPThe April 2002 version of this technical memo contained several tables that were notused for the actual CIP cost estimates for the WWMP The CIP either used differentdata sources or did not include the categories covered in these tables
B1 Alternate Data Category TablesB11 Chemical Grouting of JointsChemical Grouting of Joints consists of utilizing chemical products to eliminate leaksin pipe joints The estimate includes mobilization set up and furnishing of allincidentals The estimate is shown and is in unit cost per pipe joint All 2000 dataused for Table B-1 comes from historical sources from 1982 to 1999 and was escalatedto 2003 using the CCI
Table B-1Historical Chemical Grouting of Joints Costs
SizeSource UnitCostJoint Year
2003 Unit CostJoint(CCI) Source
Al l $6000 1985 $9580 1
$3500 1982 $6129 5
$2400 1988 $3557 8
$3500 1999 $3868 11
$3500 1996 $4171 13
Avg $5461
B12 SlipliningSliplining is considered to be a light rehabilitation method Sliplining installationincludes
Installation of HPDE Pipe into existing sewer pipe Excavation and backfill of insertion pits in common earth Annular space grouting Mobilization Sewer preparation And furnishing of all incidentals
The service life of Sliplining is 50 years Sizes are the ID of the Slipliner pipe forexample to reline a 20rdquo sewer use the cost for the 16rdquo Slipliner The estimate in TableB-2 is unit cost x $1000 per mile of installation
7182019 Basis of Cost Estimates
httpslidepdfcomreaderfullbasis-of-cost-estimates 4067
Detroit Water and Sewerage DepartmentBasis of Cost Estimates
September 2003 39
Table B-2Sliplining Costs
Size 2003 UnitCost Mile
4rdquo $20
6rdquo $50
8rdquo $90
10rdquo $130
12rdquo $190
14rdquo $230
16rdquo $290
18rdquo $370
20rdquo $460
22rdquo $56024rdquo $660
26rdquo $780
28rdquo $900
30rdquo $1040
32rdquo $1180
36rdquo $1490
42rdquo $2030
48rdquo $2650
52rdquo $3060
54rdquo $3360
B13 Sewer Pipe ReplacementIt has been determined that the improvements to the DWSD sewer system would notinclude the replacement of any sewer pipes However the costs for the constructionof new sewers were investigated The results of this investigation follow Note thatthe costs included in these tables (Table B-3 through B-13) are the recommended costsfrom Table 51-1
Ductile Iron Force Main
Ductile Iron Force Main installation includes
Cement lined ductile iron pipe (6-24) Excavation and backfill of common earth 3 ndash 35 feet of cover to crown of the pipe Minimum utility relocation Up to 6rdquo of bituminous pavement removal and replacement Furnishing of all incidentals
7182019 Basis of Cost Estimates
httpslidepdfcomreaderfullbasis-of-cost-estimates 4167
Detroit Water and Sewerage DepartmentBasis of Cost Estimates
September 2003 40
Table B-3 shows the ductile iron force main installation estimate in unit cost x $1000per mile of pipe installation escalated using the CCI The service life of ductile ironforce mains is 30 years
Table B-3Historical New Ductile Iron Force Main Installation Costs
Size
SourceUnitCostLF Year 2003 Unit CostLF (CCI) Source
4 $1000 1985 $1597 1
$1500 1985 $2395 1
Avg $1996
6 $1600 1985 $2555 1
$1900 1985 $3034 1
$2700 2000 $2907 10
$1840 1971 $7795 14
$1600 1971 $6778 14
Avg $4614
8 $3000 2000 $3230 10
Avg $3230
10 $3300 2000 $3553 10
Avg $3553
12 $3700 2000 $3984 10
$1600 1971 $6778 14
$2800 1990 $3963 16
Avg $4909
14 $4100 2000 $4414 10
Avg $4414
16 $4500 2000 $4845 10
Avg $4845
7182019 Basis of Cost Estimates
httpslidepdfcomreaderfullbasis-of-cost-estimates 4267
Detroit Water and Sewerage DepartmentBasis of Cost Estimates
September 2003 41
Size
SourceUnitCostLF Year 2003 Unit CostLF (CCI) Source
18 $4200 1990 $5945 16
Avg $5945
20 $5300 2000 $5706 10
$4750 1971 $20124 14
Avg $12915
24 $6000 2000 $6460 10
Avg $6460
48 $10700 2000 $11520 10
Avg $11520
Service Leads Service Lead installation includes
6 SDR 35 PVC pipe and fittings Excavation and backfill of common earth Min 4rsquo cover to crown of the pipe Tie-in to existing sewer Reseeding
Furnishing of all incidentals
Table B-4 shows the estimate for service lead installation in unit cost per foot of pipewith the historical data escalated using the CCI The service life of service leads is 25years
Table B-4Historical New Service Lead Installation Costs
SizeSource unitCostLF Year
2003 Unit CostLF(CCI) Source
6 $1400 1971 $5931 14
$1560 1971 $6609 14
Avg $6270
7182019 Basis of Cost Estimates
httpslidepdfcomreaderfullbasis-of-cost-estimates 4367
Detroit Water and Sewerage DepartmentBasis of Cost Estimates
September 2003 42
Sanitary Laterals
Sanitary Lateral installation includes
Plain concrete pipe (8-12)
Excavation and backfill of common earth including trench shield or box 48rdquo diameter manholes at 300 feet Minimum utility relocation Up to 6rdquo of bituminous pavement removal and replacement Furnishing of all incidentals
Table B-5 shows the estimate for sanitary laterals in unit cost x $1000 per mile of pipeinstallation with the historical data escalated using the CCI The service life ofsanitary laterals is 50 years
Table B-5
Historical New Sanitary Lateral Installation Costs
SizeSource UnitCostLF Year
2003 Unit CostLF(CCI) Source
8 $2250 1985 $3592 1
$3500 1999 $3868 6
$2900 1971 $12286 14
$2600 1971 $11015 14
$2540 1971 $10761 14
$3260 1971 $13811 14
$3500 1990 $4954 16
$3500 1990 $4954 19
Avg $7706
10 $2400 1985 $3832 1
$2500 1985 $3992 1
$4000 1999 $4421 6
$5600 2000 $6029 10
$3000 1971 $12710 14
$5700 1971 $24148 14
Avg $9189
12 $5500 1999 $6079 6
$4500 1990 $6370 16
Avg $6224
7182019 Basis of Cost Estimates
httpslidepdfcomreaderfullbasis-of-cost-estimates 4467
Detroit Water and Sewerage DepartmentBasis of Cost Estimates
September 2003 43
Storm and Combined LateralsStorm and combined lateral installation includes
Reinforced concrete pipe (12-24) Excavation and backfill of common earth Sheeting shoring and bracing Trench shield or box at 8rsquo 48rdquo Diameter manholes at 300 feet Min bury to the crown of the pipe as listed below Minimum utility relocation Up to 6rdquo of bituminous pavement removal and replacement And furnishing of all incidentals
Tables B-6 shows the estimates for storm and combined laterals in unit cost x $1000per mile of pipe installation at various depths with the historical data escalated usingthe CCI However the depth of installation is unknown The service life of storm andcombined laterals is 50 years
Table B-6Historical New Storm and Combined Lateral Installation Costs
SizeSource Unit
CostLF Year2003 Unit CostLF
(CCI) Source
12 $2500 1985 $3992 1
$3000 1985 $4790 1
$4500 1989 $6531 9
$6100 2000 $6568 10
$4350 1971 $18429 14
$3900 1971 $16523 14
$2700 1990 $3822 16
$4890 1971 $20717 14
$4500 1990 $6370 16
$4500 1990 $6370 19
$2700 1990 $3822 19
Avg $8161
15 $2750 1985 $4391 1$6700 2000 $7214 10
$4900 1971 $20759 14
$3375 1990 $4777 16
$5625 1990 $7962 16
$3375 1990 $4777 19
7182019 Basis of Cost Estimates
httpslidepdfcomreaderfullbasis-of-cost-estimates 4567
Detroit Water and Sewerage DepartmentBasis of Cost Estimates
September 2003 44
SizeSource Unit
CostLF Year2003 Unit CostLF
(CCI) Source
15 $5625 1990 $7962 19
$3100 1999 $3426 11
Avg $6808
18 $3000 1985 $4790 1
$7300 2000 $7860 10
$3255 1990 $4607 16
$4050 1990 $5733 16
$4050 1990 $5733 19
$6750 1990 $9554 19
Avg $6379
21 $8000 2000 $8613 10
$5200 1971 $22030 14
$4800 1971 $20335 14
$4700 1971 $19912 14
$4725 1990 $6688 16
$4720 1990 $6681 19
Avg $14043
24 $8800 2000 $9475 10
$5400 1971 $22877 14
$5060 1971 $21437 14
$4430 1990 $6271 16
$5400 1990 $7644 19
$5400 1990 $7644 16
Avg $12558
Trunk SewersTrunk Sewer installation includes
Reinforced concrete pipe (27-66) Excavation and backfill of common earth Sheeting shoring and bracing Manholes at 300 feet Diameters as follows
o Pipe size 27rdquo ndash 36rdquo 60rdquo diameter manholes
7182019 Basis of Cost Estimates
httpslidepdfcomreaderfullbasis-of-cost-estimates 4667
Detroit Water and Sewerage DepartmentBasis of Cost Estimates
September 2003 45
o Pipe size 42rdquo- 48rdquo 72rdquo diameter manholeso Pipe size 54rdquo ndash 66rdquo 84rdquo diameter manholes
Min bury to the crown of the pipe as listed below Minimum utility relocation Up to 6rdquo of bituminous pavement removal and replacement And furnishing of all incidentals
Table B-7 shows the estimates in unit cost x $1000 per mile of pipe installation atvarious depths with the historical data escalated using the CCI However the depthof installation is unknown The service life of trunk sewers is 50 years
Table B-7Historical New Trunk Sewer Installation Costs
Size Source Unit CostLF Year 2003 Unit CostLF (CCI) Source
27 $9600 2000 $10336 10
$5000 1971 $21183 14
Avg $15759
30 $10400 2000 $11197 10
$13500 1996 $16090 13
Avg $13643
36 $9300 1982 $16285 5
$27500 1998 $31114 3
$27500 1997 $31621 7$27000 1999 $29843 11
$14500 1996 $17281 13
Avg $25229
42 $29000 1997 $33346 7
$33000 1999 $36474 11
$13200 2000 $14212 10
Avg $28011
48 $30000 1997 $34496 7
$28500 1999 $31500 11
Avg $32998
Size Source Unit CostLF Year 2003 Unit CostLF (CCI) Source
54 $31000 1997 $35646 7
7182019 Basis of Cost Estimates
httpslidepdfcomreaderfullbasis-of-cost-estimates 4767
Detroit Water and Sewerage DepartmentBasis of Cost Estimates
September 2003 46
Avg $35646
60 $34000 1997 $39096 7
Avg $39096
66 $47000 1998 $53177 3
$50000 1998 $56571 3
Avg $54874
Interceptors TunnelsInterceptor tunnel installation includes
Reinforced concrete pipe (78-120) Excavation and backfill of common earth Sheeting shoring and bracing 8rsquo Diameter manholes at 600 feet Min bury to the crown of the pipe as listed below Minimum utility relocation Up to 6rdquo of bituminous pavement removal and replacement And furnishing of all incidentals
Table B-8 shows the estimates in unit cost x $1000 per mile of pipe installation atvarious depths with the historical data escalated using the CCI However the depthof installation is unknown The service life of interceptors tunnels is 50 years
Table B-8Historical New Interceptors Tunnels Installation Costs
Size Source Unit CostLF Year 2003 Unit CostLF (CCI) Source
78 $60000 1998 $67885 3
Avg $67885
84 $62000 1998 $70148 3
Avg $70148
96 $70000 1998 $79199 3
Avg $79199
Size Source Unit CostLF Year 2003 Unit CostLF (CCI) Source
102 $75000 1998 $84856 3
7182019 Basis of Cost Estimates
httpslidepdfcomreaderfullbasis-of-cost-estimates 4867
Detroit Water and Sewerage DepartmentBasis of Cost Estimates
September 2003 47
Avg $84856
108 80000 1998 $90514 3
Avg $90514
120 $90000 1985 $143700 1
Avg $143700
B14 Miscellaneous RepairsThis cost estimating technical memorandum reviewed the costs for various sewersystem repairs that were not scheduled or included in the WWMP CIP developmentThis section contains the results of this repair cost review
Sump Pump Disconnection
Sump Pump Disconnection consists of removal of sump valves electrical connectionsand restoration These costs in unit cost per connection are estimated at $6720 in2000 dollars
Root Control
Root Control consists of utilizing chemical methods The estimate includesmobilization set up and furnishing of all incidentals Table B-9 shows the estimate inunit cost per linear foot of pipe with the historical data escalated using the CCI
Table B-9Historical Root Control Costs
SizeSource Unit
CostLF Year 2003 Unit CostLF (CCI) Source
Al l $200 1982 $350 5
$200 1988 $296 8
$140 1989 $203 9
$200 2000 $215 20
$225 2000 $242 20
$275 2000 $296 20
Avg $267
B15 Historical ReferencesShown on each spreadsheet is a reference code to the source of individual unit pricesTable B-10 shows the references used for the historical estimates in Appendices A andB
7182019 Basis of Cost Estimates
httpslidepdfcomreaderfullbasis-of-cost-estimates 4967
Detroit Water and Sewerage DepartmentBasis of Cost Estimates
September 2003 48
Table B-10Historical References
Source Title Date
1 Unidentified CDM Documents 1985
2Beaconsfield Relief Sewer Cleaning Manholes Inspection forSouth Macomb Sanitary District 1999
3 SOCSDS Project Plan 1998
4 Cost Effective Analysis 1998
5 Grosse Pointe Infrastructure 1982
6 City of Rochester Hills SDA 1999
7 HRC Detailed Cost Estimates 1997
8 Beverly Hills Local Sewer Study Rehabilitation Program 1988
9 Unidentified CDM Documents 1989
10 Unidentified Construction Cost Estimate
11 South Macomb Sanitary District 1999
12 City of Rochester Hills Sanitary Sewer Evaluation Survey 1996
13 South Macomb Sanitary District Appendix J 1996
14 Clinton-Oakland Sewage Disposal System 1971
15 City of Hazel Park MI
16 Farmington MI Sewer Seperation Improvements 1990
17 Basic Requirements Report Evergreen-Farmington Relief 1985
18 Cost Estimate 1975
19 Pre-Rehabilitation Local Sewer Costs 1990
20 Ann Arbor SSO Prevention Task Force 2000
B16 Means and Manufacturersrsquo EstimatesThe calculation of construction costs using the RW Means methodology requiresprices for component materials and construction activities (ie excavation orbackfilling) The following table presents the component costs used in the
development of construction cost guidelines
7182019 Basis of Cost Estimates
httpslidepdfcomreaderfullbasis-of-cost-estimates 5067
Detroit Water and Sewerage DepartmentBasis of Cost Estimates
September 2003 49
Table B-11Component Costs for Means and Manufacturersrsquo Estimates
Item Size Description Unit Cost Units Source
Excavation
Excavation common earth hauling
away fill up to 4 mi $1549 CY Means
BackfillCommon earth front-end loaderCompaction 12 lifts $882 CY Means
Select FillCrushed bank run gravelcompaction 6 lifts $2650 CY Means
Sheeting 8 DeepWood solid sheeting incl Walesbraces and spacers Drive amp Extract $668 SF Means
16 DeepWood solid sheeting incl Walesbraces and spacers Drive amp Extract $876 SF Means
24 DeepWood solid sheeting incl Walesbraces and spacers Drive amp Extract $1074 SF Means
32 DeepWood solid sheeting incl Walesbraces and spacers Drive amp Extract $1199 SF Means
Pavement Removal Bituminous 4 to 6 thick $572 SY Means
Saw Cutting Asphalt 6 thick $281 LF Means
Pavement Replacement Over Trench 6 thick $4333 SY Means
Non-Reinforced ConcretePipe 8 Bell and Spigot Joints Extra strength $1231 LF Means
10 Bell and Spigot Joints Extra strength $1305 LF Means
12 Bell and Spigot Joints Extra strength $1480 LF Means
Reinforced Concrete Pipe 12
Class 3 BampS or TampG Joints
wgaskets $1890 LF Means
15Class 3 BampS or TampG Jointswgaskets $2167 LF Means
18Class 3 BampS or TampG Jointswgaskets $2536 LF Means
7182019 Basis of Cost Estimates
httpslidepdfcomreaderfullbasis-of-cost-estimates 5167
Detroit Water and Sewerage DepartmentBasis of Cost Estimates
September 2003 50
Item Size Description Unit Cost Units Source
Reinforced Concrete Pipe 21Class 3 BampS or TampG Joints wogaskets $3135 LF Means
24Class 3 BampS or TampG Jointswgaskets $3504 LF Means
27Class 3 BampS or TampG Joints wogaskets $5302 LF Means
30Class 3 BampS or TampG Jointswgaskets $6592 LF Means
36Class 3 BampS or TampG Jointswgaskets $8990 LF Means
42
Class 3 BampS or TampG Joints wo
gaskets $9220 LF Means
48Class 3 BampS or TampG Jointswgaskets $13185 LF Means
54Class 3 BampS or TampG Jointswgaskets $14845 LF Means
60Class 3 BampS or TampG Joints wogaskets $16504 LF Means
66Class 3 BampS or TampG Joints wogaskets $23004 LF Means
72Class 3 BampS or TampG Jointswgaskets $29504 LF Means
78Class 3 BampS or TampG Joints wogaskets $32500 LF Means
84Class 3 BampS or TampG Joints wogaskets $35497 LF Means
96Class 3 BampS or TampG Jointswgaskets $43795 LF Means
102
Class 3 BampS or TampG Joints wo
gaskets $46000 LF Means
108Class 3 BampS or TampG Joints wogaskets $48300 LF Means
120Class 3 BampS or TampG Joints wogaskets $53000 LF Means
7182019 Basis of Cost Estimates
httpslidepdfcomreaderfullbasis-of-cost-estimates 5267
Detroit Water and Sewerage DepartmentBasis of Cost Estimates
September 2003 51
Item Size Description Unit Cost Units Source
Ductile Iron Pipe 4 Class 50 Cement Lined Mech Joint $1982 LF Means
6 Class 50 Cement Lined Mech Joint $2305 LF Means
8 Class 50 Cement Lined Mech Joint $2812 LF Means
10 Class 50 Cement Lined Mech Joint $3458 LF Means
12 Class 50 Cement Lined Mech Joint $4103 LF Means
14 Class 50 Cement Lined Mech Joint $4656 LF Means
16 Class 50 Cement Lined Mech Joint $5670 LF Means
18 Class 50 Cement Lined Mech Joint $6731 LF Means
20 Class 50 Cement Lined Mech Joint $7745 LF Means
24 Class 50 Cement Lined Mech Joint $9958 LF Means
48 Class 50 Cement Lined Mech Joint $23234 LF Est
PVC Pipe (SDR35) 6 SDR 35 BampS $512 LF Means
6 SDR 35 BampS 45 Degree Bend $7376 LF Means
HDPEPipe for Sliplining 4HDPE Pipe PE3408 DR21 (80 psi)price installed $442 LF Manufact
6HDPE Pipe PE3408 DR21 (80 psi)price installed $958 LF Manufact
8
HDPE Pipe PE3408 DR21 (80 psi)
price installed $1623 LF Manufact
10HDPE Pipe PE3408 DR21 (80 psi)price installed $2521 LF Manufact
12HDPE Pipe PE3408 DR21 (80 psi)price installed $3547 LF Manufact
7182019 Basis of Cost Estimates
httpslidepdfcomreaderfullbasis-of-cost-estimates 5367
Detroit Water and Sewerage DepartmentBasis of Cost Estimates
September 2003 52
Item Size Description Unit Cost Units Source
HDPEPipe for Sliplining 14HDPE Pipe PE3408 DR21 (80 psi)price installed $4276 LF Manufact
16HDPE Pipe PE3408 DR21 (80 psi)price installed $5586 LF Manufact
18HDPE Pipe PE3408 DR21 (80 psi)price installed $7069 LF Manufact
20HDPE Pipe PE3408 DR21 (80 psi)price installed $8728 LF Manufact
22HDPE Pipe PE3408 DR21 (80 psi)price installed $10560 LF Manufact
24
HDPE Pipe PE3408 DR21 (80 psi)
price installed $12567 LF Manufact
26HDPE Pipe PE3408 DR21 (80 psi)price installed $14749 LF Manufact
28HDPE Pipe PE3408 DR21 (80 psi)price installed $17106 LF Manufact
30HDPE Pipe PE3408 DR21 (80 psi)price installed $19637 LF Manufact
32HDPE Pipe PE3408 DR21 (80 psi)price installed $22342 LF Manufact
36HDPE Pipe PE3408 DR21 (80 psi)price installed $28277 LF Manufact
42HDPE Pipe PE3408 DR21 (80 psi)price installed $38488 LF Manufact
48HDPE Pipe PE3408 DR21 (80 psi)price installed $50270 LF Manufact
52HDPE Pipe PE3408 DR21 (80 psi)price installed $57869 LF Manufact
54
HDPE Pipe PE3408 DR21 (80 psi)
price installed $63623 LF Manufact
Manholes 4 DiaPrecast Concrete not incl Excavbackfill frame cover sheeting $17979 VLF Means
5 DiaPrecast Concrete not incl Excavbackfill frame cover sheeting $18809 VLF Means
7182019 Basis of Cost Estimates
httpslidepdfcomreaderfullbasis-of-cost-estimates 5467
Detroit Water and Sewerage DepartmentBasis of Cost Estimates
September 2003 53
Item Size Description Unit Cost Units Source
Manholes 6 DiaPrecast Concrete not incl Excavbackfill frame cover sheeting $28582 VLF Means
7 DiaPrecast Concrete not incl Excavbackfill frame cover sheeting $38355 VLF Means
8 DiaPrecast Concrete not incl Excavbackfill frame cover sheeting $48128 VLF Means
B17 Meanrsquos Unit Cost Estimates
Table B-12 contains a sample estimating sheet for calculating each component costusing the material and labor costs identified in the previous section
7182019 Basis of Cost Estimates
httpslidepdfcomreaderfullbasis-of-cost-estimates 5567
Detroit Water and Sewerage DepartmentBasis of Cost Estimates
September 2003 54
Table B-12Sample Component Costs Estimator
Quick Sewer Estimator
Force Mains
Dimensions
Pipe Size 14 in
Trench Width 4 Ft not less than 32
Trench Depth 6 Ft
Length 1 Ft
Material Costs
Pipe CostLF 66 $LF
Excav CostCY 13 $CYBackfill Cost CY 10 $CY
Select Fill CostCY 12 $CY
Pavament DemoCost SY 7 $SY
New Pavement Cost SY 29 $SY
Saw Cut Per LF 4 $LF
Sheeting Cost SF 0 $SF
May not be required for excavations under 5 deep
Pavement A (sy)= 044
Vexcav (cy) = Vbfill (cy) =
089 049
Hbfill (ft)
Sheeting (sf) Common Fill 333333
12
Vsfill (cy) =
036 Hsfill (ft)
Select Fill 266667
W (ft) = 4
Total Costs
7182019 Basis of Cost Estimates
httpslidepdfcomreaderfullbasis-of-cost-estimates 5667
Detroit Water and Sewerage DepartmentBasis of Cost Estimates
September 2003 55
Pipe $6600
Excav $622
Backfill $494
Select Fill $427
Pavement Demo $311New Pavement $1289
Saw Cut $800
Sheeting Cost $000
Total Price $10543
Price Per Foot $10543 LF
7182019 Basis of Cost Estimates
httpslidepdfcomreaderfullbasis-of-cost-estimates 5767
Detroit Water and Sewerage DepartmentBasis of Cost Estimates
September 2003 56
Appendix C
Unit Costs for Treatment Facilities
7182019 Basis of Cost Estimates
httpslidepdfcomreaderfullbasis-of-cost-estimates 5867
Detroit Water and Sewerage DepartmentBasis of Cost Estimates
September 2003 57
Appendix C ndash Unit Costs for Treatment FacilitiesThe following tables outline the unit costs for treatment facilities derived from projectcost estimates These unit costs are provided for future estimating of these facilitiesand are the total cost X 1000 They are base construction costs only and do notinclude engineering fees allowances or contingencies
Table C-1Influent Pump Station Unit Cost
Capacity 2000 2010 2020 2030 2040 2050
394 mgd $1960 $2320 $2820 $3320 $3820 $4320
400 mgd $3810 $4520 $5490 $6460 $7430 $8400
491 mgd $2060 $2440 $2970 $3490 $4010 $4530
615 mgd $2510 $2980 $3620 $4260 $4900 $5540
615 mgd $2510 $2980 $3620 $4260 $4900 $5540
615 mgd $3050 $3620 $4400 $5180 $5960 $6740
619 mgd $3150 $3740 $4550 $5350 $6150 $6950
860 mgd $4440 $5270 $6410 $7540 $8670 $9800
1040 mgd $5940 $7040 $8560 $10070 $11580 $13090
1080 mgd $3790 $4490 $5460 $6420 $7380 $8340
1130 mgd $6090 $7220 $8780 $10330 $11880 $13420
1260 mgd $4510 $5350 $6500 $7650 $8800 $9940
1580 mgd $6020 $7140 $8680 $10210 $11740 $13270
1890 mgd $6350 $7530 $9150 $10770 $12390 $14000
2535 mgd $7030 $8340 $10140 $11930 $13720 $15500
3105 mgd $7030 $8340 $10140 $11930 $13720 $15500
Table C-2
Screening and Grit Chamber Unit Cost Capacity 2000 2010 2020 2030 2040 2050
116 mgd $1530 $1810 $2200 $2590 $2980 $3370
143 mgd $2030 $2410 $2930 $3450 $3970 $4490
216 mgd $2210 $2620 $3180 $3740 $4300 $4860
221 mgd $3490 $4140 $5030 $5920 $6810 $7700
226 mgd $3490 $4140 $5030 $5920 $6810 $7700
322 mgd $4500 $5340 $6490 $7640 $8790 $9930
322 mgd $4500 $5340 $6490 $7640 $8790 $9930
368 mgd $3240 $3840 $4670 $5490 $6320 $7140
409 mgd $3700 $4390 $5340 $6280 $7220 $8160
471 mgd $6190 $7340 $8920 $10500 $12080 $13650471 mgd $5940 $7040 $8560 $10070 $11580 $13090
554 mgd $4520 $5360 $6510 $7660 $8810 $9960
576 mgd $5190 $6160 $7490 $8810 $10130 $11450
636 mgd $5600 $6640 $8070 $9500 $10930 $12350
1000 mgd $9770 $11590 $14090 $16580 $19070 $21550
1250 mgd $11300 $13400 $16290 $19170 $22050 $24920
7182019 Basis of Cost Estimates
httpslidepdfcomreaderfullbasis-of-cost-estimates 5967
Detroit Water and Sewerage DepartmentBasis of Cost Estimates
September 2003 58
Table C-3 Aeration Bas in wi th Nit ri ficat ion Unit Cost
Capacity 2000 2010 2020 2030 2040 2050
113 mgd $10400 $12330 $14990 $17640 $20290 $22930
140 mgd $11200 $13280 $16140 $18990 $21840 $24680
211 mgd $17300 $20520 $24940 $29350 $33760 $38150
211 mgd $17300 $20520 $24940 $29350 $33760 $38150211 mgd $16000 $18980 $23070 $27150 $31230 $35290
308 mgd $22600 $26800 $32570 $38320 $44080 $49810
308 mgd $22600 $26800 $32570 $38320 $44080 $49810
359 mgd $24200 $28700 $34880 $41040 $47210 $53350
400 mgd $22600 $26800 $32570 $38320 $44080 $49810
450 mgd $32300 $38310 $46560 $54780 $63010 $71200
450 mgd $31800 $37710 $45830 $53930 $62040 $70110
540 mgd $35300 $41860 $50880 $59870 $68870 $77830
563 mgd $36800 $43640 $53040 $62410 $71790 $81130
622 mgd $39300 $46610 $56650 $66660 $76680 $86650
Table C-4Primary Clarifiers Unit Cost
Capacity 2000 2010 2020 2030 2040 2050
116 mgd $1530 $1810 $2200 $2590 $2980 $3370
143 mgd $2030 $2410 $2930 $3450 $3970 $4490
216 mgd $2210 $2620 $3180 $3740 $4300 $4860
221 mgd $3490 $4140 $5030 $5920 $6810 $7700
226 mgd $3490 $4140 $5030 $5920 $6810 $7700
322 mgd $4500 $5340 $6490 $7640 $8790 $9930
322 mgd $4500 $5340 $6490 $7640 $8790 $9930
368 mgd $3240 $3840 $4670 $5490 $6320 $7140
409 mgd $3700 $4390 $5340 $6280 $7220 $8160
471 mgd $6190 $7340 $8920 $10500 $12080 $13650
471 mgd $5940 $7040 $8560 $10070 $11580 $13090
554 mgd $4520 $5360 $6510 $7660 $8810 $9960
576 mgd $5190 $6160 $7490 $8810 $10130 $11450
636 mgd $5600 $6640 $8070 $9500 $10930 $12350
1000 mgd $9770 $11590 $14090 $16580 $19070 $21550
1250 mgd $11300 $13400 $16290 $19170 $22050 $24920
Table C-5Complete Mix Activated Sludge Unit Cost
Capacity 2000 2010 2020 2030 2040 2050
100 mgd $21800 $25850 $31420 $36970 $42530 $48060
125 mgd $25300 $30000 $36460 $42900 $49350 $55770
7182019 Basis of Cost Estimates
httpslidepdfcomreaderfullbasis-of-cost-estimates 6067
Detroit Water and Sewerage DepartmentBasis of Cost Estimates
September 2003 59
Table C-6Iron Feed System Unit Cost
Capacity 2000 2010 2020 2030 2040 2050
113 mgd $152 $180 $220 $260 $300 $340
140 mgd $152 $180 $220 $260 $300 $340
211 mgd $152 $180 $220 $260 $300 $340
211 mgd $152 $180 $220 $260 $300 $340211 mgd $152 $180 $220 $260 $300 $340
308 mgd $156 $190 $230 $270 $310 $350
308 mgd $156 $190 $230 $270 $310 $350
359 mgd $175 $210 $260 $310 $360 $410
400 mgd $164 $190 $230 $270 $310 $350
450 mgd $182 $220 $270 $320 $370 $420
450 mgd $182 $220 $270 $320 $370 $420
540 mgd $208 $250 $300 $350 $400 $450
563 mgd $189 $220 $270 $320 $370 $420
622 mgd $197 $230 $280 $330 $380 $430
1000 mgd $205 $240 $290 $340 $390 $440
1250 mgd $225 $270 $330 $390 $450 $510
Table C-7Coagulation-Flocculation Unit Cost
Capacity 2000 2010 2020 2030 2040 2050
100 mgd $19700 $23360 $28390 $33410 $38430 $43430
125 mgd $24100 $28580 $34740 $40880 $47020 $53130
Table C-8Secondary Clarifiers Unit Cost
Capacity 2000 2010 2020 2030 2040 2050
113 mgd $3050 $3620 $4400 $5180 $5960 $6740140 mgd $3800 $4510 $5480 $6450 $7420 $8380
211 mgd $4430 $5250 $6380 $7510 $8640 $9760
211 mgd $4430 $5250 $6380 $7510 $8640 $9760
211 mgd $4870 $5780 $7030 $8270 $9510 $10750
308 mgd $5800 $6880 $8360 $9840 $11320 $12790
308 mgd $5800 $6880 $8360 $9840 $11320 $12790
359 mgd $7120 $8440 $10260 $12070 $13880 $15680
400 mgd $6280 $7450 $9050 $10650 $12250 $13840
450 mgd $8070 $9570 $11630 $13680 $15740 $17790
450 mgd $8070 $9570 $11630 $13680 $15740 $17790
540 mgd $10400 $12330 $14990 $17640 $20290 $22930
563 mgd $11500 $13640 $16580 $19510 $22440 $25360
622 mgd $12400 $14710 $17880 $21040 $24200 $27350
1000 mgd $13700 $16250 $19750 $23240 $26730 $30210
1250 mgd $15200 $18030 $21910 $25780 $29650 $33510
7182019 Basis of Cost Estimates
httpslidepdfcomreaderfullbasis-of-cost-estimates 6167
Detroit Water and Sewerage DepartmentBasis of Cost Estimates
September 2003 60
Table C-9Intermediate Pumping Unit Cost
Capacity 2000 2010 2020 2030 2040 2050
253 mgd $734 $870 $1060 $1250 $1440 $1630
350 mgd $1060 $1260 $1530 $1800 $2070 $2340
400 mgd $1220 $1450 $1760 $2070 $2380 $2690
446 mgd $1380 $1640 $1990 $2340 $2690 $3040452 mgd $1410 $1670 $2030 $2390 $2750 $3110
529 mgd $1680 $1990 $2420 $2850 $3280 $3710
611 mgd $1680 $1990 $2420 $2850 $3280 $3710
669 mgd $1860 $2210 $2690 $3170 $3650 $4120
743 mgd $2090 $2480 $3010 $3540 $4070 $4600
849 mgd $2430 $2880 $3500 $4120 $4740 $5360
942 mgd $2470 $2930 $3560 $4190 $4820 $5450
1040 mgd $2770 $3290 $4000 $4710 $5420 $6120
1050 mgd $2810 $3330 $4050 $4770 $5490 $6200
1130 mgd $3040 $3610 $4390 $5170 $5950 $6720
Table C-10Filtration Unit Cost
Capacity 2000 2010 2020 2030 2040 2050
113 mgd $3930 $4660 $5660 $6660 $7660 $8660
140 mgd $5040 $5980 $7270 $8550 $9830 $11110
211 mgd $6210 $7360 $8950 $10530 $12110 $13680
211 mgd $6220 $7380 $8970 $10550 $12140 $13720
308 mgd $7900 $9370 $11390 $13400 $15410 $17410
359 mgd $8440 $10010 $12170 $14320 $16470 $18610
400 mgd $9190 $10900 $13250 $15590 $17930 $20260
450 mgd $10400 $12330 $14990 $17640 $20290 $22930
540 mgd $11800 $13990 $17000 $20000 $23010 $26000563 mgd $12200 $14470 $17590 $20700 $23810 $26910
622 mgd $13500 $16010 $19460 $22900 $26340 $29770
7182019 Basis of Cost Estimates
httpslidepdfcomreaderfullbasis-of-cost-estimates 6267
Detroit Water and Sewerage DepartmentBasis of Cost Estimates
September 2003 61
Table C-11Ultraviolet Disinfection Unit Cost
Capacity 2000 2010 2020 2030 2040 2050
259 mgd $912 $1080 $1310 $1540 $1770 $2000
351 mgd $1280 $1520 $1850 $2180 $2510 $2840
400 mgd $1530 $1810 $2200 $2590 $2980 $3370
452 mgd $2040 $2420 $2940 $3460 $3980 $4500452 mgd $3310 $3930 $4780 $5620 $6460 $7300
452 mgd $1750 $2080 $2530 $2980 $3430 $3880
619 mgd $1750 $2080 $2530 $2980 $3430 $3880
619 mgd $2280 $2700 $3280 $3860 $4440 $5020
679 mgd $2550 $3020 $3670 $4320 $4970 $5620
860 mgd $3830 $4540 $5520 $6500 $7480 $8450
860 mgd $3060 $3630 $4410 $5190 $5970 $6750
956 mgd $3400 $4030 $4900 $5770 $6640 $7500
1036 mgd $3830 $4540 $5520 $6500 $7480 $8450
1126 mgd $4100 $4860 $5910 $6950 $7990 $9030
1750 mgd $8270 $9810 $11920 $14030 $16140 $18240
2000 mgd $8620 $10220 $12420 $14610 $16810 $19000
Table C-12Post Aeration Unit Cost
Capacity 2000 2010 2020 2030 2040 2050
113 mgd $114 $140 $170 $200 $230 $260
140 mgd $134 $160 $190 $220 $250 $280
211 mgd $142 $170 $210 $250 $290 $330
211 mgd $142 $170 $210 $250 $290 $330
211 mgd $167 $200 $240 $280 $320 $360
308 mgd $182 $220 $270 $320 $370 $420308 mgd $182 $220 $270 $320 $370 $420
359 mgd $260 $310 $380 $450 $520 $590
400 mgd $273 $320 $390 $460 $530 $600
450 mgd $237 $280 $340 $400 $460 $520
450 mgd $237 $280 $340 $400 $460 $520
540 mgd $363 $430 $520 $610 $700 $790
563 mgd $358 $420 $510 $600 $690 $780
622 mgd $388 $460 $560 $660 $760 $860
1000 mgd $455 $540 $660 $780 $900 $1020
1250 mgd $554 $660 $800 $940 $1080 $1220
7182019 Basis of Cost Estimates
httpslidepdfcomreaderfullbasis-of-cost-estimates 6367
Detroit Water and Sewerage DepartmentBasis of Cost Estimates
September 2003 62
Table C-13Blower System Unit Cost
Capacity 2000 2010 2020 2030 2040 2050
170 mgd $718 $850 $1030 $1210 $1390 $1570
210 mgd $786 $930 $1130 $1330 $1530 $1730
317 mgd $1120 $1330 $1620 $1910 $2200 $2490
317 mgd $1120 $1330 $1620 $1910 $2200 $2490317 mgd $1060 $1260 $1530 $1800 $2070 $2340
462 mgd $7440 $8820 $10720 $12610 $14510 $16400
462 mgd $7440 $8820 $10720 $12610 $14510 $16400
539 mgd $7440 $8820 $10720 $12610 $14510 $16400
600 mgd $6430 $7630 $9270 $10910 $12550 $14180
675 mgd $8920 $10580 $12860 $15130 $17400 $19660
675 mgd $8840 $10480 $12740 $14990 $17240 $19480
810 mgd $8950 $10610 $12900 $15180 $17460 $19730
845 mgd $8600 $10200 $12400 $14590 $16780 $18960
933 mgd $8950 $10610 $12900 $15180 $17460 $19730
1500 mgd $6370 $7550 $9180 $10800 $12420 $14040
1875 mgd $7670 $9100 $11060 $13010 $14970 $16920
Table C-14Gravity Thickening Unit Cost
Capacity 2000 2010 2020 2030 2040 2050
113 mgd $278 $330 $400 $470 $540 $610
140 mgd $319 $380 $460 $540 $620 $700
211 mgd $693 $820 $1000 $1180 $1360 $1540
211 mgd $555 $660 $800 $940 $1080 $1220
211 mgd $396 $470 $570 $670 $770 $870
308 mgd $708 $840 $1020 $1200 $1380 $1560308 mgd $723 $860 $1050 $1240 $1430 $1620
359 mgd $609 $720 $880 $1040 $1200 $1360
400 mgd $581 $690 $840 $990 $1140 $1290
450 mgd $927 $1100 $1340 $1580 $1820 $2060
450 mgd $944 $1120 $1360 $1600 $1840 $2080
540 mgd $830 $980 $1190 $1400 $1610 $1820
563 mgd $768 $910 $1110 $1310 $1510 $1710
622 mgd $830 $980 $1190 $1400 $1610 $1820
1000 mgd $723 $860 $1050 $1240 $1430 $1620
1250 mgd $845 $1000 $1220 $1440 $1660 $1880
7182019 Basis of Cost Estimates
httpslidepdfcomreaderfullbasis-of-cost-estimates 6467
Detroit Water and Sewerage DepartmentBasis of Cost Estimates
September 2003 63
Table C-15Centrifugation Unit Cost
Capacity 2000 2010 2020 2030 2040 2050
113 mgd $2050 $2430 $2950 $3470 $3990 $4510
14 mgd $2440 $2890 $3510 $4130 $4750 $5370
211 mgd $2930 $3470 $4220 $4970 $5720 $6460
211 mgd $2220 $2630 $3200 $3770 $4340 $4900211 mgd $4160 $4930 $5990 $7050 $8110 $9160
308 mgd $2990 $3550 $4310 $5070 $5830 $6590
308 mgd $3040 $3610 $4390 $5170 $5950 $6720
359 mgd $6200 $7350 $8930 $10510 $12090 $13660
40 mgd $6150 $7290 $8860 $10430 $12000 $13560
45 mgd $4420 $5240 $6370 $7500 $8630 $9750
45 mgd $4500 $5340 $6490 $7640 $8790 $9930
54 mgd $9210 $10920 $13270 $15610 $17960 $20300
563 mgd $10700 $12690 $15420 $18140 $20870 $23580
622 mgd $11900 $14110 $17150 $20180 $23210 $26230
100 mgd $15000 $17790 $21620 $25440 $29260 $33060
125 mgd $17900 $21230 $25800 $30360 $34920 $39460
Table C-16Hauling and Landfilling Unit Cost
Capacity 2000 2010 2020 2030 2040 2050
113 mgd $438 $520 $630 $740 $850 $960
140 mgd $546 $650 $790 $930 $1070 $1210
211 mgd $1060 $1260 $1530 $1800 $2070 $2340
211 mgd $788 $930 $1130 $1330 $1530 $1730
211 mgd $810 $960 $1170 $1380 $1590 $1800
308 mgd $1090 $1290 $1570 $1850 $2130 $2410308 mgd $1100 $1300 $1580 $1860 $2140 $2420
359 mgd $1400 $1660 $2020 $2380 $2740 $3100
400 mgd $1370 $1620 $1970 $2320 $2670 $3020
450 mgd $1530 $1810 $2200 $2590 $2980 $3370
450 mgd $1560 $1850 $2250 $2650 $3050 $3450
540 mgd $2150 $2550 $3100 $3650 $4200 $4750
563 mgd $2030 $2410 $2930 $3450 $3970 $4490
622 mgd $2220 $2630 $3200 $3770 $4340 $4900
1000 mgd $2360 $2800 $3400 $4000 $4600 $5200
1250 mgd $2950 $3500 $4250 $5000 $5750 $6500
7182019 Basis of Cost Estimates
httpslidepdfcomreaderfullbasis-of-cost-estimates 6567
Detroit Water and Sewerage DepartmentBasis of Cost Estimates
September 2003 64
Appendix D
Wastewater Treatment Plant Ongoing Repair andReplacement Cost Estimates
7182019 Basis of Cost Estimates
httpslidepdfcomreaderfullbasis-of-cost-estimates 6667
Detroit Water and Sewerage DepartmentBasis of Cost Estimates
September 2003 65
SUMMARY OF CAPITAL IMPROVEMENT PROJECT COSTS
Explanation of Capital Improvement Costs
NOTE This analysis was provided by the staff of the Detroit Wastewater Partners (DWSDProject PC-744 - Wastewater Treatment Plant Upgrade) and DWSD Wastewater Plant staff Itwas completed in July 2003
General
1 Capital costs are presented by major process and non-process areas The project costsassume a major capital improvement project for the specified life cycle based on recent capitalimprovements performed under PC-744 other recent capital improvement projects (ie PC-740 PC-720 etc) and best engineering judgment The line items listed in each area areintended to provide a basis for the cost estimate to give an understanding of the level of costestimate assumptions used and items includednot included in the cost estimate It is unlikelyand not intended that the major capital projects would include all of the items listed at thespecified cycle Rather it is more likely that the overall cost would be broken into smallerprojects spread across a ~10 year period at the specified cycle
2 The percentages listed below were applied to each of the base construction costs Theseare similar to the percentages used in the Wastewater Master Plan (see Master Plan TechnicalMemo Basis of Cost Estimates dated August 15 2003)
- 30 Contingency (for miscellaneous items not included in the general cost estimate)
- 25 Contractor Overhead and Profit and General Conditions
- 20 Engineering Legal Administration and Management
3 Capital costs presented assume continued use of the existing processes in place at the
WWTP It does not assume major changes to the treatment process such as a new form ofprimary treatment or biological treatment The costs also do not include potentially newprocesses that may be required for regulatory or other reasons such as filtration of thesecondary effluent sludge digestion or major change to the type of effluent disinfection
4 Capital costs presented for each process area do not include maintenance related costs forroutine maintenance between the major capital improvement cycles It is assumed thatmaintenance activities will be performed on the equipment at the required frequencies tomaintain the equipment in good worknig order between major rehabilitation or replacementprojects
Link to Complete Spreadsheets is found on the Wastewater Master Plan
CD DWP Est of Capital Improvements for WWTP - 50-yrxls
7182019 Basis of Cost Estimates
httpslidepdfcomreaderfullbasis-of-cost-estimates 6767
Detroit Water and Sewerage DepartmentBasis of Cost Estimates
Table D1
SUMMARY OF CAPITAL IMPROVEMENT PROJECT COSTS
Area Life Cycle Start of Cycle 2003 Costs ($M)PROCESS RELATED
Pump Station No 1 20 2025 $ 63Pump Station No 2 20 2006 $ 66
Chemical Addition 20 2023 $ 9Rectangular Primary Clarifiers 20 2013 $ 86Circular Primary Clarifiers 20 2025 $ 84ILP Nos 1 2 3 4 7 20 2025 $ 29
Aeration Basins 20 2025 $ 55Cryo Plants 10 2015 $ 1Secondary Clarifiers 20 2020 $ 140SFE Pump Station 20 2010 $ 13
Chlorination 20 2022 $ 16
Dechlorination 20 2023 $ 12Hydraulic Structures 20 2020 $ 7Complex A and B 20 2025 $ 32
C-I Dewatering 15 2020 $ 31C-II Lower Level Dewatering 15 2019 $ 35C-II Upper Level Dewatering 15 2015 $ 42
C-I and C-II Incineration 15 2009 $ 139Sludge Offloading 20 2025 $ 19NON-PROCESS RELATED
AdminRagland Buildings 20 2025 $ 10Plant Security 10 2015 $ 10Plant-wide Paving 15 2020 $ 6Parking Structure 20 2025 $ 7Work Environment Improvements 10 2015 $ 5
Rehab of OampM Bldgs Warehouses 20 2007 $ 40Plant-wide Instrumentation 15 2020 $ 100General Electrical 20 2045 $ 29Plant-wide Secondary Water 15 2025 $ 6
Plant-wide Steam System 15 2023 $ 6Plant-wide Potable Water 15 2010 $ 2Plant -wide Drainage 15 2010 $ 2
Fire Protection Improvements 20 2006 $ 4Plant-Wide JOCs As-Needed Eng 1 2005 $ 3
Total $ 1107
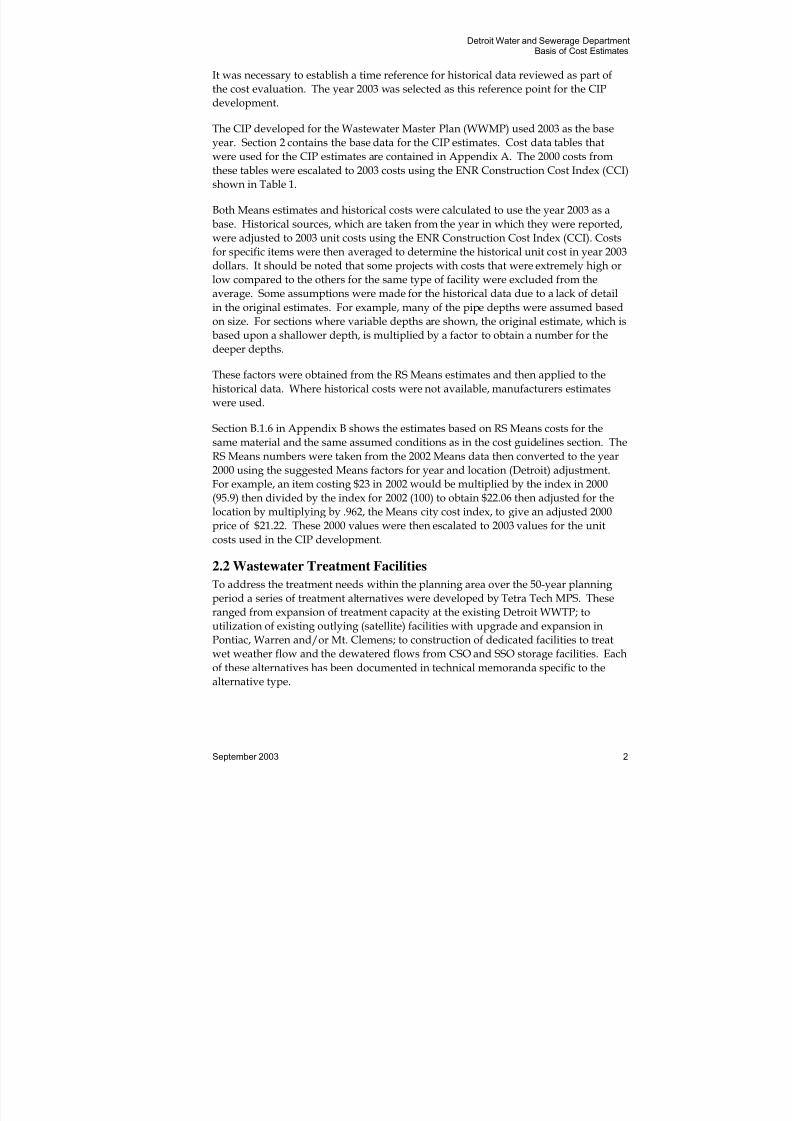
7182019 Basis of Cost Estimates
httpslidepdfcomreaderfullbasis-of-cost-estimates 467
Detroit Water and Sewerage DepartmentBasis of Cost Estimates
September 2003 2
It was necessary to establish a time reference for historical data reviewed as part ofthe cost evaluation The year 2003 was selected as this reference point for the CIPdevelopment
The CIP developed for the Wastewater Master Plan (WWMP) used 2003 as the baseyear Section 2 contains the base data for the CIP estimates Cost data tables thatwere used for the CIP estimates are contained in Appendix A The 2000 costs fromthese tables were escalated to 2003 costs using the ENR Construction Cost Index (CCI)shown in Table 1
Both Means estimates and historical costs were calculated to use the year 2003 as abase Historical sources which are taken from the year in which they were reportedwere adjusted to 2003 unit costs using the ENR Construction Cost Index (CCI) Costsfor specific items were then averaged to determine the historical unit cost in year 2003dollars It should be noted that some projects with costs that were extremely high orlow compared to the others for the same type of facility were excluded from theaverage Some assumptions were made for the historical data due to a lack of detail
in the original estimates For example many of the pipe depths were assumed basedon size For sections where variable depths are shown the original estimate which isbased upon a shallower depth is multiplied by a factor to obtain a number for thedeeper depths
These factors were obtained from the RS Means estimates and then applied to thehistorical data Where historical costs were not available manufacturers estimateswere used
Section B16 in Appendix B shows the estimates based on RS Means costs for thesame material and the same assumed conditions as in the cost guidelines section The
RS Means numbers were taken from the 2002 Means data then converted to the year2000 using the suggested Means factors for year and location (Detroit) adjustmentFor example an item costing $23 in 2002 would be multiplied by the index in 2000(959) then divided by the index for 2002 (100) to obtain $2206 then adjusted for thelocation by multiplying by 962 the Means city cost index to give an adjusted 2000price of $2122 These 2000 values were then escalated to 2003 values for the unitcosts used in the CIP development
22 Wastewater Treatment Facilities
To address the treatment needs within the planning area over the 50-year planningperiod a series of treatment alternatives were developed by Tetra Tech MPS Theseranged from expansion of treatment capacity at the existing Detroit WWTP toutilization of existing outlying (satellite) facilities with upgrade and expansion inPontiac Warren andor Mt Clemens to construction of dedicated facilities to treatwet weather flow and the dewatered flows from CSO and SSO storage facilities Eachof these alternatives has been documented in technical memoranda specific to thealternative type
7182019 Basis of Cost Estimates
httpslidepdfcomreaderfullbasis-of-cost-estimates 567
Detroit Water and Sewerage DepartmentBasis of Cost Estimates
September 2003 3
The three technical memoranda describing alternativesndash Expanded Facilities withinthe City of Detroit Technical Feasibility of Satellite Treatment and TechnicalFeasibility of a Wet Weather Flow Treatment Facility- contain detailed descriptions ofthe proposed facilities and include as appendices the complete cost estimates foreach facility
As part of the alternatives development conceptual (planning level) cost estimateswere developed for the facilities being proposed These estimates would be based onspecific facility locations preliminary facility layouts and defined treatment processcapacities Because this additional detail is available more detailed estimates couldbe prepared than could be expected for conveyance facilities
These estimates used standard construction cost estimating procedures and formatsDesigners broke down facilities by each component process and prepared costestimates at the process level for the specific size and configuration appropriate foreach facility
Appendix C contains the treatment facility unit cost tables derived from thealternatives Any unit costs for conveyance items used in these alternative estimatessuch as pipes were used with other data in calculating the CIP costs
3 LimitationsEvery construction project presents unique conditions with respect to location siteconstraints and soil or geotechnical considerations Also construction industrymarket conditions can greatly affect project costing By considering both historicalcosts as well as current cost estimating methods an attempt was made to account forthe range of potential costs However no estimates can be considered final until
complete construction plans and specifications have been prepared At the MasterPlanning stage these unit costs as well project costs derived from them need to beevaluated appropriately Thus these generalized costs are appropriate forcomparison of alternative approaches to providing service but additional detailshould be provided for site-specific construction estimates
4 Allowances and ContingenciesAt every stage of construction cost estimating certain unknown factors need to beaccounted for in the development of estimated costs This is even true at the timefinal plans and specifications are completed for a specific project It is especiallycritical at the planning stage The unit costs presented throughout this technical
memorandum are base construction costs for the most part This means that in mostcases no allowances or contingencies of any type have been applied Contingenciesneed to be added to cost estimates prior to inclusion in the CIP
The following cost categories need to be considered in the development of completecost estimates Contractor Overhead and Profit Contingency and Engineering LegalAdministrative and Management
7182019 Basis of Cost Estimates
httpslidepdfcomreaderfullbasis-of-cost-estimates 667
Detroit Water and Sewerage DepartmentBasis of Cost Estimates
September 2003 4
Contractor Overhead and Profit accounts for the markup that contractors employ tocover costs such as mobilization and the profit they would expect to garner from theproject
The Contingency markup has two main parts Planning Level Contingency andContractor Contingency The Planning Level Contingency accounts for theuncertainty of the cost estimate due to the basic level of design developmentappropriate at the planning level This contingency should decrease significantly aseach project proceeds from the Master Plan stage through the Project Plan stage thePreliminary Design Stage and the Final Design Stage For a Master Plan looking 50years into the future the contingency will be a considerable portion of the total costsThe contractor contingency allows for uncertainty in the final contract cost due tomarket conditions at the time the project is bid and for potential changes to theproject during the construction stage (change orders)
Engineering Legal Administrative and Management markups account for severalaspects of the projects These include providing funds for performing the engineering
design calculations preparing plans and specifications bidding the constructioncontract and awarding the work contractor oversight shop drawing review andapproval on site inspection services change order development development ofrecord drawings and contract close out They also account for the costs associatedwith legal review of construction contracts and when necessary the involvement offinancial professionals in preparation of bond statements and the sale of bonds
A review of contingencies used in other recent DWSD projects led to the use of thefollowing multipliers For new construction (replacement) or major rehabilitation themultipliers applied are
Contractor Overhead and Profit 25 of base construction costs
Contingency 30 of total construction cost includingcontractor overhead and profit
Engineering Legal 20 of total construction cost includingAdministrative and Management contractor overhead and profit
For all other categories (inspection cleaning rehabilitation etc) the multipliersapplied are
Contractor Overhead and Profit 25 of base construction costs
Contingency 15 of total construction cost includingcontractor overhead and profit
Engineering Legal 10 of total construction cost includingAdministrative and Management contractor overhead and profit
7182019 Basis of Cost Estimates
httpslidepdfcomreaderfullbasis-of-cost-estimates 767
Detroit Water and Sewerage DepartmentBasis of Cost Estimates
September 2003 5
Most unit costs presented in this technical memorandum are basic construction costswithout contingencies The above contingencies needed to be added to the base costsas project specific estimates are developed The estimates that are based on actualcosts from past projects already include these contingencies
5 Cost IndexHistorical costs have been adjusted using data from the Engineering News Record(ENR) Construction Cost Index History which provides annual cost indices from1913 to present Table 1 shows the annual cost indices from 1969 to 2002Extrapolation of this data gives the annual indices for the year 2003
The cost estimates developed for the CIP used a 2003 cost The 2003 costs wereobtained by escalating any base data used from their base year to 2003 using the CCIUsing the example for a 1990 estimated cost for 12 sanitary line of $212 per linearfoot convert it to 2003 cost by dividing the unit price by the yearrsquos index (2124732)Then multiply by the year 2003 index (6698) to get the escalated 2003 unit cost of $300
7182019 Basis of Cost Estimates
httpslidepdfcomreaderfullbasis-of-cost-estimates 867
Detroit Water and Sewerage DepartmentBasis of Cost Estimates
September 2003 6
Table 1ENR Construction Cost Index (CCI)
Year Index Year Index
1969 1269 1986 4295
1970 1381 1987 4406
1971 1581 1988 4519
1972 1753 1989 4615
1973 1895 1990 4732
1974 2020 1991 4835
1975 2212 1992 4985
1976 2401 1993 5210
1977 2576 1994 5408
1978 2776 1995 5471
1979 3003 1996 5620
1980 3237 1997 5825
1981 3535 1998 5920
1982 3825 1999 6060
1983 4066 2000 6221
1984 4146 2001 6342
1985 4195 2002 6538
2003 6698
Index for 2002 was averaged in 1202 using 11 months of data This number was forecasted
7182019 Basis of Cost Estimates
httpslidepdfcomreaderfullbasis-of-cost-estimates 967
Detroit Water and Sewerage DepartmentBasis of Cost Estimates
September 2003 7
Cost Guideline SummariesThe following pages contain cost guidelines for those items included in the CIP andrate model including pipe installation special structures and manholes pumpstations pipe rehabilitation miscellaneous repair and pipeline inspection andcleaning The categories and layout correspond to the CIP cost estimating
spreadsheets
For each category the material and assumed construction conditions are identifiedThese include type and depth of excavation utility and pavement restorationanticipated and number of manholes or other structures included in the estimateAdditionally a useful life expectancy for the specific type of facility is provided foruse in CIP development
6 Program 1 Sewer Infrastructure ProgramThis section of the CIP development includes the inspection cleaning rehabilitation
and replacement of DWSD sewers
61 Subprogram No 1A Lateral and Connector Sewers ndashCleaning Sediment Disposal amp Condition AssessmentLateral and Connector sewers were defined previously in consultation with DWSDA lateral sewer collects flows from homes and businesses for discharge into trunksewers These sewers range in size from 6rdquo to 24rdquo in diameter with an average size of18rdquo A connector sewer is a pipe that carries the wastewater flow from a lateral sewerto a trunk sewer Connector sewers range from 24rdquo in diameter to a 4rsquo by 6rsquo eggshape with an average size of 30rdquo in diameter An assessment of DWSD sewers fromthe technical memorandum Lateral Sewers and Connection Sewers indicates that
there are 2258 miles of laterals and 559 miles of connector sewers in the DWSD sewersystem
611 Inspection
The CIP costs for inspection of lateral and connector sewers were developed with theassumption that this inspection would be accomplished through sewer televisingSewer televising consists of remote televising of sewers using robotically controlledcameras The estimate includes mobilization set up for camera entry and furnishingof all incidentals
The actual CIP cost estimation was derived from the technical memorandum entitled
Physical Inspection of Lateral and Connector Sewers revised May 2003 whichdescribes a recent pilot project performed by Inland Waters Pollution Control Inc forDWSD Inspections occurred in June July and October of 2002 This projectinspected several DWSD sewers in the lateral and connector categories using TVinspection methods The selected sewers for these inspections included varying pipediameters as well as material types The average inspection costs from the pilotproject are used for the CIP Table A-1 in Appendix A shows an alternate costestimation for sewer inspections based on historical data These unit costs in Table A
7182019 Basis of Cost Estimates
httpslidepdfcomreaderfullbasis-of-cost-estimates 1067
Detroit Water and Sewerage DepartmentBasis of Cost Estimates
September 2003 8
do not include contingencies Note that the pilot project costs are within the rangesset in Table A
2003 Lateral and Connector Sewer Inspection Costs = $211 per linear foot ($11141 per mile)
612 Cleaning
Sewer Cleaning consists of preparatory cleaning (also called light cleaning) or heavycleaning utilizing a hydraulic sewer jetvacuum unit The estimate includesmobilization set up for jetvacuum truck and furnishing of all incidentals
The CIP costs for the cleaning of lateral and connector sewers were taken from thetechnical memorandum entitled Physical Inspection of Lateral and Connector Sewersrevised May 2003 which describes a recent pilot project performed by Inland WatersPollution Control Inc for DWSD Table A-2 in Appendix A shows an alternate costestimation for sewer cleaning based on historical data
The unit costs do not include contingencies
2003 Lateral and Connector Sewer Light Cleaning Costs = $325 per linear foot ($17160 permile)
2003 Lateral and Connector Sewer Heavy Cleaning Costs = $900 per linear foot ($47520 permile)
613 Sediment Testing
A concern regarding the pipes in the DWSD system is that the buildup of sludgecontains toxic materials such as PCBs or mercury This sludge should be removedand disposed of in a different manner than the current sewer jet vacuum unit
practices (washing sludgedown the sewers to the WWTP) Sludge removal shouldtherefore include a sampling station to test the sludge components If sludge testsindicate hazardous materials the sludge will need to be disposed of in an apporpiatelandfill The cost per truckload comes from CDM and assumes two tests one forPCBrsquos and one for mercury would be performed on each load
2003 Lateral and Connector Sewer Sediment Testing Costs = $200 per truck load (10 truckloads per mile)
62 Subprogram No 1B Interceptor and Trunk Sewer Cleaning
Disposal and Condition AssessmentInterceptor and trunk sewers are defined previously in the Interceptor and TrunkSewers technical memorandum A trunk sewer collects flows from lateral andconnector sewers for discharge into interceptor sewers These sewers are generallylarger than laterals ranging in size from 18rdquo to 10rsquo in diameter An interceptor seweris a large sewer that carries the wastewater flow from a number of trunk sewers to thewastewater treatment plant These sewers do not connect to any homes buildings or
7182019 Basis of Cost Estimates
httpslidepdfcomreaderfullbasis-of-cost-estimates 1167
Detroit Water and Sewerage DepartmentBasis of Cost Estimates
September 2003 9
catch basins Interceptor sewers are generally larger than trunk sewers (10rsquo or larger)An assessment of DWSD sewers indicated that there are 483 miles of trunk sewersand 83 miles of interceptors (39 miles serving Macomb County only) in the DWSDsewer system
621 Inspection
The CIP costs for inspection of interceptor and trunk sewers were developed with theassumption that inspection would be accomplished through sewer televising Othermethods such as diving may be more effective because of the larger sizes of pipesSewer televising consists of remote televising of sewers using robotically controlledcameras The estimate includes mobilization set up for camera entry and furnishingof all incidentals The estimate is unit cost per mile of pipe The CIP costs for theinspection of interceptor and trunk sewers were taken from Table A-1 which is basedon historical data This unit cost does not include contingencies
2003 Interceptor and Trunk Sewer Inspection Costs = $431 per linear foot ($22747 per mile)
63 Subprogram No 1C Lateral amp Connector SewerImprovements
Costs for improvements to the lateral and connector sewers in the DWSD system werederived These improvements can include the rehabilitation of the existing sewers orthe construction of new sewers to replace existing sewers to enhance the sewer systemwhere there are deficiencies This memorandum only considers the rehabilitation oflateral and connector sewers
631 Rehabilitation - Lateral and Connector Relining
There are a few different methods of rehabilitating sewers that were considered for
lateral and connector sewers These include chemical grouting of joints slipliningand cured-in-place-pipe (CIPP) CIPP was the preferred method used for the CIPestimates
CIPP Lining
CIPP lining is considered to be major rehabilitation CIPP installation includes theinstallation of Cured-In-Place Pipe mobilization sewer preparation and furnishing ofall incidentals
The service life of CIPP Lining is 50 years The CIP cost estimation for lateral andconnector sewer rehabilitation was derived from the recent pilot project performed by
Inland Waters for DWSD This information is found in the technical memorandumentitled Physical Inspection of Lateral and Connector Sewers For this project CIPPwas installed for several lengths of laterals and connectors within the DWSD systemThese unit costs do not include contingencies
2003 Lateral Sewer CIPP Rehabilitation Costs = $12235 per linear foot ($646000 per mile)
2003 Connector Sewer CIPP Rehabilitation Costs = $22030 per linear foot ($1163184 permile)
7182019 Basis of Cost Estimates
httpslidepdfcomreaderfullbasis-of-cost-estimates 1267
Detroit Water and Sewerage DepartmentBasis of Cost Estimates
September 2003 10
Table A-3 in Appendix A shows an alternate cost estimation for CIPP Lining based onhistorical data
64 Subprogram No 1D Interceptor and Trunk SewerImprovementsCosts for improvements to the interceptor and trunk sewers in the DWSD systemwere derived These improvements include the rehabilitation of the existing sewersand the construction of new sewers to replace existing sewers or to enhance thesewer system where there are deficiencies
641 Rehabilitation ndash Structural Repairs
The rehabilitation of the larger interceptor and trunk sewers requires methodsdifferent than for lateral and connector sewers In addition to a CIPP relining specificstructural repairs can be accomplished because the sewers are large enough to be
entered As a result of recent inspections of some of the interceptors and trunk sewersin the DWSD system some structural repairs were identified These can be found inthe CS-1158 report called Long Term CSO Plan for the Detroit and Rouge Rivers 1996These inspections covered approximately 886400 linear feet or about 30 of thesystem with structural repair costs (mostly CIPP lining) estimated at $18000000
Table A-3 shows the CIPP lining cost estimation based on historical data This tablehowever only goes up to 48rdquo pipe while the pipes used in this structural repaircalculation range from 24rdquo to 177rdquo The unit cost below is an extrapolation of Table A-3 and does not include contingencies
2003 Interceptor and Trunk Sewer Structural Repair Costs = $1000 per linear foot
642 Cleaning
Sewer Cleaning of the interceptor and trunk sewers consists of heavy cleaningutilizing a hydraulic sewer jetvacuum unit The estimate includes mobilization setup for jetvacuum truck and furnishing of all incidentals The CIP costs for thecleaning of interceptor and trunk sewers were taken from Table A-2 which is basedon historical data This unit cost does not include contingencies
2003 Interceptor and Trunk Sewer Heavy Cleaning Costs = $1641 per linear foot
643 Sludge RemovalAn analysis of inspection reports on interceptor and trunk sewers by TYJT calculatedthat sludge removal and disposal for 30 of the system would cost approximately$1867043 These can be found in the CS-1158 report called Long Term CSO Plan forthe Detroit and Rouge Rivers 1996 This sludge removal is considered to be heavycleaning and uses the costs from the historical data in Table A-2
2003 Interceptor and Trunk Sewer Sludge Removal Costs = $1641 per linear foot
7182019 Basis of Cost Estimates
httpslidepdfcomreaderfullbasis-of-cost-estimates 1367
Detroit Water and Sewerage DepartmentBasis of Cost Estimates
September 2003 11
644 Sediment Testing
A concern regarding the pipes in the DWSD system is that the buildup of sludgecontains toxic materials such as PCBs or mercury This sludge should be removedand disposed of in a different manner than the current sewer jet vacuum unitpractices (washing sludge down the sewers to the WWTP) Sludge removal should
therefore include a sampling station to test the sludge components and disposal ofhazardous material in a landfill Sludge amounts were obtained from inspectionreports found in the CS-1158 report called Long Term CSO Plan for the Detroit andRouge Rivers 1996 The cost per truckload comes from CDM and assumes two testsone each for PCBs and mercury would be performed on each load
2003 Interceptor and Trunk Sewer Sediment Testing Costs $200 per truck load (10 cu yds)
645 New Relief Sewers
DWSD previously identified areas of the system where relief sewers were neededThese areas were defined in Status Report on Storm Relief Sewer Program by DWSD
issued July 1975 reissued July 1978 The Wastewater Master Plan (WWMP) team hasreviewed these relief sewers (Local Alternatives for SSO Control technicalmemorandum) and concluded that the following may be needed pending furthersystem inspections and cleaning
7 Mile Road Reliefo 7920 ft of 120rdquo at depth of 30rsquoo 13200 ft of 120rdquo at depth of 25rsquo
Fenkell Reliefo 7920 ft of 156rdquo at depth of 25rsquoo 13200 ft of 192rdquo at depth of 10rsquo
Schoolcraft Reliefo 10560 ft of 192rdquo at depth of 15rsquo
Hubbell Reliefo 10660 ft of 144rdquo at depth of 10rsquoo 7920 ft of 144rdquo at depth of 20rsquo
Joy Clark Reliefo 6833 ft of 192rdquo at depth of 25rsquoo 27216 ft of 192rdquo at depth of 15rsquoo 169 ft of 120rdquo at depth of 10rsquo
The cost of construction of relief sewers was estimated in 1978 and again in 1996 forthe CS-1158 Long Term CSO Control Plan for the Detroit and Rouge Rivers Volume3 1004 C1 Alternative Evaluations (Table C4 in Alternative 6) Table A-4 shows the1996 estimates as well as the 2003 costs derived by escalation using the CCI Thecosts from this table used for the new relief sewer cost are shown here
120rdquo at depth of 10rsquo Costs = $1289 per linear foot
120rdquo at depth of 25rsquo Costs = $1557 per linear foot
7182019 Basis of Cost Estimates
httpslidepdfcomreaderfullbasis-of-cost-estimates 1467
Detroit Water and Sewerage DepartmentBasis of Cost Estimates
September 2003 12
120rdquo at depth of 30rsquo Costs = $1712 per linear foot
144rdquo at depth of 10rsquo Costs = $1389 per linear foot
144rdquo at depth of 20rsquo Costs = $1579 per linear foot
156rdquo at depth of 25rsquo Costs = $1938 per linear foot
192rdquo at depth of 10rsquo to 15rsquo Costs = $2399 per linear foot
192rdquo at depth of 25rsquo Costs = $2771 per linear foot
646 Future Modeling
The CIP cost estimation has included future modeling of the DWSD sewer systemThis modeling of data from the Segmented Facilities plan is scheduled to take placefrom 2008 to 2010 The estimate from CDM includes contingencies
2003 Future Modeling Costs = $100000
647 Oakwood Interceptor
A cost estimate was prepared for the installation of a new redundant sewer systemparallel to the Oakwood Interceptor section of the NW Interceptor This estimate wasperformed by Tetra Tech MPS and can be found in the CS-1314 technicalmemorandum entitled Conceptual Plan for Oakwood Northwest Interceptor revisedMay 2003 The estimate does not include contingencies
2003 Oakwood Redundant Interceptor Costs = $8700000
648 Macomb Meter Stop Gates
A project is proposed to install stop gates at meters CV-3 and MB-25 in MacombCounty The estimate from SDA and found in the technical memorandum entitledCapital Improvement Programs for Macomb County does not include contingencies
2003 Stop Gate Installation Costs = $1700000 each
649 North Gratiot Interceptor
This project will install the new North Gratiot Interceptor Sewer (NGIS) in MacombCounty The estimate from SDA and found in the technical memorandum entitled
Capital Improvement Program for Macomb County includes contingencies
2003 NGIS Installation Costs = $40000000
6410 Northwest Interceptor Improvements
This project includes improvements to the Northwest Interceptor Sewer (NWIS) from8 Mile Road to the WWTP This estimate was performed by Tetra Tech MPS and can
7182019 Basis of Cost Estimates
httpslidepdfcomreaderfullbasis-of-cost-estimates 1567
Detroit Water and Sewerage DepartmentBasis of Cost Estimates
September 2003 13
be found in the technical memorandum entitled Conceptual Plan for OakwoodNorthwest Interceptor The estimate does not include contingencies
2003 10rsquo Diameter Lining Costs = $1000 per linear foot
2003 10rsquo Diameter Replacement Sewer Costs = $2500 per linear foot
65 Subprogram No 1E Manholes and Catch BasinImprovements
Inspection and repair of sewer structures in the DWSD system are required to ensurethe system operates efficiently Therefore the CIP estimated costs for the inspectionand repair of manholes and catch basins
651 Manhole Inspections
Manhole inspection consists of either topside inspection or full inspection Table A-5
in Appendix A shows the estimate in unit cost per manhole inspection based onhistorical data The CIP estimate for manhole inspections assumes 5 of themanholes in the system will undergo topside inspection every year This unit costdoes not include contingencies
2003 Manhole Inspection Costs = $52 per structure
652 Manhole Repairs
Manhole repairs can consist of
Manhole wrapping
External chemical grout Manhole shelf repair Manhole channel repair Pipe connection repair Raising replacing manhole frames
Each repair is separate The CIP estimate assumes that the quantity of manholesneeding the above categories of repairs varies with the amounts per inspection cycleas follows
5 need manhole wrapping 8 need external chemical grout 10 need manhole shelf repair 10 need manhole channel repair 10 need pipe connection repair 15 need raising replacing manhole frames
2003 Manhole Wrapping Costs = $215 per structure
2003 External Chemical Grouting Costs = $1938 per structure
7182019 Basis of Cost Estimates
httpslidepdfcomreaderfullbasis-of-cost-estimates 1667
Detroit Water and Sewerage DepartmentBasis of Cost Estimates
September 2003 14
2003 Manhole Shelf Repair Costs = $646 per structure
2003 Manhole Channel Repair Costs = $646 per structure
2003 Pipe Connection Repair Costs = $538 per structure
2003 Manhole Frame Replacement Repair Costs = $646 per structure
653 Manhole Replacement
Manhole installation (replacement) includes
Pre-cast reinforced concrete manholes risers and cones cast-in-place basesframes castings steps
Excavation and backfill of common earth Sheeting shoring bracing and dewatering Up to 6rdquo of bituminous pavement removal and replacement
And furnishing of all incidentals
Table A-6 in Appendix A shows the estimate in unit cost per vertical linear foot ofinstallation based on historical information This estimate for manhole replacementassumes that manholes are 4 in diameter and 15 deep and that 2 would need to bereplaced for each inspection cycle (20 years) This unit cost does not includecontingencies
2003 Manhole Replacement Costs = $6053 per manhole
654 Catch Basin Cleaning
The CIP cost estimations assume that all 200000 catch basins will be cleaned everycycle Table A-7 in Appendix A shows the cost per catch basin Catch basin cleaningincludes labor trucks and disposal This unit cost does not include contingencies
2003 Catch Basin Cleaning Costs = $59 per catch basin
655 Catch Basin Repair
The CIP cost estimation for catch basin repair assumes that the repairs will be pipeconnection repair and frame replacement as shown in Section 652 for manholesThese unit costs do not include contingencies
2003 Catch Basin Pipe Connection Repair Costs = $538 per catch basin
2003 Catch Basin Frame Replacement Costs = $646 per catch basin
66 Subprogram No 1F Regulators Outfalls Backwater GatesDiversion Dams and In-System Storage661 Outfall Flow Regulators Inspection
Outfall regulator inspection includes inspection and report writing
7182019 Basis of Cost Estimates
httpslidepdfcomreaderfullbasis-of-cost-estimates 1767
Detroit Water and Sewerage DepartmentBasis of Cost Estimates
September 2003 15
The cost estimate assumes that a five-person crew can dive and inspect two outfallregulators each day The cost per day for a five-person crew is $6000day as shownin an invoice for the installation of backwater gate sensors for the Baby Creek outfallIt should be noted that some outfall regulators might cost more to inspect than othersdepending on regulator accessibility and condition This unit cost does not includecontingencies
2003 Outfall Regulator Inspection Costs = $3000 per average outfall regulator
662 Outfall Flow Regulators Rehabilitation
Outfall regulator rehabilitation includes cleaning and inspection of the regulatorfloat and sump chamber removal of existing regulator gates and associatedcomponents removal of flap gates and sluice gates rehabilitation of regulator floatreplacement of access manhole frames and covers installation of new slide gates andflexible flap gates and temporary diversion of sewage flow
Regulator rehabilitation was performed under Contract PC-695 Regulator RemoteFlow Control Structures and Dam Rehabilitation This project rehabilitated 40 gatesfor a total cost of $7708000 The average cost of $192700 per gate is rounded to$200000 per gate This contract ended in 2000 so the cost is escalated to $218000using a CCI escalation factor of 1077 It should be noted that some outfall regulatorsmight cost more to rehabilitate than others depending on regulator accessibility andcondition This cost estimate includes any contingencies
2003 Outfall Regulator Rehabilitation Costs = $218000 per average outfall regulator
663 Outfall Flow Regulators Replacement
Outfall regulator replacement includes the mechanical work described in the outfallregulator rehabilitation work described above and additionally replacement of theconcrete regulator chamber
As noted above the cost for the mechanical equipment replacement is $218000 peroutfall regulator It is assumed that the regulator junction chamber replacement costswould be similar to the influent junction chamber construction costs for the St AubinScreening and Disinfection Facility Contract PC-731 The contractor has provided adetailed cost estimate which indicates that the construction cost for this junctionchamber would be $105000 An additional $10000 is added for destruction andremoval of the existing regulator chamber In summary the regulator replacementcosts are
Installation of mechanical components = $218000
Construction of new regulator chamber = $105000
Destructionremoval of existing regulator chamber = $10000
Total = $333000
7182019 Basis of Cost Estimates
httpslidepdfcomreaderfullbasis-of-cost-estimates 1867
Detroit Water and Sewerage DepartmentBasis of Cost Estimates
September 2003 16
Although the mechanical components portion includes some contingencies the unitcost here does not include contingencies
2003 Outfall Regulator Replacement Costs = $333000 per average outfall regulator
664 Outfall Backwater Gate and Diversion Dam Inspection
Outfall inspection includes inspection and report writing Backwater gates anddiversion dams are inspected at the same time as outfalls and do not require anyadditional costs The cost estimate assumes that a five-person crew can dive andinspect two outfalls each day
The cost per day for a five-person crew is $6000day as shown in an invoice for theinstallation of backwater gate sensors for the Baby Creek outfall It should be notedthat some outfalls might cost more to inspect than others depending on outfall sizedepth number of conduits and condition This unit cost does not includecontingencies
2003 Outfall Inspection Costs = $3000 per average outfall
665 Outfall Rehabilitation
Outfall rehabilitation includes repair work at each outfall as needed
The cost estimate is based on outfall rehabilitation costs budgeted for the DWSDcontract DWS 849850 Inspection and In-place Rehabilitation of Outfalls The costfor this project is $15540000 for rehabilitation of twelve outfalls This results in anaverage cost of $1295000 per outfall The cost shown is an average amount for alloutfalls Outfall rehabilitation costs can vary widely because the work involvedcould range from nothing to significant structural repairs This unit cost does include
contingencies
2003 Outfall Rehabilitation Costs = $1295000 per average outfall
666 Outfall Replacement
Outfall replacement includes removal of the existing outfall and installation of a newoutfall from the junction chamber to the river
Outfall replacement costs are estimated based on the equivalent installation of a sewerline for the average size length and depth outfall The average outfall calculationsassume that outfalls with multiple barrels can be represented by a longer length of
single barrel outfall For example a double barrel outfall with a length of 15 ft can beconsidered a single barrel outfall with length 30 ft Similarly outfalls with box eggor arch shapes are converted to cylinders with equivalent diameters For example a10 ft x 10 ft box sewer is considered equivalent to an 113 ft diameter cylinder Theseconsiderations are used to calculate the average length and diameter for all outfallsThe average outfall is 85 ft in diameter and 1280 ft in length Outfall depth is notreadily available and is assumed to be 10 ft
7182019 Basis of Cost Estimates
httpslidepdfcomreaderfullbasis-of-cost-estimates 1967
Detroit Water and Sewerage DepartmentBasis of Cost Estimates
September 2003 17
The replacement cost for the average size and length outfall can then be calculatedbased on the cost of installation of a new sewer with these dimensions The costs forsewer installation as a function of size and depth are displayed in Table A-4 Thistable indicates that the replacement cost for an 85 ft diameter 1280 ft long and 10 ftdeep outfall would be about $12600000 It should be noted that outfall replacementcosts would vary significantly because of differences in size number of conduits anddepth below the surface This unit cost does not include contingencies
2003 Outfall Replacement Costs = $12619680 per average outfall
667 Backwater Gate Rehabilitation
Backwater gate rehabilitation includes cleaning leak repair repairreplacement ofrotted or deteriorated timber and repairreplacement of hardware
The estimated total cost for repair of twelve backwater gates under Contract CS-1158Long Term CSO Control Plan for the Detroit and Rouge Rivers (1996) is $182000This results in an average cost of $15200 per gate This cost is then multiplied by aCCI escalation factor resulting in an average 2003 cost of $18100 per gate This cost isthen rounded to $20000 for the estimate Actual backwater gate rehabilitation costswill vary considerably depending on the condition and accessibility of the gate Thisunit cost does include contingencies
2003 Backwater Gate Rehabilitation Costs = $20000 per average backwater gate
668 Backwater Gate Replacement
Backwater gate replacement includes replacement of the backwater gates andassociated stop logs
The cost for installation of two backwater gates and associated stop logs at the StAubin Screening and Disinfection Facility is $336000 according to the detailed costbreakdown for Contract PC-731 St Aubin Screening and Disinfection Facility It isassumed that removal of the existing gates and other site work would costapproximately $14000 This results in a total cost of $350000 for the installation oftwo gates at one location There are 154 gates at 54 locations or an average of 281gates per location It is assumed that the cost of gate replacement is proportional tothe total number of gates Hence the cost for replacing all of the gates would be
$350000 2 gates 154 gates all locations = $26460000
$26460000 54 locations = $490000 per location
This cost was then multiplied by a CCI escalation factor to obtain a 2003 average costof $517000 per location It should be noted that the cost at each location would varybased on the number and size of backwater gates and stop logs This unit cost doesnot include contingencies
2003 Backwater Gate Replacement Costs = $517000 per average backwater gate
7182019 Basis of Cost Estimates
httpslidepdfcomreaderfullbasis-of-cost-estimates 2067
Detroit Water and Sewerage DepartmentBasis of Cost Estimates
September 2003 18
669 Diversion Dam Rehabilitation
Diversion dam rehabilitation includes cleaning and repair of deteriorated damsurfaces restoration of connection between dam surface and bottom of flashboardsand repairreplacement of associated stop logs
The needed repairs are identified in the CS-1314 Review of Collection SystemRegulators and Outfalls technical memorandum revised May 2003 The cost fordiversion dam rehabilitation is based on simple cost estimates for a three man crewworking two days The average cost for diversion dam rehabilitation based on threelocations is $1000 per dam It should be noted that diversion dam rehabilitation costswill vary based on the size type and condition of the diversion dam This unit costdoes not include contingencies
2003 Diversion Dam Rehabilitation Costs = $1000 per average diversion dam
6610 Diversion Dam Replacement
Diversion dam replacement includes the installation of a new inflatable dam at theexisting location This cost also includes the cost of removing the existing diversiondam
The cost for diversion dam replacement is based on the detailed cost breakdown forContract PC-731 St Aubin Screening and Disinfection Facility The installation costfor an inflatable diversion dam according to this contract is $70000 This cost ismultiplied by a CCI escalation factor to get a 2003 installation cost of $74000 It isassumed that there is an additional cost of $10000 for destruction and removal of theexisting diversion dam and other site work The total cost for diversion damreplacement is $84000 per dam The cost of each diversion dam will vary based on
dam size and accessibility This unit cost does not include contingencies
2003 Diversion Dam Replacement Costs = $84000 per average diversion dam
6611 In-System Storage Devices amp System Gate Inspection
In-system storage device (ISSD) inspection includes inspection and report writingThe cost estimate assumes that a three-person crew can inspect one ISSD each dayThe cost for one three-person crew should be about $3000 This unit cost does notinclude contingencies
2003 ISSD Inspection Costs = $3000 per ISSD
6612 In-System Storage Devices amp System Gate Rehabilitation
ISSD rehabilitation includes removal of existing regulator gates and associatedcomponents removal of existing operating systems for the regulator gatesinstallation of new slide gates with self-enclosed hydraulic operating systemsinstallation of instrumentation and control systems for remote operation of the slidegates from the SCC
7182019 Basis of Cost Estimates
httpslidepdfcomreaderfullbasis-of-cost-estimates 2167
Detroit Water and Sewerage DepartmentBasis of Cost Estimates
September 2003 19
This type of work was performed under Contract PC-695 Regulator Remote FlowControl Structures and Dam Rehabilitation This project rehabilitated 40 gates for atotal cost of $7708000 The average cost of $192700 per gate was rounded to$200000 per gate This contract ended in 2000 so the cost was then escalated to$218000 using a construction cost escalation factor It should be noted that someISSDs cost more to rehabilitate than others depending on ISSD type accessibility andcondition This unit cost does include contingencies
2003 ISSD Rehabilitation Costs = $218000 per ISSD
6613 In-System Storage Devices amp System Gate Replacement
ISSD replacement includes removal of all existing ISSD mechanical electrical andinstrumentation components and replacement with new components
ISSD replacement costs are based on Contract PC-747 In-System Storage Under thiscontract thirteen new ISSDs were installed for a total cost of $26400000 This wouldresult in an average cost of $2030000 per ISSD It is assumed that this installationcost is comparable to the average ISSD replacement cost It should be noted that ISSDreplacement costs would vary depending on the size type and accessibility of thedevice This unit cost does include contingencies
2003 ISSD Replacement Costs = $2030000 per ISSD
67 Subprogram No 1G Pump Stations671 Inspections
Pump station inspection includes inspection of the structural condition of the stationand wet well (if equipped) pump testing and inspection of the instrumentation and
control devices
The pump station inspection costs are estimated to run about $1000 per pump fortesting based on a cost breakdown from Contract PC-744 Wastewater TreatmentPlant Rehabilitation and Program Management It was assumed that it would take anengineer about 25 weeks to inspect the pump station and write a report At $100 perhour this would cost $10000 per pump station This unit cost does not includecontingencies In summary pump station inspection costs include
Pump testing = $1000 per pump
Pump station inspection and report writing = $10000 per pump station
2003 Pump Station Inspection Costs = $10000 per pump station + $1000 per pump
672 Rehabilitation
Pump station rehabilitation includes pump and motor testing station cleaningpainting and repair repairreplacement of damaged pump motor control panelparts and minor pump station structural repairs
7182019 Basis of Cost Estimates
httpslidepdfcomreaderfullbasis-of-cost-estimates 2267
Detroit Water and Sewerage DepartmentBasis of Cost Estimates
September 2003 20
The pump station rehabilitation costs can be estimated based on the total pumpstation rehabilitation costs estimated for Contract PC-744 Wastewater TreatmentPlant Rehabilitation and Program Management In the PC-744 report the total costfor immediate short-term and long term rehabilitation routine and long lead timespare parts CMMS system and motor repairreplacement was $7737500 It isassumed that this cost is representative of pump rehabilitation needs for each five-year interval This cost does not include contingencies
2003 Pump Station Rehabilitation Costs = $7737500 for rehabilitation of all pump stations
673 Major Rehabilitation
Major rehabilitation of pump stations includes the capital cost of renovating awastewater pump station including all pumps and related equipment
The cost for pump station major rehabilitation was estimated by CDM and for theTetra Tech MPS alternatives development (technical memoranda Expanded Facilitieswithin the City of Detroit Technical Feasibility of Satellite Treatment and TechnicalFeasibility of a Wet Weather Flow Treatment Facility) and is found in Table A-9aPump station major rehabilitation will vary considerably depending on pump stationand wet well condition number and capacity of pumps and instrumentation andcontrol requirements Table A-9b shows the breakdown of these costs into low orhigh flow categories The average flow of DWSD pump stations is more than 500MGD so the high flow cost is used for the CIP This unit cost does not includecontingencies
2003 Pump Station Major Rehabilitation Costs (500 + MGD)= $20000000 for the average pump station
674 Energy ManagementThe CIP estimates reflect the need for better energy management in terms of pumps atthe pump stations This is expected to be accomplished through the installation ofvariable-frequency drives (VFD) on these pumps The CIP includes VFD installationat the Clintondale and Woodmere Pump Stations The estimate based on thetechnical memorandum entitled Energy Management was made by TYJT and did notinclude contingencies The following estimate has had contingencies added
2003 Energy Management Costs (VFD installation at Clintondale and Woodmere) =$682500
68 Subprogram No 1H Meters681 Inspection and Maintenance
Flow meter maintenance includes maintenance repair and some replacement (mostlymechanical but some structural) of current meters billing and database managementand dye testingflow accuracy The costs shown are based on the maintenancebudget for CS-1249 Greater Detroit Regional Sewer System Model ndash Billing Meter
7182019 Basis of Cost Estimates
httpslidepdfcomreaderfullbasis-of-cost-estimates 2367
Detroit Water and Sewerage DepartmentBasis of Cost Estimates
September 2003 21
Program This project maintains 50 meters with an annual budget of $2000000 Thisunit cost does include contingencies
2003 Meter Maintenance Costs = $40000average meter
682 Replacement
Flow meter replacement includes meter equipment and installation costs as well asmeter vault replacement The CIP cost is based on a CDM estimate from the CS-1249Greater Detroit Regional Sewer System Model ndash Billing Meter Program and isrepresentative of the average meter Meter replacement costs may vary considerablydepending on the type and location of the meter This unit cost does not includecontingencies
2003 Meter Replacement Costs = $500000average meter
683 Macomb Odor Control
Some additional specific projects were included in the CIP estimation These involveodor control measures at 12 Macomb County meter chambers through the installationof carbon adsorption units The estimates are based on the CS-1292 Task Order Nos33 and 34 Final Draft Report that did not include contingencies The followingestimate has had contingencies added
2003 Macomb County Odor Control Costs = $772500
7 Program 2 CSO and SSO Control Program
71 Ongoing CIP Projects
The WWMP CIP estimation has identified several projects included in the current CIP
that have carry-over costs These rollover CIP costs are as shown in Table A-8 andinclude any contingencies
2003 Ongoing CIPRollover Costs = $617759000
72 New ProjectsThe WWMP CIP estimation has identified some new CSO projects These CIP costsare as shown below and include any contingencies The Detroit River CSO is basedon an estimate of $25000000 per outfall assuming the construction of a screening anddisinfection facility
Table 2 New CSO Project Costs
Project CIP Cost
Lower Rouge River Outfalls $25000000
Detroit River CSOs ndash Upper Range $750000000
Detroit River CSOs ndash Lower Range $375000000
Based on half as many outfalls constrd
7182019 Basis of Cost Estimates
httpslidepdfcomreaderfullbasis-of-cost-estimates 2467
Detroit Water and Sewerage DepartmentBasis of Cost Estimates
September 2003 22
73 CSO RehabilitationThe WWMP also considered the rehabilitation of the CSOrsquos in the DWSD system Theupper range estimate assumes that the rehabilitation costs would be approximately1 of the CSO construction costs The table below shows the construction and CIPrehabilitation costs without contingencies It is assumed that each facility will be
rehabilitated annually from 2008 to 2050 The lower range estimate assumes a yearlyrehabilitation cost
Table 3 Upper Range CSO Rehabilitation Costs
Facility Construction Cost RehabilitationCost (each)
Conner Creek CSO $199049172 $1990492
Fox Creek CSO $11582891 $ 115829Leib CSO $31327898 $ 313279
St Aubin CSO $21540250 $ 215403Upper Rouge CSO $418000000 $4180000
Baby Creek CSO $50389000 $ 503890
7 Mile CSO $17638861 $ 176389Fenkell CSO $22281777 $ 222818
Hubbell Southfield CSO $67975783 $ 679758
Belle Isle CSO $14960000 $ 149600
2003 Lower Range CSO Rehab Costs = $6000000 per year
8 Program 3 System Control and Wastewater Treatment
Program81 Wastewater Treatment Plant Ongoing and MajorRehabilitationThe DWSD Wastewater Treatment Plant (WWTP) is the largest facility in the DWSDsewer system An overall assessment of funding needed for the WastewaterTreatment Plant Program was first estimated for planning purposes by summarizingthe current yearly funding for wastewater treatment plant programs This data issummarized in Table 61 and additional information is presented in Table A11 inAppendix A
Table 4 shows that current proposed expenditures have increased from about $99million from the 1997-2002 CIP to $175 million in the 2002-07 CIP However thisamount includes many projects that are not directly related to the WastewaterTreatment Plant such as work at system pump stations Deleting these projects thetotal is closer to $134 million per year
7182019 Basis of Cost Estimates
httpslidepdfcomreaderfullbasis-of-cost-estimates 2567
Detroit Water and Sewerage DepartmentBasis of Cost Estimates
September 2003 23
Table 4 Summary of CIP Proposed Expenditures on the DWSD WastewaterTreatment Plant and System Control
CIP
Total Proposed WWTP CIP
Expenditures (over 5 years)
Yearly WWTP Expenditure
Average
(over 5 years)
20023 to 20067 $878M $175M
20023 to 20067 (deleting
non-WWTP projects)
$670M $134M
20012 to 20056 $973M $194M
19978 to 20012 $493M $99M
Source Sewage Disposal System Capital Improvement Program Descriptions Financial Planning Division
DWSD
Detroit Wastewater Partners the program managers for the PC-744 wastewater plant
upgrade reviewed this initial information in a meeting on January 31 2003Expenditures on renewal and replacement of wastewater treatment plant componentsare typically 3 of the value of the wastewater plant per year for large plants Anestimated value for the Detroit Wastewater Plant is about $5 billion Expenditures of3 of the plant value result in an estimate of $150 million per year as a reasonabletarget to maintain a functioning plant including replacement and upgrade oftreatment processes as technology improves This estimate is summarized in the firstcolumn in Table 5
Table 5 Summary of CIP Proposed Funding Estimates for the DWSDWastewater Treatment Plant and System Control
Original Estimate
Proposed WWTP CIP Yearly
Funding Requirements
(including Process
Improvements)
Revised Estimate from
DWP and DWSD Plant
Staff of Proposed WWTP
Yearly Funding
Requirements
Wastewater Treatment Plant -
Ongoing Renovation and Repairs
$80M $55-70M
Major Renovation of the Wastewater
Treatment Plant
$40M --
System Controls and RegionalOperations
$30M $15M
TOTAL $150M $70-85M
A successful ongoing program of repair and replacement at the WastewaterTreatment Plant cannot be conducted without periodic inspections and updates to theNeeds Assessment The cost of this program is estimated at $100 - 200000 ifconducted yearly If not completed yearly the cost would be higher
7182019 Basis of Cost Estimates
httpslidepdfcomreaderfullbasis-of-cost-estimates 2667
Detroit Water and Sewerage DepartmentBasis of Cost Estimates
September 2003 24
For the 50-year Capital Improvements Program the estimate of $150M for theWastewater Treatment Plant and System Controls was used for assessing rateimpacts as it is a realistic (see Volume 5 Customer Service and Technical SupportProgram) Subsequently in July 2003 a more detailed review of facility needs for theWastewater Treatment Plant and System Controls by Detroit Wastewater Partnersand the Wastewater Treatment Plant staff resulted in a revised estimate shown in thesecond column in Table 5 Note that this estimate includes a much lower cost forongoing renovations to System Controls Also this estimate does not include majorrenovations that would change the treatment process
The Detroit Wastewater Partners estimate of yearly funding requirements was basedon an assessment of the anticipated life and replacement cost of assets at theWastewater Treatment Plant This estimate is summarized in Table D1 in AppendixD of this report Background data from this analysis is included in the spreadsheetslinked to Appendix D
Historical information summarizing expenditures on the plant over the last ten yearswas compared to the $150M estimate Figure 1 shows the magnitude of the dramaticincrease in project expenditures at the Wastewater Treatment Plant in the last fouryears to address the requirements of the Federal Court Upgrades were required totreatment units that were last renovated more than 20 years ago These upgrades didnot include totally new treatment technologies
While this level of expenditure is not expected to continue indefinitely the averagelevel of expenditures over the next fifty years may approach $150M if new treatmenttechnologies are required to replace the current system This would become
necessary if 1) permit limits or other regulatory requirements change or 2) if spaceconstraints and growth in the amount of wastewater treated made expansion of theplant necessary Even without these changes another major renovation of the plant islikely 20 years after the current renovation or in the decade 2020-2030 If onlyongoing replacement and repair of the Wastewater Plant and System Controls isrequired however the estimated CIP requirements for the Wastewater TreatmentPlant and System Controls may be considerably less
7182019 Basis of Cost Estimates
httpslidepdfcomreaderfullbasis-of-cost-estimates 2767
Detroit Water and Sewerage DepartmentBasis of Cost Estimates
September 2003 25
Figure 1
Detroit Wastewater Treatment Plant
Capital Expenditures - 10 Years
$-
$50
$100
$150
$200
$250
1992-1993
1993-1994
1994-1995
1995-1996
1996-1997
1997-1998
1998-1999
1999-2000
2000-2001
2001-2002
Fiscal Year
M i l l i o n s
7182019 Basis of Cost Estimates
httpslidepdfcomreaderfullbasis-of-cost-estimates 2867
Detroit Water and Sewerage DepartmentBasis of Cost Estimates
September 2003 26
Appendix A
Data Tables Used for CIP
7182019 Basis of Cost Estimates
httpslidepdfcomreaderfullbasis-of-cost-estimates 2967
Detroit Water and Sewerage DepartmentBasis of Cost Estimates
September 2003 27
Appendix A ndash Data Tables Used for CIPThe April 2002 version of this technical memo contained several tables that were usedfor the actual CIP cost estimates for the WWMP These tables use 2000 costssometimes based on historical data escalated using the BCI instead of the CCI TheCIP estimates use 2003 data with CCI escalations This section contains these original
tables as well as the recalculated tables The sources listed in these tables are shownin table B-10 in section B15
Sewer Inspection Costs
The only number from Table A-1 used for the CIP estimation is the unit cost for the54-90rdquo category Table A-1 shows this data escalated using the CCI The averagesfrom the 2003 CCI category are used for the CIP
Table A-1Historical Sewer Inspection Costs
SizeSource Unit
CostLF Year2003 Unit CostLF
(CCI) Source
8 - 24 $130 1982 $228 5
$125 2000 $135 15
$080 1988 $119 8
$150 2000 $162 21
Avg $161
27 - 48 $100 1999 $111 2
$225 1999 $249 11
$225 1996 $268 13
$200 2000 $215 21
Avg $211
54 - 90 $300 2000 $323 21
$500 2000 $538 21
Avg $431
Sewer Cleaning CostsAll 2000 data used for Table A-2 comes from historical sources from 1988 to 2000 Theaverages from the 2003 CCI category are used for the CIP
7182019 Basis of Cost Estimates
httpslidepdfcomreaderfullbasis-of-cost-estimates 3067
Detroit Water and Sewerage DepartmentBasis of Cost Estimates
September 2003 28
Table A-2Historical Sewer Cleaning Costs
TaskSource Unit
CostLF Year2003 Unit
CostLF (CCI) Source
PrepCleaning $085 1988 $126 8
$125 2000 $135 15
$200 2000 $215 21
$300 2000 $323 21
$400 2000 $431 21
$500 2000 $538 21
Avg $295
HeavyCleaning $1750 1999 $1934 2
$1200 2000 $1292 20
$1500 2000 $1615 20
$1600 2000 $1723 20
Avg $1641
CIPP Lining CostsAll 2000 data used for Table A-3 comes from historical sources from 1988 to 2000 and
was escalated to 2000 using the BCI The averages from the 2003 CCI category areused for the CIP
Table A-3Historical CIPP Lining Costs
SizeSource Unit
CostLF Year2003 Unit CostLF
(CCI) Source
8 $5800 1982 $10156 5
$6000 1982 $10507 5
$6500 1999 $7184 6
Avg $9282
10 $8000 1999 $8842 6
$8600 1988 $12747 8
Avg $10795
7182019 Basis of Cost Estimates
httpslidepdfcomreaderfullbasis-of-cost-estimates 3167
Detroit Water and Sewerage DepartmentBasis of Cost Estimates
September 2003 29
SizeSource Unit
CostLF Year2003 Unit CostLF
(CCI) Source
12 $6000 1982 $10507 5
$9500 1999 $10500 6
$12800 1988 $18972 8
$9400 1988 $13933 8
Avg $13478
15 $12800 1988 $18972 8
$10800 1988 $16008 8
Avg $17490
18 $12800 1988 $18972 8
Avg $18972
21 $10500 1982 $18387 5
$23000 2000 $24764 20
Avg $21575
24 $16300 1988 $24160 8
$27300 2000 $29393 20
Avg $26776
27 $30000 2000 $32300 20
Avg $32300
30 $36000 2000 $38760 20
Avg $38760
36 $44500 2000 $47912 20
Avg $47912
42 $53300 2000 $57387 20
Avg $57387
48 $62000 2000 $66754 20
Avg $66754
7182019 Basis of Cost Estimates
httpslidepdfcomreaderfullbasis-of-cost-estimates 3267
Detr
September 2003
Table A-4New Relief Sewer Installation Costs
Cost of Sewers-in-Place per Linear Foot at Various Depth Ranges
D e p t h
0 ndash 10 Ft 10 ndash 15 Ft 15 ndash 20 Ft 20 ndash 25 Ft 25 ndash
Size 1996 2003 1996 2003 1996 2003 1996 2003 1996
21 $174 $207 $226 $269 $281 $335 $341 $406 $395
24 $218 $260 $278 $331 $333 $397 $393 $468 $470
27 $262 $312 $330 $393 $385 $459 $445 $530 $503
30 $306 $365 $382 $455 $437 $521 $497 $592 $557
36 $350 $417 $434 $517 $489 $583 $549 $654 $611
42 $394 $470 $486 $579 $541 $645 $601 $716 $665
48 $438 $522 $538 $641 $593 $707 $653 $778 $719
54 $482 $574 $590 $703 $645 $769 $705 $840 $773
60 $530 $632 $641 $764 $698 $832 $755 $900 $830
66 $567 $676 $686 $818 $744 $887 $802 $956 $882
72 $604 $720 $731 $871 $790 $942 $849 $1012 $934
78 $641 $764 $776 $925 $836 $996 $896 $1068 $986
84 $678 $808 $821 $978 $882 $1051 $943 $1124 $1037
90 $715 $852 $866 $1032 $928 $1106 $990 $1180 $1089
7182019 Basis of Cost Estimates
httpslidepdfcomreaderfullbasis-of-cost-estimates 3367
Detr
September 2003
Cost of Sewers-in-Place per Linear Foot at Various Depth Ranges
D e p t h
0 ndash 10 Ft 10 ndash 15 Ft 15 ndash 20 Ft 20 ndash 25 Ft 25 ndash
Size 1996 2003 1996 2003 1996 2003 1996 2003 1996
96 $753 $897 $911 $1086 $974 $1161 $1037 $1236 $1140
102 $953 $1136 $1018 $1213 $1084 $1292 $1181
108 $995 $1186 $1063 $1267 $1131 $1348 $1222
114 $1037 $1236 $1107 $1319 $1178 $1404 $1263
120 $1081 $1288 $1153 $1374 $1225 $1460 $1306
132 $1123 $1338 $1197 $1427 $1272 $1516 $1372
144 $1165 $1388 $1245 $1484 $1325 $1579 $1439
156 $1407 $1677 $1497 $1784 $1626
168 $1590 $1895 $1692 $2017 $1837
180 $1797 $2142 $1912 $2279 $2076
192 $2013 $2399 $2141 $2552 $2325
204 $2254 $2686 $2398 $2858 $2604
7182019 Basis of Cost Estimates
httpslidepdfcomreaderfullbasis-of-cost-estimates 3467
Detroit Water and Sewerage DepartmentBasis of Cost Estimates
September 2003 33
Table A-5Manhole Inspection Costs
Repair Type 2000 UnitCost
2003 UnitCost
TopsideInspection $50 $52
Full Inspection $150 $162
Manhole Replacement Costs
All 2000 data used for Table A-6 comes from historical sources from 1971 to 2000 andwas escalated to 2003 for the CIP
Table A-6Historical Manhole Replacement Costs
SizeSource UnitCostVLF Year
2003 Unit CostVLF(CCI)
4 $12000 1985 $19160
$22500 1999 $24869
$16250 1999 $17961
$10000 1971 $42366
$18000 1999 $19895
$10400 1971 $44060
$10900 1971 $46178
$10300 1971 $43637$18750 1990 $26540
$12500 1990 $17693
$16250 1971 $68844
$17500 1971 $74140
$18700 1971 $79224
Avg $40351
5 $25000 1990 $35387
$18750 1990 $26540$18750 1999 $20724
$22000 1999 $24316
Avg $26742
7182019 Basis of Cost Estimates
httpslidepdfcomreaderfullbasis-of-cost-estimates 3567
Detroit Water and Sewerage DepartmentBasis of Cost Estimates
September 2003 34
SizeSource UnitCostVLF Year
2003 Unit CostVLF(CCI)
6 $29000 1999 $32053
$21250 1999 $23487
Avg $27770
7 $26000 1998 $29417
$35000 1998 $39600
$18750 1985 $29937
$25000 1985 $39917
$37000 1999 $40895
Avg $35953
8 $118750 1999 $131252
$95000 1996 $113222
Avg $122237
The manhole replacement for the CIP assumes the average manhole is 4 in diameterand 15 deep This calculates as follows Each manhole installation = $40351 X 15 =$605265
Table A-7Catch Basin Cleaning Costs
Item Quantity Unit Cost Total Per Year
Labor Cost 33 each $50 per hour $3432000 $3432000
Truck Cost 12 each $350000 $4200000 $420000
Disposal Cost 66667 each $1 $66667 $66667
Cost per Catch Basin $59
7182019 Basis of Cost Estimates
httpslidepdfcomreaderfullbasis-of-cost-estimates 3667
Detroit Water and Sewerage DepartmentBasis of Cost Estimates
September 2003 35
Table A-8CSO CIP Rollover Costs
Project Total Cost CIP RolloverCost
Upper Rouge River Complete CSO Facility $481000000 $362000000
City of Detroit Downspout Disconnects (current CIP runsthrough 2008 estimate for 2008 to 2050)
$208000000 $165000000
Oakwood Pump StationCSO Basin NA $86000000
LTCSO Program Management (current CIP runs through2008 estimate for 2008 to 2050)
NA $4759000
Pump Station Replacement Major RehabilitationPump Stations installation includes the capital cost of constructing a wastewaterpump station including all pumps and related equipment The CIP estimate does notreflect the replacement of any pump station as major rehabilitation is thought to be
adequate Tables A-9a shows the major rehabilitation estimate in unit cost x $1000per pump station dependent on the size of the station Table A-9b shows thebreakdown of these costs into low or high flow categories
Table A-9aPump Station Replacement Costs
Size 2000 Unit Cost 2003 Unit Cost
175 GPM
$65 $70
300 GPM
$65 $70
350 GPM
$65 $70
700 GPM
$85 $92
750 GPM
$90 $97
1250 GPM
$140 $151
1800 GPM
$190 $205
2400 GPM
$250 $269
4200 GPM
$395 $425
5700 GPM
$495 $533
18056 GPM $359
27778 GPM
$512
33333 GPM
$615
34722 GPM
$666
38889 GPM
$717
7182019 Basis of Cost Estimates
httpslidepdfcomreaderfullbasis-of-cost-estimates 3767
Detroit Water and Sewerage DepartmentBasis of Cost Estimates
September 2003 36
Size 2000 Unit Cost 2003 Unit Cost
49000 GPM
$1080 $2380
59722 GPM
$1127
66667 GPM $1229
78472 GPM
$1434
700000 GPM
$12000 $12920
Table A-9bPump Station Replacement Costs
Size 2003 Unit Cost
0 - 500 GPM $1567000
500 + GPM $20000000
7182019 Basis of Cost Estimates
httpslidepdfcomreaderfullbasis-of-cost-estimates 3867
Detroit Water and Sewerage DepartmentBasis of Cost Estimates
September 2003 37
Appendix B
Data Tables Not Used for CIP
7182019 Basis of Cost Estimates
httpslidepdfcomreaderfullbasis-of-cost-estimates 3967
Detroit Water and Sewerage DepartmentBasis of Cost Estimates
September 2003 38
Appendix B ndash Data Tables Not Used for CIPThe April 2002 version of this technical memo contained several tables that were notused for the actual CIP cost estimates for the WWMP The CIP either used differentdata sources or did not include the categories covered in these tables
B1 Alternate Data Category TablesB11 Chemical Grouting of JointsChemical Grouting of Joints consists of utilizing chemical products to eliminate leaksin pipe joints The estimate includes mobilization set up and furnishing of allincidentals The estimate is shown and is in unit cost per pipe joint All 2000 dataused for Table B-1 comes from historical sources from 1982 to 1999 and was escalatedto 2003 using the CCI
Table B-1Historical Chemical Grouting of Joints Costs
SizeSource UnitCostJoint Year
2003 Unit CostJoint(CCI) Source
Al l $6000 1985 $9580 1
$3500 1982 $6129 5
$2400 1988 $3557 8
$3500 1999 $3868 11
$3500 1996 $4171 13
Avg $5461
B12 SlipliningSliplining is considered to be a light rehabilitation method Sliplining installationincludes
Installation of HPDE Pipe into existing sewer pipe Excavation and backfill of insertion pits in common earth Annular space grouting Mobilization Sewer preparation And furnishing of all incidentals
The service life of Sliplining is 50 years Sizes are the ID of the Slipliner pipe forexample to reline a 20rdquo sewer use the cost for the 16rdquo Slipliner The estimate in TableB-2 is unit cost x $1000 per mile of installation
7182019 Basis of Cost Estimates
httpslidepdfcomreaderfullbasis-of-cost-estimates 4067
Detroit Water and Sewerage DepartmentBasis of Cost Estimates
September 2003 39
Table B-2Sliplining Costs
Size 2003 UnitCost Mile
4rdquo $20
6rdquo $50
8rdquo $90
10rdquo $130
12rdquo $190
14rdquo $230
16rdquo $290
18rdquo $370
20rdquo $460
22rdquo $56024rdquo $660
26rdquo $780
28rdquo $900
30rdquo $1040
32rdquo $1180
36rdquo $1490
42rdquo $2030
48rdquo $2650
52rdquo $3060
54rdquo $3360
B13 Sewer Pipe ReplacementIt has been determined that the improvements to the DWSD sewer system would notinclude the replacement of any sewer pipes However the costs for the constructionof new sewers were investigated The results of this investigation follow Note thatthe costs included in these tables (Table B-3 through B-13) are the recommended costsfrom Table 51-1
Ductile Iron Force Main
Ductile Iron Force Main installation includes
Cement lined ductile iron pipe (6-24) Excavation and backfill of common earth 3 ndash 35 feet of cover to crown of the pipe Minimum utility relocation Up to 6rdquo of bituminous pavement removal and replacement Furnishing of all incidentals
7182019 Basis of Cost Estimates
httpslidepdfcomreaderfullbasis-of-cost-estimates 4167
Detroit Water and Sewerage DepartmentBasis of Cost Estimates
September 2003 40
Table B-3 shows the ductile iron force main installation estimate in unit cost x $1000per mile of pipe installation escalated using the CCI The service life of ductile ironforce mains is 30 years
Table B-3Historical New Ductile Iron Force Main Installation Costs
Size
SourceUnitCostLF Year 2003 Unit CostLF (CCI) Source
4 $1000 1985 $1597 1
$1500 1985 $2395 1
Avg $1996
6 $1600 1985 $2555 1
$1900 1985 $3034 1
$2700 2000 $2907 10
$1840 1971 $7795 14
$1600 1971 $6778 14
Avg $4614
8 $3000 2000 $3230 10
Avg $3230
10 $3300 2000 $3553 10
Avg $3553
12 $3700 2000 $3984 10
$1600 1971 $6778 14
$2800 1990 $3963 16
Avg $4909
14 $4100 2000 $4414 10
Avg $4414
16 $4500 2000 $4845 10
Avg $4845
7182019 Basis of Cost Estimates
httpslidepdfcomreaderfullbasis-of-cost-estimates 4267
Detroit Water and Sewerage DepartmentBasis of Cost Estimates
September 2003 41
Size
SourceUnitCostLF Year 2003 Unit CostLF (CCI) Source
18 $4200 1990 $5945 16
Avg $5945
20 $5300 2000 $5706 10
$4750 1971 $20124 14
Avg $12915
24 $6000 2000 $6460 10
Avg $6460
48 $10700 2000 $11520 10
Avg $11520
Service Leads Service Lead installation includes
6 SDR 35 PVC pipe and fittings Excavation and backfill of common earth Min 4rsquo cover to crown of the pipe Tie-in to existing sewer Reseeding
Furnishing of all incidentals
Table B-4 shows the estimate for service lead installation in unit cost per foot of pipewith the historical data escalated using the CCI The service life of service leads is 25years
Table B-4Historical New Service Lead Installation Costs
SizeSource unitCostLF Year
2003 Unit CostLF(CCI) Source
6 $1400 1971 $5931 14
$1560 1971 $6609 14
Avg $6270
7182019 Basis of Cost Estimates
httpslidepdfcomreaderfullbasis-of-cost-estimates 4367
Detroit Water and Sewerage DepartmentBasis of Cost Estimates
September 2003 42
Sanitary Laterals
Sanitary Lateral installation includes
Plain concrete pipe (8-12)
Excavation and backfill of common earth including trench shield or box 48rdquo diameter manholes at 300 feet Minimum utility relocation Up to 6rdquo of bituminous pavement removal and replacement Furnishing of all incidentals
Table B-5 shows the estimate for sanitary laterals in unit cost x $1000 per mile of pipeinstallation with the historical data escalated using the CCI The service life ofsanitary laterals is 50 years
Table B-5
Historical New Sanitary Lateral Installation Costs
SizeSource UnitCostLF Year
2003 Unit CostLF(CCI) Source
8 $2250 1985 $3592 1
$3500 1999 $3868 6
$2900 1971 $12286 14
$2600 1971 $11015 14
$2540 1971 $10761 14
$3260 1971 $13811 14
$3500 1990 $4954 16
$3500 1990 $4954 19
Avg $7706
10 $2400 1985 $3832 1
$2500 1985 $3992 1
$4000 1999 $4421 6
$5600 2000 $6029 10
$3000 1971 $12710 14
$5700 1971 $24148 14
Avg $9189
12 $5500 1999 $6079 6
$4500 1990 $6370 16
Avg $6224
7182019 Basis of Cost Estimates
httpslidepdfcomreaderfullbasis-of-cost-estimates 4467
Detroit Water and Sewerage DepartmentBasis of Cost Estimates
September 2003 43
Storm and Combined LateralsStorm and combined lateral installation includes
Reinforced concrete pipe (12-24) Excavation and backfill of common earth Sheeting shoring and bracing Trench shield or box at 8rsquo 48rdquo Diameter manholes at 300 feet Min bury to the crown of the pipe as listed below Minimum utility relocation Up to 6rdquo of bituminous pavement removal and replacement And furnishing of all incidentals
Tables B-6 shows the estimates for storm and combined laterals in unit cost x $1000per mile of pipe installation at various depths with the historical data escalated usingthe CCI However the depth of installation is unknown The service life of storm andcombined laterals is 50 years
Table B-6Historical New Storm and Combined Lateral Installation Costs
SizeSource Unit
CostLF Year2003 Unit CostLF
(CCI) Source
12 $2500 1985 $3992 1
$3000 1985 $4790 1
$4500 1989 $6531 9
$6100 2000 $6568 10
$4350 1971 $18429 14
$3900 1971 $16523 14
$2700 1990 $3822 16
$4890 1971 $20717 14
$4500 1990 $6370 16
$4500 1990 $6370 19
$2700 1990 $3822 19
Avg $8161
15 $2750 1985 $4391 1$6700 2000 $7214 10
$4900 1971 $20759 14
$3375 1990 $4777 16
$5625 1990 $7962 16
$3375 1990 $4777 19
7182019 Basis of Cost Estimates
httpslidepdfcomreaderfullbasis-of-cost-estimates 4567
Detroit Water and Sewerage DepartmentBasis of Cost Estimates
September 2003 44
SizeSource Unit
CostLF Year2003 Unit CostLF
(CCI) Source
15 $5625 1990 $7962 19
$3100 1999 $3426 11
Avg $6808
18 $3000 1985 $4790 1
$7300 2000 $7860 10
$3255 1990 $4607 16
$4050 1990 $5733 16
$4050 1990 $5733 19
$6750 1990 $9554 19
Avg $6379
21 $8000 2000 $8613 10
$5200 1971 $22030 14
$4800 1971 $20335 14
$4700 1971 $19912 14
$4725 1990 $6688 16
$4720 1990 $6681 19
Avg $14043
24 $8800 2000 $9475 10
$5400 1971 $22877 14
$5060 1971 $21437 14
$4430 1990 $6271 16
$5400 1990 $7644 19
$5400 1990 $7644 16
Avg $12558
Trunk SewersTrunk Sewer installation includes
Reinforced concrete pipe (27-66) Excavation and backfill of common earth Sheeting shoring and bracing Manholes at 300 feet Diameters as follows
o Pipe size 27rdquo ndash 36rdquo 60rdquo diameter manholes
7182019 Basis of Cost Estimates
httpslidepdfcomreaderfullbasis-of-cost-estimates 4667
Detroit Water and Sewerage DepartmentBasis of Cost Estimates
September 2003 45
o Pipe size 42rdquo- 48rdquo 72rdquo diameter manholeso Pipe size 54rdquo ndash 66rdquo 84rdquo diameter manholes
Min bury to the crown of the pipe as listed below Minimum utility relocation Up to 6rdquo of bituminous pavement removal and replacement And furnishing of all incidentals
Table B-7 shows the estimates in unit cost x $1000 per mile of pipe installation atvarious depths with the historical data escalated using the CCI However the depthof installation is unknown The service life of trunk sewers is 50 years
Table B-7Historical New Trunk Sewer Installation Costs
Size Source Unit CostLF Year 2003 Unit CostLF (CCI) Source
27 $9600 2000 $10336 10
$5000 1971 $21183 14
Avg $15759
30 $10400 2000 $11197 10
$13500 1996 $16090 13
Avg $13643
36 $9300 1982 $16285 5
$27500 1998 $31114 3
$27500 1997 $31621 7$27000 1999 $29843 11
$14500 1996 $17281 13
Avg $25229
42 $29000 1997 $33346 7
$33000 1999 $36474 11
$13200 2000 $14212 10
Avg $28011
48 $30000 1997 $34496 7
$28500 1999 $31500 11
Avg $32998
Size Source Unit CostLF Year 2003 Unit CostLF (CCI) Source
54 $31000 1997 $35646 7
7182019 Basis of Cost Estimates
httpslidepdfcomreaderfullbasis-of-cost-estimates 4767
Detroit Water and Sewerage DepartmentBasis of Cost Estimates
September 2003 46
Avg $35646
60 $34000 1997 $39096 7
Avg $39096
66 $47000 1998 $53177 3
$50000 1998 $56571 3
Avg $54874
Interceptors TunnelsInterceptor tunnel installation includes
Reinforced concrete pipe (78-120) Excavation and backfill of common earth Sheeting shoring and bracing 8rsquo Diameter manholes at 600 feet Min bury to the crown of the pipe as listed below Minimum utility relocation Up to 6rdquo of bituminous pavement removal and replacement And furnishing of all incidentals
Table B-8 shows the estimates in unit cost x $1000 per mile of pipe installation atvarious depths with the historical data escalated using the CCI However the depthof installation is unknown The service life of interceptors tunnels is 50 years
Table B-8Historical New Interceptors Tunnels Installation Costs
Size Source Unit CostLF Year 2003 Unit CostLF (CCI) Source
78 $60000 1998 $67885 3
Avg $67885
84 $62000 1998 $70148 3
Avg $70148
96 $70000 1998 $79199 3
Avg $79199
Size Source Unit CostLF Year 2003 Unit CostLF (CCI) Source
102 $75000 1998 $84856 3
7182019 Basis of Cost Estimates
httpslidepdfcomreaderfullbasis-of-cost-estimates 4867
Detroit Water and Sewerage DepartmentBasis of Cost Estimates
September 2003 47
Avg $84856
108 80000 1998 $90514 3
Avg $90514
120 $90000 1985 $143700 1
Avg $143700
B14 Miscellaneous RepairsThis cost estimating technical memorandum reviewed the costs for various sewersystem repairs that were not scheduled or included in the WWMP CIP developmentThis section contains the results of this repair cost review
Sump Pump Disconnection
Sump Pump Disconnection consists of removal of sump valves electrical connectionsand restoration These costs in unit cost per connection are estimated at $6720 in2000 dollars
Root Control
Root Control consists of utilizing chemical methods The estimate includesmobilization set up and furnishing of all incidentals Table B-9 shows the estimate inunit cost per linear foot of pipe with the historical data escalated using the CCI
Table B-9Historical Root Control Costs
SizeSource Unit
CostLF Year 2003 Unit CostLF (CCI) Source
Al l $200 1982 $350 5
$200 1988 $296 8
$140 1989 $203 9
$200 2000 $215 20
$225 2000 $242 20
$275 2000 $296 20
Avg $267
B15 Historical ReferencesShown on each spreadsheet is a reference code to the source of individual unit pricesTable B-10 shows the references used for the historical estimates in Appendices A andB
7182019 Basis of Cost Estimates
httpslidepdfcomreaderfullbasis-of-cost-estimates 4967
Detroit Water and Sewerage DepartmentBasis of Cost Estimates
September 2003 48
Table B-10Historical References
Source Title Date
1 Unidentified CDM Documents 1985
2Beaconsfield Relief Sewer Cleaning Manholes Inspection forSouth Macomb Sanitary District 1999
3 SOCSDS Project Plan 1998
4 Cost Effective Analysis 1998
5 Grosse Pointe Infrastructure 1982
6 City of Rochester Hills SDA 1999
7 HRC Detailed Cost Estimates 1997
8 Beverly Hills Local Sewer Study Rehabilitation Program 1988
9 Unidentified CDM Documents 1989
10 Unidentified Construction Cost Estimate
11 South Macomb Sanitary District 1999
12 City of Rochester Hills Sanitary Sewer Evaluation Survey 1996
13 South Macomb Sanitary District Appendix J 1996
14 Clinton-Oakland Sewage Disposal System 1971
15 City of Hazel Park MI
16 Farmington MI Sewer Seperation Improvements 1990
17 Basic Requirements Report Evergreen-Farmington Relief 1985
18 Cost Estimate 1975
19 Pre-Rehabilitation Local Sewer Costs 1990
20 Ann Arbor SSO Prevention Task Force 2000
B16 Means and Manufacturersrsquo EstimatesThe calculation of construction costs using the RW Means methodology requiresprices for component materials and construction activities (ie excavation orbackfilling) The following table presents the component costs used in the
development of construction cost guidelines
7182019 Basis of Cost Estimates
httpslidepdfcomreaderfullbasis-of-cost-estimates 5067
Detroit Water and Sewerage DepartmentBasis of Cost Estimates
September 2003 49
Table B-11Component Costs for Means and Manufacturersrsquo Estimates
Item Size Description Unit Cost Units Source
Excavation
Excavation common earth hauling
away fill up to 4 mi $1549 CY Means
BackfillCommon earth front-end loaderCompaction 12 lifts $882 CY Means
Select FillCrushed bank run gravelcompaction 6 lifts $2650 CY Means
Sheeting 8 DeepWood solid sheeting incl Walesbraces and spacers Drive amp Extract $668 SF Means
16 DeepWood solid sheeting incl Walesbraces and spacers Drive amp Extract $876 SF Means
24 DeepWood solid sheeting incl Walesbraces and spacers Drive amp Extract $1074 SF Means
32 DeepWood solid sheeting incl Walesbraces and spacers Drive amp Extract $1199 SF Means
Pavement Removal Bituminous 4 to 6 thick $572 SY Means
Saw Cutting Asphalt 6 thick $281 LF Means
Pavement Replacement Over Trench 6 thick $4333 SY Means
Non-Reinforced ConcretePipe 8 Bell and Spigot Joints Extra strength $1231 LF Means
10 Bell and Spigot Joints Extra strength $1305 LF Means
12 Bell and Spigot Joints Extra strength $1480 LF Means
Reinforced Concrete Pipe 12
Class 3 BampS or TampG Joints
wgaskets $1890 LF Means
15Class 3 BampS or TampG Jointswgaskets $2167 LF Means
18Class 3 BampS or TampG Jointswgaskets $2536 LF Means
7182019 Basis of Cost Estimates
httpslidepdfcomreaderfullbasis-of-cost-estimates 5167
Detroit Water and Sewerage DepartmentBasis of Cost Estimates
September 2003 50
Item Size Description Unit Cost Units Source
Reinforced Concrete Pipe 21Class 3 BampS or TampG Joints wogaskets $3135 LF Means
24Class 3 BampS or TampG Jointswgaskets $3504 LF Means
27Class 3 BampS or TampG Joints wogaskets $5302 LF Means
30Class 3 BampS or TampG Jointswgaskets $6592 LF Means
36Class 3 BampS or TampG Jointswgaskets $8990 LF Means
42
Class 3 BampS or TampG Joints wo
gaskets $9220 LF Means
48Class 3 BampS or TampG Jointswgaskets $13185 LF Means
54Class 3 BampS or TampG Jointswgaskets $14845 LF Means
60Class 3 BampS or TampG Joints wogaskets $16504 LF Means
66Class 3 BampS or TampG Joints wogaskets $23004 LF Means
72Class 3 BampS or TampG Jointswgaskets $29504 LF Means
78Class 3 BampS or TampG Joints wogaskets $32500 LF Means
84Class 3 BampS or TampG Joints wogaskets $35497 LF Means
96Class 3 BampS or TampG Jointswgaskets $43795 LF Means
102
Class 3 BampS or TampG Joints wo
gaskets $46000 LF Means
108Class 3 BampS or TampG Joints wogaskets $48300 LF Means
120Class 3 BampS or TampG Joints wogaskets $53000 LF Means
7182019 Basis of Cost Estimates
httpslidepdfcomreaderfullbasis-of-cost-estimates 5267
Detroit Water and Sewerage DepartmentBasis of Cost Estimates
September 2003 51
Item Size Description Unit Cost Units Source
Ductile Iron Pipe 4 Class 50 Cement Lined Mech Joint $1982 LF Means
6 Class 50 Cement Lined Mech Joint $2305 LF Means
8 Class 50 Cement Lined Mech Joint $2812 LF Means
10 Class 50 Cement Lined Mech Joint $3458 LF Means
12 Class 50 Cement Lined Mech Joint $4103 LF Means
14 Class 50 Cement Lined Mech Joint $4656 LF Means
16 Class 50 Cement Lined Mech Joint $5670 LF Means
18 Class 50 Cement Lined Mech Joint $6731 LF Means
20 Class 50 Cement Lined Mech Joint $7745 LF Means
24 Class 50 Cement Lined Mech Joint $9958 LF Means
48 Class 50 Cement Lined Mech Joint $23234 LF Est
PVC Pipe (SDR35) 6 SDR 35 BampS $512 LF Means
6 SDR 35 BampS 45 Degree Bend $7376 LF Means
HDPEPipe for Sliplining 4HDPE Pipe PE3408 DR21 (80 psi)price installed $442 LF Manufact
6HDPE Pipe PE3408 DR21 (80 psi)price installed $958 LF Manufact
8
HDPE Pipe PE3408 DR21 (80 psi)
price installed $1623 LF Manufact
10HDPE Pipe PE3408 DR21 (80 psi)price installed $2521 LF Manufact
12HDPE Pipe PE3408 DR21 (80 psi)price installed $3547 LF Manufact
7182019 Basis of Cost Estimates
httpslidepdfcomreaderfullbasis-of-cost-estimates 5367
Detroit Water and Sewerage DepartmentBasis of Cost Estimates
September 2003 52
Item Size Description Unit Cost Units Source
HDPEPipe for Sliplining 14HDPE Pipe PE3408 DR21 (80 psi)price installed $4276 LF Manufact
16HDPE Pipe PE3408 DR21 (80 psi)price installed $5586 LF Manufact
18HDPE Pipe PE3408 DR21 (80 psi)price installed $7069 LF Manufact
20HDPE Pipe PE3408 DR21 (80 psi)price installed $8728 LF Manufact
22HDPE Pipe PE3408 DR21 (80 psi)price installed $10560 LF Manufact
24
HDPE Pipe PE3408 DR21 (80 psi)
price installed $12567 LF Manufact
26HDPE Pipe PE3408 DR21 (80 psi)price installed $14749 LF Manufact
28HDPE Pipe PE3408 DR21 (80 psi)price installed $17106 LF Manufact
30HDPE Pipe PE3408 DR21 (80 psi)price installed $19637 LF Manufact
32HDPE Pipe PE3408 DR21 (80 psi)price installed $22342 LF Manufact
36HDPE Pipe PE3408 DR21 (80 psi)price installed $28277 LF Manufact
42HDPE Pipe PE3408 DR21 (80 psi)price installed $38488 LF Manufact
48HDPE Pipe PE3408 DR21 (80 psi)price installed $50270 LF Manufact
52HDPE Pipe PE3408 DR21 (80 psi)price installed $57869 LF Manufact
54
HDPE Pipe PE3408 DR21 (80 psi)
price installed $63623 LF Manufact
Manholes 4 DiaPrecast Concrete not incl Excavbackfill frame cover sheeting $17979 VLF Means
5 DiaPrecast Concrete not incl Excavbackfill frame cover sheeting $18809 VLF Means
7182019 Basis of Cost Estimates
httpslidepdfcomreaderfullbasis-of-cost-estimates 5467
Detroit Water and Sewerage DepartmentBasis of Cost Estimates
September 2003 53
Item Size Description Unit Cost Units Source
Manholes 6 DiaPrecast Concrete not incl Excavbackfill frame cover sheeting $28582 VLF Means
7 DiaPrecast Concrete not incl Excavbackfill frame cover sheeting $38355 VLF Means
8 DiaPrecast Concrete not incl Excavbackfill frame cover sheeting $48128 VLF Means
B17 Meanrsquos Unit Cost Estimates
Table B-12 contains a sample estimating sheet for calculating each component costusing the material and labor costs identified in the previous section
7182019 Basis of Cost Estimates
httpslidepdfcomreaderfullbasis-of-cost-estimates 5567
Detroit Water and Sewerage DepartmentBasis of Cost Estimates
September 2003 54
Table B-12Sample Component Costs Estimator
Quick Sewer Estimator
Force Mains
Dimensions
Pipe Size 14 in
Trench Width 4 Ft not less than 32
Trench Depth 6 Ft
Length 1 Ft
Material Costs
Pipe CostLF 66 $LF
Excav CostCY 13 $CYBackfill Cost CY 10 $CY
Select Fill CostCY 12 $CY
Pavament DemoCost SY 7 $SY
New Pavement Cost SY 29 $SY
Saw Cut Per LF 4 $LF
Sheeting Cost SF 0 $SF
May not be required for excavations under 5 deep
Pavement A (sy)= 044
Vexcav (cy) = Vbfill (cy) =
089 049
Hbfill (ft)
Sheeting (sf) Common Fill 333333
12
Vsfill (cy) =
036 Hsfill (ft)
Select Fill 266667
W (ft) = 4
Total Costs
7182019 Basis of Cost Estimates
httpslidepdfcomreaderfullbasis-of-cost-estimates 5667
Detroit Water and Sewerage DepartmentBasis of Cost Estimates
September 2003 55
Pipe $6600
Excav $622
Backfill $494
Select Fill $427
Pavement Demo $311New Pavement $1289
Saw Cut $800
Sheeting Cost $000
Total Price $10543
Price Per Foot $10543 LF
7182019 Basis of Cost Estimates
httpslidepdfcomreaderfullbasis-of-cost-estimates 5767
Detroit Water and Sewerage DepartmentBasis of Cost Estimates
September 2003 56
Appendix C
Unit Costs for Treatment Facilities
7182019 Basis of Cost Estimates
httpslidepdfcomreaderfullbasis-of-cost-estimates 5867
Detroit Water and Sewerage DepartmentBasis of Cost Estimates
September 2003 57
Appendix C ndash Unit Costs for Treatment FacilitiesThe following tables outline the unit costs for treatment facilities derived from projectcost estimates These unit costs are provided for future estimating of these facilitiesand are the total cost X 1000 They are base construction costs only and do notinclude engineering fees allowances or contingencies
Table C-1Influent Pump Station Unit Cost
Capacity 2000 2010 2020 2030 2040 2050
394 mgd $1960 $2320 $2820 $3320 $3820 $4320
400 mgd $3810 $4520 $5490 $6460 $7430 $8400
491 mgd $2060 $2440 $2970 $3490 $4010 $4530
615 mgd $2510 $2980 $3620 $4260 $4900 $5540
615 mgd $2510 $2980 $3620 $4260 $4900 $5540
615 mgd $3050 $3620 $4400 $5180 $5960 $6740
619 mgd $3150 $3740 $4550 $5350 $6150 $6950
860 mgd $4440 $5270 $6410 $7540 $8670 $9800
1040 mgd $5940 $7040 $8560 $10070 $11580 $13090
1080 mgd $3790 $4490 $5460 $6420 $7380 $8340
1130 mgd $6090 $7220 $8780 $10330 $11880 $13420
1260 mgd $4510 $5350 $6500 $7650 $8800 $9940
1580 mgd $6020 $7140 $8680 $10210 $11740 $13270
1890 mgd $6350 $7530 $9150 $10770 $12390 $14000
2535 mgd $7030 $8340 $10140 $11930 $13720 $15500
3105 mgd $7030 $8340 $10140 $11930 $13720 $15500
Table C-2
Screening and Grit Chamber Unit Cost Capacity 2000 2010 2020 2030 2040 2050
116 mgd $1530 $1810 $2200 $2590 $2980 $3370
143 mgd $2030 $2410 $2930 $3450 $3970 $4490
216 mgd $2210 $2620 $3180 $3740 $4300 $4860
221 mgd $3490 $4140 $5030 $5920 $6810 $7700
226 mgd $3490 $4140 $5030 $5920 $6810 $7700
322 mgd $4500 $5340 $6490 $7640 $8790 $9930
322 mgd $4500 $5340 $6490 $7640 $8790 $9930
368 mgd $3240 $3840 $4670 $5490 $6320 $7140
409 mgd $3700 $4390 $5340 $6280 $7220 $8160
471 mgd $6190 $7340 $8920 $10500 $12080 $13650471 mgd $5940 $7040 $8560 $10070 $11580 $13090
554 mgd $4520 $5360 $6510 $7660 $8810 $9960
576 mgd $5190 $6160 $7490 $8810 $10130 $11450
636 mgd $5600 $6640 $8070 $9500 $10930 $12350
1000 mgd $9770 $11590 $14090 $16580 $19070 $21550
1250 mgd $11300 $13400 $16290 $19170 $22050 $24920
7182019 Basis of Cost Estimates
httpslidepdfcomreaderfullbasis-of-cost-estimates 5967
Detroit Water and Sewerage DepartmentBasis of Cost Estimates
September 2003 58
Table C-3 Aeration Bas in wi th Nit ri ficat ion Unit Cost
Capacity 2000 2010 2020 2030 2040 2050
113 mgd $10400 $12330 $14990 $17640 $20290 $22930
140 mgd $11200 $13280 $16140 $18990 $21840 $24680
211 mgd $17300 $20520 $24940 $29350 $33760 $38150
211 mgd $17300 $20520 $24940 $29350 $33760 $38150211 mgd $16000 $18980 $23070 $27150 $31230 $35290
308 mgd $22600 $26800 $32570 $38320 $44080 $49810
308 mgd $22600 $26800 $32570 $38320 $44080 $49810
359 mgd $24200 $28700 $34880 $41040 $47210 $53350
400 mgd $22600 $26800 $32570 $38320 $44080 $49810
450 mgd $32300 $38310 $46560 $54780 $63010 $71200
450 mgd $31800 $37710 $45830 $53930 $62040 $70110
540 mgd $35300 $41860 $50880 $59870 $68870 $77830
563 mgd $36800 $43640 $53040 $62410 $71790 $81130
622 mgd $39300 $46610 $56650 $66660 $76680 $86650
Table C-4Primary Clarifiers Unit Cost
Capacity 2000 2010 2020 2030 2040 2050
116 mgd $1530 $1810 $2200 $2590 $2980 $3370
143 mgd $2030 $2410 $2930 $3450 $3970 $4490
216 mgd $2210 $2620 $3180 $3740 $4300 $4860
221 mgd $3490 $4140 $5030 $5920 $6810 $7700
226 mgd $3490 $4140 $5030 $5920 $6810 $7700
322 mgd $4500 $5340 $6490 $7640 $8790 $9930
322 mgd $4500 $5340 $6490 $7640 $8790 $9930
368 mgd $3240 $3840 $4670 $5490 $6320 $7140
409 mgd $3700 $4390 $5340 $6280 $7220 $8160
471 mgd $6190 $7340 $8920 $10500 $12080 $13650
471 mgd $5940 $7040 $8560 $10070 $11580 $13090
554 mgd $4520 $5360 $6510 $7660 $8810 $9960
576 mgd $5190 $6160 $7490 $8810 $10130 $11450
636 mgd $5600 $6640 $8070 $9500 $10930 $12350
1000 mgd $9770 $11590 $14090 $16580 $19070 $21550
1250 mgd $11300 $13400 $16290 $19170 $22050 $24920
Table C-5Complete Mix Activated Sludge Unit Cost
Capacity 2000 2010 2020 2030 2040 2050
100 mgd $21800 $25850 $31420 $36970 $42530 $48060
125 mgd $25300 $30000 $36460 $42900 $49350 $55770
7182019 Basis of Cost Estimates
httpslidepdfcomreaderfullbasis-of-cost-estimates 6067
Detroit Water and Sewerage DepartmentBasis of Cost Estimates
September 2003 59
Table C-6Iron Feed System Unit Cost
Capacity 2000 2010 2020 2030 2040 2050
113 mgd $152 $180 $220 $260 $300 $340
140 mgd $152 $180 $220 $260 $300 $340
211 mgd $152 $180 $220 $260 $300 $340
211 mgd $152 $180 $220 $260 $300 $340211 mgd $152 $180 $220 $260 $300 $340
308 mgd $156 $190 $230 $270 $310 $350
308 mgd $156 $190 $230 $270 $310 $350
359 mgd $175 $210 $260 $310 $360 $410
400 mgd $164 $190 $230 $270 $310 $350
450 mgd $182 $220 $270 $320 $370 $420
450 mgd $182 $220 $270 $320 $370 $420
540 mgd $208 $250 $300 $350 $400 $450
563 mgd $189 $220 $270 $320 $370 $420
622 mgd $197 $230 $280 $330 $380 $430
1000 mgd $205 $240 $290 $340 $390 $440
1250 mgd $225 $270 $330 $390 $450 $510
Table C-7Coagulation-Flocculation Unit Cost
Capacity 2000 2010 2020 2030 2040 2050
100 mgd $19700 $23360 $28390 $33410 $38430 $43430
125 mgd $24100 $28580 $34740 $40880 $47020 $53130
Table C-8Secondary Clarifiers Unit Cost
Capacity 2000 2010 2020 2030 2040 2050
113 mgd $3050 $3620 $4400 $5180 $5960 $6740140 mgd $3800 $4510 $5480 $6450 $7420 $8380
211 mgd $4430 $5250 $6380 $7510 $8640 $9760
211 mgd $4430 $5250 $6380 $7510 $8640 $9760
211 mgd $4870 $5780 $7030 $8270 $9510 $10750
308 mgd $5800 $6880 $8360 $9840 $11320 $12790
308 mgd $5800 $6880 $8360 $9840 $11320 $12790
359 mgd $7120 $8440 $10260 $12070 $13880 $15680
400 mgd $6280 $7450 $9050 $10650 $12250 $13840
450 mgd $8070 $9570 $11630 $13680 $15740 $17790
450 mgd $8070 $9570 $11630 $13680 $15740 $17790
540 mgd $10400 $12330 $14990 $17640 $20290 $22930
563 mgd $11500 $13640 $16580 $19510 $22440 $25360
622 mgd $12400 $14710 $17880 $21040 $24200 $27350
1000 mgd $13700 $16250 $19750 $23240 $26730 $30210
1250 mgd $15200 $18030 $21910 $25780 $29650 $33510
7182019 Basis of Cost Estimates
httpslidepdfcomreaderfullbasis-of-cost-estimates 6167
Detroit Water and Sewerage DepartmentBasis of Cost Estimates
September 2003 60
Table C-9Intermediate Pumping Unit Cost
Capacity 2000 2010 2020 2030 2040 2050
253 mgd $734 $870 $1060 $1250 $1440 $1630
350 mgd $1060 $1260 $1530 $1800 $2070 $2340
400 mgd $1220 $1450 $1760 $2070 $2380 $2690
446 mgd $1380 $1640 $1990 $2340 $2690 $3040452 mgd $1410 $1670 $2030 $2390 $2750 $3110
529 mgd $1680 $1990 $2420 $2850 $3280 $3710
611 mgd $1680 $1990 $2420 $2850 $3280 $3710
669 mgd $1860 $2210 $2690 $3170 $3650 $4120
743 mgd $2090 $2480 $3010 $3540 $4070 $4600
849 mgd $2430 $2880 $3500 $4120 $4740 $5360
942 mgd $2470 $2930 $3560 $4190 $4820 $5450
1040 mgd $2770 $3290 $4000 $4710 $5420 $6120
1050 mgd $2810 $3330 $4050 $4770 $5490 $6200
1130 mgd $3040 $3610 $4390 $5170 $5950 $6720
Table C-10Filtration Unit Cost
Capacity 2000 2010 2020 2030 2040 2050
113 mgd $3930 $4660 $5660 $6660 $7660 $8660
140 mgd $5040 $5980 $7270 $8550 $9830 $11110
211 mgd $6210 $7360 $8950 $10530 $12110 $13680
211 mgd $6220 $7380 $8970 $10550 $12140 $13720
308 mgd $7900 $9370 $11390 $13400 $15410 $17410
359 mgd $8440 $10010 $12170 $14320 $16470 $18610
400 mgd $9190 $10900 $13250 $15590 $17930 $20260
450 mgd $10400 $12330 $14990 $17640 $20290 $22930
540 mgd $11800 $13990 $17000 $20000 $23010 $26000563 mgd $12200 $14470 $17590 $20700 $23810 $26910
622 mgd $13500 $16010 $19460 $22900 $26340 $29770
7182019 Basis of Cost Estimates
httpslidepdfcomreaderfullbasis-of-cost-estimates 6267
Detroit Water and Sewerage DepartmentBasis of Cost Estimates
September 2003 61
Table C-11Ultraviolet Disinfection Unit Cost
Capacity 2000 2010 2020 2030 2040 2050
259 mgd $912 $1080 $1310 $1540 $1770 $2000
351 mgd $1280 $1520 $1850 $2180 $2510 $2840
400 mgd $1530 $1810 $2200 $2590 $2980 $3370
452 mgd $2040 $2420 $2940 $3460 $3980 $4500452 mgd $3310 $3930 $4780 $5620 $6460 $7300
452 mgd $1750 $2080 $2530 $2980 $3430 $3880
619 mgd $1750 $2080 $2530 $2980 $3430 $3880
619 mgd $2280 $2700 $3280 $3860 $4440 $5020
679 mgd $2550 $3020 $3670 $4320 $4970 $5620
860 mgd $3830 $4540 $5520 $6500 $7480 $8450
860 mgd $3060 $3630 $4410 $5190 $5970 $6750
956 mgd $3400 $4030 $4900 $5770 $6640 $7500
1036 mgd $3830 $4540 $5520 $6500 $7480 $8450
1126 mgd $4100 $4860 $5910 $6950 $7990 $9030
1750 mgd $8270 $9810 $11920 $14030 $16140 $18240
2000 mgd $8620 $10220 $12420 $14610 $16810 $19000
Table C-12Post Aeration Unit Cost
Capacity 2000 2010 2020 2030 2040 2050
113 mgd $114 $140 $170 $200 $230 $260
140 mgd $134 $160 $190 $220 $250 $280
211 mgd $142 $170 $210 $250 $290 $330
211 mgd $142 $170 $210 $250 $290 $330
211 mgd $167 $200 $240 $280 $320 $360
308 mgd $182 $220 $270 $320 $370 $420308 mgd $182 $220 $270 $320 $370 $420
359 mgd $260 $310 $380 $450 $520 $590
400 mgd $273 $320 $390 $460 $530 $600
450 mgd $237 $280 $340 $400 $460 $520
450 mgd $237 $280 $340 $400 $460 $520
540 mgd $363 $430 $520 $610 $700 $790
563 mgd $358 $420 $510 $600 $690 $780
622 mgd $388 $460 $560 $660 $760 $860
1000 mgd $455 $540 $660 $780 $900 $1020
1250 mgd $554 $660 $800 $940 $1080 $1220
7182019 Basis of Cost Estimates
httpslidepdfcomreaderfullbasis-of-cost-estimates 6367
Detroit Water and Sewerage DepartmentBasis of Cost Estimates
September 2003 62
Table C-13Blower System Unit Cost
Capacity 2000 2010 2020 2030 2040 2050
170 mgd $718 $850 $1030 $1210 $1390 $1570
210 mgd $786 $930 $1130 $1330 $1530 $1730
317 mgd $1120 $1330 $1620 $1910 $2200 $2490
317 mgd $1120 $1330 $1620 $1910 $2200 $2490317 mgd $1060 $1260 $1530 $1800 $2070 $2340
462 mgd $7440 $8820 $10720 $12610 $14510 $16400
462 mgd $7440 $8820 $10720 $12610 $14510 $16400
539 mgd $7440 $8820 $10720 $12610 $14510 $16400
600 mgd $6430 $7630 $9270 $10910 $12550 $14180
675 mgd $8920 $10580 $12860 $15130 $17400 $19660
675 mgd $8840 $10480 $12740 $14990 $17240 $19480
810 mgd $8950 $10610 $12900 $15180 $17460 $19730
845 mgd $8600 $10200 $12400 $14590 $16780 $18960
933 mgd $8950 $10610 $12900 $15180 $17460 $19730
1500 mgd $6370 $7550 $9180 $10800 $12420 $14040
1875 mgd $7670 $9100 $11060 $13010 $14970 $16920
Table C-14Gravity Thickening Unit Cost
Capacity 2000 2010 2020 2030 2040 2050
113 mgd $278 $330 $400 $470 $540 $610
140 mgd $319 $380 $460 $540 $620 $700
211 mgd $693 $820 $1000 $1180 $1360 $1540
211 mgd $555 $660 $800 $940 $1080 $1220
211 mgd $396 $470 $570 $670 $770 $870
308 mgd $708 $840 $1020 $1200 $1380 $1560308 mgd $723 $860 $1050 $1240 $1430 $1620
359 mgd $609 $720 $880 $1040 $1200 $1360
400 mgd $581 $690 $840 $990 $1140 $1290
450 mgd $927 $1100 $1340 $1580 $1820 $2060
450 mgd $944 $1120 $1360 $1600 $1840 $2080
540 mgd $830 $980 $1190 $1400 $1610 $1820
563 mgd $768 $910 $1110 $1310 $1510 $1710
622 mgd $830 $980 $1190 $1400 $1610 $1820
1000 mgd $723 $860 $1050 $1240 $1430 $1620
1250 mgd $845 $1000 $1220 $1440 $1660 $1880
7182019 Basis of Cost Estimates
httpslidepdfcomreaderfullbasis-of-cost-estimates 6467
Detroit Water and Sewerage DepartmentBasis of Cost Estimates
September 2003 63
Table C-15Centrifugation Unit Cost
Capacity 2000 2010 2020 2030 2040 2050
113 mgd $2050 $2430 $2950 $3470 $3990 $4510
14 mgd $2440 $2890 $3510 $4130 $4750 $5370
211 mgd $2930 $3470 $4220 $4970 $5720 $6460
211 mgd $2220 $2630 $3200 $3770 $4340 $4900211 mgd $4160 $4930 $5990 $7050 $8110 $9160
308 mgd $2990 $3550 $4310 $5070 $5830 $6590
308 mgd $3040 $3610 $4390 $5170 $5950 $6720
359 mgd $6200 $7350 $8930 $10510 $12090 $13660
40 mgd $6150 $7290 $8860 $10430 $12000 $13560
45 mgd $4420 $5240 $6370 $7500 $8630 $9750
45 mgd $4500 $5340 $6490 $7640 $8790 $9930
54 mgd $9210 $10920 $13270 $15610 $17960 $20300
563 mgd $10700 $12690 $15420 $18140 $20870 $23580
622 mgd $11900 $14110 $17150 $20180 $23210 $26230
100 mgd $15000 $17790 $21620 $25440 $29260 $33060
125 mgd $17900 $21230 $25800 $30360 $34920 $39460
Table C-16Hauling and Landfilling Unit Cost
Capacity 2000 2010 2020 2030 2040 2050
113 mgd $438 $520 $630 $740 $850 $960
140 mgd $546 $650 $790 $930 $1070 $1210
211 mgd $1060 $1260 $1530 $1800 $2070 $2340
211 mgd $788 $930 $1130 $1330 $1530 $1730
211 mgd $810 $960 $1170 $1380 $1590 $1800
308 mgd $1090 $1290 $1570 $1850 $2130 $2410308 mgd $1100 $1300 $1580 $1860 $2140 $2420
359 mgd $1400 $1660 $2020 $2380 $2740 $3100
400 mgd $1370 $1620 $1970 $2320 $2670 $3020
450 mgd $1530 $1810 $2200 $2590 $2980 $3370
450 mgd $1560 $1850 $2250 $2650 $3050 $3450
540 mgd $2150 $2550 $3100 $3650 $4200 $4750
563 mgd $2030 $2410 $2930 $3450 $3970 $4490
622 mgd $2220 $2630 $3200 $3770 $4340 $4900
1000 mgd $2360 $2800 $3400 $4000 $4600 $5200
1250 mgd $2950 $3500 $4250 $5000 $5750 $6500
7182019 Basis of Cost Estimates
httpslidepdfcomreaderfullbasis-of-cost-estimates 6567
Detroit Water and Sewerage DepartmentBasis of Cost Estimates
September 2003 64
Appendix D
Wastewater Treatment Plant Ongoing Repair andReplacement Cost Estimates
7182019 Basis of Cost Estimates
httpslidepdfcomreaderfullbasis-of-cost-estimates 6667
Detroit Water and Sewerage DepartmentBasis of Cost Estimates
September 2003 65
SUMMARY OF CAPITAL IMPROVEMENT PROJECT COSTS
Explanation of Capital Improvement Costs
NOTE This analysis was provided by the staff of the Detroit Wastewater Partners (DWSDProject PC-744 - Wastewater Treatment Plant Upgrade) and DWSD Wastewater Plant staff Itwas completed in July 2003
General
1 Capital costs are presented by major process and non-process areas The project costsassume a major capital improvement project for the specified life cycle based on recent capitalimprovements performed under PC-744 other recent capital improvement projects (ie PC-740 PC-720 etc) and best engineering judgment The line items listed in each area areintended to provide a basis for the cost estimate to give an understanding of the level of costestimate assumptions used and items includednot included in the cost estimate It is unlikelyand not intended that the major capital projects would include all of the items listed at thespecified cycle Rather it is more likely that the overall cost would be broken into smallerprojects spread across a ~10 year period at the specified cycle
2 The percentages listed below were applied to each of the base construction costs Theseare similar to the percentages used in the Wastewater Master Plan (see Master Plan TechnicalMemo Basis of Cost Estimates dated August 15 2003)
- 30 Contingency (for miscellaneous items not included in the general cost estimate)
- 25 Contractor Overhead and Profit and General Conditions
- 20 Engineering Legal Administration and Management
3 Capital costs presented assume continued use of the existing processes in place at the
WWTP It does not assume major changes to the treatment process such as a new form ofprimary treatment or biological treatment The costs also do not include potentially newprocesses that may be required for regulatory or other reasons such as filtration of thesecondary effluent sludge digestion or major change to the type of effluent disinfection
4 Capital costs presented for each process area do not include maintenance related costs forroutine maintenance between the major capital improvement cycles It is assumed thatmaintenance activities will be performed on the equipment at the required frequencies tomaintain the equipment in good worknig order between major rehabilitation or replacementprojects
Link to Complete Spreadsheets is found on the Wastewater Master Plan
CD DWP Est of Capital Improvements for WWTP - 50-yrxls
7182019 Basis of Cost Estimates
httpslidepdfcomreaderfullbasis-of-cost-estimates 6767
Detroit Water and Sewerage DepartmentBasis of Cost Estimates
Table D1
SUMMARY OF CAPITAL IMPROVEMENT PROJECT COSTS
Area Life Cycle Start of Cycle 2003 Costs ($M)PROCESS RELATED
Pump Station No 1 20 2025 $ 63Pump Station No 2 20 2006 $ 66
Chemical Addition 20 2023 $ 9Rectangular Primary Clarifiers 20 2013 $ 86Circular Primary Clarifiers 20 2025 $ 84ILP Nos 1 2 3 4 7 20 2025 $ 29
Aeration Basins 20 2025 $ 55Cryo Plants 10 2015 $ 1Secondary Clarifiers 20 2020 $ 140SFE Pump Station 20 2010 $ 13
Chlorination 20 2022 $ 16
Dechlorination 20 2023 $ 12Hydraulic Structures 20 2020 $ 7Complex A and B 20 2025 $ 32
C-I Dewatering 15 2020 $ 31C-II Lower Level Dewatering 15 2019 $ 35C-II Upper Level Dewatering 15 2015 $ 42
C-I and C-II Incineration 15 2009 $ 139Sludge Offloading 20 2025 $ 19NON-PROCESS RELATED
AdminRagland Buildings 20 2025 $ 10Plant Security 10 2015 $ 10Plant-wide Paving 15 2020 $ 6Parking Structure 20 2025 $ 7Work Environment Improvements 10 2015 $ 5
Rehab of OampM Bldgs Warehouses 20 2007 $ 40Plant-wide Instrumentation 15 2020 $ 100General Electrical 20 2045 $ 29Plant-wide Secondary Water 15 2025 $ 6
Plant-wide Steam System 15 2023 $ 6Plant-wide Potable Water 15 2010 $ 2Plant -wide Drainage 15 2010 $ 2
Fire Protection Improvements 20 2006 $ 4Plant-Wide JOCs As-Needed Eng 1 2005 $ 3
Total $ 1107
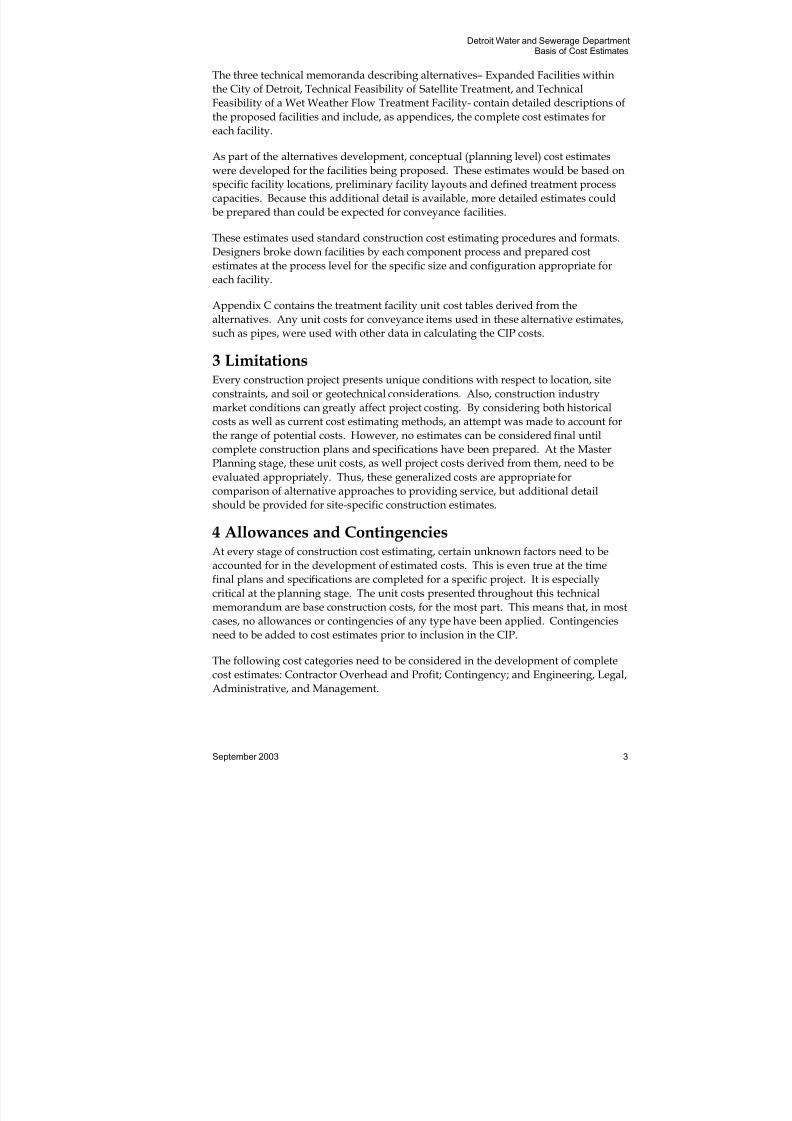
7182019 Basis of Cost Estimates
httpslidepdfcomreaderfullbasis-of-cost-estimates 3667
Detroit Water and Sewerage DepartmentBasis of Cost Estimates
September 2003 35
Table A-8CSO CIP Rollover Costs
Project Total Cost CIP RolloverCost
Upper Rouge River Complete CSO Facility $481000000 $362000000
City of Detroit Downspout Disconnects (current CIP runsthrough 2008 estimate for 2008 to 2050)
$208000000 $165000000
Oakwood Pump StationCSO Basin NA $86000000
LTCSO Program Management (current CIP runs through2008 estimate for 2008 to 2050)
NA $4759000
Pump Station Replacement Major RehabilitationPump Stations installation includes the capital cost of constructing a wastewaterpump station including all pumps and related equipment The CIP estimate does notreflect the replacement of any pump station as major rehabilitation is thought to be
adequate Tables A-9a shows the major rehabilitation estimate in unit cost x $1000per pump station dependent on the size of the station Table A-9b shows thebreakdown of these costs into low or high flow categories
Table A-9aPump Station Replacement Costs
Size 2000 Unit Cost 2003 Unit Cost
175 GPM
$65 $70
300 GPM
$65 $70
350 GPM
$65 $70
700 GPM
$85 $92
750 GPM
$90 $97
1250 GPM
$140 $151
1800 GPM
$190 $205
2400 GPM
$250 $269
4200 GPM
$395 $425
5700 GPM
$495 $533
18056 GPM $359
27778 GPM
$512
33333 GPM
$615
34722 GPM
$666
38889 GPM
$717
7182019 Basis of Cost Estimates
httpslidepdfcomreaderfullbasis-of-cost-estimates 3767
Detroit Water and Sewerage DepartmentBasis of Cost Estimates
September 2003 36
Size 2000 Unit Cost 2003 Unit Cost
49000 GPM
$1080 $2380
59722 GPM
$1127
66667 GPM $1229
78472 GPM
$1434
700000 GPM
$12000 $12920
Table A-9bPump Station Replacement Costs
Size 2003 Unit Cost
0 - 500 GPM $1567000
500 + GPM $20000000
7182019 Basis of Cost Estimates
httpslidepdfcomreaderfullbasis-of-cost-estimates 3867
Detroit Water and Sewerage DepartmentBasis of Cost Estimates
September 2003 37
Appendix B
Data Tables Not Used for CIP
7182019 Basis of Cost Estimates
httpslidepdfcomreaderfullbasis-of-cost-estimates 3967
Detroit Water and Sewerage DepartmentBasis of Cost Estimates
September 2003 38
Appendix B ndash Data Tables Not Used for CIPThe April 2002 version of this technical memo contained several tables that were notused for the actual CIP cost estimates for the WWMP The CIP either used differentdata sources or did not include the categories covered in these tables
B1 Alternate Data Category TablesB11 Chemical Grouting of JointsChemical Grouting of Joints consists of utilizing chemical products to eliminate leaksin pipe joints The estimate includes mobilization set up and furnishing of allincidentals The estimate is shown and is in unit cost per pipe joint All 2000 dataused for Table B-1 comes from historical sources from 1982 to 1999 and was escalatedto 2003 using the CCI
Table B-1Historical Chemical Grouting of Joints Costs
SizeSource UnitCostJoint Year
2003 Unit CostJoint(CCI) Source
Al l $6000 1985 $9580 1
$3500 1982 $6129 5
$2400 1988 $3557 8
$3500 1999 $3868 11
$3500 1996 $4171 13
Avg $5461
B12 SlipliningSliplining is considered to be a light rehabilitation method Sliplining installationincludes
Installation of HPDE Pipe into existing sewer pipe Excavation and backfill of insertion pits in common earth Annular space grouting Mobilization Sewer preparation And furnishing of all incidentals
The service life of Sliplining is 50 years Sizes are the ID of the Slipliner pipe forexample to reline a 20rdquo sewer use the cost for the 16rdquo Slipliner The estimate in TableB-2 is unit cost x $1000 per mile of installation
7182019 Basis of Cost Estimates
httpslidepdfcomreaderfullbasis-of-cost-estimates 4067
Detroit Water and Sewerage DepartmentBasis of Cost Estimates
September 2003 39
Table B-2Sliplining Costs
Size 2003 UnitCost Mile
4rdquo $20
6rdquo $50
8rdquo $90
10rdquo $130
12rdquo $190
14rdquo $230
16rdquo $290
18rdquo $370
20rdquo $460
22rdquo $56024rdquo $660
26rdquo $780
28rdquo $900
30rdquo $1040
32rdquo $1180
36rdquo $1490
42rdquo $2030
48rdquo $2650
52rdquo $3060
54rdquo $3360
B13 Sewer Pipe ReplacementIt has been determined that the improvements to the DWSD sewer system would notinclude the replacement of any sewer pipes However the costs for the constructionof new sewers were investigated The results of this investigation follow Note thatthe costs included in these tables (Table B-3 through B-13) are the recommended costsfrom Table 51-1
Ductile Iron Force Main
Ductile Iron Force Main installation includes
Cement lined ductile iron pipe (6-24) Excavation and backfill of common earth 3 ndash 35 feet of cover to crown of the pipe Minimum utility relocation Up to 6rdquo of bituminous pavement removal and replacement Furnishing of all incidentals
7182019 Basis of Cost Estimates
httpslidepdfcomreaderfullbasis-of-cost-estimates 4167
Detroit Water and Sewerage DepartmentBasis of Cost Estimates
September 2003 40
Table B-3 shows the ductile iron force main installation estimate in unit cost x $1000per mile of pipe installation escalated using the CCI The service life of ductile ironforce mains is 30 years
Table B-3Historical New Ductile Iron Force Main Installation Costs
Size
SourceUnitCostLF Year 2003 Unit CostLF (CCI) Source
4 $1000 1985 $1597 1
$1500 1985 $2395 1
Avg $1996
6 $1600 1985 $2555 1
$1900 1985 $3034 1
$2700 2000 $2907 10
$1840 1971 $7795 14
$1600 1971 $6778 14
Avg $4614
8 $3000 2000 $3230 10
Avg $3230
10 $3300 2000 $3553 10
Avg $3553
12 $3700 2000 $3984 10
$1600 1971 $6778 14
$2800 1990 $3963 16
Avg $4909
14 $4100 2000 $4414 10
Avg $4414
16 $4500 2000 $4845 10
Avg $4845
7182019 Basis of Cost Estimates
httpslidepdfcomreaderfullbasis-of-cost-estimates 4267
Detroit Water and Sewerage DepartmentBasis of Cost Estimates
September 2003 41
Size
SourceUnitCostLF Year 2003 Unit CostLF (CCI) Source
18 $4200 1990 $5945 16
Avg $5945
20 $5300 2000 $5706 10
$4750 1971 $20124 14
Avg $12915
24 $6000 2000 $6460 10
Avg $6460
48 $10700 2000 $11520 10
Avg $11520
Service Leads Service Lead installation includes
6 SDR 35 PVC pipe and fittings Excavation and backfill of common earth Min 4rsquo cover to crown of the pipe Tie-in to existing sewer Reseeding
Furnishing of all incidentals
Table B-4 shows the estimate for service lead installation in unit cost per foot of pipewith the historical data escalated using the CCI The service life of service leads is 25years
Table B-4Historical New Service Lead Installation Costs
SizeSource unitCostLF Year
2003 Unit CostLF(CCI) Source
6 $1400 1971 $5931 14
$1560 1971 $6609 14
Avg $6270
7182019 Basis of Cost Estimates
httpslidepdfcomreaderfullbasis-of-cost-estimates 4367
Detroit Water and Sewerage DepartmentBasis of Cost Estimates
September 2003 42
Sanitary Laterals
Sanitary Lateral installation includes
Plain concrete pipe (8-12)
Excavation and backfill of common earth including trench shield or box 48rdquo diameter manholes at 300 feet Minimum utility relocation Up to 6rdquo of bituminous pavement removal and replacement Furnishing of all incidentals
Table B-5 shows the estimate for sanitary laterals in unit cost x $1000 per mile of pipeinstallation with the historical data escalated using the CCI The service life ofsanitary laterals is 50 years
Table B-5
Historical New Sanitary Lateral Installation Costs
SizeSource UnitCostLF Year
2003 Unit CostLF(CCI) Source
8 $2250 1985 $3592 1
$3500 1999 $3868 6
$2900 1971 $12286 14
$2600 1971 $11015 14
$2540 1971 $10761 14
$3260 1971 $13811 14
$3500 1990 $4954 16
$3500 1990 $4954 19
Avg $7706
10 $2400 1985 $3832 1
$2500 1985 $3992 1
$4000 1999 $4421 6
$5600 2000 $6029 10
$3000 1971 $12710 14
$5700 1971 $24148 14
Avg $9189
12 $5500 1999 $6079 6
$4500 1990 $6370 16
Avg $6224
7182019 Basis of Cost Estimates
httpslidepdfcomreaderfullbasis-of-cost-estimates 4467
Detroit Water and Sewerage DepartmentBasis of Cost Estimates
September 2003 43
Storm and Combined LateralsStorm and combined lateral installation includes
Reinforced concrete pipe (12-24) Excavation and backfill of common earth Sheeting shoring and bracing Trench shield or box at 8rsquo 48rdquo Diameter manholes at 300 feet Min bury to the crown of the pipe as listed below Minimum utility relocation Up to 6rdquo of bituminous pavement removal and replacement And furnishing of all incidentals
Tables B-6 shows the estimates for storm and combined laterals in unit cost x $1000per mile of pipe installation at various depths with the historical data escalated usingthe CCI However the depth of installation is unknown The service life of storm andcombined laterals is 50 years
Table B-6Historical New Storm and Combined Lateral Installation Costs
SizeSource Unit
CostLF Year2003 Unit CostLF
(CCI) Source
12 $2500 1985 $3992 1
$3000 1985 $4790 1
$4500 1989 $6531 9
$6100 2000 $6568 10
$4350 1971 $18429 14
$3900 1971 $16523 14
$2700 1990 $3822 16
$4890 1971 $20717 14
$4500 1990 $6370 16
$4500 1990 $6370 19
$2700 1990 $3822 19
Avg $8161
15 $2750 1985 $4391 1$6700 2000 $7214 10
$4900 1971 $20759 14
$3375 1990 $4777 16
$5625 1990 $7962 16
$3375 1990 $4777 19
7182019 Basis of Cost Estimates
httpslidepdfcomreaderfullbasis-of-cost-estimates 4567
Detroit Water and Sewerage DepartmentBasis of Cost Estimates
September 2003 44
SizeSource Unit
CostLF Year2003 Unit CostLF
(CCI) Source
15 $5625 1990 $7962 19
$3100 1999 $3426 11
Avg $6808
18 $3000 1985 $4790 1
$7300 2000 $7860 10
$3255 1990 $4607 16
$4050 1990 $5733 16
$4050 1990 $5733 19
$6750 1990 $9554 19
Avg $6379
21 $8000 2000 $8613 10
$5200 1971 $22030 14
$4800 1971 $20335 14
$4700 1971 $19912 14
$4725 1990 $6688 16
$4720 1990 $6681 19
Avg $14043
24 $8800 2000 $9475 10
$5400 1971 $22877 14
$5060 1971 $21437 14
$4430 1990 $6271 16
$5400 1990 $7644 19
$5400 1990 $7644 16
Avg $12558
Trunk SewersTrunk Sewer installation includes
Reinforced concrete pipe (27-66) Excavation and backfill of common earth Sheeting shoring and bracing Manholes at 300 feet Diameters as follows
o Pipe size 27rdquo ndash 36rdquo 60rdquo diameter manholes
7182019 Basis of Cost Estimates
httpslidepdfcomreaderfullbasis-of-cost-estimates 4667
Detroit Water and Sewerage DepartmentBasis of Cost Estimates
September 2003 45
o Pipe size 42rdquo- 48rdquo 72rdquo diameter manholeso Pipe size 54rdquo ndash 66rdquo 84rdquo diameter manholes
Min bury to the crown of the pipe as listed below Minimum utility relocation Up to 6rdquo of bituminous pavement removal and replacement And furnishing of all incidentals
Table B-7 shows the estimates in unit cost x $1000 per mile of pipe installation atvarious depths with the historical data escalated using the CCI However the depthof installation is unknown The service life of trunk sewers is 50 years
Table B-7Historical New Trunk Sewer Installation Costs
Size Source Unit CostLF Year 2003 Unit CostLF (CCI) Source
27 $9600 2000 $10336 10
$5000 1971 $21183 14
Avg $15759
30 $10400 2000 $11197 10
$13500 1996 $16090 13
Avg $13643
36 $9300 1982 $16285 5
$27500 1998 $31114 3
$27500 1997 $31621 7$27000 1999 $29843 11
$14500 1996 $17281 13
Avg $25229
42 $29000 1997 $33346 7
$33000 1999 $36474 11
$13200 2000 $14212 10
Avg $28011
48 $30000 1997 $34496 7
$28500 1999 $31500 11
Avg $32998
Size Source Unit CostLF Year 2003 Unit CostLF (CCI) Source
54 $31000 1997 $35646 7
7182019 Basis of Cost Estimates
httpslidepdfcomreaderfullbasis-of-cost-estimates 4767
Detroit Water and Sewerage DepartmentBasis of Cost Estimates
September 2003 46
Avg $35646
60 $34000 1997 $39096 7
Avg $39096
66 $47000 1998 $53177 3
$50000 1998 $56571 3
Avg $54874
Interceptors TunnelsInterceptor tunnel installation includes
Reinforced concrete pipe (78-120) Excavation and backfill of common earth Sheeting shoring and bracing 8rsquo Diameter manholes at 600 feet Min bury to the crown of the pipe as listed below Minimum utility relocation Up to 6rdquo of bituminous pavement removal and replacement And furnishing of all incidentals
Table B-8 shows the estimates in unit cost x $1000 per mile of pipe installation atvarious depths with the historical data escalated using the CCI However the depthof installation is unknown The service life of interceptors tunnels is 50 years
Table B-8Historical New Interceptors Tunnels Installation Costs
Size Source Unit CostLF Year 2003 Unit CostLF (CCI) Source
78 $60000 1998 $67885 3
Avg $67885
84 $62000 1998 $70148 3
Avg $70148
96 $70000 1998 $79199 3
Avg $79199
Size Source Unit CostLF Year 2003 Unit CostLF (CCI) Source
102 $75000 1998 $84856 3
7182019 Basis of Cost Estimates
httpslidepdfcomreaderfullbasis-of-cost-estimates 4867
Detroit Water and Sewerage DepartmentBasis of Cost Estimates
September 2003 47
Avg $84856
108 80000 1998 $90514 3
Avg $90514
120 $90000 1985 $143700 1
Avg $143700
B14 Miscellaneous RepairsThis cost estimating technical memorandum reviewed the costs for various sewersystem repairs that were not scheduled or included in the WWMP CIP developmentThis section contains the results of this repair cost review
Sump Pump Disconnection
Sump Pump Disconnection consists of removal of sump valves electrical connectionsand restoration These costs in unit cost per connection are estimated at $6720 in2000 dollars
Root Control
Root Control consists of utilizing chemical methods The estimate includesmobilization set up and furnishing of all incidentals Table B-9 shows the estimate inunit cost per linear foot of pipe with the historical data escalated using the CCI
Table B-9Historical Root Control Costs
SizeSource Unit
CostLF Year 2003 Unit CostLF (CCI) Source
Al l $200 1982 $350 5
$200 1988 $296 8
$140 1989 $203 9
$200 2000 $215 20
$225 2000 $242 20
$275 2000 $296 20
Avg $267
B15 Historical ReferencesShown on each spreadsheet is a reference code to the source of individual unit pricesTable B-10 shows the references used for the historical estimates in Appendices A andB
7182019 Basis of Cost Estimates
httpslidepdfcomreaderfullbasis-of-cost-estimates 4967
Detroit Water and Sewerage DepartmentBasis of Cost Estimates
September 2003 48
Table B-10Historical References
Source Title Date
1 Unidentified CDM Documents 1985
2Beaconsfield Relief Sewer Cleaning Manholes Inspection forSouth Macomb Sanitary District 1999
3 SOCSDS Project Plan 1998
4 Cost Effective Analysis 1998
5 Grosse Pointe Infrastructure 1982
6 City of Rochester Hills SDA 1999
7 HRC Detailed Cost Estimates 1997
8 Beverly Hills Local Sewer Study Rehabilitation Program 1988
9 Unidentified CDM Documents 1989
10 Unidentified Construction Cost Estimate
11 South Macomb Sanitary District 1999
12 City of Rochester Hills Sanitary Sewer Evaluation Survey 1996
13 South Macomb Sanitary District Appendix J 1996
14 Clinton-Oakland Sewage Disposal System 1971
15 City of Hazel Park MI
16 Farmington MI Sewer Seperation Improvements 1990
17 Basic Requirements Report Evergreen-Farmington Relief 1985
18 Cost Estimate 1975
19 Pre-Rehabilitation Local Sewer Costs 1990
20 Ann Arbor SSO Prevention Task Force 2000
B16 Means and Manufacturersrsquo EstimatesThe calculation of construction costs using the RW Means methodology requiresprices for component materials and construction activities (ie excavation orbackfilling) The following table presents the component costs used in the
development of construction cost guidelines
7182019 Basis of Cost Estimates
httpslidepdfcomreaderfullbasis-of-cost-estimates 5067
Detroit Water and Sewerage DepartmentBasis of Cost Estimates
September 2003 49
Table B-11Component Costs for Means and Manufacturersrsquo Estimates
Item Size Description Unit Cost Units Source
Excavation
Excavation common earth hauling
away fill up to 4 mi $1549 CY Means
BackfillCommon earth front-end loaderCompaction 12 lifts $882 CY Means
Select FillCrushed bank run gravelcompaction 6 lifts $2650 CY Means
Sheeting 8 DeepWood solid sheeting incl Walesbraces and spacers Drive amp Extract $668 SF Means
16 DeepWood solid sheeting incl Walesbraces and spacers Drive amp Extract $876 SF Means
24 DeepWood solid sheeting incl Walesbraces and spacers Drive amp Extract $1074 SF Means
32 DeepWood solid sheeting incl Walesbraces and spacers Drive amp Extract $1199 SF Means
Pavement Removal Bituminous 4 to 6 thick $572 SY Means
Saw Cutting Asphalt 6 thick $281 LF Means
Pavement Replacement Over Trench 6 thick $4333 SY Means
Non-Reinforced ConcretePipe 8 Bell and Spigot Joints Extra strength $1231 LF Means
10 Bell and Spigot Joints Extra strength $1305 LF Means
12 Bell and Spigot Joints Extra strength $1480 LF Means
Reinforced Concrete Pipe 12
Class 3 BampS or TampG Joints
wgaskets $1890 LF Means
15Class 3 BampS or TampG Jointswgaskets $2167 LF Means
18Class 3 BampS or TampG Jointswgaskets $2536 LF Means
7182019 Basis of Cost Estimates
httpslidepdfcomreaderfullbasis-of-cost-estimates 5167
Detroit Water and Sewerage DepartmentBasis of Cost Estimates
September 2003 50
Item Size Description Unit Cost Units Source
Reinforced Concrete Pipe 21Class 3 BampS or TampG Joints wogaskets $3135 LF Means
24Class 3 BampS or TampG Jointswgaskets $3504 LF Means
27Class 3 BampS or TampG Joints wogaskets $5302 LF Means
30Class 3 BampS or TampG Jointswgaskets $6592 LF Means
36Class 3 BampS or TampG Jointswgaskets $8990 LF Means
42
Class 3 BampS or TampG Joints wo
gaskets $9220 LF Means
48Class 3 BampS or TampG Jointswgaskets $13185 LF Means
54Class 3 BampS or TampG Jointswgaskets $14845 LF Means
60Class 3 BampS or TampG Joints wogaskets $16504 LF Means
66Class 3 BampS or TampG Joints wogaskets $23004 LF Means
72Class 3 BampS or TampG Jointswgaskets $29504 LF Means
78Class 3 BampS or TampG Joints wogaskets $32500 LF Means
84Class 3 BampS or TampG Joints wogaskets $35497 LF Means
96Class 3 BampS or TampG Jointswgaskets $43795 LF Means
102
Class 3 BampS or TampG Joints wo
gaskets $46000 LF Means
108Class 3 BampS or TampG Joints wogaskets $48300 LF Means
120Class 3 BampS or TampG Joints wogaskets $53000 LF Means
7182019 Basis of Cost Estimates
httpslidepdfcomreaderfullbasis-of-cost-estimates 5267
Detroit Water and Sewerage DepartmentBasis of Cost Estimates
September 2003 51
Item Size Description Unit Cost Units Source
Ductile Iron Pipe 4 Class 50 Cement Lined Mech Joint $1982 LF Means
6 Class 50 Cement Lined Mech Joint $2305 LF Means
8 Class 50 Cement Lined Mech Joint $2812 LF Means
10 Class 50 Cement Lined Mech Joint $3458 LF Means
12 Class 50 Cement Lined Mech Joint $4103 LF Means
14 Class 50 Cement Lined Mech Joint $4656 LF Means
16 Class 50 Cement Lined Mech Joint $5670 LF Means
18 Class 50 Cement Lined Mech Joint $6731 LF Means
20 Class 50 Cement Lined Mech Joint $7745 LF Means
24 Class 50 Cement Lined Mech Joint $9958 LF Means
48 Class 50 Cement Lined Mech Joint $23234 LF Est
PVC Pipe (SDR35) 6 SDR 35 BampS $512 LF Means
6 SDR 35 BampS 45 Degree Bend $7376 LF Means
HDPEPipe for Sliplining 4HDPE Pipe PE3408 DR21 (80 psi)price installed $442 LF Manufact
6HDPE Pipe PE3408 DR21 (80 psi)price installed $958 LF Manufact
8
HDPE Pipe PE3408 DR21 (80 psi)
price installed $1623 LF Manufact
10HDPE Pipe PE3408 DR21 (80 psi)price installed $2521 LF Manufact
12HDPE Pipe PE3408 DR21 (80 psi)price installed $3547 LF Manufact
7182019 Basis of Cost Estimates
httpslidepdfcomreaderfullbasis-of-cost-estimates 5367
Detroit Water and Sewerage DepartmentBasis of Cost Estimates
September 2003 52
Item Size Description Unit Cost Units Source
HDPEPipe for Sliplining 14HDPE Pipe PE3408 DR21 (80 psi)price installed $4276 LF Manufact
16HDPE Pipe PE3408 DR21 (80 psi)price installed $5586 LF Manufact
18HDPE Pipe PE3408 DR21 (80 psi)price installed $7069 LF Manufact
20HDPE Pipe PE3408 DR21 (80 psi)price installed $8728 LF Manufact
22HDPE Pipe PE3408 DR21 (80 psi)price installed $10560 LF Manufact
24
HDPE Pipe PE3408 DR21 (80 psi)
price installed $12567 LF Manufact
26HDPE Pipe PE3408 DR21 (80 psi)price installed $14749 LF Manufact
28HDPE Pipe PE3408 DR21 (80 psi)price installed $17106 LF Manufact
30HDPE Pipe PE3408 DR21 (80 psi)price installed $19637 LF Manufact
32HDPE Pipe PE3408 DR21 (80 psi)price installed $22342 LF Manufact
36HDPE Pipe PE3408 DR21 (80 psi)price installed $28277 LF Manufact
42HDPE Pipe PE3408 DR21 (80 psi)price installed $38488 LF Manufact
48HDPE Pipe PE3408 DR21 (80 psi)price installed $50270 LF Manufact
52HDPE Pipe PE3408 DR21 (80 psi)price installed $57869 LF Manufact
54
HDPE Pipe PE3408 DR21 (80 psi)
price installed $63623 LF Manufact
Manholes 4 DiaPrecast Concrete not incl Excavbackfill frame cover sheeting $17979 VLF Means
5 DiaPrecast Concrete not incl Excavbackfill frame cover sheeting $18809 VLF Means
7182019 Basis of Cost Estimates
httpslidepdfcomreaderfullbasis-of-cost-estimates 5467
Detroit Water and Sewerage DepartmentBasis of Cost Estimates
September 2003 53
Item Size Description Unit Cost Units Source
Manholes 6 DiaPrecast Concrete not incl Excavbackfill frame cover sheeting $28582 VLF Means
7 DiaPrecast Concrete not incl Excavbackfill frame cover sheeting $38355 VLF Means
8 DiaPrecast Concrete not incl Excavbackfill frame cover sheeting $48128 VLF Means
B17 Meanrsquos Unit Cost Estimates
Table B-12 contains a sample estimating sheet for calculating each component costusing the material and labor costs identified in the previous section
7182019 Basis of Cost Estimates
httpslidepdfcomreaderfullbasis-of-cost-estimates 5567
Detroit Water and Sewerage DepartmentBasis of Cost Estimates
September 2003 54
Table B-12Sample Component Costs Estimator
Quick Sewer Estimator
Force Mains
Dimensions
Pipe Size 14 in
Trench Width 4 Ft not less than 32
Trench Depth 6 Ft
Length 1 Ft
Material Costs
Pipe CostLF 66 $LF
Excav CostCY 13 $CYBackfill Cost CY 10 $CY
Select Fill CostCY 12 $CY
Pavament DemoCost SY 7 $SY
New Pavement Cost SY 29 $SY
Saw Cut Per LF 4 $LF
Sheeting Cost SF 0 $SF
May not be required for excavations under 5 deep
Pavement A (sy)= 044
Vexcav (cy) = Vbfill (cy) =
089 049
Hbfill (ft)
Sheeting (sf) Common Fill 333333
12
Vsfill (cy) =
036 Hsfill (ft)
Select Fill 266667
W (ft) = 4
Total Costs
7182019 Basis of Cost Estimates
httpslidepdfcomreaderfullbasis-of-cost-estimates 5667
Detroit Water and Sewerage DepartmentBasis of Cost Estimates
September 2003 55
Pipe $6600
Excav $622
Backfill $494
Select Fill $427
Pavement Demo $311New Pavement $1289
Saw Cut $800
Sheeting Cost $000
Total Price $10543
Price Per Foot $10543 LF
7182019 Basis of Cost Estimates
httpslidepdfcomreaderfullbasis-of-cost-estimates 5767
Detroit Water and Sewerage DepartmentBasis of Cost Estimates
September 2003 56
Appendix C
Unit Costs for Treatment Facilities
7182019 Basis of Cost Estimates
httpslidepdfcomreaderfullbasis-of-cost-estimates 5867
Detroit Water and Sewerage DepartmentBasis of Cost Estimates
September 2003 57
Appendix C ndash Unit Costs for Treatment FacilitiesThe following tables outline the unit costs for treatment facilities derived from projectcost estimates These unit costs are provided for future estimating of these facilitiesand are the total cost X 1000 They are base construction costs only and do notinclude engineering fees allowances or contingencies
Table C-1Influent Pump Station Unit Cost
Capacity 2000 2010 2020 2030 2040 2050
394 mgd $1960 $2320 $2820 $3320 $3820 $4320
400 mgd $3810 $4520 $5490 $6460 $7430 $8400
491 mgd $2060 $2440 $2970 $3490 $4010 $4530
615 mgd $2510 $2980 $3620 $4260 $4900 $5540
615 mgd $2510 $2980 $3620 $4260 $4900 $5540
615 mgd $3050 $3620 $4400 $5180 $5960 $6740
619 mgd $3150 $3740 $4550 $5350 $6150 $6950
860 mgd $4440 $5270 $6410 $7540 $8670 $9800
1040 mgd $5940 $7040 $8560 $10070 $11580 $13090
1080 mgd $3790 $4490 $5460 $6420 $7380 $8340
1130 mgd $6090 $7220 $8780 $10330 $11880 $13420
1260 mgd $4510 $5350 $6500 $7650 $8800 $9940
1580 mgd $6020 $7140 $8680 $10210 $11740 $13270
1890 mgd $6350 $7530 $9150 $10770 $12390 $14000
2535 mgd $7030 $8340 $10140 $11930 $13720 $15500
3105 mgd $7030 $8340 $10140 $11930 $13720 $15500
Table C-2
Screening and Grit Chamber Unit Cost Capacity 2000 2010 2020 2030 2040 2050
116 mgd $1530 $1810 $2200 $2590 $2980 $3370
143 mgd $2030 $2410 $2930 $3450 $3970 $4490
216 mgd $2210 $2620 $3180 $3740 $4300 $4860
221 mgd $3490 $4140 $5030 $5920 $6810 $7700
226 mgd $3490 $4140 $5030 $5920 $6810 $7700
322 mgd $4500 $5340 $6490 $7640 $8790 $9930
322 mgd $4500 $5340 $6490 $7640 $8790 $9930
368 mgd $3240 $3840 $4670 $5490 $6320 $7140
409 mgd $3700 $4390 $5340 $6280 $7220 $8160
471 mgd $6190 $7340 $8920 $10500 $12080 $13650471 mgd $5940 $7040 $8560 $10070 $11580 $13090
554 mgd $4520 $5360 $6510 $7660 $8810 $9960
576 mgd $5190 $6160 $7490 $8810 $10130 $11450
636 mgd $5600 $6640 $8070 $9500 $10930 $12350
1000 mgd $9770 $11590 $14090 $16580 $19070 $21550
1250 mgd $11300 $13400 $16290 $19170 $22050 $24920
7182019 Basis of Cost Estimates
httpslidepdfcomreaderfullbasis-of-cost-estimates 5967
Detroit Water and Sewerage DepartmentBasis of Cost Estimates
September 2003 58
Table C-3 Aeration Bas in wi th Nit ri ficat ion Unit Cost
Capacity 2000 2010 2020 2030 2040 2050
113 mgd $10400 $12330 $14990 $17640 $20290 $22930
140 mgd $11200 $13280 $16140 $18990 $21840 $24680
211 mgd $17300 $20520 $24940 $29350 $33760 $38150
211 mgd $17300 $20520 $24940 $29350 $33760 $38150211 mgd $16000 $18980 $23070 $27150 $31230 $35290
308 mgd $22600 $26800 $32570 $38320 $44080 $49810
308 mgd $22600 $26800 $32570 $38320 $44080 $49810
359 mgd $24200 $28700 $34880 $41040 $47210 $53350
400 mgd $22600 $26800 $32570 $38320 $44080 $49810
450 mgd $32300 $38310 $46560 $54780 $63010 $71200
450 mgd $31800 $37710 $45830 $53930 $62040 $70110
540 mgd $35300 $41860 $50880 $59870 $68870 $77830
563 mgd $36800 $43640 $53040 $62410 $71790 $81130
622 mgd $39300 $46610 $56650 $66660 $76680 $86650
Table C-4Primary Clarifiers Unit Cost
Capacity 2000 2010 2020 2030 2040 2050
116 mgd $1530 $1810 $2200 $2590 $2980 $3370
143 mgd $2030 $2410 $2930 $3450 $3970 $4490
216 mgd $2210 $2620 $3180 $3740 $4300 $4860
221 mgd $3490 $4140 $5030 $5920 $6810 $7700
226 mgd $3490 $4140 $5030 $5920 $6810 $7700
322 mgd $4500 $5340 $6490 $7640 $8790 $9930
322 mgd $4500 $5340 $6490 $7640 $8790 $9930
368 mgd $3240 $3840 $4670 $5490 $6320 $7140
409 mgd $3700 $4390 $5340 $6280 $7220 $8160
471 mgd $6190 $7340 $8920 $10500 $12080 $13650
471 mgd $5940 $7040 $8560 $10070 $11580 $13090
554 mgd $4520 $5360 $6510 $7660 $8810 $9960
576 mgd $5190 $6160 $7490 $8810 $10130 $11450
636 mgd $5600 $6640 $8070 $9500 $10930 $12350
1000 mgd $9770 $11590 $14090 $16580 $19070 $21550
1250 mgd $11300 $13400 $16290 $19170 $22050 $24920
Table C-5Complete Mix Activated Sludge Unit Cost
Capacity 2000 2010 2020 2030 2040 2050
100 mgd $21800 $25850 $31420 $36970 $42530 $48060
125 mgd $25300 $30000 $36460 $42900 $49350 $55770
7182019 Basis of Cost Estimates
httpslidepdfcomreaderfullbasis-of-cost-estimates 6067
Detroit Water and Sewerage DepartmentBasis of Cost Estimates
September 2003 59
Table C-6Iron Feed System Unit Cost
Capacity 2000 2010 2020 2030 2040 2050
113 mgd $152 $180 $220 $260 $300 $340
140 mgd $152 $180 $220 $260 $300 $340
211 mgd $152 $180 $220 $260 $300 $340
211 mgd $152 $180 $220 $260 $300 $340211 mgd $152 $180 $220 $260 $300 $340
308 mgd $156 $190 $230 $270 $310 $350
308 mgd $156 $190 $230 $270 $310 $350
359 mgd $175 $210 $260 $310 $360 $410
400 mgd $164 $190 $230 $270 $310 $350
450 mgd $182 $220 $270 $320 $370 $420
450 mgd $182 $220 $270 $320 $370 $420
540 mgd $208 $250 $300 $350 $400 $450
563 mgd $189 $220 $270 $320 $370 $420
622 mgd $197 $230 $280 $330 $380 $430
1000 mgd $205 $240 $290 $340 $390 $440
1250 mgd $225 $270 $330 $390 $450 $510
Table C-7Coagulation-Flocculation Unit Cost
Capacity 2000 2010 2020 2030 2040 2050
100 mgd $19700 $23360 $28390 $33410 $38430 $43430
125 mgd $24100 $28580 $34740 $40880 $47020 $53130
Table C-8Secondary Clarifiers Unit Cost
Capacity 2000 2010 2020 2030 2040 2050
113 mgd $3050 $3620 $4400 $5180 $5960 $6740140 mgd $3800 $4510 $5480 $6450 $7420 $8380
211 mgd $4430 $5250 $6380 $7510 $8640 $9760
211 mgd $4430 $5250 $6380 $7510 $8640 $9760
211 mgd $4870 $5780 $7030 $8270 $9510 $10750
308 mgd $5800 $6880 $8360 $9840 $11320 $12790
308 mgd $5800 $6880 $8360 $9840 $11320 $12790
359 mgd $7120 $8440 $10260 $12070 $13880 $15680
400 mgd $6280 $7450 $9050 $10650 $12250 $13840
450 mgd $8070 $9570 $11630 $13680 $15740 $17790
450 mgd $8070 $9570 $11630 $13680 $15740 $17790
540 mgd $10400 $12330 $14990 $17640 $20290 $22930
563 mgd $11500 $13640 $16580 $19510 $22440 $25360
622 mgd $12400 $14710 $17880 $21040 $24200 $27350
1000 mgd $13700 $16250 $19750 $23240 $26730 $30210
1250 mgd $15200 $18030 $21910 $25780 $29650 $33510
7182019 Basis of Cost Estimates
httpslidepdfcomreaderfullbasis-of-cost-estimates 6167
Detroit Water and Sewerage DepartmentBasis of Cost Estimates
September 2003 60
Table C-9Intermediate Pumping Unit Cost
Capacity 2000 2010 2020 2030 2040 2050
253 mgd $734 $870 $1060 $1250 $1440 $1630
350 mgd $1060 $1260 $1530 $1800 $2070 $2340
400 mgd $1220 $1450 $1760 $2070 $2380 $2690
446 mgd $1380 $1640 $1990 $2340 $2690 $3040452 mgd $1410 $1670 $2030 $2390 $2750 $3110
529 mgd $1680 $1990 $2420 $2850 $3280 $3710
611 mgd $1680 $1990 $2420 $2850 $3280 $3710
669 mgd $1860 $2210 $2690 $3170 $3650 $4120
743 mgd $2090 $2480 $3010 $3540 $4070 $4600
849 mgd $2430 $2880 $3500 $4120 $4740 $5360
942 mgd $2470 $2930 $3560 $4190 $4820 $5450
1040 mgd $2770 $3290 $4000 $4710 $5420 $6120
1050 mgd $2810 $3330 $4050 $4770 $5490 $6200
1130 mgd $3040 $3610 $4390 $5170 $5950 $6720
Table C-10Filtration Unit Cost
Capacity 2000 2010 2020 2030 2040 2050
113 mgd $3930 $4660 $5660 $6660 $7660 $8660
140 mgd $5040 $5980 $7270 $8550 $9830 $11110
211 mgd $6210 $7360 $8950 $10530 $12110 $13680
211 mgd $6220 $7380 $8970 $10550 $12140 $13720
308 mgd $7900 $9370 $11390 $13400 $15410 $17410
359 mgd $8440 $10010 $12170 $14320 $16470 $18610
400 mgd $9190 $10900 $13250 $15590 $17930 $20260
450 mgd $10400 $12330 $14990 $17640 $20290 $22930
540 mgd $11800 $13990 $17000 $20000 $23010 $26000563 mgd $12200 $14470 $17590 $20700 $23810 $26910
622 mgd $13500 $16010 $19460 $22900 $26340 $29770
7182019 Basis of Cost Estimates
httpslidepdfcomreaderfullbasis-of-cost-estimates 6267
Detroit Water and Sewerage DepartmentBasis of Cost Estimates
September 2003 61
Table C-11Ultraviolet Disinfection Unit Cost
Capacity 2000 2010 2020 2030 2040 2050
259 mgd $912 $1080 $1310 $1540 $1770 $2000
351 mgd $1280 $1520 $1850 $2180 $2510 $2840
400 mgd $1530 $1810 $2200 $2590 $2980 $3370
452 mgd $2040 $2420 $2940 $3460 $3980 $4500452 mgd $3310 $3930 $4780 $5620 $6460 $7300
452 mgd $1750 $2080 $2530 $2980 $3430 $3880
619 mgd $1750 $2080 $2530 $2980 $3430 $3880
619 mgd $2280 $2700 $3280 $3860 $4440 $5020
679 mgd $2550 $3020 $3670 $4320 $4970 $5620
860 mgd $3830 $4540 $5520 $6500 $7480 $8450
860 mgd $3060 $3630 $4410 $5190 $5970 $6750
956 mgd $3400 $4030 $4900 $5770 $6640 $7500
1036 mgd $3830 $4540 $5520 $6500 $7480 $8450
1126 mgd $4100 $4860 $5910 $6950 $7990 $9030
1750 mgd $8270 $9810 $11920 $14030 $16140 $18240
2000 mgd $8620 $10220 $12420 $14610 $16810 $19000
Table C-12Post Aeration Unit Cost
Capacity 2000 2010 2020 2030 2040 2050
113 mgd $114 $140 $170 $200 $230 $260
140 mgd $134 $160 $190 $220 $250 $280
211 mgd $142 $170 $210 $250 $290 $330
211 mgd $142 $170 $210 $250 $290 $330
211 mgd $167 $200 $240 $280 $320 $360
308 mgd $182 $220 $270 $320 $370 $420308 mgd $182 $220 $270 $320 $370 $420
359 mgd $260 $310 $380 $450 $520 $590
400 mgd $273 $320 $390 $460 $530 $600
450 mgd $237 $280 $340 $400 $460 $520
450 mgd $237 $280 $340 $400 $460 $520
540 mgd $363 $430 $520 $610 $700 $790
563 mgd $358 $420 $510 $600 $690 $780
622 mgd $388 $460 $560 $660 $760 $860
1000 mgd $455 $540 $660 $780 $900 $1020
1250 mgd $554 $660 $800 $940 $1080 $1220
7182019 Basis of Cost Estimates
httpslidepdfcomreaderfullbasis-of-cost-estimates 6367
Detroit Water and Sewerage DepartmentBasis of Cost Estimates
September 2003 62
Table C-13Blower System Unit Cost
Capacity 2000 2010 2020 2030 2040 2050
170 mgd $718 $850 $1030 $1210 $1390 $1570
210 mgd $786 $930 $1130 $1330 $1530 $1730
317 mgd $1120 $1330 $1620 $1910 $2200 $2490
317 mgd $1120 $1330 $1620 $1910 $2200 $2490317 mgd $1060 $1260 $1530 $1800 $2070 $2340
462 mgd $7440 $8820 $10720 $12610 $14510 $16400
462 mgd $7440 $8820 $10720 $12610 $14510 $16400
539 mgd $7440 $8820 $10720 $12610 $14510 $16400
600 mgd $6430 $7630 $9270 $10910 $12550 $14180
675 mgd $8920 $10580 $12860 $15130 $17400 $19660
675 mgd $8840 $10480 $12740 $14990 $17240 $19480
810 mgd $8950 $10610 $12900 $15180 $17460 $19730
845 mgd $8600 $10200 $12400 $14590 $16780 $18960
933 mgd $8950 $10610 $12900 $15180 $17460 $19730
1500 mgd $6370 $7550 $9180 $10800 $12420 $14040
1875 mgd $7670 $9100 $11060 $13010 $14970 $16920
Table C-14Gravity Thickening Unit Cost
Capacity 2000 2010 2020 2030 2040 2050
113 mgd $278 $330 $400 $470 $540 $610
140 mgd $319 $380 $460 $540 $620 $700
211 mgd $693 $820 $1000 $1180 $1360 $1540
211 mgd $555 $660 $800 $940 $1080 $1220
211 mgd $396 $470 $570 $670 $770 $870
308 mgd $708 $840 $1020 $1200 $1380 $1560308 mgd $723 $860 $1050 $1240 $1430 $1620
359 mgd $609 $720 $880 $1040 $1200 $1360
400 mgd $581 $690 $840 $990 $1140 $1290
450 mgd $927 $1100 $1340 $1580 $1820 $2060
450 mgd $944 $1120 $1360 $1600 $1840 $2080
540 mgd $830 $980 $1190 $1400 $1610 $1820
563 mgd $768 $910 $1110 $1310 $1510 $1710
622 mgd $830 $980 $1190 $1400 $1610 $1820
1000 mgd $723 $860 $1050 $1240 $1430 $1620
1250 mgd $845 $1000 $1220 $1440 $1660 $1880
7182019 Basis of Cost Estimates
httpslidepdfcomreaderfullbasis-of-cost-estimates 6467
Detroit Water and Sewerage DepartmentBasis of Cost Estimates
September 2003 63
Table C-15Centrifugation Unit Cost
Capacity 2000 2010 2020 2030 2040 2050
113 mgd $2050 $2430 $2950 $3470 $3990 $4510
14 mgd $2440 $2890 $3510 $4130 $4750 $5370
211 mgd $2930 $3470 $4220 $4970 $5720 $6460
211 mgd $2220 $2630 $3200 $3770 $4340 $4900211 mgd $4160 $4930 $5990 $7050 $8110 $9160
308 mgd $2990 $3550 $4310 $5070 $5830 $6590
308 mgd $3040 $3610 $4390 $5170 $5950 $6720
359 mgd $6200 $7350 $8930 $10510 $12090 $13660
40 mgd $6150 $7290 $8860 $10430 $12000 $13560
45 mgd $4420 $5240 $6370 $7500 $8630 $9750
45 mgd $4500 $5340 $6490 $7640 $8790 $9930
54 mgd $9210 $10920 $13270 $15610 $17960 $20300
563 mgd $10700 $12690 $15420 $18140 $20870 $23580
622 mgd $11900 $14110 $17150 $20180 $23210 $26230
100 mgd $15000 $17790 $21620 $25440 $29260 $33060
125 mgd $17900 $21230 $25800 $30360 $34920 $39460
Table C-16Hauling and Landfilling Unit Cost
Capacity 2000 2010 2020 2030 2040 2050
113 mgd $438 $520 $630 $740 $850 $960
140 mgd $546 $650 $790 $930 $1070 $1210
211 mgd $1060 $1260 $1530 $1800 $2070 $2340
211 mgd $788 $930 $1130 $1330 $1530 $1730
211 mgd $810 $960 $1170 $1380 $1590 $1800
308 mgd $1090 $1290 $1570 $1850 $2130 $2410308 mgd $1100 $1300 $1580 $1860 $2140 $2420
359 mgd $1400 $1660 $2020 $2380 $2740 $3100
400 mgd $1370 $1620 $1970 $2320 $2670 $3020
450 mgd $1530 $1810 $2200 $2590 $2980 $3370
450 mgd $1560 $1850 $2250 $2650 $3050 $3450
540 mgd $2150 $2550 $3100 $3650 $4200 $4750
563 mgd $2030 $2410 $2930 $3450 $3970 $4490
622 mgd $2220 $2630 $3200 $3770 $4340 $4900
1000 mgd $2360 $2800 $3400 $4000 $4600 $5200
1250 mgd $2950 $3500 $4250 $5000 $5750 $6500
7182019 Basis of Cost Estimates
httpslidepdfcomreaderfullbasis-of-cost-estimates 6567
Detroit Water and Sewerage DepartmentBasis of Cost Estimates
September 2003 64
Appendix D
Wastewater Treatment Plant Ongoing Repair andReplacement Cost Estimates
7182019 Basis of Cost Estimates
httpslidepdfcomreaderfullbasis-of-cost-estimates 6667
Detroit Water and Sewerage DepartmentBasis of Cost Estimates
September 2003 65
SUMMARY OF CAPITAL IMPROVEMENT PROJECT COSTS
Explanation of Capital Improvement Costs
NOTE This analysis was provided by the staff of the Detroit Wastewater Partners (DWSDProject PC-744 - Wastewater Treatment Plant Upgrade) and DWSD Wastewater Plant staff Itwas completed in July 2003
General
1 Capital costs are presented by major process and non-process areas The project costsassume a major capital improvement project for the specified life cycle based on recent capitalimprovements performed under PC-744 other recent capital improvement projects (ie PC-740 PC-720 etc) and best engineering judgment The line items listed in each area areintended to provide a basis for the cost estimate to give an understanding of the level of costestimate assumptions used and items includednot included in the cost estimate It is unlikelyand not intended that the major capital projects would include all of the items listed at thespecified cycle Rather it is more likely that the overall cost would be broken into smallerprojects spread across a ~10 year period at the specified cycle
2 The percentages listed below were applied to each of the base construction costs Theseare similar to the percentages used in the Wastewater Master Plan (see Master Plan TechnicalMemo Basis of Cost Estimates dated August 15 2003)
- 30 Contingency (for miscellaneous items not included in the general cost estimate)
- 25 Contractor Overhead and Profit and General Conditions
- 20 Engineering Legal Administration and Management
3 Capital costs presented assume continued use of the existing processes in place at the
WWTP It does not assume major changes to the treatment process such as a new form ofprimary treatment or biological treatment The costs also do not include potentially newprocesses that may be required for regulatory or other reasons such as filtration of thesecondary effluent sludge digestion or major change to the type of effluent disinfection
4 Capital costs presented for each process area do not include maintenance related costs forroutine maintenance between the major capital improvement cycles It is assumed thatmaintenance activities will be performed on the equipment at the required frequencies tomaintain the equipment in good worknig order between major rehabilitation or replacementprojects
Link to Complete Spreadsheets is found on the Wastewater Master Plan
CD DWP Est of Capital Improvements for WWTP - 50-yrxls
7182019 Basis of Cost Estimates
httpslidepdfcomreaderfullbasis-of-cost-estimates 6767
Detroit Water and Sewerage DepartmentBasis of Cost Estimates
Table D1
SUMMARY OF CAPITAL IMPROVEMENT PROJECT COSTS
Area Life Cycle Start of Cycle 2003 Costs ($M)PROCESS RELATED
Pump Station No 1 20 2025 $ 63Pump Station No 2 20 2006 $ 66
Chemical Addition 20 2023 $ 9Rectangular Primary Clarifiers 20 2013 $ 86Circular Primary Clarifiers 20 2025 $ 84ILP Nos 1 2 3 4 7 20 2025 $ 29
Aeration Basins 20 2025 $ 55Cryo Plants 10 2015 $ 1Secondary Clarifiers 20 2020 $ 140SFE Pump Station 20 2010 $ 13
Chlorination 20 2022 $ 16
Dechlorination 20 2023 $ 12Hydraulic Structures 20 2020 $ 7Complex A and B 20 2025 $ 32
C-I Dewatering 15 2020 $ 31C-II Lower Level Dewatering 15 2019 $ 35C-II Upper Level Dewatering 15 2015 $ 42
C-I and C-II Incineration 15 2009 $ 139Sludge Offloading 20 2025 $ 19NON-PROCESS RELATED
AdminRagland Buildings 20 2025 $ 10Plant Security 10 2015 $ 10Plant-wide Paving 15 2020 $ 6Parking Structure 20 2025 $ 7Work Environment Improvements 10 2015 $ 5
Rehab of OampM Bldgs Warehouses 20 2007 $ 40Plant-wide Instrumentation 15 2020 $ 100General Electrical 20 2045 $ 29Plant-wide Secondary Water 15 2025 $ 6
Plant-wide Steam System 15 2023 $ 6Plant-wide Potable Water 15 2010 $ 2Plant -wide Drainage 15 2010 $ 2
Fire Protection Improvements 20 2006 $ 4Plant-Wide JOCs As-Needed Eng 1 2005 $ 3
Total $ 1107
7182019 Basis of Cost Estimates
httpslidepdfcomreaderfullbasis-of-cost-estimates 3767
Detroit Water and Sewerage DepartmentBasis of Cost Estimates
September 2003 36
Size 2000 Unit Cost 2003 Unit Cost
49000 GPM
$1080 $2380
59722 GPM
$1127
66667 GPM $1229
78472 GPM
$1434
700000 GPM
$12000 $12920
Table A-9bPump Station Replacement Costs
Size 2003 Unit Cost
0 - 500 GPM $1567000
500 + GPM $20000000
7182019 Basis of Cost Estimates
httpslidepdfcomreaderfullbasis-of-cost-estimates 3867
Detroit Water and Sewerage DepartmentBasis of Cost Estimates
September 2003 37
Appendix B
Data Tables Not Used for CIP
7182019 Basis of Cost Estimates
httpslidepdfcomreaderfullbasis-of-cost-estimates 3967
Detroit Water and Sewerage DepartmentBasis of Cost Estimates
September 2003 38
Appendix B ndash Data Tables Not Used for CIPThe April 2002 version of this technical memo contained several tables that were notused for the actual CIP cost estimates for the WWMP The CIP either used differentdata sources or did not include the categories covered in these tables
B1 Alternate Data Category TablesB11 Chemical Grouting of JointsChemical Grouting of Joints consists of utilizing chemical products to eliminate leaksin pipe joints The estimate includes mobilization set up and furnishing of allincidentals The estimate is shown and is in unit cost per pipe joint All 2000 dataused for Table B-1 comes from historical sources from 1982 to 1999 and was escalatedto 2003 using the CCI
Table B-1Historical Chemical Grouting of Joints Costs
SizeSource UnitCostJoint Year
2003 Unit CostJoint(CCI) Source
Al l $6000 1985 $9580 1
$3500 1982 $6129 5
$2400 1988 $3557 8
$3500 1999 $3868 11
$3500 1996 $4171 13
Avg $5461
B12 SlipliningSliplining is considered to be a light rehabilitation method Sliplining installationincludes
Installation of HPDE Pipe into existing sewer pipe Excavation and backfill of insertion pits in common earth Annular space grouting Mobilization Sewer preparation And furnishing of all incidentals
The service life of Sliplining is 50 years Sizes are the ID of the Slipliner pipe forexample to reline a 20rdquo sewer use the cost for the 16rdquo Slipliner The estimate in TableB-2 is unit cost x $1000 per mile of installation
7182019 Basis of Cost Estimates
httpslidepdfcomreaderfullbasis-of-cost-estimates 4067
Detroit Water and Sewerage DepartmentBasis of Cost Estimates
September 2003 39
Table B-2Sliplining Costs
Size 2003 UnitCost Mile
4rdquo $20
6rdquo $50
8rdquo $90
10rdquo $130
12rdquo $190
14rdquo $230
16rdquo $290
18rdquo $370
20rdquo $460
22rdquo $56024rdquo $660
26rdquo $780
28rdquo $900
30rdquo $1040
32rdquo $1180
36rdquo $1490
42rdquo $2030
48rdquo $2650
52rdquo $3060
54rdquo $3360
B13 Sewer Pipe ReplacementIt has been determined that the improvements to the DWSD sewer system would notinclude the replacement of any sewer pipes However the costs for the constructionof new sewers were investigated The results of this investigation follow Note thatthe costs included in these tables (Table B-3 through B-13) are the recommended costsfrom Table 51-1
Ductile Iron Force Main
Ductile Iron Force Main installation includes
Cement lined ductile iron pipe (6-24) Excavation and backfill of common earth 3 ndash 35 feet of cover to crown of the pipe Minimum utility relocation Up to 6rdquo of bituminous pavement removal and replacement Furnishing of all incidentals
7182019 Basis of Cost Estimates
httpslidepdfcomreaderfullbasis-of-cost-estimates 4167
Detroit Water and Sewerage DepartmentBasis of Cost Estimates
September 2003 40
Table B-3 shows the ductile iron force main installation estimate in unit cost x $1000per mile of pipe installation escalated using the CCI The service life of ductile ironforce mains is 30 years
Table B-3Historical New Ductile Iron Force Main Installation Costs
Size
SourceUnitCostLF Year 2003 Unit CostLF (CCI) Source
4 $1000 1985 $1597 1
$1500 1985 $2395 1
Avg $1996
6 $1600 1985 $2555 1
$1900 1985 $3034 1
$2700 2000 $2907 10
$1840 1971 $7795 14
$1600 1971 $6778 14
Avg $4614
8 $3000 2000 $3230 10
Avg $3230
10 $3300 2000 $3553 10
Avg $3553
12 $3700 2000 $3984 10
$1600 1971 $6778 14
$2800 1990 $3963 16
Avg $4909
14 $4100 2000 $4414 10
Avg $4414
16 $4500 2000 $4845 10
Avg $4845
7182019 Basis of Cost Estimates
httpslidepdfcomreaderfullbasis-of-cost-estimates 4267
Detroit Water and Sewerage DepartmentBasis of Cost Estimates
September 2003 41
Size
SourceUnitCostLF Year 2003 Unit CostLF (CCI) Source
18 $4200 1990 $5945 16
Avg $5945
20 $5300 2000 $5706 10
$4750 1971 $20124 14
Avg $12915
24 $6000 2000 $6460 10
Avg $6460
48 $10700 2000 $11520 10
Avg $11520
Service Leads Service Lead installation includes
6 SDR 35 PVC pipe and fittings Excavation and backfill of common earth Min 4rsquo cover to crown of the pipe Tie-in to existing sewer Reseeding
Furnishing of all incidentals
Table B-4 shows the estimate for service lead installation in unit cost per foot of pipewith the historical data escalated using the CCI The service life of service leads is 25years
Table B-4Historical New Service Lead Installation Costs
SizeSource unitCostLF Year
2003 Unit CostLF(CCI) Source
6 $1400 1971 $5931 14
$1560 1971 $6609 14
Avg $6270
7182019 Basis of Cost Estimates
httpslidepdfcomreaderfullbasis-of-cost-estimates 4367
Detroit Water and Sewerage DepartmentBasis of Cost Estimates
September 2003 42
Sanitary Laterals
Sanitary Lateral installation includes
Plain concrete pipe (8-12)
Excavation and backfill of common earth including trench shield or box 48rdquo diameter manholes at 300 feet Minimum utility relocation Up to 6rdquo of bituminous pavement removal and replacement Furnishing of all incidentals
Table B-5 shows the estimate for sanitary laterals in unit cost x $1000 per mile of pipeinstallation with the historical data escalated using the CCI The service life ofsanitary laterals is 50 years
Table B-5
Historical New Sanitary Lateral Installation Costs
SizeSource UnitCostLF Year
2003 Unit CostLF(CCI) Source
8 $2250 1985 $3592 1
$3500 1999 $3868 6
$2900 1971 $12286 14
$2600 1971 $11015 14
$2540 1971 $10761 14
$3260 1971 $13811 14
$3500 1990 $4954 16
$3500 1990 $4954 19
Avg $7706
10 $2400 1985 $3832 1
$2500 1985 $3992 1
$4000 1999 $4421 6
$5600 2000 $6029 10
$3000 1971 $12710 14
$5700 1971 $24148 14
Avg $9189
12 $5500 1999 $6079 6
$4500 1990 $6370 16
Avg $6224
7182019 Basis of Cost Estimates
httpslidepdfcomreaderfullbasis-of-cost-estimates 4467
Detroit Water and Sewerage DepartmentBasis of Cost Estimates
September 2003 43
Storm and Combined LateralsStorm and combined lateral installation includes
Reinforced concrete pipe (12-24) Excavation and backfill of common earth Sheeting shoring and bracing Trench shield or box at 8rsquo 48rdquo Diameter manholes at 300 feet Min bury to the crown of the pipe as listed below Minimum utility relocation Up to 6rdquo of bituminous pavement removal and replacement And furnishing of all incidentals
Tables B-6 shows the estimates for storm and combined laterals in unit cost x $1000per mile of pipe installation at various depths with the historical data escalated usingthe CCI However the depth of installation is unknown The service life of storm andcombined laterals is 50 years
Table B-6Historical New Storm and Combined Lateral Installation Costs
SizeSource Unit
CostLF Year2003 Unit CostLF
(CCI) Source
12 $2500 1985 $3992 1
$3000 1985 $4790 1
$4500 1989 $6531 9
$6100 2000 $6568 10
$4350 1971 $18429 14
$3900 1971 $16523 14
$2700 1990 $3822 16
$4890 1971 $20717 14
$4500 1990 $6370 16
$4500 1990 $6370 19
$2700 1990 $3822 19
Avg $8161
15 $2750 1985 $4391 1$6700 2000 $7214 10
$4900 1971 $20759 14
$3375 1990 $4777 16
$5625 1990 $7962 16
$3375 1990 $4777 19
7182019 Basis of Cost Estimates
httpslidepdfcomreaderfullbasis-of-cost-estimates 4567
Detroit Water and Sewerage DepartmentBasis of Cost Estimates
September 2003 44
SizeSource Unit
CostLF Year2003 Unit CostLF
(CCI) Source
15 $5625 1990 $7962 19
$3100 1999 $3426 11
Avg $6808
18 $3000 1985 $4790 1
$7300 2000 $7860 10
$3255 1990 $4607 16
$4050 1990 $5733 16
$4050 1990 $5733 19
$6750 1990 $9554 19
Avg $6379
21 $8000 2000 $8613 10
$5200 1971 $22030 14
$4800 1971 $20335 14
$4700 1971 $19912 14
$4725 1990 $6688 16
$4720 1990 $6681 19
Avg $14043
24 $8800 2000 $9475 10
$5400 1971 $22877 14
$5060 1971 $21437 14
$4430 1990 $6271 16
$5400 1990 $7644 19
$5400 1990 $7644 16
Avg $12558
Trunk SewersTrunk Sewer installation includes
Reinforced concrete pipe (27-66) Excavation and backfill of common earth Sheeting shoring and bracing Manholes at 300 feet Diameters as follows
o Pipe size 27rdquo ndash 36rdquo 60rdquo diameter manholes
7182019 Basis of Cost Estimates
httpslidepdfcomreaderfullbasis-of-cost-estimates 4667
Detroit Water and Sewerage DepartmentBasis of Cost Estimates
September 2003 45
o Pipe size 42rdquo- 48rdquo 72rdquo diameter manholeso Pipe size 54rdquo ndash 66rdquo 84rdquo diameter manholes
Min bury to the crown of the pipe as listed below Minimum utility relocation Up to 6rdquo of bituminous pavement removal and replacement And furnishing of all incidentals
Table B-7 shows the estimates in unit cost x $1000 per mile of pipe installation atvarious depths with the historical data escalated using the CCI However the depthof installation is unknown The service life of trunk sewers is 50 years
Table B-7Historical New Trunk Sewer Installation Costs
Size Source Unit CostLF Year 2003 Unit CostLF (CCI) Source
27 $9600 2000 $10336 10
$5000 1971 $21183 14
Avg $15759
30 $10400 2000 $11197 10
$13500 1996 $16090 13
Avg $13643
36 $9300 1982 $16285 5
$27500 1998 $31114 3
$27500 1997 $31621 7$27000 1999 $29843 11
$14500 1996 $17281 13
Avg $25229
42 $29000 1997 $33346 7
$33000 1999 $36474 11
$13200 2000 $14212 10
Avg $28011
48 $30000 1997 $34496 7
$28500 1999 $31500 11
Avg $32998
Size Source Unit CostLF Year 2003 Unit CostLF (CCI) Source
54 $31000 1997 $35646 7
7182019 Basis of Cost Estimates
httpslidepdfcomreaderfullbasis-of-cost-estimates 4767
Detroit Water and Sewerage DepartmentBasis of Cost Estimates
September 2003 46
Avg $35646
60 $34000 1997 $39096 7
Avg $39096
66 $47000 1998 $53177 3
$50000 1998 $56571 3
Avg $54874
Interceptors TunnelsInterceptor tunnel installation includes
Reinforced concrete pipe (78-120) Excavation and backfill of common earth Sheeting shoring and bracing 8rsquo Diameter manholes at 600 feet Min bury to the crown of the pipe as listed below Minimum utility relocation Up to 6rdquo of bituminous pavement removal and replacement And furnishing of all incidentals
Table B-8 shows the estimates in unit cost x $1000 per mile of pipe installation atvarious depths with the historical data escalated using the CCI However the depthof installation is unknown The service life of interceptors tunnels is 50 years
Table B-8Historical New Interceptors Tunnels Installation Costs
Size Source Unit CostLF Year 2003 Unit CostLF (CCI) Source
78 $60000 1998 $67885 3
Avg $67885
84 $62000 1998 $70148 3
Avg $70148
96 $70000 1998 $79199 3
Avg $79199
Size Source Unit CostLF Year 2003 Unit CostLF (CCI) Source
102 $75000 1998 $84856 3
7182019 Basis of Cost Estimates
httpslidepdfcomreaderfullbasis-of-cost-estimates 4867
Detroit Water and Sewerage DepartmentBasis of Cost Estimates
September 2003 47
Avg $84856
108 80000 1998 $90514 3
Avg $90514
120 $90000 1985 $143700 1
Avg $143700
B14 Miscellaneous RepairsThis cost estimating technical memorandum reviewed the costs for various sewersystem repairs that were not scheduled or included in the WWMP CIP developmentThis section contains the results of this repair cost review
Sump Pump Disconnection
Sump Pump Disconnection consists of removal of sump valves electrical connectionsand restoration These costs in unit cost per connection are estimated at $6720 in2000 dollars
Root Control
Root Control consists of utilizing chemical methods The estimate includesmobilization set up and furnishing of all incidentals Table B-9 shows the estimate inunit cost per linear foot of pipe with the historical data escalated using the CCI
Table B-9Historical Root Control Costs
SizeSource Unit
CostLF Year 2003 Unit CostLF (CCI) Source
Al l $200 1982 $350 5
$200 1988 $296 8
$140 1989 $203 9
$200 2000 $215 20
$225 2000 $242 20
$275 2000 $296 20
Avg $267
B15 Historical ReferencesShown on each spreadsheet is a reference code to the source of individual unit pricesTable B-10 shows the references used for the historical estimates in Appendices A andB
7182019 Basis of Cost Estimates
httpslidepdfcomreaderfullbasis-of-cost-estimates 4967
Detroit Water and Sewerage DepartmentBasis of Cost Estimates
September 2003 48
Table B-10Historical References
Source Title Date
1 Unidentified CDM Documents 1985
2Beaconsfield Relief Sewer Cleaning Manholes Inspection forSouth Macomb Sanitary District 1999
3 SOCSDS Project Plan 1998
4 Cost Effective Analysis 1998
5 Grosse Pointe Infrastructure 1982
6 City of Rochester Hills SDA 1999
7 HRC Detailed Cost Estimates 1997
8 Beverly Hills Local Sewer Study Rehabilitation Program 1988
9 Unidentified CDM Documents 1989
10 Unidentified Construction Cost Estimate
11 South Macomb Sanitary District 1999
12 City of Rochester Hills Sanitary Sewer Evaluation Survey 1996
13 South Macomb Sanitary District Appendix J 1996
14 Clinton-Oakland Sewage Disposal System 1971
15 City of Hazel Park MI
16 Farmington MI Sewer Seperation Improvements 1990
17 Basic Requirements Report Evergreen-Farmington Relief 1985
18 Cost Estimate 1975
19 Pre-Rehabilitation Local Sewer Costs 1990
20 Ann Arbor SSO Prevention Task Force 2000
B16 Means and Manufacturersrsquo EstimatesThe calculation of construction costs using the RW Means methodology requiresprices for component materials and construction activities (ie excavation orbackfilling) The following table presents the component costs used in the
development of construction cost guidelines
7182019 Basis of Cost Estimates
httpslidepdfcomreaderfullbasis-of-cost-estimates 5067
Detroit Water and Sewerage DepartmentBasis of Cost Estimates
September 2003 49
Table B-11Component Costs for Means and Manufacturersrsquo Estimates
Item Size Description Unit Cost Units Source
Excavation
Excavation common earth hauling
away fill up to 4 mi $1549 CY Means
BackfillCommon earth front-end loaderCompaction 12 lifts $882 CY Means
Select FillCrushed bank run gravelcompaction 6 lifts $2650 CY Means
Sheeting 8 DeepWood solid sheeting incl Walesbraces and spacers Drive amp Extract $668 SF Means
16 DeepWood solid sheeting incl Walesbraces and spacers Drive amp Extract $876 SF Means
24 DeepWood solid sheeting incl Walesbraces and spacers Drive amp Extract $1074 SF Means
32 DeepWood solid sheeting incl Walesbraces and spacers Drive amp Extract $1199 SF Means
Pavement Removal Bituminous 4 to 6 thick $572 SY Means
Saw Cutting Asphalt 6 thick $281 LF Means
Pavement Replacement Over Trench 6 thick $4333 SY Means
Non-Reinforced ConcretePipe 8 Bell and Spigot Joints Extra strength $1231 LF Means
10 Bell and Spigot Joints Extra strength $1305 LF Means
12 Bell and Spigot Joints Extra strength $1480 LF Means
Reinforced Concrete Pipe 12
Class 3 BampS or TampG Joints
wgaskets $1890 LF Means
15Class 3 BampS or TampG Jointswgaskets $2167 LF Means
18Class 3 BampS or TampG Jointswgaskets $2536 LF Means
7182019 Basis of Cost Estimates
httpslidepdfcomreaderfullbasis-of-cost-estimates 5167
Detroit Water and Sewerage DepartmentBasis of Cost Estimates
September 2003 50
Item Size Description Unit Cost Units Source
Reinforced Concrete Pipe 21Class 3 BampS or TampG Joints wogaskets $3135 LF Means
24Class 3 BampS or TampG Jointswgaskets $3504 LF Means
27Class 3 BampS or TampG Joints wogaskets $5302 LF Means
30Class 3 BampS or TampG Jointswgaskets $6592 LF Means
36Class 3 BampS or TampG Jointswgaskets $8990 LF Means
42
Class 3 BampS or TampG Joints wo
gaskets $9220 LF Means
48Class 3 BampS or TampG Jointswgaskets $13185 LF Means
54Class 3 BampS or TampG Jointswgaskets $14845 LF Means
60Class 3 BampS or TampG Joints wogaskets $16504 LF Means
66Class 3 BampS or TampG Joints wogaskets $23004 LF Means
72Class 3 BampS or TampG Jointswgaskets $29504 LF Means
78Class 3 BampS or TampG Joints wogaskets $32500 LF Means
84Class 3 BampS or TampG Joints wogaskets $35497 LF Means
96Class 3 BampS or TampG Jointswgaskets $43795 LF Means
102
Class 3 BampS or TampG Joints wo
gaskets $46000 LF Means
108Class 3 BampS or TampG Joints wogaskets $48300 LF Means
120Class 3 BampS or TampG Joints wogaskets $53000 LF Means
7182019 Basis of Cost Estimates
httpslidepdfcomreaderfullbasis-of-cost-estimates 5267
Detroit Water and Sewerage DepartmentBasis of Cost Estimates
September 2003 51
Item Size Description Unit Cost Units Source
Ductile Iron Pipe 4 Class 50 Cement Lined Mech Joint $1982 LF Means
6 Class 50 Cement Lined Mech Joint $2305 LF Means
8 Class 50 Cement Lined Mech Joint $2812 LF Means
10 Class 50 Cement Lined Mech Joint $3458 LF Means
12 Class 50 Cement Lined Mech Joint $4103 LF Means
14 Class 50 Cement Lined Mech Joint $4656 LF Means
16 Class 50 Cement Lined Mech Joint $5670 LF Means
18 Class 50 Cement Lined Mech Joint $6731 LF Means
20 Class 50 Cement Lined Mech Joint $7745 LF Means
24 Class 50 Cement Lined Mech Joint $9958 LF Means
48 Class 50 Cement Lined Mech Joint $23234 LF Est
PVC Pipe (SDR35) 6 SDR 35 BampS $512 LF Means
6 SDR 35 BampS 45 Degree Bend $7376 LF Means
HDPEPipe for Sliplining 4HDPE Pipe PE3408 DR21 (80 psi)price installed $442 LF Manufact
6HDPE Pipe PE3408 DR21 (80 psi)price installed $958 LF Manufact
8
HDPE Pipe PE3408 DR21 (80 psi)
price installed $1623 LF Manufact
10HDPE Pipe PE3408 DR21 (80 psi)price installed $2521 LF Manufact
12HDPE Pipe PE3408 DR21 (80 psi)price installed $3547 LF Manufact
7182019 Basis of Cost Estimates
httpslidepdfcomreaderfullbasis-of-cost-estimates 5367
Detroit Water and Sewerage DepartmentBasis of Cost Estimates
September 2003 52
Item Size Description Unit Cost Units Source
HDPEPipe for Sliplining 14HDPE Pipe PE3408 DR21 (80 psi)price installed $4276 LF Manufact
16HDPE Pipe PE3408 DR21 (80 psi)price installed $5586 LF Manufact
18HDPE Pipe PE3408 DR21 (80 psi)price installed $7069 LF Manufact
20HDPE Pipe PE3408 DR21 (80 psi)price installed $8728 LF Manufact
22HDPE Pipe PE3408 DR21 (80 psi)price installed $10560 LF Manufact
24
HDPE Pipe PE3408 DR21 (80 psi)
price installed $12567 LF Manufact
26HDPE Pipe PE3408 DR21 (80 psi)price installed $14749 LF Manufact
28HDPE Pipe PE3408 DR21 (80 psi)price installed $17106 LF Manufact
30HDPE Pipe PE3408 DR21 (80 psi)price installed $19637 LF Manufact
32HDPE Pipe PE3408 DR21 (80 psi)price installed $22342 LF Manufact
36HDPE Pipe PE3408 DR21 (80 psi)price installed $28277 LF Manufact
42HDPE Pipe PE3408 DR21 (80 psi)price installed $38488 LF Manufact
48HDPE Pipe PE3408 DR21 (80 psi)price installed $50270 LF Manufact
52HDPE Pipe PE3408 DR21 (80 psi)price installed $57869 LF Manufact
54
HDPE Pipe PE3408 DR21 (80 psi)
price installed $63623 LF Manufact
Manholes 4 DiaPrecast Concrete not incl Excavbackfill frame cover sheeting $17979 VLF Means
5 DiaPrecast Concrete not incl Excavbackfill frame cover sheeting $18809 VLF Means
7182019 Basis of Cost Estimates
httpslidepdfcomreaderfullbasis-of-cost-estimates 5467
Detroit Water and Sewerage DepartmentBasis of Cost Estimates
September 2003 53
Item Size Description Unit Cost Units Source
Manholes 6 DiaPrecast Concrete not incl Excavbackfill frame cover sheeting $28582 VLF Means
7 DiaPrecast Concrete not incl Excavbackfill frame cover sheeting $38355 VLF Means
8 DiaPrecast Concrete not incl Excavbackfill frame cover sheeting $48128 VLF Means
B17 Meanrsquos Unit Cost Estimates
Table B-12 contains a sample estimating sheet for calculating each component costusing the material and labor costs identified in the previous section
7182019 Basis of Cost Estimates
httpslidepdfcomreaderfullbasis-of-cost-estimates 5567
Detroit Water and Sewerage DepartmentBasis of Cost Estimates
September 2003 54
Table B-12Sample Component Costs Estimator
Quick Sewer Estimator
Force Mains
Dimensions
Pipe Size 14 in
Trench Width 4 Ft not less than 32
Trench Depth 6 Ft
Length 1 Ft
Material Costs
Pipe CostLF 66 $LF
Excav CostCY 13 $CYBackfill Cost CY 10 $CY
Select Fill CostCY 12 $CY
Pavament DemoCost SY 7 $SY
New Pavement Cost SY 29 $SY
Saw Cut Per LF 4 $LF
Sheeting Cost SF 0 $SF
May not be required for excavations under 5 deep
Pavement A (sy)= 044
Vexcav (cy) = Vbfill (cy) =
089 049
Hbfill (ft)
Sheeting (sf) Common Fill 333333
12
Vsfill (cy) =
036 Hsfill (ft)
Select Fill 266667
W (ft) = 4
Total Costs
7182019 Basis of Cost Estimates
httpslidepdfcomreaderfullbasis-of-cost-estimates 5667
Detroit Water and Sewerage DepartmentBasis of Cost Estimates
September 2003 55
Pipe $6600
Excav $622
Backfill $494
Select Fill $427
Pavement Demo $311New Pavement $1289
Saw Cut $800
Sheeting Cost $000
Total Price $10543
Price Per Foot $10543 LF
7182019 Basis of Cost Estimates
httpslidepdfcomreaderfullbasis-of-cost-estimates 5767
Detroit Water and Sewerage DepartmentBasis of Cost Estimates
September 2003 56
Appendix C
Unit Costs for Treatment Facilities
7182019 Basis of Cost Estimates
httpslidepdfcomreaderfullbasis-of-cost-estimates 5867
Detroit Water and Sewerage DepartmentBasis of Cost Estimates
September 2003 57
Appendix C ndash Unit Costs for Treatment FacilitiesThe following tables outline the unit costs for treatment facilities derived from projectcost estimates These unit costs are provided for future estimating of these facilitiesand are the total cost X 1000 They are base construction costs only and do notinclude engineering fees allowances or contingencies
Table C-1Influent Pump Station Unit Cost
Capacity 2000 2010 2020 2030 2040 2050
394 mgd $1960 $2320 $2820 $3320 $3820 $4320
400 mgd $3810 $4520 $5490 $6460 $7430 $8400
491 mgd $2060 $2440 $2970 $3490 $4010 $4530
615 mgd $2510 $2980 $3620 $4260 $4900 $5540
615 mgd $2510 $2980 $3620 $4260 $4900 $5540
615 mgd $3050 $3620 $4400 $5180 $5960 $6740
619 mgd $3150 $3740 $4550 $5350 $6150 $6950
860 mgd $4440 $5270 $6410 $7540 $8670 $9800
1040 mgd $5940 $7040 $8560 $10070 $11580 $13090
1080 mgd $3790 $4490 $5460 $6420 $7380 $8340
1130 mgd $6090 $7220 $8780 $10330 $11880 $13420
1260 mgd $4510 $5350 $6500 $7650 $8800 $9940
1580 mgd $6020 $7140 $8680 $10210 $11740 $13270
1890 mgd $6350 $7530 $9150 $10770 $12390 $14000
2535 mgd $7030 $8340 $10140 $11930 $13720 $15500
3105 mgd $7030 $8340 $10140 $11930 $13720 $15500
Table C-2
Screening and Grit Chamber Unit Cost Capacity 2000 2010 2020 2030 2040 2050
116 mgd $1530 $1810 $2200 $2590 $2980 $3370
143 mgd $2030 $2410 $2930 $3450 $3970 $4490
216 mgd $2210 $2620 $3180 $3740 $4300 $4860
221 mgd $3490 $4140 $5030 $5920 $6810 $7700
226 mgd $3490 $4140 $5030 $5920 $6810 $7700
322 mgd $4500 $5340 $6490 $7640 $8790 $9930
322 mgd $4500 $5340 $6490 $7640 $8790 $9930
368 mgd $3240 $3840 $4670 $5490 $6320 $7140
409 mgd $3700 $4390 $5340 $6280 $7220 $8160
471 mgd $6190 $7340 $8920 $10500 $12080 $13650471 mgd $5940 $7040 $8560 $10070 $11580 $13090
554 mgd $4520 $5360 $6510 $7660 $8810 $9960
576 mgd $5190 $6160 $7490 $8810 $10130 $11450
636 mgd $5600 $6640 $8070 $9500 $10930 $12350
1000 mgd $9770 $11590 $14090 $16580 $19070 $21550
1250 mgd $11300 $13400 $16290 $19170 $22050 $24920
7182019 Basis of Cost Estimates
httpslidepdfcomreaderfullbasis-of-cost-estimates 5967
Detroit Water and Sewerage DepartmentBasis of Cost Estimates
September 2003 58
Table C-3 Aeration Bas in wi th Nit ri ficat ion Unit Cost
Capacity 2000 2010 2020 2030 2040 2050
113 mgd $10400 $12330 $14990 $17640 $20290 $22930
140 mgd $11200 $13280 $16140 $18990 $21840 $24680
211 mgd $17300 $20520 $24940 $29350 $33760 $38150
211 mgd $17300 $20520 $24940 $29350 $33760 $38150211 mgd $16000 $18980 $23070 $27150 $31230 $35290
308 mgd $22600 $26800 $32570 $38320 $44080 $49810
308 mgd $22600 $26800 $32570 $38320 $44080 $49810
359 mgd $24200 $28700 $34880 $41040 $47210 $53350
400 mgd $22600 $26800 $32570 $38320 $44080 $49810
450 mgd $32300 $38310 $46560 $54780 $63010 $71200
450 mgd $31800 $37710 $45830 $53930 $62040 $70110
540 mgd $35300 $41860 $50880 $59870 $68870 $77830
563 mgd $36800 $43640 $53040 $62410 $71790 $81130
622 mgd $39300 $46610 $56650 $66660 $76680 $86650
Table C-4Primary Clarifiers Unit Cost
Capacity 2000 2010 2020 2030 2040 2050
116 mgd $1530 $1810 $2200 $2590 $2980 $3370
143 mgd $2030 $2410 $2930 $3450 $3970 $4490
216 mgd $2210 $2620 $3180 $3740 $4300 $4860
221 mgd $3490 $4140 $5030 $5920 $6810 $7700
226 mgd $3490 $4140 $5030 $5920 $6810 $7700
322 mgd $4500 $5340 $6490 $7640 $8790 $9930
322 mgd $4500 $5340 $6490 $7640 $8790 $9930
368 mgd $3240 $3840 $4670 $5490 $6320 $7140
409 mgd $3700 $4390 $5340 $6280 $7220 $8160
471 mgd $6190 $7340 $8920 $10500 $12080 $13650
471 mgd $5940 $7040 $8560 $10070 $11580 $13090
554 mgd $4520 $5360 $6510 $7660 $8810 $9960
576 mgd $5190 $6160 $7490 $8810 $10130 $11450
636 mgd $5600 $6640 $8070 $9500 $10930 $12350
1000 mgd $9770 $11590 $14090 $16580 $19070 $21550
1250 mgd $11300 $13400 $16290 $19170 $22050 $24920
Table C-5Complete Mix Activated Sludge Unit Cost
Capacity 2000 2010 2020 2030 2040 2050
100 mgd $21800 $25850 $31420 $36970 $42530 $48060
125 mgd $25300 $30000 $36460 $42900 $49350 $55770
7182019 Basis of Cost Estimates
httpslidepdfcomreaderfullbasis-of-cost-estimates 6067
Detroit Water and Sewerage DepartmentBasis of Cost Estimates
September 2003 59
Table C-6Iron Feed System Unit Cost
Capacity 2000 2010 2020 2030 2040 2050
113 mgd $152 $180 $220 $260 $300 $340
140 mgd $152 $180 $220 $260 $300 $340
211 mgd $152 $180 $220 $260 $300 $340
211 mgd $152 $180 $220 $260 $300 $340211 mgd $152 $180 $220 $260 $300 $340
308 mgd $156 $190 $230 $270 $310 $350
308 mgd $156 $190 $230 $270 $310 $350
359 mgd $175 $210 $260 $310 $360 $410
400 mgd $164 $190 $230 $270 $310 $350
450 mgd $182 $220 $270 $320 $370 $420
450 mgd $182 $220 $270 $320 $370 $420
540 mgd $208 $250 $300 $350 $400 $450
563 mgd $189 $220 $270 $320 $370 $420
622 mgd $197 $230 $280 $330 $380 $430
1000 mgd $205 $240 $290 $340 $390 $440
1250 mgd $225 $270 $330 $390 $450 $510
Table C-7Coagulation-Flocculation Unit Cost
Capacity 2000 2010 2020 2030 2040 2050
100 mgd $19700 $23360 $28390 $33410 $38430 $43430
125 mgd $24100 $28580 $34740 $40880 $47020 $53130
Table C-8Secondary Clarifiers Unit Cost
Capacity 2000 2010 2020 2030 2040 2050
113 mgd $3050 $3620 $4400 $5180 $5960 $6740140 mgd $3800 $4510 $5480 $6450 $7420 $8380
211 mgd $4430 $5250 $6380 $7510 $8640 $9760
211 mgd $4430 $5250 $6380 $7510 $8640 $9760
211 mgd $4870 $5780 $7030 $8270 $9510 $10750
308 mgd $5800 $6880 $8360 $9840 $11320 $12790
308 mgd $5800 $6880 $8360 $9840 $11320 $12790
359 mgd $7120 $8440 $10260 $12070 $13880 $15680
400 mgd $6280 $7450 $9050 $10650 $12250 $13840
450 mgd $8070 $9570 $11630 $13680 $15740 $17790
450 mgd $8070 $9570 $11630 $13680 $15740 $17790
540 mgd $10400 $12330 $14990 $17640 $20290 $22930
563 mgd $11500 $13640 $16580 $19510 $22440 $25360
622 mgd $12400 $14710 $17880 $21040 $24200 $27350
1000 mgd $13700 $16250 $19750 $23240 $26730 $30210
1250 mgd $15200 $18030 $21910 $25780 $29650 $33510
7182019 Basis of Cost Estimates
httpslidepdfcomreaderfullbasis-of-cost-estimates 6167
Detroit Water and Sewerage DepartmentBasis of Cost Estimates
September 2003 60
Table C-9Intermediate Pumping Unit Cost
Capacity 2000 2010 2020 2030 2040 2050
253 mgd $734 $870 $1060 $1250 $1440 $1630
350 mgd $1060 $1260 $1530 $1800 $2070 $2340
400 mgd $1220 $1450 $1760 $2070 $2380 $2690
446 mgd $1380 $1640 $1990 $2340 $2690 $3040452 mgd $1410 $1670 $2030 $2390 $2750 $3110
529 mgd $1680 $1990 $2420 $2850 $3280 $3710
611 mgd $1680 $1990 $2420 $2850 $3280 $3710
669 mgd $1860 $2210 $2690 $3170 $3650 $4120
743 mgd $2090 $2480 $3010 $3540 $4070 $4600
849 mgd $2430 $2880 $3500 $4120 $4740 $5360
942 mgd $2470 $2930 $3560 $4190 $4820 $5450
1040 mgd $2770 $3290 $4000 $4710 $5420 $6120
1050 mgd $2810 $3330 $4050 $4770 $5490 $6200
1130 mgd $3040 $3610 $4390 $5170 $5950 $6720
Table C-10Filtration Unit Cost
Capacity 2000 2010 2020 2030 2040 2050
113 mgd $3930 $4660 $5660 $6660 $7660 $8660
140 mgd $5040 $5980 $7270 $8550 $9830 $11110
211 mgd $6210 $7360 $8950 $10530 $12110 $13680
211 mgd $6220 $7380 $8970 $10550 $12140 $13720
308 mgd $7900 $9370 $11390 $13400 $15410 $17410
359 mgd $8440 $10010 $12170 $14320 $16470 $18610
400 mgd $9190 $10900 $13250 $15590 $17930 $20260
450 mgd $10400 $12330 $14990 $17640 $20290 $22930
540 mgd $11800 $13990 $17000 $20000 $23010 $26000563 mgd $12200 $14470 $17590 $20700 $23810 $26910
622 mgd $13500 $16010 $19460 $22900 $26340 $29770
7182019 Basis of Cost Estimates
httpslidepdfcomreaderfullbasis-of-cost-estimates 6267
Detroit Water and Sewerage DepartmentBasis of Cost Estimates
September 2003 61
Table C-11Ultraviolet Disinfection Unit Cost
Capacity 2000 2010 2020 2030 2040 2050
259 mgd $912 $1080 $1310 $1540 $1770 $2000
351 mgd $1280 $1520 $1850 $2180 $2510 $2840
400 mgd $1530 $1810 $2200 $2590 $2980 $3370
452 mgd $2040 $2420 $2940 $3460 $3980 $4500452 mgd $3310 $3930 $4780 $5620 $6460 $7300
452 mgd $1750 $2080 $2530 $2980 $3430 $3880
619 mgd $1750 $2080 $2530 $2980 $3430 $3880
619 mgd $2280 $2700 $3280 $3860 $4440 $5020
679 mgd $2550 $3020 $3670 $4320 $4970 $5620
860 mgd $3830 $4540 $5520 $6500 $7480 $8450
860 mgd $3060 $3630 $4410 $5190 $5970 $6750
956 mgd $3400 $4030 $4900 $5770 $6640 $7500
1036 mgd $3830 $4540 $5520 $6500 $7480 $8450
1126 mgd $4100 $4860 $5910 $6950 $7990 $9030
1750 mgd $8270 $9810 $11920 $14030 $16140 $18240
2000 mgd $8620 $10220 $12420 $14610 $16810 $19000
Table C-12Post Aeration Unit Cost
Capacity 2000 2010 2020 2030 2040 2050
113 mgd $114 $140 $170 $200 $230 $260
140 mgd $134 $160 $190 $220 $250 $280
211 mgd $142 $170 $210 $250 $290 $330
211 mgd $142 $170 $210 $250 $290 $330
211 mgd $167 $200 $240 $280 $320 $360
308 mgd $182 $220 $270 $320 $370 $420308 mgd $182 $220 $270 $320 $370 $420
359 mgd $260 $310 $380 $450 $520 $590
400 mgd $273 $320 $390 $460 $530 $600
450 mgd $237 $280 $340 $400 $460 $520
450 mgd $237 $280 $340 $400 $460 $520
540 mgd $363 $430 $520 $610 $700 $790
563 mgd $358 $420 $510 $600 $690 $780
622 mgd $388 $460 $560 $660 $760 $860
1000 mgd $455 $540 $660 $780 $900 $1020
1250 mgd $554 $660 $800 $940 $1080 $1220
7182019 Basis of Cost Estimates
httpslidepdfcomreaderfullbasis-of-cost-estimates 6367
Detroit Water and Sewerage DepartmentBasis of Cost Estimates
September 2003 62
Table C-13Blower System Unit Cost
Capacity 2000 2010 2020 2030 2040 2050
170 mgd $718 $850 $1030 $1210 $1390 $1570
210 mgd $786 $930 $1130 $1330 $1530 $1730
317 mgd $1120 $1330 $1620 $1910 $2200 $2490
317 mgd $1120 $1330 $1620 $1910 $2200 $2490317 mgd $1060 $1260 $1530 $1800 $2070 $2340
462 mgd $7440 $8820 $10720 $12610 $14510 $16400
462 mgd $7440 $8820 $10720 $12610 $14510 $16400
539 mgd $7440 $8820 $10720 $12610 $14510 $16400
600 mgd $6430 $7630 $9270 $10910 $12550 $14180
675 mgd $8920 $10580 $12860 $15130 $17400 $19660
675 mgd $8840 $10480 $12740 $14990 $17240 $19480
810 mgd $8950 $10610 $12900 $15180 $17460 $19730
845 mgd $8600 $10200 $12400 $14590 $16780 $18960
933 mgd $8950 $10610 $12900 $15180 $17460 $19730
1500 mgd $6370 $7550 $9180 $10800 $12420 $14040
1875 mgd $7670 $9100 $11060 $13010 $14970 $16920
Table C-14Gravity Thickening Unit Cost
Capacity 2000 2010 2020 2030 2040 2050
113 mgd $278 $330 $400 $470 $540 $610
140 mgd $319 $380 $460 $540 $620 $700
211 mgd $693 $820 $1000 $1180 $1360 $1540
211 mgd $555 $660 $800 $940 $1080 $1220
211 mgd $396 $470 $570 $670 $770 $870
308 mgd $708 $840 $1020 $1200 $1380 $1560308 mgd $723 $860 $1050 $1240 $1430 $1620
359 mgd $609 $720 $880 $1040 $1200 $1360
400 mgd $581 $690 $840 $990 $1140 $1290
450 mgd $927 $1100 $1340 $1580 $1820 $2060
450 mgd $944 $1120 $1360 $1600 $1840 $2080
540 mgd $830 $980 $1190 $1400 $1610 $1820
563 mgd $768 $910 $1110 $1310 $1510 $1710
622 mgd $830 $980 $1190 $1400 $1610 $1820
1000 mgd $723 $860 $1050 $1240 $1430 $1620
1250 mgd $845 $1000 $1220 $1440 $1660 $1880
7182019 Basis of Cost Estimates
httpslidepdfcomreaderfullbasis-of-cost-estimates 6467
Detroit Water and Sewerage DepartmentBasis of Cost Estimates
September 2003 63
Table C-15Centrifugation Unit Cost
Capacity 2000 2010 2020 2030 2040 2050
113 mgd $2050 $2430 $2950 $3470 $3990 $4510
14 mgd $2440 $2890 $3510 $4130 $4750 $5370
211 mgd $2930 $3470 $4220 $4970 $5720 $6460
211 mgd $2220 $2630 $3200 $3770 $4340 $4900211 mgd $4160 $4930 $5990 $7050 $8110 $9160
308 mgd $2990 $3550 $4310 $5070 $5830 $6590
308 mgd $3040 $3610 $4390 $5170 $5950 $6720
359 mgd $6200 $7350 $8930 $10510 $12090 $13660
40 mgd $6150 $7290 $8860 $10430 $12000 $13560
45 mgd $4420 $5240 $6370 $7500 $8630 $9750
45 mgd $4500 $5340 $6490 $7640 $8790 $9930
54 mgd $9210 $10920 $13270 $15610 $17960 $20300
563 mgd $10700 $12690 $15420 $18140 $20870 $23580
622 mgd $11900 $14110 $17150 $20180 $23210 $26230
100 mgd $15000 $17790 $21620 $25440 $29260 $33060
125 mgd $17900 $21230 $25800 $30360 $34920 $39460
Table C-16Hauling and Landfilling Unit Cost
Capacity 2000 2010 2020 2030 2040 2050
113 mgd $438 $520 $630 $740 $850 $960
140 mgd $546 $650 $790 $930 $1070 $1210
211 mgd $1060 $1260 $1530 $1800 $2070 $2340
211 mgd $788 $930 $1130 $1330 $1530 $1730
211 mgd $810 $960 $1170 $1380 $1590 $1800
308 mgd $1090 $1290 $1570 $1850 $2130 $2410308 mgd $1100 $1300 $1580 $1860 $2140 $2420
359 mgd $1400 $1660 $2020 $2380 $2740 $3100
400 mgd $1370 $1620 $1970 $2320 $2670 $3020
450 mgd $1530 $1810 $2200 $2590 $2980 $3370
450 mgd $1560 $1850 $2250 $2650 $3050 $3450
540 mgd $2150 $2550 $3100 $3650 $4200 $4750
563 mgd $2030 $2410 $2930 $3450 $3970 $4490
622 mgd $2220 $2630 $3200 $3770 $4340 $4900
1000 mgd $2360 $2800 $3400 $4000 $4600 $5200
1250 mgd $2950 $3500 $4250 $5000 $5750 $6500
7182019 Basis of Cost Estimates
httpslidepdfcomreaderfullbasis-of-cost-estimates 6567
Detroit Water and Sewerage DepartmentBasis of Cost Estimates
September 2003 64
Appendix D
Wastewater Treatment Plant Ongoing Repair andReplacement Cost Estimates
7182019 Basis of Cost Estimates
httpslidepdfcomreaderfullbasis-of-cost-estimates 6667
Detroit Water and Sewerage DepartmentBasis of Cost Estimates
September 2003 65
SUMMARY OF CAPITAL IMPROVEMENT PROJECT COSTS
Explanation of Capital Improvement Costs
NOTE This analysis was provided by the staff of the Detroit Wastewater Partners (DWSDProject PC-744 - Wastewater Treatment Plant Upgrade) and DWSD Wastewater Plant staff Itwas completed in July 2003
General
1 Capital costs are presented by major process and non-process areas The project costsassume a major capital improvement project for the specified life cycle based on recent capitalimprovements performed under PC-744 other recent capital improvement projects (ie PC-740 PC-720 etc) and best engineering judgment The line items listed in each area areintended to provide a basis for the cost estimate to give an understanding of the level of costestimate assumptions used and items includednot included in the cost estimate It is unlikelyand not intended that the major capital projects would include all of the items listed at thespecified cycle Rather it is more likely that the overall cost would be broken into smallerprojects spread across a ~10 year period at the specified cycle
2 The percentages listed below were applied to each of the base construction costs Theseare similar to the percentages used in the Wastewater Master Plan (see Master Plan TechnicalMemo Basis of Cost Estimates dated August 15 2003)
- 30 Contingency (for miscellaneous items not included in the general cost estimate)
- 25 Contractor Overhead and Profit and General Conditions
- 20 Engineering Legal Administration and Management
3 Capital costs presented assume continued use of the existing processes in place at the
WWTP It does not assume major changes to the treatment process such as a new form ofprimary treatment or biological treatment The costs also do not include potentially newprocesses that may be required for regulatory or other reasons such as filtration of thesecondary effluent sludge digestion or major change to the type of effluent disinfection
4 Capital costs presented for each process area do not include maintenance related costs forroutine maintenance between the major capital improvement cycles It is assumed thatmaintenance activities will be performed on the equipment at the required frequencies tomaintain the equipment in good worknig order between major rehabilitation or replacementprojects
Link to Complete Spreadsheets is found on the Wastewater Master Plan
CD DWP Est of Capital Improvements for WWTP - 50-yrxls
7182019 Basis of Cost Estimates
httpslidepdfcomreaderfullbasis-of-cost-estimates 6767
Detroit Water and Sewerage DepartmentBasis of Cost Estimates
Table D1
SUMMARY OF CAPITAL IMPROVEMENT PROJECT COSTS
Area Life Cycle Start of Cycle 2003 Costs ($M)PROCESS RELATED
Pump Station No 1 20 2025 $ 63Pump Station No 2 20 2006 $ 66
Chemical Addition 20 2023 $ 9Rectangular Primary Clarifiers 20 2013 $ 86Circular Primary Clarifiers 20 2025 $ 84ILP Nos 1 2 3 4 7 20 2025 $ 29
Aeration Basins 20 2025 $ 55Cryo Plants 10 2015 $ 1Secondary Clarifiers 20 2020 $ 140SFE Pump Station 20 2010 $ 13
Chlorination 20 2022 $ 16
Dechlorination 20 2023 $ 12Hydraulic Structures 20 2020 $ 7Complex A and B 20 2025 $ 32
C-I Dewatering 15 2020 $ 31C-II Lower Level Dewatering 15 2019 $ 35C-II Upper Level Dewatering 15 2015 $ 42
C-I and C-II Incineration 15 2009 $ 139Sludge Offloading 20 2025 $ 19NON-PROCESS RELATED
AdminRagland Buildings 20 2025 $ 10Plant Security 10 2015 $ 10Plant-wide Paving 15 2020 $ 6Parking Structure 20 2025 $ 7Work Environment Improvements 10 2015 $ 5
Rehab of OampM Bldgs Warehouses 20 2007 $ 40Plant-wide Instrumentation 15 2020 $ 100General Electrical 20 2045 $ 29Plant-wide Secondary Water 15 2025 $ 6
Plant-wide Steam System 15 2023 $ 6Plant-wide Potable Water 15 2010 $ 2Plant -wide Drainage 15 2010 $ 2
Fire Protection Improvements 20 2006 $ 4Plant-Wide JOCs As-Needed Eng 1 2005 $ 3
Total $ 1107

7182019 Basis of Cost Estimates
httpslidepdfcomreaderfullbasis-of-cost-estimates 4667
Detroit Water and Sewerage DepartmentBasis of Cost Estimates
September 2003 45
o Pipe size 42rdquo- 48rdquo 72rdquo diameter manholeso Pipe size 54rdquo ndash 66rdquo 84rdquo diameter manholes
Min bury to the crown of the pipe as listed below Minimum utility relocation Up to 6rdquo of bituminous pavement removal and replacement And furnishing of all incidentals
Table B-7 shows the estimates in unit cost x $1000 per mile of pipe installation atvarious depths with the historical data escalated using the CCI However the depthof installation is unknown The service life of trunk sewers is 50 years
Table B-7Historical New Trunk Sewer Installation Costs
Size Source Unit CostLF Year 2003 Unit CostLF (CCI) Source
27 $9600 2000 $10336 10
$5000 1971 $21183 14
Avg $15759
30 $10400 2000 $11197 10
$13500 1996 $16090 13
Avg $13643
36 $9300 1982 $16285 5
$27500 1998 $31114 3
$27500 1997 $31621 7$27000 1999 $29843 11
$14500 1996 $17281 13
Avg $25229
42 $29000 1997 $33346 7
$33000 1999 $36474 11
$13200 2000 $14212 10
Avg $28011
48 $30000 1997 $34496 7
$28500 1999 $31500 11
Avg $32998
Size Source Unit CostLF Year 2003 Unit CostLF (CCI) Source
54 $31000 1997 $35646 7
7182019 Basis of Cost Estimates
httpslidepdfcomreaderfullbasis-of-cost-estimates 4767
Detroit Water and Sewerage DepartmentBasis of Cost Estimates
September 2003 46
Avg $35646
60 $34000 1997 $39096 7
Avg $39096
66 $47000 1998 $53177 3
$50000 1998 $56571 3
Avg $54874
Interceptors TunnelsInterceptor tunnel installation includes
Reinforced concrete pipe (78-120) Excavation and backfill of common earth Sheeting shoring and bracing 8rsquo Diameter manholes at 600 feet Min bury to the crown of the pipe as listed below Minimum utility relocation Up to 6rdquo of bituminous pavement removal and replacement And furnishing of all incidentals
Table B-8 shows the estimates in unit cost x $1000 per mile of pipe installation atvarious depths with the historical data escalated using the CCI However the depthof installation is unknown The service life of interceptors tunnels is 50 years
Table B-8Historical New Interceptors Tunnels Installation Costs
Size Source Unit CostLF Year 2003 Unit CostLF (CCI) Source
78 $60000 1998 $67885 3
Avg $67885
84 $62000 1998 $70148 3
Avg $70148
96 $70000 1998 $79199 3
Avg $79199
Size Source Unit CostLF Year 2003 Unit CostLF (CCI) Source
102 $75000 1998 $84856 3
7182019 Basis of Cost Estimates
httpslidepdfcomreaderfullbasis-of-cost-estimates 4867
Detroit Water and Sewerage DepartmentBasis of Cost Estimates
September 2003 47
Avg $84856
108 80000 1998 $90514 3
Avg $90514
120 $90000 1985 $143700 1
Avg $143700
B14 Miscellaneous RepairsThis cost estimating technical memorandum reviewed the costs for various sewersystem repairs that were not scheduled or included in the WWMP CIP developmentThis section contains the results of this repair cost review
Sump Pump Disconnection
Sump Pump Disconnection consists of removal of sump valves electrical connectionsand restoration These costs in unit cost per connection are estimated at $6720 in2000 dollars
Root Control
Root Control consists of utilizing chemical methods The estimate includesmobilization set up and furnishing of all incidentals Table B-9 shows the estimate inunit cost per linear foot of pipe with the historical data escalated using the CCI
Table B-9Historical Root Control Costs
SizeSource Unit
CostLF Year 2003 Unit CostLF (CCI) Source
Al l $200 1982 $350 5
$200 1988 $296 8
$140 1989 $203 9
$200 2000 $215 20
$225 2000 $242 20
$275 2000 $296 20
Avg $267
B15 Historical ReferencesShown on each spreadsheet is a reference code to the source of individual unit pricesTable B-10 shows the references used for the historical estimates in Appendices A andB
7182019 Basis of Cost Estimates
httpslidepdfcomreaderfullbasis-of-cost-estimates 4967
Detroit Water and Sewerage DepartmentBasis of Cost Estimates
September 2003 48
Table B-10Historical References
Source Title Date
1 Unidentified CDM Documents 1985
2Beaconsfield Relief Sewer Cleaning Manholes Inspection forSouth Macomb Sanitary District 1999
3 SOCSDS Project Plan 1998
4 Cost Effective Analysis 1998
5 Grosse Pointe Infrastructure 1982
6 City of Rochester Hills SDA 1999
7 HRC Detailed Cost Estimates 1997
8 Beverly Hills Local Sewer Study Rehabilitation Program 1988
9 Unidentified CDM Documents 1989
10 Unidentified Construction Cost Estimate
11 South Macomb Sanitary District 1999
12 City of Rochester Hills Sanitary Sewer Evaluation Survey 1996
13 South Macomb Sanitary District Appendix J 1996
14 Clinton-Oakland Sewage Disposal System 1971
15 City of Hazel Park MI
16 Farmington MI Sewer Seperation Improvements 1990
17 Basic Requirements Report Evergreen-Farmington Relief 1985
18 Cost Estimate 1975
19 Pre-Rehabilitation Local Sewer Costs 1990
20 Ann Arbor SSO Prevention Task Force 2000
B16 Means and Manufacturersrsquo EstimatesThe calculation of construction costs using the RW Means methodology requiresprices for component materials and construction activities (ie excavation orbackfilling) The following table presents the component costs used in the
development of construction cost guidelines
7182019 Basis of Cost Estimates
httpslidepdfcomreaderfullbasis-of-cost-estimates 5067
Detroit Water and Sewerage DepartmentBasis of Cost Estimates
September 2003 49
Table B-11Component Costs for Means and Manufacturersrsquo Estimates
Item Size Description Unit Cost Units Source
Excavation
Excavation common earth hauling
away fill up to 4 mi $1549 CY Means
BackfillCommon earth front-end loaderCompaction 12 lifts $882 CY Means
Select FillCrushed bank run gravelcompaction 6 lifts $2650 CY Means
Sheeting 8 DeepWood solid sheeting incl Walesbraces and spacers Drive amp Extract $668 SF Means
16 DeepWood solid sheeting incl Walesbraces and spacers Drive amp Extract $876 SF Means
24 DeepWood solid sheeting incl Walesbraces and spacers Drive amp Extract $1074 SF Means
32 DeepWood solid sheeting incl Walesbraces and spacers Drive amp Extract $1199 SF Means
Pavement Removal Bituminous 4 to 6 thick $572 SY Means
Saw Cutting Asphalt 6 thick $281 LF Means
Pavement Replacement Over Trench 6 thick $4333 SY Means
Non-Reinforced ConcretePipe 8 Bell and Spigot Joints Extra strength $1231 LF Means
10 Bell and Spigot Joints Extra strength $1305 LF Means
12 Bell and Spigot Joints Extra strength $1480 LF Means
Reinforced Concrete Pipe 12
Class 3 BampS or TampG Joints
wgaskets $1890 LF Means
15Class 3 BampS or TampG Jointswgaskets $2167 LF Means
18Class 3 BampS or TampG Jointswgaskets $2536 LF Means
7182019 Basis of Cost Estimates
httpslidepdfcomreaderfullbasis-of-cost-estimates 5167
Detroit Water and Sewerage DepartmentBasis of Cost Estimates
September 2003 50
Item Size Description Unit Cost Units Source
Reinforced Concrete Pipe 21Class 3 BampS or TampG Joints wogaskets $3135 LF Means
24Class 3 BampS or TampG Jointswgaskets $3504 LF Means
27Class 3 BampS or TampG Joints wogaskets $5302 LF Means
30Class 3 BampS or TampG Jointswgaskets $6592 LF Means
36Class 3 BampS or TampG Jointswgaskets $8990 LF Means
42
Class 3 BampS or TampG Joints wo
gaskets $9220 LF Means
48Class 3 BampS or TampG Jointswgaskets $13185 LF Means
54Class 3 BampS or TampG Jointswgaskets $14845 LF Means
60Class 3 BampS or TampG Joints wogaskets $16504 LF Means
66Class 3 BampS or TampG Joints wogaskets $23004 LF Means
72Class 3 BampS or TampG Jointswgaskets $29504 LF Means
78Class 3 BampS or TampG Joints wogaskets $32500 LF Means
84Class 3 BampS or TampG Joints wogaskets $35497 LF Means
96Class 3 BampS or TampG Jointswgaskets $43795 LF Means
102
Class 3 BampS or TampG Joints wo
gaskets $46000 LF Means
108Class 3 BampS or TampG Joints wogaskets $48300 LF Means
120Class 3 BampS or TampG Joints wogaskets $53000 LF Means
7182019 Basis of Cost Estimates
httpslidepdfcomreaderfullbasis-of-cost-estimates 5267
Detroit Water and Sewerage DepartmentBasis of Cost Estimates
September 2003 51
Item Size Description Unit Cost Units Source
Ductile Iron Pipe 4 Class 50 Cement Lined Mech Joint $1982 LF Means
6 Class 50 Cement Lined Mech Joint $2305 LF Means
8 Class 50 Cement Lined Mech Joint $2812 LF Means
10 Class 50 Cement Lined Mech Joint $3458 LF Means
12 Class 50 Cement Lined Mech Joint $4103 LF Means
14 Class 50 Cement Lined Mech Joint $4656 LF Means
16 Class 50 Cement Lined Mech Joint $5670 LF Means
18 Class 50 Cement Lined Mech Joint $6731 LF Means
20 Class 50 Cement Lined Mech Joint $7745 LF Means
24 Class 50 Cement Lined Mech Joint $9958 LF Means
48 Class 50 Cement Lined Mech Joint $23234 LF Est
PVC Pipe (SDR35) 6 SDR 35 BampS $512 LF Means
6 SDR 35 BampS 45 Degree Bend $7376 LF Means
HDPEPipe for Sliplining 4HDPE Pipe PE3408 DR21 (80 psi)price installed $442 LF Manufact
6HDPE Pipe PE3408 DR21 (80 psi)price installed $958 LF Manufact
8
HDPE Pipe PE3408 DR21 (80 psi)
price installed $1623 LF Manufact
10HDPE Pipe PE3408 DR21 (80 psi)price installed $2521 LF Manufact
12HDPE Pipe PE3408 DR21 (80 psi)price installed $3547 LF Manufact
7182019 Basis of Cost Estimates
httpslidepdfcomreaderfullbasis-of-cost-estimates 5367
Detroit Water and Sewerage DepartmentBasis of Cost Estimates
September 2003 52
Item Size Description Unit Cost Units Source
HDPEPipe for Sliplining 14HDPE Pipe PE3408 DR21 (80 psi)price installed $4276 LF Manufact
16HDPE Pipe PE3408 DR21 (80 psi)price installed $5586 LF Manufact
18HDPE Pipe PE3408 DR21 (80 psi)price installed $7069 LF Manufact
20HDPE Pipe PE3408 DR21 (80 psi)price installed $8728 LF Manufact
22HDPE Pipe PE3408 DR21 (80 psi)price installed $10560 LF Manufact
24
HDPE Pipe PE3408 DR21 (80 psi)
price installed $12567 LF Manufact
26HDPE Pipe PE3408 DR21 (80 psi)price installed $14749 LF Manufact
28HDPE Pipe PE3408 DR21 (80 psi)price installed $17106 LF Manufact
30HDPE Pipe PE3408 DR21 (80 psi)price installed $19637 LF Manufact
32HDPE Pipe PE3408 DR21 (80 psi)price installed $22342 LF Manufact
36HDPE Pipe PE3408 DR21 (80 psi)price installed $28277 LF Manufact
42HDPE Pipe PE3408 DR21 (80 psi)price installed $38488 LF Manufact
48HDPE Pipe PE3408 DR21 (80 psi)price installed $50270 LF Manufact
52HDPE Pipe PE3408 DR21 (80 psi)price installed $57869 LF Manufact
54
HDPE Pipe PE3408 DR21 (80 psi)
price installed $63623 LF Manufact
Manholes 4 DiaPrecast Concrete not incl Excavbackfill frame cover sheeting $17979 VLF Means
5 DiaPrecast Concrete not incl Excavbackfill frame cover sheeting $18809 VLF Means
7182019 Basis of Cost Estimates
httpslidepdfcomreaderfullbasis-of-cost-estimates 5467
Detroit Water and Sewerage DepartmentBasis of Cost Estimates
September 2003 53
Item Size Description Unit Cost Units Source
Manholes 6 DiaPrecast Concrete not incl Excavbackfill frame cover sheeting $28582 VLF Means
7 DiaPrecast Concrete not incl Excavbackfill frame cover sheeting $38355 VLF Means
8 DiaPrecast Concrete not incl Excavbackfill frame cover sheeting $48128 VLF Means
B17 Meanrsquos Unit Cost Estimates
Table B-12 contains a sample estimating sheet for calculating each component costusing the material and labor costs identified in the previous section
7182019 Basis of Cost Estimates
httpslidepdfcomreaderfullbasis-of-cost-estimates 5567
Detroit Water and Sewerage DepartmentBasis of Cost Estimates
September 2003 54
Table B-12Sample Component Costs Estimator
Quick Sewer Estimator
Force Mains
Dimensions
Pipe Size 14 in
Trench Width 4 Ft not less than 32
Trench Depth 6 Ft
Length 1 Ft
Material Costs
Pipe CostLF 66 $LF
Excav CostCY 13 $CYBackfill Cost CY 10 $CY
Select Fill CostCY 12 $CY
Pavament DemoCost SY 7 $SY
New Pavement Cost SY 29 $SY
Saw Cut Per LF 4 $LF
Sheeting Cost SF 0 $SF
May not be required for excavations under 5 deep
Pavement A (sy)= 044
Vexcav (cy) = Vbfill (cy) =
089 049
Hbfill (ft)
Sheeting (sf) Common Fill 333333
12
Vsfill (cy) =
036 Hsfill (ft)
Select Fill 266667
W (ft) = 4
Total Costs
7182019 Basis of Cost Estimates
httpslidepdfcomreaderfullbasis-of-cost-estimates 5667
Detroit Water and Sewerage DepartmentBasis of Cost Estimates
September 2003 55
Pipe $6600
Excav $622
Backfill $494
Select Fill $427
Pavement Demo $311New Pavement $1289
Saw Cut $800
Sheeting Cost $000
Total Price $10543
Price Per Foot $10543 LF
7182019 Basis of Cost Estimates
httpslidepdfcomreaderfullbasis-of-cost-estimates 5767
Detroit Water and Sewerage DepartmentBasis of Cost Estimates
September 2003 56
Appendix C
Unit Costs for Treatment Facilities
7182019 Basis of Cost Estimates
httpslidepdfcomreaderfullbasis-of-cost-estimates 5867
Detroit Water and Sewerage DepartmentBasis of Cost Estimates
September 2003 57
Appendix C ndash Unit Costs for Treatment FacilitiesThe following tables outline the unit costs for treatment facilities derived from projectcost estimates These unit costs are provided for future estimating of these facilitiesand are the total cost X 1000 They are base construction costs only and do notinclude engineering fees allowances or contingencies
Table C-1Influent Pump Station Unit Cost
Capacity 2000 2010 2020 2030 2040 2050
394 mgd $1960 $2320 $2820 $3320 $3820 $4320
400 mgd $3810 $4520 $5490 $6460 $7430 $8400
491 mgd $2060 $2440 $2970 $3490 $4010 $4530
615 mgd $2510 $2980 $3620 $4260 $4900 $5540
615 mgd $2510 $2980 $3620 $4260 $4900 $5540
615 mgd $3050 $3620 $4400 $5180 $5960 $6740
619 mgd $3150 $3740 $4550 $5350 $6150 $6950
860 mgd $4440 $5270 $6410 $7540 $8670 $9800
1040 mgd $5940 $7040 $8560 $10070 $11580 $13090
1080 mgd $3790 $4490 $5460 $6420 $7380 $8340
1130 mgd $6090 $7220 $8780 $10330 $11880 $13420
1260 mgd $4510 $5350 $6500 $7650 $8800 $9940
1580 mgd $6020 $7140 $8680 $10210 $11740 $13270
1890 mgd $6350 $7530 $9150 $10770 $12390 $14000
2535 mgd $7030 $8340 $10140 $11930 $13720 $15500
3105 mgd $7030 $8340 $10140 $11930 $13720 $15500
Table C-2
Screening and Grit Chamber Unit Cost Capacity 2000 2010 2020 2030 2040 2050
116 mgd $1530 $1810 $2200 $2590 $2980 $3370
143 mgd $2030 $2410 $2930 $3450 $3970 $4490
216 mgd $2210 $2620 $3180 $3740 $4300 $4860
221 mgd $3490 $4140 $5030 $5920 $6810 $7700
226 mgd $3490 $4140 $5030 $5920 $6810 $7700
322 mgd $4500 $5340 $6490 $7640 $8790 $9930
322 mgd $4500 $5340 $6490 $7640 $8790 $9930
368 mgd $3240 $3840 $4670 $5490 $6320 $7140
409 mgd $3700 $4390 $5340 $6280 $7220 $8160
471 mgd $6190 $7340 $8920 $10500 $12080 $13650471 mgd $5940 $7040 $8560 $10070 $11580 $13090
554 mgd $4520 $5360 $6510 $7660 $8810 $9960
576 mgd $5190 $6160 $7490 $8810 $10130 $11450
636 mgd $5600 $6640 $8070 $9500 $10930 $12350
1000 mgd $9770 $11590 $14090 $16580 $19070 $21550
1250 mgd $11300 $13400 $16290 $19170 $22050 $24920
7182019 Basis of Cost Estimates
httpslidepdfcomreaderfullbasis-of-cost-estimates 5967
Detroit Water and Sewerage DepartmentBasis of Cost Estimates
September 2003 58
Table C-3 Aeration Bas in wi th Nit ri ficat ion Unit Cost
Capacity 2000 2010 2020 2030 2040 2050
113 mgd $10400 $12330 $14990 $17640 $20290 $22930
140 mgd $11200 $13280 $16140 $18990 $21840 $24680
211 mgd $17300 $20520 $24940 $29350 $33760 $38150
211 mgd $17300 $20520 $24940 $29350 $33760 $38150211 mgd $16000 $18980 $23070 $27150 $31230 $35290
308 mgd $22600 $26800 $32570 $38320 $44080 $49810
308 mgd $22600 $26800 $32570 $38320 $44080 $49810
359 mgd $24200 $28700 $34880 $41040 $47210 $53350
400 mgd $22600 $26800 $32570 $38320 $44080 $49810
450 mgd $32300 $38310 $46560 $54780 $63010 $71200
450 mgd $31800 $37710 $45830 $53930 $62040 $70110
540 mgd $35300 $41860 $50880 $59870 $68870 $77830
563 mgd $36800 $43640 $53040 $62410 $71790 $81130
622 mgd $39300 $46610 $56650 $66660 $76680 $86650
Table C-4Primary Clarifiers Unit Cost
Capacity 2000 2010 2020 2030 2040 2050
116 mgd $1530 $1810 $2200 $2590 $2980 $3370
143 mgd $2030 $2410 $2930 $3450 $3970 $4490
216 mgd $2210 $2620 $3180 $3740 $4300 $4860
221 mgd $3490 $4140 $5030 $5920 $6810 $7700
226 mgd $3490 $4140 $5030 $5920 $6810 $7700
322 mgd $4500 $5340 $6490 $7640 $8790 $9930
322 mgd $4500 $5340 $6490 $7640 $8790 $9930
368 mgd $3240 $3840 $4670 $5490 $6320 $7140
409 mgd $3700 $4390 $5340 $6280 $7220 $8160
471 mgd $6190 $7340 $8920 $10500 $12080 $13650
471 mgd $5940 $7040 $8560 $10070 $11580 $13090
554 mgd $4520 $5360 $6510 $7660 $8810 $9960
576 mgd $5190 $6160 $7490 $8810 $10130 $11450
636 mgd $5600 $6640 $8070 $9500 $10930 $12350
1000 mgd $9770 $11590 $14090 $16580 $19070 $21550
1250 mgd $11300 $13400 $16290 $19170 $22050 $24920
Table C-5Complete Mix Activated Sludge Unit Cost
Capacity 2000 2010 2020 2030 2040 2050
100 mgd $21800 $25850 $31420 $36970 $42530 $48060
125 mgd $25300 $30000 $36460 $42900 $49350 $55770
7182019 Basis of Cost Estimates
httpslidepdfcomreaderfullbasis-of-cost-estimates 6067
Detroit Water and Sewerage DepartmentBasis of Cost Estimates
September 2003 59
Table C-6Iron Feed System Unit Cost
Capacity 2000 2010 2020 2030 2040 2050
113 mgd $152 $180 $220 $260 $300 $340
140 mgd $152 $180 $220 $260 $300 $340
211 mgd $152 $180 $220 $260 $300 $340
211 mgd $152 $180 $220 $260 $300 $340211 mgd $152 $180 $220 $260 $300 $340
308 mgd $156 $190 $230 $270 $310 $350
308 mgd $156 $190 $230 $270 $310 $350
359 mgd $175 $210 $260 $310 $360 $410
400 mgd $164 $190 $230 $270 $310 $350
450 mgd $182 $220 $270 $320 $370 $420
450 mgd $182 $220 $270 $320 $370 $420
540 mgd $208 $250 $300 $350 $400 $450
563 mgd $189 $220 $270 $320 $370 $420
622 mgd $197 $230 $280 $330 $380 $430
1000 mgd $205 $240 $290 $340 $390 $440
1250 mgd $225 $270 $330 $390 $450 $510
Table C-7Coagulation-Flocculation Unit Cost
Capacity 2000 2010 2020 2030 2040 2050
100 mgd $19700 $23360 $28390 $33410 $38430 $43430
125 mgd $24100 $28580 $34740 $40880 $47020 $53130
Table C-8Secondary Clarifiers Unit Cost
Capacity 2000 2010 2020 2030 2040 2050
113 mgd $3050 $3620 $4400 $5180 $5960 $6740140 mgd $3800 $4510 $5480 $6450 $7420 $8380
211 mgd $4430 $5250 $6380 $7510 $8640 $9760
211 mgd $4430 $5250 $6380 $7510 $8640 $9760
211 mgd $4870 $5780 $7030 $8270 $9510 $10750
308 mgd $5800 $6880 $8360 $9840 $11320 $12790
308 mgd $5800 $6880 $8360 $9840 $11320 $12790
359 mgd $7120 $8440 $10260 $12070 $13880 $15680
400 mgd $6280 $7450 $9050 $10650 $12250 $13840
450 mgd $8070 $9570 $11630 $13680 $15740 $17790
450 mgd $8070 $9570 $11630 $13680 $15740 $17790
540 mgd $10400 $12330 $14990 $17640 $20290 $22930
563 mgd $11500 $13640 $16580 $19510 $22440 $25360
622 mgd $12400 $14710 $17880 $21040 $24200 $27350
1000 mgd $13700 $16250 $19750 $23240 $26730 $30210
1250 mgd $15200 $18030 $21910 $25780 $29650 $33510
7182019 Basis of Cost Estimates
httpslidepdfcomreaderfullbasis-of-cost-estimates 6167
Detroit Water and Sewerage DepartmentBasis of Cost Estimates
September 2003 60
Table C-9Intermediate Pumping Unit Cost
Capacity 2000 2010 2020 2030 2040 2050
253 mgd $734 $870 $1060 $1250 $1440 $1630
350 mgd $1060 $1260 $1530 $1800 $2070 $2340
400 mgd $1220 $1450 $1760 $2070 $2380 $2690
446 mgd $1380 $1640 $1990 $2340 $2690 $3040452 mgd $1410 $1670 $2030 $2390 $2750 $3110
529 mgd $1680 $1990 $2420 $2850 $3280 $3710
611 mgd $1680 $1990 $2420 $2850 $3280 $3710
669 mgd $1860 $2210 $2690 $3170 $3650 $4120
743 mgd $2090 $2480 $3010 $3540 $4070 $4600
849 mgd $2430 $2880 $3500 $4120 $4740 $5360
942 mgd $2470 $2930 $3560 $4190 $4820 $5450
1040 mgd $2770 $3290 $4000 $4710 $5420 $6120
1050 mgd $2810 $3330 $4050 $4770 $5490 $6200
1130 mgd $3040 $3610 $4390 $5170 $5950 $6720
Table C-10Filtration Unit Cost
Capacity 2000 2010 2020 2030 2040 2050
113 mgd $3930 $4660 $5660 $6660 $7660 $8660
140 mgd $5040 $5980 $7270 $8550 $9830 $11110
211 mgd $6210 $7360 $8950 $10530 $12110 $13680
211 mgd $6220 $7380 $8970 $10550 $12140 $13720
308 mgd $7900 $9370 $11390 $13400 $15410 $17410
359 mgd $8440 $10010 $12170 $14320 $16470 $18610
400 mgd $9190 $10900 $13250 $15590 $17930 $20260
450 mgd $10400 $12330 $14990 $17640 $20290 $22930
540 mgd $11800 $13990 $17000 $20000 $23010 $26000563 mgd $12200 $14470 $17590 $20700 $23810 $26910
622 mgd $13500 $16010 $19460 $22900 $26340 $29770
7182019 Basis of Cost Estimates
httpslidepdfcomreaderfullbasis-of-cost-estimates 6267
Detroit Water and Sewerage DepartmentBasis of Cost Estimates
September 2003 61
Table C-11Ultraviolet Disinfection Unit Cost
Capacity 2000 2010 2020 2030 2040 2050
259 mgd $912 $1080 $1310 $1540 $1770 $2000
351 mgd $1280 $1520 $1850 $2180 $2510 $2840
400 mgd $1530 $1810 $2200 $2590 $2980 $3370
452 mgd $2040 $2420 $2940 $3460 $3980 $4500452 mgd $3310 $3930 $4780 $5620 $6460 $7300
452 mgd $1750 $2080 $2530 $2980 $3430 $3880
619 mgd $1750 $2080 $2530 $2980 $3430 $3880
619 mgd $2280 $2700 $3280 $3860 $4440 $5020
679 mgd $2550 $3020 $3670 $4320 $4970 $5620
860 mgd $3830 $4540 $5520 $6500 $7480 $8450
860 mgd $3060 $3630 $4410 $5190 $5970 $6750
956 mgd $3400 $4030 $4900 $5770 $6640 $7500
1036 mgd $3830 $4540 $5520 $6500 $7480 $8450
1126 mgd $4100 $4860 $5910 $6950 $7990 $9030
1750 mgd $8270 $9810 $11920 $14030 $16140 $18240
2000 mgd $8620 $10220 $12420 $14610 $16810 $19000
Table C-12Post Aeration Unit Cost
Capacity 2000 2010 2020 2030 2040 2050
113 mgd $114 $140 $170 $200 $230 $260
140 mgd $134 $160 $190 $220 $250 $280
211 mgd $142 $170 $210 $250 $290 $330
211 mgd $142 $170 $210 $250 $290 $330
211 mgd $167 $200 $240 $280 $320 $360
308 mgd $182 $220 $270 $320 $370 $420308 mgd $182 $220 $270 $320 $370 $420
359 mgd $260 $310 $380 $450 $520 $590
400 mgd $273 $320 $390 $460 $530 $600
450 mgd $237 $280 $340 $400 $460 $520
450 mgd $237 $280 $340 $400 $460 $520
540 mgd $363 $430 $520 $610 $700 $790
563 mgd $358 $420 $510 $600 $690 $780
622 mgd $388 $460 $560 $660 $760 $860
1000 mgd $455 $540 $660 $780 $900 $1020
1250 mgd $554 $660 $800 $940 $1080 $1220
7182019 Basis of Cost Estimates
httpslidepdfcomreaderfullbasis-of-cost-estimates 6367
Detroit Water and Sewerage DepartmentBasis of Cost Estimates
September 2003 62
Table C-13Blower System Unit Cost
Capacity 2000 2010 2020 2030 2040 2050
170 mgd $718 $850 $1030 $1210 $1390 $1570
210 mgd $786 $930 $1130 $1330 $1530 $1730
317 mgd $1120 $1330 $1620 $1910 $2200 $2490
317 mgd $1120 $1330 $1620 $1910 $2200 $2490317 mgd $1060 $1260 $1530 $1800 $2070 $2340
462 mgd $7440 $8820 $10720 $12610 $14510 $16400
462 mgd $7440 $8820 $10720 $12610 $14510 $16400
539 mgd $7440 $8820 $10720 $12610 $14510 $16400
600 mgd $6430 $7630 $9270 $10910 $12550 $14180
675 mgd $8920 $10580 $12860 $15130 $17400 $19660
675 mgd $8840 $10480 $12740 $14990 $17240 $19480
810 mgd $8950 $10610 $12900 $15180 $17460 $19730
845 mgd $8600 $10200 $12400 $14590 $16780 $18960
933 mgd $8950 $10610 $12900 $15180 $17460 $19730
1500 mgd $6370 $7550 $9180 $10800 $12420 $14040
1875 mgd $7670 $9100 $11060 $13010 $14970 $16920
Table C-14Gravity Thickening Unit Cost
Capacity 2000 2010 2020 2030 2040 2050
113 mgd $278 $330 $400 $470 $540 $610
140 mgd $319 $380 $460 $540 $620 $700
211 mgd $693 $820 $1000 $1180 $1360 $1540
211 mgd $555 $660 $800 $940 $1080 $1220
211 mgd $396 $470 $570 $670 $770 $870
308 mgd $708 $840 $1020 $1200 $1380 $1560308 mgd $723 $860 $1050 $1240 $1430 $1620
359 mgd $609 $720 $880 $1040 $1200 $1360
400 mgd $581 $690 $840 $990 $1140 $1290
450 mgd $927 $1100 $1340 $1580 $1820 $2060
450 mgd $944 $1120 $1360 $1600 $1840 $2080
540 mgd $830 $980 $1190 $1400 $1610 $1820
563 mgd $768 $910 $1110 $1310 $1510 $1710
622 mgd $830 $980 $1190 $1400 $1610 $1820
1000 mgd $723 $860 $1050 $1240 $1430 $1620
1250 mgd $845 $1000 $1220 $1440 $1660 $1880
7182019 Basis of Cost Estimates
httpslidepdfcomreaderfullbasis-of-cost-estimates 6467
Detroit Water and Sewerage DepartmentBasis of Cost Estimates
September 2003 63
Table C-15Centrifugation Unit Cost
Capacity 2000 2010 2020 2030 2040 2050
113 mgd $2050 $2430 $2950 $3470 $3990 $4510
14 mgd $2440 $2890 $3510 $4130 $4750 $5370
211 mgd $2930 $3470 $4220 $4970 $5720 $6460
211 mgd $2220 $2630 $3200 $3770 $4340 $4900211 mgd $4160 $4930 $5990 $7050 $8110 $9160
308 mgd $2990 $3550 $4310 $5070 $5830 $6590
308 mgd $3040 $3610 $4390 $5170 $5950 $6720
359 mgd $6200 $7350 $8930 $10510 $12090 $13660
40 mgd $6150 $7290 $8860 $10430 $12000 $13560
45 mgd $4420 $5240 $6370 $7500 $8630 $9750
45 mgd $4500 $5340 $6490 $7640 $8790 $9930
54 mgd $9210 $10920 $13270 $15610 $17960 $20300
563 mgd $10700 $12690 $15420 $18140 $20870 $23580
622 mgd $11900 $14110 $17150 $20180 $23210 $26230
100 mgd $15000 $17790 $21620 $25440 $29260 $33060
125 mgd $17900 $21230 $25800 $30360 $34920 $39460
Table C-16Hauling and Landfilling Unit Cost
Capacity 2000 2010 2020 2030 2040 2050
113 mgd $438 $520 $630 $740 $850 $960
140 mgd $546 $650 $790 $930 $1070 $1210
211 mgd $1060 $1260 $1530 $1800 $2070 $2340
211 mgd $788 $930 $1130 $1330 $1530 $1730
211 mgd $810 $960 $1170 $1380 $1590 $1800
308 mgd $1090 $1290 $1570 $1850 $2130 $2410308 mgd $1100 $1300 $1580 $1860 $2140 $2420
359 mgd $1400 $1660 $2020 $2380 $2740 $3100
400 mgd $1370 $1620 $1970 $2320 $2670 $3020
450 mgd $1530 $1810 $2200 $2590 $2980 $3370
450 mgd $1560 $1850 $2250 $2650 $3050 $3450
540 mgd $2150 $2550 $3100 $3650 $4200 $4750
563 mgd $2030 $2410 $2930 $3450 $3970 $4490
622 mgd $2220 $2630 $3200 $3770 $4340 $4900
1000 mgd $2360 $2800 $3400 $4000 $4600 $5200
1250 mgd $2950 $3500 $4250 $5000 $5750 $6500
7182019 Basis of Cost Estimates
httpslidepdfcomreaderfullbasis-of-cost-estimates 6567
Detroit Water and Sewerage DepartmentBasis of Cost Estimates
September 2003 64
Appendix D
Wastewater Treatment Plant Ongoing Repair andReplacement Cost Estimates
7182019 Basis of Cost Estimates
httpslidepdfcomreaderfullbasis-of-cost-estimates 6667
Detroit Water and Sewerage DepartmentBasis of Cost Estimates
September 2003 65
SUMMARY OF CAPITAL IMPROVEMENT PROJECT COSTS
Explanation of Capital Improvement Costs
NOTE This analysis was provided by the staff of the Detroit Wastewater Partners (DWSDProject PC-744 - Wastewater Treatment Plant Upgrade) and DWSD Wastewater Plant staff Itwas completed in July 2003
General
1 Capital costs are presented by major process and non-process areas The project costsassume a major capital improvement project for the specified life cycle based on recent capitalimprovements performed under PC-744 other recent capital improvement projects (ie PC-740 PC-720 etc) and best engineering judgment The line items listed in each area areintended to provide a basis for the cost estimate to give an understanding of the level of costestimate assumptions used and items includednot included in the cost estimate It is unlikelyand not intended that the major capital projects would include all of the items listed at thespecified cycle Rather it is more likely that the overall cost would be broken into smallerprojects spread across a ~10 year period at the specified cycle
2 The percentages listed below were applied to each of the base construction costs Theseare similar to the percentages used in the Wastewater Master Plan (see Master Plan TechnicalMemo Basis of Cost Estimates dated August 15 2003)
- 30 Contingency (for miscellaneous items not included in the general cost estimate)
- 25 Contractor Overhead and Profit and General Conditions
- 20 Engineering Legal Administration and Management
3 Capital costs presented assume continued use of the existing processes in place at the
WWTP It does not assume major changes to the treatment process such as a new form ofprimary treatment or biological treatment The costs also do not include potentially newprocesses that may be required for regulatory or other reasons such as filtration of thesecondary effluent sludge digestion or major change to the type of effluent disinfection
4 Capital costs presented for each process area do not include maintenance related costs forroutine maintenance between the major capital improvement cycles It is assumed thatmaintenance activities will be performed on the equipment at the required frequencies tomaintain the equipment in good worknig order between major rehabilitation or replacementprojects
Link to Complete Spreadsheets is found on the Wastewater Master Plan
CD DWP Est of Capital Improvements for WWTP - 50-yrxls
7182019 Basis of Cost Estimates
httpslidepdfcomreaderfullbasis-of-cost-estimates 6767
Detroit Water and Sewerage DepartmentBasis of Cost Estimates
Table D1
SUMMARY OF CAPITAL IMPROVEMENT PROJECT COSTS
Area Life Cycle Start of Cycle 2003 Costs ($M)PROCESS RELATED
Pump Station No 1 20 2025 $ 63Pump Station No 2 20 2006 $ 66
Chemical Addition 20 2023 $ 9Rectangular Primary Clarifiers 20 2013 $ 86Circular Primary Clarifiers 20 2025 $ 84ILP Nos 1 2 3 4 7 20 2025 $ 29
Aeration Basins 20 2025 $ 55Cryo Plants 10 2015 $ 1Secondary Clarifiers 20 2020 $ 140SFE Pump Station 20 2010 $ 13
Chlorination 20 2022 $ 16
Dechlorination 20 2023 $ 12Hydraulic Structures 20 2020 $ 7Complex A and B 20 2025 $ 32
C-I Dewatering 15 2020 $ 31C-II Lower Level Dewatering 15 2019 $ 35C-II Upper Level Dewatering 15 2015 $ 42
C-I and C-II Incineration 15 2009 $ 139Sludge Offloading 20 2025 $ 19NON-PROCESS RELATED
AdminRagland Buildings 20 2025 $ 10Plant Security 10 2015 $ 10Plant-wide Paving 15 2020 $ 6Parking Structure 20 2025 $ 7Work Environment Improvements 10 2015 $ 5
Rehab of OampM Bldgs Warehouses 20 2007 $ 40Plant-wide Instrumentation 15 2020 $ 100General Electrical 20 2045 $ 29Plant-wide Secondary Water 15 2025 $ 6
Plant-wide Steam System 15 2023 $ 6Plant-wide Potable Water 15 2010 $ 2Plant -wide Drainage 15 2010 $ 2
Fire Protection Improvements 20 2006 $ 4Plant-Wide JOCs As-Needed Eng 1 2005 $ 3
Total $ 1107
7182019 Basis of Cost Estimates
httpslidepdfcomreaderfullbasis-of-cost-estimates 4767
Detroit Water and Sewerage DepartmentBasis of Cost Estimates
September 2003 46
Avg $35646
60 $34000 1997 $39096 7
Avg $39096
66 $47000 1998 $53177 3
$50000 1998 $56571 3
Avg $54874
Interceptors TunnelsInterceptor tunnel installation includes
Reinforced concrete pipe (78-120) Excavation and backfill of common earth Sheeting shoring and bracing 8rsquo Diameter manholes at 600 feet Min bury to the crown of the pipe as listed below Minimum utility relocation Up to 6rdquo of bituminous pavement removal and replacement And furnishing of all incidentals
Table B-8 shows the estimates in unit cost x $1000 per mile of pipe installation atvarious depths with the historical data escalated using the CCI However the depthof installation is unknown The service life of interceptors tunnels is 50 years
Table B-8Historical New Interceptors Tunnels Installation Costs
Size Source Unit CostLF Year 2003 Unit CostLF (CCI) Source
78 $60000 1998 $67885 3
Avg $67885
84 $62000 1998 $70148 3
Avg $70148
96 $70000 1998 $79199 3
Avg $79199
Size Source Unit CostLF Year 2003 Unit CostLF (CCI) Source
102 $75000 1998 $84856 3
7182019 Basis of Cost Estimates
httpslidepdfcomreaderfullbasis-of-cost-estimates 4867
Detroit Water and Sewerage DepartmentBasis of Cost Estimates
September 2003 47
Avg $84856
108 80000 1998 $90514 3
Avg $90514
120 $90000 1985 $143700 1
Avg $143700
B14 Miscellaneous RepairsThis cost estimating technical memorandum reviewed the costs for various sewersystem repairs that were not scheduled or included in the WWMP CIP developmentThis section contains the results of this repair cost review
Sump Pump Disconnection
Sump Pump Disconnection consists of removal of sump valves electrical connectionsand restoration These costs in unit cost per connection are estimated at $6720 in2000 dollars
Root Control
Root Control consists of utilizing chemical methods The estimate includesmobilization set up and furnishing of all incidentals Table B-9 shows the estimate inunit cost per linear foot of pipe with the historical data escalated using the CCI
Table B-9Historical Root Control Costs
SizeSource Unit
CostLF Year 2003 Unit CostLF (CCI) Source
Al l $200 1982 $350 5
$200 1988 $296 8
$140 1989 $203 9
$200 2000 $215 20
$225 2000 $242 20
$275 2000 $296 20
Avg $267
B15 Historical ReferencesShown on each spreadsheet is a reference code to the source of individual unit pricesTable B-10 shows the references used for the historical estimates in Appendices A andB
7182019 Basis of Cost Estimates
httpslidepdfcomreaderfullbasis-of-cost-estimates 4967
Detroit Water and Sewerage DepartmentBasis of Cost Estimates
September 2003 48
Table B-10Historical References
Source Title Date
1 Unidentified CDM Documents 1985
2Beaconsfield Relief Sewer Cleaning Manholes Inspection forSouth Macomb Sanitary District 1999
3 SOCSDS Project Plan 1998
4 Cost Effective Analysis 1998
5 Grosse Pointe Infrastructure 1982
6 City of Rochester Hills SDA 1999
7 HRC Detailed Cost Estimates 1997
8 Beverly Hills Local Sewer Study Rehabilitation Program 1988
9 Unidentified CDM Documents 1989
10 Unidentified Construction Cost Estimate
11 South Macomb Sanitary District 1999
12 City of Rochester Hills Sanitary Sewer Evaluation Survey 1996
13 South Macomb Sanitary District Appendix J 1996
14 Clinton-Oakland Sewage Disposal System 1971
15 City of Hazel Park MI
16 Farmington MI Sewer Seperation Improvements 1990
17 Basic Requirements Report Evergreen-Farmington Relief 1985
18 Cost Estimate 1975
19 Pre-Rehabilitation Local Sewer Costs 1990
20 Ann Arbor SSO Prevention Task Force 2000
B16 Means and Manufacturersrsquo EstimatesThe calculation of construction costs using the RW Means methodology requiresprices for component materials and construction activities (ie excavation orbackfilling) The following table presents the component costs used in the
development of construction cost guidelines
7182019 Basis of Cost Estimates
httpslidepdfcomreaderfullbasis-of-cost-estimates 5067
Detroit Water and Sewerage DepartmentBasis of Cost Estimates
September 2003 49
Table B-11Component Costs for Means and Manufacturersrsquo Estimates
Item Size Description Unit Cost Units Source
Excavation
Excavation common earth hauling
away fill up to 4 mi $1549 CY Means
BackfillCommon earth front-end loaderCompaction 12 lifts $882 CY Means
Select FillCrushed bank run gravelcompaction 6 lifts $2650 CY Means
Sheeting 8 DeepWood solid sheeting incl Walesbraces and spacers Drive amp Extract $668 SF Means
16 DeepWood solid sheeting incl Walesbraces and spacers Drive amp Extract $876 SF Means
24 DeepWood solid sheeting incl Walesbraces and spacers Drive amp Extract $1074 SF Means
32 DeepWood solid sheeting incl Walesbraces and spacers Drive amp Extract $1199 SF Means
Pavement Removal Bituminous 4 to 6 thick $572 SY Means
Saw Cutting Asphalt 6 thick $281 LF Means
Pavement Replacement Over Trench 6 thick $4333 SY Means
Non-Reinforced ConcretePipe 8 Bell and Spigot Joints Extra strength $1231 LF Means
10 Bell and Spigot Joints Extra strength $1305 LF Means
12 Bell and Spigot Joints Extra strength $1480 LF Means
Reinforced Concrete Pipe 12
Class 3 BampS or TampG Joints
wgaskets $1890 LF Means
15Class 3 BampS or TampG Jointswgaskets $2167 LF Means
18Class 3 BampS or TampG Jointswgaskets $2536 LF Means
7182019 Basis of Cost Estimates
httpslidepdfcomreaderfullbasis-of-cost-estimates 5167
Detroit Water and Sewerage DepartmentBasis of Cost Estimates
September 2003 50
Item Size Description Unit Cost Units Source
Reinforced Concrete Pipe 21Class 3 BampS or TampG Joints wogaskets $3135 LF Means
24Class 3 BampS or TampG Jointswgaskets $3504 LF Means
27Class 3 BampS or TampG Joints wogaskets $5302 LF Means
30Class 3 BampS or TampG Jointswgaskets $6592 LF Means
36Class 3 BampS or TampG Jointswgaskets $8990 LF Means
42
Class 3 BampS or TampG Joints wo
gaskets $9220 LF Means
48Class 3 BampS or TampG Jointswgaskets $13185 LF Means
54Class 3 BampS or TampG Jointswgaskets $14845 LF Means
60Class 3 BampS or TampG Joints wogaskets $16504 LF Means
66Class 3 BampS or TampG Joints wogaskets $23004 LF Means
72Class 3 BampS or TampG Jointswgaskets $29504 LF Means
78Class 3 BampS or TampG Joints wogaskets $32500 LF Means
84Class 3 BampS or TampG Joints wogaskets $35497 LF Means
96Class 3 BampS or TampG Jointswgaskets $43795 LF Means
102
Class 3 BampS or TampG Joints wo
gaskets $46000 LF Means
108Class 3 BampS or TampG Joints wogaskets $48300 LF Means
120Class 3 BampS or TampG Joints wogaskets $53000 LF Means
7182019 Basis of Cost Estimates
httpslidepdfcomreaderfullbasis-of-cost-estimates 5267
Detroit Water and Sewerage DepartmentBasis of Cost Estimates
September 2003 51
Item Size Description Unit Cost Units Source
Ductile Iron Pipe 4 Class 50 Cement Lined Mech Joint $1982 LF Means
6 Class 50 Cement Lined Mech Joint $2305 LF Means
8 Class 50 Cement Lined Mech Joint $2812 LF Means
10 Class 50 Cement Lined Mech Joint $3458 LF Means
12 Class 50 Cement Lined Mech Joint $4103 LF Means
14 Class 50 Cement Lined Mech Joint $4656 LF Means
16 Class 50 Cement Lined Mech Joint $5670 LF Means
18 Class 50 Cement Lined Mech Joint $6731 LF Means
20 Class 50 Cement Lined Mech Joint $7745 LF Means
24 Class 50 Cement Lined Mech Joint $9958 LF Means
48 Class 50 Cement Lined Mech Joint $23234 LF Est
PVC Pipe (SDR35) 6 SDR 35 BampS $512 LF Means
6 SDR 35 BampS 45 Degree Bend $7376 LF Means
HDPEPipe for Sliplining 4HDPE Pipe PE3408 DR21 (80 psi)price installed $442 LF Manufact
6HDPE Pipe PE3408 DR21 (80 psi)price installed $958 LF Manufact
8
HDPE Pipe PE3408 DR21 (80 psi)
price installed $1623 LF Manufact
10HDPE Pipe PE3408 DR21 (80 psi)price installed $2521 LF Manufact
12HDPE Pipe PE3408 DR21 (80 psi)price installed $3547 LF Manufact
7182019 Basis of Cost Estimates
httpslidepdfcomreaderfullbasis-of-cost-estimates 5367
Detroit Water and Sewerage DepartmentBasis of Cost Estimates
September 2003 52
Item Size Description Unit Cost Units Source
HDPEPipe for Sliplining 14HDPE Pipe PE3408 DR21 (80 psi)price installed $4276 LF Manufact
16HDPE Pipe PE3408 DR21 (80 psi)price installed $5586 LF Manufact
18HDPE Pipe PE3408 DR21 (80 psi)price installed $7069 LF Manufact
20HDPE Pipe PE3408 DR21 (80 psi)price installed $8728 LF Manufact
22HDPE Pipe PE3408 DR21 (80 psi)price installed $10560 LF Manufact
24
HDPE Pipe PE3408 DR21 (80 psi)
price installed $12567 LF Manufact
26HDPE Pipe PE3408 DR21 (80 psi)price installed $14749 LF Manufact
28HDPE Pipe PE3408 DR21 (80 psi)price installed $17106 LF Manufact
30HDPE Pipe PE3408 DR21 (80 psi)price installed $19637 LF Manufact
32HDPE Pipe PE3408 DR21 (80 psi)price installed $22342 LF Manufact
36HDPE Pipe PE3408 DR21 (80 psi)price installed $28277 LF Manufact
42HDPE Pipe PE3408 DR21 (80 psi)price installed $38488 LF Manufact
48HDPE Pipe PE3408 DR21 (80 psi)price installed $50270 LF Manufact
52HDPE Pipe PE3408 DR21 (80 psi)price installed $57869 LF Manufact
54
HDPE Pipe PE3408 DR21 (80 psi)
price installed $63623 LF Manufact
Manholes 4 DiaPrecast Concrete not incl Excavbackfill frame cover sheeting $17979 VLF Means
5 DiaPrecast Concrete not incl Excavbackfill frame cover sheeting $18809 VLF Means
7182019 Basis of Cost Estimates
httpslidepdfcomreaderfullbasis-of-cost-estimates 5467
Detroit Water and Sewerage DepartmentBasis of Cost Estimates
September 2003 53
Item Size Description Unit Cost Units Source
Manholes 6 DiaPrecast Concrete not incl Excavbackfill frame cover sheeting $28582 VLF Means
7 DiaPrecast Concrete not incl Excavbackfill frame cover sheeting $38355 VLF Means
8 DiaPrecast Concrete not incl Excavbackfill frame cover sheeting $48128 VLF Means
B17 Meanrsquos Unit Cost Estimates
Table B-12 contains a sample estimating sheet for calculating each component costusing the material and labor costs identified in the previous section
7182019 Basis of Cost Estimates
httpslidepdfcomreaderfullbasis-of-cost-estimates 5567
Detroit Water and Sewerage DepartmentBasis of Cost Estimates
September 2003 54
Table B-12Sample Component Costs Estimator
Quick Sewer Estimator
Force Mains
Dimensions
Pipe Size 14 in
Trench Width 4 Ft not less than 32
Trench Depth 6 Ft
Length 1 Ft
Material Costs
Pipe CostLF 66 $LF
Excav CostCY 13 $CYBackfill Cost CY 10 $CY
Select Fill CostCY 12 $CY
Pavament DemoCost SY 7 $SY
New Pavement Cost SY 29 $SY
Saw Cut Per LF 4 $LF
Sheeting Cost SF 0 $SF
May not be required for excavations under 5 deep
Pavement A (sy)= 044
Vexcav (cy) = Vbfill (cy) =
089 049
Hbfill (ft)
Sheeting (sf) Common Fill 333333
12
Vsfill (cy) =
036 Hsfill (ft)
Select Fill 266667
W (ft) = 4
Total Costs
7182019 Basis of Cost Estimates
httpslidepdfcomreaderfullbasis-of-cost-estimates 5667
Detroit Water and Sewerage DepartmentBasis of Cost Estimates
September 2003 55
Pipe $6600
Excav $622
Backfill $494
Select Fill $427
Pavement Demo $311New Pavement $1289
Saw Cut $800
Sheeting Cost $000
Total Price $10543
Price Per Foot $10543 LF
7182019 Basis of Cost Estimates
httpslidepdfcomreaderfullbasis-of-cost-estimates 5767
Detroit Water and Sewerage DepartmentBasis of Cost Estimates
September 2003 56
Appendix C
Unit Costs for Treatment Facilities
7182019 Basis of Cost Estimates
httpslidepdfcomreaderfullbasis-of-cost-estimates 5867
Detroit Water and Sewerage DepartmentBasis of Cost Estimates
September 2003 57
Appendix C ndash Unit Costs for Treatment FacilitiesThe following tables outline the unit costs for treatment facilities derived from projectcost estimates These unit costs are provided for future estimating of these facilitiesand are the total cost X 1000 They are base construction costs only and do notinclude engineering fees allowances or contingencies
Table C-1Influent Pump Station Unit Cost
Capacity 2000 2010 2020 2030 2040 2050
394 mgd $1960 $2320 $2820 $3320 $3820 $4320
400 mgd $3810 $4520 $5490 $6460 $7430 $8400
491 mgd $2060 $2440 $2970 $3490 $4010 $4530
615 mgd $2510 $2980 $3620 $4260 $4900 $5540
615 mgd $2510 $2980 $3620 $4260 $4900 $5540
615 mgd $3050 $3620 $4400 $5180 $5960 $6740
619 mgd $3150 $3740 $4550 $5350 $6150 $6950
860 mgd $4440 $5270 $6410 $7540 $8670 $9800
1040 mgd $5940 $7040 $8560 $10070 $11580 $13090
1080 mgd $3790 $4490 $5460 $6420 $7380 $8340
1130 mgd $6090 $7220 $8780 $10330 $11880 $13420
1260 mgd $4510 $5350 $6500 $7650 $8800 $9940
1580 mgd $6020 $7140 $8680 $10210 $11740 $13270
1890 mgd $6350 $7530 $9150 $10770 $12390 $14000
2535 mgd $7030 $8340 $10140 $11930 $13720 $15500
3105 mgd $7030 $8340 $10140 $11930 $13720 $15500
Table C-2
Screening and Grit Chamber Unit Cost Capacity 2000 2010 2020 2030 2040 2050
116 mgd $1530 $1810 $2200 $2590 $2980 $3370
143 mgd $2030 $2410 $2930 $3450 $3970 $4490
216 mgd $2210 $2620 $3180 $3740 $4300 $4860
221 mgd $3490 $4140 $5030 $5920 $6810 $7700
226 mgd $3490 $4140 $5030 $5920 $6810 $7700
322 mgd $4500 $5340 $6490 $7640 $8790 $9930
322 mgd $4500 $5340 $6490 $7640 $8790 $9930
368 mgd $3240 $3840 $4670 $5490 $6320 $7140
409 mgd $3700 $4390 $5340 $6280 $7220 $8160
471 mgd $6190 $7340 $8920 $10500 $12080 $13650471 mgd $5940 $7040 $8560 $10070 $11580 $13090
554 mgd $4520 $5360 $6510 $7660 $8810 $9960
576 mgd $5190 $6160 $7490 $8810 $10130 $11450
636 mgd $5600 $6640 $8070 $9500 $10930 $12350
1000 mgd $9770 $11590 $14090 $16580 $19070 $21550
1250 mgd $11300 $13400 $16290 $19170 $22050 $24920
7182019 Basis of Cost Estimates
httpslidepdfcomreaderfullbasis-of-cost-estimates 5967
Detroit Water and Sewerage DepartmentBasis of Cost Estimates
September 2003 58
Table C-3 Aeration Bas in wi th Nit ri ficat ion Unit Cost
Capacity 2000 2010 2020 2030 2040 2050
113 mgd $10400 $12330 $14990 $17640 $20290 $22930
140 mgd $11200 $13280 $16140 $18990 $21840 $24680
211 mgd $17300 $20520 $24940 $29350 $33760 $38150
211 mgd $17300 $20520 $24940 $29350 $33760 $38150211 mgd $16000 $18980 $23070 $27150 $31230 $35290
308 mgd $22600 $26800 $32570 $38320 $44080 $49810
308 mgd $22600 $26800 $32570 $38320 $44080 $49810
359 mgd $24200 $28700 $34880 $41040 $47210 $53350
400 mgd $22600 $26800 $32570 $38320 $44080 $49810
450 mgd $32300 $38310 $46560 $54780 $63010 $71200
450 mgd $31800 $37710 $45830 $53930 $62040 $70110
540 mgd $35300 $41860 $50880 $59870 $68870 $77830
563 mgd $36800 $43640 $53040 $62410 $71790 $81130
622 mgd $39300 $46610 $56650 $66660 $76680 $86650
Table C-4Primary Clarifiers Unit Cost
Capacity 2000 2010 2020 2030 2040 2050
116 mgd $1530 $1810 $2200 $2590 $2980 $3370
143 mgd $2030 $2410 $2930 $3450 $3970 $4490
216 mgd $2210 $2620 $3180 $3740 $4300 $4860
221 mgd $3490 $4140 $5030 $5920 $6810 $7700
226 mgd $3490 $4140 $5030 $5920 $6810 $7700
322 mgd $4500 $5340 $6490 $7640 $8790 $9930
322 mgd $4500 $5340 $6490 $7640 $8790 $9930
368 mgd $3240 $3840 $4670 $5490 $6320 $7140
409 mgd $3700 $4390 $5340 $6280 $7220 $8160
471 mgd $6190 $7340 $8920 $10500 $12080 $13650
471 mgd $5940 $7040 $8560 $10070 $11580 $13090
554 mgd $4520 $5360 $6510 $7660 $8810 $9960
576 mgd $5190 $6160 $7490 $8810 $10130 $11450
636 mgd $5600 $6640 $8070 $9500 $10930 $12350
1000 mgd $9770 $11590 $14090 $16580 $19070 $21550
1250 mgd $11300 $13400 $16290 $19170 $22050 $24920
Table C-5Complete Mix Activated Sludge Unit Cost
Capacity 2000 2010 2020 2030 2040 2050
100 mgd $21800 $25850 $31420 $36970 $42530 $48060
125 mgd $25300 $30000 $36460 $42900 $49350 $55770
7182019 Basis of Cost Estimates
httpslidepdfcomreaderfullbasis-of-cost-estimates 6067
Detroit Water and Sewerage DepartmentBasis of Cost Estimates
September 2003 59
Table C-6Iron Feed System Unit Cost
Capacity 2000 2010 2020 2030 2040 2050
113 mgd $152 $180 $220 $260 $300 $340
140 mgd $152 $180 $220 $260 $300 $340
211 mgd $152 $180 $220 $260 $300 $340
211 mgd $152 $180 $220 $260 $300 $340211 mgd $152 $180 $220 $260 $300 $340
308 mgd $156 $190 $230 $270 $310 $350
308 mgd $156 $190 $230 $270 $310 $350
359 mgd $175 $210 $260 $310 $360 $410
400 mgd $164 $190 $230 $270 $310 $350
450 mgd $182 $220 $270 $320 $370 $420
450 mgd $182 $220 $270 $320 $370 $420
540 mgd $208 $250 $300 $350 $400 $450
563 mgd $189 $220 $270 $320 $370 $420
622 mgd $197 $230 $280 $330 $380 $430
1000 mgd $205 $240 $290 $340 $390 $440
1250 mgd $225 $270 $330 $390 $450 $510
Table C-7Coagulation-Flocculation Unit Cost
Capacity 2000 2010 2020 2030 2040 2050
100 mgd $19700 $23360 $28390 $33410 $38430 $43430
125 mgd $24100 $28580 $34740 $40880 $47020 $53130
Table C-8Secondary Clarifiers Unit Cost
Capacity 2000 2010 2020 2030 2040 2050
113 mgd $3050 $3620 $4400 $5180 $5960 $6740140 mgd $3800 $4510 $5480 $6450 $7420 $8380
211 mgd $4430 $5250 $6380 $7510 $8640 $9760
211 mgd $4430 $5250 $6380 $7510 $8640 $9760
211 mgd $4870 $5780 $7030 $8270 $9510 $10750
308 mgd $5800 $6880 $8360 $9840 $11320 $12790
308 mgd $5800 $6880 $8360 $9840 $11320 $12790
359 mgd $7120 $8440 $10260 $12070 $13880 $15680
400 mgd $6280 $7450 $9050 $10650 $12250 $13840
450 mgd $8070 $9570 $11630 $13680 $15740 $17790
450 mgd $8070 $9570 $11630 $13680 $15740 $17790
540 mgd $10400 $12330 $14990 $17640 $20290 $22930
563 mgd $11500 $13640 $16580 $19510 $22440 $25360
622 mgd $12400 $14710 $17880 $21040 $24200 $27350
1000 mgd $13700 $16250 $19750 $23240 $26730 $30210
1250 mgd $15200 $18030 $21910 $25780 $29650 $33510
7182019 Basis of Cost Estimates
httpslidepdfcomreaderfullbasis-of-cost-estimates 6167
Detroit Water and Sewerage DepartmentBasis of Cost Estimates
September 2003 60
Table C-9Intermediate Pumping Unit Cost
Capacity 2000 2010 2020 2030 2040 2050
253 mgd $734 $870 $1060 $1250 $1440 $1630
350 mgd $1060 $1260 $1530 $1800 $2070 $2340
400 mgd $1220 $1450 $1760 $2070 $2380 $2690
446 mgd $1380 $1640 $1990 $2340 $2690 $3040452 mgd $1410 $1670 $2030 $2390 $2750 $3110
529 mgd $1680 $1990 $2420 $2850 $3280 $3710
611 mgd $1680 $1990 $2420 $2850 $3280 $3710
669 mgd $1860 $2210 $2690 $3170 $3650 $4120
743 mgd $2090 $2480 $3010 $3540 $4070 $4600
849 mgd $2430 $2880 $3500 $4120 $4740 $5360
942 mgd $2470 $2930 $3560 $4190 $4820 $5450
1040 mgd $2770 $3290 $4000 $4710 $5420 $6120
1050 mgd $2810 $3330 $4050 $4770 $5490 $6200
1130 mgd $3040 $3610 $4390 $5170 $5950 $6720
Table C-10Filtration Unit Cost
Capacity 2000 2010 2020 2030 2040 2050
113 mgd $3930 $4660 $5660 $6660 $7660 $8660
140 mgd $5040 $5980 $7270 $8550 $9830 $11110
211 mgd $6210 $7360 $8950 $10530 $12110 $13680
211 mgd $6220 $7380 $8970 $10550 $12140 $13720
308 mgd $7900 $9370 $11390 $13400 $15410 $17410
359 mgd $8440 $10010 $12170 $14320 $16470 $18610
400 mgd $9190 $10900 $13250 $15590 $17930 $20260
450 mgd $10400 $12330 $14990 $17640 $20290 $22930
540 mgd $11800 $13990 $17000 $20000 $23010 $26000563 mgd $12200 $14470 $17590 $20700 $23810 $26910
622 mgd $13500 $16010 $19460 $22900 $26340 $29770
7182019 Basis of Cost Estimates
httpslidepdfcomreaderfullbasis-of-cost-estimates 6267
Detroit Water and Sewerage DepartmentBasis of Cost Estimates
September 2003 61
Table C-11Ultraviolet Disinfection Unit Cost
Capacity 2000 2010 2020 2030 2040 2050
259 mgd $912 $1080 $1310 $1540 $1770 $2000
351 mgd $1280 $1520 $1850 $2180 $2510 $2840
400 mgd $1530 $1810 $2200 $2590 $2980 $3370
452 mgd $2040 $2420 $2940 $3460 $3980 $4500452 mgd $3310 $3930 $4780 $5620 $6460 $7300
452 mgd $1750 $2080 $2530 $2980 $3430 $3880
619 mgd $1750 $2080 $2530 $2980 $3430 $3880
619 mgd $2280 $2700 $3280 $3860 $4440 $5020
679 mgd $2550 $3020 $3670 $4320 $4970 $5620
860 mgd $3830 $4540 $5520 $6500 $7480 $8450
860 mgd $3060 $3630 $4410 $5190 $5970 $6750
956 mgd $3400 $4030 $4900 $5770 $6640 $7500
1036 mgd $3830 $4540 $5520 $6500 $7480 $8450
1126 mgd $4100 $4860 $5910 $6950 $7990 $9030
1750 mgd $8270 $9810 $11920 $14030 $16140 $18240
2000 mgd $8620 $10220 $12420 $14610 $16810 $19000
Table C-12Post Aeration Unit Cost
Capacity 2000 2010 2020 2030 2040 2050
113 mgd $114 $140 $170 $200 $230 $260
140 mgd $134 $160 $190 $220 $250 $280
211 mgd $142 $170 $210 $250 $290 $330
211 mgd $142 $170 $210 $250 $290 $330
211 mgd $167 $200 $240 $280 $320 $360
308 mgd $182 $220 $270 $320 $370 $420308 mgd $182 $220 $270 $320 $370 $420
359 mgd $260 $310 $380 $450 $520 $590
400 mgd $273 $320 $390 $460 $530 $600
450 mgd $237 $280 $340 $400 $460 $520
450 mgd $237 $280 $340 $400 $460 $520
540 mgd $363 $430 $520 $610 $700 $790
563 mgd $358 $420 $510 $600 $690 $780
622 mgd $388 $460 $560 $660 $760 $860
1000 mgd $455 $540 $660 $780 $900 $1020
1250 mgd $554 $660 $800 $940 $1080 $1220
7182019 Basis of Cost Estimates
httpslidepdfcomreaderfullbasis-of-cost-estimates 6367
Detroit Water and Sewerage DepartmentBasis of Cost Estimates
September 2003 62
Table C-13Blower System Unit Cost
Capacity 2000 2010 2020 2030 2040 2050
170 mgd $718 $850 $1030 $1210 $1390 $1570
210 mgd $786 $930 $1130 $1330 $1530 $1730
317 mgd $1120 $1330 $1620 $1910 $2200 $2490
317 mgd $1120 $1330 $1620 $1910 $2200 $2490317 mgd $1060 $1260 $1530 $1800 $2070 $2340
462 mgd $7440 $8820 $10720 $12610 $14510 $16400
462 mgd $7440 $8820 $10720 $12610 $14510 $16400
539 mgd $7440 $8820 $10720 $12610 $14510 $16400
600 mgd $6430 $7630 $9270 $10910 $12550 $14180
675 mgd $8920 $10580 $12860 $15130 $17400 $19660
675 mgd $8840 $10480 $12740 $14990 $17240 $19480
810 mgd $8950 $10610 $12900 $15180 $17460 $19730
845 mgd $8600 $10200 $12400 $14590 $16780 $18960
933 mgd $8950 $10610 $12900 $15180 $17460 $19730
1500 mgd $6370 $7550 $9180 $10800 $12420 $14040
1875 mgd $7670 $9100 $11060 $13010 $14970 $16920
Table C-14Gravity Thickening Unit Cost
Capacity 2000 2010 2020 2030 2040 2050
113 mgd $278 $330 $400 $470 $540 $610
140 mgd $319 $380 $460 $540 $620 $700
211 mgd $693 $820 $1000 $1180 $1360 $1540
211 mgd $555 $660 $800 $940 $1080 $1220
211 mgd $396 $470 $570 $670 $770 $870
308 mgd $708 $840 $1020 $1200 $1380 $1560308 mgd $723 $860 $1050 $1240 $1430 $1620
359 mgd $609 $720 $880 $1040 $1200 $1360
400 mgd $581 $690 $840 $990 $1140 $1290
450 mgd $927 $1100 $1340 $1580 $1820 $2060
450 mgd $944 $1120 $1360 $1600 $1840 $2080
540 mgd $830 $980 $1190 $1400 $1610 $1820
563 mgd $768 $910 $1110 $1310 $1510 $1710
622 mgd $830 $980 $1190 $1400 $1610 $1820
1000 mgd $723 $860 $1050 $1240 $1430 $1620
1250 mgd $845 $1000 $1220 $1440 $1660 $1880
7182019 Basis of Cost Estimates
httpslidepdfcomreaderfullbasis-of-cost-estimates 6467
Detroit Water and Sewerage DepartmentBasis of Cost Estimates
September 2003 63
Table C-15Centrifugation Unit Cost
Capacity 2000 2010 2020 2030 2040 2050
113 mgd $2050 $2430 $2950 $3470 $3990 $4510
14 mgd $2440 $2890 $3510 $4130 $4750 $5370
211 mgd $2930 $3470 $4220 $4970 $5720 $6460
211 mgd $2220 $2630 $3200 $3770 $4340 $4900211 mgd $4160 $4930 $5990 $7050 $8110 $9160
308 mgd $2990 $3550 $4310 $5070 $5830 $6590
308 mgd $3040 $3610 $4390 $5170 $5950 $6720
359 mgd $6200 $7350 $8930 $10510 $12090 $13660
40 mgd $6150 $7290 $8860 $10430 $12000 $13560
45 mgd $4420 $5240 $6370 $7500 $8630 $9750
45 mgd $4500 $5340 $6490 $7640 $8790 $9930
54 mgd $9210 $10920 $13270 $15610 $17960 $20300
563 mgd $10700 $12690 $15420 $18140 $20870 $23580
622 mgd $11900 $14110 $17150 $20180 $23210 $26230
100 mgd $15000 $17790 $21620 $25440 $29260 $33060
125 mgd $17900 $21230 $25800 $30360 $34920 $39460
Table C-16Hauling and Landfilling Unit Cost
Capacity 2000 2010 2020 2030 2040 2050
113 mgd $438 $520 $630 $740 $850 $960
140 mgd $546 $650 $790 $930 $1070 $1210
211 mgd $1060 $1260 $1530 $1800 $2070 $2340
211 mgd $788 $930 $1130 $1330 $1530 $1730
211 mgd $810 $960 $1170 $1380 $1590 $1800
308 mgd $1090 $1290 $1570 $1850 $2130 $2410308 mgd $1100 $1300 $1580 $1860 $2140 $2420
359 mgd $1400 $1660 $2020 $2380 $2740 $3100
400 mgd $1370 $1620 $1970 $2320 $2670 $3020
450 mgd $1530 $1810 $2200 $2590 $2980 $3370
450 mgd $1560 $1850 $2250 $2650 $3050 $3450
540 mgd $2150 $2550 $3100 $3650 $4200 $4750
563 mgd $2030 $2410 $2930 $3450 $3970 $4490
622 mgd $2220 $2630 $3200 $3770 $4340 $4900
1000 mgd $2360 $2800 $3400 $4000 $4600 $5200
1250 mgd $2950 $3500 $4250 $5000 $5750 $6500
7182019 Basis of Cost Estimates
httpslidepdfcomreaderfullbasis-of-cost-estimates 6567
Detroit Water and Sewerage DepartmentBasis of Cost Estimates
September 2003 64
Appendix D
Wastewater Treatment Plant Ongoing Repair andReplacement Cost Estimates
7182019 Basis of Cost Estimates
httpslidepdfcomreaderfullbasis-of-cost-estimates 6667
Detroit Water and Sewerage DepartmentBasis of Cost Estimates
September 2003 65
SUMMARY OF CAPITAL IMPROVEMENT PROJECT COSTS
Explanation of Capital Improvement Costs
NOTE This analysis was provided by the staff of the Detroit Wastewater Partners (DWSDProject PC-744 - Wastewater Treatment Plant Upgrade) and DWSD Wastewater Plant staff Itwas completed in July 2003
General
1 Capital costs are presented by major process and non-process areas The project costsassume a major capital improvement project for the specified life cycle based on recent capitalimprovements performed under PC-744 other recent capital improvement projects (ie PC-740 PC-720 etc) and best engineering judgment The line items listed in each area areintended to provide a basis for the cost estimate to give an understanding of the level of costestimate assumptions used and items includednot included in the cost estimate It is unlikelyand not intended that the major capital projects would include all of the items listed at thespecified cycle Rather it is more likely that the overall cost would be broken into smallerprojects spread across a ~10 year period at the specified cycle
2 The percentages listed below were applied to each of the base construction costs Theseare similar to the percentages used in the Wastewater Master Plan (see Master Plan TechnicalMemo Basis of Cost Estimates dated August 15 2003)
- 30 Contingency (for miscellaneous items not included in the general cost estimate)
- 25 Contractor Overhead and Profit and General Conditions
- 20 Engineering Legal Administration and Management
3 Capital costs presented assume continued use of the existing processes in place at the
WWTP It does not assume major changes to the treatment process such as a new form ofprimary treatment or biological treatment The costs also do not include potentially newprocesses that may be required for regulatory or other reasons such as filtration of thesecondary effluent sludge digestion or major change to the type of effluent disinfection
4 Capital costs presented for each process area do not include maintenance related costs forroutine maintenance between the major capital improvement cycles It is assumed thatmaintenance activities will be performed on the equipment at the required frequencies tomaintain the equipment in good worknig order between major rehabilitation or replacementprojects
Link to Complete Spreadsheets is found on the Wastewater Master Plan
CD DWP Est of Capital Improvements for WWTP - 50-yrxls
7182019 Basis of Cost Estimates
httpslidepdfcomreaderfullbasis-of-cost-estimates 6767
Detroit Water and Sewerage DepartmentBasis of Cost Estimates
Table D1
SUMMARY OF CAPITAL IMPROVEMENT PROJECT COSTS
Area Life Cycle Start of Cycle 2003 Costs ($M)PROCESS RELATED
Pump Station No 1 20 2025 $ 63Pump Station No 2 20 2006 $ 66
Chemical Addition 20 2023 $ 9Rectangular Primary Clarifiers 20 2013 $ 86Circular Primary Clarifiers 20 2025 $ 84ILP Nos 1 2 3 4 7 20 2025 $ 29
Aeration Basins 20 2025 $ 55Cryo Plants 10 2015 $ 1Secondary Clarifiers 20 2020 $ 140SFE Pump Station 20 2010 $ 13
Chlorination 20 2022 $ 16
Dechlorination 20 2023 $ 12Hydraulic Structures 20 2020 $ 7Complex A and B 20 2025 $ 32
C-I Dewatering 15 2020 $ 31C-II Lower Level Dewatering 15 2019 $ 35C-II Upper Level Dewatering 15 2015 $ 42
C-I and C-II Incineration 15 2009 $ 139Sludge Offloading 20 2025 $ 19NON-PROCESS RELATED
AdminRagland Buildings 20 2025 $ 10Plant Security 10 2015 $ 10Plant-wide Paving 15 2020 $ 6Parking Structure 20 2025 $ 7Work Environment Improvements 10 2015 $ 5
Rehab of OampM Bldgs Warehouses 20 2007 $ 40Plant-wide Instrumentation 15 2020 $ 100General Electrical 20 2045 $ 29Plant-wide Secondary Water 15 2025 $ 6
Plant-wide Steam System 15 2023 $ 6Plant-wide Potable Water 15 2010 $ 2Plant -wide Drainage 15 2010 $ 2
Fire Protection Improvements 20 2006 $ 4Plant-Wide JOCs As-Needed Eng 1 2005 $ 3
Total $ 1107

7182019 Basis of Cost Estimates
httpslidepdfcomreaderfullbasis-of-cost-estimates 4867
Detroit Water and Sewerage DepartmentBasis of Cost Estimates
September 2003 47
Avg $84856
108 80000 1998 $90514 3
Avg $90514
120 $90000 1985 $143700 1
Avg $143700
B14 Miscellaneous RepairsThis cost estimating technical memorandum reviewed the costs for various sewersystem repairs that were not scheduled or included in the WWMP CIP developmentThis section contains the results of this repair cost review
Sump Pump Disconnection
Sump Pump Disconnection consists of removal of sump valves electrical connectionsand restoration These costs in unit cost per connection are estimated at $6720 in2000 dollars
Root Control
Root Control consists of utilizing chemical methods The estimate includesmobilization set up and furnishing of all incidentals Table B-9 shows the estimate inunit cost per linear foot of pipe with the historical data escalated using the CCI
Table B-9Historical Root Control Costs
SizeSource Unit
CostLF Year 2003 Unit CostLF (CCI) Source
Al l $200 1982 $350 5
$200 1988 $296 8
$140 1989 $203 9
$200 2000 $215 20
$225 2000 $242 20
$275 2000 $296 20
Avg $267
B15 Historical ReferencesShown on each spreadsheet is a reference code to the source of individual unit pricesTable B-10 shows the references used for the historical estimates in Appendices A andB
7182019 Basis of Cost Estimates
httpslidepdfcomreaderfullbasis-of-cost-estimates 4967
Detroit Water and Sewerage DepartmentBasis of Cost Estimates
September 2003 48
Table B-10Historical References
Source Title Date
1 Unidentified CDM Documents 1985
2Beaconsfield Relief Sewer Cleaning Manholes Inspection forSouth Macomb Sanitary District 1999
3 SOCSDS Project Plan 1998
4 Cost Effective Analysis 1998
5 Grosse Pointe Infrastructure 1982
6 City of Rochester Hills SDA 1999
7 HRC Detailed Cost Estimates 1997
8 Beverly Hills Local Sewer Study Rehabilitation Program 1988
9 Unidentified CDM Documents 1989
10 Unidentified Construction Cost Estimate
11 South Macomb Sanitary District 1999
12 City of Rochester Hills Sanitary Sewer Evaluation Survey 1996
13 South Macomb Sanitary District Appendix J 1996
14 Clinton-Oakland Sewage Disposal System 1971
15 City of Hazel Park MI
16 Farmington MI Sewer Seperation Improvements 1990
17 Basic Requirements Report Evergreen-Farmington Relief 1985
18 Cost Estimate 1975
19 Pre-Rehabilitation Local Sewer Costs 1990
20 Ann Arbor SSO Prevention Task Force 2000
B16 Means and Manufacturersrsquo EstimatesThe calculation of construction costs using the RW Means methodology requiresprices for component materials and construction activities (ie excavation orbackfilling) The following table presents the component costs used in the
development of construction cost guidelines
7182019 Basis of Cost Estimates
httpslidepdfcomreaderfullbasis-of-cost-estimates 5067
Detroit Water and Sewerage DepartmentBasis of Cost Estimates
September 2003 49
Table B-11Component Costs for Means and Manufacturersrsquo Estimates
Item Size Description Unit Cost Units Source
Excavation
Excavation common earth hauling
away fill up to 4 mi $1549 CY Means
BackfillCommon earth front-end loaderCompaction 12 lifts $882 CY Means
Select FillCrushed bank run gravelcompaction 6 lifts $2650 CY Means
Sheeting 8 DeepWood solid sheeting incl Walesbraces and spacers Drive amp Extract $668 SF Means
16 DeepWood solid sheeting incl Walesbraces and spacers Drive amp Extract $876 SF Means
24 DeepWood solid sheeting incl Walesbraces and spacers Drive amp Extract $1074 SF Means
32 DeepWood solid sheeting incl Walesbraces and spacers Drive amp Extract $1199 SF Means
Pavement Removal Bituminous 4 to 6 thick $572 SY Means
Saw Cutting Asphalt 6 thick $281 LF Means
Pavement Replacement Over Trench 6 thick $4333 SY Means
Non-Reinforced ConcretePipe 8 Bell and Spigot Joints Extra strength $1231 LF Means
10 Bell and Spigot Joints Extra strength $1305 LF Means
12 Bell and Spigot Joints Extra strength $1480 LF Means
Reinforced Concrete Pipe 12
Class 3 BampS or TampG Joints
wgaskets $1890 LF Means
15Class 3 BampS or TampG Jointswgaskets $2167 LF Means
18Class 3 BampS or TampG Jointswgaskets $2536 LF Means
7182019 Basis of Cost Estimates
httpslidepdfcomreaderfullbasis-of-cost-estimates 5167
Detroit Water and Sewerage DepartmentBasis of Cost Estimates
September 2003 50
Item Size Description Unit Cost Units Source
Reinforced Concrete Pipe 21Class 3 BampS or TampG Joints wogaskets $3135 LF Means
24Class 3 BampS or TampG Jointswgaskets $3504 LF Means
27Class 3 BampS or TampG Joints wogaskets $5302 LF Means
30Class 3 BampS or TampG Jointswgaskets $6592 LF Means
36Class 3 BampS or TampG Jointswgaskets $8990 LF Means
42
Class 3 BampS or TampG Joints wo
gaskets $9220 LF Means
48Class 3 BampS or TampG Jointswgaskets $13185 LF Means
54Class 3 BampS or TampG Jointswgaskets $14845 LF Means
60Class 3 BampS or TampG Joints wogaskets $16504 LF Means
66Class 3 BampS or TampG Joints wogaskets $23004 LF Means
72Class 3 BampS or TampG Jointswgaskets $29504 LF Means
78Class 3 BampS or TampG Joints wogaskets $32500 LF Means
84Class 3 BampS or TampG Joints wogaskets $35497 LF Means
96Class 3 BampS or TampG Jointswgaskets $43795 LF Means
102
Class 3 BampS or TampG Joints wo
gaskets $46000 LF Means
108Class 3 BampS or TampG Joints wogaskets $48300 LF Means
120Class 3 BampS or TampG Joints wogaskets $53000 LF Means
7182019 Basis of Cost Estimates
httpslidepdfcomreaderfullbasis-of-cost-estimates 5267
Detroit Water and Sewerage DepartmentBasis of Cost Estimates
September 2003 51
Item Size Description Unit Cost Units Source
Ductile Iron Pipe 4 Class 50 Cement Lined Mech Joint $1982 LF Means
6 Class 50 Cement Lined Mech Joint $2305 LF Means
8 Class 50 Cement Lined Mech Joint $2812 LF Means
10 Class 50 Cement Lined Mech Joint $3458 LF Means
12 Class 50 Cement Lined Mech Joint $4103 LF Means
14 Class 50 Cement Lined Mech Joint $4656 LF Means
16 Class 50 Cement Lined Mech Joint $5670 LF Means
18 Class 50 Cement Lined Mech Joint $6731 LF Means
20 Class 50 Cement Lined Mech Joint $7745 LF Means
24 Class 50 Cement Lined Mech Joint $9958 LF Means
48 Class 50 Cement Lined Mech Joint $23234 LF Est
PVC Pipe (SDR35) 6 SDR 35 BampS $512 LF Means
6 SDR 35 BampS 45 Degree Bend $7376 LF Means
HDPEPipe for Sliplining 4HDPE Pipe PE3408 DR21 (80 psi)price installed $442 LF Manufact
6HDPE Pipe PE3408 DR21 (80 psi)price installed $958 LF Manufact
8
HDPE Pipe PE3408 DR21 (80 psi)
price installed $1623 LF Manufact
10HDPE Pipe PE3408 DR21 (80 psi)price installed $2521 LF Manufact
12HDPE Pipe PE3408 DR21 (80 psi)price installed $3547 LF Manufact
7182019 Basis of Cost Estimates
httpslidepdfcomreaderfullbasis-of-cost-estimates 5367
Detroit Water and Sewerage DepartmentBasis of Cost Estimates
September 2003 52
Item Size Description Unit Cost Units Source
HDPEPipe for Sliplining 14HDPE Pipe PE3408 DR21 (80 psi)price installed $4276 LF Manufact
16HDPE Pipe PE3408 DR21 (80 psi)price installed $5586 LF Manufact
18HDPE Pipe PE3408 DR21 (80 psi)price installed $7069 LF Manufact
20HDPE Pipe PE3408 DR21 (80 psi)price installed $8728 LF Manufact
22HDPE Pipe PE3408 DR21 (80 psi)price installed $10560 LF Manufact
24
HDPE Pipe PE3408 DR21 (80 psi)
price installed $12567 LF Manufact
26HDPE Pipe PE3408 DR21 (80 psi)price installed $14749 LF Manufact
28HDPE Pipe PE3408 DR21 (80 psi)price installed $17106 LF Manufact
30HDPE Pipe PE3408 DR21 (80 psi)price installed $19637 LF Manufact
32HDPE Pipe PE3408 DR21 (80 psi)price installed $22342 LF Manufact
36HDPE Pipe PE3408 DR21 (80 psi)price installed $28277 LF Manufact
42HDPE Pipe PE3408 DR21 (80 psi)price installed $38488 LF Manufact
48HDPE Pipe PE3408 DR21 (80 psi)price installed $50270 LF Manufact
52HDPE Pipe PE3408 DR21 (80 psi)price installed $57869 LF Manufact
54
HDPE Pipe PE3408 DR21 (80 psi)
price installed $63623 LF Manufact
Manholes 4 DiaPrecast Concrete not incl Excavbackfill frame cover sheeting $17979 VLF Means
5 DiaPrecast Concrete not incl Excavbackfill frame cover sheeting $18809 VLF Means
7182019 Basis of Cost Estimates
httpslidepdfcomreaderfullbasis-of-cost-estimates 5467
Detroit Water and Sewerage DepartmentBasis of Cost Estimates
September 2003 53
Item Size Description Unit Cost Units Source
Manholes 6 DiaPrecast Concrete not incl Excavbackfill frame cover sheeting $28582 VLF Means
7 DiaPrecast Concrete not incl Excavbackfill frame cover sheeting $38355 VLF Means
8 DiaPrecast Concrete not incl Excavbackfill frame cover sheeting $48128 VLF Means
B17 Meanrsquos Unit Cost Estimates
Table B-12 contains a sample estimating sheet for calculating each component costusing the material and labor costs identified in the previous section
7182019 Basis of Cost Estimates
httpslidepdfcomreaderfullbasis-of-cost-estimates 5567
Detroit Water and Sewerage DepartmentBasis of Cost Estimates
September 2003 54
Table B-12Sample Component Costs Estimator
Quick Sewer Estimator
Force Mains
Dimensions
Pipe Size 14 in
Trench Width 4 Ft not less than 32
Trench Depth 6 Ft
Length 1 Ft
Material Costs
Pipe CostLF 66 $LF
Excav CostCY 13 $CYBackfill Cost CY 10 $CY
Select Fill CostCY 12 $CY
Pavament DemoCost SY 7 $SY
New Pavement Cost SY 29 $SY
Saw Cut Per LF 4 $LF
Sheeting Cost SF 0 $SF
May not be required for excavations under 5 deep
Pavement A (sy)= 044
Vexcav (cy) = Vbfill (cy) =
089 049
Hbfill (ft)
Sheeting (sf) Common Fill 333333
12
Vsfill (cy) =
036 Hsfill (ft)
Select Fill 266667
W (ft) = 4
Total Costs
7182019 Basis of Cost Estimates
httpslidepdfcomreaderfullbasis-of-cost-estimates 5667
Detroit Water and Sewerage DepartmentBasis of Cost Estimates
September 2003 55
Pipe $6600
Excav $622
Backfill $494
Select Fill $427
Pavement Demo $311New Pavement $1289
Saw Cut $800
Sheeting Cost $000
Total Price $10543
Price Per Foot $10543 LF
7182019 Basis of Cost Estimates
httpslidepdfcomreaderfullbasis-of-cost-estimates 5767
Detroit Water and Sewerage DepartmentBasis of Cost Estimates
September 2003 56
Appendix C
Unit Costs for Treatment Facilities
7182019 Basis of Cost Estimates
httpslidepdfcomreaderfullbasis-of-cost-estimates 5867
Detroit Water and Sewerage DepartmentBasis of Cost Estimates
September 2003 57
Appendix C ndash Unit Costs for Treatment FacilitiesThe following tables outline the unit costs for treatment facilities derived from projectcost estimates These unit costs are provided for future estimating of these facilitiesand are the total cost X 1000 They are base construction costs only and do notinclude engineering fees allowances or contingencies
Table C-1Influent Pump Station Unit Cost
Capacity 2000 2010 2020 2030 2040 2050
394 mgd $1960 $2320 $2820 $3320 $3820 $4320
400 mgd $3810 $4520 $5490 $6460 $7430 $8400
491 mgd $2060 $2440 $2970 $3490 $4010 $4530
615 mgd $2510 $2980 $3620 $4260 $4900 $5540
615 mgd $2510 $2980 $3620 $4260 $4900 $5540
615 mgd $3050 $3620 $4400 $5180 $5960 $6740
619 mgd $3150 $3740 $4550 $5350 $6150 $6950
860 mgd $4440 $5270 $6410 $7540 $8670 $9800
1040 mgd $5940 $7040 $8560 $10070 $11580 $13090
1080 mgd $3790 $4490 $5460 $6420 $7380 $8340
1130 mgd $6090 $7220 $8780 $10330 $11880 $13420
1260 mgd $4510 $5350 $6500 $7650 $8800 $9940
1580 mgd $6020 $7140 $8680 $10210 $11740 $13270
1890 mgd $6350 $7530 $9150 $10770 $12390 $14000
2535 mgd $7030 $8340 $10140 $11930 $13720 $15500
3105 mgd $7030 $8340 $10140 $11930 $13720 $15500
Table C-2
Screening and Grit Chamber Unit Cost Capacity 2000 2010 2020 2030 2040 2050
116 mgd $1530 $1810 $2200 $2590 $2980 $3370
143 mgd $2030 $2410 $2930 $3450 $3970 $4490
216 mgd $2210 $2620 $3180 $3740 $4300 $4860
221 mgd $3490 $4140 $5030 $5920 $6810 $7700
226 mgd $3490 $4140 $5030 $5920 $6810 $7700
322 mgd $4500 $5340 $6490 $7640 $8790 $9930
322 mgd $4500 $5340 $6490 $7640 $8790 $9930
368 mgd $3240 $3840 $4670 $5490 $6320 $7140
409 mgd $3700 $4390 $5340 $6280 $7220 $8160
471 mgd $6190 $7340 $8920 $10500 $12080 $13650471 mgd $5940 $7040 $8560 $10070 $11580 $13090
554 mgd $4520 $5360 $6510 $7660 $8810 $9960
576 mgd $5190 $6160 $7490 $8810 $10130 $11450
636 mgd $5600 $6640 $8070 $9500 $10930 $12350
1000 mgd $9770 $11590 $14090 $16580 $19070 $21550
1250 mgd $11300 $13400 $16290 $19170 $22050 $24920
7182019 Basis of Cost Estimates
httpslidepdfcomreaderfullbasis-of-cost-estimates 5967
Detroit Water and Sewerage DepartmentBasis of Cost Estimates
September 2003 58
Table C-3 Aeration Bas in wi th Nit ri ficat ion Unit Cost
Capacity 2000 2010 2020 2030 2040 2050
113 mgd $10400 $12330 $14990 $17640 $20290 $22930
140 mgd $11200 $13280 $16140 $18990 $21840 $24680
211 mgd $17300 $20520 $24940 $29350 $33760 $38150
211 mgd $17300 $20520 $24940 $29350 $33760 $38150211 mgd $16000 $18980 $23070 $27150 $31230 $35290
308 mgd $22600 $26800 $32570 $38320 $44080 $49810
308 mgd $22600 $26800 $32570 $38320 $44080 $49810
359 mgd $24200 $28700 $34880 $41040 $47210 $53350
400 mgd $22600 $26800 $32570 $38320 $44080 $49810
450 mgd $32300 $38310 $46560 $54780 $63010 $71200
450 mgd $31800 $37710 $45830 $53930 $62040 $70110
540 mgd $35300 $41860 $50880 $59870 $68870 $77830
563 mgd $36800 $43640 $53040 $62410 $71790 $81130
622 mgd $39300 $46610 $56650 $66660 $76680 $86650
Table C-4Primary Clarifiers Unit Cost
Capacity 2000 2010 2020 2030 2040 2050
116 mgd $1530 $1810 $2200 $2590 $2980 $3370
143 mgd $2030 $2410 $2930 $3450 $3970 $4490
216 mgd $2210 $2620 $3180 $3740 $4300 $4860
221 mgd $3490 $4140 $5030 $5920 $6810 $7700
226 mgd $3490 $4140 $5030 $5920 $6810 $7700
322 mgd $4500 $5340 $6490 $7640 $8790 $9930
322 mgd $4500 $5340 $6490 $7640 $8790 $9930
368 mgd $3240 $3840 $4670 $5490 $6320 $7140
409 mgd $3700 $4390 $5340 $6280 $7220 $8160
471 mgd $6190 $7340 $8920 $10500 $12080 $13650
471 mgd $5940 $7040 $8560 $10070 $11580 $13090
554 mgd $4520 $5360 $6510 $7660 $8810 $9960
576 mgd $5190 $6160 $7490 $8810 $10130 $11450
636 mgd $5600 $6640 $8070 $9500 $10930 $12350
1000 mgd $9770 $11590 $14090 $16580 $19070 $21550
1250 mgd $11300 $13400 $16290 $19170 $22050 $24920
Table C-5Complete Mix Activated Sludge Unit Cost
Capacity 2000 2010 2020 2030 2040 2050
100 mgd $21800 $25850 $31420 $36970 $42530 $48060
125 mgd $25300 $30000 $36460 $42900 $49350 $55770
7182019 Basis of Cost Estimates
httpslidepdfcomreaderfullbasis-of-cost-estimates 6067
Detroit Water and Sewerage DepartmentBasis of Cost Estimates
September 2003 59
Table C-6Iron Feed System Unit Cost
Capacity 2000 2010 2020 2030 2040 2050
113 mgd $152 $180 $220 $260 $300 $340
140 mgd $152 $180 $220 $260 $300 $340
211 mgd $152 $180 $220 $260 $300 $340
211 mgd $152 $180 $220 $260 $300 $340211 mgd $152 $180 $220 $260 $300 $340
308 mgd $156 $190 $230 $270 $310 $350
308 mgd $156 $190 $230 $270 $310 $350
359 mgd $175 $210 $260 $310 $360 $410
400 mgd $164 $190 $230 $270 $310 $350
450 mgd $182 $220 $270 $320 $370 $420
450 mgd $182 $220 $270 $320 $370 $420
540 mgd $208 $250 $300 $350 $400 $450
563 mgd $189 $220 $270 $320 $370 $420
622 mgd $197 $230 $280 $330 $380 $430
1000 mgd $205 $240 $290 $340 $390 $440
1250 mgd $225 $270 $330 $390 $450 $510
Table C-7Coagulation-Flocculation Unit Cost
Capacity 2000 2010 2020 2030 2040 2050
100 mgd $19700 $23360 $28390 $33410 $38430 $43430
125 mgd $24100 $28580 $34740 $40880 $47020 $53130
Table C-8Secondary Clarifiers Unit Cost
Capacity 2000 2010 2020 2030 2040 2050
113 mgd $3050 $3620 $4400 $5180 $5960 $6740140 mgd $3800 $4510 $5480 $6450 $7420 $8380
211 mgd $4430 $5250 $6380 $7510 $8640 $9760
211 mgd $4430 $5250 $6380 $7510 $8640 $9760
211 mgd $4870 $5780 $7030 $8270 $9510 $10750
308 mgd $5800 $6880 $8360 $9840 $11320 $12790
308 mgd $5800 $6880 $8360 $9840 $11320 $12790
359 mgd $7120 $8440 $10260 $12070 $13880 $15680
400 mgd $6280 $7450 $9050 $10650 $12250 $13840
450 mgd $8070 $9570 $11630 $13680 $15740 $17790
450 mgd $8070 $9570 $11630 $13680 $15740 $17790
540 mgd $10400 $12330 $14990 $17640 $20290 $22930
563 mgd $11500 $13640 $16580 $19510 $22440 $25360
622 mgd $12400 $14710 $17880 $21040 $24200 $27350
1000 mgd $13700 $16250 $19750 $23240 $26730 $30210
1250 mgd $15200 $18030 $21910 $25780 $29650 $33510
7182019 Basis of Cost Estimates
httpslidepdfcomreaderfullbasis-of-cost-estimates 6167
Detroit Water and Sewerage DepartmentBasis of Cost Estimates
September 2003 60
Table C-9Intermediate Pumping Unit Cost
Capacity 2000 2010 2020 2030 2040 2050
253 mgd $734 $870 $1060 $1250 $1440 $1630
350 mgd $1060 $1260 $1530 $1800 $2070 $2340
400 mgd $1220 $1450 $1760 $2070 $2380 $2690
446 mgd $1380 $1640 $1990 $2340 $2690 $3040452 mgd $1410 $1670 $2030 $2390 $2750 $3110
529 mgd $1680 $1990 $2420 $2850 $3280 $3710
611 mgd $1680 $1990 $2420 $2850 $3280 $3710
669 mgd $1860 $2210 $2690 $3170 $3650 $4120
743 mgd $2090 $2480 $3010 $3540 $4070 $4600
849 mgd $2430 $2880 $3500 $4120 $4740 $5360
942 mgd $2470 $2930 $3560 $4190 $4820 $5450
1040 mgd $2770 $3290 $4000 $4710 $5420 $6120
1050 mgd $2810 $3330 $4050 $4770 $5490 $6200
1130 mgd $3040 $3610 $4390 $5170 $5950 $6720
Table C-10Filtration Unit Cost
Capacity 2000 2010 2020 2030 2040 2050
113 mgd $3930 $4660 $5660 $6660 $7660 $8660
140 mgd $5040 $5980 $7270 $8550 $9830 $11110
211 mgd $6210 $7360 $8950 $10530 $12110 $13680
211 mgd $6220 $7380 $8970 $10550 $12140 $13720
308 mgd $7900 $9370 $11390 $13400 $15410 $17410
359 mgd $8440 $10010 $12170 $14320 $16470 $18610
400 mgd $9190 $10900 $13250 $15590 $17930 $20260
450 mgd $10400 $12330 $14990 $17640 $20290 $22930
540 mgd $11800 $13990 $17000 $20000 $23010 $26000563 mgd $12200 $14470 $17590 $20700 $23810 $26910
622 mgd $13500 $16010 $19460 $22900 $26340 $29770
7182019 Basis of Cost Estimates
httpslidepdfcomreaderfullbasis-of-cost-estimates 6267
Detroit Water and Sewerage DepartmentBasis of Cost Estimates
September 2003 61
Table C-11Ultraviolet Disinfection Unit Cost
Capacity 2000 2010 2020 2030 2040 2050
259 mgd $912 $1080 $1310 $1540 $1770 $2000
351 mgd $1280 $1520 $1850 $2180 $2510 $2840
400 mgd $1530 $1810 $2200 $2590 $2980 $3370
452 mgd $2040 $2420 $2940 $3460 $3980 $4500452 mgd $3310 $3930 $4780 $5620 $6460 $7300
452 mgd $1750 $2080 $2530 $2980 $3430 $3880
619 mgd $1750 $2080 $2530 $2980 $3430 $3880
619 mgd $2280 $2700 $3280 $3860 $4440 $5020
679 mgd $2550 $3020 $3670 $4320 $4970 $5620
860 mgd $3830 $4540 $5520 $6500 $7480 $8450
860 mgd $3060 $3630 $4410 $5190 $5970 $6750
956 mgd $3400 $4030 $4900 $5770 $6640 $7500
1036 mgd $3830 $4540 $5520 $6500 $7480 $8450
1126 mgd $4100 $4860 $5910 $6950 $7990 $9030
1750 mgd $8270 $9810 $11920 $14030 $16140 $18240
2000 mgd $8620 $10220 $12420 $14610 $16810 $19000
Table C-12Post Aeration Unit Cost
Capacity 2000 2010 2020 2030 2040 2050
113 mgd $114 $140 $170 $200 $230 $260
140 mgd $134 $160 $190 $220 $250 $280
211 mgd $142 $170 $210 $250 $290 $330
211 mgd $142 $170 $210 $250 $290 $330
211 mgd $167 $200 $240 $280 $320 $360
308 mgd $182 $220 $270 $320 $370 $420308 mgd $182 $220 $270 $320 $370 $420
359 mgd $260 $310 $380 $450 $520 $590
400 mgd $273 $320 $390 $460 $530 $600
450 mgd $237 $280 $340 $400 $460 $520
450 mgd $237 $280 $340 $400 $460 $520
540 mgd $363 $430 $520 $610 $700 $790
563 mgd $358 $420 $510 $600 $690 $780
622 mgd $388 $460 $560 $660 $760 $860
1000 mgd $455 $540 $660 $780 $900 $1020
1250 mgd $554 $660 $800 $940 $1080 $1220
7182019 Basis of Cost Estimates
httpslidepdfcomreaderfullbasis-of-cost-estimates 6367
Detroit Water and Sewerage DepartmentBasis of Cost Estimates
September 2003 62
Table C-13Blower System Unit Cost
Capacity 2000 2010 2020 2030 2040 2050
170 mgd $718 $850 $1030 $1210 $1390 $1570
210 mgd $786 $930 $1130 $1330 $1530 $1730
317 mgd $1120 $1330 $1620 $1910 $2200 $2490
317 mgd $1120 $1330 $1620 $1910 $2200 $2490317 mgd $1060 $1260 $1530 $1800 $2070 $2340
462 mgd $7440 $8820 $10720 $12610 $14510 $16400
462 mgd $7440 $8820 $10720 $12610 $14510 $16400
539 mgd $7440 $8820 $10720 $12610 $14510 $16400
600 mgd $6430 $7630 $9270 $10910 $12550 $14180
675 mgd $8920 $10580 $12860 $15130 $17400 $19660
675 mgd $8840 $10480 $12740 $14990 $17240 $19480
810 mgd $8950 $10610 $12900 $15180 $17460 $19730
845 mgd $8600 $10200 $12400 $14590 $16780 $18960
933 mgd $8950 $10610 $12900 $15180 $17460 $19730
1500 mgd $6370 $7550 $9180 $10800 $12420 $14040
1875 mgd $7670 $9100 $11060 $13010 $14970 $16920
Table C-14Gravity Thickening Unit Cost
Capacity 2000 2010 2020 2030 2040 2050
113 mgd $278 $330 $400 $470 $540 $610
140 mgd $319 $380 $460 $540 $620 $700
211 mgd $693 $820 $1000 $1180 $1360 $1540
211 mgd $555 $660 $800 $940 $1080 $1220
211 mgd $396 $470 $570 $670 $770 $870
308 mgd $708 $840 $1020 $1200 $1380 $1560308 mgd $723 $860 $1050 $1240 $1430 $1620
359 mgd $609 $720 $880 $1040 $1200 $1360
400 mgd $581 $690 $840 $990 $1140 $1290
450 mgd $927 $1100 $1340 $1580 $1820 $2060
450 mgd $944 $1120 $1360 $1600 $1840 $2080
540 mgd $830 $980 $1190 $1400 $1610 $1820
563 mgd $768 $910 $1110 $1310 $1510 $1710
622 mgd $830 $980 $1190 $1400 $1610 $1820
1000 mgd $723 $860 $1050 $1240 $1430 $1620
1250 mgd $845 $1000 $1220 $1440 $1660 $1880
7182019 Basis of Cost Estimates
httpslidepdfcomreaderfullbasis-of-cost-estimates 6467
Detroit Water and Sewerage DepartmentBasis of Cost Estimates
September 2003 63
Table C-15Centrifugation Unit Cost
Capacity 2000 2010 2020 2030 2040 2050
113 mgd $2050 $2430 $2950 $3470 $3990 $4510
14 mgd $2440 $2890 $3510 $4130 $4750 $5370
211 mgd $2930 $3470 $4220 $4970 $5720 $6460
211 mgd $2220 $2630 $3200 $3770 $4340 $4900211 mgd $4160 $4930 $5990 $7050 $8110 $9160
308 mgd $2990 $3550 $4310 $5070 $5830 $6590
308 mgd $3040 $3610 $4390 $5170 $5950 $6720
359 mgd $6200 $7350 $8930 $10510 $12090 $13660
40 mgd $6150 $7290 $8860 $10430 $12000 $13560
45 mgd $4420 $5240 $6370 $7500 $8630 $9750
45 mgd $4500 $5340 $6490 $7640 $8790 $9930
54 mgd $9210 $10920 $13270 $15610 $17960 $20300
563 mgd $10700 $12690 $15420 $18140 $20870 $23580
622 mgd $11900 $14110 $17150 $20180 $23210 $26230
100 mgd $15000 $17790 $21620 $25440 $29260 $33060
125 mgd $17900 $21230 $25800 $30360 $34920 $39460
Table C-16Hauling and Landfilling Unit Cost
Capacity 2000 2010 2020 2030 2040 2050
113 mgd $438 $520 $630 $740 $850 $960
140 mgd $546 $650 $790 $930 $1070 $1210
211 mgd $1060 $1260 $1530 $1800 $2070 $2340
211 mgd $788 $930 $1130 $1330 $1530 $1730
211 mgd $810 $960 $1170 $1380 $1590 $1800
308 mgd $1090 $1290 $1570 $1850 $2130 $2410308 mgd $1100 $1300 $1580 $1860 $2140 $2420
359 mgd $1400 $1660 $2020 $2380 $2740 $3100
400 mgd $1370 $1620 $1970 $2320 $2670 $3020
450 mgd $1530 $1810 $2200 $2590 $2980 $3370
450 mgd $1560 $1850 $2250 $2650 $3050 $3450
540 mgd $2150 $2550 $3100 $3650 $4200 $4750
563 mgd $2030 $2410 $2930 $3450 $3970 $4490
622 mgd $2220 $2630 $3200 $3770 $4340 $4900
1000 mgd $2360 $2800 $3400 $4000 $4600 $5200
1250 mgd $2950 $3500 $4250 $5000 $5750 $6500
7182019 Basis of Cost Estimates
httpslidepdfcomreaderfullbasis-of-cost-estimates 6567
Detroit Water and Sewerage DepartmentBasis of Cost Estimates
September 2003 64
Appendix D
Wastewater Treatment Plant Ongoing Repair andReplacement Cost Estimates
7182019 Basis of Cost Estimates
httpslidepdfcomreaderfullbasis-of-cost-estimates 6667
Detroit Water and Sewerage DepartmentBasis of Cost Estimates
September 2003 65
SUMMARY OF CAPITAL IMPROVEMENT PROJECT COSTS
Explanation of Capital Improvement Costs
NOTE This analysis was provided by the staff of the Detroit Wastewater Partners (DWSDProject PC-744 - Wastewater Treatment Plant Upgrade) and DWSD Wastewater Plant staff Itwas completed in July 2003
General
1 Capital costs are presented by major process and non-process areas The project costsassume a major capital improvement project for the specified life cycle based on recent capitalimprovements performed under PC-744 other recent capital improvement projects (ie PC-740 PC-720 etc) and best engineering judgment The line items listed in each area areintended to provide a basis for the cost estimate to give an understanding of the level of costestimate assumptions used and items includednot included in the cost estimate It is unlikelyand not intended that the major capital projects would include all of the items listed at thespecified cycle Rather it is more likely that the overall cost would be broken into smallerprojects spread across a ~10 year period at the specified cycle
2 The percentages listed below were applied to each of the base construction costs Theseare similar to the percentages used in the Wastewater Master Plan (see Master Plan TechnicalMemo Basis of Cost Estimates dated August 15 2003)
- 30 Contingency (for miscellaneous items not included in the general cost estimate)
- 25 Contractor Overhead and Profit and General Conditions
- 20 Engineering Legal Administration and Management
3 Capital costs presented assume continued use of the existing processes in place at the
WWTP It does not assume major changes to the treatment process such as a new form ofprimary treatment or biological treatment The costs also do not include potentially newprocesses that may be required for regulatory or other reasons such as filtration of thesecondary effluent sludge digestion or major change to the type of effluent disinfection
4 Capital costs presented for each process area do not include maintenance related costs forroutine maintenance between the major capital improvement cycles It is assumed thatmaintenance activities will be performed on the equipment at the required frequencies tomaintain the equipment in good worknig order between major rehabilitation or replacementprojects
Link to Complete Spreadsheets is found on the Wastewater Master Plan
CD DWP Est of Capital Improvements for WWTP - 50-yrxls
7182019 Basis of Cost Estimates
httpslidepdfcomreaderfullbasis-of-cost-estimates 6767
Detroit Water and Sewerage DepartmentBasis of Cost Estimates
Table D1
SUMMARY OF CAPITAL IMPROVEMENT PROJECT COSTS
Area Life Cycle Start of Cycle 2003 Costs ($M)PROCESS RELATED
Pump Station No 1 20 2025 $ 63Pump Station No 2 20 2006 $ 66
Chemical Addition 20 2023 $ 9Rectangular Primary Clarifiers 20 2013 $ 86Circular Primary Clarifiers 20 2025 $ 84ILP Nos 1 2 3 4 7 20 2025 $ 29
Aeration Basins 20 2025 $ 55Cryo Plants 10 2015 $ 1Secondary Clarifiers 20 2020 $ 140SFE Pump Station 20 2010 $ 13
Chlorination 20 2022 $ 16
Dechlorination 20 2023 $ 12Hydraulic Structures 20 2020 $ 7Complex A and B 20 2025 $ 32
C-I Dewatering 15 2020 $ 31C-II Lower Level Dewatering 15 2019 $ 35C-II Upper Level Dewatering 15 2015 $ 42
C-I and C-II Incineration 15 2009 $ 139Sludge Offloading 20 2025 $ 19NON-PROCESS RELATED
AdminRagland Buildings 20 2025 $ 10Plant Security 10 2015 $ 10Plant-wide Paving 15 2020 $ 6Parking Structure 20 2025 $ 7Work Environment Improvements 10 2015 $ 5
Rehab of OampM Bldgs Warehouses 20 2007 $ 40Plant-wide Instrumentation 15 2020 $ 100General Electrical 20 2045 $ 29Plant-wide Secondary Water 15 2025 $ 6
Plant-wide Steam System 15 2023 $ 6Plant-wide Potable Water 15 2010 $ 2Plant -wide Drainage 15 2010 $ 2
Fire Protection Improvements 20 2006 $ 4Plant-Wide JOCs As-Needed Eng 1 2005 $ 3
Total $ 1107
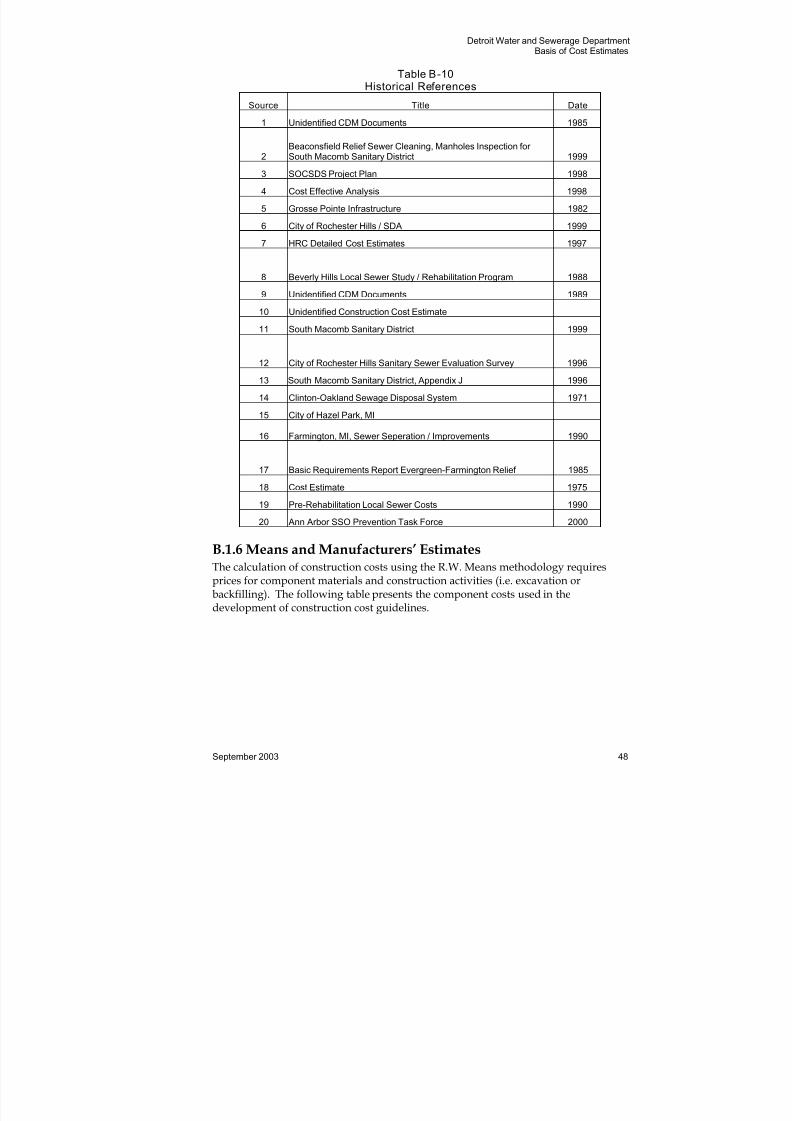
7182019 Basis of Cost Estimates
httpslidepdfcomreaderfullbasis-of-cost-estimates 4967
Detroit Water and Sewerage DepartmentBasis of Cost Estimates
September 2003 48
Table B-10Historical References
Source Title Date
1 Unidentified CDM Documents 1985
2Beaconsfield Relief Sewer Cleaning Manholes Inspection forSouth Macomb Sanitary District 1999
3 SOCSDS Project Plan 1998
4 Cost Effective Analysis 1998
5 Grosse Pointe Infrastructure 1982
6 City of Rochester Hills SDA 1999
7 HRC Detailed Cost Estimates 1997
8 Beverly Hills Local Sewer Study Rehabilitation Program 1988
9 Unidentified CDM Documents 1989
10 Unidentified Construction Cost Estimate
11 South Macomb Sanitary District 1999
12 City of Rochester Hills Sanitary Sewer Evaluation Survey 1996
13 South Macomb Sanitary District Appendix J 1996
14 Clinton-Oakland Sewage Disposal System 1971
15 City of Hazel Park MI
16 Farmington MI Sewer Seperation Improvements 1990
17 Basic Requirements Report Evergreen-Farmington Relief 1985
18 Cost Estimate 1975
19 Pre-Rehabilitation Local Sewer Costs 1990
20 Ann Arbor SSO Prevention Task Force 2000
B16 Means and Manufacturersrsquo EstimatesThe calculation of construction costs using the RW Means methodology requiresprices for component materials and construction activities (ie excavation orbackfilling) The following table presents the component costs used in the
development of construction cost guidelines
7182019 Basis of Cost Estimates
httpslidepdfcomreaderfullbasis-of-cost-estimates 5067
Detroit Water and Sewerage DepartmentBasis of Cost Estimates
September 2003 49
Table B-11Component Costs for Means and Manufacturersrsquo Estimates
Item Size Description Unit Cost Units Source
Excavation
Excavation common earth hauling
away fill up to 4 mi $1549 CY Means
BackfillCommon earth front-end loaderCompaction 12 lifts $882 CY Means
Select FillCrushed bank run gravelcompaction 6 lifts $2650 CY Means
Sheeting 8 DeepWood solid sheeting incl Walesbraces and spacers Drive amp Extract $668 SF Means
16 DeepWood solid sheeting incl Walesbraces and spacers Drive amp Extract $876 SF Means
24 DeepWood solid sheeting incl Walesbraces and spacers Drive amp Extract $1074 SF Means
32 DeepWood solid sheeting incl Walesbraces and spacers Drive amp Extract $1199 SF Means
Pavement Removal Bituminous 4 to 6 thick $572 SY Means
Saw Cutting Asphalt 6 thick $281 LF Means
Pavement Replacement Over Trench 6 thick $4333 SY Means
Non-Reinforced ConcretePipe 8 Bell and Spigot Joints Extra strength $1231 LF Means
10 Bell and Spigot Joints Extra strength $1305 LF Means
12 Bell and Spigot Joints Extra strength $1480 LF Means
Reinforced Concrete Pipe 12
Class 3 BampS or TampG Joints
wgaskets $1890 LF Means
15Class 3 BampS or TampG Jointswgaskets $2167 LF Means
18Class 3 BampS or TampG Jointswgaskets $2536 LF Means
7182019 Basis of Cost Estimates
httpslidepdfcomreaderfullbasis-of-cost-estimates 5167
Detroit Water and Sewerage DepartmentBasis of Cost Estimates
September 2003 50
Item Size Description Unit Cost Units Source
Reinforced Concrete Pipe 21Class 3 BampS or TampG Joints wogaskets $3135 LF Means
24Class 3 BampS or TampG Jointswgaskets $3504 LF Means
27Class 3 BampS or TampG Joints wogaskets $5302 LF Means
30Class 3 BampS or TampG Jointswgaskets $6592 LF Means
36Class 3 BampS or TampG Jointswgaskets $8990 LF Means
42
Class 3 BampS or TampG Joints wo
gaskets $9220 LF Means
48Class 3 BampS or TampG Jointswgaskets $13185 LF Means
54Class 3 BampS or TampG Jointswgaskets $14845 LF Means
60Class 3 BampS or TampG Joints wogaskets $16504 LF Means
66Class 3 BampS or TampG Joints wogaskets $23004 LF Means
72Class 3 BampS or TampG Jointswgaskets $29504 LF Means
78Class 3 BampS or TampG Joints wogaskets $32500 LF Means
84Class 3 BampS or TampG Joints wogaskets $35497 LF Means
96Class 3 BampS or TampG Jointswgaskets $43795 LF Means
102
Class 3 BampS or TampG Joints wo
gaskets $46000 LF Means
108Class 3 BampS or TampG Joints wogaskets $48300 LF Means
120Class 3 BampS or TampG Joints wogaskets $53000 LF Means
7182019 Basis of Cost Estimates
httpslidepdfcomreaderfullbasis-of-cost-estimates 5267
Detroit Water and Sewerage DepartmentBasis of Cost Estimates
September 2003 51
Item Size Description Unit Cost Units Source
Ductile Iron Pipe 4 Class 50 Cement Lined Mech Joint $1982 LF Means
6 Class 50 Cement Lined Mech Joint $2305 LF Means
8 Class 50 Cement Lined Mech Joint $2812 LF Means
10 Class 50 Cement Lined Mech Joint $3458 LF Means
12 Class 50 Cement Lined Mech Joint $4103 LF Means
14 Class 50 Cement Lined Mech Joint $4656 LF Means
16 Class 50 Cement Lined Mech Joint $5670 LF Means
18 Class 50 Cement Lined Mech Joint $6731 LF Means
20 Class 50 Cement Lined Mech Joint $7745 LF Means
24 Class 50 Cement Lined Mech Joint $9958 LF Means
48 Class 50 Cement Lined Mech Joint $23234 LF Est
PVC Pipe (SDR35) 6 SDR 35 BampS $512 LF Means
6 SDR 35 BampS 45 Degree Bend $7376 LF Means
HDPEPipe for Sliplining 4HDPE Pipe PE3408 DR21 (80 psi)price installed $442 LF Manufact
6HDPE Pipe PE3408 DR21 (80 psi)price installed $958 LF Manufact
8
HDPE Pipe PE3408 DR21 (80 psi)
price installed $1623 LF Manufact
10HDPE Pipe PE3408 DR21 (80 psi)price installed $2521 LF Manufact
12HDPE Pipe PE3408 DR21 (80 psi)price installed $3547 LF Manufact
7182019 Basis of Cost Estimates
httpslidepdfcomreaderfullbasis-of-cost-estimates 5367
Detroit Water and Sewerage DepartmentBasis of Cost Estimates
September 2003 52
Item Size Description Unit Cost Units Source
HDPEPipe for Sliplining 14HDPE Pipe PE3408 DR21 (80 psi)price installed $4276 LF Manufact
16HDPE Pipe PE3408 DR21 (80 psi)price installed $5586 LF Manufact
18HDPE Pipe PE3408 DR21 (80 psi)price installed $7069 LF Manufact
20HDPE Pipe PE3408 DR21 (80 psi)price installed $8728 LF Manufact
22HDPE Pipe PE3408 DR21 (80 psi)price installed $10560 LF Manufact
24
HDPE Pipe PE3408 DR21 (80 psi)
price installed $12567 LF Manufact
26HDPE Pipe PE3408 DR21 (80 psi)price installed $14749 LF Manufact
28HDPE Pipe PE3408 DR21 (80 psi)price installed $17106 LF Manufact
30HDPE Pipe PE3408 DR21 (80 psi)price installed $19637 LF Manufact
32HDPE Pipe PE3408 DR21 (80 psi)price installed $22342 LF Manufact
36HDPE Pipe PE3408 DR21 (80 psi)price installed $28277 LF Manufact
42HDPE Pipe PE3408 DR21 (80 psi)price installed $38488 LF Manufact
48HDPE Pipe PE3408 DR21 (80 psi)price installed $50270 LF Manufact
52HDPE Pipe PE3408 DR21 (80 psi)price installed $57869 LF Manufact
54
HDPE Pipe PE3408 DR21 (80 psi)
price installed $63623 LF Manufact
Manholes 4 DiaPrecast Concrete not incl Excavbackfill frame cover sheeting $17979 VLF Means
5 DiaPrecast Concrete not incl Excavbackfill frame cover sheeting $18809 VLF Means
7182019 Basis of Cost Estimates
httpslidepdfcomreaderfullbasis-of-cost-estimates 5467
Detroit Water and Sewerage DepartmentBasis of Cost Estimates
September 2003 53
Item Size Description Unit Cost Units Source
Manholes 6 DiaPrecast Concrete not incl Excavbackfill frame cover sheeting $28582 VLF Means
7 DiaPrecast Concrete not incl Excavbackfill frame cover sheeting $38355 VLF Means
8 DiaPrecast Concrete not incl Excavbackfill frame cover sheeting $48128 VLF Means
B17 Meanrsquos Unit Cost Estimates
Table B-12 contains a sample estimating sheet for calculating each component costusing the material and labor costs identified in the previous section
7182019 Basis of Cost Estimates
httpslidepdfcomreaderfullbasis-of-cost-estimates 5567
Detroit Water and Sewerage DepartmentBasis of Cost Estimates
September 2003 54
Table B-12Sample Component Costs Estimator
Quick Sewer Estimator
Force Mains
Dimensions
Pipe Size 14 in
Trench Width 4 Ft not less than 32
Trench Depth 6 Ft
Length 1 Ft
Material Costs
Pipe CostLF 66 $LF
Excav CostCY 13 $CYBackfill Cost CY 10 $CY
Select Fill CostCY 12 $CY
Pavament DemoCost SY 7 $SY
New Pavement Cost SY 29 $SY
Saw Cut Per LF 4 $LF
Sheeting Cost SF 0 $SF
May not be required for excavations under 5 deep
Pavement A (sy)= 044
Vexcav (cy) = Vbfill (cy) =
089 049
Hbfill (ft)
Sheeting (sf) Common Fill 333333
12
Vsfill (cy) =
036 Hsfill (ft)
Select Fill 266667
W (ft) = 4
Total Costs
7182019 Basis of Cost Estimates
httpslidepdfcomreaderfullbasis-of-cost-estimates 5667
Detroit Water and Sewerage DepartmentBasis of Cost Estimates
September 2003 55
Pipe $6600
Excav $622
Backfill $494
Select Fill $427
Pavement Demo $311New Pavement $1289
Saw Cut $800
Sheeting Cost $000
Total Price $10543
Price Per Foot $10543 LF
7182019 Basis of Cost Estimates
httpslidepdfcomreaderfullbasis-of-cost-estimates 5767
Detroit Water and Sewerage DepartmentBasis of Cost Estimates
September 2003 56
Appendix C
Unit Costs for Treatment Facilities
7182019 Basis of Cost Estimates
httpslidepdfcomreaderfullbasis-of-cost-estimates 5867
Detroit Water and Sewerage DepartmentBasis of Cost Estimates
September 2003 57
Appendix C ndash Unit Costs for Treatment FacilitiesThe following tables outline the unit costs for treatment facilities derived from projectcost estimates These unit costs are provided for future estimating of these facilitiesand are the total cost X 1000 They are base construction costs only and do notinclude engineering fees allowances or contingencies
Table C-1Influent Pump Station Unit Cost
Capacity 2000 2010 2020 2030 2040 2050
394 mgd $1960 $2320 $2820 $3320 $3820 $4320
400 mgd $3810 $4520 $5490 $6460 $7430 $8400
491 mgd $2060 $2440 $2970 $3490 $4010 $4530
615 mgd $2510 $2980 $3620 $4260 $4900 $5540
615 mgd $2510 $2980 $3620 $4260 $4900 $5540
615 mgd $3050 $3620 $4400 $5180 $5960 $6740
619 mgd $3150 $3740 $4550 $5350 $6150 $6950
860 mgd $4440 $5270 $6410 $7540 $8670 $9800
1040 mgd $5940 $7040 $8560 $10070 $11580 $13090
1080 mgd $3790 $4490 $5460 $6420 $7380 $8340
1130 mgd $6090 $7220 $8780 $10330 $11880 $13420
1260 mgd $4510 $5350 $6500 $7650 $8800 $9940
1580 mgd $6020 $7140 $8680 $10210 $11740 $13270
1890 mgd $6350 $7530 $9150 $10770 $12390 $14000
2535 mgd $7030 $8340 $10140 $11930 $13720 $15500
3105 mgd $7030 $8340 $10140 $11930 $13720 $15500
Table C-2
Screening and Grit Chamber Unit Cost Capacity 2000 2010 2020 2030 2040 2050
116 mgd $1530 $1810 $2200 $2590 $2980 $3370
143 mgd $2030 $2410 $2930 $3450 $3970 $4490
216 mgd $2210 $2620 $3180 $3740 $4300 $4860
221 mgd $3490 $4140 $5030 $5920 $6810 $7700
226 mgd $3490 $4140 $5030 $5920 $6810 $7700
322 mgd $4500 $5340 $6490 $7640 $8790 $9930
322 mgd $4500 $5340 $6490 $7640 $8790 $9930
368 mgd $3240 $3840 $4670 $5490 $6320 $7140
409 mgd $3700 $4390 $5340 $6280 $7220 $8160
471 mgd $6190 $7340 $8920 $10500 $12080 $13650471 mgd $5940 $7040 $8560 $10070 $11580 $13090
554 mgd $4520 $5360 $6510 $7660 $8810 $9960
576 mgd $5190 $6160 $7490 $8810 $10130 $11450
636 mgd $5600 $6640 $8070 $9500 $10930 $12350
1000 mgd $9770 $11590 $14090 $16580 $19070 $21550
1250 mgd $11300 $13400 $16290 $19170 $22050 $24920
7182019 Basis of Cost Estimates
httpslidepdfcomreaderfullbasis-of-cost-estimates 5967
Detroit Water and Sewerage DepartmentBasis of Cost Estimates
September 2003 58
Table C-3 Aeration Bas in wi th Nit ri ficat ion Unit Cost
Capacity 2000 2010 2020 2030 2040 2050
113 mgd $10400 $12330 $14990 $17640 $20290 $22930
140 mgd $11200 $13280 $16140 $18990 $21840 $24680
211 mgd $17300 $20520 $24940 $29350 $33760 $38150
211 mgd $17300 $20520 $24940 $29350 $33760 $38150211 mgd $16000 $18980 $23070 $27150 $31230 $35290
308 mgd $22600 $26800 $32570 $38320 $44080 $49810
308 mgd $22600 $26800 $32570 $38320 $44080 $49810
359 mgd $24200 $28700 $34880 $41040 $47210 $53350
400 mgd $22600 $26800 $32570 $38320 $44080 $49810
450 mgd $32300 $38310 $46560 $54780 $63010 $71200
450 mgd $31800 $37710 $45830 $53930 $62040 $70110
540 mgd $35300 $41860 $50880 $59870 $68870 $77830
563 mgd $36800 $43640 $53040 $62410 $71790 $81130
622 mgd $39300 $46610 $56650 $66660 $76680 $86650
Table C-4Primary Clarifiers Unit Cost
Capacity 2000 2010 2020 2030 2040 2050
116 mgd $1530 $1810 $2200 $2590 $2980 $3370
143 mgd $2030 $2410 $2930 $3450 $3970 $4490
216 mgd $2210 $2620 $3180 $3740 $4300 $4860
221 mgd $3490 $4140 $5030 $5920 $6810 $7700
226 mgd $3490 $4140 $5030 $5920 $6810 $7700
322 mgd $4500 $5340 $6490 $7640 $8790 $9930
322 mgd $4500 $5340 $6490 $7640 $8790 $9930
368 mgd $3240 $3840 $4670 $5490 $6320 $7140
409 mgd $3700 $4390 $5340 $6280 $7220 $8160
471 mgd $6190 $7340 $8920 $10500 $12080 $13650
471 mgd $5940 $7040 $8560 $10070 $11580 $13090
554 mgd $4520 $5360 $6510 $7660 $8810 $9960
576 mgd $5190 $6160 $7490 $8810 $10130 $11450
636 mgd $5600 $6640 $8070 $9500 $10930 $12350
1000 mgd $9770 $11590 $14090 $16580 $19070 $21550
1250 mgd $11300 $13400 $16290 $19170 $22050 $24920
Table C-5Complete Mix Activated Sludge Unit Cost
Capacity 2000 2010 2020 2030 2040 2050
100 mgd $21800 $25850 $31420 $36970 $42530 $48060
125 mgd $25300 $30000 $36460 $42900 $49350 $55770
7182019 Basis of Cost Estimates
httpslidepdfcomreaderfullbasis-of-cost-estimates 6067
Detroit Water and Sewerage DepartmentBasis of Cost Estimates
September 2003 59
Table C-6Iron Feed System Unit Cost
Capacity 2000 2010 2020 2030 2040 2050
113 mgd $152 $180 $220 $260 $300 $340
140 mgd $152 $180 $220 $260 $300 $340
211 mgd $152 $180 $220 $260 $300 $340
211 mgd $152 $180 $220 $260 $300 $340211 mgd $152 $180 $220 $260 $300 $340
308 mgd $156 $190 $230 $270 $310 $350
308 mgd $156 $190 $230 $270 $310 $350
359 mgd $175 $210 $260 $310 $360 $410
400 mgd $164 $190 $230 $270 $310 $350
450 mgd $182 $220 $270 $320 $370 $420
450 mgd $182 $220 $270 $320 $370 $420
540 mgd $208 $250 $300 $350 $400 $450
563 mgd $189 $220 $270 $320 $370 $420
622 mgd $197 $230 $280 $330 $380 $430
1000 mgd $205 $240 $290 $340 $390 $440
1250 mgd $225 $270 $330 $390 $450 $510
Table C-7Coagulation-Flocculation Unit Cost
Capacity 2000 2010 2020 2030 2040 2050
100 mgd $19700 $23360 $28390 $33410 $38430 $43430
125 mgd $24100 $28580 $34740 $40880 $47020 $53130
Table C-8Secondary Clarifiers Unit Cost
Capacity 2000 2010 2020 2030 2040 2050
113 mgd $3050 $3620 $4400 $5180 $5960 $6740140 mgd $3800 $4510 $5480 $6450 $7420 $8380
211 mgd $4430 $5250 $6380 $7510 $8640 $9760
211 mgd $4430 $5250 $6380 $7510 $8640 $9760
211 mgd $4870 $5780 $7030 $8270 $9510 $10750
308 mgd $5800 $6880 $8360 $9840 $11320 $12790
308 mgd $5800 $6880 $8360 $9840 $11320 $12790
359 mgd $7120 $8440 $10260 $12070 $13880 $15680
400 mgd $6280 $7450 $9050 $10650 $12250 $13840
450 mgd $8070 $9570 $11630 $13680 $15740 $17790
450 mgd $8070 $9570 $11630 $13680 $15740 $17790
540 mgd $10400 $12330 $14990 $17640 $20290 $22930
563 mgd $11500 $13640 $16580 $19510 $22440 $25360
622 mgd $12400 $14710 $17880 $21040 $24200 $27350
1000 mgd $13700 $16250 $19750 $23240 $26730 $30210
1250 mgd $15200 $18030 $21910 $25780 $29650 $33510
7182019 Basis of Cost Estimates
httpslidepdfcomreaderfullbasis-of-cost-estimates 6167
Detroit Water and Sewerage DepartmentBasis of Cost Estimates
September 2003 60
Table C-9Intermediate Pumping Unit Cost
Capacity 2000 2010 2020 2030 2040 2050
253 mgd $734 $870 $1060 $1250 $1440 $1630
350 mgd $1060 $1260 $1530 $1800 $2070 $2340
400 mgd $1220 $1450 $1760 $2070 $2380 $2690
446 mgd $1380 $1640 $1990 $2340 $2690 $3040452 mgd $1410 $1670 $2030 $2390 $2750 $3110
529 mgd $1680 $1990 $2420 $2850 $3280 $3710
611 mgd $1680 $1990 $2420 $2850 $3280 $3710
669 mgd $1860 $2210 $2690 $3170 $3650 $4120
743 mgd $2090 $2480 $3010 $3540 $4070 $4600
849 mgd $2430 $2880 $3500 $4120 $4740 $5360
942 mgd $2470 $2930 $3560 $4190 $4820 $5450
1040 mgd $2770 $3290 $4000 $4710 $5420 $6120
1050 mgd $2810 $3330 $4050 $4770 $5490 $6200
1130 mgd $3040 $3610 $4390 $5170 $5950 $6720
Table C-10Filtration Unit Cost
Capacity 2000 2010 2020 2030 2040 2050
113 mgd $3930 $4660 $5660 $6660 $7660 $8660
140 mgd $5040 $5980 $7270 $8550 $9830 $11110
211 mgd $6210 $7360 $8950 $10530 $12110 $13680
211 mgd $6220 $7380 $8970 $10550 $12140 $13720
308 mgd $7900 $9370 $11390 $13400 $15410 $17410
359 mgd $8440 $10010 $12170 $14320 $16470 $18610
400 mgd $9190 $10900 $13250 $15590 $17930 $20260
450 mgd $10400 $12330 $14990 $17640 $20290 $22930
540 mgd $11800 $13990 $17000 $20000 $23010 $26000563 mgd $12200 $14470 $17590 $20700 $23810 $26910
622 mgd $13500 $16010 $19460 $22900 $26340 $29770
7182019 Basis of Cost Estimates
httpslidepdfcomreaderfullbasis-of-cost-estimates 6267
Detroit Water and Sewerage DepartmentBasis of Cost Estimates
September 2003 61
Table C-11Ultraviolet Disinfection Unit Cost
Capacity 2000 2010 2020 2030 2040 2050
259 mgd $912 $1080 $1310 $1540 $1770 $2000
351 mgd $1280 $1520 $1850 $2180 $2510 $2840
400 mgd $1530 $1810 $2200 $2590 $2980 $3370
452 mgd $2040 $2420 $2940 $3460 $3980 $4500452 mgd $3310 $3930 $4780 $5620 $6460 $7300
452 mgd $1750 $2080 $2530 $2980 $3430 $3880
619 mgd $1750 $2080 $2530 $2980 $3430 $3880
619 mgd $2280 $2700 $3280 $3860 $4440 $5020
679 mgd $2550 $3020 $3670 $4320 $4970 $5620
860 mgd $3830 $4540 $5520 $6500 $7480 $8450
860 mgd $3060 $3630 $4410 $5190 $5970 $6750
956 mgd $3400 $4030 $4900 $5770 $6640 $7500
1036 mgd $3830 $4540 $5520 $6500 $7480 $8450
1126 mgd $4100 $4860 $5910 $6950 $7990 $9030
1750 mgd $8270 $9810 $11920 $14030 $16140 $18240
2000 mgd $8620 $10220 $12420 $14610 $16810 $19000
Table C-12Post Aeration Unit Cost
Capacity 2000 2010 2020 2030 2040 2050
113 mgd $114 $140 $170 $200 $230 $260
140 mgd $134 $160 $190 $220 $250 $280
211 mgd $142 $170 $210 $250 $290 $330
211 mgd $142 $170 $210 $250 $290 $330
211 mgd $167 $200 $240 $280 $320 $360
308 mgd $182 $220 $270 $320 $370 $420308 mgd $182 $220 $270 $320 $370 $420
359 mgd $260 $310 $380 $450 $520 $590
400 mgd $273 $320 $390 $460 $530 $600
450 mgd $237 $280 $340 $400 $460 $520
450 mgd $237 $280 $340 $400 $460 $520
540 mgd $363 $430 $520 $610 $700 $790
563 mgd $358 $420 $510 $600 $690 $780
622 mgd $388 $460 $560 $660 $760 $860
1000 mgd $455 $540 $660 $780 $900 $1020
1250 mgd $554 $660 $800 $940 $1080 $1220
7182019 Basis of Cost Estimates
httpslidepdfcomreaderfullbasis-of-cost-estimates 6367
Detroit Water and Sewerage DepartmentBasis of Cost Estimates
September 2003 62
Table C-13Blower System Unit Cost
Capacity 2000 2010 2020 2030 2040 2050
170 mgd $718 $850 $1030 $1210 $1390 $1570
210 mgd $786 $930 $1130 $1330 $1530 $1730
317 mgd $1120 $1330 $1620 $1910 $2200 $2490
317 mgd $1120 $1330 $1620 $1910 $2200 $2490317 mgd $1060 $1260 $1530 $1800 $2070 $2340
462 mgd $7440 $8820 $10720 $12610 $14510 $16400
462 mgd $7440 $8820 $10720 $12610 $14510 $16400
539 mgd $7440 $8820 $10720 $12610 $14510 $16400
600 mgd $6430 $7630 $9270 $10910 $12550 $14180
675 mgd $8920 $10580 $12860 $15130 $17400 $19660
675 mgd $8840 $10480 $12740 $14990 $17240 $19480
810 mgd $8950 $10610 $12900 $15180 $17460 $19730
845 mgd $8600 $10200 $12400 $14590 $16780 $18960
933 mgd $8950 $10610 $12900 $15180 $17460 $19730
1500 mgd $6370 $7550 $9180 $10800 $12420 $14040
1875 mgd $7670 $9100 $11060 $13010 $14970 $16920
Table C-14Gravity Thickening Unit Cost
Capacity 2000 2010 2020 2030 2040 2050
113 mgd $278 $330 $400 $470 $540 $610
140 mgd $319 $380 $460 $540 $620 $700
211 mgd $693 $820 $1000 $1180 $1360 $1540
211 mgd $555 $660 $800 $940 $1080 $1220
211 mgd $396 $470 $570 $670 $770 $870
308 mgd $708 $840 $1020 $1200 $1380 $1560308 mgd $723 $860 $1050 $1240 $1430 $1620
359 mgd $609 $720 $880 $1040 $1200 $1360
400 mgd $581 $690 $840 $990 $1140 $1290
450 mgd $927 $1100 $1340 $1580 $1820 $2060
450 mgd $944 $1120 $1360 $1600 $1840 $2080
540 mgd $830 $980 $1190 $1400 $1610 $1820
563 mgd $768 $910 $1110 $1310 $1510 $1710
622 mgd $830 $980 $1190 $1400 $1610 $1820
1000 mgd $723 $860 $1050 $1240 $1430 $1620
1250 mgd $845 $1000 $1220 $1440 $1660 $1880
7182019 Basis of Cost Estimates
httpslidepdfcomreaderfullbasis-of-cost-estimates 6467
Detroit Water and Sewerage DepartmentBasis of Cost Estimates
September 2003 63
Table C-15Centrifugation Unit Cost
Capacity 2000 2010 2020 2030 2040 2050
113 mgd $2050 $2430 $2950 $3470 $3990 $4510
14 mgd $2440 $2890 $3510 $4130 $4750 $5370
211 mgd $2930 $3470 $4220 $4970 $5720 $6460
211 mgd $2220 $2630 $3200 $3770 $4340 $4900211 mgd $4160 $4930 $5990 $7050 $8110 $9160
308 mgd $2990 $3550 $4310 $5070 $5830 $6590
308 mgd $3040 $3610 $4390 $5170 $5950 $6720
359 mgd $6200 $7350 $8930 $10510 $12090 $13660
40 mgd $6150 $7290 $8860 $10430 $12000 $13560
45 mgd $4420 $5240 $6370 $7500 $8630 $9750
45 mgd $4500 $5340 $6490 $7640 $8790 $9930
54 mgd $9210 $10920 $13270 $15610 $17960 $20300
563 mgd $10700 $12690 $15420 $18140 $20870 $23580
622 mgd $11900 $14110 $17150 $20180 $23210 $26230
100 mgd $15000 $17790 $21620 $25440 $29260 $33060
125 mgd $17900 $21230 $25800 $30360 $34920 $39460
Table C-16Hauling and Landfilling Unit Cost
Capacity 2000 2010 2020 2030 2040 2050
113 mgd $438 $520 $630 $740 $850 $960
140 mgd $546 $650 $790 $930 $1070 $1210
211 mgd $1060 $1260 $1530 $1800 $2070 $2340
211 mgd $788 $930 $1130 $1330 $1530 $1730
211 mgd $810 $960 $1170 $1380 $1590 $1800
308 mgd $1090 $1290 $1570 $1850 $2130 $2410308 mgd $1100 $1300 $1580 $1860 $2140 $2420
359 mgd $1400 $1660 $2020 $2380 $2740 $3100
400 mgd $1370 $1620 $1970 $2320 $2670 $3020
450 mgd $1530 $1810 $2200 $2590 $2980 $3370
450 mgd $1560 $1850 $2250 $2650 $3050 $3450
540 mgd $2150 $2550 $3100 $3650 $4200 $4750
563 mgd $2030 $2410 $2930 $3450 $3970 $4490
622 mgd $2220 $2630 $3200 $3770 $4340 $4900
1000 mgd $2360 $2800 $3400 $4000 $4600 $5200
1250 mgd $2950 $3500 $4250 $5000 $5750 $6500
7182019 Basis of Cost Estimates
httpslidepdfcomreaderfullbasis-of-cost-estimates 6567
Detroit Water and Sewerage DepartmentBasis of Cost Estimates
September 2003 64
Appendix D
Wastewater Treatment Plant Ongoing Repair andReplacement Cost Estimates
7182019 Basis of Cost Estimates
httpslidepdfcomreaderfullbasis-of-cost-estimates 6667
Detroit Water and Sewerage DepartmentBasis of Cost Estimates
September 2003 65
SUMMARY OF CAPITAL IMPROVEMENT PROJECT COSTS
Explanation of Capital Improvement Costs
NOTE This analysis was provided by the staff of the Detroit Wastewater Partners (DWSDProject PC-744 - Wastewater Treatment Plant Upgrade) and DWSD Wastewater Plant staff Itwas completed in July 2003
General
1 Capital costs are presented by major process and non-process areas The project costsassume a major capital improvement project for the specified life cycle based on recent capitalimprovements performed under PC-744 other recent capital improvement projects (ie PC-740 PC-720 etc) and best engineering judgment The line items listed in each area areintended to provide a basis for the cost estimate to give an understanding of the level of costestimate assumptions used and items includednot included in the cost estimate It is unlikelyand not intended that the major capital projects would include all of the items listed at thespecified cycle Rather it is more likely that the overall cost would be broken into smallerprojects spread across a ~10 year period at the specified cycle
2 The percentages listed below were applied to each of the base construction costs Theseare similar to the percentages used in the Wastewater Master Plan (see Master Plan TechnicalMemo Basis of Cost Estimates dated August 15 2003)
- 30 Contingency (for miscellaneous items not included in the general cost estimate)
- 25 Contractor Overhead and Profit and General Conditions
- 20 Engineering Legal Administration and Management
3 Capital costs presented assume continued use of the existing processes in place at the
WWTP It does not assume major changes to the treatment process such as a new form ofprimary treatment or biological treatment The costs also do not include potentially newprocesses that may be required for regulatory or other reasons such as filtration of thesecondary effluent sludge digestion or major change to the type of effluent disinfection
4 Capital costs presented for each process area do not include maintenance related costs forroutine maintenance between the major capital improvement cycles It is assumed thatmaintenance activities will be performed on the equipment at the required frequencies tomaintain the equipment in good worknig order between major rehabilitation or replacementprojects
Link to Complete Spreadsheets is found on the Wastewater Master Plan
CD DWP Est of Capital Improvements for WWTP - 50-yrxls
7182019 Basis of Cost Estimates
httpslidepdfcomreaderfullbasis-of-cost-estimates 6767
Detroit Water and Sewerage DepartmentBasis of Cost Estimates
Table D1
SUMMARY OF CAPITAL IMPROVEMENT PROJECT COSTS
Area Life Cycle Start of Cycle 2003 Costs ($M)PROCESS RELATED
Pump Station No 1 20 2025 $ 63Pump Station No 2 20 2006 $ 66
Chemical Addition 20 2023 $ 9Rectangular Primary Clarifiers 20 2013 $ 86Circular Primary Clarifiers 20 2025 $ 84ILP Nos 1 2 3 4 7 20 2025 $ 29
Aeration Basins 20 2025 $ 55Cryo Plants 10 2015 $ 1Secondary Clarifiers 20 2020 $ 140SFE Pump Station 20 2010 $ 13
Chlorination 20 2022 $ 16
Dechlorination 20 2023 $ 12Hydraulic Structures 20 2020 $ 7Complex A and B 20 2025 $ 32
C-I Dewatering 15 2020 $ 31C-II Lower Level Dewatering 15 2019 $ 35C-II Upper Level Dewatering 15 2015 $ 42
C-I and C-II Incineration 15 2009 $ 139Sludge Offloading 20 2025 $ 19NON-PROCESS RELATED
AdminRagland Buildings 20 2025 $ 10Plant Security 10 2015 $ 10Plant-wide Paving 15 2020 $ 6Parking Structure 20 2025 $ 7Work Environment Improvements 10 2015 $ 5
Rehab of OampM Bldgs Warehouses 20 2007 $ 40Plant-wide Instrumentation 15 2020 $ 100General Electrical 20 2045 $ 29Plant-wide Secondary Water 15 2025 $ 6
Plant-wide Steam System 15 2023 $ 6Plant-wide Potable Water 15 2010 $ 2Plant -wide Drainage 15 2010 $ 2
Fire Protection Improvements 20 2006 $ 4Plant-Wide JOCs As-Needed Eng 1 2005 $ 3
Total $ 1107
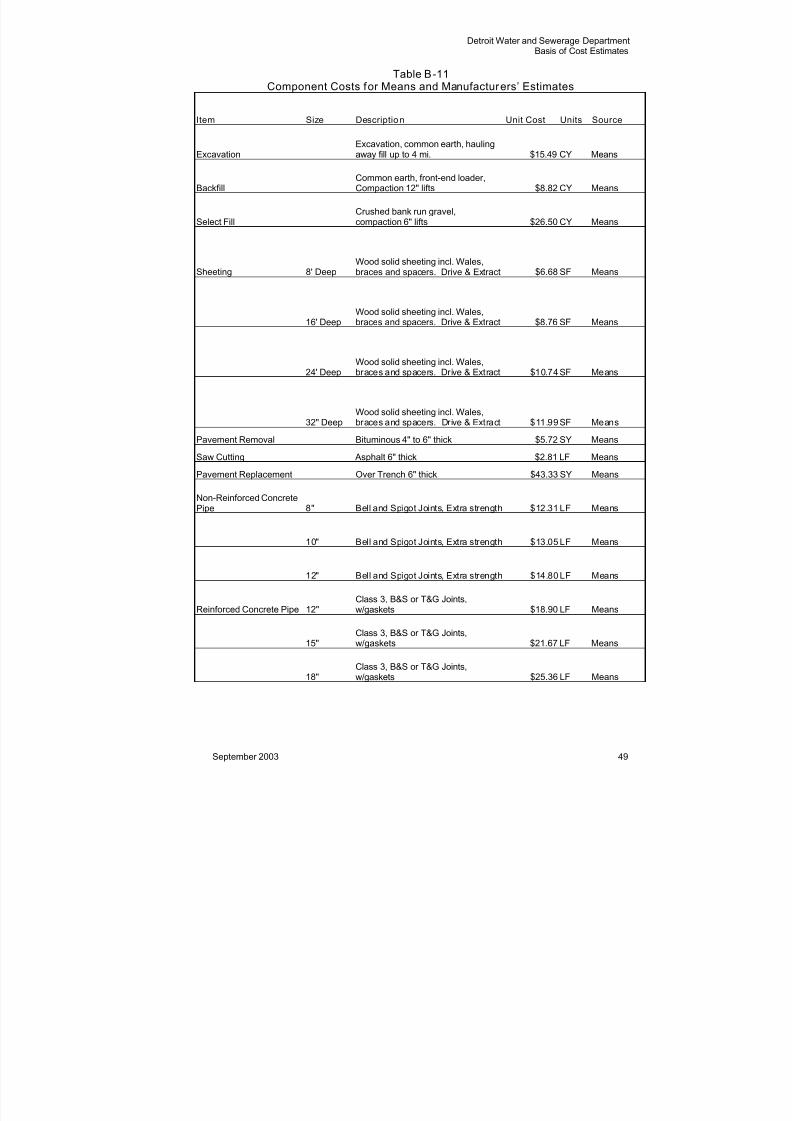
7182019 Basis of Cost Estimates
httpslidepdfcomreaderfullbasis-of-cost-estimates 5367
Detroit Water and Sewerage DepartmentBasis of Cost Estimates
September 2003 52
Item Size Description Unit Cost Units Source
HDPEPipe for Sliplining 14HDPE Pipe PE3408 DR21 (80 psi)price installed $4276 LF Manufact
16HDPE Pipe PE3408 DR21 (80 psi)price installed $5586 LF Manufact
18HDPE Pipe PE3408 DR21 (80 psi)price installed $7069 LF Manufact
20HDPE Pipe PE3408 DR21 (80 psi)price installed $8728 LF Manufact
22HDPE Pipe PE3408 DR21 (80 psi)price installed $10560 LF Manufact
24
HDPE Pipe PE3408 DR21 (80 psi)
price installed $12567 LF Manufact
26HDPE Pipe PE3408 DR21 (80 psi)price installed $14749 LF Manufact
28HDPE Pipe PE3408 DR21 (80 psi)price installed $17106 LF Manufact
30HDPE Pipe PE3408 DR21 (80 psi)price installed $19637 LF Manufact
32HDPE Pipe PE3408 DR21 (80 psi)price installed $22342 LF Manufact
36HDPE Pipe PE3408 DR21 (80 psi)price installed $28277 LF Manufact
42HDPE Pipe PE3408 DR21 (80 psi)price installed $38488 LF Manufact
48HDPE Pipe PE3408 DR21 (80 psi)price installed $50270 LF Manufact
52HDPE Pipe PE3408 DR21 (80 psi)price installed $57869 LF Manufact
54
HDPE Pipe PE3408 DR21 (80 psi)
price installed $63623 LF Manufact
Manholes 4 DiaPrecast Concrete not incl Excavbackfill frame cover sheeting $17979 VLF Means
5 DiaPrecast Concrete not incl Excavbackfill frame cover sheeting $18809 VLF Means
7182019 Basis of Cost Estimates
httpslidepdfcomreaderfullbasis-of-cost-estimates 5467
Detroit Water and Sewerage DepartmentBasis of Cost Estimates
September 2003 53
Item Size Description Unit Cost Units Source
Manholes 6 DiaPrecast Concrete not incl Excavbackfill frame cover sheeting $28582 VLF Means
7 DiaPrecast Concrete not incl Excavbackfill frame cover sheeting $38355 VLF Means
8 DiaPrecast Concrete not incl Excavbackfill frame cover sheeting $48128 VLF Means
B17 Meanrsquos Unit Cost Estimates
Table B-12 contains a sample estimating sheet for calculating each component costusing the material and labor costs identified in the previous section
7182019 Basis of Cost Estimates
httpslidepdfcomreaderfullbasis-of-cost-estimates 5567
Detroit Water and Sewerage DepartmentBasis of Cost Estimates
September 2003 54
Table B-12Sample Component Costs Estimator
Quick Sewer Estimator
Force Mains
Dimensions
Pipe Size 14 in
Trench Width 4 Ft not less than 32
Trench Depth 6 Ft
Length 1 Ft
Material Costs
Pipe CostLF 66 $LF
Excav CostCY 13 $CYBackfill Cost CY 10 $CY
Select Fill CostCY 12 $CY
Pavament DemoCost SY 7 $SY
New Pavement Cost SY 29 $SY
Saw Cut Per LF 4 $LF
Sheeting Cost SF 0 $SF
May not be required for excavations under 5 deep
Pavement A (sy)= 044
Vexcav (cy) = Vbfill (cy) =
089 049
Hbfill (ft)
Sheeting (sf) Common Fill 333333
12
Vsfill (cy) =
036 Hsfill (ft)
Select Fill 266667
W (ft) = 4
Total Costs
7182019 Basis of Cost Estimates
httpslidepdfcomreaderfullbasis-of-cost-estimates 5667
Detroit Water and Sewerage DepartmentBasis of Cost Estimates
September 2003 55
Pipe $6600
Excav $622
Backfill $494
Select Fill $427
Pavement Demo $311New Pavement $1289
Saw Cut $800
Sheeting Cost $000
Total Price $10543
Price Per Foot $10543 LF
7182019 Basis of Cost Estimates
httpslidepdfcomreaderfullbasis-of-cost-estimates 5767
Detroit Water and Sewerage DepartmentBasis of Cost Estimates
September 2003 56
Appendix C
Unit Costs for Treatment Facilities
7182019 Basis of Cost Estimates
httpslidepdfcomreaderfullbasis-of-cost-estimates 5867
Detroit Water and Sewerage DepartmentBasis of Cost Estimates
September 2003 57
Appendix C ndash Unit Costs for Treatment FacilitiesThe following tables outline the unit costs for treatment facilities derived from projectcost estimates These unit costs are provided for future estimating of these facilitiesand are the total cost X 1000 They are base construction costs only and do notinclude engineering fees allowances or contingencies
Table C-1Influent Pump Station Unit Cost
Capacity 2000 2010 2020 2030 2040 2050
394 mgd $1960 $2320 $2820 $3320 $3820 $4320
400 mgd $3810 $4520 $5490 $6460 $7430 $8400
491 mgd $2060 $2440 $2970 $3490 $4010 $4530
615 mgd $2510 $2980 $3620 $4260 $4900 $5540
615 mgd $2510 $2980 $3620 $4260 $4900 $5540
615 mgd $3050 $3620 $4400 $5180 $5960 $6740
619 mgd $3150 $3740 $4550 $5350 $6150 $6950
860 mgd $4440 $5270 $6410 $7540 $8670 $9800
1040 mgd $5940 $7040 $8560 $10070 $11580 $13090
1080 mgd $3790 $4490 $5460 $6420 $7380 $8340
1130 mgd $6090 $7220 $8780 $10330 $11880 $13420
1260 mgd $4510 $5350 $6500 $7650 $8800 $9940
1580 mgd $6020 $7140 $8680 $10210 $11740 $13270
1890 mgd $6350 $7530 $9150 $10770 $12390 $14000
2535 mgd $7030 $8340 $10140 $11930 $13720 $15500
3105 mgd $7030 $8340 $10140 $11930 $13720 $15500
Table C-2
Screening and Grit Chamber Unit Cost Capacity 2000 2010 2020 2030 2040 2050
116 mgd $1530 $1810 $2200 $2590 $2980 $3370
143 mgd $2030 $2410 $2930 $3450 $3970 $4490
216 mgd $2210 $2620 $3180 $3740 $4300 $4860
221 mgd $3490 $4140 $5030 $5920 $6810 $7700
226 mgd $3490 $4140 $5030 $5920 $6810 $7700
322 mgd $4500 $5340 $6490 $7640 $8790 $9930
322 mgd $4500 $5340 $6490 $7640 $8790 $9930
368 mgd $3240 $3840 $4670 $5490 $6320 $7140
409 mgd $3700 $4390 $5340 $6280 $7220 $8160
471 mgd $6190 $7340 $8920 $10500 $12080 $13650471 mgd $5940 $7040 $8560 $10070 $11580 $13090
554 mgd $4520 $5360 $6510 $7660 $8810 $9960
576 mgd $5190 $6160 $7490 $8810 $10130 $11450
636 mgd $5600 $6640 $8070 $9500 $10930 $12350
1000 mgd $9770 $11590 $14090 $16580 $19070 $21550
1250 mgd $11300 $13400 $16290 $19170 $22050 $24920
7182019 Basis of Cost Estimates
httpslidepdfcomreaderfullbasis-of-cost-estimates 5967
Detroit Water and Sewerage DepartmentBasis of Cost Estimates
September 2003 58
Table C-3 Aeration Bas in wi th Nit ri ficat ion Unit Cost
Capacity 2000 2010 2020 2030 2040 2050
113 mgd $10400 $12330 $14990 $17640 $20290 $22930
140 mgd $11200 $13280 $16140 $18990 $21840 $24680
211 mgd $17300 $20520 $24940 $29350 $33760 $38150
211 mgd $17300 $20520 $24940 $29350 $33760 $38150211 mgd $16000 $18980 $23070 $27150 $31230 $35290
308 mgd $22600 $26800 $32570 $38320 $44080 $49810
308 mgd $22600 $26800 $32570 $38320 $44080 $49810
359 mgd $24200 $28700 $34880 $41040 $47210 $53350
400 mgd $22600 $26800 $32570 $38320 $44080 $49810
450 mgd $32300 $38310 $46560 $54780 $63010 $71200
450 mgd $31800 $37710 $45830 $53930 $62040 $70110
540 mgd $35300 $41860 $50880 $59870 $68870 $77830
563 mgd $36800 $43640 $53040 $62410 $71790 $81130
622 mgd $39300 $46610 $56650 $66660 $76680 $86650
Table C-4Primary Clarifiers Unit Cost
Capacity 2000 2010 2020 2030 2040 2050
116 mgd $1530 $1810 $2200 $2590 $2980 $3370
143 mgd $2030 $2410 $2930 $3450 $3970 $4490
216 mgd $2210 $2620 $3180 $3740 $4300 $4860
221 mgd $3490 $4140 $5030 $5920 $6810 $7700
226 mgd $3490 $4140 $5030 $5920 $6810 $7700
322 mgd $4500 $5340 $6490 $7640 $8790 $9930
322 mgd $4500 $5340 $6490 $7640 $8790 $9930
368 mgd $3240 $3840 $4670 $5490 $6320 $7140
409 mgd $3700 $4390 $5340 $6280 $7220 $8160
471 mgd $6190 $7340 $8920 $10500 $12080 $13650
471 mgd $5940 $7040 $8560 $10070 $11580 $13090
554 mgd $4520 $5360 $6510 $7660 $8810 $9960
576 mgd $5190 $6160 $7490 $8810 $10130 $11450
636 mgd $5600 $6640 $8070 $9500 $10930 $12350
1000 mgd $9770 $11590 $14090 $16580 $19070 $21550
1250 mgd $11300 $13400 $16290 $19170 $22050 $24920
Table C-5Complete Mix Activated Sludge Unit Cost
Capacity 2000 2010 2020 2030 2040 2050
100 mgd $21800 $25850 $31420 $36970 $42530 $48060
125 mgd $25300 $30000 $36460 $42900 $49350 $55770
7182019 Basis of Cost Estimates
httpslidepdfcomreaderfullbasis-of-cost-estimates 6067
Detroit Water and Sewerage DepartmentBasis of Cost Estimates
September 2003 59
Table C-6Iron Feed System Unit Cost
Capacity 2000 2010 2020 2030 2040 2050
113 mgd $152 $180 $220 $260 $300 $340
140 mgd $152 $180 $220 $260 $300 $340
211 mgd $152 $180 $220 $260 $300 $340
211 mgd $152 $180 $220 $260 $300 $340211 mgd $152 $180 $220 $260 $300 $340
308 mgd $156 $190 $230 $270 $310 $350
308 mgd $156 $190 $230 $270 $310 $350
359 mgd $175 $210 $260 $310 $360 $410
400 mgd $164 $190 $230 $270 $310 $350
450 mgd $182 $220 $270 $320 $370 $420
450 mgd $182 $220 $270 $320 $370 $420
540 mgd $208 $250 $300 $350 $400 $450
563 mgd $189 $220 $270 $320 $370 $420
622 mgd $197 $230 $280 $330 $380 $430
1000 mgd $205 $240 $290 $340 $390 $440
1250 mgd $225 $270 $330 $390 $450 $510
Table C-7Coagulation-Flocculation Unit Cost
Capacity 2000 2010 2020 2030 2040 2050
100 mgd $19700 $23360 $28390 $33410 $38430 $43430
125 mgd $24100 $28580 $34740 $40880 $47020 $53130
Table C-8Secondary Clarifiers Unit Cost
Capacity 2000 2010 2020 2030 2040 2050
113 mgd $3050 $3620 $4400 $5180 $5960 $6740140 mgd $3800 $4510 $5480 $6450 $7420 $8380
211 mgd $4430 $5250 $6380 $7510 $8640 $9760
211 mgd $4430 $5250 $6380 $7510 $8640 $9760
211 mgd $4870 $5780 $7030 $8270 $9510 $10750
308 mgd $5800 $6880 $8360 $9840 $11320 $12790
308 mgd $5800 $6880 $8360 $9840 $11320 $12790
359 mgd $7120 $8440 $10260 $12070 $13880 $15680
400 mgd $6280 $7450 $9050 $10650 $12250 $13840
450 mgd $8070 $9570 $11630 $13680 $15740 $17790
450 mgd $8070 $9570 $11630 $13680 $15740 $17790
540 mgd $10400 $12330 $14990 $17640 $20290 $22930
563 mgd $11500 $13640 $16580 $19510 $22440 $25360
622 mgd $12400 $14710 $17880 $21040 $24200 $27350
1000 mgd $13700 $16250 $19750 $23240 $26730 $30210
1250 mgd $15200 $18030 $21910 $25780 $29650 $33510
7182019 Basis of Cost Estimates
httpslidepdfcomreaderfullbasis-of-cost-estimates 6167
Detroit Water and Sewerage DepartmentBasis of Cost Estimates
September 2003 60
Table C-9Intermediate Pumping Unit Cost
Capacity 2000 2010 2020 2030 2040 2050
253 mgd $734 $870 $1060 $1250 $1440 $1630
350 mgd $1060 $1260 $1530 $1800 $2070 $2340
400 mgd $1220 $1450 $1760 $2070 $2380 $2690
446 mgd $1380 $1640 $1990 $2340 $2690 $3040452 mgd $1410 $1670 $2030 $2390 $2750 $3110
529 mgd $1680 $1990 $2420 $2850 $3280 $3710
611 mgd $1680 $1990 $2420 $2850 $3280 $3710
669 mgd $1860 $2210 $2690 $3170 $3650 $4120
743 mgd $2090 $2480 $3010 $3540 $4070 $4600
849 mgd $2430 $2880 $3500 $4120 $4740 $5360
942 mgd $2470 $2930 $3560 $4190 $4820 $5450
1040 mgd $2770 $3290 $4000 $4710 $5420 $6120
1050 mgd $2810 $3330 $4050 $4770 $5490 $6200
1130 mgd $3040 $3610 $4390 $5170 $5950 $6720
Table C-10Filtration Unit Cost
Capacity 2000 2010 2020 2030 2040 2050
113 mgd $3930 $4660 $5660 $6660 $7660 $8660
140 mgd $5040 $5980 $7270 $8550 $9830 $11110
211 mgd $6210 $7360 $8950 $10530 $12110 $13680
211 mgd $6220 $7380 $8970 $10550 $12140 $13720
308 mgd $7900 $9370 $11390 $13400 $15410 $17410
359 mgd $8440 $10010 $12170 $14320 $16470 $18610
400 mgd $9190 $10900 $13250 $15590 $17930 $20260
450 mgd $10400 $12330 $14990 $17640 $20290 $22930
540 mgd $11800 $13990 $17000 $20000 $23010 $26000563 mgd $12200 $14470 $17590 $20700 $23810 $26910
622 mgd $13500 $16010 $19460 $22900 $26340 $29770
7182019 Basis of Cost Estimates
httpslidepdfcomreaderfullbasis-of-cost-estimates 6267
Detroit Water and Sewerage DepartmentBasis of Cost Estimates
September 2003 61
Table C-11Ultraviolet Disinfection Unit Cost
Capacity 2000 2010 2020 2030 2040 2050
259 mgd $912 $1080 $1310 $1540 $1770 $2000
351 mgd $1280 $1520 $1850 $2180 $2510 $2840
400 mgd $1530 $1810 $2200 $2590 $2980 $3370
452 mgd $2040 $2420 $2940 $3460 $3980 $4500452 mgd $3310 $3930 $4780 $5620 $6460 $7300
452 mgd $1750 $2080 $2530 $2980 $3430 $3880
619 mgd $1750 $2080 $2530 $2980 $3430 $3880
619 mgd $2280 $2700 $3280 $3860 $4440 $5020
679 mgd $2550 $3020 $3670 $4320 $4970 $5620
860 mgd $3830 $4540 $5520 $6500 $7480 $8450
860 mgd $3060 $3630 $4410 $5190 $5970 $6750
956 mgd $3400 $4030 $4900 $5770 $6640 $7500
1036 mgd $3830 $4540 $5520 $6500 $7480 $8450
1126 mgd $4100 $4860 $5910 $6950 $7990 $9030
1750 mgd $8270 $9810 $11920 $14030 $16140 $18240
2000 mgd $8620 $10220 $12420 $14610 $16810 $19000
Table C-12Post Aeration Unit Cost
Capacity 2000 2010 2020 2030 2040 2050
113 mgd $114 $140 $170 $200 $230 $260
140 mgd $134 $160 $190 $220 $250 $280
211 mgd $142 $170 $210 $250 $290 $330
211 mgd $142 $170 $210 $250 $290 $330
211 mgd $167 $200 $240 $280 $320 $360
308 mgd $182 $220 $270 $320 $370 $420308 mgd $182 $220 $270 $320 $370 $420
359 mgd $260 $310 $380 $450 $520 $590
400 mgd $273 $320 $390 $460 $530 $600
450 mgd $237 $280 $340 $400 $460 $520
450 mgd $237 $280 $340 $400 $460 $520
540 mgd $363 $430 $520 $610 $700 $790
563 mgd $358 $420 $510 $600 $690 $780
622 mgd $388 $460 $560 $660 $760 $860
1000 mgd $455 $540 $660 $780 $900 $1020
1250 mgd $554 $660 $800 $940 $1080 $1220
7182019 Basis of Cost Estimates
httpslidepdfcomreaderfullbasis-of-cost-estimates 6367
Detroit Water and Sewerage DepartmentBasis of Cost Estimates
September 2003 62
Table C-13Blower System Unit Cost
Capacity 2000 2010 2020 2030 2040 2050
170 mgd $718 $850 $1030 $1210 $1390 $1570
210 mgd $786 $930 $1130 $1330 $1530 $1730
317 mgd $1120 $1330 $1620 $1910 $2200 $2490
317 mgd $1120 $1330 $1620 $1910 $2200 $2490317 mgd $1060 $1260 $1530 $1800 $2070 $2340
462 mgd $7440 $8820 $10720 $12610 $14510 $16400
462 mgd $7440 $8820 $10720 $12610 $14510 $16400
539 mgd $7440 $8820 $10720 $12610 $14510 $16400
600 mgd $6430 $7630 $9270 $10910 $12550 $14180
675 mgd $8920 $10580 $12860 $15130 $17400 $19660
675 mgd $8840 $10480 $12740 $14990 $17240 $19480
810 mgd $8950 $10610 $12900 $15180 $17460 $19730
845 mgd $8600 $10200 $12400 $14590 $16780 $18960
933 mgd $8950 $10610 $12900 $15180 $17460 $19730
1500 mgd $6370 $7550 $9180 $10800 $12420 $14040
1875 mgd $7670 $9100 $11060 $13010 $14970 $16920
Table C-14Gravity Thickening Unit Cost
Capacity 2000 2010 2020 2030 2040 2050
113 mgd $278 $330 $400 $470 $540 $610
140 mgd $319 $380 $460 $540 $620 $700
211 mgd $693 $820 $1000 $1180 $1360 $1540
211 mgd $555 $660 $800 $940 $1080 $1220
211 mgd $396 $470 $570 $670 $770 $870
308 mgd $708 $840 $1020 $1200 $1380 $1560308 mgd $723 $860 $1050 $1240 $1430 $1620
359 mgd $609 $720 $880 $1040 $1200 $1360
400 mgd $581 $690 $840 $990 $1140 $1290
450 mgd $927 $1100 $1340 $1580 $1820 $2060
450 mgd $944 $1120 $1360 $1600 $1840 $2080
540 mgd $830 $980 $1190 $1400 $1610 $1820
563 mgd $768 $910 $1110 $1310 $1510 $1710
622 mgd $830 $980 $1190 $1400 $1610 $1820
1000 mgd $723 $860 $1050 $1240 $1430 $1620
1250 mgd $845 $1000 $1220 $1440 $1660 $1880
7182019 Basis of Cost Estimates
httpslidepdfcomreaderfullbasis-of-cost-estimates 6467
Detroit Water and Sewerage DepartmentBasis of Cost Estimates
September 2003 63
Table C-15Centrifugation Unit Cost
Capacity 2000 2010 2020 2030 2040 2050
113 mgd $2050 $2430 $2950 $3470 $3990 $4510
14 mgd $2440 $2890 $3510 $4130 $4750 $5370
211 mgd $2930 $3470 $4220 $4970 $5720 $6460
211 mgd $2220 $2630 $3200 $3770 $4340 $4900211 mgd $4160 $4930 $5990 $7050 $8110 $9160
308 mgd $2990 $3550 $4310 $5070 $5830 $6590
308 mgd $3040 $3610 $4390 $5170 $5950 $6720
359 mgd $6200 $7350 $8930 $10510 $12090 $13660
40 mgd $6150 $7290 $8860 $10430 $12000 $13560
45 mgd $4420 $5240 $6370 $7500 $8630 $9750
45 mgd $4500 $5340 $6490 $7640 $8790 $9930
54 mgd $9210 $10920 $13270 $15610 $17960 $20300
563 mgd $10700 $12690 $15420 $18140 $20870 $23580
622 mgd $11900 $14110 $17150 $20180 $23210 $26230
100 mgd $15000 $17790 $21620 $25440 $29260 $33060
125 mgd $17900 $21230 $25800 $30360 $34920 $39460
Table C-16Hauling and Landfilling Unit Cost
Capacity 2000 2010 2020 2030 2040 2050
113 mgd $438 $520 $630 $740 $850 $960
140 mgd $546 $650 $790 $930 $1070 $1210
211 mgd $1060 $1260 $1530 $1800 $2070 $2340
211 mgd $788 $930 $1130 $1330 $1530 $1730
211 mgd $810 $960 $1170 $1380 $1590 $1800
308 mgd $1090 $1290 $1570 $1850 $2130 $2410308 mgd $1100 $1300 $1580 $1860 $2140 $2420
359 mgd $1400 $1660 $2020 $2380 $2740 $3100
400 mgd $1370 $1620 $1970 $2320 $2670 $3020
450 mgd $1530 $1810 $2200 $2590 $2980 $3370
450 mgd $1560 $1850 $2250 $2650 $3050 $3450
540 mgd $2150 $2550 $3100 $3650 $4200 $4750
563 mgd $2030 $2410 $2930 $3450 $3970 $4490
622 mgd $2220 $2630 $3200 $3770 $4340 $4900
1000 mgd $2360 $2800 $3400 $4000 $4600 $5200
1250 mgd $2950 $3500 $4250 $5000 $5750 $6500
7182019 Basis of Cost Estimates
httpslidepdfcomreaderfullbasis-of-cost-estimates 6567
Detroit Water and Sewerage DepartmentBasis of Cost Estimates
September 2003 64
Appendix D
Wastewater Treatment Plant Ongoing Repair andReplacement Cost Estimates
7182019 Basis of Cost Estimates
httpslidepdfcomreaderfullbasis-of-cost-estimates 6667
Detroit Water and Sewerage DepartmentBasis of Cost Estimates
September 2003 65
SUMMARY OF CAPITAL IMPROVEMENT PROJECT COSTS
Explanation of Capital Improvement Costs
NOTE This analysis was provided by the staff of the Detroit Wastewater Partners (DWSDProject PC-744 - Wastewater Treatment Plant Upgrade) and DWSD Wastewater Plant staff Itwas completed in July 2003
General
1 Capital costs are presented by major process and non-process areas The project costsassume a major capital improvement project for the specified life cycle based on recent capitalimprovements performed under PC-744 other recent capital improvement projects (ie PC-740 PC-720 etc) and best engineering judgment The line items listed in each area areintended to provide a basis for the cost estimate to give an understanding of the level of costestimate assumptions used and items includednot included in the cost estimate It is unlikelyand not intended that the major capital projects would include all of the items listed at thespecified cycle Rather it is more likely that the overall cost would be broken into smallerprojects spread across a ~10 year period at the specified cycle
2 The percentages listed below were applied to each of the base construction costs Theseare similar to the percentages used in the Wastewater Master Plan (see Master Plan TechnicalMemo Basis of Cost Estimates dated August 15 2003)
- 30 Contingency (for miscellaneous items not included in the general cost estimate)
- 25 Contractor Overhead and Profit and General Conditions
- 20 Engineering Legal Administration and Management
3 Capital costs presented assume continued use of the existing processes in place at the
WWTP It does not assume major changes to the treatment process such as a new form ofprimary treatment or biological treatment The costs also do not include potentially newprocesses that may be required for regulatory or other reasons such as filtration of thesecondary effluent sludge digestion or major change to the type of effluent disinfection
4 Capital costs presented for each process area do not include maintenance related costs forroutine maintenance between the major capital improvement cycles It is assumed thatmaintenance activities will be performed on the equipment at the required frequencies tomaintain the equipment in good worknig order between major rehabilitation or replacementprojects
Link to Complete Spreadsheets is found on the Wastewater Master Plan
CD DWP Est of Capital Improvements for WWTP - 50-yrxls
7182019 Basis of Cost Estimates
httpslidepdfcomreaderfullbasis-of-cost-estimates 6767
Detroit Water and Sewerage DepartmentBasis of Cost Estimates
Table D1
SUMMARY OF CAPITAL IMPROVEMENT PROJECT COSTS
Area Life Cycle Start of Cycle 2003 Costs ($M)PROCESS RELATED
Pump Station No 1 20 2025 $ 63Pump Station No 2 20 2006 $ 66
Chemical Addition 20 2023 $ 9Rectangular Primary Clarifiers 20 2013 $ 86Circular Primary Clarifiers 20 2025 $ 84ILP Nos 1 2 3 4 7 20 2025 $ 29
Aeration Basins 20 2025 $ 55Cryo Plants 10 2015 $ 1Secondary Clarifiers 20 2020 $ 140SFE Pump Station 20 2010 $ 13
Chlorination 20 2022 $ 16
Dechlorination 20 2023 $ 12Hydraulic Structures 20 2020 $ 7Complex A and B 20 2025 $ 32
C-I Dewatering 15 2020 $ 31C-II Lower Level Dewatering 15 2019 $ 35C-II Upper Level Dewatering 15 2015 $ 42
C-I and C-II Incineration 15 2009 $ 139Sludge Offloading 20 2025 $ 19NON-PROCESS RELATED
AdminRagland Buildings 20 2025 $ 10Plant Security 10 2015 $ 10Plant-wide Paving 15 2020 $ 6Parking Structure 20 2025 $ 7Work Environment Improvements 10 2015 $ 5
Rehab of OampM Bldgs Warehouses 20 2007 $ 40Plant-wide Instrumentation 15 2020 $ 100General Electrical 20 2045 $ 29Plant-wide Secondary Water 15 2025 $ 6
Plant-wide Steam System 15 2023 $ 6Plant-wide Potable Water 15 2010 $ 2Plant -wide Drainage 15 2010 $ 2
Fire Protection Improvements 20 2006 $ 4Plant-Wide JOCs As-Needed Eng 1 2005 $ 3
Total $ 1107
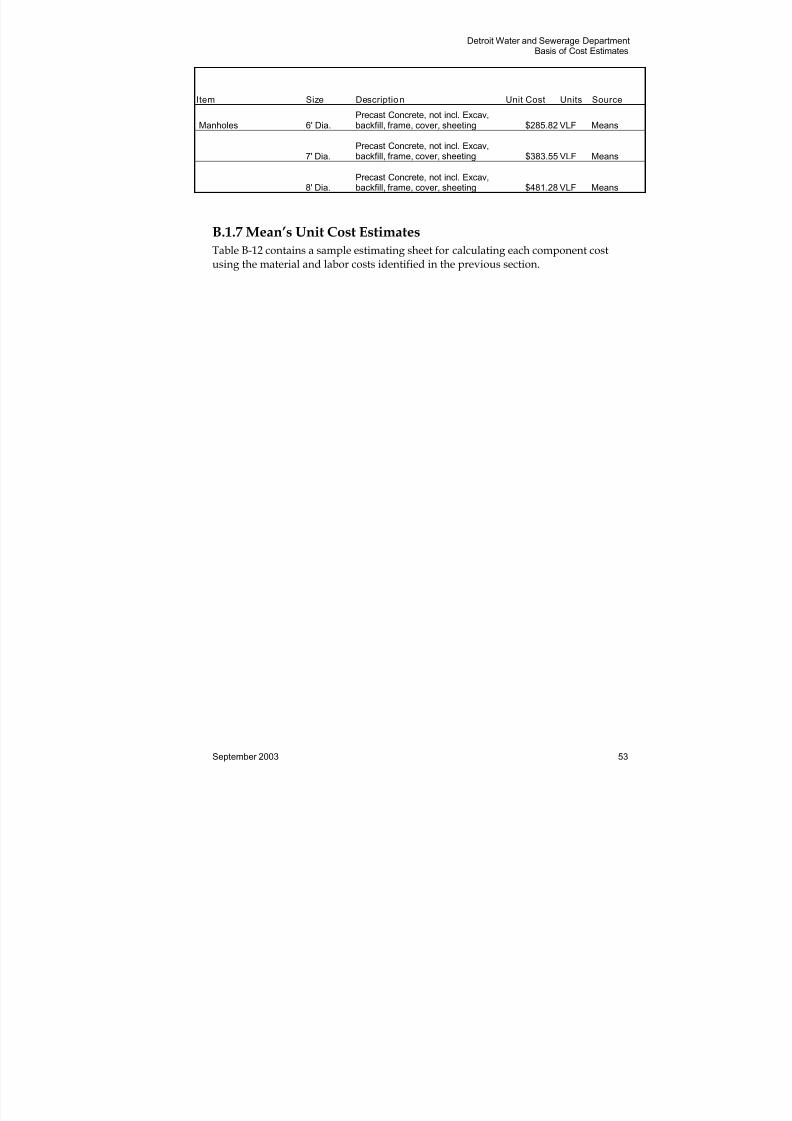
7182019 Basis of Cost Estimates
httpslidepdfcomreaderfullbasis-of-cost-estimates 6167
Detroit Water and Sewerage DepartmentBasis of Cost Estimates
September 2003 60
Table C-9Intermediate Pumping Unit Cost
Capacity 2000 2010 2020 2030 2040 2050
253 mgd $734 $870 $1060 $1250 $1440 $1630
350 mgd $1060 $1260 $1530 $1800 $2070 $2340
400 mgd $1220 $1450 $1760 $2070 $2380 $2690
446 mgd $1380 $1640 $1990 $2340 $2690 $3040452 mgd $1410 $1670 $2030 $2390 $2750 $3110
529 mgd $1680 $1990 $2420 $2850 $3280 $3710
611 mgd $1680 $1990 $2420 $2850 $3280 $3710
669 mgd $1860 $2210 $2690 $3170 $3650 $4120
743 mgd $2090 $2480 $3010 $3540 $4070 $4600
849 mgd $2430 $2880 $3500 $4120 $4740 $5360
942 mgd $2470 $2930 $3560 $4190 $4820 $5450
1040 mgd $2770 $3290 $4000 $4710 $5420 $6120
1050 mgd $2810 $3330 $4050 $4770 $5490 $6200
1130 mgd $3040 $3610 $4390 $5170 $5950 $6720
Table C-10Filtration Unit Cost
Capacity 2000 2010 2020 2030 2040 2050
113 mgd $3930 $4660 $5660 $6660 $7660 $8660
140 mgd $5040 $5980 $7270 $8550 $9830 $11110
211 mgd $6210 $7360 $8950 $10530 $12110 $13680
211 mgd $6220 $7380 $8970 $10550 $12140 $13720
308 mgd $7900 $9370 $11390 $13400 $15410 $17410
359 mgd $8440 $10010 $12170 $14320 $16470 $18610
400 mgd $9190 $10900 $13250 $15590 $17930 $20260
450 mgd $10400 $12330 $14990 $17640 $20290 $22930
540 mgd $11800 $13990 $17000 $20000 $23010 $26000563 mgd $12200 $14470 $17590 $20700 $23810 $26910
622 mgd $13500 $16010 $19460 $22900 $26340 $29770
7182019 Basis of Cost Estimates
httpslidepdfcomreaderfullbasis-of-cost-estimates 6267
Detroit Water and Sewerage DepartmentBasis of Cost Estimates
September 2003 61
Table C-11Ultraviolet Disinfection Unit Cost
Capacity 2000 2010 2020 2030 2040 2050
259 mgd $912 $1080 $1310 $1540 $1770 $2000
351 mgd $1280 $1520 $1850 $2180 $2510 $2840
400 mgd $1530 $1810 $2200 $2590 $2980 $3370
452 mgd $2040 $2420 $2940 $3460 $3980 $4500452 mgd $3310 $3930 $4780 $5620 $6460 $7300
452 mgd $1750 $2080 $2530 $2980 $3430 $3880
619 mgd $1750 $2080 $2530 $2980 $3430 $3880
619 mgd $2280 $2700 $3280 $3860 $4440 $5020
679 mgd $2550 $3020 $3670 $4320 $4970 $5620
860 mgd $3830 $4540 $5520 $6500 $7480 $8450
860 mgd $3060 $3630 $4410 $5190 $5970 $6750
956 mgd $3400 $4030 $4900 $5770 $6640 $7500
1036 mgd $3830 $4540 $5520 $6500 $7480 $8450
1126 mgd $4100 $4860 $5910 $6950 $7990 $9030
1750 mgd $8270 $9810 $11920 $14030 $16140 $18240
2000 mgd $8620 $10220 $12420 $14610 $16810 $19000
Table C-12Post Aeration Unit Cost
Capacity 2000 2010 2020 2030 2040 2050
113 mgd $114 $140 $170 $200 $230 $260
140 mgd $134 $160 $190 $220 $250 $280
211 mgd $142 $170 $210 $250 $290 $330
211 mgd $142 $170 $210 $250 $290 $330
211 mgd $167 $200 $240 $280 $320 $360
308 mgd $182 $220 $270 $320 $370 $420308 mgd $182 $220 $270 $320 $370 $420
359 mgd $260 $310 $380 $450 $520 $590
400 mgd $273 $320 $390 $460 $530 $600
450 mgd $237 $280 $340 $400 $460 $520
450 mgd $237 $280 $340 $400 $460 $520
540 mgd $363 $430 $520 $610 $700 $790
563 mgd $358 $420 $510 $600 $690 $780
622 mgd $388 $460 $560 $660 $760 $860
1000 mgd $455 $540 $660 $780 $900 $1020
1250 mgd $554 $660 $800 $940 $1080 $1220
7182019 Basis of Cost Estimates
httpslidepdfcomreaderfullbasis-of-cost-estimates 6367
Detroit Water and Sewerage DepartmentBasis of Cost Estimates
September 2003 62
Table C-13Blower System Unit Cost
Capacity 2000 2010 2020 2030 2040 2050
170 mgd $718 $850 $1030 $1210 $1390 $1570
210 mgd $786 $930 $1130 $1330 $1530 $1730
317 mgd $1120 $1330 $1620 $1910 $2200 $2490
317 mgd $1120 $1330 $1620 $1910 $2200 $2490317 mgd $1060 $1260 $1530 $1800 $2070 $2340
462 mgd $7440 $8820 $10720 $12610 $14510 $16400
462 mgd $7440 $8820 $10720 $12610 $14510 $16400
539 mgd $7440 $8820 $10720 $12610 $14510 $16400
600 mgd $6430 $7630 $9270 $10910 $12550 $14180
675 mgd $8920 $10580 $12860 $15130 $17400 $19660
675 mgd $8840 $10480 $12740 $14990 $17240 $19480
810 mgd $8950 $10610 $12900 $15180 $17460 $19730
845 mgd $8600 $10200 $12400 $14590 $16780 $18960
933 mgd $8950 $10610 $12900 $15180 $17460 $19730
1500 mgd $6370 $7550 $9180 $10800 $12420 $14040
1875 mgd $7670 $9100 $11060 $13010 $14970 $16920
Table C-14Gravity Thickening Unit Cost
Capacity 2000 2010 2020 2030 2040 2050
113 mgd $278 $330 $400 $470 $540 $610
140 mgd $319 $380 $460 $540 $620 $700
211 mgd $693 $820 $1000 $1180 $1360 $1540
211 mgd $555 $660 $800 $940 $1080 $1220
211 mgd $396 $470 $570 $670 $770 $870
308 mgd $708 $840 $1020 $1200 $1380 $1560308 mgd $723 $860 $1050 $1240 $1430 $1620
359 mgd $609 $720 $880 $1040 $1200 $1360
400 mgd $581 $690 $840 $990 $1140 $1290
450 mgd $927 $1100 $1340 $1580 $1820 $2060
450 mgd $944 $1120 $1360 $1600 $1840 $2080
540 mgd $830 $980 $1190 $1400 $1610 $1820
563 mgd $768 $910 $1110 $1310 $1510 $1710
622 mgd $830 $980 $1190 $1400 $1610 $1820
1000 mgd $723 $860 $1050 $1240 $1430 $1620
1250 mgd $845 $1000 $1220 $1440 $1660 $1880
7182019 Basis of Cost Estimates
httpslidepdfcomreaderfullbasis-of-cost-estimates 6467
Detroit Water and Sewerage DepartmentBasis of Cost Estimates
September 2003 63
Table C-15Centrifugation Unit Cost
Capacity 2000 2010 2020 2030 2040 2050
113 mgd $2050 $2430 $2950 $3470 $3990 $4510
14 mgd $2440 $2890 $3510 $4130 $4750 $5370
211 mgd $2930 $3470 $4220 $4970 $5720 $6460
211 mgd $2220 $2630 $3200 $3770 $4340 $4900211 mgd $4160 $4930 $5990 $7050 $8110 $9160
308 mgd $2990 $3550 $4310 $5070 $5830 $6590
308 mgd $3040 $3610 $4390 $5170 $5950 $6720
359 mgd $6200 $7350 $8930 $10510 $12090 $13660
40 mgd $6150 $7290 $8860 $10430 $12000 $13560
45 mgd $4420 $5240 $6370 $7500 $8630 $9750
45 mgd $4500 $5340 $6490 $7640 $8790 $9930
54 mgd $9210 $10920 $13270 $15610 $17960 $20300
563 mgd $10700 $12690 $15420 $18140 $20870 $23580
622 mgd $11900 $14110 $17150 $20180 $23210 $26230
100 mgd $15000 $17790 $21620 $25440 $29260 $33060
125 mgd $17900 $21230 $25800 $30360 $34920 $39460
Table C-16Hauling and Landfilling Unit Cost
Capacity 2000 2010 2020 2030 2040 2050
113 mgd $438 $520 $630 $740 $850 $960
140 mgd $546 $650 $790 $930 $1070 $1210
211 mgd $1060 $1260 $1530 $1800 $2070 $2340
211 mgd $788 $930 $1130 $1330 $1530 $1730
211 mgd $810 $960 $1170 $1380 $1590 $1800
308 mgd $1090 $1290 $1570 $1850 $2130 $2410308 mgd $1100 $1300 $1580 $1860 $2140 $2420
359 mgd $1400 $1660 $2020 $2380 $2740 $3100
400 mgd $1370 $1620 $1970 $2320 $2670 $3020
450 mgd $1530 $1810 $2200 $2590 $2980 $3370
450 mgd $1560 $1850 $2250 $2650 $3050 $3450
540 mgd $2150 $2550 $3100 $3650 $4200 $4750
563 mgd $2030 $2410 $2930 $3450 $3970 $4490
622 mgd $2220 $2630 $3200 $3770 $4340 $4900
1000 mgd $2360 $2800 $3400 $4000 $4600 $5200
1250 mgd $2950 $3500 $4250 $5000 $5750 $6500
7182019 Basis of Cost Estimates
httpslidepdfcomreaderfullbasis-of-cost-estimates 6567
Detroit Water and Sewerage DepartmentBasis of Cost Estimates
September 2003 64
Appendix D
Wastewater Treatment Plant Ongoing Repair andReplacement Cost Estimates
7182019 Basis of Cost Estimates
httpslidepdfcomreaderfullbasis-of-cost-estimates 6667
Detroit Water and Sewerage DepartmentBasis of Cost Estimates
September 2003 65
SUMMARY OF CAPITAL IMPROVEMENT PROJECT COSTS
Explanation of Capital Improvement Costs
NOTE This analysis was provided by the staff of the Detroit Wastewater Partners (DWSDProject PC-744 - Wastewater Treatment Plant Upgrade) and DWSD Wastewater Plant staff Itwas completed in July 2003
General
1 Capital costs are presented by major process and non-process areas The project costsassume a major capital improvement project for the specified life cycle based on recent capitalimprovements performed under PC-744 other recent capital improvement projects (ie PC-740 PC-720 etc) and best engineering judgment The line items listed in each area areintended to provide a basis for the cost estimate to give an understanding of the level of costestimate assumptions used and items includednot included in the cost estimate It is unlikelyand not intended that the major capital projects would include all of the items listed at thespecified cycle Rather it is more likely that the overall cost would be broken into smallerprojects spread across a ~10 year period at the specified cycle
2 The percentages listed below were applied to each of the base construction costs Theseare similar to the percentages used in the Wastewater Master Plan (see Master Plan TechnicalMemo Basis of Cost Estimates dated August 15 2003)
- 30 Contingency (for miscellaneous items not included in the general cost estimate)
- 25 Contractor Overhead and Profit and General Conditions
- 20 Engineering Legal Administration and Management
3 Capital costs presented assume continued use of the existing processes in place at the
WWTP It does not assume major changes to the treatment process such as a new form ofprimary treatment or biological treatment The costs also do not include potentially newprocesses that may be required for regulatory or other reasons such as filtration of thesecondary effluent sludge digestion or major change to the type of effluent disinfection
4 Capital costs presented for each process area do not include maintenance related costs forroutine maintenance between the major capital improvement cycles It is assumed thatmaintenance activities will be performed on the equipment at the required frequencies tomaintain the equipment in good worknig order between major rehabilitation or replacementprojects
Link to Complete Spreadsheets is found on the Wastewater Master Plan
CD DWP Est of Capital Improvements for WWTP - 50-yrxls
7182019 Basis of Cost Estimates
httpslidepdfcomreaderfullbasis-of-cost-estimates 6767
Detroit Water and Sewerage DepartmentBasis of Cost Estimates
Table D1
SUMMARY OF CAPITAL IMPROVEMENT PROJECT COSTS
Area Life Cycle Start of Cycle 2003 Costs ($M)PROCESS RELATED
Pump Station No 1 20 2025 $ 63Pump Station No 2 20 2006 $ 66
Chemical Addition 20 2023 $ 9Rectangular Primary Clarifiers 20 2013 $ 86Circular Primary Clarifiers 20 2025 $ 84ILP Nos 1 2 3 4 7 20 2025 $ 29
Aeration Basins 20 2025 $ 55Cryo Plants 10 2015 $ 1Secondary Clarifiers 20 2020 $ 140SFE Pump Station 20 2010 $ 13
Chlorination 20 2022 $ 16
Dechlorination 20 2023 $ 12Hydraulic Structures 20 2020 $ 7Complex A and B 20 2025 $ 32
C-I Dewatering 15 2020 $ 31C-II Lower Level Dewatering 15 2019 $ 35C-II Upper Level Dewatering 15 2015 $ 42
C-I and C-II Incineration 15 2009 $ 139Sludge Offloading 20 2025 $ 19NON-PROCESS RELATED
AdminRagland Buildings 20 2025 $ 10Plant Security 10 2015 $ 10Plant-wide Paving 15 2020 $ 6Parking Structure 20 2025 $ 7Work Environment Improvements 10 2015 $ 5
Rehab of OampM Bldgs Warehouses 20 2007 $ 40Plant-wide Instrumentation 15 2020 $ 100General Electrical 20 2045 $ 29Plant-wide Secondary Water 15 2025 $ 6
Plant-wide Steam System 15 2023 $ 6Plant-wide Potable Water 15 2010 $ 2Plant -wide Drainage 15 2010 $ 2
Fire Protection Improvements 20 2006 $ 4Plant-Wide JOCs As-Needed Eng 1 2005 $ 3
Total $ 1107
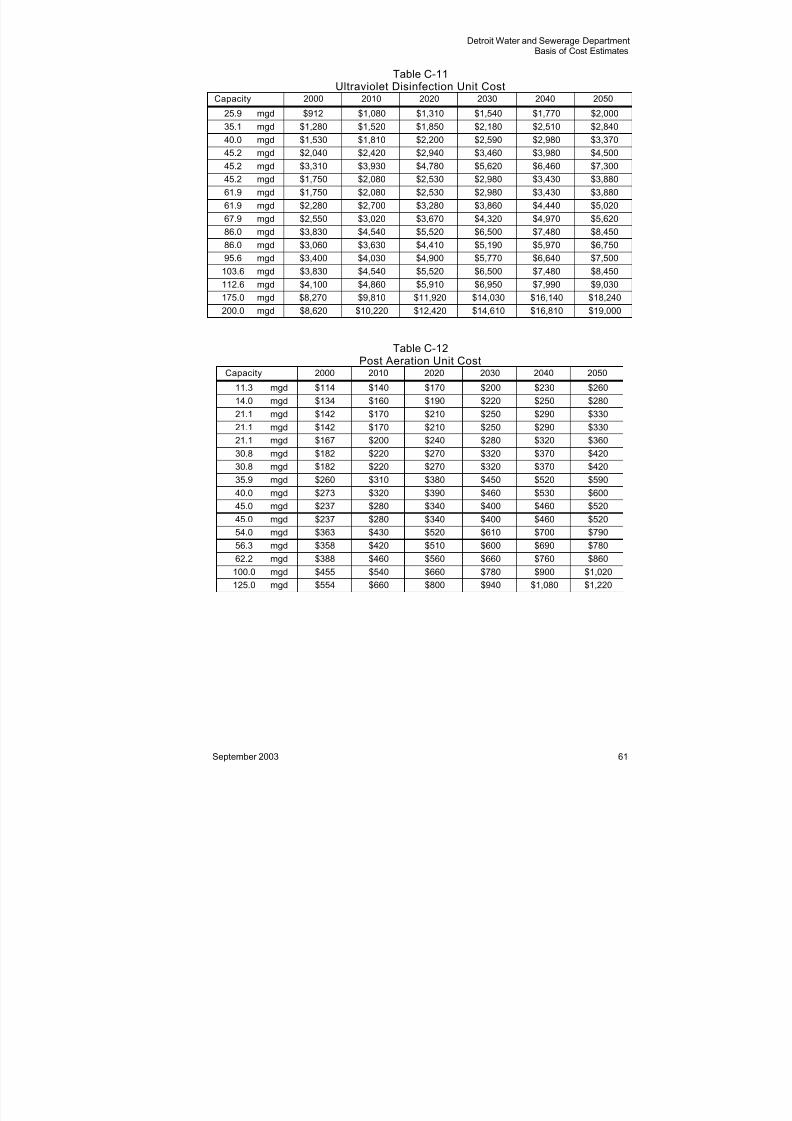
7182019 Basis of Cost Estimates
httpslidepdfcomreaderfullbasis-of-cost-estimates 6267
Detroit Water and Sewerage DepartmentBasis of Cost Estimates
September 2003 61
Table C-11Ultraviolet Disinfection Unit Cost
Capacity 2000 2010 2020 2030 2040 2050
259 mgd $912 $1080 $1310 $1540 $1770 $2000
351 mgd $1280 $1520 $1850 $2180 $2510 $2840
400 mgd $1530 $1810 $2200 $2590 $2980 $3370
452 mgd $2040 $2420 $2940 $3460 $3980 $4500452 mgd $3310 $3930 $4780 $5620 $6460 $7300
452 mgd $1750 $2080 $2530 $2980 $3430 $3880
619 mgd $1750 $2080 $2530 $2980 $3430 $3880
619 mgd $2280 $2700 $3280 $3860 $4440 $5020
679 mgd $2550 $3020 $3670 $4320 $4970 $5620
860 mgd $3830 $4540 $5520 $6500 $7480 $8450
860 mgd $3060 $3630 $4410 $5190 $5970 $6750
956 mgd $3400 $4030 $4900 $5770 $6640 $7500
1036 mgd $3830 $4540 $5520 $6500 $7480 $8450
1126 mgd $4100 $4860 $5910 $6950 $7990 $9030
1750 mgd $8270 $9810 $11920 $14030 $16140 $18240
2000 mgd $8620 $10220 $12420 $14610 $16810 $19000
Table C-12Post Aeration Unit Cost
Capacity 2000 2010 2020 2030 2040 2050
113 mgd $114 $140 $170 $200 $230 $260
140 mgd $134 $160 $190 $220 $250 $280
211 mgd $142 $170 $210 $250 $290 $330
211 mgd $142 $170 $210 $250 $290 $330
211 mgd $167 $200 $240 $280 $320 $360
308 mgd $182 $220 $270 $320 $370 $420308 mgd $182 $220 $270 $320 $370 $420
359 mgd $260 $310 $380 $450 $520 $590
400 mgd $273 $320 $390 $460 $530 $600
450 mgd $237 $280 $340 $400 $460 $520
450 mgd $237 $280 $340 $400 $460 $520
540 mgd $363 $430 $520 $610 $700 $790
563 mgd $358 $420 $510 $600 $690 $780
622 mgd $388 $460 $560 $660 $760 $860
1000 mgd $455 $540 $660 $780 $900 $1020
1250 mgd $554 $660 $800 $940 $1080 $1220
7182019 Basis of Cost Estimates
httpslidepdfcomreaderfullbasis-of-cost-estimates 6367
Detroit Water and Sewerage DepartmentBasis of Cost Estimates
September 2003 62
Table C-13Blower System Unit Cost
Capacity 2000 2010 2020 2030 2040 2050
170 mgd $718 $850 $1030 $1210 $1390 $1570
210 mgd $786 $930 $1130 $1330 $1530 $1730
317 mgd $1120 $1330 $1620 $1910 $2200 $2490
317 mgd $1120 $1330 $1620 $1910 $2200 $2490317 mgd $1060 $1260 $1530 $1800 $2070 $2340
462 mgd $7440 $8820 $10720 $12610 $14510 $16400
462 mgd $7440 $8820 $10720 $12610 $14510 $16400
539 mgd $7440 $8820 $10720 $12610 $14510 $16400
600 mgd $6430 $7630 $9270 $10910 $12550 $14180
675 mgd $8920 $10580 $12860 $15130 $17400 $19660
675 mgd $8840 $10480 $12740 $14990 $17240 $19480
810 mgd $8950 $10610 $12900 $15180 $17460 $19730
845 mgd $8600 $10200 $12400 $14590 $16780 $18960
933 mgd $8950 $10610 $12900 $15180 $17460 $19730
1500 mgd $6370 $7550 $9180 $10800 $12420 $14040
1875 mgd $7670 $9100 $11060 $13010 $14970 $16920
Table C-14Gravity Thickening Unit Cost
Capacity 2000 2010 2020 2030 2040 2050
113 mgd $278 $330 $400 $470 $540 $610
140 mgd $319 $380 $460 $540 $620 $700
211 mgd $693 $820 $1000 $1180 $1360 $1540
211 mgd $555 $660 $800 $940 $1080 $1220
211 mgd $396 $470 $570 $670 $770 $870
308 mgd $708 $840 $1020 $1200 $1380 $1560308 mgd $723 $860 $1050 $1240 $1430 $1620
359 mgd $609 $720 $880 $1040 $1200 $1360
400 mgd $581 $690 $840 $990 $1140 $1290
450 mgd $927 $1100 $1340 $1580 $1820 $2060
450 mgd $944 $1120 $1360 $1600 $1840 $2080
540 mgd $830 $980 $1190 $1400 $1610 $1820
563 mgd $768 $910 $1110 $1310 $1510 $1710
622 mgd $830 $980 $1190 $1400 $1610 $1820
1000 mgd $723 $860 $1050 $1240 $1430 $1620
1250 mgd $845 $1000 $1220 $1440 $1660 $1880
7182019 Basis of Cost Estimates
httpslidepdfcomreaderfullbasis-of-cost-estimates 6467
Detroit Water and Sewerage DepartmentBasis of Cost Estimates
September 2003 63
Table C-15Centrifugation Unit Cost
Capacity 2000 2010 2020 2030 2040 2050
113 mgd $2050 $2430 $2950 $3470 $3990 $4510
14 mgd $2440 $2890 $3510 $4130 $4750 $5370
211 mgd $2930 $3470 $4220 $4970 $5720 $6460
211 mgd $2220 $2630 $3200 $3770 $4340 $4900211 mgd $4160 $4930 $5990 $7050 $8110 $9160
308 mgd $2990 $3550 $4310 $5070 $5830 $6590
308 mgd $3040 $3610 $4390 $5170 $5950 $6720
359 mgd $6200 $7350 $8930 $10510 $12090 $13660
40 mgd $6150 $7290 $8860 $10430 $12000 $13560
45 mgd $4420 $5240 $6370 $7500 $8630 $9750
45 mgd $4500 $5340 $6490 $7640 $8790 $9930
54 mgd $9210 $10920 $13270 $15610 $17960 $20300
563 mgd $10700 $12690 $15420 $18140 $20870 $23580
622 mgd $11900 $14110 $17150 $20180 $23210 $26230
100 mgd $15000 $17790 $21620 $25440 $29260 $33060
125 mgd $17900 $21230 $25800 $30360 $34920 $39460
Table C-16Hauling and Landfilling Unit Cost
Capacity 2000 2010 2020 2030 2040 2050
113 mgd $438 $520 $630 $740 $850 $960
140 mgd $546 $650 $790 $930 $1070 $1210
211 mgd $1060 $1260 $1530 $1800 $2070 $2340
211 mgd $788 $930 $1130 $1330 $1530 $1730
211 mgd $810 $960 $1170 $1380 $1590 $1800
308 mgd $1090 $1290 $1570 $1850 $2130 $2410308 mgd $1100 $1300 $1580 $1860 $2140 $2420
359 mgd $1400 $1660 $2020 $2380 $2740 $3100
400 mgd $1370 $1620 $1970 $2320 $2670 $3020
450 mgd $1530 $1810 $2200 $2590 $2980 $3370
450 mgd $1560 $1850 $2250 $2650 $3050 $3450
540 mgd $2150 $2550 $3100 $3650 $4200 $4750
563 mgd $2030 $2410 $2930 $3450 $3970 $4490
622 mgd $2220 $2630 $3200 $3770 $4340 $4900
1000 mgd $2360 $2800 $3400 $4000 $4600 $5200
1250 mgd $2950 $3500 $4250 $5000 $5750 $6500
7182019 Basis of Cost Estimates
httpslidepdfcomreaderfullbasis-of-cost-estimates 6567
Detroit Water and Sewerage DepartmentBasis of Cost Estimates
September 2003 64
Appendix D
Wastewater Treatment Plant Ongoing Repair andReplacement Cost Estimates
7182019 Basis of Cost Estimates
httpslidepdfcomreaderfullbasis-of-cost-estimates 6667
Detroit Water and Sewerage DepartmentBasis of Cost Estimates
September 2003 65
SUMMARY OF CAPITAL IMPROVEMENT PROJECT COSTS
Explanation of Capital Improvement Costs
NOTE This analysis was provided by the staff of the Detroit Wastewater Partners (DWSDProject PC-744 - Wastewater Treatment Plant Upgrade) and DWSD Wastewater Plant staff Itwas completed in July 2003
General
1 Capital costs are presented by major process and non-process areas The project costsassume a major capital improvement project for the specified life cycle based on recent capitalimprovements performed under PC-744 other recent capital improvement projects (ie PC-740 PC-720 etc) and best engineering judgment The line items listed in each area areintended to provide a basis for the cost estimate to give an understanding of the level of costestimate assumptions used and items includednot included in the cost estimate It is unlikelyand not intended that the major capital projects would include all of the items listed at thespecified cycle Rather it is more likely that the overall cost would be broken into smallerprojects spread across a ~10 year period at the specified cycle
2 The percentages listed below were applied to each of the base construction costs Theseare similar to the percentages used in the Wastewater Master Plan (see Master Plan TechnicalMemo Basis of Cost Estimates dated August 15 2003)
- 30 Contingency (for miscellaneous items not included in the general cost estimate)
- 25 Contractor Overhead and Profit and General Conditions
- 20 Engineering Legal Administration and Management
3 Capital costs presented assume continued use of the existing processes in place at the
WWTP It does not assume major changes to the treatment process such as a new form ofprimary treatment or biological treatment The costs also do not include potentially newprocesses that may be required for regulatory or other reasons such as filtration of thesecondary effluent sludge digestion or major change to the type of effluent disinfection
4 Capital costs presented for each process area do not include maintenance related costs forroutine maintenance between the major capital improvement cycles It is assumed thatmaintenance activities will be performed on the equipment at the required frequencies tomaintain the equipment in good worknig order between major rehabilitation or replacementprojects
Link to Complete Spreadsheets is found on the Wastewater Master Plan
CD DWP Est of Capital Improvements for WWTP - 50-yrxls
7182019 Basis of Cost Estimates
httpslidepdfcomreaderfullbasis-of-cost-estimates 6767
Detroit Water and Sewerage DepartmentBasis of Cost Estimates
Table D1
SUMMARY OF CAPITAL IMPROVEMENT PROJECT COSTS
Area Life Cycle Start of Cycle 2003 Costs ($M)PROCESS RELATED
Pump Station No 1 20 2025 $ 63Pump Station No 2 20 2006 $ 66
Chemical Addition 20 2023 $ 9Rectangular Primary Clarifiers 20 2013 $ 86Circular Primary Clarifiers 20 2025 $ 84ILP Nos 1 2 3 4 7 20 2025 $ 29
Aeration Basins 20 2025 $ 55Cryo Plants 10 2015 $ 1Secondary Clarifiers 20 2020 $ 140SFE Pump Station 20 2010 $ 13
Chlorination 20 2022 $ 16
Dechlorination 20 2023 $ 12Hydraulic Structures 20 2020 $ 7Complex A and B 20 2025 $ 32
C-I Dewatering 15 2020 $ 31C-II Lower Level Dewatering 15 2019 $ 35C-II Upper Level Dewatering 15 2015 $ 42
C-I and C-II Incineration 15 2009 $ 139Sludge Offloading 20 2025 $ 19NON-PROCESS RELATED
AdminRagland Buildings 20 2025 $ 10Plant Security 10 2015 $ 10Plant-wide Paving 15 2020 $ 6Parking Structure 20 2025 $ 7Work Environment Improvements 10 2015 $ 5
Rehab of OampM Bldgs Warehouses 20 2007 $ 40Plant-wide Instrumentation 15 2020 $ 100General Electrical 20 2045 $ 29Plant-wide Secondary Water 15 2025 $ 6
Plant-wide Steam System 15 2023 $ 6Plant-wide Potable Water 15 2010 $ 2Plant -wide Drainage 15 2010 $ 2
Fire Protection Improvements 20 2006 $ 4Plant-Wide JOCs As-Needed Eng 1 2005 $ 3
Total $ 1107
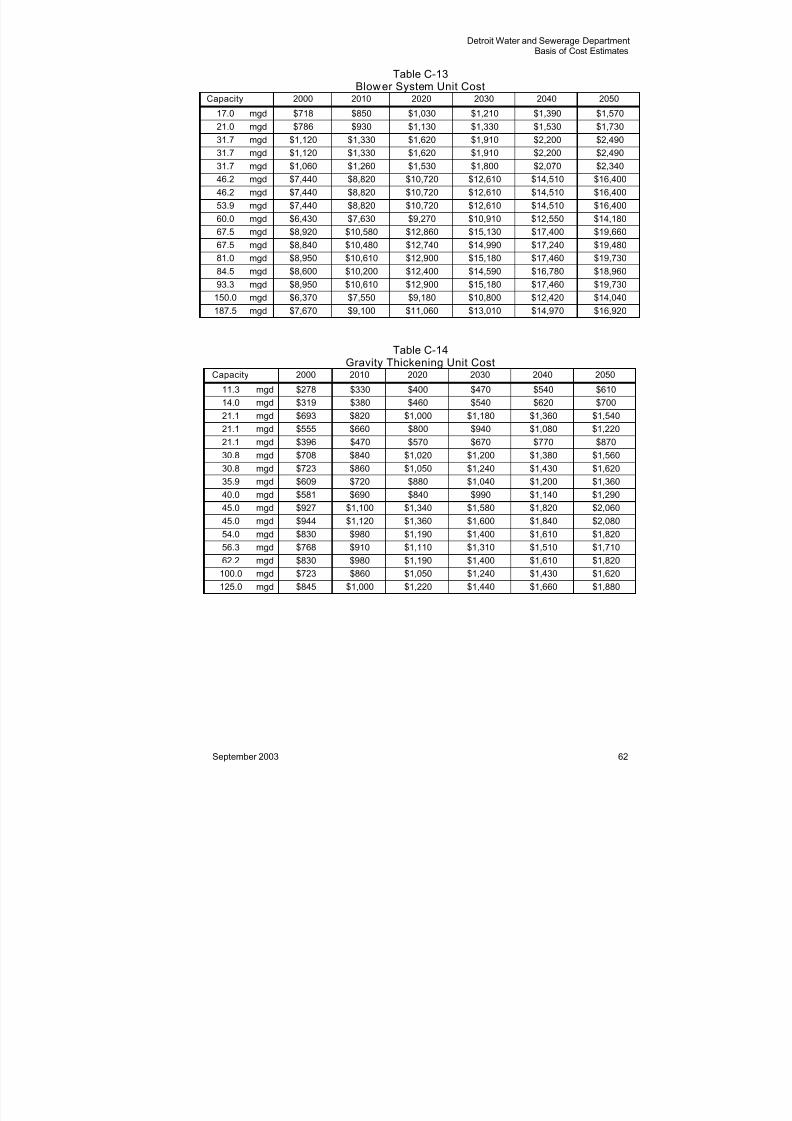
7182019 Basis of Cost Estimates
httpslidepdfcomreaderfullbasis-of-cost-estimates 6767
Detroit Water and Sewerage DepartmentBasis of Cost Estimates
Table D1
SUMMARY OF CAPITAL IMPROVEMENT PROJECT COSTS
Area Life Cycle Start of Cycle 2003 Costs ($M)PROCESS RELATED
Pump Station No 1 20 2025 $ 63Pump Station No 2 20 2006 $ 66
Chemical Addition 20 2023 $ 9Rectangular Primary Clarifiers 20 2013 $ 86Circular Primary Clarifiers 20 2025 $ 84ILP Nos 1 2 3 4 7 20 2025 $ 29
Aeration Basins 20 2025 $ 55Cryo Plants 10 2015 $ 1Secondary Clarifiers 20 2020 $ 140SFE Pump Station 20 2010 $ 13
Chlorination 20 2022 $ 16
Dechlorination 20 2023 $ 12Hydraulic Structures 20 2020 $ 7Complex A and B 20 2025 $ 32
C-I Dewatering 15 2020 $ 31C-II Lower Level Dewatering 15 2019 $ 35C-II Upper Level Dewatering 15 2015 $ 42
C-I and C-II Incineration 15 2009 $ 139Sludge Offloading 20 2025 $ 19NON-PROCESS RELATED
AdminRagland Buildings 20 2025 $ 10Plant Security 10 2015 $ 10Plant-wide Paving 15 2020 $ 6Parking Structure 20 2025 $ 7Work Environment Improvements 10 2015 $ 5
Rehab of OampM Bldgs Warehouses 20 2007 $ 40Plant-wide Instrumentation 15 2020 $ 100General Electrical 20 2045 $ 29Plant-wide Secondary Water 15 2025 $ 6
Plant-wide Steam System 15 2023 $ 6Plant-wide Potable Water 15 2010 $ 2Plant -wide Drainage 15 2010 $ 2
Fire Protection Improvements 20 2006 $ 4Plant-Wide JOCs As-Needed Eng 1 2005 $ 3
Total $ 1107