batch coffee roasting; roasting energy use; reducing that use
TRANSCRIPT

Batch coffee roasting; roasting energy use; reducing that use Henry Schwartzberg
Food Science Dept., Univ. of Massachusetts, Amherst, Mass. United States ([email protected])
ABSTRACT
This paper deals with: a) batch roasting of coffee beans, b) energy use for such roasting, and c) means for reducing such use. Overall heat and material balances are used to analyze: roaster energy consumption for batch, gas-fired roasters with afterburners; and the feasibility of methods for reducing such consumption. Coffee Roasting; Afterburning; Flame Temperature; Volatile Organic Compounds; Stack gas heat recovery INTRODUCTION 6.7 billion kg of coffee beans are roasted worldwide annually, mostly in batch roasters. Near the end of roasts, roasting coffee emits volatile organic compounds (VOC) and CO, which in many industrialized countries have to be oxidized in afterburners. Roasting and afterburning uses roughly 11.2x10¹² kJ fuel energy/year and causes emission of roughly 7.0x10⁸ kg CO2/year. This paper aims to help readers understand coffee roasting with afterburning and factors determining energy use for such roasting, and presents and evaluates ways to reduce such use.
Figure 1 Components, flow layout and stream masses and temperatures for a gas-fired batch coffee roaster where roaster gas recirculates and which is equipped with an afterburner.

Fig. 1 depicts basic components and stream mass flows and temperatures for a gas-fired batch roaster with afterburner. Stream temperatures, e.g. TGI, the temperature of gas entering the roasting chamber, (chamber for short) are enclosed in parentheses in Fig.1, but not in the text of this paper. Most temperatures vary during roasting, e.g. bean temperature, TB, and TGO, the temperature of gas leaving the roasting chamber, increase progressively. Other stream temperatures may remain constant, e.g. TAB, the temperature at which afterburning occurs, preferably should be automatically kept constant. Mean-effective stream temperatures will sometimes be used later in enthalpy balances. The mass flows, shown in italics, are the total mass of a stream that enters or leaves a roaster component during a roast. Stream flow rates vary during roasts, but total stream masses will be used later for mass and enthalpy balances. The term “gas”, by itself, will be taken to mean air partly depleted in oxygen and containing CO2 and H2O produced by combustion of fuel gas (e.g. natural gas) plus H2O, CO2, VOC and CO emitted by roasting coffee. Mass (G – FR) of gas is heated from TGO to TGI by mixing it in the furnace with mass FR of burner gas (whose temperature is TF). The blower draws the mixture into the chamber, where it contacts and transfers heat to the batch of coffee beans.
Chamber Gas-Inlet Temperature:
TGI usually ranges from 235ºC to 535ºC, but TGI as low as 220ºC [1] and as high as 650ºC [2] have been used. Prolonged use of TGI > 535ºC tends to cause bean tips and edges to burn. The heat capacity of burner gas and roaster gas are roughly equal. Therefore, based on an enthalpy balance around the furnace:
TGI = TGO +′ F R
G'(TF − TGO ) (13
F’R is the burner-gas mass-inflow rate in the furnace and G’ the mass flow rate of gas into the chamber. In some roasters, F’R undergoes one of two step- decreases at late stages of roasting, but remains constant, albeit at a different level, before and after a step. If so, TGI progressively increases while F’R remains constant (because G’ decreases progressively as roasting proceeds), but decreases a step each time F’R decreases. In other more-modern roasters, F’R is automatically adjusted so as to keep TGI constant, or to control how TGI varies during a roast. TF is determined by the combustion-air/fuel-gas ratio used. Since that ratio is automatically kept constant, TF remains constant.
Green Bean Load: The total weight of a batch of green coffee bean is R. Its initial temperature is TBO. Its dry weight is RD; and the weight of bean moisture is RDX0. About 75% of beans used in commerce are of Arabica varieties (e.g. Columbians, Santos, Costa Ricans, Kenyans, etc.) and about 25% are of Robusta varieties (e.g. beans from Viet-Nam, Uganda, Ivory Coast). Robustas are of lower quality, but are less costly. With minor exceptions, beans are roughly hemi-ellipsoidal and have a groove on their flatter surface. Green bean lots are graded in size to prevent uneven roasting. Arabica beans in the large-size range are roughly 10.3 mm long, 7.3 mm wide and 4 mm high. In the smallest commercial-size range, Arabica bean dimensions are roughly three quarters as large. Length/width ratios for Robustas are smaller than for Arabicas. 120 kg green beans, a typical load for a medium-size batch roaster, contains roughly 700,000 large beans, or, if the smallest commercial size is used, roughly 1,570,00 beans. Batches for very large roasters are four times as large.
Roasting Induced Changes:
Chamber elements or pneumatic transport continually mix freshly heated beans with the rest of the batch, thereby improving bean-to-bean uniformity of heating. As bean temperature, TB, rises; moisture vaporizes within beans and diffuses out of them, but not fast enough to prevent steam pressure build up inside the cells in beans. The beans soften; and the internal steam pressure causes them to expand [3]. As the beans expand, they release parchment (chaff) previously covering beans or trapped in the groove in beans. RDS indicates the mass of chaff released. Moisture loss ultimately causes beans to harden [3], setting the expansion.
Thermally stimulated roasting reactions inside bean cells and in their walls produce over eight-hundred identified reaction products and a wide variety of intermediate compounds. A small fraction of the products have very desirable flavors and aromas prized by consumers in roasted coffee. Pigmented reaction products cause bean color, originally light green or tan, to turn brown and progressively darken [4,5]. The reactions also cause beans to lose dry matter in the form of reaction-generated water vapor, CO2, [3,5,6] CO [6,7] and volatile organic compounds (VOC) [6,8]. RDP indicates the total mass of dry matter mass lost, including chaff. Virtually all of the bean’s initial moisture content probably evaporates by the time the beans reach their end-of-roast temperature, TBF. If so, the moisture in roasted beans consists of reaction-formed water that has not yet evaporated plus absorbed quench water; and the mass of beans at the end of the roast, but prior to quenching, = RD(1 – P). Static pressures are kept negative in most roasting chambers to prevent escape of
gas, vapor and smoke. Therefore fresh air leaks into the chamber. A indicates the total mass of fresh air that leaks into the chamber during a roast.
Gas Temperature Changes: Since the gas transfers heat to beans, it leaves the chamber at temperature TGO, which is substantially lower than inlet temperature, TGI. The leaving gas contains in-leaked air, entrained chaff, evaporated bean moisture and gas and vapor produced by dry matter breakdown. Thus, its total mass = G + A + RD(X0 + P), while the total entering mass = G. The leaving gas then passes through the blower and the cyclone, which removes entrained chaff, i.e. mass RDS. Then the gas splits into two streams: a larger one, which passes through the furnace and recycles to the chamber; and a smaller one, which passes through the afterburner.
VOC Oxidation - Afterburners: In the afterburner, the gas is heated to TAB by admixing a second stream of burner gas (mass FAB at temperature TF). If TAB is high enough and gas-residence time in the afterburner is adequately long, enough VOC will oxidize to yield stack gas containing less than 50 ppm VOC, i.e. a VOC level that satisfies German regulations. VOC are also partially destroyed when roaster gas passes through the roaster furnace. Therefore, even without afterburning, stack VOC levels can be as low as 300 ppm when all chamber-discharge gas passes through the furnace [9]. When all chamber-discharge gas does not pass through the furnace and afterburning is not used, VOC levels in stack gas typically are roughly 1,650 ppm [9] and increase markedly as TBF increases [6]. Catalytic afterburners for coffee roasters require TAB ≥ 400ºC and 0.05 s to 0.1 s of gas residence time. The catalyst has to be replaced every three or four years, and should be used with a pre-filter to prevent particulate matter from blinding it. A supplementary blower is often required to overcome pressure drop across the catalyst bed and pre-filter. Thermal afterburners are cheaper, but require TAB ≥ 760ºC and 0.4 s of gas residence time when used for coffee roasters. VOC levels in feeds for thermal and catalytic afterburner should be less than 25% of their lower explosive limit (L.E.L.). L.E.L typically range from around 10,000 to 30,000 ppm. Peak VOC levels as high as 10,000 ppm [10], i.e. potentially explosive levels, have been reported (very likely for the end of a very dark roast). Regenerative thermal oxidizers (RTO) use regenerative heat exchange to heat afterburner feeds from TGO to appropriate TAB and then cool discharged gas almost to TGO. Thus they require little or no heat input after start-up [11]. RTO should only be used for feed VOC levels less than 10% of their L.E.L. RTO also require frequent switching of flow direction through the regenerator bed or beds and, at present, rarely are used for coffee roasters.
NOX and CO: Nitrogen oxides (NOX) are generated in roaster furnace burners and in the burners used for VOC oxidizers. The higher the burner temperature the greater the NOX level. Thus afterburning reduces VOC levels, but produces NOX. NOX emission levels for coffee roasters are higher for darker roasts [11], i.e. roasts where large amounts of VOC are produced. NOX levels can be reduced roughly 50% by use of low NOX burners, i.e. burners where combustion products recycle into the combustion zone. Because little heat production is needed to operate RTO, less NOX would be emitted if they were used [11]. EU regulations limit NOX emission to 100 mg/N m3. New catalyst formulations can reduce NOX levels to 50 ppm (≈ 52 mg/N m3).
Many intermediates, including CO are produced as VOC oxidize. EU regulations limit CO emission levels to 100 mg/N m3. CO is emitted by roasting beans; and even more CO can be produced by improperly adjusted burners, partial oxidation of VOC in roaster furnaces or by incomplete oxidation of VOC in afterburners, e.g. due to: loss of catalyst activity, insufficient residence time, channelling, or TAB being too low.
Gas Input and Output: Gas mass holdup variation in the roaster system is negligible. Therefore the total gas mass leaving the system via the stack equals the sum of the total mass of entering gas and the total mass of gas and vapor emitted by beans, i.e. = F + A + RD(X0 + P – S), where F = FR + FAB. Similar mass balances apply for gas stream masses at intermediate points along the gas-flow path.
R Roasters: The flow layout in Fig. 1 is for an R roaster, i.e. a roaster where most gas leaving the chamber recycles to the chamber. R roasters usually are used for roasting large and medium sized batches, i.e. batches > 60 kg. In many older R roasters, chamber-discharge gas heats to TGI in the furnace before splitting into a recycle stream and afterburner feed, which is not heated further when TGI > TAB. Catalytic afterburners usually are used with R roasters [11]. Component sequences for some R roasters may differ from the sequence shown in Fig. 1 [12]; e.g. the cyclone may come before the blower; or an added blower or blowers may be used to
overcome high local pressure drops. In Neohaus Neotec RFB roasters, high-speed gas flow causes spouting-induced bean circulation in the chamber [12]; a blower located just before the chamber provides the needed gas pressure; and static pressures are positive in the chamber, which is well sealed. Then A = 0. Air in-leakage is further minimized by having furnace-discharge gas bypass the chamber during the loading and unloading of beans. A is positive for roughly 90% of roasters.
SP Roasters: In single-pass (SP) roasters gas passes through the roaster only once. SP roasters usually are used for small batch roasts, where R < 60 kg and sometimes is as small as 2.5 kg. In many SP roasters, fresh air, drawn in by the blower, mixes with flames from a set of lance burners. Then the mixed gas flows through the roasting chamber, blower, cyclone and afterburner. Towards the end of a roast, first one burner and then another is turned off, thereby reducing F’R and TGI in steps. Other SP roasters are equipped with a furnace with a single continuously adjustable burner, where F’R can be smoothly changed. The furnace output gas flows directly through the roasting chamber, blower, cyclone and afterburner. Thermal afterburners usually are used for small roasters [11].
Ending Roasts – Bean Cooling: The outcome of coffee roasting reactions depends on initial reactant concentrations, which, in turn, depends on bean variety and source; and on how TB varies with time, t, i.e. the “TB profile”. In industrial roasters, bean temperatures are measured with sturdy sheathed probes, which provide measured temperatures, i.e. TBM, instead of TB [13]. Often, roasts are ended when TBM reaches a set value that corresponds to TBF. Coffee flavor and aroma development will be inadequate if TBF is less than 190ºC. In most R roasters, a controlled volume of quench water is sprayed on the beans when the end-of-roast TBM is reached. Most of the water evaporates, thereby cooling the beans rapidly and stopping the roast. In most cases, the beans then discharge into the cooling tray. There, the beans form a 0.075- to 0.1-m. deep bed, which is stirred and through which room- temperature air is drawn, further cooling the beans. Often, beans at the air-outflow side of the cooler bed still remain quite hot when those at the inflow side already are cool. Strongly agitated air-based coolers that provide good bean mixing and more uniform bean cooling are used with some R roasters. In some of these coolers, beans are quenched while being air cooled, thereby increasing the time available for roasting. Air cooing alone, without quenching, usually is used for small roasters. Beans continue to emit VOC during early stages of air-cooling. Thus, air that has been used to cool beans sometimes has to be subjected to afterburning, which can use large amounts of energy.
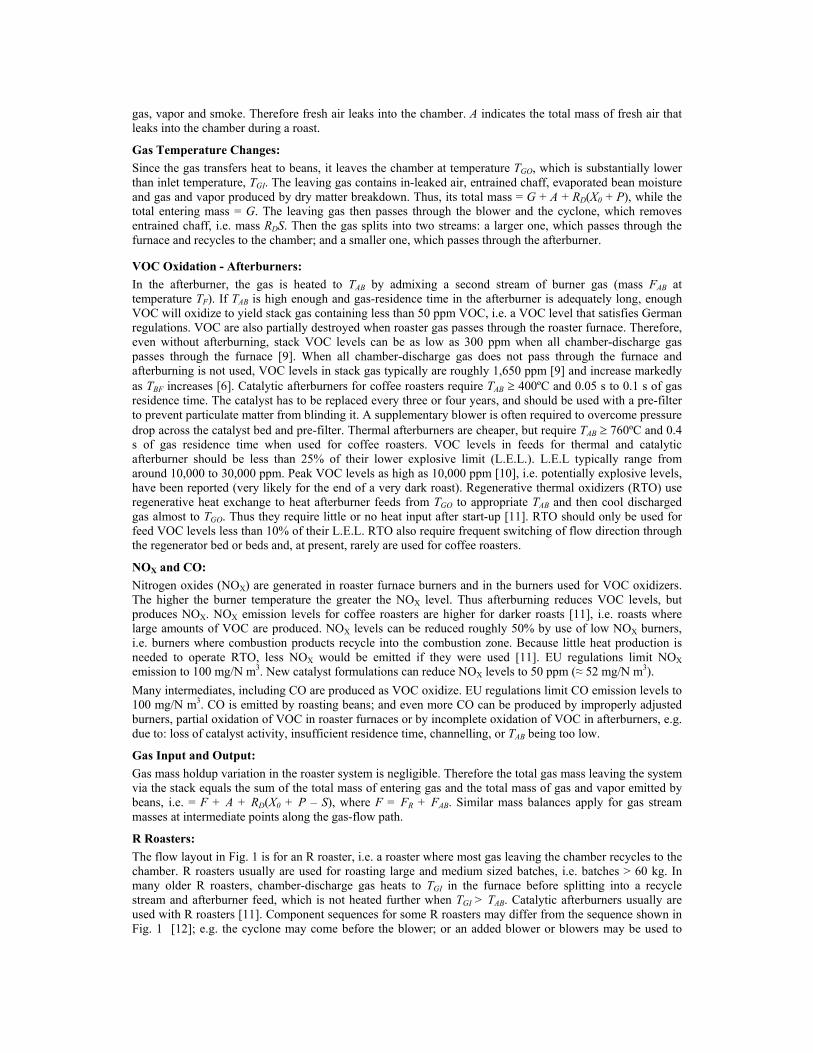
Figure 2 Actual and measured bean temperature profiles for a regular roast and degrees of roast darkness and total roasting loss for different TBF. Agtron and C.I.E. L* reflectance-based roast colors for those TBF.
Thermometric Lag:
Fig. 2 shows corresponding TB and two TBM profiles obtained with probes of different diameter during a “regular” roast where the possible roast time, tR, ranged from 480 to 720 s. Roast times for “regular” roasts can range up to 900 s, or even to 1,200 s for some roasters. Roasting beans closely surrounded the probes, thereby preventing hot gas flow from directly affecting TBM. When probes are heated by hot gas as well as by beans, TBM may always lie above TB [13]. TBM are initially much higher than TB because roasting chambers and probes are preheated before bean loading begins. Immediately after beans are added, TBM falls towards TB, which is rising. Then, for properly positioned probes, TBM falls below TB, but starts rising, and thereafter always stays below TB. Thermometric lag increases with probe size. Therefore, after TBM starts rising, it lies farther below TB for larger diameter probes than for the smaller ones [13]. (TB - TBM) tends to be proportional to dTB/dt [13] and, as just noted, is larger for large probes than small ones. Therefore it is difficult to correctly compare TBM profiles and TBF from one roaster with those from another, particularly roasters of different design, or with different probe arrangements, and to correctly compare TBF for fast and slow industrial roasts. Researchers at ETH Zurich [3,5,14] obtained highly useful TB data for fluidized bed roasts by implanting very fine thermocouples in coffee beans. Researchers at the Univ. of Hamburg-Harburg [15] found large TB gradients within beans when dTB/dt was large. Schwartzberg [13] developed methods for calculating TB profiles and TBF from properly measured TBM profiles and also showed that for individual roasters control of properly measured TBM profiles would also control TB profiles. TBM profiles often are roughly adjusted at late stages of roasting by one or two step reductions in F’R (and hence step decreases in TGI) or by step decreases in the chamber-inlet gas-flow rate, G’. Advanced control systems, first developed by Eichner in the mid 1990s, now continuously regulate TGI and G’ for some roasters, and use TBM–based feedback control to consistently provide TBM profiles that conform to “learned” profiles that yielded desirable roasted coffee. Roast Color and Total Roasting Loss: Points A through I on curve TB in fig. 2 indicate a series of increasing TBF and corresponding increasing degrees of roast darkness. The darkness descriptors, Agtron roast colors and total-roasting-loss values listed in the inset are data by Mondry [4]. The TBF for points A through I were obtained by roughly correcting Mondry’s TBM values for thermometric lag. A indicates a very light roast, E a medium roast, H a very dark roast and I over-roasting, i.e. nearly black beans. Agtron coIors are instrumentally measured and based on reflectance of narrow-spectrum near I-R light from ground roasted beans [4], and are used by specialty roasters to characterize degree of roast. Other near I-R based roast-color meters are used in industry [4]. C.I.E. L* roast colors are based on reflectance of broad-spectrum visible light, and have been used in academic research on roasting [3,5,14]. The listed L* values are rough estimates based on measured L* values [5] for coffee bought from Swiss retailers. Hunter L roast colors are also based on reflectance of broad-spectrum visible light, are used by Folgers, the largest U.S. roaster of coffee, and are often listed in process descriptions in patents obtained by that company. In the end-of-roast color range, L values are roughly 74% as great as L* values. Bean darkness increases, roast color decreases and coffee flavor character progressively changes as tR and TBF increase. Very darkly roasted beans also tend to be oilier or become oily after roasting [3], and do not store as well as lighter roasted beans.
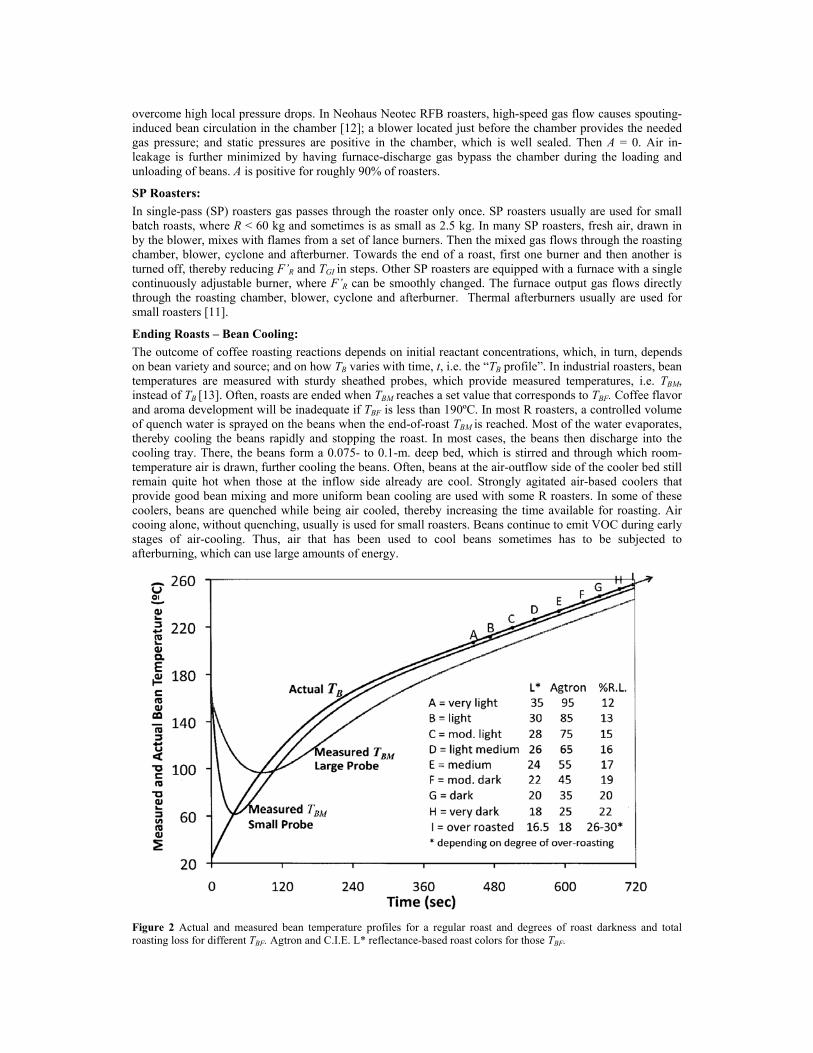
Figure 3 Cumulative mass loss of gas and vapor products emitted from beans due dry matter breakdown versus TB. The total cumulative mass of all such products is (P – S).
Dry-Matter-Based Emissions: Fig. 3 shows how: (P – S), the total cumulative mass of emitted gas and vapor products of dry matter breakdown, and the cumulative masses of emitted individual breakdown product components, i.e. reaction-formed H2O vapor, CO2, CO and VOC, increase as TB increases. Total roasting loss increases as X0 and chaff loss increases. Therefore, (P – S) values were estimated by subtracting an estimated initial as-is bean moisture content of 0.1 and an estimated as-is chaff loss of 0.01 from Mondry’s as-is total-roasting-loss values for points A through I. Irregularities in the calculated (P – S) versus TB curve were smoothed in drawing the (P – S) curve in Fig. 3. Total roasting losses are up to 1.2% greater for Robusta beans and up to 0.3% greater for Santos beans than for Columbian beans [6]. Data from Geiger [3] (used to help plot the CO2 and reaction H2O curves) showed that: a) the main dry matter breakdown products are water vapor (roughly 70% initially), then CO2, with the CO2/H2O ratio increasing with degree of roast; b) reaction-water emission can start at TB ≈ 160ºC; c) CO2 emission starts around 190ºC; and d) both emission rates increase very rapidly thereafter as TB rises. The CO curve was qualitatively based on: data from Valdovinos-Tijerino [7], which showed CO emission starting when TB ≈ 220ºC, then rising quite rapidly to very high levels when TB = 240ºC; and data from Jansen [6] indicating cumulative CO emission for Columbian beans = 0.001R for a medium roast. For Robustas, the corresponding CO loss is 0.0022R [6].
VOC-Emission Curve: The VOC curve is qualitatively based on mass spectrometric data from Dorfner [8] showing VOC-emission rates during a light-medium roast (i.e. like point D in Fig 2) in a 250 kg capacity roaster where convective heating of beans predominated, and on a VOC loss of 0.0034R for medium-roast Columbian beans from Jansen [6]. Robustas emit more VOC, e.g. 0.004R for a medium roast [6]. In the cited test by Dorfner, VOC emission was small during roughly the first 80% of the roast, and rose rapidly thereafter. The roast time, tR was 613 s; and the total as-is roast loss 16.3%, which roughly corresponds to (P – S) = 0.059 if X0 = 0.111 and S = 0.011. However, VOC were emitted 200 to 300 s into a 900 s roast in a conductively heated 0.1 kg sample roaster [8]. VOC were also emitted early when Dutra et al. [16] conductively roasted beans. Very likely, bean hot spots occur when conductive heating is used. Emission also started around 200 s to 300 s in a 1000 s roast in a 15 kg capacity SP roaster that was strongly preheated (TBM initially = 236ºC) [8]. It appears that conductive heating, local hot spots in beans and a high degree of preheating favor early VOC emission. Dutra et al. [16] found that VOC were acidic and that their acidity tended to increase almost until the very end of their test roast. Jansen [6] noted that acetic acid is a major VOC constituent.
Aroma and Flavor Development: Baggenstoss [14], Schenker [5], and Gianturco [17], each using different means, measured how in-bean concentrations of different important aroma and flavor compounds varied during roasting. For most of these compounds, these variations followed one of three patterns. In two of these patterns, concentrations rose, peaked and then declined. In one of these two patterns, the peaks occurred at light to medium roast colors, e.g. between points B and E for the Fig. 2 TB profile. In the other of these two, the peaks occurred at darker colors, e.g. between E and G. The declines in aroma concentrations within beans probably are caused by a combination of: 1) loss of aroma as VOC, 2) formation of complexes between aroma compounds and melanoidins (the dark-colored matter in roasted beans), and 3) reactive destruction of aromas. Concentrations of compounds following the third pattern rose progressively without declining as bean color became very dark, e.g. beyond point G. in Fig. 2. Compounds following the first two patterns impart important coffee flavor and aroma attributes valued by those who prefer light or medium roasts. Among compounds that follow the third pattern, e.g. 2-furfurylthiol, pyridine, cyclopentanone, guaiacol, phenol, and various pyrroles, [5,14] are some that impart the burnt, bitter and roasty notes favored by those that prefer dark roasted coffee.
Roasted coffee’s character depends more on the TB profile used for roasting than on roast color. Schenker [5] and Baggenstoss [14] used different TB profiles (measured with fine thermocouples implanted in beans) to roast identical green coffees to the same roast color. The aroma concentration profiles for the roasted coffees differed when the TB profile differed, even though their L* roast colors were the same. For fluidized bed roasts with the same roast color: TBF = 245ºC when tR =180 s, 230ºC when tR =300 s, and 212ºC when tR =720 s [3,5], i.e. faster roasts require higher TBF. For roasts with roughly equal tR, higher TBF (by roughly 5ºC) provided the same roast color when TB initially rose slowly than when TB initially rose very rapidly [3].
Heat transfer in roasting chambers: A prime symbol (′) added to stream symbols indicates stream mass flow rates or rates of change with time. Thus G′ indicates the gas mass flow rate entering the chamber, F′R, the rate of furnace-burner gas output, and
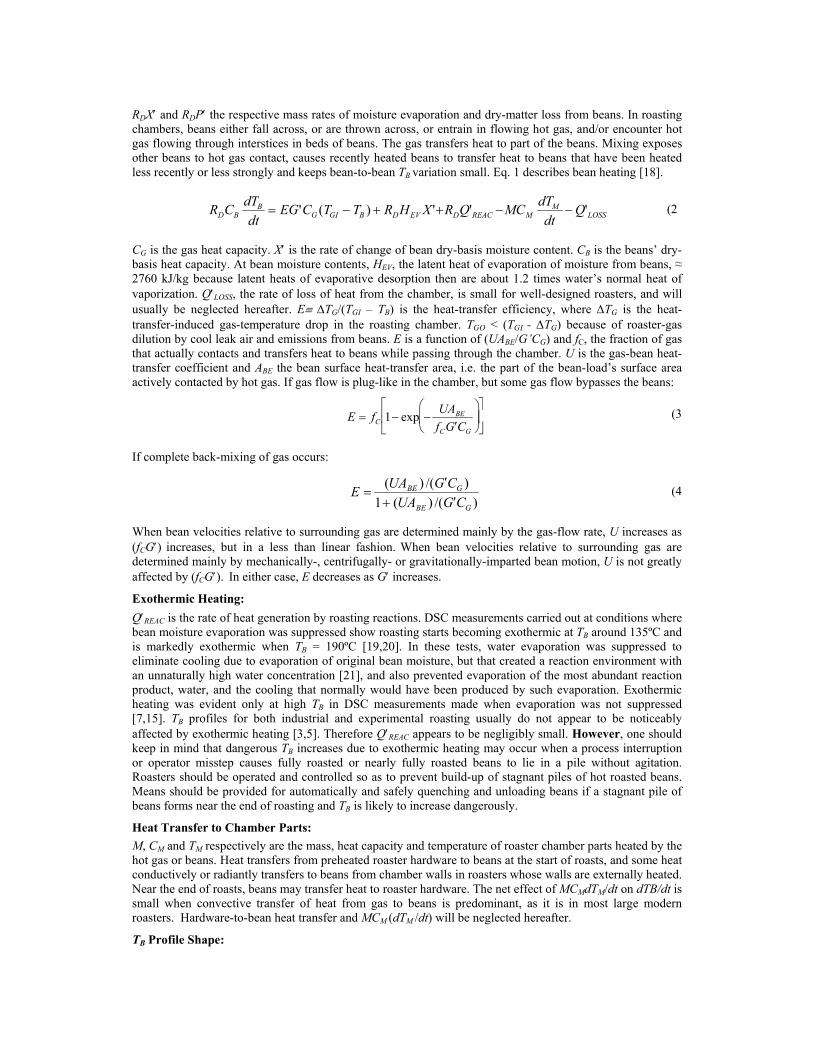
RDX′ and RDP′ the respective mass rates of moisture evaporation and dry-matter loss from beans. In roasting chambers, beans either fall across, or are thrown across, or entrain in flowing hot gas, and/or encounter hot gas flowing through interstices in beds of beans. The gas transfers heat to part of the beans. Mixing exposes other beans to hot gas contact, causes recently heated beans to transfer heat to beans that have been heated less recently or less strongly and keeps bean-to-bean TB variation small. Eq. 1 describes bean heating [18].
RDCBdTB
dt= EG'CG (TGI − TB ) + RDHEV X '+RDQ'REAC −MCM
dTM
dt− Q'LOSS (2
CG is the gas heat capacity. X′ is the rate of change of bean dry-basis moisture content. CB is the beans’ dry- basis heat capacity. At bean moisture contents, HEV, the latent heat of evaporation of moisture from beans, ≈ 2760 kJ/kg because latent heats of evaporative desorption then are about 1.2 times water’s normal heat of vaporization. Q′LOSS, the rate of loss of heat from the chamber, is small for well-designed roasters, and will usually be neglected hereafter. E≡ ∆TG/(TGI – TB) is the heat-transfer efficiency, where ∆TG is the heat-transfer-induced gas-temperature drop in the roasting chamber. TGO < (TGI - ∆TG) because of roaster-gas dilution by cool leak air and emissions from beans. E is a function of (UABE/G’CG) and fC, the fraction of gas that actually contacts and transfers heat to beans while passing through the chamber. U is the gas-bean heat-transfer coefficient and ABE the bean surface heat-transfer area, i.e. the part of the bean-load’s surface area actively contacted by hot gas. If gas flow is plug-like in the chamber, but some gas flow bypasses the beans:
E = fC 1− exp −UABE
fC ′ G CG
(3
If complete back-mixing of gas occurs:
E =(UABE ) /( ′ G CG )
1+ (UABE ) /( ′ G CG ) (4
When bean velocities relative to surrounding gas are determined mainly by the gas-flow rate, U increases as (fCG′) increases, but in a less than linear fashion. When bean velocities relative to surrounding gas are determined mainly by mechanically-, centrifugally- or gravitationally-imparted bean motion, U is not greatly affected by (fCG′). In either case, E decreases as G′ increases.
Exothermic Heating: Q′REAC is the rate of heat generation by roasting reactions. DSC measurements carried out at conditions where bean moisture evaporation was suppressed show roasting starts becoming exothermic at TB around 135ºC and is markedly exothermic when TB = 190ºC [19,20]. In these tests, water evaporation was suppressed to eliminate cooling due to evaporation of original bean moisture, but that created a reaction environment with an unnaturally high water concentration [21], and also prevented evaporation of the most abundant reaction product, water, and the cooling that normally would have been produced by such evaporation. Exothermic heating was evident only at high TB in DSC measurements made when evaporation was not suppressed [7,15]. TB profiles for both industrial and experimental roasting usually do not appear to be noticeably affected by exothermic heating [3,5]. Therefore Q′REAC appears to be negligibly small. However, one should keep in mind that dangerous TB increases due to exothermic heating may occur when a process interruption or operator misstep causes fully roasted or nearly fully roasted beans to lie in a pile without agitation. Roasters should be operated and controlled so as to prevent build-up of stagnant piles of hot roasted beans. Means should be provided for automatically and safely quenching and unloading beans if a stagnant pile of beans forms near the end of roasting and TB is likely to increase dangerously.
Heat Transfer to Chamber Parts: M, CM and TM respectively are the mass, heat capacity and temperature of roaster chamber parts heated by the hot gas or beans. Heat transfers from preheated roaster hardware to beans at the start of roasts, and some heat conductively or radiantly transfers to beans from chamber walls in roasters whose walls are externally heated. Near the end of roasts, beans may transfer heat to roaster hardware. The net effect of MCMdTM/dt on dTB/dt is small when convective transfer of heat from gas to beans is predominant, as it is in most large modern roasters. Hardware-to-bean heat transfer and MCM (dTM /dt) will be neglected hereafter.
TB Profile Shape:

The main factors affecting dTB/dt are G′, E, (TGI - TB) and X′. dTB/dt progressively decreases as roasting proceeds because (TGI - TB) progressively decreases as TB rises. dTB/dt decreases to a greater extent for roasts where TGI is small than for roasts where TGI is large. TGI was 455ºC for the roast whose TB profile was depicted in Fig. 2. There, the profile flattened toward the end of the roast. When lower TGI (e.g. 290ºC) are used, TB profiles for industrial roasts remain upwardly concave till the roast’s end. Evaporative cooling depresses dTB/dt markedly when (-X′) is large. Schenker [4] showed that the TB profile is significantly lower for large X0 than for small X0. Gas mass flow through the blower usually is proportional to gas density at TGO, i.e. inversely proportional to TGO in degrees Kelvin. TGO progressively rises as TB rises. Thus gas density and G′ tend to progressively decrease as roasting proceeds [22]; and the decrease in G′ contributes to the dTB/dt decrease. Roasting-induced increases in CB and RD reductions due to dry-matter loss also affect dTB/dt. F′R, F′AB and energy-use rates are greatest near the start of roasting when dTB/dt is largest, and are much smaller near the end of roasting, when VOC and CO output rates are largest, but both dTB/dt and -X’ are small. Roast Time: Integration of Eq. 1 with small terms eliminated yields the following approximation for roast time, tR, in seconds when variables in kg, kJ and ºC units are used:
tR ≈R DC B
EG 'CG
ln T GI − TBO
T GI − TBF
+
HEV X 0
C B (T GI − T B )
≈
0.51R DEG '
ln T GI − TBO
T GI − TBF
+
1250 X 0
(T GI −160)
(5
High-Speed Roasting: The terms with bars over them are mean effective values. Increasing G′/R and/or TGI reduces tR. If G′/R and/or TGI are increased enough, tR will be < 300 s and the roast will be a “high-speed” roast. High-speed roasting is used to produce roasted coffees with bulk densities up to 34% lower than regular roast coffee [23] and which contain more available soluble matter [1,24,25], more sucrose [25], more 3-caffeolquinic acid [25], more aroma [25], and more residual water [9,24]. The soluble-matter increase has been attributed to hydrolytic breakdown of polymeric cell wall carbohydrates [26], most likely arabinogalactans. Roasting times as small as 60 s [25] or even 47 s [26] have been used, and a tR of 35 s has been cited in one patent [24]. Nowadays, use of tR < 180 s is uncommon. High-speed roasting usually is obtained by increasing G′; but reductions in R have also been used; or have been combined with moderate increases in G′ and higher TGI [2]. G′ can only be increased to levels that will not cause beans to be pneumatically conveyed out of the roasting chamber. Therefore high speed roasting usually is carried out either in newer kinds of batch roasters, e.g. spouted-bed roasters (Neuhaus Neotec RFB roasters) [12], rotating-scoop roasters (Gothot Rapido-Nova roasters or Probat RT roasters) [12] or modified rotating-bowl roasters (i.e. Probat RZ-SY roasters) [12], that accommodate or need to use high G′, or in continuous roasters where hot gas issuing from a large number of jets impinges on a moving bed of beans (Probat Cont-Roasters or Wolverine Jet Roasters) [12,24,27]. G′/R can be more than 33 times as great for high-speed roasting as for regular roasting.
G = G′(tR), and therefore is inversely proportional to E. Since E decreases as G′ increases, G/R is much greater for high-speed roasts than for regular roasts. G/R for regular roasts ranges from 0.9 to 3.3, but for high-speed roasts G/R can be > 10. Therefore blower energy use per kg bean feed is very much greater for high-speed roasting than for regular roasting. Fluidized bed roasting was once used for high-speed roasting; but sometimes involved use of G/R as great as 60 [26]. This required very large use of energy to run blowers.
MATERIALS & METHODS
Mass Balance: Overall mass balances were based on the mass flows shown in Fig. 1. Masses: F, A and R = RD(1 + X0), enter the roaster. RDS leaves it as chaff, and [F + A + RD(X0 + P - S)] leaves it as stack gas. The mass of roasted beans remaining in the chamber at the end of a roast, but prior to quenching, is RD(1 - P).
Enthalpy Balance: Overall enthalpy balances were used to compute QSR, the kJ energy used to roast a kg of green coffee feed in both R and SP roasters. Stream or stream component masses were divided by R and multiplied by the relevant heat capacity and stream temperature, with TA used as a reference temperature, to provide specific stream enthalpies: i.e. QB for roasted beans, QG for stack gas and QC for chaff, all on a kJ/kg green beans basis. The heat capacity used for gas and for dry-matter gas and vapor breakdown products was CG = 1.12 kJ/(kg ºC). CB was based on DSC measurements [28] which, when analyzed, appeared to show the CB could
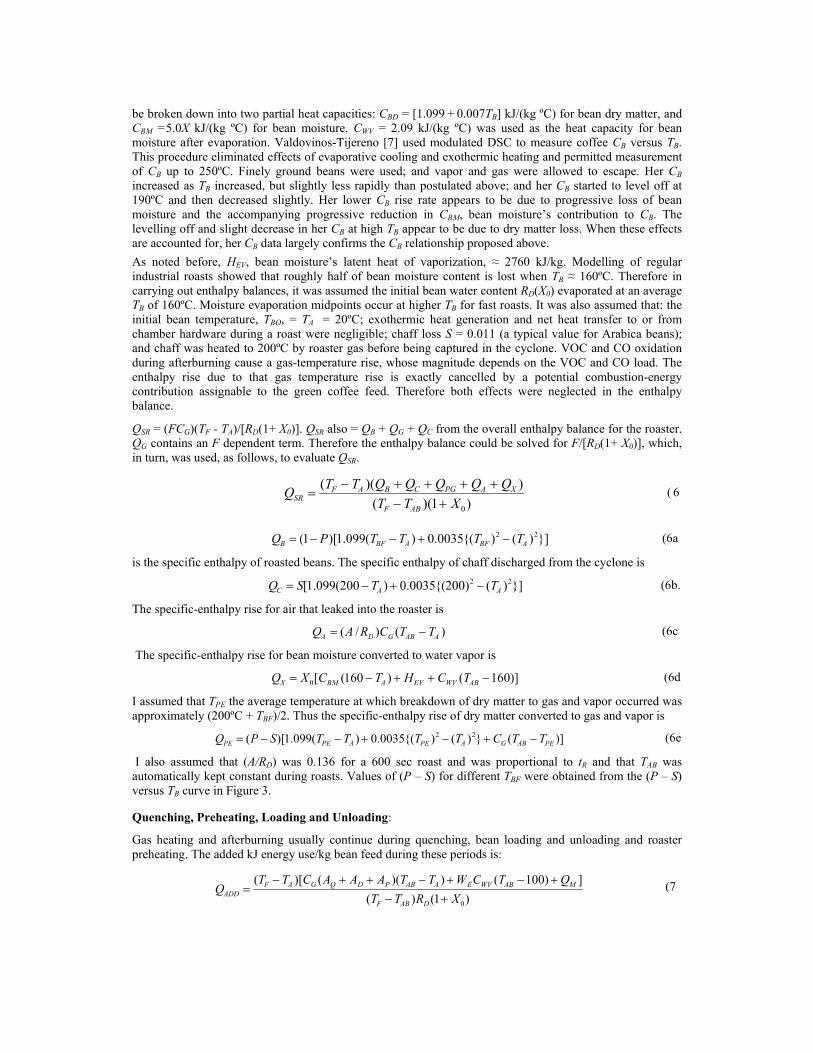
be broken down into two partial heat capacities: CBD = [1.099 + 0.007TB] kJ/(kg ºC) for bean dry matter, and CBM =5.0X kJ/(kg ºC) for bean moisture. CWV = 2.09 kJ/(kg ºC) was used as the heat capacity for bean moisture after evaporation. Valdovinos-Tijereno [7] used modulated DSC to measure coffee CB versus TB. This procedure eliminated effects of evaporative cooling and exothermic heating and permitted measurement of CB up to 250ºC. Finely ground beans were used; and vapor and gas were allowed to escape. Her CB increased as TB increased, but slightly less rapidly than postulated above; and her CB started to level off at 190ºC and then decreased slightly. Her lower CB rise rate appears to be due to progressive loss of bean moisture and the accompanying progressive reduction in CBM, bean moisture’s contribution to CB. The levelling off and slight decrease in her CB at high TB appear to be due to dry matter loss. When these effects are accounted for, her CB data largely confirms the CB relationship proposed above.
As noted before, HEV, bean moisture’s latent heat of vaporization, ≈ 2760 kJ/kg. Modelling of regular industrial roasts showed that roughly half of bean moisture content is lost when TB ≈ 160ºC. Therefore in carrying out enthalpy balances, it was assumed the initial bean water content RD(X0) evaporated at an average TB of 160ºC. Moisture evaporation midpoints occur at higher TB for fast roasts. It was also assumed that: the initial bean temperature, TBO, = TA = 20ºC; exothermic heat generation and net heat transfer to or from chamber hardware during a roast were negligible; chaff loss S = 0.011 (a typical value for Arabica beans); and chaff was heated to 200ºC by roaster gas before being captured in the cyclone. VOC and CO oxidation during afterburning cause a gas-temperature rise, whose magnitude depends on the VOC and CO load. The enthalpy rise due to that gas temperature rise is exactly cancelled by a potential combustion-energy contribution assignable to the green coffee feed. Therefore both effects were neglected in the enthalpy balance.
QSR = (FCG)(TF - TA)/[RD(1+ X0)]. QSR also = QB + QG + QC from the overall enthalpy balance for the roaster. QG contains an F dependent term. Therefore the enthalpy balance could be solved for F/[RD(1+ X0)], which, in turn, was used, as follows, to evaluate QSR.
QSR =(TF − TA )(QB + QC + QPG + QA + QX )
(TF − TAB )(1+ X0) ( 6
QB = (1− P)[1.099(TBF − TA ) + 0.0035{(TBF )2 − (TA )2}] (6a
is the specific enthalpy of roasted beans. The specific enthalpy of chaff discharged from the cyclone is
QC = S[1.099(200 − TA ) + 0.0035{(200)2 − (TA )2}] (6b.
The specific-enthalpy rise for air that leaked into the roaster is
QA = (A /RD )CG (TAB − TA ) (6c
The specific-enthalpy rise for bean moisture converted to water vapor is
QX = X0[CBM (160 − TA ) + HEV + CWV (TAB −160)] (6d
I assumed that TPE the average temperature at which breakdown of dry matter to gas and vapor occurred was approximately (200ºC + TBF)/2. Thus the specific-enthalpy rise of dry matter converted to gas and vapor is
QPE = (P − S)[1.099(TPE − TA ) + 0.0035{(TPE )2 − (TA )2} + CG (TAB − TPE )] (6e
I also assumed that (A/RD) was 0.136 for a 600 sec roast and was proportional to tR and that TAB was automatically kept constant during roasts. Values of (P – S) for different TBF were obtained from the (P – S) versus TB curve in Figure 3.
Quenching, Preheating, Loading and Unloading:
Gas heating and afterburning usually continue during quenching, bean loading and unloading and roaster preheating. The added kJ energy use/kg bean feed during these periods is:
QADD =(TF − TA )[CG (AQ + AD + AP )(TAB − TA ) + WECWV (TAB −100) + QM ]
(TF − TAB )RD (1+ X0) (7
AQ, AD and AP respectively are the kg of air in-leakage during quenching, bean discharge from the chamber, and preheating and bean loading. WE/[RD(1 + X0)] is the kg quench water evaporated/kg green beans. QM/[RD(1 + X0)] is the (kJ heat)/(kg green beans) transferred to roaster hardware during preheating. AQ, AD and AP vary with the type of roaster used, its associated quench time (15 to 30 s), preheat and charge time (30 to 90 s) and bean discharge time (5 to 40 s) and with bean-charge- and discharge-port size. It will be assumed that (AQ/R) ≈ 0.005, (AD/R) ≈ 0.041 and (AP/R) ≈ 0.027, values which appear reasonable for rotating-drum roasters, the most common type of coffee roaster. AQ, AD and AP are zero for roasters where beans are quenched while undergoing air cooling outside the roaster and where furnace gas bypasses the chamber during unloading and loading of beans. QM/R depends on chamber mass and on its temperature rise during preheating. It was assumed that QM/R ≈ 45 kJ/kg, which appears reasonable for a large rotating-drum roaster. Since surface to volume ratios for chambers tend to be proportional to R2/3, QM/R would be larger for most small roasters. WE/RD depends on TBF and on TBD, the desired bean temperature after quenching. WE/RD ≈ CBD(TBF - TBD)/∆HQ, where ∆HQ ≈ 2602 kJ/kg, the enthalpy rise for water between 20ºC liquid and 100ºC steam. It was assumed that TBD = 120ºC. Quenching usually is not used for small SP roasters. Therefore WE/RD was set to zero when determining QADD for SP roasters. WE/RD also = 0 when beans are quenched outside the roaster while undergoing cooling by air.
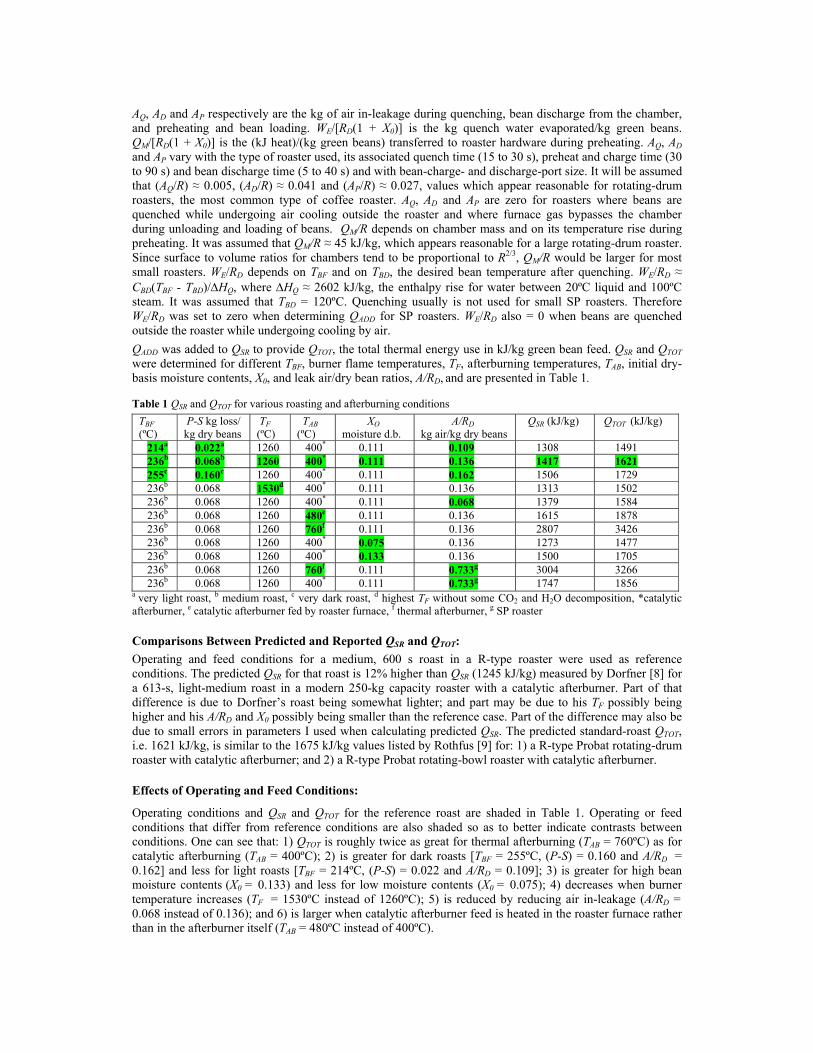
QADD was added to QSR to provide QTOT, the total thermal energy use in kJ/kg green bean feed. QSR and QTOT were determined for different TBF, burner flame temperatures, TF, afterburning temperatures, TAB, initial dry-basis moisture contents, X0, and leak air/dry bean ratios, A/RD, and are presented in Table 1.
Table 1 QSR and QTOT for various roasting and afterburning conditions TBF (ºC)
P-S kg loss/ kg dry beans
TF (ºC)
TAB (ºC)
XO moisture d.b.
A/RD kg air/kg dry beans
QSR (kJ/kg) QTOT (kJ/kg)
214a 0.022a 1260 400* 0.111 0.109 1308 1491 236b 0.068b 1260 400* 0.111 0.136 1417 1621 255c 0.160c 1260 400* 0.111 0.162 1506 1729 236b 0.068 1530d 400* 0.111 0.136 1313 1502 236b 0.068 1260 400* 0.111 0.068 1379 1584 236b 0.068 1260 480e 0.111 0.136 1615 1878 236b 0.068 1260 760f 0.111 0.136 2807 3426 236b 0.068 1260 400* 0.075 0.136 1273 1477 236b 0.068 1260 400* 0.133 0.136 1500 1705 236b 0.068 1260 760f 0.111 0.733g 3004 3266 236b 0.068 1260 400* 0.111 0.733g 1747 1856
a very light roast, b medium roast, c very dark roast, d highest TF without some CO2 and H2O decomposition, *catalytic afterburner, e catalytic afterburner fed by roaster furnace, f thermal afterburner, g SP roaster
Comparisons Between Predicted and Reported QSR and QTOT: Operating and feed conditions for a medium, 600 s roast in a R-type roaster were used as reference conditions. The predicted QSR for that roast is 12% higher than QSR (1245 kJ/kg) measured by Dorfner [8] for a 613-s, light-medium roast in a modern 250-kg capacity roaster with a catalytic afterburner. Part of that difference is due to Dorfner’s roast being somewhat lighter; and part may be due to his TF possibly being higher and his A/RD and X0 possibly being smaller than the reference case. Part of the difference may also be due to small errors in parameters I used when calculating predicted QSR. The predicted standard-roast QTOT, i.e. 1621 kJ/kg, is similar to the 1675 kJ/kg values listed by Rothfus [9] for: 1) a R-type Probat rotating-drum roaster with catalytic afterburner; and 2) a R-type Probat rotating-bowl roaster with catalytic afterburner.
Effects of Operating and Feed Conditions:
Operating conditions and QSR and QTOT for the reference roast are shaded in Table 1. Operating or feed conditions that differ from reference conditions are also shaded so as to better indicate contrasts between conditions. One can see that: 1) QTOT is roughly twice as great for thermal afterburning (TAB = 760ºC) as for catalytic afterburning (TAB = 400ºC); 2) is greater for dark roasts [TBF = 255ºC, (P-S) = 0.160 and A/RD = 0.162] and less for light roasts [TBF = 214ºC, (P-S) = 0.022 and A/RD = 0.109]; 3) is greater for high bean moisture contents (X0 = 0.133) and less for low moisture contents (X0 = 0.075); 4) decreases when burner temperature increases (TF = 1530ºC instead of 1260ºC); 5) is reduced by reducing air in-leakage (A/RD = 0.068 instead of 0.136); and 6) is larger when catalytic afterburner feed is heated in the roaster furnace rather than in the afterburner itself (TAB = 480ºC instead of 400ºC).
Effects of Using SP Roasting QTOT is greater for SP roasters (A/RD = 0.733 in Table 1) than for R roasters, particularly when thermal afterburning is used. An A/RD of 0.733 was used to account for greater air intake by SP roasters. However, A/RD, QSR and QTOT for SP roasters depend on E and TG. Both the predicted A/RD, QSR and QTOT would be greater if E or TGI were smaller than I assumed. The predicted QTOT for SP roasting with thermal afterburning, i.e. 3266 kJ/kg, is 20% less than 4060 kJ/kg listed by Rothfus [9] for a SP type Probat rotating-drum roaster with thermal afterburner and 19% more than 2680 kJ/kg listed for a SP type Gothot Rapido Nova roaster with thermal afterburner [9]. These differences probably are largely due to differenced between the actual A/RD for those roasters and the A/RD I assumed. E and TGI only slightly affect QTOT for R roasters.
Other than using catalytic instead of thermal afterburning, QTOT savings from individual process changes are modest (less than 10%). Combining them provides greater, but slightly less than additive, savings, e.g. low X0, low A/RD and high TF, when combined, reduce QTOT 17.4%. Heat savings per kg of roasted coffee are greater than those per kg of green coffee, particularly when (P + X0) is reduced. For example, the previously cited combined green-coffee-based QTOT saving of 17.4% is a 20.3% savings when reckoned per kg of roasted coffee. Thus reducing X0 and, where possible, reducing P by use of lighter roasts can provide attractive thermal-energy and product-yield savings. It has been claimed that pre-drying of beans: 1) reduces differences in roast color within beans, particularly when high-speed roasting is used [29,30]; 2) prevents the formation of rubbery tastes that would normally be generated when coffee beans, particularly Robustas, are dark roasted [30]; and 3) reduces roasting-induced dry-matter loss (when combined with a modified TB profile) [31].
Problems with Dark Roasting:
TAB probably has to be increased to provide acceptably low stack gas VOC concentrations when VOC generation is large, i.e. when very dark roasting is used. Therefore energy requirements for dark roasting probably are greater than indicated in Table 1. That added energy-use burden and other disadvantages of dark roasting, e.g. lower roasted-coffee yield, increased fouling, reduced catalyst life, provide incentives for dealing with problems caused by dark roasting. While lighter roasts may be difficult to use where dark roasts are strongly preferred, it may be possible to blend light, medium and dark roast coffee so as to retain dark-roast notes, while: a) better utilizing flavor and aroma contributions derived from each type of roast, b) increasing roasted coffee yield, c) improving roasted-bean storage stability, and d) saving energy. It has been claimed [32] that blending small amounts, e.g. 10%, of darkly roasted coffee made from pre-dried Robusta beans with 90% normally roasted coffee will provide coffee that, when brewed, will have a dark brew color, a high flavor strength/rubbery taste ratio and good balance of flavor to strength.
G’, TGI, tR and E do not affect enthalpy balances for R roasters and thus do not directly affect QTOT for such roasters, but have slight indirect effects. Reductions in tR (achieved by increasing G’, TGI or E) reduce A/RD and thereby slightly reduce QTOT. More blower energy and higher TBF are needed when high-speed roasting is used. These cause overall-energy-use increases that exceed the QTOT savings derived from the marked decrease in tR and consequent decreases in A/RD and heat loss from the roaster to its surroundings.
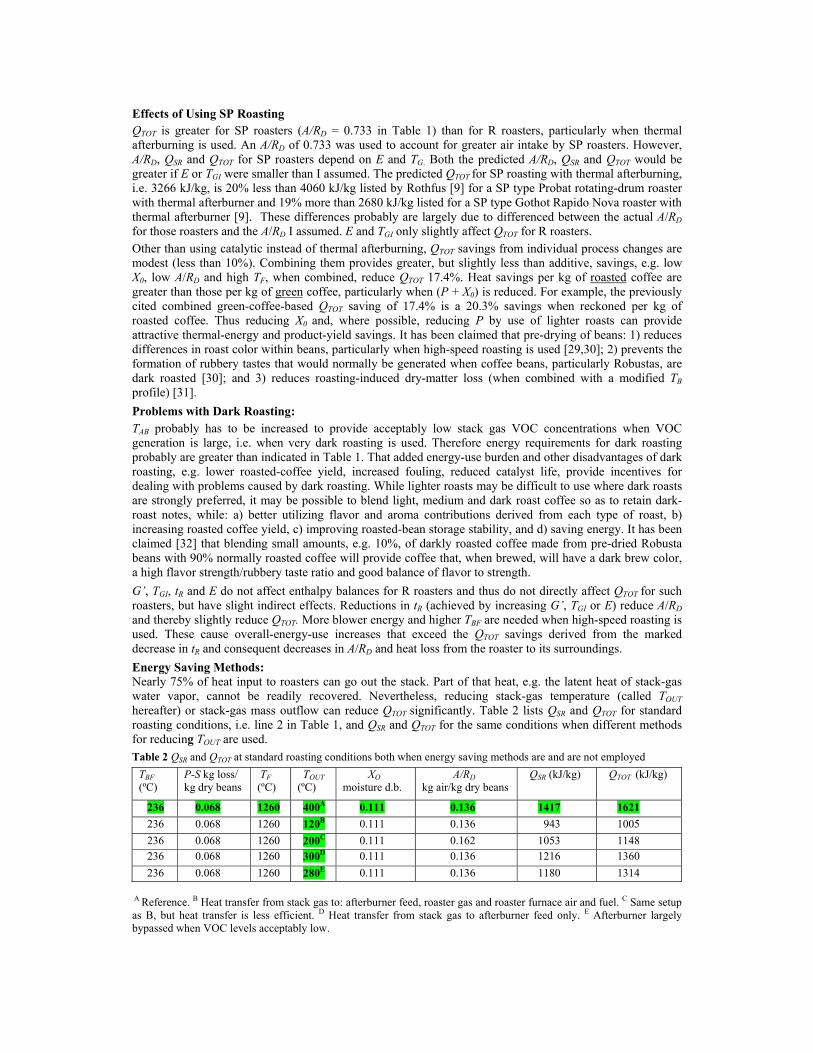
Energy Saving Methods: Nearly 75% of heat input to roasters can go out the stack. Part of that heat, e.g. the latent heat of stack-gas water vapor, cannot be readily recovered. Nevertheless, reducing stack-gas temperature (called TOUT hereafter) or stack-gas mass outflow can reduce QTOT significantly. Table 2 lists QSR and QTOT for standard roasting conditions, i.e. line 2 in Table 1, and QSR and QTOT for the same conditions when different methods for reducing TOUT are used.
Table 2 QSR and QTOT at standard roasting conditions both when energy saving methods are and are not employed TBF (ºC)
P-S kg loss/ kg dry beans
TF (ºC)
TOUT (ºC)
XO moisture d.b.
A/RD kg air/kg dry beans
QSR (kJ/kg) QTOT (kJ/kg)
236 0.068 1260 400A 0.111 0.136 1417 1621 236 0.068 1260 120B 0.111 0.136 943 1005 236 0.068 1260 200C 0.111 0.162 1053 1148 236 0.068 1260 300D 0.111 0.136 1216 1360 236 0.068 1260 280E 0.111 0.136 1180 1314
A Reference. B Heat transfer from stack gas to: afterburner feed, roaster gas and roaster furnace air and fuel. C Same setup as B, but heat transfer is less efficient. D Heat transfer from stack gas to afterburner feed only. E Afterburner largely bypassed when VOC levels acceptably low.
Use of Heat Exchange to Save Energy: Transferring heat from stack gas to cooler gas streams and/or green beans is one way to reduce TOUT. Stack gas contains a great deal of water vapor. Therefore TOUT cannot be reduced much below 100ºC without water condensing on heat-exchange surfaces and reducing heat-exchange capacity. Stepwise transfers of heat from stack gas to: a) afterburner feed; b) then chamber discharge gas; and c) burner air and fuel can reduce TOUT to 120ºC (line 2 in Table 2), thereby reducing QTOT by 38%. Line 3 (where TOUT = 200ºC) shows QTOT for the same heat-exchange scheme, but with less efficient heat exchange because of use of smaller and less costly heat exchangers. Line 4 (where TOUT = 300ºC) shows what QTOT would be if stack gas only transferred heat to afterburner feed.
Transferring heat to combustion air and fuel gas for the roaster-furnace burner may significantly increase NOX production in that burner [32]. Therefore it may be preferable to replace step c) in the previously considered three-step heat-transfer arrangement with a step in which partly cooled stack gas transfers heat to green beans in the bean-feed hopper for the roaster. Schmidt [11] described use of a mini rotating-scoop roaster to accomplish that process.
Fouling:
Heat-exchange-based QTOT reduction will be feasible only if: condensable VOC can be prevented from fouling the heat exchangers or regenerators used; those units are not too large or too costly; and heat-exchange pinches are minimized. Fouling is a problem mainly for roasters where G’ is low, and is aggravated when dark roasts are used. Low G’ lead to: 1) less reduction of VOC partial pressures by dilution; 2) lower TGO because low G’ increase E; and 3) greater TGO reduction due to dilution of roaster gas by leak air and by heat losses. Thus TGO is likely to fall enough for some VOC to condense on duct walls or as smoke droplets (which later impact on and foul surfaces). If G’ is low and E is high enough, TGO may even be low enough to permit tarry VOC to condense on roasting beans, thereby adversely affecting their flavor. Temporarily admixing furnace-discharge gas with chamber-discharge gas, or heat exchange with stack gas itself could raise TGO and heat-exchanger-surface temperatures enough to prevent VOC condensation and consequent fouling. Thus passing stack gas or partly cooled stack gas through a shell surrounding ducts through which chamber-discharge gas flows could prevent those ducts from fouling. Condensed VOC initially are oily, but harden and solidify as time goes by. It is sometimes possible to burn off fouling by passing 400ºC gas through the empty roaster for 720 to 900 s [33]. The burn-off process is automatically repeated every 24 to 40 hours for roasters that foul particularly rapidly. This procedure cannot be used for some roasters. Burn-off procedures might possibly be used to remove fouling from heat exchangers and to burn-off fouling and blinding material on afterburner catalysts.
Fouling of heat exchangers could also be avoided by allowing stack gas to exchange heat only with VOC-free streams, e.g. furnace-burner air and fuel. The mass-flow rate of stack gas exceeds the mass-flow rate of furnace-burner air and fuel. This mass-flow rate imbalance creates a heat-exchange pinch that limits how much heat can be extracted from hot stack gas by such heat transfer. Heat transfer from stack gas to other VOC-free heat-absorbing loads in a coffee roasting plant has also been considered [34].
Compact Heat Exchange
Roasters are designed to occupy a small area and to minimize duct length and consequent loss of heat from ducts. Therefore, heat-exchange systems used to recover energy used for roasting also have to be compact. Finken [35] described a compact heat exchanger and afterburner in which afterburner discharge gas was used to heat afterburner feed and roaster gas for SP roasters. The system might be adapted to recover heat in R roasters. Regenerators could also provide heat exchange compactly, but, if fouled, might be very difficult to clean. Regenerators also cannot be used when VOC levels are likely to exceed 10% of their L.E.L. Such VOC levels might easily occur when very dark roasts are produced. Heat-transfer fluids or heat pipes might be used to exchange heat compactly in the third and/or second stages of the proposed three-stage heat-exchange scheme, i.e. after stack gas has cooled enough to prevent thermal degradation of such media.
Afterburner Bypassing:
VOC levels are acceptably low during the first 75% to 80% of regular roasts, i.e. when roughly 90% of heat use occurs. If most stack gas bypasses the afterburner during this period, QTOT could be significantly reduced. A small portion, e.g. 10%, of stack gas would still be sent to the afterburner then to keep it at operating temperature. All stack gas would go through the afterburner after VOC levels start rising. The estimated average TOUT for this arrangement is 280ºC and could be even lower if E is high. The last line in Table 2 (where TOUT = 280ºC) indicates QTOT could be reduced 19% by use of this arrangement. Alternatively, afterburner bypassing could be gradually reduced as VOC levels rise. FR is the main contributor to stack gas
outflow, and decreases markedly towards the end of roasting. Therefore stack-gas outflow rates will be low when the afterburner is fully on-line. Consequently, smaller afterburners can be employed if afterburner bypassing is used; and total gas flow through the afterburner will be small. Reducing total flow through the afterburner, particularly reducing afterburner flow during times when beans release chaff (which occur relatively early in roasts) may reduce rates of catalyst blinding and deactivation and extend catalyst life.
Stack VOC levels were excessive when intermittent afterburning was used in the past with SP roasters [9], but should be substantially lower if intermittent afterburning is used with R roasters (where substantial in-furnace destruction of VOC occurs) and if excessive roaster preheating is avoided. Suitably low VOC levels can reliably be obtained by using on-line detection of VOC increases or critical TBM to initiate full afterburning. TBM profiles could also be adjusted so as to limit VOC and CO production time. For example, VOC emission could be reliably confined to the last 20% of a roast by slightly decreasing TBM during the first 80% and then increasing dTBM /dt roughly 25% or 30% thereafter. This probably would also increase in-bean generation of methanethiol, a valuable coffee aroma [36]. Similarly limiting VOC production to the last 10% of roasting would save even more energy. Afterburner bypassing would not be effective for TB (and TBM) profiles that are fairly level during mid and late stages roasting and probably would be difficult to utilize for high-speed roasting.
Effects of TAB Control:
The QSR and QTOT values in Table 1 are based on implicitly assuming that F’AB was automatically regulated so as to maintain TAB constant. If F’AB remained constant instead, TAB would progressively increase and would be much higher at the end of the roast than at the beginning. In such a case, QSR and QTOT would be larger than listed in Table 1; and TAB might become high enough at the end of roasts to damage the afterburner catalyst. Conceivably, F’AB could possibly be set at a level that would provide low TAB at the beginning of roasts, i.e. when VOC emission is negligible, but which would also provide acceptably high TAB close to the end of roasts when VOC are emitted. This might possibly save energy, but it probably would be difficult to ensure reliable and predictable provision of adequately low VOC levels.
Combining Savings: Stack-gas heat exchange and afterburner bypassing cannot be effectively combined without losing much of the energy saving provided by heat exchange. However, each of these methods can be effectively combined with other energy-saving steps, e.g. reducing X0 and A/RD and raising TF. The percent QTOT savings for the added steps would only apply to energy not already saved; but total QTOT savings can be as high as 49% if stack-gas heat exchange is combined with these added steps, and as high as 33% if afterburner bypassing is combined with these steps. In the first case, as much as 57% of the energy input per kg of roasted coffee could be saved, and in the second case, as much as 38%.
Proper Purging: Markedly reductions in QTOT cause FR as well as FAB to decrease. FR reductions reduce stack gas outflow and consequent purging of combustible VOC and CO from the roaster. Thus, when G/R is small and/or very dark roasts are used, large QTOT reductions could cause VOC concentrations near the end of roasts to become high enough within roasters to cause puffing (oscillatory non-explosive ignitions) or even an explosion. VOC concentrations in the afterburner feed would also probably exceed their allowable percentage L.E.L. limit, i.e. 25%. These problems can be circumvented by: a) using roasters that utilize larger G/R; or, if this approach is not feasible, b) temporarily using sufficient extra burner air to thereby increase F’R and venting enough to prevent VOC and CO concentrations from becoming excessive. This should be automatically done whenever monitored VOC and/or CO concentrations start to approach dangerous levels. Adding extra burner air will reduce TF, but good burner-control systems will automatically adjust F’R further so as to keep TGI constant. The amount of purging required will in part depend on how much VOC is destroyed in the roaster furnace and on whether destruction of VOC there results in production of significant amounts of CO.
Bean Cooling – Recovering Heat from Roasted Beans:
Part of the heat content of roasted beans could be recovered by passing air leaving the bean cooler through green beans held in an added hopper upstream from the green-bean-feed hopper for the roaster. The added hopper’s bottom would have a perforated, sloping inner wall and solid outer wall with an air-flow channel in between, and would be loaded so that the upper surface of the beans it contains lies roughly parallel to the hopper’s bottom (whose slope would only slightly exceed the angle of repose for coffee beans). Air drawn from the cooling tray by a blower would be also drawn upward through the perforated sloped bottom and bed of beans in the added hopper, thereby preheating the green beans. Heat recovery by this scheme can be
maximized by: 1) limiting quenching to the minimum that will arrest roasting; and 2) increasing stratification of heat transfer in cooling trays. At most, use of this approach would save roughly 134 kJ/kg green beans and raise TBO to 87ºC. Based on records of measured bean-cooler outlet-air temperature versus time [34], actual energy saving currently obtainable by use of this approach might be around 80 kJ/kg green beans.
Reduction of VOC Levels in Cooler Air: In some locales, air used to cool roasting beans also has to subjected to afterburning to oxidize VOC it contains. Afterburning should only be used only during the brief time at the start of cooling when VOC emission is significant (e.g. roughly 15 s out of a 210 to 240 s cooling period for a regular roast). If beans are cooled in a moderately stratified fashion, limiting afterburning of discharged cooler air to the first 15 s of discharge would require roughly 50 kJ/kg green beans compared to the roughly 810 kJ/kg that would be used if all discharged cooler air were subjected to afterburning. If the beans were thoroughly mixed during cooling, limiting afterburning of discharged cooler air to the first 15 s of discharge would require roughly 175 kJ/kg green beans compared to the roughly 2,740 kJ/kg that would be used if all discharged cooler air was subjected to afterburning. Thermal stratification during bean cooling causes different bean strata to cool at different rates, but saves energy when cooler air has to be subjected to afterburning. Use of quenching that adequately stops all roasting reactions should minimize adverse consequences of bean-cooling-time unevenness.
Alternatively, cooler-discharge air could be sent through a bed of an adsorbent during the time that VOC are emitted. The adsorbed VOC could be periodically desorbed in concentrated form later and sent to the afterburner. This would greatly reduce the mass of air that has to be heated to TAB. Use of the previously described green-bean-preheating scheme would reduce the temperature of discharged cooler air and facilitate VOC adsorption. The VOC contained in cooler air could also be absorbed in oil and the burned with that oil.
CONCLUSIONS
Wherever feasible, existing thermal afterburners should be replaced by catalytic afterburners. Catalytic afterburner feeds for R roasters should be heated in the afterburner itself rather than in the roaster furnace. Energy consumption for coffee roasters with afterburners can be reduced 30% to 40% by sequentially transferring heat from roaster stack gas to afterburner feed gas, chamber discharge gas, and then to burner air and fuel or to green beans. The feasibility of this approach depends on whether its use reduces or enhances fouling of heat exchangers and roaster hardware by condensable VOC. Largely bypassing afterburners when VOC concentrations are acceptably low can reduce energy use by about 20%. In each case, added energy could be saved by also increasing TF, reducing air in-leakage, use of lighter roasts and reducing the moisture content of green beans, e.g. by storing them at conditions that promote bean drying. When steps providing large energy-use reductions are utilized, care should be taken that VOC and CO are adequately purged from roasters at late stages of roasting. This can be done by temporarily increasing the air/fuel ratio used for the burner in the roaster furnace. If bean-cooler-discharge air has to be subjected to afterburning, such afterburning should be restricted to periods when that air contains appreciable amounts of VOC. Requiring more extensive afterburning of cooler air would have negative environmental effects.
Acknowledgement: Joachim Eichner, President of Praxis International Inc., provided information about industrial roasting practice that proved useful in preparing this paper. REFERENCES [1] Mahlmann, J.P. & Schecter. S.M. 1985. Controlled Coffee Roasting. U.S. Patent 4,501,761 [2] Stefanucci. A. & Protomastro, M. 1982. Low Density Coffee Process. U.S. Patent 4,349,573 [3] Geiger, R. 2004. Development of Coffee Bean Structure During Roasting – Investigations on Resistance and Driving Forces. Doctoral Dissertation ETH No. 15430, Swiss Federal Institute of Technology Zurich, Switzerland [4] Mondry, V.A. 2004. Measuring Roast Color: Can the Various Popular Systems Be Cross-Referenced. Specialty Coffee Association of America 2004 Annual Conference, Atlanta, Georgia, U.S.A. 23-26 April 2004 [5] Schenker, S. 2000. Investigations on the Hot Air Roasting of Coffee. Doctoral Dissertation ETH No. 13620, Swiss
Federal Institute of Technology Zurich, Switzerland [6] Jansen, G.A. 2006. Coffee Roasting, Magic, Art, Science: Physical Changes and Chemical Reactions. SV Corporate Media GmbH, Munich, Germany [7] Valdovinos-Tijerino, B. 2005. Etude de la Torréfaction du Café: Modelisation et Développement des Outils Pour Maitriser la Qualité du Produit en Ligne. Thése de Doctorat, Université Pierre & Marie Curie, Paris, France [8] Dorfner, R. 2004. In-Line Techniken zur Echtzeit Analyse von Fluchtigen Verbindungen in Kaffee Rostgasen. Doctoral Thesis, Technischen Universitat Munchen, Germany
[9] Rothfus, B. 1986. Coffee Consumption. Gordian-Max Rieck GmbH, Hamburg, Germany, p. 112-180 [10] Anonymous. 2006. Section 3.2.39.2 Roasting Air Emissions. Integrated Pollution Prevention and Control Reference Document on Best Available Techniques in the Food, Drink and Milk Industries. European Commission, p. 139 [11] Schmidt, K. 2008. Mitigating the Environmental Impact of Coffee Roasting. Paper. 97th Annual Convention National Coffee Association of America, Adventura, Florida, U.S.A., 6-8 March 2008 [12] Clarke, R.J. 1979. Roasting and Grinding. In: Clarke, R.J. & Macrae, R. (Eds.) Coffee. Volume 2. Technology. Elsevier Applied Science Press, Barking, Essex, England, p. 73-107 [13] Schwartzberg, H. 2006. Improving Industrial Measurement of the Temperature of Roasting Coffee Beans, 21st
International Conference on Coffee Science, Montpellier, France, 11-15 September 2006 [14] Baggenstoss, J. 2008. Coffee Roasting and Quenching Technology – Formation and Stability of Aroma Compounds. Doctoral Dissertation ETH No. 17696. Swiss Federal Institute of Technology Zurich, Switzerland [15] Eggers, R. & von Blittersdorff, M. 2005. Temperature Field During the Roasting and Cooling of Coffee Beans.
Proceeding of 20th International Conference on Coffee Science, Bangalore, India, 11-15 October 2004 [16] Dutra, E.R. Oliveira, L.S. Franca, A.S. & Afonso, R.J.C.F. 2001. A Preliminary Study on the Feasibility of Using
the Composition of Coffee Roasting Exhaust Gas for the Determination of the Degree of Roast, Journal of Food Engineering, 47(3), 241-246
[17] Gianturco, M. 1967. Coffee Flavor. In: Schultz, H.W, Day, E.A. and Libbey, E.M (Eds.) The Chemistry and Physiology of Flavor. AVI Publishing Company, Westport, Connecticut, U.S.A. p. 431-449 [18] Schwartzberg, H. 2002. Modelling Bean Heating During Batch Roasting of Coffee Beans. In: Welte-Chanes, J.,
Barbosa-Canovas, G. & Aguilera, J. (Eds.) Engineering of Food for the 21st Century. CRC Press, Boca Raton, FL, U.S.A. p. 871-890
[19] Raemy, A. 1981. Differential Thermal Analysis and Heat Flow Calorimetry of Coffee and Chicory Products. Thermochemical Acta, 43(2), 229-236
[20] Raemy, A. & Lambelet, P. 1982. A Calorimetric Study of Self Heating in Coffee and Chicory. Journal of Food Technology, 17(4), 452-460
[21] Schwartzberg, H. 2004. Modelling Exothermic Heat Generation During the Roasting of Coffee. 21st International Conference on Coffee Science, Montpellier, France, 11-15 September 2006
[22] Schwartzberg, H. 2004. Effect of the Characteristic Behavior of Roaster Blowers on Bean Heating in Batch Roasters. 9th International Congress on Engineering and Food. Montpellier, France, 7-11 March 2004
[23] Small, L.E. & Horrell, R.S. 1993, High Yield Coffee Technology. Proceedings, 15th International Conference on Coffee Science, Montpellier, France, 6-11 June 1993, p. 719-726
[24] MacAllister, R.V. & Spotholz, C.H, 1964. Coffee Roasting. U.S. Patent 3,122,439 [25] Price, S.E. Kussin, R.P. Fruhling, R.J. & Harris, M.B. 1991. Ultrafast Roasted Coffee. U.S. Patent 4,988,590 [26] Brandlein, L.S. Schecter, S.P. & Mahlmann, J.P. 1988. Coffee Roasting Method, U.S. Patent 4,737,376 [27] Hubbard, M.R. 1982. High Speed Process for Roasting Coffee. U.S. Patent 4,322,447 [28] Singh, P. Singh, R, Bhamidipati, S. Singh. S & Barone, P. 1997. Thermophysical Properties of Fresh and Roasted
Coffee Powders. Journal of Food Process Engineering, 20(1), 31-50 [29] Kirkpatrick, S.J. Bertagna, R.W. & Gutwein, R.W. 1992. Process for Making Reduced Density Coffee. U.S. Patent
5,160,757 [30] Jensen, M.R. Kirkpatrick, S.J. & Leppla, J.K. 1994. High Yield Roasted Coffee with Balanced Flavor. U.S. Patent
5,322,703 [31] Adler, I.L. & Feldbrugge, A.H. 1971. Method of Roasting Coffee, U.S. Patent 3,589,912 [32] Donley, E & Lewandowski, D. 1996. Optimized Design and Oxidizing Parameters for Minimizing Emissions
During VOC Thermal Oxidation. Metal Finishing, 94(11), 52-58 [33] Angstadt, J.W. 1970. Method and Apparatus for Automatic Cleaning of Coffee Roasters. U.S. Patent 3,733,172 [34] De Monte, M. Padoano, E. & Pozzetto, D. 2003. Waste Heat Recovery in a Coffee Roasting Plant. Applied Thermal Engineering, 23(8), 1033-1044 [35] Finken, H. Jansen, G. & Naves, E. 1998. Arrangement for Roasting Vegetable Bulk Material, Such as Coffee Beans. U.S. Patent 5,718,164 [36] Wasserman, G.S. Rerngsamai, N. Hayes, D.F. Mofford, E.F. & Dabdoub, C. 2001. Roasted Coffee and Coffee
Roasting Method, U.S. Patent 6,207,211