battery electric vehicle user experiences in norway’s
TRANSCRIPT

TØI report 1719/2019
Erik Figenbaum
Susanne Nordbakke
Battery electric vehicle user experiences in Norway’s maturing market


TØI Report
1719/2019
Battery electric vehicle user experiences in Norway’s maturing market
Erik Figenbaum Susanne Nordbakke
Front-page photography: Erik Figenbaum
ISSN 2535-5104 Electronic
ISBN 978-82-480-2261-9 Electronic Oslo, August 2019

Copyright © Transportøkonomisk institutt, 2019 Denne publikasjonen er vernet i henhold til Åndsverkloven av 2018
Ved gjengivelse av materiale fra publikasjonen, må fullstendig kilde oppgis
Tittel: Elbil brukererfaringer i et marked under modning
Title: Battery electric vehicle user experiences in Norway’s maturing market
Forfattere: Erik Figenbaum og Susanne Nordbakke
Authors: Erik Figenbaum and Susanne Nordbakke
Dato: 08.2019 Date: 08.2019 TØI-rapport: 1719/2019 TØI Report: 1719/2019 Sider: 86 Pages: 86 ISSN elektronisk: 2535-5104 ISSN Electronic: 2535-5104 ISBN elektronisk: 978-82-480-2261-9 ISBN Electronic: 978-82-480-2261-9 Finansieringskilde: Forskningsrådet Financed by: The Research Council of
Norway
Prosjekt: 4441 - ELAN Project: 4441 - ELAN Prosjektleder: Erik Figenbaum Project Manager: Erik Figenbaum Kvalitetsansvarlig: Jardar Andersen Quality Manager: Jardar Andersen Fagfelt: Transportteknologi og miljø Research Area: Transport Technology and
Environment Emneord: Brukeradferd
Brukererfaringer Elbil Internettundersøkelse Reisevaner
Keywords: Electric vehicles Internetbased surveys User behavior User experience
Sammendrag: Summary:
Elbilbrukerne blir stadig likere gjennomsnittsbilisten når det gjelder socio-demografiske karakteristika og bruksadferd, i henhold til en spørreundersøkelse gjennomført i Juni 2018 blant elbileiere. Denne utviklingen har blitt fremskyndet av bedre modeller med lenger rekkevidde, utbyggingen av et sammenhengende nettverk av hurtigladere som har muliggjort både langturer og bekymringsløs nærtransport. Kunnskapen om elbiler har også spredt seg ytterligere i befolkningen og en enda høyere andel elbilister sa de vil kjøpe en elbil igjen enn det elbileiere svarte i en tilsvarende undersøkelse i 2016. Også bensinbileierne er blitt mer positive til å kjøpe elbiler. De norske insentivene har medført at elbiler er lønnsomme å kjøpe og eie og har en lav marginal brukskostnad. Den lave brukskostnaden kan potensielt lede til økt trafikk, men denne potensielle effekten har så langt vært begrenset ut fra resultatene i 2018 og 2016 spørreundersøkelsene. Enda færre brukere har hatt utfordringer med bruk av elbilene enn i 2016.
Battery electric vehicle (BEV) users are moving into the early majority user group in Norway, according to a survey of users conducted in June 2018. Compared with a survey conducted in 2016, they have approached the average socio-demographics of vehicle owners. This development has been facilitated by the availability of new BEV models with longer range, improvements to the fast charger networks to allow for long distance driving and less stress in daily traffic, and the increased familiarity with BEVs in the population. Large incentives and the low marginal cost of use has made BEVs very attractive in the market but could potentially lead to a risk that the total volume of traffic increases more than anticipated. So far this potential effect seems to be fairly limited. Fewer users have experienced trouble with their BEV and the willingness to buy a BEV again is even higher than in 2016.
Language of report: English
Transportøkonomisk Institutt Gaustadalléen 21, 0349 Oslo Telefon 22 57 38 00 - www.toi.no
Institute of Transport Economics Gaustadalléen 21, N-0349 Oslo, Norway Telephone +47 22 57 38 00 - www.toi.no

Battery electric vehicle user experiences in Norway’s maturing market
Copyright © Transportøkonomisk institutt, 2019 o
Preface The Institute of Transport Economics follows the development of the electric vehicle market in Norway closely. The “Electromobility Lab Norway” (ELAN) project is one of several projects. Its purpose is to generate new, enhanced and accurate knowledge on the battery electric vehicle market development in Norway, and the prerequisites for meeting the national transportation sector goal of only selling zero-emission vehicles in the passenger vehicle segment by 2025. This report is one of the deliverables of ELAN, a survey of battery electric vehicle owners and the prospective future owners, i.e. those that currently own a combustion engine vehicle. The aim of the survey was to increase the knowledge about the user motivation for buying different types of vehicles, how they use their vehicles and their assessment of how the vehicles works in practise. The report has been written jointly by Erik Figenbaum and Susanne Nordbakke. Jardar Andersen has been TØI’s quality assurer. Trude Kvalsvik has been responsible for the final finishing of the report. Oslo, August 2019 Institute of Transport Economics Gunnar Lindberg Jardar Andersen Managing Director Research Director


Battery electric vehicle user experiences in Norway’s maturing market
Copyright © Transportøkonomisk institutt, 2019 o
Content Summary Sammendrag
Definitions/Acronyms ................................................................................................. 1 1 Introduction ......................................................................................................... 1
1.1 Background ...................................................................................................................... 1 1.2 Knowledge gaps ............................................................................................................... 2 1.3 The ELAN project targets and research questions .................................................... 2 1.4 Structure of the Report ................................................................................................... 3
2 Method and Analysis ............................................................................................ 4 2.1 Theory ............................................................................................................................... 4 2.2 Methods and research design ......................................................................................... 5 2.3 Data – samples of BEV– and ICEV owners .............................................................. 5 2.4 The questionnaire ............................................................................................................ 6 2.5 Reporting by vehicle, not by person ............................................................................. 7 2.6 Representativeness of the sample ................................................................................. 8
3 Socio-demographic characteristics of different BEV- owners .......................... 12 3.1 Changes in socio-demographics between 2016 and 2018 ....................................... 12 3.2 Socio-demographic differences by vehicle ownership ............................................. 14
4 Buying the vehicle .............................................................................................. 16 4.1 Reasons for buying the vehicle .................................................................................... 16 4.2 Other factors of importance for buying an e-vehicle ............................................... 18 4.3 Additional vehicle or replacement of a vehicle? ....................................................... 19 4.4 Need for roof rack, tow hook, 4WD .......................................................................... 21
5 Daily travels and charging ................................................................................. 23 5.1 Daily travels .................................................................................................................... 23 5.2 Other daily trips ............................................................................................................. 24 5.3 Daily charging and electricity connections used ....................................................... 25 5.4 Electricity connections used ........................................................................................ 27
6 Long distance driving and charging behaviour ................................................. 31 6.1 Frequency of vacation trips.......................................................................................... 31 6.2 Characteristics of long distance travel ........................................................................ 32 6.3 Fast charging on long distance trips ........................................................................... 36 6.4 Trips to the cabin .......................................................................................................... 41 6.5 User reactions, range and charge issues on long trips .............................................. 43
7 Annual driving and travel changes .................................................................... 46 7.1 Yearly mileage measured as users stated km in their vehicle insurance contract . 46 7.2 Travel mode changes after buying the vehicle .......................................................... 47
8 Value of local incentives ..................................................................................... 55

Battery electric vehicle user experiences in Norway’s maturing market
o Copyright © Institute of Transport Economics, 2019
9 Future buying behaviour .................................................................................... 59 9.1 Travel challenges are small - Avoided and aborted trips ......................................... 59 9.2 Buying the same vehicle again? ................................................................................... 59 9.3 Advantages and disadvantages of BEVs .................................................................... 61
10 Discussion and conclusions ............................................................................... 66 10.1 Discussion ...................................................................................................................... 66 10.2 Conclusion ..................................................................................................................... 72 10.3 Sources of error, reservation ....................................................................................... 72
11 References .......................................................................................................... 74 Appendix 1 Invitation to survey ................................................................................. 77 Appendix 2 Survey questions ..................................................................................... 78 Appendix 3 Additional analysis ................................................................................. 84

Telephone: +47 22 57 38 00 E-mail: [email protected] i This report can be downloaded from www.toi.no
Summary
Battery electric vehicle user experiences in Norway’s maturing market
TØI Report 1719/2019 Authors: Erik Figenbaum og Susanne Nordbakke
Oslo 2019 86 pages English language
According to Rogers’ theory on the diffusion of innovations, users can be split on a timeline of successive adopters into innovators, early adopters, early and late majority and laggards. Under this perspective, a 2016 user survey showed that battery electric vehicle (BEV) owners in Norway could be classified as early adopters. A recent survey - performed in June 2018 – now shows that owners are moving into the early majority user group, and have now approached the average socio-demographics of vehicle owners in general. This development has been facilitated by the availability of new BEV models with longer range, improvements to the fast charger networks to allow for long distance driving and less stress in daily traffic, and the increased familiarity with BEVs in the population. Large incentives and the low marginal cost of use, have additionally made BEVs very attractive in the market. Although there is potentially a risk that the total volume of traffic increases more than anticipated, due to the low marginal cost of use, so far this effect seems to be fairly limited. Survey results also show that compared to the situation in 2016, fewer users have experienced trouble with their BEV and the willingness to buy a BEV again is higher.
Introduction
This report presents the results from an online survey of Battery Electric Vehicle (BEVs) and Internal Combustion Engine Vehicle (ICEVs) owners. The survey was conducted in May/June 2018 within the Electromombility LAb Norway (ELAN) project. This research project is led by the Institute of Transport Economics (TOI) and sponsored by the Research Council of Norway. The main purpose of the ELAN project is to develop enhanced and accurate knowledge on the diffusion of electric vehicles and on the innovations and strategies required to reach Norway’s goals for the low emission society.
Battery Electric Vehicles in Norway
The results of the BEV and ICEV owner survey must be seen in a broader context, whereby Norwegian policies and characteristics plays an important role. Whereas BEVs are expensive and little known among consumers in most European countries, they have become very popular among Norwegians. The main reason for the appeal in Norway is the long term BEV policy involving extensive national and local incentives. The BEV share of the total fleet passed 7% at the end of 2018, when 200 000 BEVs were on the roads of Norway. The BEV share of new vehicles sold in 2018 reached 31%, which is unprecedented anywhere in the world. Although hugely positive, these results are still not enough to reach Norway’s ambitious environmental goals to follow up the Paris agreement. According to the goals set in national vehicle policy, from 2025 all new passenger vehicles will be zero emission vehicles. In addition, the growth in person transport in larger cities

Battery electric vehicle user experiences in Norway’s maturing market
ii Copyright © Institute of Transport Economics, 2019
should be taken by public transport, bicycles or walking, as defined by the targets stated in the National Transportation Plan from 2018-2029. Norwegian political incentives for BEVs range from purchase incentives, such as exemption from Value Added Tax (VAT) and registration tax (which are substantial in Norway) to local incentives such as exemptions from road tolls, parking charges and access to bus lanes. These incentives have eliminated the BEV disadvantage with respect to the purchase price compared to ICEVs, and local incentives have provided the initial BEV owners with advantages not available to others. At the same time a network of fast chargers covering cities and main roads between cities have been put in place since 2011, making life with BEVs gradually easier. Norway is also especially suited for vehicle electrification; 98% of the electricity production is produced from renewables (mainly hydro-electric based), the electricity grid is robust from power plant to homes, and most Norwegians can park on own land and electricity is often already available. Home charging is thus feasible for most vehicle owners. The population is affluent and up to half of the vehicle owning households own more than one vehicle. These households can easily accommodate one BEV into the household without sacrificing much flexibility.
Methods, Materials and Analysis
The net based user survey which is analysed in this report was conducted in May/June 2018. Participants were 3650 BEV owners who were drawn from a sample of members of the Norwegian Electric Vehicle Association, and 2033 ICEV owners drawn from a sample of members of the Norwegian Automobile Federation. The response rates were 18 percent and 9.4 percent respectively for the two groups. The BEV sample was found to be representative of BEV owners in general, whereas the ICEV sample seemed to deviate somewhat from ICEV owners when comparing with vehicle owning households in the National Travel Survey 2013/14. To solve this issue, most of the analysis was conducted for subsamples of vehicle owners that were workers (either full, part-time or self-employed). In some cases the ICEV sample was further limited to persons that owned vehicles with a model year of 2011 or more recent (the year BEVs came fully on the market) to make it as equal as possible to the BEV sample. A user survey was also conducted in 2016, drawn from members of the same organizations as in 2018. Results from the 2016 survey are used here as a benchmark to assess the direction the BEV market is moving, when it comes to adopter groups. According to the diffusion theory as described by Rogers, diffusion of innovations normally follows an s-shaped curve with five adopter groups successively adopting the innovation: the innovators (2 %), the early adopters (14 %), the early majority (34 %), the late majority (34 %), and laggards (16 %). The “early adopters” are described by Rogers as the ones that triggers the critical mass by making judicious decisions on what to adopt and conveying it to peers. The “early majority adopters” are characterized by the motto: “not to be the first, nor be the last to adopt”. The majority are the mainstream adopters whereas laggards are prone to sticking to the status quo. The relative advantage of the innovation compared to existing solutions is the most important criteria that adopters evaluate new technology against. Therefore, understanding the user motivations for buying a BEV, how they are used, and the advantages and disadvantages that users experience, is vital to understanding the diffusion process of BEVs in Norway. The survey therefore contained questions related to the Socio-demography of users and households, their daily travel and charging behaviour, their long distance travel and charging behaviour, travel changes

Battery electric vehicle user experiences in Norway’s maturing market
Copyright © Institute of Transport Economics, 2019 iii
undertaken after buying a BEV, buying motivation, value of and use of incentives, and the importance of various incentives and attributes of vehicles when deciding on the purchase, as well as opinions about the vehicles, and the use of and the quality of the charging infrastructure. Data about the BEV fleet composition and the geographical spread complement the analysis. It was used, for instance, to investigate the BEV samples representativeness geographically and for the split between different BEV models and size segments.
Results
BEV and ICEV owners socio-demographic characteristics
In 2016, Figenbaum and Kolbenstvedt found that BEV owners had typical characteristics of being “early adopters”, such as being younger male workers with high education and higher incomes. Being younger they also tended to be part of larger households. While BEV owners retain some of these characteristics in 2018, there are several indications that BEV-owners are becoming more similar to the population of car owners in general in terms of socio-economic characteristics: Compared to 2016, the BEV owners are older, more females own a BEV, fewer BEV owners are within the workforce and the households associated with BEV owners are smaller in 2018. The adoption of BEVs is thus moving up the s-curve to the “early majority” of adopters.
Daily driving and home charging
The battery electric car continues to be an everyday workhorse of families in Norway, as they were also in the 2016 survey. BEVs were in 2018, as in 2016, used more often for all local trip types (commuting, shopping, escorting children to activities etc) than ICEVs were. This is likely to be associated with the much lower marginal cost of operating a BEV than an ICEV, so that those owning more than one vehicle tend to use the BEV locally whenever possible. Another reason can be that families, the dominant owner group, tend to have larger needs for local transport than other vehicle owning groups, for instance to escort children to activities. BEV owners in the survey had on average 35 percent longer distance between home and work locations than ICEV owners, further supporting the assumption that low marginal cost of driving is important when choosing a BEV over an ICEV, and that commuting is an important reason for buying a BEV. The frequency of home charging was the same in 2018 as in 2016, with 80 percent of users charging 3 times or more per week at home. On average, users said they charged about 4.4 times/week at home and about 1.1 times/week at work. The home charging process had become safer with 43 percent using home chargers (Wallbox) in 2018, up from 24 percent in 2016. Only 7 percent of users said they never charged their vehicles at home, whereas another 2 percent said they did it rarer than monthly. For these two groups of BEV owners, 53 percent said they charged at work, 29 percent at public chargers and the rest on-street close to home. BEV owners living in apartments charged less often at home (65% weekly or more often) than owners living in detached houses (96% weekly or more often).

Battery electric vehicle user experiences in Norway’s maturing market
iv Copyright © Institute of Transport Economics, 2019
Long distance driving
Long distance driving is one of the last hurdles towards mass adoption of BEVs, particularly for single vehicle households. For single vehicle households to take BEVs into use, they must be able to use them for long distance trips. The greatest disadvantages of BEVs, as perceived by ICEV owners, were in order of importance: driving range, vehicle size and practical characteristics (trunk size, tow bar availability etc.). These are all features that are often necessary for long trips. Besides the vehicle characteristics, a large challenge for full diffusion of BEVs in Norway will be to put in place efficient charging solutions for long distance driving. The challenge will be particularly important during peak long distance travel times, such as vacations. BEVs were more often used for longer distance trips and vacation in 2018 than they were in 2016, with a much higher share of the surveyed ICEV owners (52 percent) than BEV owners (31 percent) going on long vacation trips (above 300 km). The average BEV and ICEV owner, however, do as few as 4 and 6 of these trips respectively per year. Of the four main vacation periods (summer, Easter, fall and winter), summer was the period when the difference in the stated long distance driving behavior between BEV and ICEV owners was the largest. More ICEV owners than BEV owners said they do long distance trips in this time period. The reason for this is not clear. For the other vacation periods, the long distance driving pattern was fairly equal. The differences between BEV and ICEV owners were about the same when looking separately at households with and without children, workers and non-workers, and single and multi-vehicle households. The summer vacation long distance driving is less problematic for charging infrastructure deployment than the other periods, even when taking into consideration the fact that more people go on the longest distance trips in this period. Reasons are that the vehicles’ range will be at the maximum, it will be easier for users to drive economically (no need to heat the vehicle), and the summer vacation period is more stretched out in time and geography than the other vacation periods. A specific but common type of long distance trip in Norway is to the family owned cabins/huts and vacation homes (hereafter, described as ‘cabin’). There are 464 000 of these in total (one per five households). Of the 58 percent of BEV owners that said they have access to vacation homes/cabins, 65 percent said they can charge there, whereas of the 51 percent of ICEV owners with access to cabins, only 35 percent said that electricity is or can be made available for charging where the vehicle is parked. The average number of annual trips to these cabins is about the same for both groups. In theory, range needs on peak travel days could be solved to a large extent if vehicle owners driving the longest stretches on peak travel days buy the vehicles that have the longest range. An analysis of the market by sub segments and vehicle prices, and the availability of long range BEVs, indicate that such vehicles will become available in most vehicle segments. Users will thus be able to select a more expensive vehicle or battery option that allow them to avoid charge queues on peak travel days.
Fast charging
Fast charging supports long distance trips in addition to extraordinary local and regional travels, as well as those that forgot to charge their vehicle overnight. The surveyed BEV users said they did about 19 fast charges per year on average. Charge queues were experienced both locally and regionally to a similar extent, and a bit more often on long

Battery electric vehicle user experiences in Norway’s maturing market
Copyright © Institute of Transport Economics, 2019 v
distance trips. 12-18 percent experienced queues often or always depending on location and on the county they lived and charged. Another 41%-54% experienced queues sometimes. There was however some acceptance for fast charge stops and standing in queues among BEV owners. Owners seemed to accept between 1-3 stops and 5-20 minutes of charge queues on days when many people are travelling. Nonetheless, these results could be due to a sense of realism for what was possible. About half of users were willing to change travel time on peak travel days to avoid charge queues, but mainly within the same day. The charge time and queue time is not fully wasted. BEV owners reported a variety of activities while charging, such as checking/sending e-mails, looking at social media, taking a stroll or using the facilities at the charge station (kiosks, cafés, toilets etc.). The user perception of the fast charger network improved substantially between 2016 and 2018. Fast chargers supporting long distance trips were by most (non-Tesla) BEV owners deemed acceptable or good when it came to availability, position, quality and reliability. Only about 10 percent rated those attributes as poor. Payment systems were even more favorably rated, with only about 5 percent rating them as poor. The satisfaction with these attributes was even higher among Tesla owners, which indicate that the Tesla Supercharger network was performing well.
Total travel and travel changes
Incentives for BEVs can lead to unintended side effects. A key question is if the use of the vehicle is higher when people buy a BEV instead of another vehicle type. This result could be expected based on economic theory. The much lower marginal cost per km of BEVs compared to ICEVs should lead to increased usage when a vehicle owner replaces an ICEV with a BEV. The reasons for the low marginal cost of use is both the efficient utilization of electricity and the low cost of electricity compared to the inefficient use of expensive diesel or gasoline in ICEVs. There are some indications of a rebound effect. One third of the BEV owning households (within the workforce) reported that the acquisition of the car had led to changes in the households total travel behaviour, and about half of these reported to be driving more often than before. This indicates that buying a BEV does not imply a huge increase in average car use. The overall effect appeared to be small also when looking at other indicators. The increase in the households average total vehicle km insured (insurance cost varies with annual km), as reported by the users themselves, was only 2.4 percent. Another potential rebound effect of the BEV policies is an increase in the total number of vehicles, due to the total ownership cost of BEVs being lower than that of ICEVs in Norway. An effect was also visible in the data here, with up to 10 percent of the BEVs consisting of potentially additional vehicles that might not have been bought as ICEVs. BEV owners tended however to have more reasons for buying an additional vehicle and larger transportation needs in general than ICEV owner, so the 10% seems to be an upper limit for this potential rebound effect. Based on the insurance interval of annual km driven it can be estimated that both BEVs and ICEVs that were 2011 and newer year models in 2018, were driven about the same number of km per year. The estimates, based on the survey respondents in 2018, are 16 500 and 16 200 km respectively. These results are about the same as in 2016.

Battery electric vehicle user experiences in Norway’s maturing market
vi Copyright © Institute of Transport Economics, 2019
Value of local incentives
The users own assessment of the average value of local incentives was reduced by 10 percent between 2016 and 2018, but the average value was still rated as high as 14 000 NOK/year per user. The value of access to the bus lanes had gone down substantially between 2016 and 2018, while the value of the toll road exemption had gone up. Both changes are related to policy changes that occurred during this period. BEV owners had in 2016 free access to bus lanes, but were in 2018 required to have a passenger in the car when driving in the most busy bus lanes in the rush hours. Toll road prices have gone up around cities between 2016 and 2018, in particular around Oslo, and new toll roads were introduced along some major roads, leading to an increased value of that incentive in many counties. The toll road exemption was therefore the most important local incentive in 2018, accounting for 65% of the average annual value of local incentives. This incentive has increased in importance since 2016. The availability of local incentives is gradually changing. Bus lanes access will increasingly be restricted during rush hours, to keep bus travel times down. The local monetary incentives can be cut in half as local authorities now can choose to introduce half of the ICEV owners’ rate for BEV owners on toll roads, parking facilities and ferries according to the latest revisions in BEV policies.
Current and future buying behaviour
While there are many reasons to buy a particular type of vehicle, 56 percent of BEV owners said economy was the most important, when forced to provide the single most important factor. In contrast, only 8 percent of ICEV owners said this was the most important factor. The second most important reason for BEV owners was the environment (18 percent) which was not important at all to ICEV owners. Reliability and buying a practical vehicle were most important reasons among ICEV owners but much less important among BEV owners. The same situation applied when looking at how they rated the various attributes of vehicles, but here both groups put the highest emphasis on reliability and driving abilities. ICEV owners said that comfort, safety and size also are very important vehicle characteristics in the buying process, whereas BEV owners rated range, energy cost and purchase price higher. The importance of economy of use is not surprising. BEV owners can (in Norway) save 2000-3500 Euros per year owning a BEV rather than an ICEV, due to the much lower energy cost, the competitive sales price resulting from the tax exemptions, and the high monetary value of local incentives. The challenges of owning a BEV were in general reduced between 2016 and 2018. Fewer BEV owners had in 2018 avoided doing trips with their BEVs compared to 2016, at 21 percent and 28 percent, respectively. The share that had aborted a trip was unchanged (5-6 percent for both years). A higher share of BEV owners said in 2018 that they would repurchase a BEV compared with 2016 (94 percent vs 88 percent). The share of ‘don’t know’ responders had gone down from 11 percent to 6 percent. A positive development was also seen among ICEV owners. Fewer said they would repurchase an ICEV (63 percent vs 55 percent) and those that said they would not (9 percent vs 7 percent), were much more inclined to say they would rather buy a BEV in 2018 than in 2016 (55 percent vs 23 percent), while the opposite was the case for PHEVs (27 percent vs 60 percent).

Battery electric vehicle user experiences in Norway’s maturing market
Copyright © Institute of Transport Economics, 2019 vii
Conclusion
The Norwegian BEV market has taken another step towards the normalization of BEVs as a regular vehicle option for consumers. The socio-demographic differences of BEV owners between 2018 and 2016 points at BEVs moving up the adoption curve towards the majority buyer groups. This development has been facilitated by new models coming on the market, an increased driving range of new and existing models, improvements to the network of fast chargers, and the increasing familiarity with BEVs in the population. The risk that the overall number of vehicles in the fleet can increase and each vehicle be driven more, due to the low marginal cost of owning and operating a BEV in Norway, seems so far limited. This can, however, still change as and when new groups take BEVs into use.


Telefon: 22 57 38 00 E-mail: [email protected] IRapporten kan lastes ned fra www.toi.no
Sammendrag
Elbil brukererfaringer i et marked under modning
TØI rapport 1719/2019 Forfattere: Erik Figenbaum og Susanne Nordbakke
Oslo 2019 86 sider
Elbilbrukerne blir stadig likere gjennomsnittsbilisten når det gjelder sosio-demografiske karakteristika og bruksadferd, i henhold til en spørreundersøkelse gjennomført i Juni 2018 blant elbileiere. Denne utviklingen har blitt fremskyndet av bedre elbilmodeller med lenger rekkevidde og utbyggingen av et sammenhengende nettverk av hurtigladere som har muliggjort både langturer og bekymringsløs nærtransport. Kunnskapen om elbiler har også spredt seg ytterligere i befolkningen og en enda høyere andel elbilister sa de ville kjøpe en elbil igjen enn det elbileiere svarte i en tilsvarende undersøkelse i 2016. Også bensinbileierne hadde blitt mer positive til å kjøpe elbiler. De norske insentivene har medført at elbiler er lønnsomme å kjøpe og eie og har en lav marginal brukskostnad. Den lave brukskostnaden kan potensielt lede til økt trafikk, men denne potensielle effekten har så langt vært begrenset ut fra resultatene i 2018 og 2016 spørreundersøkelsene. Enda færre brukere har hatt utfordringer med bruk av elbilene enn i 2016.
Introduksjon
Denne rapporten presenterer resultater fra en nettbasert spørreundersøkelse blant elbileiere (batteridrevne) og eiere av bensin- og dieselbiler. Undersøkelsen ble gjennomført i Mai/Juni 2019 som del av ELAN (Electromobility Lab Norway) forskningsprosjektet som ledes av TØI og finansieres av Forskningsrådet. Hovedhensikten med ELAN er å utvikle forbedret og presis kunnskap om spredningen av elbiler i Norge, og de innovasjonene og strategien som vil kreves for at vi skal nå de nasjonale målene for et framtidig lavutslippsamfunn.
Elbiler i Norge
Resultatene må ses i en bredere sammenheng, der Norge er et land som er godt tilrettelagt for elektrifisering, og elbileiere mottar så kraftige kjøpsinsentiver at kostnadsulempen er eliminert og til og med blitt til en fordel. I resten av Europa er elbiler dyrere enn andre biler pga. færre eller fraværende insentiver og langt færre har kunnskaper om elbilenes egenskaper. Elbilandelen av bilparken passerte i Norge 7,1% på slutten av 2018 og det var da mer enn 200 000 elbiler på veien. Andelen av nybilsalget lå på 31% i 2018 som helhet, noe som er langt foran alle andre land i verden. Dette er likevel langt fra målet fra Nasjonal Transportplan om bare å selge elbiler fra 2025. Ved siden av de økonomiske kjøpsinsentivene har lokale insentiver som gratis passering av bomstasjoner og tilgang til kollektivfeltet hatt stor betydning, sammen med etableringen av et nettverk av hurtigladere i og mellom de største byene i Norge. Noe som gradvis har gjort livet med en elbil enklere. Norge er på andre måter også velegnet, med i hovedsak fornybar elektrisitet basert på vannkraft. De fleste bileiere har tilgang på parkering på egen tomt og et robust kraftnett fram til husholdningene gjør at det er mulig for de fleste å lade hjemme.

Elbil brukererfaringer i et marked under modning
II Copyright © Transportøkonomisk institutt, 2019Denne publikasjonen er vernet i henhold til Åndsverkloven av 2018
En høy andel av husholdningen disponerer mer enn en bil og kan forholdsvis enkelt inkorporere en elbil med begrenset rekkevidde uten å måtte ofre særlig mye fleksibilitet.
Metode, data, analyse
Den internettbaserte spørreundersøkelsen som analyseres i denne rapport ble gjennomført i Mai/Juni 2018 blant 3 650 tilfeldig utvalgte elbileiere som var medlemmer av norsk elbilforening, og 2033 medlemmer av NAF, valgt ut for å være nasjonalt representative. Responsraten var henholdsvis ca. 18% og 9,4%. En spørreundersøkelse ble gjennomført blant respondenter fra de samme organisasjonene i 2016, slik at det er mulig å studere endringer mellom disse to årene. Elbilutvalget ble vurdert til å være representativt for elbileiere generelt. NAF utvalget avvek noe fra bileiende husholdninger i henhold til den norske reisevaneundersøkelsen (RVU 2013/14). For å redusere avviket ble utvalgene i de fleste analysene snevret inn til bileiere som var i arbeid, og i tillegg for NAF-utvalget begrenset til eiere av 2011 og nyere bilmodeller (det var først fra 2011 at elbiler fullt ut ble et reelt alternativ i markedet). I følge Rogers teori om diffusjon av innovasjoner så følger diffusjonen normalt en S-kurve der 5 grupper suksessivt tar innovasjonen i bruk: «innovatører» (2%), «tidlig brukere» (14%), «tidlig majoritet» (34%), «sen majoritet» (34%) og «etternølere» (16%). Rogers beskriver «tidlig brukere» som de som trigger at kritisk masse kan nås gjennom å ta veloverveide beslutninger om hva de tar i bruk og sprer informasjonen om hvorfor til sine kontakter. «Tidlig majoritet» beskrives slik: «ikke de første som tar en innovasjon i bruk men ikke de siste heller» og de representerer sammen med «sen majoritet» det store flertallet av konsumenter. «Etternølere» er ikke interessert i endringer og vil helst fortsette som før. Brukerne ser på innovasjonens relative fordeler i forhold til dagens teknologi som det viktigste kriteriet for å vurdere om en innovasjon skal tas i bruk. Insentiver kan forsere innovasjonsprosessen. Disse mekanismene gjør det viktig å forstå brukernes kjøpsmotivasjon og hvordan bruken og bruksopplevelsen av innovasjonen er og eventuelt hvordan den skiller seg fra dagens teknologi. Som for eksempel hvilke fordeler og ulemper brukerne ser. Da kan man finne ut hvordan videre diffusjon kan foregå. Spørreundersøkelsen inneholdt derfor spørsmål relatert til brukernes sosio-demografiske karakteristika, deres daglig reise- og lademønster, deres langdistanse reiser og bruk av hurtiglading, og om endringer i reisemønstre etter kjøpet av elbil. Videre var det spørsmål om hvorfor de valgte denne bilen, bruk av og verdi av lokale insentiver, og viktigheten av ulike insentiver og attributter elbiler har. Til sist inneholdt undersøkelsen også spørsmål om bruk av og vurderinger av kvaliteten på ladeinfrastrukturen som var tilgjengelig i Norge. Data fra kjøretøyregisteret over bilflåten ble brukt til å vurdere hvor representativ elbileierne var med hensyn på geografisk fordeling og elbilmodeller de eide.
Resultater
Socio-demografiske karakteristika
I TØIs 2016 spørreundersøkelse blant elbileiere var en av konklusjonene at elbileiere hadde noen av de typiske karakteristikkene til «tidlig brukere» (early adopters), slik som at de var yngre menn med høy utdanning som var i arbeid og bodde i større husholdninger med høyere inntekter enn andre bileiere.

Elbil brukererfaringer i et marked under modning
Copyright © Transportøkonomisk institutt, 2019 III Denne publikasjonen er vernet i henhold til Åndsverkloven av 2018
Elbileierne hadde fremdeles disse karakteristika i 2018, men hadde blitt likere den generelle bileieren i befolkningen som helhet. I forhold til i 2016 hadde de blitt litt eldre, flere var kvinner, flere var pensjonister og husholdningene hadde blitt mindre. Elbilmarkedet var på vei inn i den tidlige «majoritetsgruppen» (early majority) kjøpere. Elbiler var blitt mer «normale», og dermed et alternativ for stadig flere, slik en også kunne se på salgsstatistikken.
Daglig bruk og lading
Elbilen var fortsatt familienes arbeidshest i Norge, slik også spørreundersøkelsen i 2016 viste. Elbiler ble i 2018 anvendt oftere enn bensin- og dieselbiler for alle typer lokale reiser, til pendling, innkjøpsreiser, følgereiser med transport av barn til aktiviteter etc. Dette skyldes blant annet at mange barnefamiliehusholdninger har mer enn en bil. Transporten deres kan omfordeles slik at elbilen anvendes mest mulig til å dekke det lokale transportbehovet, fordi marginal-kostnaden er mye lavere enn for en bensin- eller dieselbil. At elbilen ikke har utslipp lokalt er en ekstra bonus men ikke den primære kjøpsårsaken. Familier med barn har også generelt sett et større lokalt transportbehov enn andre bileiende grupper, for eksempel for å følge barna til fritidsaktiviteter. Elbileierne hadde i gjennomsnitt 35% lenger avstand mellom hjem og arbeid enn eierne av bensin- og dieselbileierne i undersøkelsen, noe som indikerer at lav marginalkostnad ved bruk og pendling har hatt betydning ved valg av biltype. Jo lenger pendlerdistansen er jo mer lønnsomt er det å kjøpe en elbil, både på grunn av innsparte energikostnader og større sannsynlighet for at brukeren sparer bompenger. Som i 2016 undersøkelsen så ladet 80% av elbileierne i 2018 elbilene sine tre ganger eller mer per uke hjemme. I gjennomsnitt ladet de 4,4 ganger per uke mot bare 1,1 gang per uke på arbeidsplassen. Ladeprosessen hadde blitt tryggere. Langt flere, det vil si 43% av alle elbileiere som svarte på 2018 undersøkelsen hadde investert i en hjemmelader mot bare 24% i henhold til 2016 spørreundersøkelsen. Bare syv prosent svarte at de aldri lader bilen hjemme og ytterligere to prosent sjeldnere enn månedlig. Av disse ni prosentene av elbileiere så svarte 53% at de ladet på arbeid, 29% på offentlige ladere og resten på gata nær hjemmet. Av elbileierne som bor i leiligheter, ladet 65% hjemme ukentlig eller oftere, mens av de som bor i enebolig svarte 96% det samme.
Langdistanse kjøring
Langdistansekjøring er en av de siste utfordringene på veien mot full markedsintroduksjon for elbiler. Dette bruksområdet er spesielt viktig for enbilshusholdningene. De må ta elbilen på slike langturer og dette må fungere i praksis. Bensin- og dieselbileiere sa eksempelvis at de største ulempene ved elbiler er (i fallende viktighet): rekkevidde, bilstørrelse og praktiske karakteristika som størrelse på bagasjerom og manglende mulighet for tilhengerfeste. Dette egenskaper som er relatert til lengre reiser og fleksibel bilbruk. Bilegenskaper som muliggjør lange reiser må derfor på plass for at teknologien skal kunne spres til alle, men det må også komme på plass effektive ladeløsninger for disse lange reisene. Utfordringene vil være spesielt store på store utfartsdager i hovedferieperiodene. En høyere andel elbileiere benyttet elbilen på langdistanseturer og feriereiser i 2018 enn i 2016. Men langt flere bensin- og dieselbileiere (52%) foretok de lengste ferieturene, de over 300 km, sammenlignet med elbileiere (31%). Antallet slike reiser var imidlertid i gjennomsnitt så lavt som henholdsvis seks per år og fire per år. Av de fire hovedferieperiodene, påske, sommerferie, høstferie og vinterferie, så var det sommeren

Elbil brukererfaringer i et marked under modning
IV Copyright © Transportøkonomisk institutt, 2019Denne publikasjonen er vernet i henhold til Åndsverkloven av 2018
forskjellen var størst mellom disse to bileiergruppene. Det er altså om sommeren at bensin- og dieselbileierne kjører oftere lange turer enn elbileierne. For de tre andre ferieperiodene var det forholdsvis små forskjeller i svarene. Forskjellene var omtrent de samme for husholdninger med og uten barn, arbeidere og de uten arbeid, og mellom enbils- og flerbilshusholdninger. Sommerferiens lange reiser er trolig enklere å utbygge ett hurtigladenettverk for enn for de andre ferieperiodene. Elbilenes rekkevidde vil være på maksimum, bilene kan kjøres mer økonomisk (ikke noe varmebehov), og sommerferien er spredt over en mye lengre tidsperiode og mer geografisk spredt. En spesifikk type lange reiser er hytteturene. I Norge er det 464 000 hytter og sommerhus av ulike varianter. Blant elbileierne sa 58% at de disponerte hytte. Av disse kunne 65% lade bilen der. Blant bensin- og dieselbileiere var hyttetilgangen også høy (51%), men bare 35% hadde elektrisitet tilgjengelig nærme nok til at det vil være praktisk mulig å lade en elbil der (mindre enn 20 meter fra parkeringsplassen). Ut fra svarene i undersøkelsen ser en at Elbileierne og eierne av bensin- og dieselbiler drar omtrent like ofte på hytta. Teoretisk kan rekkevidde behovet på de travle dagene dekkes med begrenset ladeinfrastrukturutbygging, hvis de som har de lengste reiseveiene og mangler lading, velger elbilene med lengst rekkevidde. En analyse av tilgangen på elbilmodeller i ulike segmenter og bilstørrelser viser at dette kan bli mulig. Bilkjøperne kan velge mellom en litt dyrere bil med lang rekkevidde, eller en rimeligere bil med kortere rekkevidde men som må hurtiglades (oftere) på de lange turene. De må også ta med i betraktningen den økte risikoen for å oppleve ladekøer på travel reisedager.
Hurtiglading
Hurtiglading kan støtte langdistansekjøring, ekstraordinære lokale transportbehov og dem som har glemt å lade bilene over natten. Ut fra spørreundersøkelsen ser en at hurtigladere brukes lokalt, regionalt og på lange reiser. I gjennomsnitt sa elbileierne at de foretok 19 hurtigladinger per år. Ladekøer opplevde 12-18% av brukerne ofte eller alltid på lokale og regionale ladesteder og litt oftere på lange reiser, avhengig av hvilket fylke de bodde i. Ytterligere 41-54% opplevde ladekø av og til. Det var en viss akseptans for å foreta 1-3 ladestopp på lange reiser, og å vente i 5 til opp mot 20 minutter i ladekø på dager der mange reiser samtidig. Om lag halvparten var villige til å endre reisetidspunktet på slike dager for å unngå køer, men i hovedsak innenfor samme dag. Ladetid og venting i kø ble fylt med ulike aktiviteter som å lese e-poster, være på sosiale media, ta en spasertur eller benytte fasilitetene på stedet (Kiosk, toalett etc.). Brukerne syntes tydeligvis at det har blitt store forbedringer i ladenettverkene mellom 2016 og 2018. De var mye mer fornøyde i 2018 enn de var i 2016. De fleste mener tilbudet er godt eller akseptabelt for parameterne tilgjengelighet, posisjon, kvalitet og pålitelighet. Bare om lag 10 prosent mente at tilbudet var dårlig. Betalingsløsninger var det enda større tilfredshet med, kun ca. 5 prosent ga de en dårlig karakter. Tesla eierne er enda mer fornøyd enn de øvrige gruppene. Men det er fortsatt et stort behov for å bygge ut infrastrukturen for å holde ladekøene nede i og med at elbilparken vokser så raskt.
Total kjøring og endring i reiseadferd
Elbilinsentiver kan potensielt medføre uønskede bieffekter. F.eks. hvis hver bil brukes mer, eller hvis flere kjøper bil enn det de ellers ville gjort. Begge deler kan bidra til ytterligere

Elbil brukererfaringer i et marked under modning
Copyright © Transportøkonomisk institutt, 2019 V Denne publikasjonen er vernet i henhold til Åndsverkloven av 2018
køutfordringer f.eks. i byene. I og med at elbiler har lavere marginal kostnad mer kjørt km enn bensin- og dieselbiler, vil det være forventet utfra vanlig økonomisk teori at bileierne kjører mer når de først har kjøpt elbilen. Det er noen indikasjoner på at elbilkjøp endrer reisemønstre noe mer enn kjøp av en bensin- eller dieselbil gjør, men effekten er forholdsvis liten. En tredjedel av de som eier elbil og er i arbeid rapporterte at bilkjøpet hadde ledet til endringer i husholdningens reisemønster. Omlag halvparten av disse sa at de kjørte mer enn før, men en analyse av hvor mye de sa at husholdningens samlede forsikrede kjørelengde hadde endret seg viste bare en gjennomsnittlig økning i kjørte km på 2,4% per år. Den andre potensielt uønskede effekten av den norske elbilpolitikken kan være at antallet biler totalt kan øke fordi elbileiere i Norge har lavere totale årlige bilkostnader enn eiere av bensin- og dieselbiler har. Dette kan gjøre at flere kjøper bil enn hvis bare bensin- og dieselbiler var tilgjengelig. En slik effekt kan leses ut av materialet fra spørreundersøkelsen. Opp til 10% av elbilene kan være ekstrabiler som ikke ellers ville blitt kjøpt. Men det er ikke mulig å vite sikkert hva disse elbileierne hadde gjort alternativt. En høyere andel av elbileierne har hjemmeboende barn enn blant bensin- og dieselbileiere og det er vanligere å kjøpe en ekstrabil i slike husholdninger enn i andre grupper. Dermed er 10% et øvre estimat for denne effekten. Basert på hvilket intervall de hadde valgt for årlig km i bilforsikringen, kan det estimeres at elbileiere og bensin- og dieselbileiere som eier 2011 og nyere årsmodeller kjører om lag like mye per år, henholdsvis ca. 16 500 km og 16 200 km, som er omtrent det samme som i 2016 undersøkelsen.
Verdi av lokale incentiver
Elbilbrukernes egen vurdering av verdien av lokale insentiver endret seg betydelig mellom 2016 og 2018. Endringene sammenfaller med endringen i politikken knyttet til insentivene i samme periode. Total gjennomsnittlig fordel gikk ned med bare om lag 10% til ca. 14000 kr, men bompengenes andel av totalsummen gikk betydelig opp og utgjorde 65% av totalen mens tidsbesparingene og dermed verdien ved bruk av kollektivfeltet gikk betydelig ned. Dette skyldes for det første at bompengetakstene gikk kraftig opp flere steder i Norge mellom 2016 og 2018, spesielt rundt byene, og for det andre at det ble innført stadig flere restriksjoner på bruken av kollektivfeltene i rushtiden mellom 2016 og 2018. I 2018 måtte man f.eks. i flere av de mest attraktive kollektivfeltene være mer enn en person i bilen i rushtiden. Fremover vil verdien av disse insentivene gradvis reduseres ettersom det lokalt innføres ytterligere restriksjoner på bruk av kollektivfeltene og fordi det gradvis i henhold til vedtak i stortinget kan innføres inntil 50% brukerbetaling (i forhold til hva bensin-og dieselbileiere betaler) i bomstasjoner, for parkering og på fergene.
Dagens og fremtidige kjøpsadferd
Det er mange grunner til å velge en spesifikk bil, men for elbileiere var biløkonomi den klart viktigste faktoren. Hele 56% oppga dette som den viktigste grunnen i 2018, men bare 8% av bensin- og dieselbileiere gjorde det samme. Den nest viktigste grunnen til valget av elbil var miljø, 18% svarte dette, mens pålitelighet og praktiske egenskaper var viktigst for bensin- og dieselbileiere. Disse egenskapene var ikke så viktige for elbileierne. Bensin- og dieselbileiere sa også at komfort, sikkerhet og bilstørrelse var svært viktig mens elbileierne syntes rekkevidde, energikostnader og kjøpspris var viktigere. Viktigheten av biløkonomi

Elbil brukererfaringer i et marked under modning
VI Copyright © Transportøkonomisk institutt, 2019 Denne publikasjonen er vernet i henhold til Åndsverkloven av 2018
for elbileier er ikke så overraskende. Det er i Norge mulig å spare over 20 tusen kroner i året på å eie en elbil pga. lave energikostnader, kjøpsinsentiver, og med en gjennomsnittlig fordel av de lokale elbilfordelene (fritak for bompenger etc.). Færre elbileiere hadde i 2018 latt være å gjennomføre en tur pga. rekkeviddeutfordringer sammenlignet med i 2016, 21% mot 28%. Andelen som sa de hadde avbrutt en reise var uendret - kun 5-6% begge årene. Livet med en elbil hadde altså blitt litt enklere i løpet av denne perioden. Andelen som sa de ville kjøpe en elbil igjen var enda høyere i 2018 enn i 2016. Hele 94% sa at de ville kjøpe en elbil igjen. Også bensin- og dieselbileiere var blitt mer positive til elbiler. Andelen som ville kjøpe en bensin/dieselbil igjen var redusert fra 63 til 55 prosent og blant de som sa de ikke ville kjøpe en slik bil igjen (9%) var andelen som heller ville kjøpe en elbil økt fra 23% til 55%, mens utviklingen var motsatt for ladbare hybridbiler.
Konklusjon
Det norske elbilmarkedet har tatt nye steg mot normalisering av elbil som et vanlig valg-alternativ for norske konsumenter. Endringene i sosio-demografiske karakteristika mellom spørreundersøkelsen i 2016 og 2018 indikerer at elbilmarkedet er på vei inn i tidlig majoritet av kjøpergrupper. Dette har blitt muliggjort av at flere modeller med attraktive egenskaper og lenger rekkevidde har kommet på markedet og at eksisterende modeller har fått lenger rekkevidde og andre forbedringer. Etableringen av et landsdekkende nettverk av hurtigladere har også hatt stor betydning. Elbilers bruksegenskaper har også blitt enda bedre kjent i befolkningen mellom 2016 og 2018 og bensin- og dieselbileier har i løpet av denne perioden blitt mer positive til elbiler. De lave kostnadene ved å eie og bruke elbiler i Norge kan gi en risiko for at den totale trafikken øker og slik sett skape utfordringer for et annet mål i NTP, at veksten i trafikken i byene skal tas med kollektiv, sykkel eller gange. Så langt ser denne risikoen ut å være nokså begrenset, men det kan endre seg når nye brukergrupper tar elbiler i bruk.

Battery electric vehicle user experiences in Norway’s maturing market
Copyright © Institute of Transport Economics, 2019 1
Definitions/Acronyms
Vehicle types
BEV: Battery Electric Vehicle, a vehicle only powered with electricity from batteries
EV: See PEV
EREV: Extended Range Electric Vehicles, a vehicle operating mainly as a BEV but with an engine/generator set on board generating electricity charging the battery when empty
HEV: Hybrid Electric Vehicle, a vehicle where the electric motor partly or part time powers the wheels, using electricity recharged into the batteries when running the electric motor in generator mode, thus reducing the fuel consumption of the ICE.
ICE: Internal Combustion Engine, i.e. gasoline or diesel engine
ICEV: Internal Combustion Engine Vehicle (Gasoline or diesel vehicle)
PEV: Plug in Electric Vehicle, all vehicles with a plug to be able to recharge the battery from the grid, i.e. BEV, PHEV, EREV
PHEV: Plug in Hybrid Electric Vehicle, a vehicle that can be powered by an electric motor with electricity charged from the grid and stored in the vehicles battery alone, or in combination with an ICE in other operation modes


Battery electric vehicle user experiences in Norway’s maturing market
Copyright © Institute of Transport Economics, 2019 1
1 Introduction
1.1 Background
Battery Electric Vehicles (BEVs) can contribute to reduction of greenhouse gas emissions and local pollution when replacing transport otherwise carried out using diesel or gasoline fuelled vehicles. BEVs themselves emit no tailpipe climate gas emission and no local air pollution; i.e. they are zero emission vehicles, when keeping the electricity production outside of the equation. In addition, electric propulsion is three times as energy efficient as petrol or diesel engine propulsion. About 98% of the electricity produced in Norway is based on hydro-electric power sources (a few percent is wind), and is thus emission free (Figenbaum 2017a). The production of electricity is in Europe anyhow part of the EU Emission Trading System (ETS). Therefore, when an Internal Combustion Engine Vehicle (ICEV) is replaced with BEV, the greenhouse gas emissions from the ICEV will be eliminated, while the emissions from the EU ETS is kept constant due to the emission ceiling. The overall result will be a 100% emission reduction from the use phase of the vehicle (Figenbaum 2017a). Changing to BEVs from ICEVs (Internal Combustion Engine Vehicles) will thus be environmentally efficient in Norway and in Europe as a whole. The results can however be less conclusive when studying individual European countries. The effects of vehicle production are beyond the scope of this report and is a complex issue given that vehicles and components may be produced inside or outside of the EU ETS using different material and energy sources. Life cycle emission studies in general conclude that BEVs lead to higher greenhouse emissions in the production phase but these emissions are more than compensated for due to the low or zero-emission use phase. BEVs will, like petrol and diesel vehicles, produce particle emission from the tyre wear and tear resulting from the contact between the tyre and the roads, but should emit less emissions due to break pad wear because of the regenerative braking feature. BEVs take up as much space in cities as petrol and diesel vehicles and is not a solution for congestion challenges. BEVs low energy cost, which in Norway are about 20% of those of a diesel vehicle, lead to a low marginal cost of operation that could lead to a risk of increased driving when consumers switch from ICEVs to BEVs. Vehicle purchase taxes are very high in Norway. The registration tax consists of taxes on vehicle weight, CO2-emissions and NOX-emissions. The tax is progressive, and registration tax for heavier vehicles with high emissions can be over 15 000 Euros. Tax for a typical compact vehicle could be 6 000 Euros, for a small vehicle around 3 000 Euros. BEVs’ are 100% exempted from this tax. In addition, BEVs are exempted from the 25% VAT imposed on other vehicles. Several local incentives are also available, such as access to bus lane and free passing of toll roads (Figenbaum 2018). Norway’s extensive national and local incentives and long term stable BEV policy have been essential (Figenbaum 2017a, 2018) in achieving a BEV share of the total fleet passing 7% in December 2018. The BEV share of new vehicle sales in 2018 reached 40%. But these results are still far away from reaching Norway’s ambitious environmental goals for the years to come to follow up the Paris agreement. From 2025, all new passenger vehicles

Battery electric vehicle user experiences in Norway’s maturing market
2 Copyright © Institute of Transport Economics, 2019
shall according to the national vehicle policy be zero emission vehicles, and the growth in transport of persons in larger cities should be taken by public transport, bicycles or walking (NTP 2018 – 2029).
1.2 Knowledge gaps
The early adopters of BEVs have mostly been multi-vehicle owners (Figenbaum and Kolbenstvedt 2016, Figenbaum et al 2014). This group has had little challenges adapting to the range and charge time limitations of BEVs (Figenbaum and Kolbenstvedt 2015, 2016). To reach a target of only selling BEVs from 2025 (NTP 2018 – 2029), also single BEV households must start using BEVs at a large scale, and multi-vehicle households must replace all their vehicles with BEVs. There have been some indications that BEVs, being new cars driven by persons in larger families with children, often living in the outskirts of cities with longer distance to work, might drive their BEVs more than ICEVs are driven by their owners. The ICEV owners are however generally older, have older vehicles and less children, and are more often retired than current BEV owners (Figenbaum and Kolbenstvedt 2016, Figenbaum et al 2014), so that their driving needs are different. Newer vehicles are in general also driven more than older ones (Figenbaum 2018). There is thus a need to update the knowledge on BEV users continuously to find possible rebound effects, i.e. effects of a negative environmental character which hadn’t been found without BEVs. This is particularly important due to the normalization of BEVs in the population. BEVs are increasingly bought by the average vehicle buyer, whereas earlier buyers have been extensive vehicle users at the outset. A central question is thus: What are the prerequisites for further market adoption of BEVs in Norway, and how can this adoption take place while limiting negative impacts on other societal goals such as the target of limiting the vehicle based person transport growth in cities.
1.3 The ELAN project targets and research questions
The main purpose of the ELAN project is to develop enhanced and accurate knowledge on the diffusion of electric vehicles and on the innovations and strategies required to reach Norway’s ambitious national goals for the low emission society. Using state of the art research methods, the project monitors and take advantage of the extraordinary battery electric vehicle market development taking place in Norway. This report presents results generated in WP 2, the “Consumer knowledge lab”, which focuses on the development of knowledge of user and non-user attitudes, behaviour and characteristics over time. Such data are essential input for evaluating the potential for future adoption of BEVs and for improving and validating theories, frameworks and models of diffusion of the battery electric vehicle innovation in society at large. The research questions investigated and discussed in WP 2 are:
• What are the characteristics, attitudes, preferences, and travel behaviour, of BEV and ICEV users?
• How do they change over time? • Do changes in attitude and behaviour interact with BEV technology innovation,
incentives and policies?

Battery electric vehicle user experiences in Norway’s maturing market
Copyright © Institute of Transport Economics, 2019 3
• Which barriers and opportunities inhibit or support the development of increased uptake of BEVs?
• What will be impacts on the user’s mobility pattern and motoring practice? The answers of such questions are also important for our understanding of how a transformation to electric vehicles influence other environmental transport sector targets and possible rebound or side effects, which is the theme of ELAN WP5 “Side effects”. This report is thus also part of the work done in WP5. The report builds on a survey of BEV and ICEV owners carried out in June 2018.
1.4 Structure of the Report
Chapter 2 presents the survey method, questionnaire and the surveyed samples used in the analysis. Chapter 3 presents the socio-demographic characteristics of the survey samples. Chapters 3-9 covers the results of the surveys when it comes to buying behaviour, daily and long distance travel behaviour and changes to behaviour, use of and value of local incentives, and an analysis of the prospects for future buying behaviour. A discussion of the results and the conclusion of the study follows in chapter 10.

Battery electric vehicle user experiences in Norway’s maturing market
4 Copyright © Institute of Transport Economics, 2019
2 Method and Analysis
2.1 Theory
The theory of diffusion of innovations developed by Rogers (1962, 1995) seeing diffusion as a social process, will be used as the main theoretical baseline for explaining the development of the market and the factors influencing diffusion. Additional insights can be found by viewing individual and societal decisions in a multilevel perspective (Geels 2012, Figenbaum 2017a). A central concept of Rogers’ theory is the relative advantage of innovation over an existing practise. The relative advantage (or disadvantage) can be of economic, practical or organizational nature. A working paper developed in WP1 of the ELAN project (Figenbaum 2017b) and the analysis of the current Electromobility status in Norway (Figenbaum 2018), identified long distance driving and charging as the main remaining barriers to BEV adoption in the general population. These two topics directly link to Rogers’ theory as they influence how users view the relative advantage of BEVs vs ICEVs. Cost, a barrier to Electromobility in most areas of Europe, is not a barrier in Norway due to the generous Norwegian BEV incentives (an overview is provided in Figenbaum 2018) and the low cost of electricity compared to petrol and diesel (Figenbaum 2018). Furthermore, Figenbaum (2018) found that more than 75% of households park their vehicles on own land, including those that park in a dedicated parking spaces in common parking facilities, and will in most cases be able to charge their vehicle. Those parking in common facilities may however have some practical and technical challenges. The factors defining users at different stages in the diffusion process and the elements influencing the process according to Rogers’ theory, is described in further detail in Figenbaum and Kolbenstvedt (2015b), and for the Multi-level perspective in Figenbaum (2017a). These theoretical concepts are used as a basis to design a survey of users and non-users, and define relevant questions to these groups, so that one can better understand their needs, and identify possible barriers for further diffusion of BEVs in the general vehicle owning population. Figure 2.1 sum up crucial factors influencing user behaviour and adaptation.
Figure 2.1: Main factors influencing the diffusion process. Source: Figenbaum and Kolbenstvedt 2015a.

Battery electric vehicle user experiences in Norway’s maturing market
Copyright © Institute of Transport Economics, 2019 5
2.2 Methods and research design
The main purpose of ELAN WP 2 is to conduct national user and non-user online surveys to identify the characteristics and vehicle purchase motivations of actual and potential BEV buyers in 2018 and 2020. This report covers the results of the 2018 survey conducted by ELAN WP2 among BEV and ICEV owners. ICEV owners were surveyed both to provide a reference for the results, and primarily to understand an get deeper knowledge of the next generation of BEV owners. The survey was coordinated with the need to collect survey data for the analysis done in ELAN WP 3, WP4 and WP5. For WP 5 the main topic is to understand if a transition to BEVs will lead to unchanged or increased traffic volumes. Longitudinal charting of user characteristics and attitudes will be done by taking advantage of earlier TØI surveys of BEV users and non-users carried out in 2014, 2016 and 2018 (Figenbaum et al 2014 and Figenbaum and Kolbenstvedt 2016, Kolbenstvedt and Assum 2018). These surveys map a number of issues, such as patterns of use, the role and importance of incentives and use of other means of transport. The 2018 questionnaires contained many of the questions used in the earlier Norwegian BEV studies to allow for longitudinal studies. To evaluate the representativeness of the data sets, also user data from the national travel survey 2013/2014 (Hjorthol et al 2014) and register data from the national register of the BEV fleet retrieved from the Norwegian Public Roads Administration (NPRA 2018), will be used.
2.3 Data – samples of BEV– and ICEV owners
The data was gathered through online questionnaire surveys among members of the Norwegian Automobile Federation (NAF) and the Norwegian EV-Association (Elbilforeningen). While NAF represents all kinds of motor vehicles owners, the EV-association represents BEV-owners. By sampling from the member bases of these organizations, the plan was to get large enough samples to compare BEV-owners and ICEV-owners. The surveys were carried out in May (EV-Association) and June (NAF) 2018. Table 2.1 shows the gross and the net sample size as well the response rate.
Table 2.1: An overview of the sample. BEV-consumer survey 2018. The net samples contain both BEVs, PHEVs and ICEVs.
Recruitment base Brut sample Net sample Response rate Share of national fleet EV-Association 20 000 3594 18 % 2.2% of all BEVs NAF I 15 000 1395* 9,1% NAF II 9 000 869 9,6% NAF (total) 24000 2264 9,4 % 0.09% of all ICEVS
*25th of June 2018.
The samples were drawn randomly from the membership base of each organization, and each organization sent out an invitation letter by e-mail with a link to the survey (see attachment 1). A reminder was sent one week after the invitation letter was sent. Due to problems with the survey software, many respondents experienced problems when answering the first survey sent out by NAF (NAF I), which consequently resulted in few

Battery electric vehicle user experiences in Norway’s maturing market
6 Copyright © Institute of Transport Economics, 2019
responses. Hence, it was decided to send the survey (NAF II) out to another sample drawn from their membership base. The response rate of the second NAF survey (NAF II) was also low, but this is due to short time limit to respond: The survey was closed down one week after it was sent out and no reminder was submitted. The response rate of the EV-Association members is lower than in the 2016 (Figenbaum and Kolbenstvedt 2016) and 2014 (Figenbaum et al 2014) surveys, which had response rates of 19% and 22% respectively. The low response rate is in line with what is seen in other net based surveys in later years. Section 2.6 discusses the representativeness of the samples, and section 2.5 the number of respondents owning BEVs, PHEVs and ICEVs within each sample. The samples are in the analysis split by the type of vehicle they own and thus answered for, not by how they were recruited. The survey and the invitation letter were approved by the Norwegian Centre for Research Data (NSD).
2.4 The questionnaire
The survey had sections on socio-demography, vehicle usage on short and long distance travels and potential changes to travel patterns, use of and assessment of charging stations in different locations, opinions on BEV characteristics, advantage of local incentives, challenges with owning a BEV, reasons for buying the vehicle and future potential buying behavior, as seen in Table 2.2. Some of the questions were designed to be backwards compatible with earlier TØI surveys or to be compatible with surveys done in other countries. Compared to the 2016 and 2014 surveys a much larger focus was on the long distance driving and charging behavior. The focus of the survey in 2018 was on the households use of the vehicle(s).
Table 2.2: Survey topics and questions per sample, full list of questions in Appendix 2. Main topic Sample Questions Socio-demography BEV, ICEV Respondent: Age, gender, education, work status
Household characteristics: size, number of persons, children and driving license holders, house type and location, income
Daily travel BEV, ICEV Trip type frequencies, distance to work Changes to travel behavior BEV, ICEV Changes to households insured km, annual driving
and travel mode shifts Annual travel BEV, ICEV Total km insured for the vehicle Driving and charging on long distance trips
BEV Types of trips, frequency, distances, vacation and hut trips, charging during the trip, assessment of charging infrastructure
Reasons for buying the vehicle BEV, ICEV Main reason and user’s assessment of influencing factors
Value of and use of local incentives
BEV Cost savings: Toll roads, parking, ferry use Time savings: Use of bus lane, time to find parking
Charging frequency by location/type
BEV Normal charging: Home, office, public Fast chargers: Local, regional, long distance trips
Challenges with using BEVs BEV Range issues, frequency of avoided or aborted trips Vehicle equipment BEV, ICEV Need for four-wheel drive, tow hook, roof rack, bike
rack. Charging queues, range anxiety
BEV Frequency of queues, range anxiety frequency
Opinions about BEVs BEV, ICEV Assessment of technical, practical and societal factors
Future buying prospects BEV, ICEV Next vehicle to be bought, limiting factors, required equipment

Battery electric vehicle user experiences in Norway’s maturing market
Copyright © Institute of Transport Economics, 2019 7
2.5 Reporting by vehicle, not by person
At the very start of the questionnaire, respondents from both organizations were asked to answer the questions in the survey in relation to a BEV in the household. If they did not have a BEV in the household, they were asked to answer questions about the vehicle type, i.e. ICEV (including hybrids without a plug) or a PHEV, they do have. If several types of vehicles, they were asked to select one and to answer the questions in the survey related to that vehicle. The majority of those reporting for a BEV, stems from the sample from the EV-Association, while those reporting for an ICEV stems mostly from Norwegian Automobile Association, see Table 2.3.
Table 2.3: Overview of reporting by vehicle type in the different samples and in the overall sample. Type of vehicle EV-Association NAF (I and II) Total (N) % (N) % (N) BEV 3487 97 172 7,6 3659 PHEV 47 1,3 89 3,9 136 ICEV 59 1,6 1989 87,9 2048 No vehicle 1 0 14 0,6 15 Total 3594 100 2264 100 5858
However, having reported for a specific type of vehicle in the questionnaire, the respondents might also have other types of vehicles in the household. Based on reporting of other types of vehicle in the household, the share of different vehicles in the household by type of vehicle they reported for was calculated, as seen in Table 2.4. As expected, many of those having answered for one type of vehicle in the survey, also have access to other vehicles and also to other types of vehicles. The PHEV sample size was too small to be analyzed further.
Table 2.4: Overview of types of vehicles/combinations of vehicles available in households that responded for a BEV, and an ICEV. Percent. N=5683. Rounded. PHEV-respondents (N=103) and households without a vehicle have been excluded.
BEV ICEV N= Single BEV 28 1015 Multi BEV 5 183 BEV+ICEV/PHEV 67 3 2528 Single ICEV 53 1086 Multi ICEV (incl. PHEV) 44 902 Total 100 100 N= 3650 2033 5683
Very few of the ICEV-respondents, have a BEV in the household (3 percent). The BEV-respondents, however, are more likely to have more than one vehicle in the household than the ICEV-respondents (72 percent versus 44 percent). The multi vehicle owning share of BEV owners has however decreased from a 78-79 percent share in 2014/2016 (Figenbaum et al 2014, Figenbaum and Kolbenstvedt 2016). This indicates that BEVs are increasingly becoming an alternative for single-vehicle households, and an indication of a “normalization” of BEVs as an alternative vehicle option in the population.

Battery electric vehicle user experiences in Norway’s maturing market
8 Copyright © Institute of Transport Economics, 2019
2.6 Representativeness of the sample
In order to be able to compare the data on BEV and ICEV users, we need to explore whether the samples are representative for the entire population of BEV and ICEV users. In the following section, the socio-demographic characteristics, vehicle brand and geographical location of the samples of BEV and ICEV respondents are compared against other data. Table 2.5 shows differences in the respondent’s gender, age, education and work status, the number of children in the household and the household income, between ICEV and BEV owners in the national travel survey (RVU 2013/14, respondents in households that have one or more vehicles at their disposal), and in our sample of BEV and ICEV respondents (ELAN 2018). The primary purpose of the following analysis is to evaluate whether the ICEV-sample in the ELAN survey is representative for the entire population of ICEV-owners (measured by the RVU-sample of ICEV-owners). As for BEV-owners, the ELAN sample is likely to be more representative on a national basis than the BEV sample from the RVU. This is primarily related to the fact that all BEV buyers are automatically given a membership in the Norwegian EV association (Elbilforeningen), when buying their vehicle from a brand dealer, while only a small number of BEV-owners were interviewed for the RVU 2013/14. In the ELAN samples, there is an overrepresentation of male respondents compared to the RVU, this applies both for the ICEV and BEV respondents. This can most likely be explained by the fact that most vehicles are registered on the male in a typical household, and that this male person is likely also the person registered in the associations that the ELAN sample is drawn from (NAF 2018). The RVU sample is on the other hand a random sample containing a random person in a vehicle owning household. Hence, it is likely that more men than women have received the questionnaire of the ELAN survey. This is a minor problem, as the respondents are reporting on the households use of the vehicle, which also include the use of the vehicle by women (and children with driving licences) in the household. The respondents of ICEVs in the ELAN survey (drawn from NAF) are somewhat older, have somewhat lower education, fewer children in the household, and are to a greater degree retired than those in the RVU 2013/14. This is not surprising given that fact that NAF members are older than the population in general (NAF 2018), and it is well known that younger generations have higher educational levels than previous generations. In addition, the ELAN respondents for ICEVs have also somewhat lower household income than respondents in the RVU 2013/14, which can be explained by the higher share of retired respondents in the former than in the latter. The differences in socio-demographics will be accounted for when necessary in the analysis, especially when they might affect specific behaviours like daily trips. In 2016 some of the analysis was done on samples containing respondents that were working full-time, part-time or being self-employed owning 2011 and newer vehicles (Figenbaum and Kolbenstvedt 2016), which eliminated most of the sociodemographic biases in the sample, but reduced the ICEV sample size significantly.

Battery electric vehicle user experiences in Norway’s maturing market
Copyright © Institute of Transport Economics, 2019 9
Table 2.5: Gender, age, household income, education and work status among persons living in a household owning an ICEV or BEV in the national travel survey 2013/14 (18 years or older) and the ELAN sample (those reporting for an ICEV or a BEV vehicle). Percent.
RVU 2013/14
(ICEV in the household)*
RVU 2013/14 (BEV in the
household)**
ELAN 2018 (Responded for an ICEV)
ELAN 2018 (Responded for a BEV)
N= 47656 (weighted)
867 (weighted)
2033 3650
Gender Male 53 53 75 72 Female 47 47 25 28
Total 100 100 100 100 Age 18-24 10 10 1 1
25-34 16 16 4 10 35-44 19 31 10 21 45-54 19 28 19 31 55-66 19 12 32 28 67-74 9 2 26 8
75 år+ 8 1 9 2 Total 100 100 100 100
% of household with children (17 years or younger)
36 62 20 45
Household income 200 000 or less 3 1 1 0
200 000-399 999 9 3 8 2 400 000-599 999 16 5 23 8 600 000-799 999 16 10 19 11 800 000-999 999 17 19 18 19
1 000 000 and above 28 57 23 52 Don't know/don't want to answer 11 5 9 8
Total 100 100 100 100 Education Primary school 8 2 5 2
Secondary school 39 25 32 22 University/college lower degree 32 38 37 39
University/college higher degree 21 36 26 37 Total 100 100 100 100
Work status Employed (full/part time, self-employed) 66 85 57 85
Student 6 6 1 1 Retired 20 4 36 11
Social security recipient 5 3 5 2 Other 3 2 1 1 Total 100 100 100 100
*One or more ICEV vehicles in the household, but none BEV vehicles. **One or more BEV vehicles in the household, and might have other types of vehicles in the household as well.
2.6.1 Brand and type of vehicles among BEV-respondents compared to national statistics
Table 2.6 shows the distribution of different BEV brands in the ELAN sample and in the total Norwegian fleet. Statistics of the Norwegian fleet of BEV vehicles was acquired through the Norwegian Public Roads Administration.

Battery electric vehicle user experiences in Norway’s maturing market
10 Copyright © Institute of Transport Economics, 2019
Table 2.6: Distribution of type of brand (BEVs) in the ELAN sample and in the total Norwegian passenger vehicle fleet (01.01.2018). Percent.
National fleet
Share of national fleet
Number of respondents
Share of total respondents
Nissan Leaf 34632 24.8 % 683 19.6 % VW E-Golf 23455 16.8 % 655 18.8 % Tesla Model S 15560 11.2 % 302 8.7 % BWM i3 13825 9.9 % 429 12.3 % Kia Soul 10854 7.8 % 371 10.7 % VW E-Up 7787 5.6 % 105 3.0 % Renault Zoe 6485 4.6 % 187 5.4 % Tesla Model X 6200 4.4 % 192 5.5 % Mercedes B 4999 3.6 % 122 3.5 % Mitsubishi I-Miev 3634 2.6 % 53 1.5 % Hyundai Ioniq 2640 1.9 % 171 4.9 % Peugeot Ion 2529 1.8 % 27 0.8 % Citroën C-Zero 2316 1.7 % 37 1.1 % Nissan E-NV200 1191 0.9 % 26 0.8 % Opel Ampera-E 1122 0.8 % 83 2.4 % Ford Focus 964 0.7 % 0 0 % Think 593 0.4 % 3 0 % Smart fortwo 376 0.3 % 0 0 % Others 312 0.2 % 32 0.9 % Total 139474 100 % 3478 100 %
The table shows that there is a sufficiently representative distribution of brands in the ELAN samples when compared to that of the national fleet, when also taking into account the distribution of the size of vehicles (compact, small, minis, and large vehicles) as seen in Table 2.7, as the size of a vehicle determines to a large extent its potential usage pattern.
Table 2.7: Distribution of vehicle segments for BEVs in the ELAN sample and in the national fleet (01.01.2018).
National Norwegian Fleet ELAN BEV Sample Compact vehicles 59,4 % 62,3 % Small vehicles 18,0 % 19.1 % Minis 7.0 % 4,4 % Large vehicles 15.6 % 14.2 % Sum 100 % 100%
2.6.2 Geographical location of BEV-respondents compared to national statistics
In the national statistics of the BEV fleet retrieved from the Statistics Norway, there is data on the geographical location of the BEVs. Figure 2.2 shows that the geographical distribution in the sample (ELAN 2018) is fairly representative of the distribution of BEVs in the national fleet register, within some variation. Figure 2.2 also shows that the BEV fleet is much larger in the counties comprising large Norwegian cities, like Oslo, Akershus, Hordaland with Bergen, Rogaland with Stavanger and Trøndelag with Trondheim. It is also in these areas we find most toll roads, most free parking possibilities and advantage of the permission to use bus lanes. This pattern thus indicates the importance of local incentives.

Battery electric vehicle user experiences in Norway’s maturing market
Copyright © Institute of Transport Economics, 2019 11
Figure 2.2: Geographical location of BEVs in different Norwegian counties in the ELAN sample and in the national fleet (National vehicle register). Percent. NElanSample=3 478, NNationalFleet=139 474.

Battery electric vehicle user experiences in Norway’s maturing market
12 Copyright © Institute of Transport Economics, 2019
3 Socio-demographic characteristics of different BEV- owners
3.1 Changes in socio-demographics between 2016 and 2018
The BEV owners in the 2016 user survey had the typical characteristics of “early adopters” in the diffusion stage, as described in the theory of diffusion of innovations by Rogers (1995), such as being younger male workers with high education and living in larger households with higher incomes compared to ICEV owners (Figenbaum and Kolbenstvedt 2016). Comparing the ELAN data with the 2016 survey (Figenbaum and Kolbenstvedt) there are indications that BEV owners in 2018 are moving up in the diffusion process to the “early majority” of adopters (Rogers 1995), in the sense that they are becoming more similar to the majority of car owners. From 2016 to 2018, there has been an increase in the average age of BEV owners and in the share of female BEV owners, as shown in Table 3.1. Both changes are significant.
Table 3.1: Socio-demographical data on vehicle owner groups in Norway 2016 and 2018. Source: Figenbaum and Kolbenstvedt 2016, ELAN 2018.
BEV BEV ICEV ICEV 2016
(N=3111) 2018
(N=3659) 2016
(N=3018) 2018
(N=2048) Employed or self-employed 91 85** 67 57** Retired/Benefit recipient/Student 9 14** 33 42** Primary, secondary, high school (1-13th grade)
22 24 33 37**
Higher education up to 4 years 38 39 37 37 Higher education in excess of 4 years 40 37 29 26* Gender, male share of respondents 80 72** 78 75* Average age in years 47 51*** 56 59*** Average number of persons in household 3,17 2,95*** 2,5 2,3*** Share of households with children 56 45** 27 20** Multivehicle households 79 73** 52 50 Average distance to work in km1 25,5 25,4 18 18,7 Gross household income: 0 - 600 000 NOK
11
11
26
31**
600 001 - 1 000 000 NOK 36 30** 41 37** >1 000 000 NOK Do not want to report
47 6
52** 7*
24 9
23 9
**p<0,001, *p<0,005 (two-sided test). ***p<0,001 (t-test). No significant difference between 2016 and 2018 on unmarked variables. 1Respondents who are full- or part-time employed or self-employed.
In addition, households owning BEVs are getting smaller with a lower number of vehicles in the households: From 2016 to 2018 there were significant decreases in the average

Battery electric vehicle user experiences in Norway’s maturing market
Copyright © Institute of Transport Economics, 2019 13
number of persons in the household, in the share of households with children (<18 years) and in the share of multivehicle households. Moreover, there has been a significant increase in the share of people outside the workforce among BEV owners in the same period. Apparently, this change has not impacted the average income of the households, see Table 3.1, which shows that there has been a significant decrease from 2016 to 2018 in the share of BEV owners who has a household income of 600 000 -1 000 000 NOK and increase in the share of households with incomes above 1 000 000 NOK. Higher incomes can be explained by a higher average age among BEV owners, and also by a general income increase in society. However, the reverse tendency is to be found among ICEV owners. From 2016 to 2018, there has been a significant increase among ICEV owners that have a household income up to 600 000 NOK. This might be explained by an increase in the share of ICEV owners that are outside the workforce from 2016 to 2018, and the high share of retired persons (36 percent) among ICEV owners in 2018. In order to control for this, an analysis of household income has been conducted for only respondents that are within the workforce (full- or part-time employed or self-employed), see Table 3.2.
Table 3.2: Gross household income (1000 NOK) among BEV and ICEV owners that are full, part-time or self-employed in Norway 2016 and 2018. Percent. Source: Figenbaum and Kolbenstvedt 2016, ELAN 2018.
BEV 2016 (N=2612)
BEV 2018 (N=3143)
ICEV 2016 (N=1845)
ICEV 2018 (N=1164)
0-600 8 8 17 17 600-1000 35 27** 41 40 1000+ 52 58** 34 36 Do not want to report 5 7** 8 7
**p<0,001, *p<0,005 (two-sided test). No significant difference between 2016 and 2018 on unmarked variables.
When only looking at the respondents in the workforce, there are no significant change in household income among ICEV owners. However, there is still an increase in the share of households with more than 1 million in income among BEV owners from 2016 to 2018, which supports the finding from the previous analysis of all BEV owners (see Table 3.2) that there has been an increase in the share of high income households among BEV owners. Many of the changes in the sociodemographic characteristics (except for income) of the BEV owners from 2016 to 2018, can also be found among ICEV owners in the same period. However, as pointed out in section 2.6, the ICEV owners in the ELAN sample are probably not representative for the ICEV owners in the general population, as they tend to be older and with a higher share of retired respondents as compared to the RVU 2013/2014. This is also a fact confirmed by NAF (the Norwegian automobile organization, personal communication) and our sample of ICEV owners is also drawn from their member base.

Battery electric vehicle user experiences in Norway’s maturing market
14 Copyright © Institute of Transport Economics, 2019
3.2 Socio-demographic differences by vehicle ownership
The following section explores to which extent different types of vehicle ownership in the household differ by various socio-demographic characteristics. The type of vehicle ownership is here defined by the number of vehicles in the household, vehicle types and combination of vehicle types (see also Table 2.4 in section 2.5). In order to control for the age differences observed between ICEV- owners in the ELAN survey and the RVU survey (see section 2.6.1), the following analysis is based only on respondents that were full- or part-time employed or self-employed. In addition, only respondents who answered for a vehicle model (either ICEV or BEV) from 2011 or newer, are compared, as it was from this year respondents had a “real” choice between buying a BEV or an ICEV.
Table 3.3: Socio-demographic characteristics by different combinations of type of vehicle they own and the number of vehicles in the household. Percent. Respondents with full- or part-time work or self-employed and with car model 2011 or newer. ELAN 2018.
Single BEV
(N=823)
Multi BEV
(N=171)
Single ICEV
(N=281)
ICEV+other (not BEV) (N=329)
BEV+ other
(N=2169) Age Average age 45,7 48,2 53,3 54,3 49,5 Gender** Female 35 26 31 21 26 Type of household**
One adult 24 2 31 2 2
Two adults 28 31 40 54 32 With children <18years 44 59 25 30 53 More than two adults 5 8 4 15 14 Education** Primary/lower secondary
school (1-10th grade) 2 2 3 4 2
Upper secondary/High school (11-13th grade)
22 23 22 33 23
Higher education 1-4 years 35 45 41 42 40 Higher education >4 years 41 30 34 21 35 Household income**
0-400 000 3 1 3 1 1
401-800 000 36 7 39 19 9 801-1 200 000 34 32 33 46 41 More than 1 200 000 21 54 19 30 42 Do not want to report 6 5 7 5 7 Type of house**
Villa/singel house 32 74 48 80 76
Townhouse/Rowhouse 19 15 17 8 15 Apartment 47 11 34 10 8 Other 2 1 1 2 1 Location** Large city (Oslo, Bergen,
Trondheim, Stavanger, Drammen, Kristiansand)
59 42 40 17 33
Small city 17 19 27 27 24 Village 19 26 20 23 29 Rural area 5 13 13 34 14
**p<0,001 (chi-square test)
Table 3.3 shows that owners belonging to single BEV households are the youngest of all the different types of households. In addition, the single BEV households have the highest share of female owners and are also the ones with the highest share of 4 year or more of higher education. The single BEV households have also the highest share of respondents

Battery electric vehicle user experiences in Norway’s maturing market
Copyright © Institute of Transport Economics, 2019 15
living in the larger cities (59 percent) and living in apartments (47 percent) compared to any of the other type of households. Together with the single ICEV households, the single BEV households have the largest shares of one person households (respectively 31 and 24 percent). Smaller household together with age (BEV; younger, ICEV; older) are factors that probably can explain the lower household income among single vehicle type households. The BEV households with multiple vehicles (either with only BEVs or at least one BEV) stands out from multi vehicle households without a BEV in terms of size of the household; Multivehicle households with a BEV have a higher share of households with children (18 years or younger). In addition, while the majority of multivehicle households with a BEV live in smaller or larger cities, the majority of multivehicle households without a BEV live in rural areas or villages. In general, the multivehicle households with a BEV are younger, have more female owners, are slightly more educated and have a little higher income than the multivehicle households without a BEV. The major difference between the multi BEV households without any other vehicle types and the multi BEV households that also have other vehicles types, is the income level. The share of households with household income higher than 1.2 mill NOK is significantly (p<0,001, two-sided test) higher among multi BEV households without any other vehicle types compared to multi BEV households that also have other vehicle types (54 versus 42 percent).

Battery electric vehicle user experiences in Norway’s maturing market
16 Copyright © Institute of Transport Economics, 2019
4 Buying the vehicle
This chapter looks at the reasons people have for choosing a vehicle and how they rate the importance of various factors involved in the purchase decision.
4.1 Reasons for buying the vehicle
The respondents were first asked whether they bought a new or a used vehicle. 86 percent of the BEV owners and 44 percent of the ICEV owners reported having bought a new vehicle. These are exactly the same shares that were reported in the Norwegian Plug in Electric Vehicle (PEV) consumer survey in 2016 (Figenbaum and Kolbenstvedt 2016). The respondents were also asked “Which of the following factors describes your choice of type of vehicle best?” The respondents could in this question only select one factor. As BEVs did not get into the market before 2011, the analysis of motives of ICEV owners is presented separately for owners of 2011 and newer year model vehicles. Figure 4.1 shows how the BEV and ICEV owners answered to this question.
Figure 4.1: Main factor describing the choice of type of vehicle among BEV and ICEVtotal sample and ICEV2011+ owners. Only one factor could be selected. Percent.
There were only minor differences in the motivation for buying that type of vehicle between the total sample of ICEV owners and the ICEV owners of models from 2011 and newer. As for BEV and ICEV owners (total), there were significant differences in how they responded to this question. For BEV owners, the primary factors behind their choice of vehicle were economical aspects within the household, while the ICEV owner’s choice was
2
56
11
2
18
7
5
3
9
38
15
1
3
32
2
8
36
17
2
3
33
0 10 20 30 40 50 60
Other/don't know
Economy within the household
Practical car
Safety concerns
Environmental concerns
Technological interest
Reliability
ICEV 2011 or newer (N=1176) ICEV (N=2048) BEV (N=3659)

Battery electric vehicle user experiences in Norway’s maturing market
Copyright © Institute of Transport Economics, 2019 17
more related to the need for a practical and reliable vehicle. In addition, environmental concerns were more important to the BEV owners than the ICEV owners (total), while the situation is reversed when it comes to safety concerns. The respondents were also asked to evaluate (on a 5-point scale from no importance to crucial importance) how important different characteristics of the vehicle were for their choice of that specific vehicle. The results are presented in in Figure 4.2.
Figure 4.2: Importance (“great” or “crucial”) of different aspects of the vehicle for buying that specific vehicle among BEV and ICEV2011+ owners. Percent. Sorted according to highest-lowest share among BEV owners.
Top speed and acceleration capabilities were the least important attributes for buying a vehicle in both groups. BEV owners tended to attribute less importance to the given aspects and characteristics of the vehicle than the ICEV owners. Figure 4.2 shows that BEV owners attributed the greatest importance (“great” or “crucial”) to aspects such as reliability, driving abilities, driving range, energy costs and purchase price. Reliability and driving abilities were also among the aspects that were attributed greatest importance among ICEV owners, but compared to the BEV owners they attributed much greater importance to aspects such as safety, driving comfort and the size of the vehicle and the trunk size than BEV owners did. BEV owners attributed greater importance to driving range, energy costs and environmental influence than the ICEV owner’s did. All mentioned differences are significant (p<0,001).
75
64
64
61
60
58
51
50
49
39
37
37
36
30
28
24
14
5
93
84
51
39
63
78
24
46
80
70
46
36
34
24
44
38
20
6
0 10 20 30 40 50 60 70 80 90 100
Reliability
Driving abilities
Driving range
Energy costs
Purchase price
Driving comfort
Environmental concerns
Fuel costs
Safety
Size of the car and trunk
Interior equipment
Advanced technology
Image/design/look
Time to fuel (electricity/gazoline/diesel)
Brand
Easy to resale as a used car
Acceleration abilities
Top speed
ICEV 2011 or newer (N=1176) BEV (N=3653)

Battery electric vehicle user experiences in Norway’s maturing market
18 Copyright © Institute of Transport Economics, 2019
Symbolic and luxury features, such as brand, image/design, advanced technology, and interior equipment, were not rated highly by any of the type of owners, but ICEV owners tended to attribute more importance to brand and interior equipment than the BEV owners did. They were also more concerned about the resale value of the vehicle. To sum up, both type of owners put the highest value to the reliability of the vehicle, its driving abilities and purchase price. The ICEV owners tended to value more traditional vehicle features (comfort, safety, size as well as symbolic and luxury features) than the BEV owners, while the BEV owners on their part, put greater value to new features specifically related to electric vehicles (driving range, energy costs and environmental influence).
4.2 Other factors of importance for buying an e-vehicle
To capture the importance of various incentives, the BEV-owners were also asked about other factors that might be of importance for their buying of a new vehicle, and in this case, the BEV in question. They could range their answers to each factor on a 5-point scale from no importance to crucial importance. The same question was posed in the 2016 PEV consumer survey. In 2016, the respondents could range their answers to the same factors, but on a different scale: no importance, some importance and great importance. Figure 4.3 shows the share of BEV-owners that reported that a factor was either of “great” or “crucial” importance in 2016 and 2018. Note that the registration tax exemption and the exemption from the VAT are not included in the questions. The reason is that these two tax exemptions are embedded into the vehicle purchase price so that they are non-transparent to the buyers. Purchase price was a main parameter discussed in Section 4.1.
Figure 4.3: Share of BEV-owners (2011 models or newer) that reported that a factor was “great” or “crucial” importance for buying the electric vehicle in question in 2018 and “great” importance in 2016. BEV owners in 2016 and 2018. Percent. The “don’t know”-category is excluded from the analysis. **p<0,001 (two-sided test).
The two incentives that were rated as most important were “Exemption from toll road charges” and “Reduced annual tax”. There was a substantial and significant increase between 2016 to 2018 in the share who rated “exemption from road toll charges” as being of “great” or “crucial importance” for buying the electric vehicle. This increase can most likely be explained by an increase in the toll road prices several places throughout the country over the period. In Oslo, there was for instance a 38 % price increase in the toll roads between the 2016 and the 2018 surveys outside of rush hours, whereas the increase
63
49
25
24
20
16
12
8
50
49
19
25
23
17
7
30
0 10 20 30 40 50 60 70
Exemption from road toll charges**
Reduced annual tax/insurance
Access to bus lane**
Free/cheaper parking/public charging
Access to charging at work**
Preferred brand sold BEV
Reduced rate on ferries**
Reduced imposed benefit tax**
2016 (N=3111) 2018 (N=3653)

Battery electric vehicle user experiences in Norway’s maturing market
Copyright © Institute of Transport Economics, 2019 19
was 53 % during the rush hours (Fjellinjen 2019). There were also significant increases in the same period in the shares who reported that “access to bus lanes” and “reduced ferry rates” were of “great/crucial” importance for buying the vehicle. The greater importance of bus lanes is a puzzle as restrictions on that access applies in more and more locations due to the increase in the BEV fleets. A small, but statistically significant decrease was observed for the importance attributed to “access to charging at work”. A reason for this change could be that BEVs in 2018 had on average longer range than BEVs had in 2016. The importance attributed to “reduced imposed benefit tax” for company vehicles was reduced significantly, from 30 percent rating this as “great/crucial” in 2016 to 8 percent in 2018. This decrease might be explained by the fact that this tax benefit for company vehicles was reduced in 2018.
4.3 Additional vehicle or replacement of a vehicle?
More ICEV-owners than BEV-owners reported that the vehicle in question replaced another vehicle, 91 versus 80 percent (owners of 2011 models or newer), which indicate that BEV-owners to a larger degree bought an additional vehicle or their first vehicle. As seen in chapter 2.6, the BEV-owners were younger than the ICEV-owners, and hence in an age-group where it is more common to buy the first and thus an additional vehicle. The reasons can be different life transitions such as getting larger families, children, moving to larger living places in the outskirts, and thus possibly getting longer distances to work etc. Among those who reported having replaced the vehicle (N=4771), 92 percent report that the vehicle in question replaced an ICEV. There were no significant difference between BEV- and ICEV-owners regarding this question. The respondents who said they had bought an additional vehicle, received a follow-up question: “Was the acquisition of an additional vehicle in the household influenced by any of the following reasons?”. The respondents could report the two most important reasons. Figure 4.4 shows how the respondents answered to this question, and the differences between BEV- and ICEV-owners (both owners of 2011 or newer year model vehicles).

Battery electric vehicle user experiences in Norway’s maturing market
20 Copyright © Institute of Transport Economics, 2019
Figure 4.4: Share of respondents that report a given reason for acquiring another vehicle to the household, BEV-owners and ICEV-owners (both 2011 models or newer)/those who had bought an additional vehicle to the household. Percent. BEV- and ICEV-owners (both 2011 models or newer). **p<0,001, *p<0,005 (two-sided test). The respondents could report the two most important factors.
BEV-owners tended to report to a larger degree reasons for buying an extra vehicle that were related to changes in the household that could lead to changes in travel needs (for example due to children started in kindergarten or at school), compared to what ICEV-owners did, as well as changes in location of the household’s residence. The differences observed are significant. The fact that these types of changes are more frequently presented as reasons for buying an additional vehicle among BEV-owners than ICEV owners might again relate to their younger age than the ICEV-owners, and that they are entering a new life phase with growing transport needs. The ICEV-owners, on their part, reported to a larger degree than the BEV-owners that the “public transport offer” is too poor (frequency, comfort etc.)” and “other reasons” that were not given in the alternatives. These differences are significant. There was no significant difference between households with and without children when it comes to this question (but the number of respondents was low, in particular for ICEV owners). When looking only at vehicle owners living in large cities, there was no significant difference between these owner groups. BEV owners tends to live in and around cities. This means that even though they may live in a rural area outside of a city, their public transport offer could be better than that of an average ICEV owner living in a general rural area. The data does show that for rural ICEV owners poor public transport is a more important reason for buying an extra vehicle than it is for rural BEV owners. The greatest difference between BEV and ICEV-respondents in the reason for buying the vehicle was the “wish to use another vehicle less”, which was stated by 37 percent of the BEV owners. Only 7 percent reported this as a reason among the ICEV-owners. The difference is significant and about the same as in the 2016 survey (for responses in 2016 on reasons to buy an additional vehicle, see Figure A4.1 in appendix 3). The tendency to report this reason was significantly greater (45 percent) among households holding a BEV
4
10
13
19
20
23
34
37
4
11
8
11
39
34
32
7
0 5 10 15 20 25 30 35 40 45
The household has grown in members
The number of driving licenses has increased
The travel needs of the household has changed,f ex children started in kindergarten or school**
The household has changed location**
Other reasons**
The public transport supply is too poor(frequency, comfort etc)**
It is timesaving to travel by car
Wish to use another car in the household less**
ICEV 2018 (N=208) BEV 2018 (N=675)

Battery electric vehicle user experiences in Norway’s maturing market
Copyright © Institute of Transport Economics, 2019 21
in addition to another vehicle type (non BEV) than among multi-BEV households (14 percent) or multi-ICEV households (14 percent) (two-sided tests). As seen in the previous chapters, this might relate either to economic and/or environmental reasons. Moreover, bivariate analysis shows that there was a positive and significant and positive association between household income and having answered “wish to use another vehicle in the household less” among BEV-respondents, as seen in Table 4.1. Those with higher income more often rated this as a reason for buying the extra vehicle. This probably indicates that having two vehicles or more in the household requires higher household income.
Table 4.1: Association between “Wish to use another vehicle less” and household income. BEV-owners who has bought an additional vehicle (non-replacers). Percent. N=679.
NOK 201 000-400 000
NOK 401 000-600 000
NOK 601 000-800 000
NOK 801 000- 1
000 000
NOK 1 001 000-1 200 000
Above NOK 1 201 000
Do not wish to report
No 81 84 69 66 61 55 75 Yes 19 16 31 34 39 45 25 Total 100 100 100 100 100 100 100 N= 21 38 62 136 123 248 51
*p<0,001 (chi square-test)
4.4 Need for roof rack, tow hook, 4WD
Four-wheel drive is popular in Norway due to the combination of harsh winters with snowy and icy roads and a hilly and mountainous landscape. The stated need to have a vehicle with four-wheel drive in the household was smaller among BEV owners than ICEV owners, as seen in Figure 4.5. Norwegians also tend to buy vehicles for multipurpose use. Tow hooks and roof racks/ski boxes and bike carriers are therefore commonly mounted on vehicles. The differences between BEV owners and ICEV owners was fairly small when it comes to the stated needs for these types of equipment, but more ICEV-owners than BEV owners said that the household need a tow hook, while fewer said that they need to mount something on the roof than among BEV owners.
Figure 4.5: The need for four-wheel drive, tow hook, roof rack/ski box and ability to transport skis among BEV and ICEV owners. Four-wheel drive: NBEV=3572, NICEV=2008. Tow hook: NBEV=3611, NICEV=2029. Roof rack: NBEV=3554, NICEV=1988. Bike carrier: NBEV=3556, NICEV=1984. Percent. ELAN 2018.

Battery electric vehicle user experiences in Norway’s maturing market
22 Copyright © Institute of Transport Economics, 2019
BEVs have various limitations when it comes to these items, such as tow hooks most often not being an available option, or that limited number of models are certified to carry a roof rack. BEV owners seemed to take that disadvantage into account when answering questions about the need for these options. Note that the household’s transportation needs are the focus of the question. The need could be met by another household vehicle than a BEV, which could partially explain the relatively small differences. The high share that said they need a vehicle with a tow hook, leads to the conclusion that BEVs will have to be able to be fitted with tow hooks if BEVs are to replace all ICEVs in Norwegian households. Roof rack is less conclusive. Many vehicles also have a small hatch between the passenger compartment and the trunk area to make it possible to transport skis inside the vehicle. Transporting goods on the roof, towing a trailer, or transporting bikes over longer distances, will reduce range substantially and make the use of BEVs more cumbersome on such trips (Figenbaum 2018). That means that even if these types of equipment becomes available on BEVs, part of the barrier against purchasing a BEV due to needs to transport things on the roof or in a trailer might still be in place.

Battery electric vehicle user experiences in Norway’s maturing market
Copyright © Institute of Transport Economics, 2019 23
5 Daily travels and charging
5.1 Daily travels
In the analyses of daily travels, people who are employed (full-, part-time or self-employed), are the focus of the analysis to get a reasonable comparison of trip type distribution between comparable groups, as the ICEV groups contain a larger share of retired people.
5.1.1 Frequency of commuting and work related trips Figure 5.1 shows the frequency of use of BEVs and ICEV in the households for commuting trips (to and from work) and for work related trips. It can be seen that the BEV was used much more frequently to and from work than the ICEV, in total and for both multi-vehicle and single vehicle households. Multi-vehicle households in general use vehicles more often to drive to work than single-vehicle owners, which is not surprising as commuting is an important factor for buying a second car in a household. It is also not surprising that BEVs are used more often than ICEVs for commuting as the marginal cost of use is much lower due to the lower energy cost and the exemption from road tolls (Figenbaum 2018). It is also for commuting that the access to bus lanes has the highest value as these trips are done at peak travel times.
Figure 5.1: Trip frequency to work and work related trips among BEV- and ICEV-respondents (total and single and multi-vehicle owners) that are employed or self-employed (BEV Multi includes those that own a BEV and another vehicle of any type). Percent.

Battery electric vehicle user experiences in Norway’s maturing market
24 Copyright © Institute of Transport Economics, 2019
On the average, BEVs were used for longer trips than ICEVs, both in distance and time. While the trips to work for the BEVs in question (N=2895) in general were 26 km long and took 28 minutes, the trips for the ICEVs in question (N=895) were 20 km long and took on average 22 minutes. These differences are significant (p<0,001, t-test), but include also users with very long distances to work, which would be out of reach for daily commuting. The distance and time spent for trips to go to work have therefore been recalculated in Table 5.1, restricting the maximum distance to 150 km and the maximum time to 120 minutes. These values have been chosen to capture distances and times that are judged to be within reach for daily commutes. The distance to work can also be a proxy for the perceived competitiveness of public transport. Longer distances mean that the likelihood of having to change from one public transport unit to another increases, and the time used compared to driving is likely higher the longer the distance is. The results show that BEV owners consistently drove longer distances to get to work than ICEV owners did. For instance, did half of BEV owners drive more than 19 km to get to work, whereas as for ICEV owners that number was 11 km. The 20% with the longest distances, drove more than 39 km if they were a BEV owner and more than 29 km if they were an ICEV owner.
Table 5.1: Distances and length of trips to commute to work among BEV and ICEV owners. Distances over 150 km and 120 minutes are left out, because they are too long for daily commutes. ELAN 2018.
Km Minutes BEV (N=2882) ICEV (N=890) BEV (N=2880) ICEV (N=889) Average 25 19 27 20 10 percentile 5 2 9 5 20 percentile 8 4 13 9 Median 19 11 20 15 80 percentile 39 29 37 30 90 percentile 52 44 48 42
There are many economic and temporal advantages for BEV owners if they use a BEV instead of an ICEV on travels to work, for example exemptions from road toll charges and access to the bus lanes, and drastically reduced energy costs. The longer the distance is to work the larger are the potential benefits of using a BEV instead of an ICEV, which could explain the differences in frequency of use, distance and time use related to work trips between BEV owners and ICEV owners. Although few of the vehicles in the samples were used for work related trips, BEVs are used more frequently on these trips than ICEVs. The difference is significant (p<0,001, two-sided test).
5.2 Other daily trips
The BEVs were also used more frequently than ICEVs on other types of daily trips, such as escorting children, travels to own leisure activities, visits and shopping, as shown in Figure 5.2. Again this might be explained by the different advantages related to an electric vehicle (economic, temporal, parking etc.), but it might also relate to differences in travel needs between the BEV and ICEV owners due to household differences.

Battery electric vehicle user experiences in Norway’s maturing market
Copyright © Institute of Transport Economics, 2019 25
Figure 5.2: Trip frequency where the purpose is escorting children, own leisure activities, visits, and shopping among BEV- and ICEV-respondents. Percent. “Don’t know” is excluded. Only employed respondents (full-or part-time or self-employed).
5.3 Daily charging and electricity connections used
The following analysis of charging and electricity connections used, are based on responses from the full sample of BEV owners, and not limited to those that are employed.
5.3.1 Daily charging Most of the BEV-respondents could charge at home, as seen in Figure 5.3. 80 percent of BEV owners charged 3 times or more per week in the garage or in their own parking lot at home, which was the same as in 2016 (Figenbaum and Kolbenstvedt 2016, page 34). As Figure 5.3 shows, only about 3 percent reported that they charged in the street at home weekly or more often, and most respondents reported that they never do this (88 percent). These user shares were also similar to the 2016 survey (Figenbaum and Kolbenstvedt 2016). 18 percent reported that they charged three times or more per week at the workplace, and 27 percent reported that they did this on a weekly basis. There was a decrease in the share who reported that they charged at the workplace compared to 2016. In 2016, 28 percent reported that they charged at the workplace three times or more during a week, and 38 percent reported that they did this on a weekly basis (1 times or more during a week). The differences are significant (p<0,001, two-sided test). There are two potential explanations for this decrease. The average range for BEVs in the fleet increased between 2016 and 2018, which should lead to less needs for charging at work, and the installation of chargers in workplaces are potentially not keeping up with the increased BEV fleet.
177 14 7 12 6
2211
13
6
169
86
28
25
18
14
40
33
49
43
4452
5273
3151
3145
6 12
0%10%20%30%40%50%60%70%80%90%
100%
BEV ICEV BEV ICEV BEV ICEV BEV ICEV
Escorting children Own leisure Visits Shopping
4 times+/week 3-4 times/week 1-2 times/week Monthly or more seldom

Battery electric vehicle user experiences in Norway’s maturing market
26 Copyright © Institute of Transport Economics, 2019
Figure 5.3: Charging frequency in the garage/parking lot at home, in the street at home, at the workplace and at available public facilities elsewhere among BEV-respondents. Percent. N=3659.
Moreover, Figure 5.3 also shows that few respondents reported using available public chargers. Only 13 percent report used them on a weekly basis (1 times or more per week). Those that said they never or rarer than monthly charge at home, seemed to rely on a mix of workplace and public chargers, while fewer charged on-street, as seen in Figure 5.4. The average number of charges per week of this group was 4.3, of which about 53 percent took place at work, 29 percent at public chargers and 18 percent on street.
Figure 5.4: Charge location for those that cannot charge at home (on own land or parking spot). Percent.
Charging behavior, at least when it comes to the location of charging, was not surprisingly closely related to the type of housing the respondents resided in. Figure 5.5 shows the share among BEV-respondents who reported that they charged one time or more during a week in the garage/private parking lot at home, on the street at home, at the workplace or at available public facilities, by the type of house they live in. The results show that there is a significant and positive relation between the degree of charging in the garage/private parking lot and how detached the residence of the respondent is (counting from apartment to row house/town house to detached house/villa). The opposite and significant
45
7
25
11
3
18
9
9
3
2
922
2
6
14
41
7
88
50
26
0.0 %
20.0 %
40.0 %
60.0 %
80.0 %
100.0 %
Garage In the street(home)
Workplace Available publicfacilities
Daily 3-5 times/week 1-2 times/week
1-2 times/month More seldom Never

Battery electric vehicle user experiences in Norway’s maturing market
Copyright © Institute of Transport Economics, 2019 27
associations are seen for apartment residences where owners tended to charge more in the street at home and at available public facilities. As for charging at the workplace, there were no significant correlation between frequency of charging and the type of residence. It is however possible that those who cannot charge at home rely on charging at work whereas some of the owners with home charging access charge at work without actually having the need to do so.
Figure 5.5: Charging one time or more during a week in a garage/private parking lot at home, in the street at home, at the workplace, and at available public facilities elsewhere. Percent. BEV-respondents. **p<0,001 (chi-square test).
5.4 Electricity connections used
The type of electricity connection is relevant for the safety of the charging process. New installations are required to have a dedicated socket and line with a specific fuse and ground fault detection unit installed in the fuse box or in the form of a home charger (Figenbaum 2018). The home charger units (also called “wallbox”) have built in ground fault detection and circuit breakers and are connected to the fuse box with a dedicated power line and fused separately. Using an ordinary domestic socket over time can pose a fire risk and should be avoided, and it is no longer allowed for new installations. The BEV-respondents were asked which type of electricity connection they used when charging their vehicle. The results shown in Figure 5.6 shows that the most common electricity connection was a home charger station, either with 16A (3.7 kW) or 32A (7-22 kW), which was used by 43 percent. About one third of the respondents used an ordinary socket when charging their vehicle. 20 percent charge their vehicle used a dedicated socket (with proper fuse) for the vehicle cable. In 2016, 24 percent used a home charger, 67 percent a domestic socket and 9 percent used other connections1. The share of owners using home chargers (“wallbox”) thus increased substantially between 2016 and 2018, which is positive from a charging safety point of view. It also increases the likelihood of
1 Unpublished, the survey is documented in Figenbaum and Kolbenstvedt 2016. Only the category home charger is directly comparable as it might be possible to interpret “dedicated socket” to be a socket only used for charging the BEV, whereas the intention of the question was a socket specifically installed for BEV-charging.
96
2
26
8
85
5
27
14
65
10
33
23
82
6
31
18
0 10 20 30 40 50 60 70 80 90 100
Garage/private parking lot (at home)**
In the street (at home)**
Workplace
Available public facilities**
Other (N=49) Apartment (N=741)
Row house/town house (N=574) Detached house (N=2282)

Battery electric vehicle user experiences in Norway’s maturing market
28 Copyright © Institute of Transport Economics, 2019
continuing the adoption of BEVs in the household, as the investment can be in the order of 1,000-1,500 Euros.
Figure 5.6: Type of electricity connection used for charging among BEV-respondents in 2018. Ordinary socket=household socket outdoor or in garage, Home charger is an EVSE with built in ground fault protection and circuit breaker. Other connection can be industrial socket type. Percent. N=3512.
There was no great difference in type of electricity connection being used between the type of housing/degree of detachment as shown in Table 5.2. There was however a smaller share among those living in apartments that reported that they used an ordinary socket than those living in detached houses or row houses/town houses. The differences are significant (p<0,001, two-sided test). The reason is likely that the boards of the apartment buildings have to approve the charging solution used in the common parking facility, and that they therefore require that safe solutions are used. 71.5% of the apartment owners in 2016 charged at home with the cable coming with the vehicle using an ordinary socket2, whereas only 21.1% used a home charger station.
Table 5.2: Type of electricity connection used for charging by type of housing, ELAN 2018. Percent. Detached
house Row house/ town house
Apartment Other type of housing
Ordinary socket 36 37 26 35 Dedicated socket (with proper fuse) for the vehicle cable
19 19 21 29
Home charger station 16A (3.7 Kw) 23 27 23 9 Home charger station 32A (7-22 Kw) 21 15 20 27 Other connection 1 1 2 0 Don't know 0 1 8 0 Total 100 100 100 100 N= 2275 549 629 48
The type of electricity connection also varied by brand of the vehicle, as shown in Table 5.3. For some brands, the numbers of respondents were very low. Hence, in the analysis, it was only explored whether there are significant differences in the type of electricity connection between brands that had more than a hundred respondents.
2 The questions were not equal. That response in 2016 corresponds best with the sum of line one and line two of table 5.2.
35
20
23
20
1 2 Ordinary socket
Dedicated socket (with proper fuse) for thecar cableHome charger station 16A (3,4 Kw)
Home charger station 32A (7-22 Kw)
Other connection
Don't know

Battery electric vehicle user experiences in Norway’s maturing market
Copyright © Institute of Transport Economics, 2019 29
Table 5.3: Type of electricity connection by brand of the vehicle. Percent. Brands that have been compared with the average type of electricity connection in the sample of BEV-respondents, are outlined in bold. The figures outlined in bold for each brand are the basis used for comparison.
Ordinary socket
Dedicated socket (with proper fuse)
for the vehicle cable
Home charger
station 16A (3.7 Kw)
Home charger
station 32A (7-22 Kw)
Other connec-
tion
Don't know
Total N=
BMW i3 n.s. 36 20 20 21 1 3 100 432 Citroën C-Zero 67 15 10 5 0 3 100 39 Hyundai Ioniq* 27 17 29 22 2 3 100 170 Kia Soul* 41 20 19 17 1 3 100 370 Mercedes Bn.s. 42 16 27 13 2 0 100 122 Mitsubishi I-Miev 55 34 8 4 0 0 100 53 Nissan E-NV200 58 15 19 4 0 4 100 26 Nissan Leaf** 41 24 19 13 1 2 100 681 Opel Ampera-E 30 17 22 28 2 1 100 83 Peugeot Ion 59 33 0 7 0 0 100 27 Renault Zoe** 13 12 51 22 0 3 100 192 Tesla Model S** 21 19 17 38 3 3 100 307 Tesla Model X** 28 12 17 41 2 1 100 195 Think 33 67 0 0 0 0 100 3 VW E-Golf** 32 19 31 17 1 2 100 659 VW E-Up* 45 20 21 12 1 1 100 113 Other BEV 47 28 19 3 0 3 100 32 Total 35 20 23 20 1 2 100 3504
*p<0,010, **p<0,001, n.s.=not significant. (two-sided tests)
The share who reported using a 16A home charger station was the greatest among Renault Zoe owners compared with all other brands (51 percent against 23 among BEV owners in general), and they were the least likely, together with the Tesla X respondents to use a dedicated socket for charging ( both 12 percent against 20 percent). The main reason for the high share of Renault owners using a home charger is that the vehicle often is sold with a home charger installation included with the purchase. The reason is that the Zoe has a technical solution that make charging from some Norwegian household sockets impossible without using a specific home charger unit. Using a home charging station 32A was much more common among Tesla respondents, both Model S and Model X owners, than other respondents (38 and 41 against 20 percent). There was not much difference between VW E-Golf-respondents and respondents of other brands except for the former using somewhat more 16A home chargers compared to the BEV owners in general (31 against 23 percent). The respondents using an ordinary socket for electricity connection was the highest among owners of the smallest vehicles (Mitsubishi I-Miev, Citroën C-Zero, Peugeot Ion, VW E-Up), and these were also the least likely to have a home charger unit. The share using an ordinary socket was also higher among Kia Soul, Mercedes B, Nissan Leaf and E-NV200 owners compared to the sample as a whole (41, 42, 41 and 58 against 35 percent). Nissan Leaf-respondents were the least likely to use a home charger station of the compact and larger vehicles, when looking at both 16A and 32A combined. Respondents with a Hyundai Ioniq were somewhat more likely to use a home charger station (either 16A or 32A) than the average BEV user (51 against 43 percent). All mentioned differences above are significant.

Battery electric vehicle user experiences in Norway’s maturing market
30 Copyright © Institute of Transport Economics, 2019
Respondents with a BMW i3 did not vary from the sample as a whole in type of electricity connection used. The analysis of fast charger use in chapter 6 shows that fast charging also supports local travels but is mainly used for travels elsewhere (other municipalities, long distance driving).

Battery electric vehicle user experiences in Norway’s maturing market
Copyright © Institute of Transport Economics, 2019 31
6 Long distance driving and charging behaviour
The user survey contained a number of questions on long distance travel both for BEV and ICEV owners, and on BEV owners use and perception of the fast charger infrastructure on these trips. The goal was to achieve a better understanding on how BEVs and ICEVs are used on long distance trips, especially on peak travel days, and how the network of fast chargers can assist users long distance travel.
6.1 Frequency of vacation trips
It was shown in chapter 5, that a BEV in 2018 was used more frequently than an ICEV for daily trips. On vacation trips, however, the ICEV was used more frequently than the BEV, as seen in Figure 6.1. This might indicate that BEV-owners still experienced challenges related to vacation trips, or that the BEV has a different transportation role in the household. The Figure shows that there was a larger share of the BEVs that were never used on vacation trips (27 percent) than the ICEVs (5 percent). The Figure also shows that there is a large difference between the use of BEVs and the ICEVs for vacations with frequency less often than monthly3.
Figure 6.1: Trip frequency where the purpose is vacation among BEV- and ICEV-respondents that are employed or self-employed. Percent. “Don’t know” category is excluded.
However, compared to the responses given in the 2016 survey (Figenbaum and Kolbenstvedt 2016), the share of BEVs never used for vacation purposes decreased from 37 percent in 2016 to 27 percent in 2018. The decrease was significant (p<0,001, two-sided test). Longer range BEVs came into the fleet between these two years, which might explain the larger share of BEVs used for vacation trips.
3 The question was part of the set of questions for daily travels, hence daily was a response alternative.
5 1 317
4827
6 2 419
65
50
50
100
4 times+/week 3-4 times/week 1-2 times/week Monthly Less thanmonthly
NeverBEV (N=3024) ICEV (N=1150)

Battery electric vehicle user experiences in Norway’s maturing market
32 Copyright © Institute of Transport Economics, 2019
6.2 Characteristics of long distance travel
A higher share of ICEV owners than BEV owners said in 2018 that the household go on long distance trips (the question related to all long distance travel regardless of means of transportation). This was the case for all trip length intervals, apart from the interval 100-199 km where BEV owners had more trips, as seen in Figure 6.2. The biggest difference was for the longest trips above 300 km, where the share of users that said they never do trips above 300 km was 40 percent among BEV owners and 22 percent among ICEV owners4. But the average number of these trips was very small as seen in Figure 6.3, in total and per county, and the average number of trips was similar for BEV and ICEV owners.
Figure 6.2: Share of BEV owners (N=3487) and ICEV owners (N=2048) doing long distance trips (regardless of means of transportation) per year per distance interval (irrespective of means of transport). ELAN user survey May/June 2018. Percent.
Figure 6.3: Number of long distance trips (one way, regardless of means of transportation) per year for BEV owners (top) and ICEV owners (bottom). Don’t know category assumed to have zero trips. User survey May/June 2018. Percent. ELAN 2018. BEV owners: NAkershus=740, NAust-Agder=53, NBuskerud=222, NHedmark=86, NHordaland=419, NMøre og Romsdal=103, NNordland=72, NOppland=89, NOslo=688, NRogaland=313, NTelemark=97, NTroms=38, NTrøndelag=192, NVest-Agder=107, NVestfold=135, NØstfold=161, NTotal=3659. ICEV owners: NAkershus=250, NAust-Agder=40, NBuskerud=125, NHedmark=114, NHordaland=186, NMøre og Romsdal=96, NNordland=119, NOppland=100, NOslo=210, NRogaland=117, NTelemark=59, NTroms=76, NTrøndelad=194, NVest-Agder=40, NVestfold=101, NØstfold=104, NTotal=2048.
4 Not shown in diagram, calculated through a cross-tabulation between 300-399 and above 400 km.

Battery electric vehicle user experiences in Norway’s maturing market
Copyright © Institute of Transport Economics, 2019 33
The biggest differences in the long distance vehicle travel on peak travel days was seen for the summer vacation period, when a much larger share of ICEV owner’s trips exceeded 300 km than for BEV owners, as seen in Figure 6.4. On the other hand, a higher share of BEV owners than ICEV owners reported that they do not do long distance trips in such periods (not relevant responses). When assuming that the not relevant responders travel less than 100 km for their longest trip, then the Easter, Winter and Fall vacation travel patterns became rather equal for BEV and ICEV owners, but a higher share of ICEV owners tended to travel longer distances in the Fall vacations than BEV owners.
Figure 6.4: Distance of the longest vehicle based trip from home to destination in the main Norwegian vacation periods, by the share of responding BEV owners (N=3487) and ICEV owners (N=2048). User survey May/June 2018.
The same situation applied to a variable degree when looking separately at households where the respondent was working and the household owned a 2011 and never year model vehicle, and for different types of multi and single vehicle BEV and ICEV owners, as seen in Figure 6.5.

Battery electric vehicle user experiences in Norway’s maturing market
34 Copyright © Institute of Transport Economics, 2019
Figure 6.5: Distance of the longest vehicle5 based trip between home and destination in the main Norwegian vacation periods by the share of responding BEV owners (N=3163) and ICEV owners (N=610) that are working and have a 2011YM or never vehicle, by different user sub-groups and in total. User survey May/June 2018.
The average driving distance for those that said they do long distance vehicle based trips were longer for ICEV owners than BEV owners in the summer vacation period in 15 out of 18 provinces as shown in Figure 6.6. The reason for this difference is unknown. It could be due to differences in socio-demographics between the counties, or that BEVs owners less often go on the long distance vehicle based trips. The question was about the household’s vehicle based trips in general, not only the trips with the vehicle they were answering for in the survey.
5 Any vehicle can be used for these trips as the question was about vehicle based trips in general

Battery electric vehicle user experiences in Norway’s maturing market
Copyright © Institute of Transport Economics, 2019 35
Figure 6.6: The average longest vehicle based trip between home and destination per province per four main vacation periods with peak travel volumes, BEV owners and ICEV owners (top) per province. Difference between average ICEV and BEV owners (bottom). Km. ELAN user survey May/June 2018. NAkershus=740, NAust-Agder=53, NBuskerud=222, NHedmark=86, NHordaland=419, NMøre og Romsdal=103, NNordland=72, NOppland=89, NOslo=688, NRogaland=313, NTelemark=97, NTroms=38, NTrøndelag=192, NVest-Agder=107, NVestfold=135, NØstfold=161, NTotal=3659. ICEV owners: NAkershus=250, NAust-Agder=40, NBuskerud=125, NHedmark=114, NHordaland=186, NMøre og Romsdal=96, NNordland=119, NOppland=100, NOslo=210, NRogaland=117, NTelemark=59, NTroms=76, NTrøndelad=194, NVest-Agder=40, NVestfold=101, NØstfold=104, NTotal=2048.
BEV owners said that they would like BEVs to have a real world range for vacation trips that not surprisingly was longer than the range of most of the BEVs in the current Norwegian BEV fleet, as seen in Figure 6.7. The Tesla vehicles range is about 350 km in the winter and 450 km in the summer, which was deemed acceptable for more than 63 % of the users for summer driving, and over 50 percent for winter driving.
Figure 6.7: BEV owners (N=3487) assessment of the required real world range a BEV needs to have summer and winter to be able to use this vehicle type on “longer” vacation trips. ELAN user survey May/June 2018. Percent.
A large share of users would however not really need so long range. For instance, can the VW E-Golf with the 36 kWh battery cover a large share of user’s needs for long distance travels during these peak travel seasons, as seen by the calculation in Figure 6.8. The share of user needs met could reach 60-70 percent in the summer season and 75-85 percent for Easter, assuming one fast charge, and that the not relevant responders are unlikely to do vehicle based long distance trips in such periods. The assumption for this calculation is that

Battery electric vehicle user experiences in Norway’s maturing market
36 Copyright © Institute of Transport Economics, 2019
all BEV owners can charge at the destination. In reality, charge access can be limited as seen in section 6.4.
Figure 6.8: Percent of BEV users that would have enough range with a VW E-Golf 36 kWh BEV. Calculated by the authors based on the survey respondents long distance driving pattern on peak travel days. Not relevant = those that said that long distance driving was not a relevant to the question about the longest trip they do during Summer vacation and Easter vacation periods. ELAN user survey May/June 2018. NAkershus=740, NBuskerud=222, NHordaland=419, NMøre og Romsdal=103, NOslo=688, NRogaland=313, NTroms=38, NTrøndelag=192, NVest-Agder=107, NVestfold=135, NØstfold=161, NNorway=3659.
6.3 Fast charging on long distance trips
The first question about fast charging in the survey was a general question of where BEV owners say they fast charge their vehicles. The results are seen in Figure 6.9, grouped by how the users responded to three individual questions about fast charging use in (1) their own municipality, (2) the neighboring municipalities and (3) on long distance trips. The average number of fast charges was calculated to be 19 per year for the non-Tesla vehicles6. The number is heavily influenced by super users (about 10 percent of the total number of users according to Figenbaum 2019), and could thus be on the high side. It is possible that some of the super users were BEV owners without access to home charging or they could be craftsmen or other professional users.
Figure 6.9: Where and how often non-Tesla BEV owners say they use fast chargers. N=2967. ELAN 2018.
In a similar survey in 2016 the question was phrased slightly differently, and the result was a lower number of fast charges, i.e. 13-16 per non-Tesla BEV user/year (Figenbaum and
6 Tesla has a proprietary charging network and is therefore not part of the analysis.

Battery electric vehicle user experiences in Norway’s maturing market
Copyright © Institute of Transport Economics, 2019 37
Kolbenstvedt 2016), but the fast charger infrastructure was also less built out then. As seen, the most common in 2018 was to use fast chargers for a mix of local, regional and long distance trips. The least common was to use fast chargers only locally. About 17 percent said they never used fast chargers. The 2 percent of users that said they fast charged daily or 3-5 timer/week, stood for 24 percent of the total estimated fast charges per year. Charge queues were in 2018 most often experienced outside of the owner’s municipality and the biggest issues were seen on long distance trips, as seen in Figure 6.10. But most users that experienced queues only did it sometimes, whereas 10-16 percent experienced it often, and only 2 percent said they experienced it always. The share of users that did not know are unlikely to have experienced charge queues or they did not use fast chargers much.
Figure 6.10: Where and how often BEV users (N=1471) experience fast charger queues (the question was only given to users of fast chargers). Percent. ELAN 2018.
Figure 6.11 shows the differences between counties. Of all counties, users in Oslo experienced the most queues in own county, but experienced average queues elsewhere. Users in Oppland and Hedmark experienced few queues in own municipality but were among the worst hit when going on long distance trips. Users in Trøndelag rarely experienced queues.
Figure 6.11: Where and how often BEV users experience fast charger queues by county. Categories “Not relevant” and “Don’t know” were excluded. Percent. ELAN 2018. Left chart: NAkershus=205, NBuskerud=66, NHedmark=33, NHordaland=163, NOppland=39, NOslo=247, NRogaland=78, NTelemark=32, NTrøndelag=59, NVest-Agder=37, NVestfold=63, NØstfold=59, NTotal=1189. Middle chart: NAkershus=235, NBuskerud=75, NHedmark=39, NHordaland=169, NOppland=39, NOslo=257, NRogaland=80, NTelemark=35, NTrøndelag=61, NVest-Agder=44, NVestfold=70, NØstfold=58, NTotal=1279. Right chart: NAkershus=2341, NBuskerud=72, NHedmark=40, NHordaland=156, NOppland=36, NOslo=263, NRogaland=79, NTelemark=35, NTrøndelag=57, NVest-Agder=44, NVestfold=69, NØstfold=61, NTotal=1268.

Battery electric vehicle user experiences in Norway’s maturing market
38 Copyright © Institute of Transport Economics, 2019
Figure 6.12 shows the number of fast charge stops and how long charge queues that users in 2018 were willing to accept on long distance trips, and what they did while charging. The acceptable number of charge stops was likely influenced by what was reasonable to expect given the vehicle, and thus the available driving range, these owners had. The most surprising finding was the willingness to accept moderate charge queue lengths on peak travel days, although the willingness rapidly went down beyond 20 minutes. People tended to use social media, read e-mails, take a stroll or use the facilities at the charging station, while charging. It might thus be a good idea for charge operators to offer free WIFI at the charge station so that people have something to do while charging, especially if the cellular network in the area is poor. Co-location with a facility that offer toilets and a convenience store also seems to be something to consider.
Figure 6.12: Number of fast charge stops that BEV owners (N=3095) are willing to have on long distance trips (those that do trips >100 km within a year), their willingness to accept charge queue lengths on days when many people are travelling at the same time, and the types of activities that BEV owners do while fast charging.
The willingness to change travel start time to avoid charge queues was limited. A third of the users said they were not willing to change travel time, a third were willing to start earlier or later on the same day, and 7-8 percent could be willing to change travel day, as seen in Figure 6.13. The rest saw no need to use fast chargers, or the question was not relevant or they did not know (both categories are likely non-users on such days).
Figure 6.13: BEV owners (those that do long distance trips) willingness to adapt the travel start time to avoid charge time queues (N=3095). Percent. ELAN 2018.
Users in general rated the availability, location, payment solutions, reliability and quality of fast chargers on long distance trips to be good as seen in Figure 6.14, as only about 1 out of 10 users (non-Tesla) were not satisfied. It seems that the ease of payment was also rated satisfactorily, likely because all operators offer a pay per minute solution through the use of

Battery electric vehicle user experiences in Norway’s maturing market
Copyright © Institute of Transport Economics, 2019 39
an App, an RFID card or with an SMS message via the cellular phone networks. A large share of Tesla owners answered not relevant on the ease of payment which is understand-able, as most of them did not need to pay in the Tesla Supercharger network at that point in time.
Figure 6.14: Tesla owners (N=473) and other BEVs owners (N=2021) rating of availability, quality and payment system of fast chargers used on long distance trips (those that do such trips). Percent. ELAN 2018.
Tesla owners rated fast chargers even more positively than the other BEV owners on all parameters. It is however a bit surprising that Tesla owners were more satisfied with the availability/location than other BEV owners, given that there were more than 500 locations for Chademo/CCS chargers versus less than 50 Tesla Supercharger locations available in Norway at the time of the survey. But, Tesla owners can drive longer distances before needing to charge and thus need fewer locations. Tesla owners can also via an adapter use the Chademo chargers in 500 other locations. Tesla also has an easier job than other car manufacturers when it comes to making the fast charge experience seamless, as they have control of the hardware and the software both in the vehicle and in the charger. Figure 6.15 shows how the non-Tesla users in different counties rated the fast charge infrastructure they were using on their last long distance trip. The differences between counties are fairly small and non-systematic for most parameters, especially when looking at the counties with the largest cities and the highest numbers of users, i.e. Oslo, Akershus (surrounds Oslo), Hordaland, Rogaland and Trøndelag. Availability and position of the fast chargers were, by the users that have an opinion, on average for Norway rated as good by 65% of users (lowest/highest: 58%/81%) and poor by 11% (lowest/highest 3%/16%). Capacity of the charger locations were on average for Norway rated as good by 65% of users (lowest/highest: 62%/81%) and poor by 11% (lowest/highest 3%/17%). Quality of the charger locations were on average for Norway rated as good by 69% of users (lowest/highest: 61%/81%) and poor by 10% (lowest/highest 3%/16%). Payment was the overall most positively rated parameter of fast chargers. and on average for Norway rated as good by 81% of users (lowest/highest: 71%/93%) and poor by only 6% (lowest/highest 0%/9%). “Plug’n charge” solutions are currently being developed. In these solutions users plug in and the system automatically detects the vehicle, authorize the charge and sends the bill, much like Tesla owners already experience. User assessment of payment solutions is thus likely to become even more positively rated in the coming years.
10 10 5 2 1 1
21 18 12 11
4 3
59 61 72
86 94
34
4 7 7 1 1 5 5 4 4 1 1
56
-
20
40
60
80
100
Availability/Location Quality/Reliability Ease of payment Availability/Location Quality/Reliability Ease of payment
All other BEVs Tesla
Shar
e of
resp
onde
nts
Poor Neither nor Good Don't know Not relevant

Battery electric vehicle user experiences in Norway’s maturing market
40 Copyright © Institute of Transport Economics, 2019
Figure 6.15: Non-Tesla user assessment of fast charger offering on their last long distance trip by county of origin (all users). “Don’t know” and “Not relevant” categories are excluded from the analysis. Percent. ELAN2018. NAkershus=377, NAust-Agder=36, NBuskerud=118, NHedmark=52, NHordaland=218, NMøre og Romsdal=, NNordland=33, NOppland=72, NOslo=482, NRogaland=184, NSogn og Fjordane=30, NTelemark=71, NTrøndelad=110, NVest-Agder=76, NVestfold=121, NØstfold=105, NTotal=1872.

Battery electric vehicle user experiences in Norway’s maturing market
Copyright © Institute of Transport Economics, 2019 41
6.4 Trips to the cabin
There are 434,809 (SSB 2019) recreational cabins (chalet, hut, cottage) and summer houses, and 32,869 regular houses used for vacation and recreational purposes, in Norway. These cabins and vacation houses are typically located in the mountain or coastal regions. A smaller share of these are located in the woods or in other rural areas. 58 percent of BEV owners and 51 percent of ICEV owners in the survey stated that they had access to cabins. Of these, 65 percent of BEV owners said that they can charge their vehicle at the cabin, whereas 35 percent of ICEV owners said that electricity for charging is or can be made available where the vehicle is parked (less than 20 m distance). BEV and ICEV owner’s said they travel about equally often to their cabin, but ICEV owners more often had shorter, but also longer distances than BEV owners, as seen in Figure 6.16.
Figure 6.16: Frequency of use and distance to cabins. NBEV=2027, NICEV=1050. Percent. ELAN 2018
Table 6.1 shows the spread of distance by percentiles, the average distance and the standard deviation for BEV owners that can and cannot charge, and ICEV owners that have and do not have access to electricity at their cabins. The large standard deviation is due to a small number of users that have very long distances to their cabins, as seen by the difference between 90 and 95 percentiles.
Table 6.1: Distance to cabin, average, percentiles, std. dev. BEV owners with and without capability to charge, ICEV owners with and without electricity available.
N Average Std. dev.
10 perc
20 perc
30 perc
40 perc
50 perc
60 perc
70 perc
80 perc
90 perc
95 perc
BEV Can charge 1330 217 346 45 75 110 130 160 190 220 250 350 500 Cannot
charge 647 267 508 30 60 95 120 150 186 225 264 360 700
ICEV Electricity available
538 281 611 30 67 100 120 154 190 222 280 460 863
No Electricity 431 218 449 15 30 50 80 118 150 197 250 359 600
The average distance for owners in the different counties is calculated7 in Figure 6.17 by setting the maximum distance to 500 km, which is a reasonable maximum distance for vehicle based travels to cabins. Owners in Akershus and Oslo have the longest distances to cabins, which is not an optimal combination with also having the largest share of BEVs in the fleets (as seen in chapter 2).
7 Maximum distance was limited to 500 km. Longer distances are less likely to be covered by vehicle travel.

Battery electric vehicle user experiences in Norway’s maturing market
42 Copyright © Institute of Transport Economics, 2019
People in Østfold also have long distances to their recreational cabins, as this county is South-East of Oslo, whereas mountain destinations with large number of cabins are mainly located North or West of Oslo.
Figure 6.17: Average distances to cabins, and distance intervals, by county and BEV/ICEV ownership. Km and percentage. Limited to those that have up to 500 km distance to cabins. Percent. ELAN 2018. BEV owners: NAkershus=456, NAust-Agder=21, NBuskerud=124, NHedmark=51, NHordaland=208, NMøre og Romsdal=45, NNordland=34, NOppland=55, NOslo=411, NRogaland=154, NTelemark=57, NTrøndelad=118, NVest-Agder=56, NVestfold=80, NØstfold=68, NTotal=2013. ICEV owners: NAkershus=137, NAust-Agder=13, NBuskerud=62, NHedmark=48, NHordaland=84, NMøre og Romsdal=43, NNordland=52, NOppland=52, NOslo=120, NRogaland=43, NTelemark=26, NTrøndelad=109, NVest-Agder=19, NVestfold=41, NØstfold=46, NTotal=969.
Almost half of the BEV owners said that they always or often get to their cabins using their BEV, but it is more common to use another household vehicle (72 percent of BEV owners own another vehicle) for this trip type, as seen in Figure 6.18. Of those that said they used the BEV to get to their cabin, the dominant places to charge were at the destination and at fast chargers on the way to the destination.

Battery electric vehicle user experiences in Norway’s maturing market
Copyright © Institute of Transport Economics, 2019 43
Figure 6.18: BEV owners means of transport and charge locations on the way to cabins (N=2027, N=1597/other household vehicle). Percent. ELAN 2018.
6.5 User reactions, range and charge issues on long trips
The users where asked about range anxiety and charge queue stress in general, and whether uncertain access to fast chargers on long distance trips limited their willingness to use their BEV on such trips. The results are seen in Figure 6.19, split by single and multivehicle households. The most remarkable result was the small difference between single- and multivehicle BEV households. It seems that the driving experience related to these aspects was rather similar between these two owner groups. Those with more than one household vehicle were however less inclined to use their BEVs on long distance trips due to uncertainty with access to charging. They also were slightly less stressed by charge queues (assuming that those who choosed the Don’t know category are unlikely to be experiencing stress).
Figure 6.19: Range anxiety, charge queue stress and long distance charging access uncertainty among single- (n=965) and multi-vehicle BEV households (N=2522). Percent. ELAN 2018.
The range anxiety went down somewhat with increasing battery size as seen in Figure 6.20. The effect was however rather small up to battery sizes of 40 kWh. Nevertheless, 50-60 % of the owners with the smallest batteries strongly or somewhat disagreed to often experiencing range anxiety, and only 5-8 % strongly agreed with this statement. When looking at the owners that strongly or somewhat agreed, the difference between the long range and the short range vehicles seems fairly small. The reason could be that these vehicle types are used differently, i.e. that the vehicles with small batteries rarely are used for trips where the range is too short. When vehicles get longer range, people likely use them for longer distance trips and the range anxiety is reduced less with increased battery capacity than expected.

Battery electric vehicle user experiences in Norway’s maturing market
44 Copyright © Institute of Transport Economics, 2019
Figure 6.20: Range anxiety among owners of different BEV models and battery sizes. Percent. ELAN 2018.
Figure 6.21 shows that there were some differences between counties when it comes to range anxiety, charge queue stress, and uncertainty related to access to chargers. People in Oslo and Telemark most often experienced range anxiety, whereas people in Nordland and Aust-Agder were the least stressed by charge queues. People in Aust-Agder were also the least worried about fast charger access.

Battery electric vehicle user experiences in Norway’s maturing market
Copyright © Institute of Transport Economics, 2019 45
Figure 6.21: Range anxiety, charge queue stress and long distance charging access uncertainty by owner’s county of origin. NAkershus=740, NAust-Agder=53, NBuskerud=222, NHedmark=86, NHordaland=419, NMøre og Romsdal=103, NNordland=72, NOppland=89, NOslo=688, NRogaland=313, NTelemark=97, NTrøndelag=192, NVest-Agder=107, NVestfold=135, NØstfold=161, NNorway=3659.

Battery electric vehicle user experiences in Norway’s maturing market
46 Copyright © Institute of Transport Economics, 2019
7 Annual driving and travel changes
This chapter deals with the total annual driving pattern of the different types of vehicles and investigates travel changes after the vehicles were bought. The target is to see if BEVs are driven more or less than other types of vehicles, and if the household’s total vehicle based driving has changed differently for BEV owners than ICEV owners after the purchase of the vehicle. The risk of more vehicles being bought because of BEVs low marginal cost of use is not discussed in this chapter as it was discussed in chapter 4.
7.1 Yearly mileage measured as users stated km in their vehicle insurance contract
The respondents, both in 2016 and in 2018, were asked about the yearly mileage in the vehicle insurance for the vehicle they responded for8. How the BEV and the ICEV owners responded both in 2016 and in 2018 is shown in Figure 7.1.
Figure 7.1: Annual driving distance in the vehicles insurance 2016 and 2018.
As the figure shows, there were no large changes among neither the BEV nor the ICEV owners in the yearly total mileage in the households vehicle insurances between 2016 and 2018. The average annual driving distance in 2018 can be estimated from the yearly insured km per year9 to be 16500 km for BEV owners and 15500 km for ICEV owners. When only looking at 2011 and newer vehicles, the ICEV owners insured their vehicles for an average distance of 16200 km, which is within 2 % of the estimate for BEV owners, that all own newer than 2010 vehicles. There is thus no significant difference in the estimated total annual driving between these owner groups.
8 The price of the insurance increases with increases mileage. The distance insured is thus optimized by users. 9 Figenbaum and Kolbenstvedt (2016) found that this question produced about the same annual distance estimate as odometer readings did. Mid of intervals used. For 2016, 25000 km was used for the above 20000 km category. For 2018 the category was split by 20001-30000 km and above 30000 km, with 35000 km used above 30000 km.
9 9 11 1325 23 25 2422 25 25 2618 17 21 1724 24 16 19
0%20%40%60%80%
100%
BEV 2016(N=3111)
BEV 2018(N=3659)
ICEV 2016(N=2080)
ICEV 2018(N=2048)
8000 km or less 8001-12 000 km 12 001-16 000 km
16 001-20 000 km More than 20 000 Don't know

Battery electric vehicle user experiences in Norway’s maturing market
Copyright © Institute of Transport Economics, 2019 47
The annual insured distance appears to have increased since 2016, when it was 15 800 km for the average BEV and 15 000 km for ICEVs when including vehicles of all ages. Insured km above 20000 km was however one category in the survey in 2016 with an assumed average of 25000 km. Whereas in 2018 it was split into 20,001-30,000 km and above 30,000 km. If the 2016 assumption is applied to the results for 2018, the annual driving distances are reduced to exactly the same values as in 2016 for both vehicle types, and thus the total driving per vehicle seems unchanged based on this parameter. There were large variations between different vehicle owner types. A higher share of Multi BEV owners (workers) had an insured driving length of 20 000 km per year than other owner groups (workers). The same group also had 12-21 percent lower share of users driving less than 12 000 km per year compared to other owner groups, as seen in Table 7.1.
Table 7.1: Annual insured driving distance of the vehicle in question by different types of vehicle owning households where the respondent is working full or part time or is self-employed.
Single BEV Single ICEV Multi BEV Multi ICEV BEV+other 8000 km eller mindre 8% 13% 2% 7% 7% 8001-12 000 km 24% 22% 12% 19% 20% 12 001-16 000 km 28% 24% 20% 27% 26% 16 001-20 000 km 16% 17% 22% 17% 19% 20 001-30 000 14% 16% 26% 19% 19% >30 000 km 6% 6% 15% 9% 8% Don’t know 3% 3% 2% 2% 2% Number of respondents 828 748 179 720 1825
7.2 Travel mode changes after buying the vehicle
In the following section, we explore to which extent the travel behavior of households (both BEV and ICEV) became more vehicle based after the acquisition of the car. The analysis is based on data from respondents that are full- or part-time employed or self-employed in order to control for differences in work status between the samples of BEV- and ICEV-respondents, and because commuting to work is a major contribution to the total annual driving distance of vehicles.
7.2.1 Changes in transport mode on commuting trips Travel to work is the most important every day transport activity. It is therefore of great interest to explore if there are other transport mode changes on commuting trips when a BEV is bought, than when a household buys an ICEV. The respondents were therefore asked the following question about work trips: “How were these work trips carried out before the acquisition of this vehicle? Please answer for the person who most frequently use this vehicle for these trips”. Both BEV- and ICEV-respondents received this question, and Figure 7.2 shows how they responded. Again, only respondents that are employed (fulltime or part-time) or self-employed are included in the analysis.

Battery electric vehicle user experiences in Norway’s maturing market
48 Copyright © Institute of Transport Economics, 2019
Figure 7.2: Transport mode on work trips before the acquisition of the vehicle, for the person who most frequently use the present vehicle. Among BEV- and ICEV-respondents that are employed or self-employed. Percent.
Figure 7.2 clearly shows that most users drove to work prior to buying the vehicle, but the users that shifted to a BEV could drive more environmentally friendly than before. The share that report that they used a car as a driver to get to work before the acquisition of the present vehicle (that they answer for) was also somewhat greater among BEV-respondents than among ICEV respondents. The difference is significant (p<0,001, two-sided test). In addition, the share that report that this trip was not made before was greater among the ICEV-respondents than for the BEV-respondents. Again, this difference is significant (p<0,001, two-sided test). This difference can probably be explained by differences among BEV and ICEV-respondents concerning whether they replaced a previous vehicle and/or whether they bought an additional vehicle/first vehicle. In general, as shown in chapter 4.3 the ICEV-respondents have to a greater extent than the BEV-respondents replaced a vehicle (91 versus 80 percent of owners of 2011 and newer year model vehicles), which might seem contrary to the result for the work trips above. The additional vehicle could however also have been bought due to a need to drive to work of another person in the household. As shown in Table 7.2, there is a strong – and significant - association between having replaced a vehicle (regardless of type) and the extent to which the trip to work was made by vehicle as a driver before the acquisition of the new vehicle.
Table 7.2: Transport mode on work trips before the acquisition of the vehicle, by having replaced the vehicle or not. Percent. Full- or part-time employed and self-employed*.
Replaced a vehicle Bought an additional vehicle Don't know Vehicle as a driver 89 64 69 Vehicle as a passenger 1 3 4 Public transport 3 18 4 Bike/walking 1 2 0 Trip was not made before 5 11 19 Other 1 2 4
Total 100 100 100 N= 3190 642 26
*p<0,001 (chi square test)
7.2.2 Travel changes in general The respondents received the following question: “Has the household changed travel behaviour after the acquisition of this vehicle?” 26 percent of all the respondents (N=4391)
87
1 7 1 4 1
79
2 3 3 112
020406080
100
Car as a driver Car as apassenger
Public transport On foot/cycking The trip wasnot made
before
Other
BEV (N=2896) ICEV (N=895)

Battery electric vehicle user experiences in Norway’s maturing market
Copyright © Institute of Transport Economics, 2019 49
answered “yes” to this question. A larger share of the BEV-respondents (33 percent of N=3143) responded “yes” to this question compared to ICEV-respondents (7 percent of N=1165). This indicates that the greatest changes in travel behaviour comes with the acquisition of a BEV. As daily travel is highly correlated with being inside the work market, the following analyses will focus on respondents being full- or part-time employed or self-employed. Table 7.3 shows that, among the ICEV-respondents, there was a strong association between having changed the travel behaviour in the household after the acquisition of the vehicle and whether the vehicle replaced another vehicle in the household or not.
Table 7.3: Changes in travel behaviour in the household after the acquisition of the vehicle by different household categories describing having one/several vehicles in the household and whether the vehicle in question is replaced among BEV- and ICEV-respondents. Percent. Full-or part-time employed or self-employed.
Only one vehicle which was not replaced (first
vehicle)
Additional vehicle, own
several vehicles
Replaced, owned one
vehicle
Replaced, owned several
vehicles
BEV (N=3119) Yes 661,2 401,2 361 29 No 34 60 64 71
Total 100 100 100 100 N= 112 491 683 1833
ICEV (N=1152) Yes 381,2 171 64 4 No 62 83 94 96
Total 100 100 100 100 N= 47 81 431 593
1p<0,001 (two-sided test, “replaced, several vehicles” used for comparison), 2 n.s. (two-sided test, “replaced, only one vehicle” used for comparison), 3p<0,001 (two-sided test, “additional vehicle, several vehicles” used for comparison), 4 n.s. (two-sided test, “replaced, several vehicles used for comparison),
The share of ICEV-respondents who reported having changed their travel behaviour in the household after the acquisition of the vehicle was much larger among both those who have only one vehicle which is not replaced (probably the first vehicle in the household) and those who have bought an additional vehicle, compared to those that had replaced a vehicle (independent of whether they have only one vehicle or several vehicles in the household). The differences are significant and expected. In addition, it can also be seen that ICEV-respondents that had only one vehicle in the household which was not replaced with another (their first vehicle), reported to a larger degree that they had changed their travel behaviour compared to ICEV-respondents that had bought an additional vehicle to the household. The difference is significant. The same pattern can be observed for the BEV-respondents, but the difference in the extent to which travel behaviour is changed was not so much associated with having replaced a vehicle or not. The largest difference in the share reporting changes in travel behaviour in the household was found between those who have only one vehicle in the household, which was not replaced (probably the first vehicle) and other household categories. The difference is significant. There is a small, but significant difference between both having bought an additional vehicle to the household and those who had one vehicle in the household which was replaced, and households having several vehicles, where the vehicle in question replaced another.

Battery electric vehicle user experiences in Norway’s maturing market
50 Copyright © Institute of Transport Economics, 2019
7.2.3 How travel behaviour has changed after the acquisition of the new vehicle
The analysis in section 7.2.2. only point to the question whether travel behaviour in the household has changed or not, they do not tell anything about the direction of change. Hence, the respondents confirming that the household had changed travel behaviour after the acquisition of the vehicle, received a follow-up question: “How has the travel behaviour changed in the household after the acquisition of this vehicle”. How the BEV-respondents and ICEV-respondents answered to the question, is shown in Figure 7.3.
Figure 7.3: “How has the travel behaviour changed in the household after the acquisition of the vehicle”. BEV-respondents (N=1056) and ICEV-respondents (N=85). Full- or part-time employed or self-employed. Percent.
As only a few ICEV-respondents answered to this question (N=85), their answers are not generalizable to the whole population of ICEV owners, and their answers are included in the Figure 7.3 just for documentation. Hence, the following analysis will focus on the answers from the BEV-respondents. The largest changes in travel behaviour in households are to be found in car use where there is a large share (48 percent) who reported that they used a car more often or much more often in the household after the acquisition of the vehicle. The increase in car use seem to have come at the expense of the use of public transport, where there is a large share (34) who reported that they use public transport more seldom or much more seldom. However, 15 percent reported that they also use public transport more often. The smallest changes are to be found in walking/cycling, where 63 percent report that this has remained unchanged after the acquisition of the vehicle, and the share who report that they walk/cycle more (more or much more) was similar to the share who report they use these transport modes less (more seldom or much more seldom). Additional analysis, show that there is a significant association in changes in mode use and number of vehicles in the household (see Appendix 3, Table A3.2), where those who have only one vehicle in the household to a greater degree reported that they used a car more often (“more often” and “much more often”) than those who had several vehicles in the household (54 percent versus 47). However, additional analyses show that the association is even stronger between changes in car use and whether the household had replaced a vehicle or not (see Appendix 3, Table A3.3), where 75 percent of those who did not replace a vehicle reported that they used a car more often (“more often” and “much more often”),

Battery electric vehicle user experiences in Norway’s maturing market
Copyright © Institute of Transport Economics, 2019 51
while only 39 percent of those who did replace a vehicle reported the same. Table 7.4 shows that there are significant associations between changes in use of different transport mode and the different household types (that is, different combination of having one/several vehicles and having replaced a vehicle/not replaced a vehicle).
Table 7.4: How travel behaviour has changed after the acquisition of the vehicle by different household’s types. Percent. BEV-respondents. Full- or part-time employed and self-employed.
Only vehicle, not replaced (first vehicle)
(N=74)
Additional vehicle, several
vehicles (N=195)
Replaced, own only one
vehicle (N=244)
Replaced, own several
vehicles (N=521)
Use of a car Less often 4 5 206 9 Unchanged 4 26 38 53 More often 922,3 691 42 38 Total 100 100 100 100 Use of public transport Less often 722,4 571 25 27 Unchanged 24 38 52 63 More often 4 5 236 10 Total 100 100 100 100 Walking/cycling Less often 302,5 241 14 12 Unchanged 62 69 62 70 More often 8 7 247 18 Total 100 100 100 100
1p<0,001 (two-sided test) compared to “replaced, several vehicles”. 2p<0,001 (two-sided test) compared to “replaced, only one vehicle” 3p<0,001 (two-sided test) compared to “additional vehicle, several vehicles” 4p<0,01 (two-sided test) compared to “additional vehicle, several vehicles” 5not significant (95 percent) (two-sided test) compared to “additional vehicle, several vehicles” 6p<0,001 (two-sided test) compared to “replaced, several vehicles” 7not significant (95 percent) (two-sided test) compared to “replaced, several vehicles” Table 7.4 shows that households with several vehicles in the household reported different changes in the transport mode use after the acquisition of the vehicle depending on whether the vehicle in question had replaced a vehicle or not. Households that bought an additional vehicle were more likely to report that they used a car more often (than before the acquisition of the vehicle in question) compared to households with several vehicles, where the vehicle in question had replaced another vehicle (69 versus 38 percent). More car uses in households which has bought an additional vehicle seems to have come at the expense of the use of public transport. Households which bought an additional vehicle reported to a greater degree using public transport less often compared to households with several vehicles, where the vehicle in question had replaced another vehicle (57 versus 27 percent). A greater share of the former households also reported that they walked or cycled less often (than before the acquisition of the vehicle in question) than other households with several vehicles where one had been replaced (24 versus 12 percent). All the mentioned differences are significant (p<0,001, two-sided test). The same difference is observed for households with only one vehicle, where there is a difference in changes in transport mode use (after the acquisition of the vehicle) between households which did not replace a vehicle (most likely the first vehicle in the household) and households which as replaced a vehicle. The former households (with one vehicle,

Battery electric vehicle user experiences in Norway’s maturing market
52 Copyright © Institute of Transport Economics, 2019
which is not replaced) reported to a greater degree that they used a vehicle more often, and that they used public transport and walked/cycled less than before compared to households which had replaced a vehicle (and had only access to one vehicle). Again, the mentioned differences are significant. There are also differences in changes in transport mode use among households that have not replaced a vehicle, but differ in terms of number of vehicles (that is households with one vehicle and households which have bought an additional vehicle). Households which had only one vehicle, which had not replaced another (probably the first vehicle in the household) were more likely to report that they used a car more often and used public transport less compared to households that had bought an additional vehicle. The differences are significant. There were, however, no significant difference between these types of households when it comes to changes in cycling. As for households that had replaced a vehicle, but differs in terms of the number of vehicles (one vehicle or several vehicles), the one vehicle households that had replaced a vehicle report to a greater extent that they used the car less often than before the acquisition of the vehicle, than households that owned several vehicles and had replaced one of them. Moreover, the former reported to a greater extent that they used public transport more often than before, compared to households having several vehicles, where one was replaced. The mentioned differences are significant. There is also a tendency that the one vehicle households, which had replaced the vehicle with another, also walked/cycled more than before compared to households that owned several vehicles, where one had been replaced. This difference is however not significant.
7.2.4 Changes in the total driving length specified in the household’s vehicle insurance contracts
Changes to the combined total driving length of the household’s vehicles insurances can give further insights for the owners that had replaced a vehicle. These respondents received the following question: “Has the household changed the total driving distance of the vehicle insurances, after you acquired this vehicle?”. Again, the analysis below is based on respondents being full- or part-time employed or self-employed. How the BEV- and ICEV-respondents replied, can be seen in Table 7.5.
Table 7.5: Changes in total driving length of the household’s vehicle insurances. Percent and km. Respondents that have replaced a vehicle and are full- or part-time employed or self-employed.
BEV (N=2516) ICEV (N=1024) Increased by more than 4000 km 8 4 Increased by 2000-4000 km 7 5 Increased by up to 2000 km 5 3 Have the same driving distance as before 70 78 Reduced up to 2000 km 2 2 Reduced by 2000-4000 km 2 3 Reduced by more than 4000 km 2 3 Don't know 4 3 Total 100 100 Estimated average net change annual driving* 470 km 80 km
*Assuming mid of interval and >4000 km = 5000 km
The BEV owners reported to a greater degree that they had increased the household’s total driving length insurances compared to ICEV owners (20 versus 12 percent), while the

Battery electric vehicle user experiences in Norway’s maturing market
Copyright © Institute of Transport Economics, 2019 53
latter report to a greater degree that they had the same insured driving distance as before compared to the former (78 versus 70 percent). The differences are significant (p<0,001, chi-square test). These answers are consistent with the differences between BEV and ICEV owners in changes in travel behaviour. Based on the data in the table it was calculated that the average BEV that replaced another vehicle led to an estimated increase in annual driving of about 470 km in the household, whereas an average ICEV replacing another vehicle led to an increase of 80 km. The difference, 390 km, represents about 2.4 percent of the annual total driving of BEV owners, and can be seen as an estimate for the rebound effect of buying a BEV instead of an ICEV when replacing a vehicle. Some of this effect could however also be due to differences in travel needs, as a larger share of BEV owners have larger families with children compared to ICEV households.
7.2.5 Summary of changes in travel behaviour The purpose of this section was to explore potential changes in travel behaviour and mode use after the acquisition of the car, both to work and in general. The main findings from this section is as follows: Those who had replaced a vehicle reported to a greater extent that they had used a car as a driver to get to work before the acquisition of the car than those who bought an additional/first vehicle (89 versus 64 percent). This indicates that there were greater changes in the travel behaviour among those who bought an additional vehicle/first vehicle than among those who replaced a vehicle. A larger share of the BEV owners report that the household had changed its travel behaviour (in general) after the acquisition of the vehicle compared to ICEV owners (33 versus 7 percent). From further analyses of this question, the following conclusions can be drawn:
• For both BEV and ICEV owners, replacement of a previous vehicle entails less changes in travel behaviour.
• Among those who had replaced a vehicle, the changes in travel behaviour were however greater for BEV owners than for ICEV owners.
• For both BEV and ICEV owners, the greatest reported change in travel behaviour was found among those who had bought their first car.
In sum, the analyses suggest that BEV owners have larger changes in the household’s travel behaviour after the acquisition of the vehicle than ICEV owners, and that the changes are greater for BEV owners that have bought an additional car, especially if it is the first car the household have bought compared to BEV owners that have replaced a car. Analyses of how households of BEV owners (that is, those BEV owners who reported changes in their travel behaviour) have changed its travel behaviour suggest the following:
• The greatest changes in transport mode use, was to be found in car use. 48 percent of the BEV owners reported that they used a car more often or much more often than before the acquisition of the vehicle.
• A larger share reported that they use public transport less often than those who report that they use public transport more often, which indicates that increased car use to some extent came at the expense of the use of public transport.
• There were few changes in walking/cycling after the acquisition of the vehicle. • Households which bought an additional vehicle reported to a greater extent that
they used a car more often and that they used public transport less and that they walked/cycled less than households which had replaced a vehicle. The largest

Battery electric vehicle user experiences in Norway’s maturing market
54 Copyright © Institute of Transport Economics, 2019
increase in car use (and largest decrease in the use of public transport/walking/-cycling) was found among households that had bought their first vehicle.
• The smallest changes in travel behaviour was found among households that had replaced a vehicle and only had one vehicle in the household. Even though these households also reported that they used a car more often, they were also more likely to report that they used a car less (and more public transport/walking/-cycling) than other types of households (first vehicle/one-vehicle household or households with several vehicles).
In addition, analyses of BEV and ICEV owners that had replaced a vehicle, suggested that a larger share of BEV owners had increased the total driving length of the household’s vehicle insurance compared to ICEV owners. This finding supports the finding that BEV owners reported greater changes in travel behaviour in the household than the ICEV owners did, and that BEV owners used a car for transport more often after the acquisition of the vehicle. Calculations suggest that there is a potential small rebound effect in terms of annual total driving length of BEVs of about 2-3 percent of the total km driven. It was shown in chapter 4 that BEV owners tends to have larger households and are in a life phase where travel changes are more likely to occur, for instance related to transportation of children and the associated everyday stress mess. It is thus difficult to draw firm conclusions on the extent to which changes in the travel patterns – and increased car use among BEV owners - are related to changed needs, and/or to which extent they are related to a potential rebound effect, i.e. the potential increase in annual driving when buying a new vehicle in general, and any additional rebound effects when buying a BEV instead of an ICEV due to the much lower marginal cost of driving a BEV.

Battery electric vehicle user experiences in Norway’s maturing market
Copyright © Institute of Transport Economics, 2019 55
8 Value of local incentives
BEV users in Norway benefit from several valuable local incentives. These incentives were at the time the 2018 survey was conducted the following: (1) exemption from road tolls, (2) reduced parking fees (and time saved finding parking), (3) reduced main road (“Riksveg”) ferry rates, and (4) partial or full access to bus lanes (depending on local conditions). The respondents were asked how much money (road tolls, parking fees, ferry rates) and time (bus lane, finding parking) they save on these incentives. The total average value per BEV owner of these 4 incentives could then be estimated to be 14.149 NOK in 2018. The toll road exemption acounted for 65 percent percent of the total value and reduced ferry rates for 5 percent. Free parking accounted for 18 percent. The value of time saved in bus lanes accounted for 8 percent, and the time saved finding parking for 4 percent. There was a major shift in the assessed value of these incentives between 2016 to 2018, as seen in Figure 8.1. The average value was reduced from 15730 NOK/user in 2016 (2018 money) to 14150 NOK/user in 2018. The reduction was in spite of 2018 also including estimates for time saved looking for parking, which was estimated to a value of 580 NOK/average user. Without that time saving, the average incentive value of the local incentives would have been reduced by 17 percent between 2016 and 2018.
Figure 8.1: Share of total incentive value for road toll exemption, free parking, reduced ferry rates, time saved in bus lane and for finding parking (2018). N2018=3659, N2016=3111. Percent. ELAN 2018.
It can be estimated that between 2016 and 2018 the value of exemption from road tolls increased 21 percent and the value of reduced ferry rates by 20 percent. The average value of the bus lane access went down by 76 percent whereas the value of free or reduced parking rates had gone up 4 percent. These shifts correspond well with the changes in policies. The road toll rates increased substantially between 2016 and 2018 around cities where most BEV owners are located, for instance through the introduction of rush hour surcharges. The most busy bus lanes around Oslo has since 2017 only been open to BEVs in the rush hours if more than one person is in the vehicle.

Battery electric vehicle user experiences in Norway’s maturing market
56 Copyright © Institute of Transport Economics, 2019
The value of the incentives was rated the highest in the three counties with the highest market shares, i.e. Oslo, Akershus and Hordaland, as seen in Figure 8.2. These counties also contain Norway’s largest cities, Oslo (Akershus surrounds Oslo) and Bergen. Counties with large cities had higher market shares (“Fleet share” in the Figure) for the same value of incentives, as seen for Vest-Agder (Kristiansand City), Rogaland (Stavanger City) and Trøndelag (Trondheim city), compared to for instance Oppland and Hedmark, as seen in Figure 8.2. For other counties there is no clear tendency. It should be noted that the number of users in the survey in each county was rather small so the results should be interpreted carefully.
Figure 8.2: Value of local incentives per county (2018) and the share of BEVs in the local fleet in 2017 (NOK). Counties without color had less than 100 respondents, Finnmark had too few to be shown. NOK. ELAN 2018. Number of respondents: Akershus: 740, Aust-Agder: 53, Buskerud: 222, Hedmark: 86, Hordaland: 419, Møre og Romsdal: 103, Nordland: 72, Oppland: 89, Oslo: 688. Rogaland: 313, Sogn og Fjordane: 39, Telemark:97, Troms: 38, Trøndelag: 192, Vest-Agder: 107, Vestfold: 175. Norway: 3659.
The exemption from toll roads was the most important incentive in all counties as seen in Figure 8.3.

Battery electric vehicle user experiences in Norway’s maturing market
Copyright © Institute of Transport Economics, 2019 57
Figure 8.3: Value of each local incentive by County (NOK) and value of each incentive in percent of total value, 2018. NOK. ELAN 2018. Number of respondents: NAkershus=740, NAust-Agder=53, NBuskerud=222, NHedmark=86, NHordaland=419, NMøre og Romsdal=103, NNordland=72, NOppland=89, NOslo=688. NRogaland=313, NSogn og Fjordane=39, NTelemark=97, NTroms=38, NTrøndelag=192, NVest-Agder=107, NVestfold=175, NNorway=3659.
The value of incentives decreased most between 2016 and 2018 for the users that benefitted the most, as seen in Figure 8.4.
Figure 8.4: Share of users by value of incentives (NOK), 2018. N2018=3659, N2016=3111. ELAN 2018.

Battery electric vehicle user experiences in Norway’s maturing market
58 Copyright © Institute of Transport Economics, 2019
The value of these incentives shifted substantially in many of the counties between 2016 and 2018, as seen in Figure 8.5. The results are uncertain for the counties with fewest respondents. The large reduction in Buskerud seems to be due to users that in 2016 benefitted from the use of bus lanes in the direction of Oslo, and which lost most of that benefit by 2018 due to the requirement to be more than one person in the vehicle in the rush hour. The total value in Oslo and Akershus was rather stable between 2016 and 2018, but the value of road tolls increased and the value of bus lanes decreased.
Figure 8.5: The change in value of local incentives per County for each local incentive between 2016 and 2018 (NOK). The number is the net sum of changes. NOK. ELAN 2018. Number of respondents 2018: NAkershus=740, NAust-Agder=53, NBuskerud=222, NHedmark=86, NHordaland=419, NMøre og Romsdal=103, NNordland=72, NOppland=89, NOslo=688. NRogaland=313, NSogn og Fjordane=39, NTelemark=97, NTroms=38, NTrøndelag=192, NVest-Agder=107, NVestfold=175, NNorway=3659. Number of respondents 2016: NAkershus=601, NAust-Agder=74, NBuskerud=173, NHedmark=64, NHordaland=459, NMøre og Romsdal=96, NNordland=78, NOppland=46, NOslo=434, NRogaland=274, NSogn og Fjordane=22, NTelemark=68, NTroms=33, NTrøndelag=250, NVest-Agder=104, NVestfold=165.
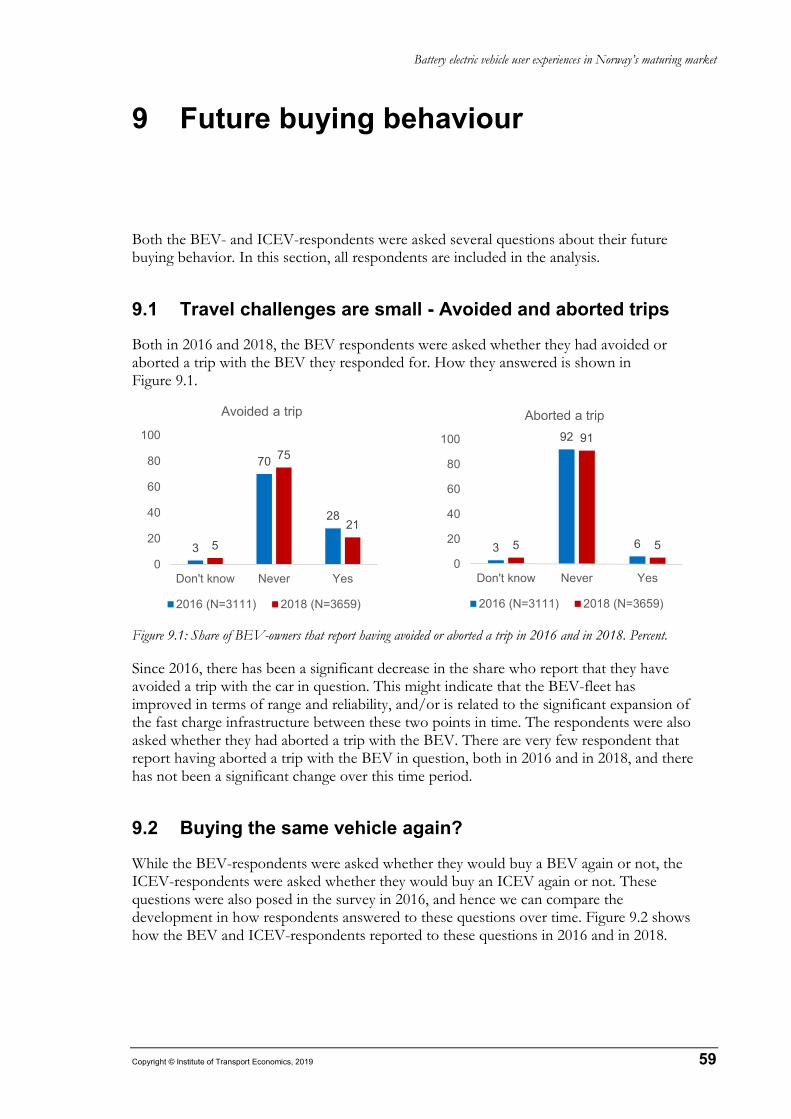
Battery electric vehicle user experiences in Norway’s maturing market
Copyright © Institute of Transport Economics, 2019 59
9 Future buying behaviour
Both the BEV- and ICEV-respondents were asked several questions about their future buying behavior. In this section, all respondents are included in the analysis.
9.1 Travel challenges are small - Avoided and aborted trips
Both in 2016 and 2018, the BEV respondents were asked whether they had avoided or aborted a trip with the BEV they responded for. How they answered is shown in Figure 9.1.
Figure 9.1: Share of BEV-owners that report having avoided or aborted a trip in 2016 and in 2018. Percent.
Since 2016, there has been a significant decrease in the share who report that they have avoided a trip with the car in question. This might indicate that the BEV-fleet has improved in terms of range and reliability, and/or is related to the significant expansion of the fast charge infrastructure between these two points in time. The respondents were also asked whether they had aborted a trip with the BEV. There are very few respondent that report having aborted a trip with the BEV in question, both in 2016 and in 2018, and there has not been a significant change over this time period.
9.2 Buying the same vehicle again?
While the BEV-respondents were asked whether they would buy a BEV again or not, the ICEV-respondents were asked whether they would buy an ICEV again or not. These questions were also posed in the survey in 2016, and hence we can compare the development in how respondents answered to these questions over time. Figure 9.2 shows how the BEV and ICEV-respondents reported to these questions in 2016 and in 2018.
3
70
28
5
75
21
0
20
40
60
80
100
Don't know Never Yes
Avoided a trip
2016 (N=3111) 2018 (N=3659)
3
92
65
91
50
20
40
60
80
100
Don't know Never Yes
Aborted a trip
2016 (N=3111) 2018 (N=3659)

Battery electric vehicle user experiences in Norway’s maturing market
60 Copyright © Institute of Transport Economics, 2019
Figure 9.2: Share of respondents (BEV- and ICEV-respondents) that would like to buy the same vehicle again (BEV and ICEV). Percent. NBEV 2016=3111, NBEV 2018=3659, NICEV 2016=3080, NICEV 2018=2048.
Already in 2018 the share of users that said they would buy a BEV again was extremely high (88%). The Figure shows that there was a further increase in the share of BEV-respondents that would like to buy a BEV between 2016 to 2018, and that there has been a decrease in the share of ICEV-respondents that would like to buy an ICEV again in the same period. Both of these changes are significant (two-sided tests), and indicate a more positive orientation towards electric vehicles and a reduced orientation towards fossil-fuel based vehicles. Additional analyses show that there were little variations in income and number of cars in the household and whether the car in question had been replaced or not, in how respondents responded to these questions. Only a few BEV-respondents reported that they would not buy a BEV again (0.4%, N=15). They were asked to report the two major reasons for why they did not want to buy a BEV again. The responses from these 15 persons is presented in Figure 9.3.
Figure 9.3: Reasons for not wanting to buy a BEV again. Percent. N=15 (BEV-respondents not wanting to buy a BEV again).
As the number of respondents reporting that they did not want to buy a BEV again was low, it is not possible to make any generalizations about their reasons for not buying this type of vehicle again. However, as we can see from Figure 9.3, the major reason (5 persons) given was that the driving range is too limited and that they would rather buy an ICEV (4 persons). Limited range was also the major reason given in the survey in 2016, and from this we can conclude that still some people in 2018 did not consider the range to be satisfactorily. However, it must be pointed out that this concerned very few BEV-respondents, most respondents (94 percent) were willing to buy a BEV again, while the remaining had not decided yet what to do.
88 94
6355
11 6
30 36
0
20
40
60
80
100
BEV 2016 BEV 2018 ICEV 2016 ICEV 2018
Yes No Don't know
7
13
60
27
13
53
0 10 20 30 40 50 60 70
The car's environmental qualities
How the car works in the cold
Limited driving range
Charging challenges
Rather buy a PHEV
Rather buy an ICEV

Battery electric vehicle user experiences in Norway’s maturing market
Copyright © Institute of Transport Economics, 2019 61
The ICEV-respondents who reported that they would not buy an ICEV again, also received the question about the two major reasons for not buying an ICEV again. How they responded to this question both in 2016 (PEV consumer survey) and in 2018 can be seen in Figure 9.4.
Figure 9.4: Reasons for not wanting to buy an ICEV again. Percent. (ICEV-respondents not wanting to buy an ICEV again).
The figure shows that there was a major shift between 2016 and 2018 in the reason for not wanting to buy an ICEV again: In 2018, the share who reported that they would rather buy a PHEV had decreased while the share who reported that they would rather buy a BEV had increased compared to 2016. The changes were significant (two-sided tests). This indicates that there had been a positive shift in the perception of BEVs and PHEVs in the period, with a more positive orientation towards BEVs. In addition, there was a significant (two-sided test) decrease in the share who reported “potential ban of driving in the cities” from 2016 to 2018, which might reflect rather a change in the situation (that is, that the ban in the cities for fossil-based fuel vehicles was more real than potential in 2018 compared with 2016) rather than a change in the reason for not buying an ICEV again. The share who reported “environmental qualities of an ICEV” decreased in the same period, but this change is not significant (two-sided test). There were no other significant differences in the reasons for not wanting to buy an ICEV again in this period (2016-2018).
9.3 Advantages and disadvantages of BEVs
In order to understand barriers for buying a BEV, as well as what might be the driving forces for buying a BEV in the future, the ICEV-respondents were asked about their opinions on the advantages and disadvantages of BEV’s. In the following, these opinions were sorted into three categories:
• Perceptions and opinions of general characteristics of BEVs • Perceptions and opinions of technology specific characteristics of BEVs (EV
specific parameters) • Perceptions and opinions of market and economic characteristics of BEVs
14
57
5
1
21
60
23
11
49
4
0
10
27
55
0 10 20 30 40 50 60 70
Changed transportation requirements/needs
Environmental qualities
Safety qualities
How it operates in cold weather
Potential ban of driving in the cities
Would rather buy a PHEV
Would rather buy a BEV
2018 (N=180) 2016 (N=221)

Battery electric vehicle user experiences in Norway’s maturing market
62 Copyright © Institute of Transport Economics, 2019
9.3.1 Perceptions and opinions of BEVs general characteristics Some of the perceptions on the general characteristics of BEVs was surveyed also in the 2016 survey. Figure 9.5 shows the ICEV-respondents perceptions of advantages and disadvantages of general characteristics of BEVs in both 2018 and 2016.
Figure 9.5: Perception of general characteristics of BEVs among ICEV-respondents in 2016 (N=3080) and in 2018 (N=2048). Percent.**p<0,001 (two-sided test). The environmental influence was perceived as the biggest general advantage of BEVs in both 2018 and 2016. But, there was a small, but significant decrease in the share who perceived the environmental impact of BEVs as an advantage, from 46 percent in 2016 to 37 percent in 2018 ( “large advantage”). In addition, there was an increase in the share who perceived the environmental influence as neither an advantage or a disadvantage in the same period (from 20 to 31 percent). The increase was significant. This might indicate that the environmental characteristics was perceived as less important than before. Apart from the environmental influence, there were few other general characteristics that stood out as being perceived as advantages of BEVs. As for acceleration, the share who perceived this as an advantage was greater than those who perceived this as a disadvantage, both in 2016 and 2018 (no significant changes). Still, in 2018, the vehicle size, was perceived as BEVs biggest disadvantage, which was unchanged since 2016. Next after vehicle size, design and image and safety were perceived as the next greatest disadvantages, although the share who reported these general
119
75
83
72
127
1914
2
5
2
1513
44
118
126
1417
2123
6
14
9
6266
2322
6371
4957
6065
5352
75
58
80
57
2031
910
2024
98
48
11
14
7
86
4637
98
1212
64
33
7
9
2
0 10 20 30 40 50 60 70 80 90 100
Safety 2016Safety 2018
Environment 2016Environment 2018**
Driving comfort 2016Driving comfort 2018
Acceleration 2016Acceleration 2018
Design and image 2016Design and image 2018
Vehicle size 2016Vehicle size 2018
Driving abilities 2018
Reliability 2018
Top speed 2018
Large disadvantage Small disadvantage Neither nor
Small advantage Large advantage

Battery electric vehicle user experiences in Norway’s maturing market
Copyright © Institute of Transport Economics, 2019 63
characteristics as disadvantages (“small” and “large disadvantage”) were relatively small (24 and 22 percent) in 2018, and these perceptions had not changed much between 2016 and 2018. Few perceived acceleration and driving comfort as general disadvantages, both in 2016 and 2018. ICEV owners did not perceive driving comfort of BEVs as neither and advantage or a disadvantage, and this perception had not changed much from 2016 to 2018. In 2018, the respondents were also asked about their perception of top speed, reliability and driving abilities as general advantage/disadvantage of BEVs. As can be seen from Figure 9.5, these general characteristics were perceived neither as a BEV advantage nor as a disadvantage.
9.3.2 Perceptions of technological characteristics As for technological characteristics, here understood as BEV specific parameters, the respondents were asked to give their opinion of the following: Driving range, practical characteristics (trunk, tow bar etc.), home charging, and time to fuel. Figure 9.6 shows how the respondents reported on their perceptions on these characteristics in both 2016 and 2018.
Figure 9.6: Perception of technological characteristics of BEVs among ICEV-respondents in 2018 (N=2048) and in 2016 (N=3080). The driving range were by ICEV owners perceived as the largest disadvantage of the technological characteristics of BEVs. However, there is a tendency that fewer in 2018 than in 2016 regarded this as a disadvantage, as a smaller share reported in 2018 that this was a “large disadvantage” than in 2016 (58 versus 73 percent). The decrease was significant. Even when looking at the total share of those who regarded the driving range as a disadvantage (that is, both “large” and “small” disadvantage) there was a significant difference between 2016 and 2018. This might indicate that – along with the technological advancements of BEVs – the perceptions of the driving range improved in favor of BEVs between 2016 and 2018. Charging time was still perceived as a disadvantage in 2018 as 67 percent reported that this was a small or a large disadvantage. There was not a significant change in this perception between 2016 and 2018.
26
73
58
9
5
40
37
25
16
26
5
7
27
32
38
6
8
23
25
22
24
5
1
2
17
28
4
3
7
4
6
46
35
7
4
0 10 20 30 40 50 60 70 80 90 100
Practical characteristics
Driving range 2016
Driving range 2018
Home charging possibility 2016
Home charging possibility 2018
Charging time 2016
Charging time 2018
Large disadvantage Small disadvantage Neither nor Small advantage Large advantage

Battery electric vehicle user experiences in Norway’s maturing market
64 Copyright © Institute of Transport Economics, 2019
The possibility of charging a BEV at home was perceived as an advantage in both 2016 and 2018. However, a larger share in 2016 perceived this as a “large” advantage compared to 2018 (46 versus 35 percent). The decrease was significant. This result is difficult to interpret, as there is not an obvious reason for why home charging ability should be less favorably rated in 2018 compared to 2016. When looking at the total share (“large” and “small” advantage) who reported this as an advantage, there was no significant change between 2016 and 2018, indicating that the change in perception was small. In 2018, the ICEV respondents were also asked about their perceptions of the practical characteristics of BEVs, such as the size of the trunk and the availability of a tow bar as an option when purchasing a vehicle. 51 percent of the ICEV owners reported that these are negative aspects of BEVs, i.e. being a small or a large disadvantage.
9.3.3 Market and economical characteristics The ICEV owners were also asked about their perceptions of specific market and economical characteristics related to BEVs. Figure 9.7 shows how the ICEV owners reported on their perceptions of these characteristics.
Figure 9.7: Perception of market and economic factors BEVs among ICEV-respondents in 2018 and 2016 (N=2048) and in 2016 (N=3080).
The selection of BEVs on the market was the greatest disadvantage as perceived by ICEV owners in 2018. 51 percent reported that they perceived this as a disadvantage (“large” and “small” disadvantage). This question was not included in the questionnaire in 2016 and hence one cannot evaluate changes in this perception of BEVs. The next greatest disadvantage, was the second hand value. 30 percent regarded this as a small or large disadvantage. However, most ICEV owners did not have a strong perception of the second hand value of BEVs. In 2018, 53 percent report that they perceive this as neither an advantage nor a disadvantage. The same share was 43 percent in 2016. In addition, there was a significant decrease in the share who reported this as a disadvantage (“large” or “small”) from 2016 to 2018 (from 46 to 30 percent). This suggests that it became easier to resale a BEV in this period, and for a better price, or that people has come to realize that there could be a comparable risk of value loss on ICEVs in the future. Energy costs were perceived as the greatest advantage of BEVs among ICEV owners: 54 percent reported that they regarded this as a “large” or “small” advantage in 2018. This question was not posed in 2016. The second next greatest advantage in regard to market and economical characteristics of BEVs, was the purchase price. Compared to 2016, there
3013
159
55
19
1617
1312
812
32
4353
3740
3373
38
511
1723
266
6
66
1816
2845
0 10 20 30 40 50 60 70 80 90 100
Second hand value 2016Second hand value 2018
Purchase price 2016Purchase price 2018
Energy costsBrand
Selection of BEV on the market
Large disadvantage Small disadvantage Neither nor
Small advantage Large advantage

Battery electric vehicle user experiences in Norway’s maturing market
Copyright © Institute of Transport Economics, 2019 65
was a small and significant increase in the share who reported this as a “large” or “small” advantage in 2018 (33 versus 39 percent). Respondents in 2018 also received the question of brand. Few respondents considered brand as either a particular advantage nor a disadvantage of BEVs.
9.3.4 Summary of advantages and disadvantages of BEVs As for 2018, the greatest advantages of BEVs, as perceived by ICEV owners, were the following, ordered by their importance; environmental influence, home charging ability, energy costs, and purchase price. There was a small tendency that fewer ICEV owners perceived environmental impacts as an advantage than in 2016, and that more ICEV owners perceived purchase price as an advantage in 2018 than in 2016. The greatest disadvantages of BEVs, as perceived by ICEV owners in 2018, were the following, again ordered by their importance: driving range, vehicle size, practical characteristics of BEVs (trunk size, tow bar availability etc.), selection of BEVs on the market, vehicle size, and second hand value of BEVs. The driving range as well as the second hand value of a BEV were perceived to a lesser extent as disadvantages in 2018 compared to 2016.

Battery electric vehicle user experiences in Norway’s maturing market
66 Copyright © Institute of Transport Economics, 2019
10 Discussion and conclusions
10.1 Discussion
The BEV-owners – from “early adopters” to “early majority adopters” According to the diffusion theory as described by Rogers (1995), diffusion of innovations normally follows a s-shaped curve with five adopter groups successively adopting the innovation: the innovators (2 %), the early adopters (14 %), the early majority (34 %), late majority (34 %), and laggards (16 %). In 2016, Figenbaum and Kolbenstvedt found that the BEV owners had typical characteristics of being “early adopters”, such as being younger male workers with high education, living in larger households with higher incomes than ICEV owners. In 2018, there are several indications that BEV-owners are becoming more similar to the population of car owners in general in terms of socio-economic characteristics and that they are moving up in the diffusion process to the “early majority” of adopters (Rogers 1995). While the “early adopters” are described by Rogers (1995) as the ones that triggers the critical mass by making judicious decisions on what to adopt and conveying it to peers, the “early majority adopters” are characterized by the motto: “not to be the first, nor be the last to adopt”. In 2018, the BEV owners are in general younger, more educated with higher incomes, living in larger households/having children in the household and are more often living in urban areas compared to ICEV owners. The family workhorse – Charged mainly at home The battery electric car continues to be an everyday workhorse of families in Norway. Families were the dominant owner group in the 2018 survey as they were in the 2016 survey. BEVs were in 2018 used more often for all local trip types (commuting, shopping, escorting children to activities etc) than ICEVs were. This is likely to be associated with the much lower marginal cost of operating a BEV than an ICEV, and that families tend to have larger local transport needs, due to the need to escort children, than other vehicle owning groups. Also retired persons used a BEV more frequently for local trips than an ICEV, but the reason is uncertain. Did they buy a BEV because they were frequent drivers beforehand, or did switching to a BEV make them drive more? BEV owners were on average younger than ICEV owners both among workers and also among those that were retired. BEV owners that were workers had on average 35 percent longer distances between the home and the work location than ICEV owners. 2011 and newer year model BEVs owned by workers were in total driven slightly more km annually than ICEVs of similar aged owned by workers. The annual estimated driving distances were for both groups the same as in 2016, taking into account differences in the survey design. BEV owners tended to have larger households than ICEV owners in 2018. The average household income of BEV owners has apparently gone up since 2016. The frequency of home charging was the same in 2018 as in 2016, 80 percent of users charged 3 times or more per week at home. On average users said the charged about 4.4 times/week at home and about 1.1 times/week at work. The home charging process had become safer with 43 percent using home chargers (Wallbox), a large increase from the 24 percent share that did so in 2016. Only 7 percent of users said they never charged their

Battery electric vehicle user experiences in Norway’s maturing market
Copyright © Institute of Transport Economics, 2019 67
vehicles at home (on own land), whereas another 2 percent said they did it rarer than monthly. For these two groups of BEV owners (9 percent of the total), the average number of recharges per week was 4.3, with 53 percent occurring at work, 29 percent at public chargers and the rest on-street close to home. BEV owners living in apartments charged less often at home (65% weekly or more often) than owners living in detached houses (96% weekly or more often). Long distance driving - a major obstacle or will range suffice? To enable BEVs to take over also single vehicle households they must work for users also on long distance trips, which is now the last hurdle to full mass adoption of BEVs (Figenbaum 2018). The greatest disadvantages of BEVs as perceived by ICEV owners are in order of importance: driving range, vehicle size and practical characteristics (trunk size, tow bar availability etc.), i.e. features that are often necessary for long trips. One of the biggest challenges in a full diffusion of BEVs in Norway will be charging solutions on these trips, especially during peak travel times. The need for charging will depend on how long these trips are and which season these trips are undertaken. A large part of the survey was therefore dedicated to establishing a better understanding of these types of vehicle based trips. BEVs were in 2018 more often used for longer distance trips and vacation than in 2016. The share that said they never use their BEV for vacation trips had gone down from 37 to 27 percent in this period. The results also show that of the two vehicle owning groups, a much higher share of ICEV owners (52 percent) than BEV owners (31 percent) went on the longest trips (>300 km), but the average BEV owner and ICEV owner only do 4 and 6 of these trips respectively per year. Of the four main vacation periods, Summer, Easter, Fall and Winter, Summer was the period when the difference in the stated long distance driving behavior between BEV and ICEV owners was the largest. More ICEV owners than BEV owners said they do long distance trips in this time period. For the other vacation periods, the long distance driving pattern was more equal. The differences between BEV and ICEV owners were about the same when looking separately at households with and without children, workers and non-workers, and single and multi-vehicle households. The reasons for the difference is unclear, whether there are other socio-demographical reasons, or that BEV buyers up to now in general have less long distance driving needs. The summer vacation long distance driving is less problematic for charging infrastructure deployment than the other periods even when taking into consideration that more people go on the longest distance trips in this period. The reasons are that the vehicles range will be at the maximum10, it will be easier for users to drive economically (no need to heat the vehicle), and the summer vacation period is more stretched out in time and geographically than the other vacation periods. The traffic should therefore be spread out more and the earnings from the deployed charging infrastructure will thus be larger. The dominating driving directions in the four vacation periods is not the same. Winter, Easter and fall vacation traffic is directed more towards Norway’s mountainous regions, whereas the summer vacation is directed more towards to coastal zones which will make it even more challenging to establish sufficient fast charger infrastructure to cover vacation traffic peaks.
10 Summer tires, optimum battery temperature, the energy consumption per km will likely be reduced due to average speeds going down on the worst peak travel days.

Battery electric vehicle user experiences in Norway’s maturing market
68 Copyright © Institute of Transport Economics, 2019
Choosing an E-Golf (36 kWh)11 as an example, and assuming that people who responded not relevant on the questions about long distance driving pattern in vacation periods do not do long distance trips, then 54 percent of BEV owners could have done their summer trips between home and long distance destinations without needing to fast charge. If ICEV owners had switched to an E-Golf, then 32 percent of them could have done their summer trips without needing to fast charge. One fast charge (adding 100-150 km range) extends that share to over 70 percent of BEV owners and over 50 percent of ICEV owners. For Easter the numbers without needing fast charging will be about 62-63 percent for both groups (assuming they can charge at the destination, and utilize range fully), increasing to over 80 percent with one fast charge. In the winter vacation the numbers will be even 3-6 percent higher. Fall will be about the same as Easter. Easter is thus likely to be the worst period because of longer travels than in the fall and winter periods, and with an early Easter the ambient temperatures can be low leading to a higher energy consumption from the vehicle. The traffic is also concentrated to just a few days during Easter, but is more spread out for the other periods (Figenbaum 2018). In reality people will need a range margin so the Figures above are a bit optimistic, allowing for a 20-30 km buffer would reduce the shares managing with the range by about 5 percent. Many will drive up to mountain resorts with a higher energy consumption12, so another 5-10 percent margin might be needed for the Easter, fall and winter vacation periods. There is a risk in the winter vacation of very low temperatures seriously affecting range. This risk could deter buyers even though a BEV would work for them in most vacation periods. The E-Golf range is shorter than the range that seems to be the minimum for new models coming on the market in 2019-2022, which will typically be 300-350 km (WLTP), thus adding about 100 km of real world range compared to the E-Golf. Then the Easter period could be doable for 76-78 of BEV/ICEV owners, without fast charge (or 67% with a margin on range), and likely will most of the remaining needs will be covered if users do one fast charge13. These estimates are made under the assumption that the vehicle can be charged at the destination, which is not always the case. BEV owners do however want a bit more real world range than the theoretical calculation above indicates. When asked how much range is needed to take their BEV for all year vacation trips: 43-50 percent of users would be satisfied with 300 km whereas 400 km would increase the share to about 66-70 percent of current BEV owners. A specific but common type of long distance trip in Norway is the trip to the family owned cabin/hut/vacation home (hereafter: cabin), of which there are 464 000 in total (one per five households). Owners tend to stay long in the main vacation period and may need to use a vehicle during the stay, for shopping or as part of the vacation activity. Charging capability at these facilities are therefore important for the diffusion of BEVs. Of the 58 percent of BEV owners that said they have access to vacation homes/cabins, 65 percent said they can charge there, whereas of the 51 percent of ICEV owners with access to such facilities, only 35 percent said that electricity is or can be made available for charging where the vehicle is parked. The average use of these cabins is about the same for both groups. About 27 percent use them less than 6 times per year, 26 percent use them 6-10 times and 27 percent 11-20 times per year. The last 20 percent use them more than 20 times per year. In theory, range needs on peak travel days could be solved to a large extent if vehicle owners driving the longest stretches on peak travel days buy the vehicles and battery
11 36 kWh battery, summer range 230 km (WLTP), winter range estimate (author) 150 km. 12 Lifting a vehicle weighing 1800 kg 800 meters up would require about 4 kWh of potential energy. 13 The driving needs should taper off quickly above 300 km for Easter, fall and winter vacation periods.

Battery electric vehicle user experiences in Norway’s maturing market
Copyright © Institute of Transport Economics, 2019 69
options that have the longest range, so as to reduce the number of vehicles needing fast charge. The market split of the last two years by vehicle segments shown in Figure 10.1 indicates that it can be possible with such a diversification of the market. Long range BEVs are and will increasingly become available in the bestselling segments. In 2019, BEVs with a WLTP range exceeding 400 km are available in the following segments: SUV Luxury, SUV Large, SUV Medium, SUV compact, Luxury vehicle, Medium vehicle, Compact vehicle and Small vehicle. These segments represented 88 percent of the sales in 2018. Many more models will be launched over the coming years in most segments. Besides availability also cost matters. “Expensive vehicles”, i.e. large and luxury (including SUV, MPV and Sport variants) accounted for 19 percent of the total vehicle sales in 2018. Adding medium sized vehicles, which can be termed “relatively expensive”, brings the share to 48 percent. A long range compact or medium sized BEV will definitively be in the price area that these buyers are accustomed to (even if taxes were to be introduced on BEVs). It can therefore be assumed that a large share of vehicle owners have the economic capability to buy a long range BEV. If those with the longest trips on peak travel days buy these long range vehicles then the fast charge infrastructure challenge on peak travel days will become much more manageable.
Figure 10.1: Market shares by vehicle segment 2017 and 2018. Source: OFVAS 2019.
Fast chargers supporting long distance trips were by most (non-Tesla) BEV owners deemed to be acceptable or good when it comes to availability, position and quality and reliability. On about 10 percent rated those attributes as poor. Payment systems were even more favorably rated, with only 5 percent rating them as poor. The satisfaction with these attributes was even higher among Tesla owners. The user perception of the fast charger network has improved substantially between 2016 and 2018. The share of respondents rating fast chargers position and availability as good has for instance gone up from 37 percent in 2016 (Figenbaum and Kolbenstvedt 2016), to 90 percent in 2018. The share rating quality and reliability as good has gone up from 42 percent to 70 percent. Users in 2018 however said that they do experience some charge queues when wanting to fast charge. 12 percent experience them often (10%) or always (2%) in own municipalities, 41% sometimes. On trips to surrounding municipalities and on long distance trips, 14-18% often or always experience queues, about 54% experience queues sometimes.

Battery electric vehicle user experiences in Norway’s maturing market
70 Copyright © Institute of Transport Economics, 2019
Range isn’t everything Range is important but the practicality of the vehicles must not be forgotten. Norwegians expects their vehicles to cover all types of driving needs both when it comes to winter driveability, size and availability of cargo carrying equipment. 32 percent of BEV owners and 41 percent of ICEV owners say that at least one household vehicle should have four wheel drive (4WD), and another 27 percent and 23 percent say it is somewhat important. The lack of 4WD BEVs has therefore been and still is a barrier to BEV adoption in many vehicle segments. Tow hook is more or less mandatory to have on at least one household vehicle. 55 percent of BEV owners and 67 percent of ICEV owners fully agree to the need for a tow hook, and another 27 percent and 19 percent agree somewhat. BEVs are less suitable for towing caravans, due to low if any towing capacity and the high resulting energy consumption (Figenbaum 2018), and only a few BEVs can be equipped with one. Fast charge station layouts are often not suitable for vehicles with caravans or trailers (Figenbaum 2018). 5 percent of households had in 2013 access to caravans (SSB 2019) and for these households BEVs may not be an option yet. Transporting stuff on the roof, or solutions for transportation of bikes, is very important to 34-35 percent of BEV owners and 29 percent of ICEV owners and somewhat important to 28-32 percent and 23-32 percent respectively. As the BEV market matures, these features and solutions will appear on more BEVs and fast charge station layout could be improved, but for now these issues remain to various degree barriers against BEV purchase for some vehicle buyers. Fast charging for long distances Fast charging supports long distance trips in addition to extraordinary local and regional travels. Users said they do about 19 fast charges per year on average. Charge queues are experienced about equally often locally and regionally and a bit more often on long distance trips. 12-18 percent experience queues often or always depending on location and on the county they live and charge in. People in Oslo experience the worst workday charge queues, followed by Akershus and partly Telemark. On long distance trips inhabitants of many counties experience queues, with Telemark, Oppland and Hedmark being the worst. Inhabitants in the latter two experience however little queues within their own municipality. There is some acceptance for fast charge stops and standing in queues among BEV owners. Owners seem to accept between 1-3 stops and 5-20 minutes of charge queues. But these results could be due to a sense of realism for what is possible with the BEV they currently own. About half the users are willing to change travel time on peak travel days to avoid charge queues, but mainly within the same day. The charge time and queue time is not fully wasted. BEV owners report a variety of activities while charging, such as doing e-mails, looking at social media, taking a stroll or using the facilities at the charge station (kiosks, cafés, toilets etc.). The acceptance of queues and charge stops could go down as the consumer groups buying BEVs expands. The introduction of longer range in new BEV models will however work in the other direction. It’s the economy of use that appeals While there are many reasons to buy a vehicle, 56 percent of BEV owners said economy was the most important reason when forced to provide the single most important reason for buying the vehicle, compared to only 8 percent of ICEV owners. The second most

Battery electric vehicle user experiences in Norway’s maturing market
Copyright © Institute of Transport Economics, 2019 71
important reason for BEV owners was environment (18 percent) which was not important at all to ICEV owners. Reliability and buying a practical vehicle was most important among ICEV owners but much less important among BEV owners. The same situation applied when looking at how they rated the various attributes of vehicles, but here both groups put the highest emphasis on reliability and driving abilities. ICEV owners said that comfort, safety and size also are very important vehicle characteristics in the buying process, whereas BEV owners rated range, energy cost and purchase price higher. The importance of economy of use is not surprising as Figenbaum (2018) found that BEV owners can save 2000-3500 Euros per year owning a BEV rather than an ICEV, due to lower energy cost, competitive price and the high monetary value of local incentives. The users own assessment of the average value of local incentives has gone down 10 percent between 2018 and 2016, but the value is still rated as high as 14 000 NOK. The value of access to the bus lanes has gone down substantially while the value of the toll road exemption has gone up, both because of policy changes. BEV owners must now have a passenger in the car when driving in the most busy bus lanes in the rush hours, while toll road prices have gone up around cities, in particular around Oslo. The net effect for Oslo is a slightly higher value, whereas for Akershus it is a small reduction. The largest reduction is seen for Buskerud where users seems to have lost most of the perceived benefit of the access to bus lanes (they now has to have a passenger in the vehicle in the rush hour). New toll roads have also been introduced along some major roads since 2016, leading to an increased value of that incentive in many counties. The toll road exemption is therefore the most important local incentive, accounting for 65% of the average annual value of local incentives. This incentive has increased in importance for BEV buyers since 2016. The availability of local incentives is gradually changing. Bus lanes access will increasingly be restricted during rush hours, to keep bus travel times down. The local monetary incentives can be cut in half as local authorities can introduce half rate of ICEV owners rate for BEV owners in toll roads, for parking and ferries (Figenbaum 2018). Fever challenges and increased willingness to repurchase The challenges of owning a BEV was in general reduced between 2018 and 2016. Fever had in 2018 avoided doing trips with their BEVs compared with 2016, 21 percent vs 28 percent, and the share that has had to abort a trip was unchanged (5-6 percent both years). An even higher share of BEV owners said in 2018 that they will repurchase a BEV compared with 2016 (94 percent vs 88 percent) and the share of don’t know has gone down from 11 percent to 6 percent. Only 15 out of 3659 users said that they will not buy a BEV again. A positive development was also seen among ICEV owners. Fewer said they would repurchase an ICEV (63 percent vs 55 percent) and those that said they would not (9 percent vs 7 percent), were much more inclined to say they would rather buy a BEV than in 2016 (55 percent vs 23 percent), while the opposite was the case for PHEVs (27 percent vs 60 percent). These numbers indicate that BEVs in 2018 had reached a breakthrough among users, and that ICEV owners became more open to buying a BEV. Low marginal cost of driving – a benefit or a risk? Incentives for BEVs can lead to unintended side effects. A key question is if the use of the vehicle is higher when people buy a BEV instead of another vehicle type. This result could be expected based on economic theory, as BEVs have a much lower marginal cost per km than ICEVs. The reason is both the efficient utilization of electricity and the low cost of electricity compared to inefficient use of expensive diesel or gasoline in ICEVs.

Battery electric vehicle user experiences in Norway’s maturing market
72 Copyright © Institute of Transport Economics, 2019
The rebound effect is real when looking at the responses to the survey question about changes to travel behaviour. Users do report to drive more often than before. The overall effect appears however to be small as the increase in the households average total vehicle km insured as reported by the users was only about 2.4 percent. The other potential rebound effect of the BEV policies is a potential for an increase in the total number of vehicles because BEVs are a cheaper means of transport than an ICEV on a total cost of ownership basis. Also here an effect is visible in the data, up to 10 percent of the BEVs are potentially additional vehicles that would not have been bought as ICEVs. The average BEV buyers are however in an age group where increased motorised transportation needs may occur more often, for instance for escorting children, whereas ICEV owners being a bit older have fewer children living in the household. The rebound effect on the number of vehicles can thus be estimated to be less than 10%. It is not possible based on the survey to estimate the effect more accurately.
10.2 Conclusion
The overall conclusion of the survey in 2018 is that the Norwegian BEV market has taken another step towards the normalization of BEVs as a vehicle option for consumers. The socio-demographic differences of BEV owners between 2018 and 2016, points at BEVs moving up the adoption curve towards the majority buyer group. BEV buyers are becoming increasingly like ICEV buyers. A higher share are single vehicle owners than in 2016. A higher share is retired and the average age has gone up to become more equal to ICEV owners. BEV owners had fewer challenges in 2018 than in 2016. A lower share had avoided doing a trip and a higher share used BEVs for long distance trips. The average perceived value of local incentives was somewhat reduced between 2016 and 2018, but the value was still about 14 000 NOK/year per average user. The value of the access to bus lanes has been substantially reduced and the value of the toll road exemption has increased, due to policy changes between 2016 and 2018. BEV owners have become even more loyal to BEVs than they were in 2016 and ICEV owners less sceptical. The low total cost of ownership and marginal cost of use of BEVs could lead to increased km travelled per year per vehicle and more vehicles in total. The first effect seems very small for now, within a few percent, whereas the other effect is potentially up to 10 percent. These parameters could however change when BEVs are taken into use by broader user groups. The fast charger infrastructure has also greatly improved both in the number of fast chargers since the start of 2016 (Figenbaum 2018, 2019), and the experienced availability and quality of the offering. Charge queues has however emerged as a new challenge for some users in some locations.
10.3 Sources of error, reservation
This report has presented results from an online user survey carried out in May/June 2018. The main weakness of the survey is the low response rate of 9-18 percent, although the total number of respondents is nevertheless high among BEV and ICEV owners.

Battery electric vehicle user experiences in Norway’s maturing market
Copyright © Institute of Transport Economics, 2019 73
The survey was designed to be representative of BEV owners (drawn from the EV association (EVA) membership register) and a group of geographically representative ICEV owners drawn from the members of the Norwegian Automobile Association (NAF). Although the response rate was fairly low, the BEV owner sample turned out to be representative both geographically and per share of BEV models in the Norwegian vehicle fleet. The NAF owners are to a larger extent retired than vehicle owners in general. This bias in the material was removed by analyzing NAF and EVA members that are workers and in some cases also limiting the analysis to owners of 2011 (the year BEVs became a real alternative in the market) and newer year models. Surveys can be biased relative to willingness and ability to participate in internet based surveys among different groups. The survey also suffer from general weaknesses of other internet based surveys, such as memory bias, potential misinterpretations, wrong data being typed in (although most of the questions had pre-defined answering alternatives) etc. An advantage of surveys, however, as compared to electronic driving pattern data, is that more information is available to help explain why things are the way they are. Nevertheless, the factual information about driving distances and trip length distributions will be less reliable than data collected from loggers in vehicles.
Battery electric vehicle user experiences in Norway’s maturing market
74 Copyright © Institute of Transport Economics, 2019
11 References
Figenbaum, E. (2019). Charging into the future. Analysis of fast charger usage. TOI report 1682/2019. Institute of Transport Economics.
Figenbaum, E. (2018). Electromobility status in Norway. Mastering long distances – the last hurdle to mass adoption. TOI report 1627/2018. Institute of Transport Economics.
Figenbaum, E. (2017a). Perspectives on Norway’s supercharged electric vehicle policy. Environmental Innovation and Societal Transitions 25 (2017) 14-34.
Figenbaum, E. (2017b). ELAN theoretical framework. Draft working paper 2017. Figenbaum, E., Kolbenstvedt, M. (2016). Learning from Norwegian Battery Electric and Plug-in
Hybrid Vehicle users. Results from a survey of vehicle owners. TØI report 1492/2016. Institute of Transport Economics.
Figenbaum, E. Kolbenstvedt, M., Elvebakk, B. (2014). Electric vehicles – environmental, economic and practical aspects. As seen by current and potential users. Compett and TØI report 1329/2014. Institute of Transport Economics.
Figenbaum, E., Kolbenstvedt, M. (2015a). Pathways to electromobility - perspectives based on Norwegian experiences. TØI, Report 1420/2015. Institute of Transport Economics.
Figenbaum, E., Kolbenstvedt, M. (2015b). Competitive Electric Town Transport. Main results from COMPETT – an Electromobility+ project. TØI report 1422/2015. Institute of Transport Economics
Figenbaum, E., Assum, T., Kolbenstvedt, M. (2015a). Electromobility in Norway – experiences and opportunities. Research in Transportation Economics in 2015. Volume 50, August 2015, Pages 29–38. doi:10.1016/j.retrec.2015.06.004
Figenbaum, E., Fearnley, N., Pfaffenbichler, P., Hjorthol, R., Kolbenstvedt, M. Emmerling, B., Jellinek, F., Bonnema, G. M., Ramjerdi, F., Møller Iversen, L. (2015b). Increasing competitiveness of e-vehicles in Europe. European Transport Research Review September 2015, 7:28. http://link.springer.com/article/10.1007 2Fs12544-015-0177-1#
Fjellinjen 2019. Data from toll road passings in the Oslo-area. Geels, F. W. (2012). A socio-Technical analysis of low-carbon transitions: Introducing the
multi-level perspective into transport studies, Journal of Transport Geography24 (2012) 471-482
Kolbenstvedt, M., Assum, T. 2018. Salg av elbiler – selgernes rolle og kjøpernes forventninger og opplevelser. TOI report 1639/2018. Institute of Transport Economics. https://www.toi.no/publikasjoner/salg-av-elbiler-selgernes-rolle-og-kjopernes-forventninger-og-opplevelser-article35010-8.html
Hjorthol R., Engebretsen L., Uteng T. P. 2014. (in Norwegian) Den nasjonale reisevaneundersøkelsen 2013/14 – Nøkkelrapport. TØI rapport 1383/2014.
NAF 2018. Personal communication with NAF.

Battery electric vehicle user experiences in Norway’s maturing market
Copyright © Institute of Transport Economics, 2019 75
NPRA 2018. Spreadsheet with data on the fleet of BEVs per 01.01.2018 from the Norwegian Public Roads Administrations vehicle register.
SSB 2019 (in Norwegian). Tabell 10453: Husholdninger med utvalgte varige forbruksvarer (prosent), etter varegruppe, statistikkvariabel og år. https://www.ssb.no/statbank/table/10453/


Battery electric vehicle user experiences in Norway’s maturing market
Copyright © Institute of Transport Economics, 2019 77
Appendix 1 Invitation to survey
(The invitation letter was in Norwegian only) Bli med på en spørreundersøkelse om bilbruksvaner og holdninger til ny teknologi ELAN, Electromobility lab Norway, er et forskningsprosjekt som bl.a. skal bidra til kunnskap om holdninger og erfaringer med ulike biltyper. Slik kunnskap gjør det enklere å finne ut hvordan en kan møte forbrukernes behov og redusere klimagassutslippene Hovedmålet til ELAN er forbedret kunnskap om spredning av elektriske kjøretøyer og innovasjonene og strategiene som kreves for å nå Norges ambisiøse nasjonale mål for lavutslippssamfunnet. Norges Automobil-Forbund (NAF) som er landets største forbrukerorganisasjon vil gjerne bidra til kunnskapsoppbygging om norske trafikanters behov og støtter derfor dette «ELAN» studiet som utføres av Transportøkonomisk institutt (TØI). Du har blitt trukket tilfeldig fra NAFs medlemsregister for å delta i undersøkelsen, Vi håper derfor du vil svare på undersøkelsen som tar ca.10-15 minutter.
Du svarer på undersøkelsen ved å klikke på lenken: Klikk her (Her må TØI legge inn link) Det tar 10-15 minutter å svare: Hvis du svarer blir du med i trekning av 3 gavekort på 2000 kroner. Har du spørsmål til undersøkelsen, kan du ta kontakt med Susanne Nordbakke på TØI enten på e-post [email protected] eller mobil 93223988. Deltakelse er frivillig, og du kan når som helst trekke deg. Alle data anonymiseres i tråd med personvernlovgivningen. Ingen av de svarene du oppgir kan tilbakeføres til deg. Undersøkelsen er meldt til Personvernombudet for forskning, NSD - Norsk senter for forskningsdata AS og behandles etter deres regler slik at personvernet ivaretas. Prosjektet avsluttes den 31.12.20.
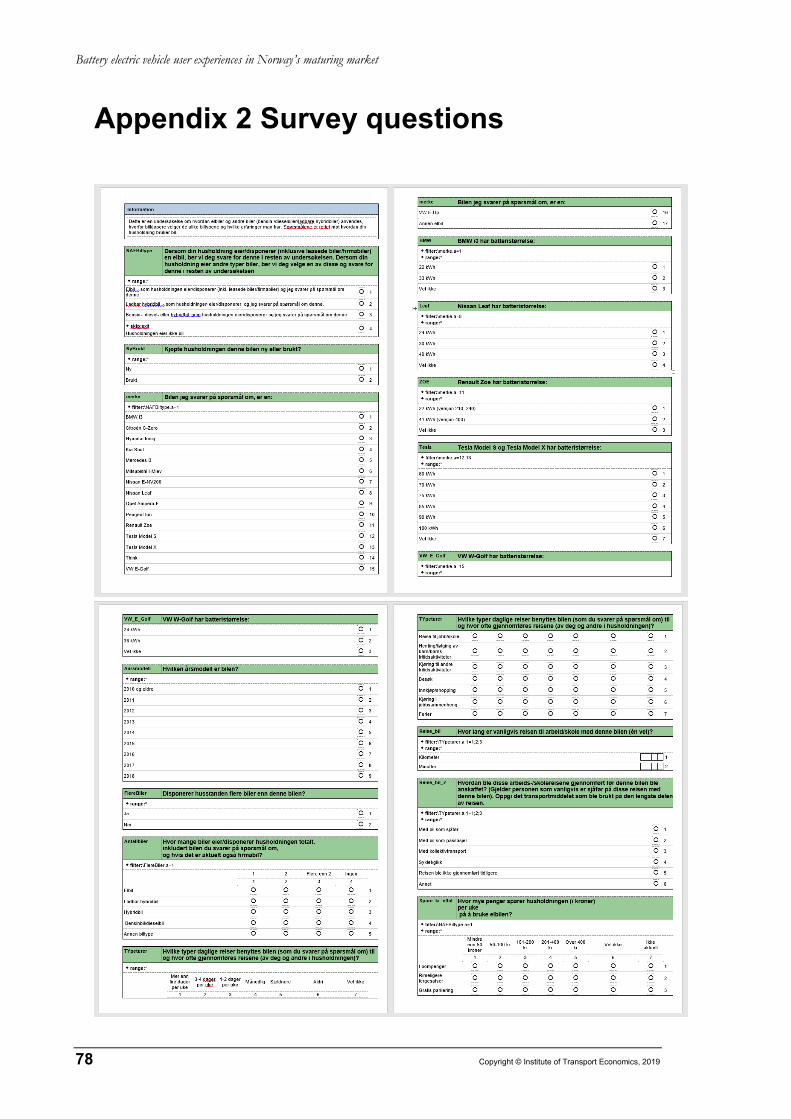
Battery electric vehicle user experiences in Norway’s maturing market
78 Copyright © Institute of Transport Economics, 2019
Appendix 2 Survey questions

Battery electric vehicle user experiences in Norway’s maturing market
Copyright © Institute of Transport Economics, 2019 79

Battery electric vehicle user experiences in Norway’s maturing market
80 Copyright © Institute of Transport Economics, 2019

Battery electric vehicle user experiences in Norway’s maturing market
Copyright © Institute of Transport Economics, 2019 81

Battery electric vehicle user experiences in Norway’s maturing market
82 Copyright © Institute of Transport Economics, 2019
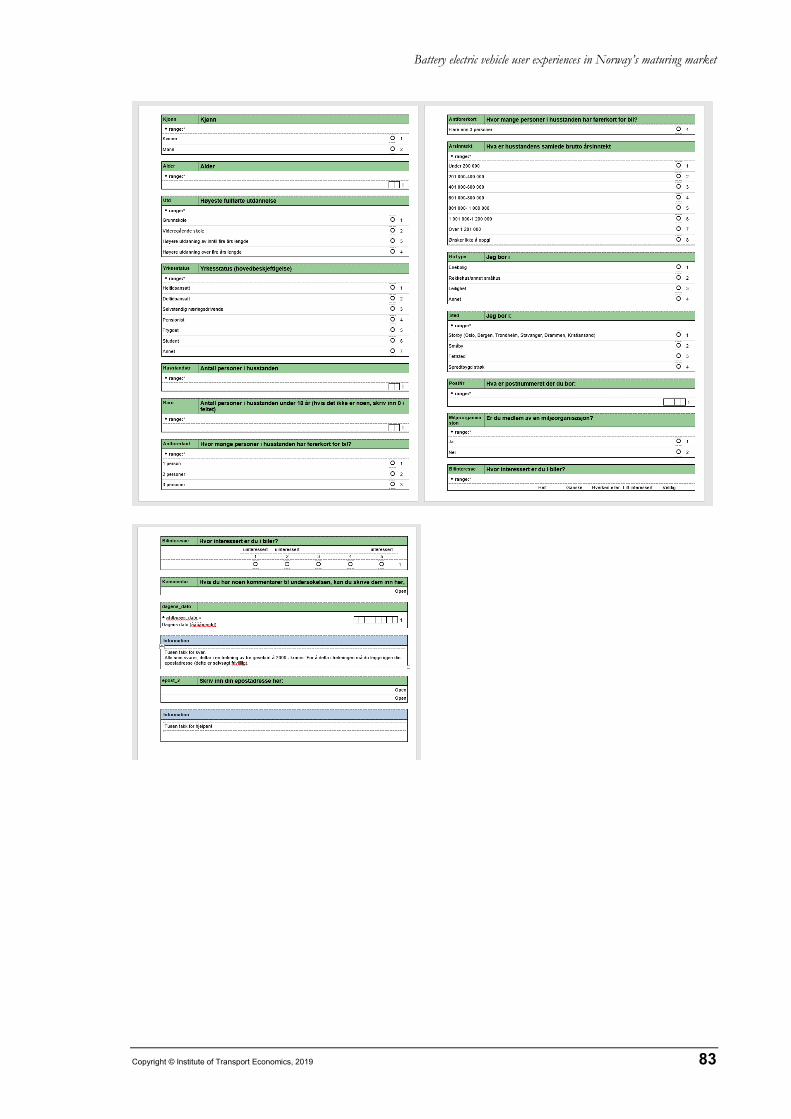
Battery electric vehicle user experiences in Norway’s maturing market
Copyright © Institute of Transport Economics, 2019 83

Battery electric vehicle user experiences in Norway’s maturing market
84 Copyright © Institute of Transport Economics, 2019
Appendix 3 Additional analysis
Table A3.1: How often is the vehicle used for travel to work by having replaced the vehicle with another or not. Percent.
Yes No Don’t know More than four times/week 72,20 70,00 64,90 3-4 days/week 10,80 11,70 5,40 1-2 days/week 5,10 5,60 0,00 Monthly 3,90 4,60 2,70 More seldom 3,50 3,00 10,80 Never 4,40 4,60 16,20 Don’t know 0,10 0,50 0,00 N= 3618 736 37 Total 100,00 100,00 100,00
Table A3.2: Changes in different transport modes after the acquisition of the vehicle by having one or several vehicles in the household. Percent. BEV-respondent (full- or part time employed and self-employed).
Several vehicles (N=725) Only one vehicle (N=324) Use of the car** Less often 8 17 Unchanged 45 30 More often 47 54
Total 100 100 Use of public transport** Less often 35 37 Unchanged 56 44 More often 9 19
Total 100 100 Waling/Cyclingn.s. Less often 15 18 Unchanged 70 61 More often 15 20
Total 100 100
**p<0,001, n.s.=not significant (chi square test)

Battery electric vehicle user experiences in Norway’s maturing market
Copyright © Institute of Transport Economics, 2019 85
Table A3.3: Changes in different transport modes after the acquisition of the vehicle by having replaced the vehicle or not. Percent. BEV-respondent (full- or part time employed and self-employed).
Replaced a vehicle (N=765) Did not replace a vehicle (N=269) Use of a car** Less often 13 5 Unchanged 48 20 More often 39 75
Total 100 100 Use of public transport** Less often 26 61 Unchanged 60 34 More often 14 5 100 100 Walking/cycling** Less often 13 26 Unchanged 67 67 More often 20 7 100 100
**p<0,001, (chi square test)
Table A3.4: Share and type of replaced and additional vehicles among BEV and ICEV owners in 2016 and 2018. Percent.
BEV owners
2016
BEV owners
2018
ICEV owners
2016
ICEV owners
2018 Replaced one or more vehicle, of these: 78 80 88 91 One ICEV 90 94 97 91 One BEV 8 2 Unknown 6 9 Other vehicle types 2 1 Bought an additional vehicle, of these: 22 20 12 9

Battery electric vehicle user experiences in Norway’s maturing market
86 Copyright © Institute of Transport Economics, 2019
Figure A4.1: Share of respondents that report a given reason for acquiring another vehicle to the household, BEV-owners, ICEV-owners, and total (2011 models or newer)/those who had bought an additional vehicle to the household. Percent. BEV- and ICEV-owners (both 2011 models or newer). **p<0,001, *p<0,005 (two-sided test, 2018 numbers). The respondents could report the two most important factors.
20
6
13
13
21
40
39
39
8
18
9
12
36
11
20
4
10
13
19
23
37
34
39
4
11
8
11
34
7
32
0 10 20 30 40 50
Other reasons**
The household has grown in members
The number of driving licenses has increased
Travel needs has changed, children inkindergarten/school**
Change in household location orworkplace/school** 2 kategorier i 16
The public transport supply is too poor(frequency, comfort etc)**
Wish to use another car in the household less**
It is timesaving to travel by car Ikke spurt i 16
2018 ICEV (N=208) 2018 BEV (N=675)
2016 ICEV (N= 375) 2016 BEV (N=678)


Transportøkonomisk institutt (TØI) Stiftelsen Norsk senter for samferdselsforskning TØI er et anvendt forskningsinstitutt, som mottar basisbevilgning fra Norges forskningsråd og gjennomfører forsknings- og utredningsoppdrag for næringsliv og offentlige etater. TØI ble opprettet i 1964 og er organisert som uavhengig stiftelse. TØI utvikler og formidler kunnskap om samferdsel med vitenskapelig kvalitet og praktisk anvendelse. Instituttet har et tverrfaglig miljø med rundt 70 høyt spesialiserte forskere. Instituttet utgir tidsskriftet Samferdsel med 10 nummer i året og driver også forskningsformidling gjennom TØI-rapporter, artikler i vitenskapelige tidsskrifter, samt innlegg og intervjuer i media. TØI-rapportene er gratis tilgjengelige på instituttets hjemmeside www.toi.no.
Besøks- og postadresse: Transportøkonomisk institutt 22 57 38 00 Gaustadalléen 21 [email protected] NO-0349 Oslo www.toi.no
TØI er partner i CIENS Forskningssenter for miljø og samfunn, lokalisert i Forskningsparken nær Universitetet i Oslo (se www. ciens.no). Instituttet deltar aktivt i internasjonalt forsknings- samarbeid, med særlig vekt på EUs rammeprogrammer. TØI dekker alle transportmidler og temaområder innen samferdsel, inkludert trafikksikkerhet, kollektivtransport, klima og miljø, reiseliv, reisevaner og reiseetterspørsel, arealplanlegging, offentlige beslutningsprosesser, næringslivets transporter og generell transportøkonomi. Transportøkonomisk institutt krever opphavsrett til egne arbeider og legger vekt på å opptre uavhengig av oppdragsgiverne i alle faglige analyser og vurderinger.