battery industry
TRANSCRIPT
Please refer to important disclosures at the end of this report 1
Strong performance by the battery industry
The ~Rs9,700cr Indian storage batteries sector (as estimated in FY2010) has anorganised market pegged at around ~Rs7,300cr. Over FY2005-10, the batterysector received a boost with industry revenues recording strong ~30% CAGR andnet income registering ~50% CAGR on the back of changing demographics,which in turn supported the secular growth in consumption in the Indian markets.
Growth momentum to sustain
Overall, we estimate the battery sector to register ~19.7% CAGR in revenues overFY2010-13. For the battery manufacturing companies in India, auto andindustrial growth remains the key revenue driver. Industrial segment revenues areestimated to increase at ~19.4% CAGR during FY2010-13, while we expect theauto battery segment revenues to post a CAGR of ~20% during the mentionedperiod. Moreover, we believe that next few years will continue to be aninvestment phase for these companies, as they are operating at almost ~95%utilisation levels in the automotive battery segment and around ~75% in theindustrial segment.
Robust volumes, stable margins to drive earnings growth
Going ahead, we model margins to contract with the LME lead prices estimatedto increase by around 10% annually, which would gradually be passed on with alag effect. We expect Exide Industries (Exide) to outperform Amara Raja Batteries(ARBL) on the earnings front following the increase in the contribution from thecaptive lead smelter to total consumption of lead (almost ~50%). While Exide isset to emerge a clear winner with earnings CAGR of ~17% due to cost savings onraw material front, ARBL is expected to report ~11% earnings CAGR duringFY2010-13.
High returns profile drives higher valuation, caps downside risks
Over the last few years, the battery manufacturers have clocked significantincrease in return ratios on the back of sustained volume growth and highmargins. On an average, these stocks delivered CAGR returns of ~50-60% overthe last five years. We attribute the steady earnings CAGR of ~50-60% as the keyfactor behind this outperformance. Over the next couple of years, profitability ofthe battery manufacturers would continue to be determined by growing demand.With the industry operating at higher capacity utilisation levels and apparentpricing flexibility would result in RoCE and RoE improving going forward and capdownside risks. We believe that investing in these stocks at current valuationswould fetch good returns for investors as the consumption theme plays out infavour of the Indian market. Thus, we maintain an Accumulate on Exide and Buyon ARBL.
Exide Industries CMP Rs158
Target Price Rs171
Recommendation Accumulate
Market Cap (Rs cr) 13,464
52 Week High/Low 169/87
Avg. Daily Volume 367,791
Reuters Code EXID.BO
Bloomberg Code EXID@IN
Amara Raja Batteries CMP Rs213
Target Price Rs261
Recommendation Buy
Market Cap (Rs cr) 1,818
52 Week High/Low 225/131
Avg. Daily Volume 79,508
Reuters Code AMAR.BO
Bloomberg Code AMRJ@IN
Vaishali Jajoo
022-4040 3800 Ext: 344 [email protected]
Yaresh Kothari
022-4040 3800 Ext: 313 [email protected]
Volume ‘Lead’ growth
Auto Ancillary
September 2010
Valuation Summary
Rating CMP Target Price P/E (x) P/BV (x) EV/EBITDA (x) EV/Sales (x) RoE (%)
(Rs) (Rs) FY11E FY12E FY11E FY12E FY11E FY12E FY11E FY12E FY11E FY12E
Exide Accumulate 158 171 20.4 17.8 4.9 4.0 11.2 9.5 2.5 2.0 26.4 24.5
ARBL Buy 213 261 11.9 9.2 2.7 2.1 6.8 5.6 1.0 0.8 24.8 25.5
HBL Power* Not Rated 28 - 7.8 6.4 1.2 1.0 5.8 4.8 0.9 0.7 16.0 17.0
Source: C-line, Bloomberg, Angel Research; Note: *Consensus, Market price as of September 20, 2010
Battery

Auto Ancillary
September 2010 2
Table of Contents
Industry 3
Strong performance by battery industry 4
Growth momentum to sustain 4
Stable lead price, backward integration helped margin expansion 6
Robust volumes to drive earnings growth 7
Expansion to capture volume growth 7
High returns profile drives higher valuation, caps downside risks 8
Stocks outperform on fundamental grounds – Exide excels 9
Exide re-rates on superior performance 10
Exide - ARBL valuation gap contracts 11
Companies 13
Exide Industries - Defensive appeal 14
Amara Raja Batteries - Catching up 30
Annexure 47
Battery Industry - Overview 48
Automotive batteries – Riding secular growth in auto sector 48
Industrial batteries – Growing with economy 53
Key risks 55

Auto Ancillary
September 2010 3
Industry

Auto Ancillary
September 2010 4
Strong performance by the battery industry
The ~Rs9,700cr Indian storage batteries sector (as estimated in FY2010) has an organised market pegged at around ~Rs7,300cr. Over FY2005-10, the battery sector received a boost with industry revenues recording strong ~30% CAGR and net income registering ~50% CAGR on the back of changing demographics, which in turn supported the secular growth in consumption in the Indian markets.
Exhibit 1: Indian battery market – Growth trend
Source: Industry, Company, Angel Research; Note : * CAGR
Exhibit 2: Battery industry’s revenue break-up
Source: Industry, Company, Angel Research
Growth momentum to sustain
The organised battery sector recorded a CAGR of ~14.1% during FY2008-10 aided by the ~10.2% and ~18.8% CAGR registered by the automotive and industrial batteries segments respectively, during the mentioned period. For the battery manufacturing companies in India, auto and industrial growth remains the key revenue driver. Going ahead, the industrial segment revenues are estimated to increase at ~19.4% CAGR over FY2010-13, while the auto battery segment revenue is estimated to post a CAGR of ~20% during the period. Overall, we estimate the battery sector to register ~19.7% CAGR in revenues over the mentioned period.
Exhibit 3: New vehicle sales, increasing vehicle population and healthy industrial growth drives battery demand
Particular FY08 FY09 FY10P FY11E FY12E FY13E CAGR FY2008-10
CAGR FY2010-13E
New OEM vehicle volume ('000 units) 10,370 10,732 13,155 15,008 16,603 18,258 12.6 11.5
yoy growth (%) 3.5 22.6 14.1 10.6 10.0
Vehicle population* ('000 units) 99,626 106,888 115,759 125,704 136,860 149,549 7.8 8.9
yoy growth (%) 7.3 8.3 8.6 8.9 9.3
Batteries Volume
Automotive volume (mn units) 30.7 35.0 40.6 47.9 54.7 60.4 15.0 14.1
yoy growth (%) 14.0 16.1 18.0 14.0 10.5
OEM volume (mn units) 10.1 11.1 13.4 15.8 17.5 19.0 15.1 12.5
yoy growth (%) 9.9 20.4 18.4 10.5 8.8
Replacement volume (mn units) 20.6 23.9 27.3 32.1 37.2 41.4 15.0 14.9
yoy growth (%) 16.0 14.1 17.8 15.7 11.3
Industrial volume (mnAH) 2,220 3,071 3,625 4,119 4,782 5,517 27.8 15.0
yoy growth (%) 38.3 18.0 13.6 16.1 15.4
Source: Industry, SIAM, Company, Angel Research; Note: *Projected
65
21
7
2418 18
2230
20
76
29
57
14 16 19
29
50
16
0
5
10
15
20
25
01020304050607080
FY
08
FY
09
FY
10
FY
11E
FY
12E
FY
13E
FY
01-1
0*
FY
05-1
0*
FY
10-1
3E*
(%)(%) Revenue growth (%) Net income growthOperating margin (RHS)
59 60
41 40
0%
20%
40%
60%
80%
100%
FY09 FY10
Automobile Industrial

Auto Ancillary
September 2010 5
We expect the auto original equipment (OE) battery volume to register 13-14% CAGR over FY2010-13 aided by healthy ~12% CAGR in automobile volumes. Auto replacement demand is expected to post 14-15% CAGR in volumes during FY2010-13. We believe that sustained auto volume growth has resulted in a large base for the replacement market. Thus, with a sharp increase in vehicle population, we see a corresponding pick up in replacement demand. Further, positive industry (IIP) cycle, increasing demand from railways and UPS segment would support healthy growth of industrial battery segment.
Exhibit 4: Strong auto, industrial growth to boost battery industry’s revenue
Source: Industry, Company, Angel Research; Note : * CAGR
We believe that the Indian battery sector offers an excellent opportunity for investors to cash in on the strong economic growth and emerging consumerism theme in India. We expect Exide and ARBL to register robust ~21% and ~23% CAGR in net sales and ~17% and ~11% CAGR in net profit respectively, during FY2010-13.
Exhibit 5: Angel’s Battery Universe – Financial Projections
(Rs cr) Exide ARBL CAGR FY2010-13E (%)
FY2010 FY2011E FY2012E FY2013E FY2010 FY2011E FY2012E FY2013E Exide Amara Raja
Revenue 3,794 4,788 5,682 6,691 1,465 1,871 2,267 2,727 20.8 23.0
EBITDA 892 1,065 1,218 1,388 281 273 327 385 15.9 11.0
PAT 537 659 757 859 167 152 197 227 16.9 10.7
Source: Company, Angel Research
Exhibit 6: Revenue growth trend
Source: Company, Angel Research; Note * CAGR
40
1
2218 18 19 19
6
14
25
18 17
10
20
0
5
10
15
20
25
30
35
40
45
FY2009 FY2010 FY2011E FY2012E FY2013E FY08-10* FY10-13E*
(%) yoy growth ind. battery revenue yoy growth auto battery revenue
22 17
36
52
19 12
26 19 18
9
26 21
34
54 64
82
21 12
28 21 20
16
44
23
0
20
40
60
80
100
FY05
FY06
FY07
FY08
FY09
FY10
FY11
E
FY12
E
FY13
E
FY00
-05*
FY05
-10*
FY10
-13E
*
(%) Exide ARBL

Auto Ancillary
September 2010 6
Stable lead price, backward integration helped margin expansion
Stable lead prices and smelter acquisition by industry leader, Exide, helped the industry clock higher margins in the last couple of years. As a result, the impact of the fluctuations in the lead prices on margins has reduced in recent quarters particularly for majors like Exide. The lead smelter acquisition has reduced Exide’s dependence on imports and purchase of pure lead from the market owing to which we model it EBITDA margins in the range of 20-22% going ahead. ARBL is expected to operate at margins of around 14-15% going forward.
Exhibit 7: Sensitivity to Exide’s FY12E EBITDA margin
LME Lead prices ($/kg)
1.9 2.2 2.4 2.6 2.9
Rupe
e-D
olla
r ra
te 41.5 34.7 31.6 28.7 26.6 24.7
43.7 32.3 29.3 26.6 25.0 23.0
46.0 26.7 23.9 21.4 20.0 18.8
48.3 28.4 25.7 23.4 22.2 21.6
50.7 24.2 21.7 19.7 18.9 18.6
Source: Bloomberg, Company, Angel Research
Exhibit 8: Sensitivity to ARBL’s FY12E EBITDA margin
LME Lead prices ($/kg)
1.9 2.2 2.4 2.6 2.9
Rupe
e-D
olla
r ra
te 41.5 23.3 19.9 16.8 14.6 12.9
43.7 21.6 18.3 15.5 13.6 12.4
46.0 20.0 16.9 14.4 12.9 12.1
48.3 18.5 15.7 13.5 12.3 12.0
50.7 17.1 14.6 12.8 12.1 12.2
Source: Bloomberg, Company, Angel Research
Exide procures ~50% of its lead requirement from captive smelters and produces recycled lead, which gives it 10-15% of cost advantage. Imports constitute ~30% of its lead consumption. In comparison, ARBL imports around ~60% of its lead requirements on account of which it operates at lower margins to Exide and is more sensitive to the changes in the LME lead prices.
Exhibit 9: High inventory levels to stabilise lead prices
Source: Bloomberg, Company, Angel Research
Exhibit 10: EBITDA margin trend
Source: Company, Angel Research
Going ahead, we model margins to contract with the LME lead prices estimated to increase by around 10% annually, which would gradually be passed on with lag effect.
0
50,000
100,000
150,000
200,000
250,000
0
1,000
2,000
3,000
4,000
5,000
Aug
-01
Aug
-02
Aug
-03
Aug
-04
Aug
-05
Aug
-06
Aug
-07
Aug
-08
Aug
-09
Aug
-10
Lead inventory (RHS) Lead prices (LHS)(USD/tonne) (tonne)
15 16 16 17 16
24 22 21 21
9
13 14 15
11
19
15 14 14
0
5
10
15
20
25
FY05 FY06 FY07 FY08 FY09 FY10 FY11E FY12E FY13E
(%) Exide ARBL
Auto Ancillary
September 2010 7
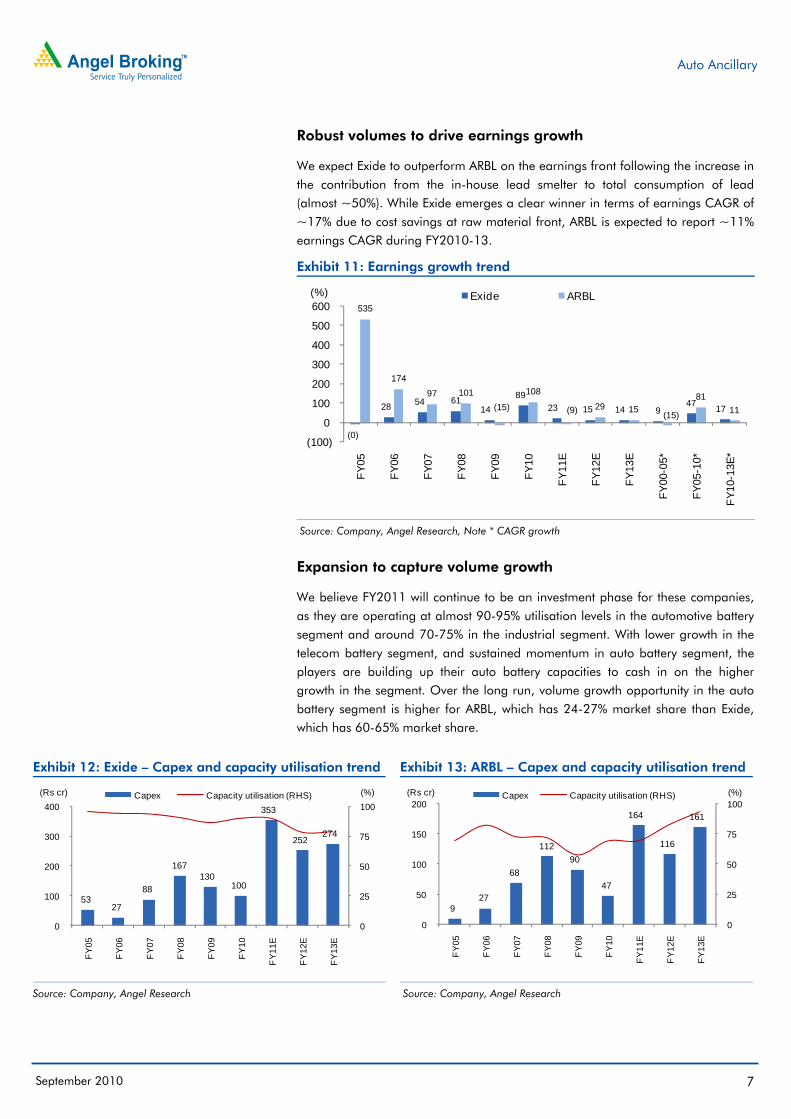
Robust volumes to drive earnings growth
We expect Exide to outperform ARBL on the earnings front following the increase in the contribution from the in-house lead smelter to total consumption of lead (almost ~50%). While Exide emerges a clear winner in terms of earnings CAGR of ~17% due to cost savings at raw material front, ARBL is expected to report ~11% earnings CAGR during FY2010-13.
Exhibit 11: Earnings growth trend
Source: Company, Angel Research, Note * CAGR growth
Expansion to capture volume growth
We believe FY2011 will continue to be an investment phase for these companies, as they are operating at almost 90-95% utilisation levels in the automotive battery segment and around 70-75% in the industrial segment. With lower growth in the telecom battery segment, and sustained momentum in auto battery segment, the players are building up their auto battery capacities to cash in on the higher growth in the segment. Over the long run, volume growth opportunity in the auto battery segment is higher for ARBL, which has 24-27% market share than Exide, which has 60-65% market share.
Exhibit 12: Exide – Capex and capacity utilisation trend
Source: Company, Angel Research
Exhibit 13: ARBL – Capex and capacity utilisation trend
Source: Company, Angel Research
(0)
28 54 61 14
89 23 15 14 9
47 17
535
174 97 101
(15)
108
(9) 29 15 (15)
81 11
(100)
0
100
200
300
400
500
600
FY05
FY06
FY07
FY08
FY09
FY10
FY11
E
FY12
E
FY13
E
FY00
-05*
FY05
-10*
FY10
-13E
*
(%) Exide ARBL
53 27
88
167 130
100
353
252 274
0
25
50
75
100
0
100
200
300
400
FY
05
FY
06
FY
07
FY
08
FY
09
FY
10
FY
11E
FY
12E
FY
13E
(%)(Rs cr) Capex Capacity utilisation (RHS)
9 27
68
112 90
47
164
116
161
0
25
50
75
100
0
50
100
150
200
FY
05
FY
06
FY
07
FY
08
FY
09
FY
10
FY
11E
FY
12E
FY
13E
(%)(Rs cr) Capex Capacity utilisation (RHS)

Auto Ancillary
September 2010 8
Exhibit 14: Exide – Capex v/s FCF
Source: Company, Angel Research
Exhibit 15: ARBL – Capex v/s FCF
Source: Company, Angel Research
We believe that both the companies are well placed in terms of funding their expansion plans owing to strong operating cash flow and low debt/equity ratio. The capacity expansions would broadly be funded through internal accruals.
Exhibit 16: Debt/Equity trend
Source: Company, Angel Research
Exhibit 17: Asset turnover trend
Source: Company, Angel Research
High returns profile drives higher valuation, caps downside risks
Over the last few years, the battery manufacturers have clocked significant increase in return ratios on the back of sustained volume growth and high margins. Going ahead, over the next couple of years, profitability of the battery manufacturers would continue to be determined largely by growing demand. Further, on the back of higher capacity utilisation levels and apparent pricing flexibility the high levels of RoCE and RoE would be maintained going forward in turn capping downside risks.
53 2788
167130 100
353
252 274
42
194
10733
313
459
370
490
617
0
200
400
600
800
FY05 FY06 FY07 FY08 FY09 FY10 FY11E FY12E FY13E
(Rs cr) Capex FCF
927
68
11290
47
164
116
161
(5) (2)
(112)(149)
94
169
(93)
27 22
(200)
(150)
(100)
(50)
0
50
100
150
200
FY05 FY06 FY07 FY08 FY09 FY10 FY11E FY12E FY13E
(Rs cr) Capex FCF
0.6 0.5 0.5
0.3 0.3
0.0 0.0 0.0 0.0 0.1
0.2
0.6
0.9
0.7
0.20.2
0.10.1
0.0
0.2
0.4
0.6
0.8
1.0
FY05 FY06 FY07 FY08 FY09 FY10 FY11E FY12E FY13E
(%) Exide ARBL
1.5 1.7
2.0
2.8 2.9 2.9 3.1 3.1 3.2
1.4
1.9 2.1 2.3 2.2
2.5 2.8 2.8 2.8
0.0
0.5
1.0
1.5
2.0
2.5
3.0
3.5
FY
05
FY
06
FY
07
FY
08
FY
09
FY
10
FY
11E
FY
12E
FY
13E
(%) Exide ARBL

Auto Ancillary
September 2010 9
Exhibit 18: RoE
Source: Company, Angel Research
Exhibit 19: RoCE
Source: Company, Angel Research
Strong auto and industrial volumes and higher contribution from backward integration coupled with a significant correction in input costs led to consistent earnings upgrades driving the outperformance of the stocks. Going ahead too, with the long-term consumption story of India intact, we expect the companies (Exide and ARBL) to continue to outperform the benchmark indices.
Stocks outperform on fundamental grounds – Exide excels
On the bourses, over the past ten years, most battery stocks broadly outperformed the benchmark indices reflecting sustained volume growth, significant margin expansion and steady earnings growth. Exide in particular registered superior performance during the period.
Exhibit 20: Exide, ARBL outperform benchmark
Source: Bloomberg, Angel Research
Exhibit 21: ARBL outperforms on higher earnings growth
Source: Bloomberg, Angel Research
In the recent past, most battery players witnessed a sharp rally and touched their life-time highs. Leader Exide is perceived as a defensive play (low beta) due to consistent growth performance, strong cash-flow and prudent execution track record. Thus, during the economic downturn it not only exhibited significant strength, but also outperformed the benchmark indices over the last five years. ARBL followed suit with strong growth in the industrial battery segment (telecom). Nonetheless, the ARBL stock fluctuated and reflected the growth contraction during the period due to contraction in demand of telecom batteries.
Over FY2005-10, ARBL has shown relative outperformance to Exide largely owing to higher contribution from the telecom battery segment. However, the recent structural shift in the telecom industry has impacted the industrial telecom battery
18 20
25 30
25
31 26 24 23
5
12
21
33
22
35
25 25 23
0
10
20
30
40
FY
05
FY
06
FY
07
FY
08
FY
09
FY
10
FY
11E
FY
12E
FY
13E
(%) Exide ARBL
16 20
26
33 32
41 37 34 32
3
13
20 26
17
35
28 29 29
0
10
20
30
40
50
FY
05
FY
06
FY
07
FY
08
FY
09
FY
10
FY
11E
FY
12E
FY
13E
(%) Exide ARBL
0
1,000
2,000
3,000
4,000
5,000
6,000
Apr
-01
Dec
-01
Aug
-02
Apr
-03
Dec
-03
Aug
-04
Apr
-05
Dec
-05
Aug
-06
Apr
-07
Dec
-07
Aug
-08
Apr
-09
Dec
-09
Aug
-10
Sensex ARBL Exide
0
500
1,000
1,500
2,000
Apr
-05
Sep-
05
Feb-
06
Jul-0
6
Dec
-06
May
-07
Oct
-07
Mar
-08
Aug
-08
Jan-
09
Jun-
09
Nov
-09
Apr
-10
Sep-
10
Sensex ARBL Exide

Auto Ancillary
September 2010 10
business of these companies, wherein the demand for telecom batteries has seen a sharp correction in the growth rate. This in turn resulted in loss of bargaining power and lower realisation from the telecom battery segment. As a result, companies generating higher revenues from the telecom battery segment (ARBL and HBL) relatively underperformed the market leader, Exide, in the recent past.
Exhibit 22: Absolute and relative performance CMP (Rs) 1 Month 3 Month 6 Month 1 Year 3 Year 5 Year
Absolute Returns (%)
Exide 158 7.5 23.7 37.0 73.6 163.7 681.1 Amara Raja 213 12.9 21.5 27.5 54.1 121.2 896.0 HBL 28 14.1 (12.2) (19.9) (17.3) (17.2) 7.8 BSE Auto 9,397 5.9 15.5 23.2 42.3 82.9 162.5 BSE Sensex 19,906 8.2 13.3 13.2 18.9 21.8 134.2 Relative Returns v/s Sensex (%)
Exide 158 (0.7) 10.4 23.8 54.7 142.0 546.9 Amara Raja 213 4.7 8.2 14.3 35.2 99.4 761.8 HBL 28 5.9 (25.5) (33.1) (36.2) (38.9) (126.4) BSE Auto 9,397 (2.3) 2.2 9.9 23.4 61.2 28.3
Source: Bloomberg, Angel Research; Note: Market price as of September 20, 2010
On an average, these stocks delivered CAGR returns of ~50-60% over the last five years. We attribute the steady earnings CAGR of ~50-60% as the key factor behind this outperformance.
Exide re-rates on superior performance
In terms of their one-year forward P/Es, most companies are trading in line with their three-year averages, but at a ~20-30% discount to their peak valuations of FY2007-08. The P/E of Exide has sharply expanded in the past five years on the back of growth in domestic volumes. We note that, Exide’s multiple expansion and investment strategies along with backward integration accelerated in FY2008. Moreover, the company is immune to the fiscal pressures in the developed markets owing to which there has been high appetite for such defensives during the global downturn. On the other hand, companies generating higher revenues from industrial battery segment like ARBL have relatively underperformed due to reduced demand in telecom segment batteries in the last couple of years.
Exhibit 23: Exide – P/E multiple expands
Source: Bloomberg, Company, Angel Research
Exhibit 24: ARBL – P/E tracked industry cycle
Source: Bloomberg, Company, Angel Research
0
5
10
15
20
25
30
Apr
-01
Dec
-01
Aug
-02
Apr
-03
Dec
-03
Aug
-04
Apr
-05
Dec
-05
Aug
-06
Apr
-07
Dec
-07
Aug
-08
Apr
-09
Dec
-09
Aug
-10
One-yr forward P/E Three-yr average P/E
Long term average P/E(x)
0
5
10
15
20
25
30
Apr
-01
Dec
-01
Aug
-02
Apr
-03
Dec
-03
Aug
-04
Apr
-05
Dec
-05
Aug
-06
Apr
-07
Dec
-07
Aug
-08
Apr
-09
Dec
-09
Aug
-10
One-yr forward P/E Three-yr average P/ELong term average P/E
(x)

Auto Ancillary
September 2010 11
Exide - ARBL valuation gap contracts
ARBL entered the auto battery segment in 2000 and gained significant market share, which was captured in the stock performance over FY2001-03 and it traded at a significant premium to leader Exide. However, simultaneously ARBL also increased its investments in the industrial (specifically telecom) battery segment, and the stock tracked the industry cycles. Thus, ARBL’s latest underperformance to Exide reflected the lower demand for telecom battery segment.
Exhibit 25: Exide, ARBL – Relative P/E performance
Source: Bloomberg, Company, Angel Research
Exhibit 26: ARBL – Premium/Discount to Exide
Source: Bloomberg, Company, Angel Research; Note: Exide P/E adjusted for
Insurance business
ARBL is currently trading at ~35% discount to industry leader, Exide (adjusted for insurance business). The gap is due to Exide's leadership position, higher margins (backward integration through acquisition of lead smelters) and its less dependence on the telecom battery segment. However, ARBL products have exhibited strong performance and continuously increased market share through innovative marketing strategies over the last ten years. ARBL is also in the process of channelising its efforts to increase market share in the auto battery segment through capacity, technology, customer and market expansion. Improved fundamentals are expected to perk up the company’s return ratios compared to its historical levels. Thus, ARBL’s valuation has increased on sustained volume growth and earnings visibility, and the valuation gap with Exide has reduced to reasonable levels of ~35% (as against five year average discount of ~50%).
We believe that investing in these stocks at current valuations would fetch good returns for investors as the consumption theme plays out in favour of the Indian market.
Exhibit 27: Global valuation – Relative
(US $mn) P/E (x) P/B (x) EV/EBITDA (x) EV/Sales (x)
Market Cap Sales* PAT* FY11E FY12E FY11E FY12E FY11E FY12E FY11E FY12E
Exide Technologies, USA 371 2,685 (12) 9.0 6.7 - - 4.4 4.0 0.1 0.1
Johnson Controls# 19,923 28,497 (338) 15.1 12.3 2.0 1.8 9.2 7.5 0.6 0.5
GS Yuasa Corp 2,911 2,666 70 28.8 22.6 2.3 2.2 10.5 8.7 0.9 0.8
Enersys 1,240 1,579 62 11.8 9.9 - - 6.7 5.7 0.7 0.6
Exide Industries 2,946 830 118 20.4 17.8 4.9 4.0 11.2 9.5 2.5 2.0
Amara Raja Batteries 398 321 37 11.9 9.2 2.7 2.1 6.8 5.6 1.0 0.8
HBL Power System 155 243 22 7.8 6.4 1.2 1.0 5.8 4.8 0.9 0.7
Source: Bloomberg, Company, Angel Research; Note: # Year end September, * Latest financial year-end, Market price as on September 20, 2010
0
5
10
15
20
25
30
Apr-
01
Dec
-01
Aug
-02
Apr-
03
Dec
-03
Aug
-04
Apr-
05
Dec
-05
Aug
-06
Apr-
07
Dec
-07
Aug
-08
Apr-
09
Dec
-09
Aug
-10
(x) AMRL Exide Adj. for Insurance
(90)(80)(70)(60)(50)(40)(30)(20)(10)
0
Apr
-04
Nov
-04
Jun-
05
Jan-
06
Aug-
06
Mar
-07
Oct
-07
May
-08
Dec
-08
Jul-0
9
Feb
-10
Sep-
10
(%) prem./ disc. to Exide Three-yr average Prem/DiscFive-yr average Prem/Disc

Auto Ancillary
September 2010 12
Exhibit 28: EV/Sales
Source: Bloomberg, Company, Angel Research
Exhibit 29: EV/EBITDA
Source: Bloomberg, Company, Angel Research
Exhibit 30: P/E
Source: Bloomberg, Company, Angel Research
Exhibit 31: P/CEPS
Source: Bloomberg, Company, Angel Research
Exhibit 32: P/BV
Source: Bloomberg, Company, Angel Research
Exhibit 33: PEG
Source: Bloomberg, Company, Angel Research
3.2
2.5
2.01.7
1.21.0
0.8 0.7
0
1
1
2
2
3
3
4
FY10 FY11E FY12E FY13E
Exide ARBL(x)14
11
9 8
7 7 6
5
0
5
10
15
FY10 FY11E FY12E FY13E
(x) Exide ARBL
25
20 18
16
11 12 9 8
0
10
20
30
FY10 FY11E FY12E FY13E
(x) Exide ARBL
22
1816
14
9 97 6
0
5
10
15
20
25
FY10 FY11E FY12E FY13E
(x) Exide ARBL
6
5
4 3 3
3 2
2
0
2
4
6
8
FY10 FY11E FY12E FY13E
(x) Exide ARBL
0.3
0.9
1.2 1.2
0.1
0.3
0.5
0.0
0.2
0.4
0.6
0.8
1.0
1.2
1.4
FY10 FY11E FY12E FY13E
Exide ARBL(x)

Auto Ancillary
September 2010 13
Companies

Please refer to important disclosures at the end of this report 14
Exide Industries is a leader in the domestic battery industry. Strong brand image and capacity addition will enable Exide to cater to the burgeoning demand for auto and industrial batteries, offering a clear growth visibility going ahead. Moreover, with increased lead sourcing from captive smelters and focus on higher-margin replacement segment will improve profitability and return ratios. At Rs158, the stock is trading at 20.4x FY2011E and 17.8x FY2012E earnings. We estimate Exide to post a 21.1% revenue CAGR over FY2010–13E, leading to a 16.9% earnings CAGR. We maintain Accumulate on the stock with an SOTP Target Price of Rs171. Owing to Exide’s defensive appeal and healthy and consistent fundamentals, we value its core operations at 17.3x (20% premium to historical average of 14.4x) its FY2012E earnings at Rs154. We have valued Exide’s stake in ING Vysya Life Insurance at Rs11/share on FY2012E NBAP and have assigned a value of Rs6/share to lead smelters (8x FY2012E PAT).
Robust demand scenario for automotive and industrial batteries: We expect auto and industrial battery market to post revenue CAGRs of 20% and 19.4%, respectively, over FY2010–13E, driven by strong demand for batteries. As such, we expect Exide to register revenue CAGRs of 20.9% and 21.7% in auto and industrial batteries, respectively, leading to overall gross revenue growth of 21.1%.
Market leader with wider reach and strong pricing power: Exide enjoys a firm pricing power, owing to its strong brand equity and well-entrenched pan India distribution network. We believe Exide is in a position to leverage its market leadership and pricing power to pass on cost increases, thereby improving its realisation, which is estimated to register a ~6% CAGR over FY2010–13E.
Captive sourcing reduces impact of lead price volatility: Exide expects to increase lead sourcing from captive smelters to ~70% in FY2012E (~50% in FY2010). We believe captive sourcing of lead reduces the raw material costs by 10-15%. Thus, our sensitivity analysis suggests that every 10% increase in sourcing from the captive smelters results in EBITDA margins expanding by ~50bp (assuming stable lead prices).
Capacity expansion to increase volumes: To cater to growing demand, Exide plans to increase its two-wheeler and four-wheeler battery capacity by 28% and 60%, respectively, with an investment of Rs400cr in FY2011E. With utilisation set to remain at high levels, we expect Exide to post volume CAGRs of 13.9% and 15.6% in the auto and industrial battery segments, respectively.
Key Financials
Y/E March (Rs cr) FY2009 FY2010 FY2011E FY2012E
Net Sales 3,393 3,794 4,788 5,682
% chg 19.3 11.8 26.2 18.7
Net Profit 283 537 659 757
% chg 14.2 89.7 22.6 14.9
EBITDA (%) 16.1 23.5 22.2 21.4
EPS (Rs) 3.6 6.3 7.7 8.9
P/E (x) 44.6 25.1 20.4 17.8
P/BV (x) 10.4 6.1 4.9 4.0
RoE (%) 25.0 31.0 26.4 24.5
RoCE (%) 31.7 40.8 36.6 34.3
EV/Sales (x) 3.9 3.2 2.5 2.0
EV/EBITDA (x) 23.9 13.7 11.2 9.5 Source: Company, Angel Research; Note: Market price as on September 20, 2010
ACCUMULATE CMP Rs158 Target Price Rs171
Investment Period 12 Months Stock Info
Sector
Bloomberg Code
Shareholding Pattern (%)
Promoters 46.0
MF / Banks / Indian Fls 28.0
FII / NRIs / OCBs 14.5
Indian Public / Others 11.5
Abs. (%) 3m 1yr 3yr
Sensex 13.3 18.9 21.8
Exide Industries 23.7 73.6 163.7
Face Value (Rs)
BSE Sensex
Nifty
Reuters Code
13,464
0.65
169/87
367,791
Auto Ancillary
Avg. Daily Volume
Market Cap (Rs cr)
Beta
52 Week High / Low
1
19,906
5,980
EXID.BO
EXID@IN
Vaishali Jajoo
022-4040 3800 Ext: 344 [email protected]
Yaresh Kothari
022-4040 3800 Ext: 313 [email protected]
Exide Industries Defensive appeal
Auto Ancillary
September 2010

Exide Industries | Auto Ancillary
September 2010 15
Investment rationale
Auto and industrial batteries: Robust demand scenario
The automotive and industrial battery segments have been witnessing strong growth post the economic downturn, driven by robust demand-pull on account of higher auto and industrial production and increased consumer spending. We expect the auto and industrial battery segments to continue to grow, generating robust revenue CAGRs of ~20% and ~19.4%, respectively, over FY2010–13E. Hence, we forecast Exide to register strong revenue CAGRs of 20.9% and 21.7% in the auto and industrial battery segments, respectively.
Automotive OEM segment
The automotive OEM segment has registered strong sales volume post the economic downturn, and domestic demand continues to witness a strong traction across all segments. The prospect for automotive batteries looks encouraging, supported by the fact that major global automotive players have set up their base in India due to low production cost and lower penetration levels. We expect volume growth to be robust and forecast passenger vehicles, commercial vehicles and two-wheelers to post CAGRs of ~13%, ~12% and ~11%, respectively, in sales between FY2010–13E, leading to sustainable demand for batteries. Consequently, Exide, which caters to 65–67% of OEM demand, is set to benefit from the expected surge in vehicle production over FY2010–13E.
Exhibit 1: Volumes to maintain growth momentum
Source: Company, Angel Research
Exhibit 2: Auto battery revenue to register 20.9% CAGR
Source: Company, Angel Research
Automotive replacement segment
The average life of an automotive battery is 3–4 years, after which it needs to be replaced; there could be as much as three battery replacements in a vehicle’s life. Going ahead, demand for replacement batteries is expected to continue to be buoyant, led by a strong base of vehicles and burgeoning automotive OEM sales.
Exide derives 48–50% of its overall revenue from the automotive replacement segment. The company has a 60-62% market share in the branded replacement market. Exide is looking to expand its market share at the cost of unorganised players, using its excellent sales and distribution network. We believe Exide is well placed to capitalise on the opportunity going ahead, given a promising outlook for the replacement market.
11.9 13.2
14.5 15.8
18.8 21.2
23.3
(5)
0
5
10
15
20
25
0
5
10
15
20
25
FY07 FY08 FY09 FY10 FY11E FY12E FY13E
(%)(mn units) Auto battery volume yoy growth (RHS)
1,668
2,561 2,905 3,108
3,975
4,683
5,495
0
10
20
30
40
50
60
0
1,000
2,000
3,000
4,000
5,000
6,000
FY07 FY08 FY09 FY10 FY11E FY12E FY13E
(%)(Rs cr) Auto battery revenue yoy growth (RHS)
Exide derives ~69% and 31% of its revenuefrom the automotive and industrial batterysegments, respectively
Exide derives 48–50% of its overallrevenue from the automotive replacementsegment

Exide Industries | Auto Ancillary
September 2010 16
Industrial battery segment
Demand for industrial batteries surged in last ten years largely owing to favourable economic scenario and growth in industrial activity. Further, during FY2007-09, largely due to significant boom in the telecom sector the segment recorded substantial jump in volumes. (Telecom sector uses batteries as a backup power source for telecom towers.) However, due to the slowdown in the telecom space, we expect demand for telecom batteries to remain subdued. Demand will mainly be driven by replacement demand for telecom batteries, which have a useful life of 5–6 years.
Exhibit 3: Ind. battery volumes to post a 15.6% CAGR
Source: Company, Angel Research
Exhibit 4: ...driving growth in industrial revenue
Source: Company, Angel Research
We expect industrial battery demand to be mainly driven by demand from the power back-up segment (UPS) and railways. Over the last five years, battery demand in the UPS/inverter segment has witnessed a 15% CAGR, driven by large-scale computerisation of banking networks and government departments and power deficit over the last few years (10.1% in FY2010). We believe demand for UPS/inverter batteries will continue to grow, as the power demand-supply gap will continue over the medium term, with deficit to be ~7.0% in FY2013E.
959 1,170
1,324 1,450
1,717
1,992
2,238
0
5
10
15
20
25
0
500
1,000
1,500
2,000
2,500
FY07 FY08 FY09 FY10 FY11E FY12E FY13E
(%)(mnAH) Ind battery volume (mnAH) yoy growth (RHS)
715
1,019 1,269
1,397
1,753
2,117
2,516
0
5
10
15
20
25
30
35
40
45
0
500
1,000
1,500
2,000
2,500
3,000
FY07 FY08 FY09 FY10 FY11E FY12E FY13E
(%)(Rs cr) Ind battery revenue yoy growth (RHS)
UPS/inverter batteries to drive industrialbattery demand
Industrial battery segment’s revenue topost a 21.7% CAGR over FY2010–13E

Exide Industries | Auto Ancillary
September 2010 17
Market leader with wider reach and strong pricing power
Exide is a dominant player in the automotive battery (OEM and replacement) and industrial battery segments with market share of 60-65% and 40–45% respectively.
Exide has leveraged upon its brand equity, better quality proposition and wider reach to consolidate its position in the market, which gives it a superior pricing power compared to peers. Over the years, Exide has been able to improve its realisation across the automobile and industrial battery businesses, which has more than offset the movements in input prices. We expect Exide to continue to leverage upon its market leadership position and pricing power, which would enhance the company’s ability to pass on cost increases in the future as well. Hence, we expect average realisation to grow at a ~6% CAGR over FY2010–13E.
Exhibit 5: Market share across segments
Source: Company, Angel Research
Exhibit 6: Average realisation to remain strong
Source: Company, Angel Research
Along with strong brand equity, Exide has a well-entrenched distribution network across India. The company has close to 38,500 retail outlets for aftermarket sales, over 9,000 main dealers and 210 hub offices, which the company plans to increase to 250 by the end of FY2011E and further to 510 by FY2013E. Exide operates through authorised distributors and dealers who, in addition to selling to consumers, sell to a tertiary distribution network, which constitutes garages and is called the ‘Humsafar Partner’ network (~21,970 partners). The company also has a separate distribution network called the ’C Dealer’ network (~500 dealers) for heavy commercial vehicles and ‘Kisaan Dealer’ network (~3,197 dealers) for tractors. On the back of its excellent service and distribution network, which is the largest among battery manufacturers, Exide continues to penetrate the replacement market.
6575
3762
5535
4080
9030
35
0 25 50 75 100
Auto (OE)Auto (OE) - PV
Auto (Replacement) incl. unorganisedBranded (Replacement)
Two WheelersPower ProjectsUPS/Inverters
TractionCap Lamps
TelecomRailways
(%)(10)
0
10
20
30
40
50
0
500
1,000
1,500
2,000
2,500
3,000
FY07 FY08 FY09 FY10 FY11E FY12E FY13E
(%)(Rs) Average realisation/unit yoy growth (RHS)

Exide Industries | Auto Ancillary
September 2010 18
Captive lead sourcing reduces impact of lead price volatility
Lead is the key raw material for Exide, accounting for 75–80% of its raw-material cost. The company acquired two smelters to recycle used lead. This helped in reducing the vulnerability of rising lead prices and augmented domestic availability of lead for Exide. These acquisitions helped Exide to increase its use of recycled lead and lead alloys for making storage batteries. This, in turn, reduced the company's dependence on imported lead in FY2010 to ~32% (~36% in FY2009).
Total lead supplied by the captive smelter increased to ~50% in FY2010 from ~35% in FY2009. Exide has benefitted from its captive sourcing strategy, as lead sourcing from captive smelters is 10–15% cheaper compared to market rates. Margins during FY2010 were substantially higher compared to average margins of 18.1% in FY2007–10.
Exhibit 7: Lead prices v/s EBITDA margin
Source: Bloomberg, Company, Angel Research
Exhibit 8: Captive lead sourcing benefits Exide
Source: Company, Angel Research
Going forward, the company plans to further increase sourcing from its smelters to ~55% in FY2011E and ~70% by FY2012E. Hence, the company is expanding its lead smelter capacity to 100,000tpa by March 2011. Going ahead, we model margins to contract with the LME lead prices estimated to increase by around ~10% annually, which would gradually be passed on with lag effect. We expect Exide to leverage upon its low-cost structure relative to its competitors.
We have assumed a ~10% increase in lead prices in FY2011E, from ~US $1,990/tonne to ~US $2,180/tonne, followed by another ~10% rise in FY2012E to ~US $2,400/tonne.
0
5
10
15
20
25
30
0
500
1,000
1,500
2,000
2,500
3,000
3,500
1QF
Y08
2QF
Y08
3QF
Y08
4QF
Y08
1QF
Y09
2QF
Y09
3QF
Y09
4QF
Y09
1QF
Y10
2QF
Y10
3QF
Y10
4QF
Y10
1QF
Y11
FY
11E
FY
12E
FY
13E
(%)(US $/tonne) Avg. Lead Price (LHS) EBITDA Margin (RHS)
0
5
10
15
20
25
0
10
20
30
40
50
60
70
80
FY07 FY08 FY09 FY10 FY11E FY12E FY13E
(%)(%) Captive consumption EBITDA Margin (RHS)
Exide acquired 100% in Tandon Metalsin October 2007 and 51% in LeadageAlloys in June 2008. In August 2010,the stake in Leadage Alloys wasincreased to 100%

Exide Industries | Auto Ancillary
September 2010 19
Exhibit 9: Impact of captive sourcing on FY2012E EBITDA margins
Cap
tive
sour
cing
(%) Lead price (Rs/kg)
114.7 120.7 127.1 133.5 140.1
70 26.1 23.8 21.4 19.1 16.6
60 25.6 23.3 20.9 18.5 16.0
50 25.1 22.8 20.4 18.0 15.5
40 24.7 22.4 19.9 17.5 14.9
30 24.2 21.9 19.4 16.9 14.4
Source: Bloomberg, Company, Angel Research
Our sensitivity analysis suggests that every 10% increase in sourcing from the captive smelters, EBITDA margins expands by ~50bp (assuming stable lead prices).
Capacity expansion to increase volume growth
Exide has been operating at ~90% utilisation levels over the past five years. The company plans to increase its battery capacity with an investment of Rs400cr in FY2011E to cater to growing demand. Exide plans to increase its two-wheeler battery capacity to 15.4mn units from 9.6mn units by setting up a new plant at Ahmednagar, Maharashtra, at a cost of Rs80cr. The company also plans to increase its four-wheeler capacity to 10.2mn units from 8mn units by FY2011.
Though the electric vehicle (EV) segment in India is still at a nascent stage, the company wants to be prepared for the opportunity as and when it arises. Hence, it plans to spend Rs40cr on EV battery capacity over the next 2–3 years.
Exhibit 10: Utilisation to remain at high levels
Source: Company, Angel Research
Exhibit 11: Adding capacities to meet demand
Source: Company, Angel Research
As a result of increased capacity, we believe Exide is well placed to meet the rising automotive battery demand. We estimate the overall utilisation level to remain at 78–80% in FY2013E. We expect Exide to post volume CAGRs of 13.9% and 15.6% in the automotive and industrial battery segments, respectively.
18.3 19.8 22.7 24.2
29.1
37.8 41.6
0 10 20 30 40 50 60 70 80 90 100
0
5
10
15
20
25
30
35
40
45
FY07 FY08 FY09 FY10 FY11E FY12E FY13E
(%)(mn units) Installed Capacity Utilisation (RHS)
0
2
4
6
8
10
12
14
16
18
2-wheeler 4-wheeler
(mn units) FY10 FY11E
60%
28%

Exide Industries | Auto Ancillary
September 2010 20
Financial performance
Net revenue to post a 20.8% CAGR over FY2010–13E
We expect Exide to post a 20.8% CAGR in its net revenue over FY2010–13E, driven by volume growth and improved realisation. Overall, battery volume (mnAH terms) is expected to grow at a 14.1% CAGR over FY2010–13E. We forecast realisation to improve at a ~6% CAGR during the same period.
Exhibit 12: 14.1% CAGR in volume over FY2010–13E
Source: Company, Angel Research
Exhibit 13: ...will lead to an 20.8% revenue CAGR
Source: Company, Angel Research
Exhibit 14: Key assumptions Y/E March FY2007 FY2008 FY2009 FY2010 FY2011E FY2012E FY2013E
Storage Batteries ('000 units) 17,686 17,996 19,109 21,899 25,977 29,405 32,534
% yoy chg 22.1 1.8 6.2 14.6 18.6 13.2 10.6
Realisation per Battery (Rs) 1,347 1,978 2,206 2,069 2,216 2,324 2,474
% yoy chg 10.8 46.8 11.5 (6.2) 7.1 4.9 6.5
Million Ampere Hours (mnAH) 2,721 3,124 3,475 3,949 4,675 5,296 5,861
% yoy chg - 14.8 11.2 13.6 18.4 13.3 10.7
Total Revenue 2,383 3,606 4,233 4,542 5,769 6,846 8,062
Automotive (Rs cr) 1,668 2,561 2,905 3,108 3,975 4,683 5,495
% yoy chg - 53.6 13.4 7.0 27.9 17.8 17.3
Industrial (Rs cr) 715 1,019 1,269 1,397 1,753 2,117 2,516
% yoy chg - 42.6 24.5 10.1 25.5 20.8 18.8
Other (Rs cr) 0.1 25.5 59.8 36.7 40.8 45.4 50.8
Source: Company, Angel Research
EBITDA to grow at a CAGR of 15.9% over FY2010-13E
Exide’s captive lead sourcing is expected to increase from ~50% in FY2010 to ~70% by FY2013E. We believe this will mitigate the impact of increase in lead prices to a certain extent. We expect margins to be in the range of 21-22% going forward. Thus, EBITDA is expected to register a 15.9% CAGR over FY2010–13E.
2,721 3,124
3,475 3,949
4,675 5,296
5,861
0
5
10
15
20
25
0
1,000
2,000
3,000
4,000
5,000
6,000
7,000
FY07 FY08 FY09 FY10 FY11E FY12E FY13E
(%)(mnAH ) Overall volumes yoy growth (RHS)
1,870
2,845 3,393
3,794
4,788
5,682
6,691
0
10
20
30
40
50
60
0
1,000
2,000
3,000
4,000
5,000
6,000
7,000
8,000
FY07 FY08 FY09 FY10 FY11E FY12E FY13E
(%)(Rs cr) Net sales yoy growth (RHS)

Exide Industries | Auto Ancillary
September 2010 21
Exhibit 15: Lead prices expected to remain stable
Source: Bloomberg, Company, Angel Research
Exhibit 16: EBITDA margins to stabilise around 21-22%
Source: Bloomberg, Company, Angel Research
Return ratios expected to remain healthy
We forecast net profit to increase to Rs859cr in FY2013E (Rs537cr in FY2010), witnessing a 16.9% CAGR over FY2010–13E. We expect return ratios to remain strong, mainly driven by the increase in asset turnover along with high operating margins. Exide’s RoE and RoCE are expected to remain high at 24-27% and 34-37%, respectively, in line with its historical levels on account of higher profitability.
Exhibit 17: Net profit to grow at a 16.9% CAGR
Source: Company, Angel Research
Exhibit 18: Return ratios to remain strong
Source: Company, Angel Research
0
50,000
100,000
150,000
200,000
250,000
0
1,000
2,000
3,000
4,000
5,000
Aug-
01
Aug-
02
Aug-
03
Aug-
04
Aug-
05
Aug-
06
Aug-
07
Aug-
08
Aug-
09
Aug-
10
(tonne)(USD/tonne) Lead inventory (RHS) Lead prices (LHS)
0
5
10
15
20
25
0
500
1,000
1,500
2,000
2,500
3,000
3,500
FY
07
FY
08
FY
09
FY
10
FY
11E
FY
12E
FY
13E
(%)(US $/tonne) Avg. Lead Price (LHS) EBITDA Margin (RHS)
0 10 20 30 40 50 60 70 80 90 100
0 100 200 300 400 500 600 700 800 900
1,000
FY07 FY08 FY09 FY10 FY11E FY12E FY13E
(%)(Rs cr) Net profit yoy growth (RHS)
25.4 29.5
25.0
31.0 26.4 24.5 22.8
26.0
33.1 31.7
40.8 36.6
34.3 32.3
0 5
10 15 20 25 30 35 40 45
FY07 FY08 FY09 FY10 FY11E FY12E FY13E
(%) RoE RoCE

Exide Industries | Auto Ancillary
September 2010 22
Stake in ING Vysya Life valued at Rs11/share
Exide has a 50% stake in ING Vysya Life Insurance Company Limited, a JV with ING Group, Netherlands. ING Vysya Life Insurance has a ~2% market share among private players in India. Exide plans to continue investing in this business and has no plans of selling out in the medium term.
We value Exide’s stake in ING Vysya Life Insurance Company at Rs11/share based on 15x FY2012E NBAP, with an NBAP margin of ~17% on an estimated annual premium equivalent (APE) amount of Rs657cr in FY2012E. Exhibit 19: Valuation of Exide’s stake in ING Vysya Life Insurance
FY2010 FY2011E FY2012E
APE (New business) 628.4 596.9 656.6
NBAP margin (%) 17.0 17.0 17.0
NBAP (Rs cr) 106.8 101.5 111.6
NBAP multiple (x) 15.0 15.0 15.0
Value of Insurance Business (Rs cr) 1,602 1,522 1,674
Exide's Holding (%) 50 50 50
Per Share Value of Insurance Business (Rs) 10 9.5 11
Source: IRDA, Company, Angel Research
Key concerns
Slowdown in demand for automobile and industrial batteries
Exide generates 15–17% of its revenue from OEM sales, which are highly dependent on off-take in cars, commercial vehicles and two-wheelers. Any decline in demand due to a slowdown in economic activity or rise in interest rates will have an adverse impact on automobile demand, which poses a downside risk to our volume and earnings estimates.
Further, the slowdown in economic activity will have a negative impact on industrial battery demand as well. Industrial battery demand is expected to remain subdued in FY2011, mainly due to the slowdown in the telecom segment. The telecom segment, which contributes 30–35% of industrial battery sales, declined in FY2010. Going ahead, if the decline in demand is severe, it would negatively impact our estimates.
Fluctuation in lead prices
Lead and lead alloys are the key inputs and major cost elements in the battery manufacturing process. Lead accounts for 75–80% of Exide’s raw-material cost. Although Exide plans to secure the supply from its own smelters, a significant increase in lead prices will have a negative impact on our earnings estimates.

Exide Industries | Auto Ancillary
September 2010 23
Outlook and valuation
We estimate Exide to post a 21.1% CAGR in gross revenue over FY2010–13E, backed by 20.9% and 21.7% revenue CAGRs in auto and industrial battery segments. Thus, we expect the bottom line to post a substantial 16.9% CAGR over the same period. Moreover, Exide's strong brand image has been creating value, while continuously improving its RoCE, due to better asset turnover on incremental capacities. We believe Exide will continue to achieve higher return ratios and margins on the back of its superior pricing power and assuming a stable input cost scenario. Going ahead, a strong balance sheet and lower debt-equity ratio will aid the company in sustaining strong cash flows.
At Rs158, the stock is quoting at 20.4x FY2011E and 17.8x FY2012E earnings. We maintain an Accumulate rating on the stock with an SOTP Target Price of Rs171. Owing to its defensive appeal and healthy and consistent business fundamentals; we are valuing the company at 17.3x (20% premium to its historical average of 14.4x) FY2012E earnings at Rs154. We have valued the company’s stake in ING Vysya Life Insurance at Rs11/share on FY2012E NBAP and have assigned a value of Rs6/share to lead smelters (8x FY2012E PAT).
Exhibit 20: One-year forward P/E band
Source: Bloomberg, Company, Angel Research
Exhibit 21: One-year forward P/E chart
Source: Bloomberg, Company, Angel Research
Exhibit 22: One-year forward EV/EBITDA band
Source: Bloomberg, Company, Angel Research
Exhibit 23: One-year forward EV/EBITDA chart
Source Bloomberg, Company, Angel Research
0
50
100
150
200
Apr-
01
Dec
-01
Aug
-02
Apr-
03
Dec
-03
Aug
-04
Apr-
05
Dec
-05
Aug
-06
Apr-
07
Dec
-07
Aug
-08
Apr-
09
Dec
-09
Aug
-10
(Rs) Share price (Rs) 6x 10x 14x 18x
0
5
10
15
20
25
30
Apr
-01
Dec
-01
Aug-
02
Apr
-03
Dec
-03
Aug-
04
Apr
-05
Dec
-05
Aug-
06
Apr
-07
Dec
-07
Aug-
08
Apr
-09
Dec
-09
Aug-
10
(x) One-yr forward P/E Three-yr average P/ELong term average P/E
0
4,000
8,000
12,000
16,000
Apr-
01
Dec
-01
Aug-
02
Apr-
03
Dec
-03
Aug-
04
Apr-
05
Dec
-05
Aug-
06
Apr-
07
Dec
-07
Aug-
08
Apr-
09
Dec
-09
Aug-
10
(Rs cr) EV (Rs cr) 2x 5x 8x 11x
0
4
8
12
16
Apr-
01
Dec
-01
Aug
-02
Apr-
03
Dec
-03
Aug
-04
Apr-
05
Dec
-05
Aug
-06
Apr-
07
Dec
-07
Aug
-08
Apr-
09
Dec
-09
Aug
-10
(x) One-yr forward EV/EBITDA Three-yr average EV/EBITDALong term average EV/EBITDA
Exide Industries | Auto Ancillary
September 2010 24
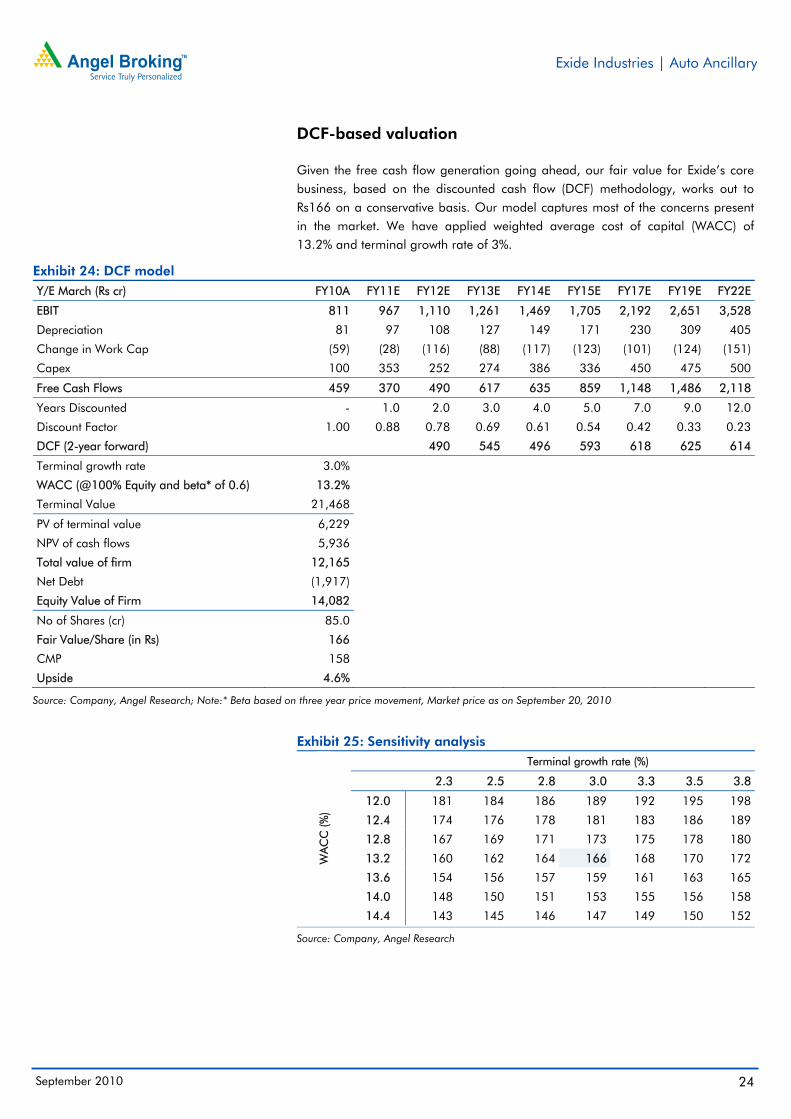
DCF-based valuation
Given the free cash flow generation going ahead, our fair value for Exide’s core business, based on the discounted cash flow (DCF) methodology, works out to Rs166 on a conservative basis. Our model captures most of the concerns present in the market. We have applied weighted average cost of capital (WACC) of 13.2% and terminal growth rate of 3%.
Exhibit 24: DCF model Y/E March (Rs cr) FY10A FY11E FY12E FY13E FY14E FY15E FY17E FY19E FY22E
EBIT 811 967 1,110 1,261 1,469 1,705 2,192 2,651 3,528
Depreciation 81 97 108 127 149 171 230 309 405
Change in Work Cap (59) (28) (116) (88) (117) (123) (101) (124) (151)
Capex 100 353 252 274 386 336 450 475 500
Free Cash Flows 459 370 490 617 635 859 1,148 1,486 2,118
Years Discounted - 1.0 2.0 3.0 4.0 5.0 7.0 9.0 12.0
Discount Factor 1.00 0.88 0.78 0.69 0.61 0.54 0.42 0.33 0.23
DCF (2-year forward) 490 545 496 593 618 625 614
Terminal growth rate 3.0%
WACC (@100% Equity and beta* of 0.6) 13.2%
Terminal Value 21,468
PV of terminal value 6,229
NPV of cash flows 5,936
Total value of firm 12,165
Net Debt (1,917)
Equity Value of Firm 14,082
No of Shares (cr) 85.0
Fair Value/Share (in Rs) 166
CMP 158
Upside 4.6%
Source: Company, Angel Research; Note:* Beta based on three year price movement, Market price as on September 20, 2010
Exhibit 25: Sensitivity analysis
WA
CC
(%)
Terminal growth rate (%)
2.3 2.5 2.8 3.0 3.3 3.5 3.8
12.0 181 184 186 189 192 195 198
12.4 174 176 178 181 183 186 189
12.8 167 169 171 173 175 178 180
13.2 160 162 164 166 168 170 172
13.6 154 156 157 159 161 163 165
14.0 148 150 151 153 155 156 158
14.4 143 145 146 147 149 150 152
Source: Company, Angel Research

Exide Industries | Auto Ancillary
September 2010 25
Company background
Exide is the largest manufacturer of lead acid storage batteries with manufacturing presence in India, Sri Lanka, UK, Singapore and Australia. The company manufactures batteries, ranging from 2.5Ah to 20,400Ah, having applications in the automotive and industrial segments. Exide has a technological tie-up with Shin Kobe, Furukawa Battery, Changxing Noble and Thunder Sky Battery. The business segment of the company comprises automotive batteries (~69% of revenue), industrial batteries (~30% of revenue) and submarine batteries (1% of revenue).
Exhibit 26: Auto battery segment’s revenue break-up
Source: Company, Angel Research
Exhibit 27: Ind. battery segment’s revenue break-up
Source: Company, Angel Research
Exhibit 28: Sectors and customers for automotive and industrial batteries Automobile
Cars Maruti Suzuki, Tata Motors, Fiat, General Motors, Honda, Hyundai, Mitsubishi, Toyota
Commercial Vehicles Tata Motors, Iveco, Ashok Leyland, Piaggio, Mazda
Motorcycle Bajaj Auto, Honda, Yamaha
Tractors Eicher Tractors, John Deere, Mahindra Tractors, New Holland Tractors
Special Purpose Vehicles Caterpillar India, JC Bamford
Industrial
Motive Power (Electric vehicles, mining locomotives, miners' cap lamps)
India Railways, Macneill & Magor, Godrej, Voltas, Josts, BHEL, Escorts, Indian Navy
Standby (Power, Telecom, UPS, Inverter) Fujitsu, Alctel, Siemens, Tata Lucent, BSNL, MTNL, AT&T, Compton Greaves, Tata Telecom, Reliance Telecom
Railways(Train lightning, AC, Electric Multiple Units, Diesel Loco Starters, Signaling and Telecom Railways
Source: Company, Angel Research
Exhibit 29: Major brands Automotive batteries Exide, SF Sonic, Standard Furukawa
Industrial batteries Exide, Index, SF, Ceil, Power Safe, Chloride
Source: Company, Angel Research
Exide has a strong sales and distribution network and offers quality customer service with a pan India presence.
After-market73%
OEM26%
Others1%
Power back-up67%
Infrastructure20%
Exports6%
Traction2%
Others5%

Exide Industries | Auto Ancillary
September 2010 26
Exhibit 30: Exide’s dealer and service network
Source: Company, Angel Research
Exhibit 31: Distribution network’s strength
Authorised dealers 13,400
Outlets 38,500
Humsafar partners 21,970
Depot cum service stations 202
Power centre shops 29
Source: Company, Angel Research
Exhibit 32: Key management team T V Ramanathan MD & CEO
G Chatterjee Director - Industrial division
P K Kataky Director - Automotive division
A K Mukherjee Director - Finance & CFO
S K Mittal Director - R&D
Supriya Coomer Company Secretary, VP - Legal and Administration
Nadeem Kazim Executive VP Human Resource
Source: Company, Angel Research
Exhibit 33: Plant location and capacity Plant Location Capacity (mn units)
Bawal, Haryana Motor-cycle 6.1
Chinchwad, Maharashtra Auto/ Motor-cycle 1.8/3.3
Haldia, West Bengal Auto/Industrial 1.0/0.3
Hosur, Tamil Nadu Auto/Industrial 1.6/0.8
Shamnagar, West Bengal Auto/Industrial 1.0/0.3
Taloja, Maharashtra Auto 1.7
Source: Company, Angel Research
Exhibit 34: Subsidiary information Subsidiary companies Objective % stake Sales (Rs. cr) PBT (Rs. cr)
Espex Batteries, UK Selling and marketing of lead acid batteries 51 30.2 0.36
Caldyne Automatics, Kolkata Design and manufacturing of battery chargers and DC/AC distribution boards 100 37 37
Chloride Batteries SE Asia Pte, Singapore Production and sales of lead acid batteries 100 122.67 4.73
Chloride International Operations in non-conventional energy systems 100 12 0.37
Chloride Metals, Pune Lead smelting and refining activities 100 264 15
Leadage Alloys, Karnataka Lead smelting and refining activities 100 546 54
Associated Battery Manufacturers, Sri Lanka Manufacturing and marketing of lead acid batteries 61.5 63.96 6.2
Source: Company, Angel Research; Note: Financial information for FY2010
OEM
Branches
Main Dealer
Customers
Subdealers/ Retailers
Factories
After-Sales Staff
Government
Institutions

Exide Industries | Auto Ancillary
September 2010 27
Profit & Loss Statement Y/E March (Rs cr) FY07 FY08 FY09 FY10 FY11E FY12E FY13E
Gross sales 2,383 3,606 4,233 4,542 5,769 6,846 8,062
Less: Excise Duty 300 449 464 328 461 548 645
Less: Sales Tax, VAT, Octroi 213 312 376 419 519 616 726
Net Sales 1,870 2,845 3,393 3,794 4,788 5,682 6,691
Total operating income 1,870 2,845 3,393 3,794 4,788 5,682 6,691
% chg 35.6 52.1 19.3 11.8 26.2 18.7 17.8
Total Expenditure 1,565 2,373 2,845 2,902 3,723 4,464 5,303
Net Raw Materials 1,141 1,874 2,248 2,181 2,882 3,396 4,061
Other Mfg costs 143 163 188 219 262 303 352
Personnel 120 146 165 219 252 340 401
Other 161 191 243 284 327 426 489
EBITDA 305 472 548 892 1,065 1,218 1,388
% chg 38.8 54.5 16.1 62.8 19.4 14.4 14.0
(% of Net Sales) 16.3 16.6 16.1 23.5 22.2 21.4 20.7
Depreciation & Amortisation 54 64 68 81 97 108 127
EBIT 251 408 480 811 967 1,110 1,261
% chg 52.0 62.2 17.8 69.0 19.2 14.8 13.6
(% of Net Sales) 13.4 14.3 14.1 21.4 20.2 19.5 18.8
Interest & other Charges 31 41 52 14 7 7 7
Other Income 15 7 7 12 14 16 19
(% of PBT) 6.3 2.0 1.6 1.5 1.5 1.5 1.5
Recurring PBT 235 374 435 810 974 1,120 1,273
% chg 55.1 59.2 16.3 86.2 20.2 14.9 13.7
Extraordinary Expense/(Inc.) 3 2 1 - - - -
PBT (reported) 232 372 434 811 974 1,120 1,273
Tax 80 124 151 273 316 363 413
(% of PBT) 34.4 33.3 34.7 33.7 32.4 32.4 32.5
PAT (reported) 152 248 283 537 659 757 860
ADJ. PAT 155 250 284 537 659 757 859
% chg 54.1 61.3 13.6 88.9 22.6 14.9 13.4
(% of Net Sales) 8.3 8.8 8.4 14.2 13.8 13.3 12.8
Basic EPS (Rs) 2.1 3.1 3.6 6.3 7.7 8.9 10.1
Fully Diluted EPS (Rs) 2.1 3.1 3.6 6.3 7.7 8.9 10.1
% chg 54.1 51.2 13.6 77.7 22.6 14.9 13.4

Exide Industries | Auto Ancillary
September 2010 28
Balance Sheet
Y/E March (Rs cr) FY07 FY08 FY09 FY10 FY11E FY12E FY13E
SOURCES OF FUNDS
Equity Share Capital 75 80 80 85 85 85 85
Reserves& Surplus 595 946 1,170 2,135 2,694 3,327 4,037
Shareholder’s Funds 670 1,026 1,250 2,220 2,779 3,412 4,122
Total Loans 325 350 317 90 90 90 90
Deferred Tax Liability 45 48 41 59 54 49 43
Total Liabilities 1,040 1,424 1,609 2,369 2,923 3,550 4,255
APPLICATION OF FUNDS
Gross Block 946 1,097 1,257 1,336 1,710 1,959 2,230
Less: Acc. Depreciation 480 542 589 660 757 865 992
Net Block 466 555 668 677 953 1,094 1,238
Capital Work-in-Progress 31 47 17 38 17 20 22
Investments 378 518 668 1,335 1,637 1,952 2,383
Current Assets 575 876 742 912 1,060 1,366 1,647
Cash 1 2 34 3 1 54 97
Loans & Advances 29 45 38 48 48 63 74
Other 545 830 669 861 1,011 1,249 1,477
Current liabilities 410 572 487 593 744 882 1,035
Net Current Assets 165 304 255 319 316 484 611
Total Assets 1,040 1,424 1,609 2,369 2,923 3,550 4,255
Cash Flow Statement Y/E March (Rs cr) FY07 FY08 FY09 FY10 FY11E FY12E FY13E
Profit before tax 232 372 434 811 974 1,120 1,273
Depreciation 54 64 68 81 97 108 127
Change in Working Capital 25 124 (55) 62 15 102 77
Less: Other income 42 243 (202) 159 11 234 185
Direct taxes paid 80 124 151 273 316 363 413
Cash Flow from Operations 189 194 498 521 760 732 879
(Inc.)/Dec. in Fixed Assets (88) (167) (130) (100) (353) (252) (274)
(Inc.)/Dec. in Investments (99) (140) (150) (667) (301) (316) (430)
(Inc.)/Dec. in loans and advances (0) (13) 6 3 (14) (15) (11)
Other income (7) 14 (41) (11) - - -
Cash Flow from Investing (194) (307) (315) (775) (668) (582) (715)
Issue of Equity - 149 - 530 - - -
Inc./(Dec.) in loans 35 25 (33) (227) (0) - -
Dividend Paid (Incl. Tax) 26 31 37 56 95 99 124
Others (71) (91) (156) (135) (189) (196) (246)
Cash Flow from Financing (10) 113 (151) 224 (94) (97) (122)
Inc./(Dec.) in Cash (16) 0 32 (31) (2) 53 42
Opening Cash balances 17 1 2 34 3 1 54
Closing Cash balances 1 2 34 3 1 54 97

Exide Industries | Auto Ancillary
September 2010 29
Key Ratios
Y/E March FY07 FY08 FY09 FY10 FY11E FY12E FY13E
Valuation Ratio (x)
P/E (on FDEPS) 76.5 50.6 44.6 25.1 20.4 17.8 15.7
P/CEPS 56.7 40.3 36.0 21.8 17.8 15.6 13.6
P/BV 18.9 12.8 10.4 6.1 4.9 4.0 3.3
Dividend yield (%) 0.2 0.3 0.4 0.6 0.6 0.8 0.9
EV/Sales 7.2 4.7 3.9 3.2 2.5 2.0 1.7
EV/EBITDA 43.9 28.2 23.9 13.7 11.2 9.5 8.0
EV / Total Assets 12.9 9.3 8.1 5.2 4.1 3.3 2.6
Per Share Data (Rs)
EPS (Basic) 2.1 3.1 3.6 6.3 7.7 8.9 10.1
EPS (fully diluted) 2.1 3.1 3.6 6.3 7.7 8.9 10.1
Cash EPS 2.8 3.9 4.4 7.3 8.9 10.2 11.6
DPS 0.4 0.4 0.6 1.0 1.0 1.3 1.5
Book Value 8.4 12.4 15.2 25.8 32.3 39.8 48.1
DuPont Analysis
EBIT margin 13.4 14.3 14.1 21.4 20.2 19.5 18.8
Tax retention ratio 0.7 0.7 0.7 0.7 0.7 0.7 0.7
Asset turnover (x) 3.2 3.8 3.9 4.0 4.2 4.1 4.1
ROIC (Post-tax) 28.3 36.6 36.0 57.4 58.0 54.2 52.3
Cost of Debt (Post Tax) 6.6 8.1 10.1 4.4 5.4 5.4 5.4
Leverage (x) - - - - - - -
Operating ROE 28.3 36.6 36.0 57.4 58.0 54.2 52.3
Returns (%)
ROCE (Pre-tax) 26.0 33.1 31.7 40.8 36.6 34.3 32.3
Angel ROIC (Pre-tax) 40.7 47.0 54.9 81.1 77.1 73.4 72.3
ROE 25.4 29.5 25.0 31.0 26.4 24.5 22.8
Turnover ratios (x)
Asset Turnover (Gross Block) 2.0 2.8 2.9 2.9 3.1 3.1 3.2
Inventory / Sales (days) 62 62 54 50 49 49 50
Receivables (days) 29 26 26 23 26 26 26
Payables (days) 53 51 46 42 40 39 40
Working capital cycle (ex-cash) (days) 30 30 28 26 24 24 26
Solvency ratios (x)
Net debt to equity (0.1) (0.2) (0.3) (0.6) (0.6) (0.6) (0.6)
Net debt to EBITDA (0.2) (0.4) (0.7) (1.4) (1.5) (1.6) (1.7)
Interest Coverage (EBIT / Interest) 8.1 10.0 9.3 60.1 134.6 154.5 175.5
Note: Market price as on September 20, 2010
Please refer to important disclosures at the end of this report 30
Amara Raja Batteries (ARBL) is India’s second largest player of lead batteries with market share of ~26%. Although the company has always traded at a discount to Exide (due to Exide’s leadership position, scale of operations, superior margins and return ratios), ARBL is well placed to tap the rising demand from the automobile and industrial segments with its innovative products, increased capacity and widening reach. ARBL is trading at 11.9x FY2011E and 9.2x FY2012E earnings. We feel the stock is available at attractive valuations. We Initiate Coverage on ARBL with a BUY rating and a Target Price of Rs261 (23% potential upside). At our target price, the stock will trade at 11.3x (35% discount to Exide's multiple of 17.3x) FY2012E EPS of Rs23.1.
Auto batteries to ride on OEM and replacement battery demand: We expect the auto battery market to post a 20% revenue CAGR over FY2010–13E, led by a robust ~12% CAGR in new vehicle sales volume across segments and growing vehicle population. Thus, we expect ARBL to post a 30.8% revenue CAGR for the auto batteries segment, aided by robust volume growth. ARBL is also focusing on strengthening its distribution network, which will increase its market share to ~30% by FY2013E from the current 24–27%.
Capacity expansion to provide scale: Supported by strong demand for auto batteries, ARBL plans to increase its two-wheeler and four-wheeler battery capacity by 100% and 21%, respectively, by FY2011, incurring a capex of Rs85cr (Rs150cr overall capex). We expect ARBL to post a 23% CAGR in revenue, driven by a strong 17.9% volume CAGR over FY2010–13E.
JV with JCI – Well placed to chase long-term growth opportunities: Growing concerns about the environmental impact of CO2 emissions and significant investments by global auto majors to develop alternative fuel base vehicles offer a huge opportunity to industry players. We believe ARBL, through its existing relationship with Johnson Controls (JCI), is well placed to tap the demand for new generation automotive batteries (lithium ion and hybrid) in the long run.
Key Financials
Y/E March (Rs cr) FY2009 FY2010 FY2011E FY2012E
Net Sales 1,313 1,465 1,871 2,267
% chg 21.2 11.6 27.7 21.2
Net Profit 80.5 167.0 152.4 197.1
% chg (14.7) 107.5 (8.8) 29.3
EBITDA (%) 11.5 19.2 14.6 14.4
EPS (Rs) 9.4 19.6 17.8 23.1
P/E (x) 22.6 10.9 11.9 9.2
P/BV (x) 4.5 3.3 2.7 2.1
RoE (%) 21.8 35.2 24.8 25.5
RoCE (%) 16.8 34.9 28.5 28.6
EV/Sales (x) 1.5 1.2 1.0 0.8
EV/EBITDA (x) 13.2 6.5 6.8 5.6 Source: Company, Angel Research; Note: Market price as of September 20, 2010
BUY CMP Rs213 Target Price Rs261
Investment Period 12 Months
Stock Info
Sector
Bloomberg Code
Shareholding Pattern (%)
Promoters 52.1
MF / Banks / Indian Fls 20.8
FII / NRIs / OCBs 8.7
Indian Public / Others 18.4
Abs. (%) 3m 1yr 3yr
Sensex 13.3 18.9 21.8
ARBL 21.5 54.1 121.2
2
19,906
5,980
AMAR.BO
AMRJ@IN
1,818
0.87
225/131
79,508
Auto Ancillary
Avg. Daily Volume
Market Cap (Rs cr)
Beta
52 Week High / Low
Face Value (Rs)
BSE Sensex
Nifty
Reuters Code
Vaishali Jajoo
022-4040 3800 Ext: 344 [email protected]
Yaresh Kothari
022-4040 3800 Ext: 313 [email protected]
Amara Raja Batteries Catching up
Auto Ancillary
September 2010

Amara Raja Batteries | Auto Ancillary
September 2010 31
Investment rationale
Auto batteries to ride on OEM and replacement battery demand
ARBL derives ~50% of its revenue from the automotive battery segment. ARBL and Exide cater to almost the entire organised automotive battery market, with Exide being the market leader having a market share of 60-65%, followed by ARBL with a share of 24–27%. We expect the automotive battery market to post a 20% CAGR in sales over FY2010–13E. Consequently, we expect ARBL to post a 17.9% volume CAGR. ARBL’s low base of volume offers more leeway to increase its market share in the OEM and replacement segments compared to Exide.
Exhibit 1: Volume to grow at a 17.9% CAGR
Source: Company, Angel Research
Exhibit 2: Auto battery revenue to drive total revenue
Source: Company, Angel Research
OE segment to aid demand for automobile batteries
The automobile industry, which is a barometer for the country’s economic strength, posted a 9.1% volume CAGR over FY2006–10, led by buoyant economic activity. The industry has also benefitted from the introduction of new models, easy availability of finance and aggressive pricing by players. Favourable demographics, low penetration level and higher per capita income would support the long-term increase in auto volumes in India. We expect the four-wheeler and two-wheeler segments to report volume CAGRs of ~13% and ~11%, respectively, over FY2010–13E, resulting in the auto industry witnessing a ~12% volume CAGR. The expected surge in auto volumes would create a sustainable demand for automotive batteries going ahead, thus benefitting ARBL.
ARBL derives ~14% of its revenue from OEMs and enjoys a 24–27% market share in the automotive OEM market. The company supplies automotive batteries to major OEMs in the country, including Ashok Leyland, Hyundai, M&M, Maruti, Tata Motors, General Motors, TAFE and FIAT. ARBL is also an exclusive supplier to Daimler Chrysler, Ford and the Maruti-Swift platform.
4,230 5,094
6,417
7,482 8,326
0
5
10
15
20
25
30
0
1,000
2,000
3,000
4,000
5,000
6,000
7,000
8,000
9,000
FY09 FY10 FY11E FY12E FY13E
(%)('000 units) Auto battery volume yoy growth (RHS)
790 846
1,237
1,531
1,893
0 5 10 15 20 25 30 35 40 45 50
0 200 400 600 800
1,000 1,200 1,400 1,600 1,800 2,000
FY09 FY10 FY11E FY12E FY13E
(%)(Rs cr) Auto battery revenue yoy growth (RHS)
ARBL has 24–27% market share in theOEM segment

Amara Raja Batteries | Auto Ancillary
September 2010 32
Replacement demand to drive growth
The short lifespan of automotive batteries, which is 3–4 years for four-wheelers and two-wheelers, creates an attractive replacement market. The replacement market largely tracks the number of vehicles on the road. We estimate vehicle penetration in India to grow at a CAGR of ~9% over FY2010–13E. On the back of healthy growth in OE sales in the last few years, we expect replacement battery demand to witness a 13–15% CAGR over FY2010–13E. This will benefit ARBL, as the company derives ~65% of its automotive battery segment’s revenue from the replacement market.
Over the past three years, ARBL has been focusing on branding. The company has steadily expanded its retail distribution network, as a strong distribution network is essential to serve the replacement market effectively. ARBL has successfully established itself in a market that is dominated by Exide. The company has a network of over 18,000 retailers, 200 franchisees and 700 PowerZone outlets, catering to the semi-urban and rural markets. ARBL’s market share in the replacement market now stands at ~26%. The company plans to widen its retail network to further increase its penetration in the replacement market.
Exhibit 3: Distribution network
FY07 FY08 FY09 FY10
AQUA - 50 70 75
Franchises 152 175 189 200
Amaron PitStops 115 120 145 145
Retailers 14,000 18,000 18,000+ 18,000+
PowerZone - 400 600 700
Source: Company, Angel Research
Exhibit 4: OEM and replacement market share
Source: Company, Angel Research
25 26 28 27
20
26 25 26
0
5
10
15
20
25
30
FY07 FY08 FY09 FY10
(%) OEM Organised replacement
ARBL derives ~33% of its revenue fromthe replacement segment

Amara Raja Batteries | Auto Ancillary
September 2010 33
Industrial batteries
UPS/inverter segment to drive demand
Demand for industrial batteries has been fairly strong over the past couple of years, largely due to the significant boom in the telecom sector. As a result, ARBL’s industrial battery business grew at a ~34% CAGR over FY2006–10. ARBL enjoys strong ties with its customers and has emerged as a preferred supplier to leading telecom operators. ARBL commanded a market share of 30–32% in the telecom battery segment in FY2010. However, the telecom sector, which constitutes 28–30% of ARBL’s sales, is expected to post modest growth going forward due to the slowdown in the telecom space. We estimate the company’s telecom battery segment to register a single-digit CAGR (~5%) in volumes over FY2010–13E.
Exhibit 5: Ind. battery segment – Stable market share
Source: Company, Angel Research
Exhibit 6: UPS/inverter batteries to contribute more
Source: Company, Angel Research
Going forward, we expect demand for industrial batteries to be driven by the power back-up (UPS) and railways segments. Large-scale computerisation of banking networks, government departments and power deficit (~10.1% in FY2010) have led to increased demand for batteries in the UPS/inverter segment over the last five years, reporting a ~15% CAGR. ARBL has emerged as one of the key suppliers to OEMs of digital UPS devices and inverters, and the company currently controls a large part of the replacement market. As of FY2010, ARBL’s market share in the UPS segment stood at ~28%. We believe the power demand-supply gap will continue over the medium term with deficit likely to be ~7.0% in FY2013E, expected to drive demand for UPS/inverter batteries.
Further, the company plans to enter the tubular batteries segment in the next couple of years. Tubular batteries are mainly used in material handling equipment.
2728
27 27
15
18
21
24
27
30
FY07 FY08 FY09 FY10
(%)
60.0 53.7
48.9 44.3
40.0 46.3
51.1 55.7
0
10
20
30
40
50
60
70
FY10 FY11E FY12E FY13E
(%) Telecom revenue UPS/Inverter revenue
Telecom battery segment contributes28–30% of overall revenue
ARBL plans to enter the tubular batterysegment in the next couple of years
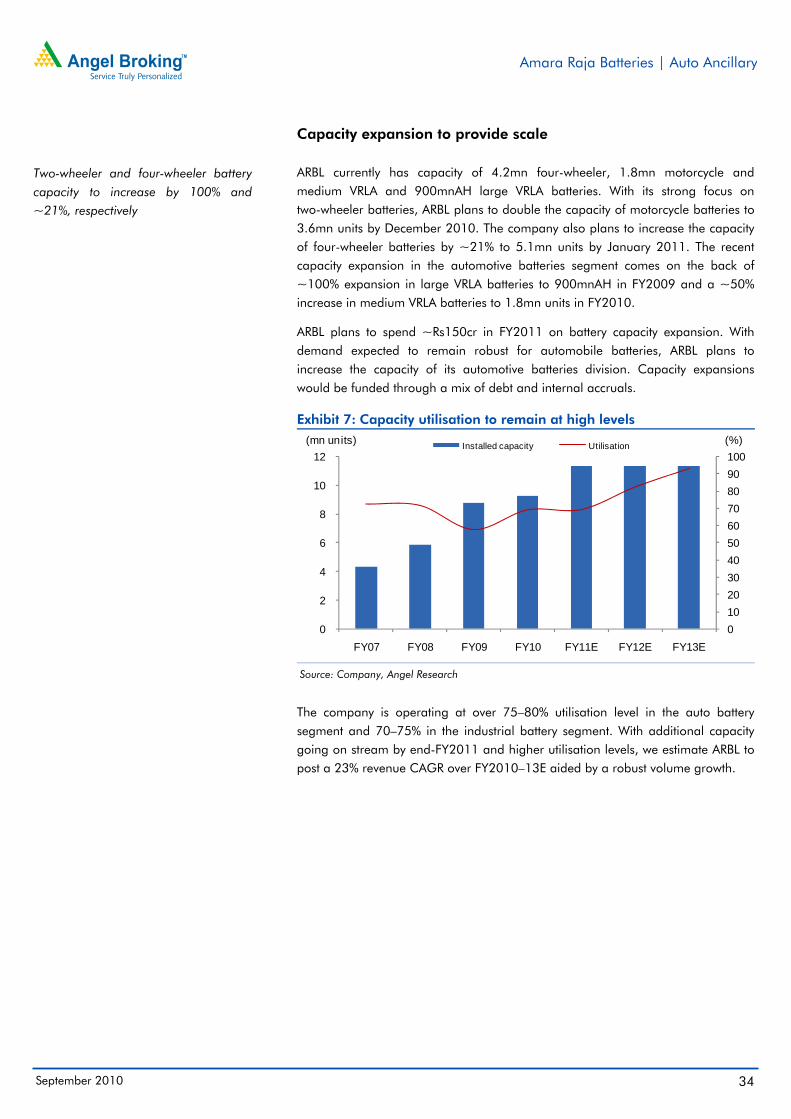
Amara Raja Batteries | Auto Ancillary
September 2010 34
Capacity expansion to provide scale ARBL currently has capacity of 4.2mn four-wheeler, 1.8mn motorcycle and medium VRLA and 900mnAH large VRLA batteries. With its strong focus on two-wheeler batteries, ARBL plans to double the capacity of motorcycle batteries to 3.6mn units by December 2010. The company also plans to increase the capacity of four-wheeler batteries by ~21% to 5.1mn units by January 2011. The recent capacity expansion in the automotive batteries segment comes on the back of ~100% expansion in large VRLA batteries to 900mnAH in FY2009 and a ~50% increase in medium VRLA batteries to 1.8mn units in FY2010.
ARBL plans to spend ~Rs150cr in FY2011 on battery capacity expansion. With demand expected to remain robust for automobile batteries, ARBL plans to increase the capacity of its automotive batteries division. Capacity expansions would be funded through a mix of debt and internal accruals.
Exhibit 7: Capacity utilisation to remain at high levels
Source: Company, Angel Research
The company is operating at over 75–80% utilisation level in the auto battery segment and 70–75% in the industrial battery segment. With additional capacity going on stream by end-FY2011 and higher utilisation levels, we estimate ARBL to post a 23% revenue CAGR over FY2010–13E aided by a robust volume growth.
0 10 20 30 40 50 60 70 80 90 100
0
2
4
6
8
10
12
FY07 FY08 FY09 FY10 FY11E FY12E FY13E
(%)(mn units) Installed capacity Utilisation
Two-wheeler and four-wheeler batterycapacity to increase by 100% and~21%, respectively

Amara Raja Batteries | Auto Ancillary
September 2010 35
JV with JCI–Well placed to chase long-term growth opportunities
ARBL is a joint venture between the Galla family and JCI, with each holding a 26% stake in the venture. ARBL has a technological tie-up with JCI.
JCI is the world’s largest manufacturer of automotive batteries with revenue of around US $28.5bn in CY2009. JCI capitalised on its global scale, technology and talent to generate cost improvements across businesses. JCI continues to expand in emerging growth markets, especially China, India, Brazil and the Middle East, as growth and economic recovery in these markets have been faster compared to mature markets. Factors such as high temperature, financial growth and energy constraints in most of these companies will drive demand for JCI’s offerings.
Exhibit 8: JCI – Financials (in US $bn) CY2007 CY2008 CY2009 CY2010E Remarks
Sales Revenue 34.6 38.1 28.5 33.5 For CY2010, JCI expects to continue to perform well on the whole. Sales are expected to increase by ~17% in CY2010, despite the strong euro. Growth would largely be aided by around 4% yoy growth in AE, 13% yoy growth in PS and about 5% yoy growth in BE. Thus, bottom line is estimated to be back in the green on profitable conversion of incremental revenue, investment in growth initiatives and impact of revised euro assumption.
% change 7.4 9.9 (25.1) 17.6
Gross Profit 5.1 5.5 3.5 4.4
Gross Profit Margin (%) 14.7 14.5 12.5 13.0
Net Income (Loss) 1.3 1.0 (0.3) 0.3
% change 21.8 (21.8) - -
Return on Sales 3.6 2.6 (1.2) 1.0
R&D Cost 0.8 0.8 0.8 0.9 R&D plays an active role in securing the future of the company, which ultimately boosts JCI’s innovative strength and offers growth opportunities.
% to Sales Revenue 2.2 2.2 2.7 2.5
Capital Expenditure 0.8 0.8 0.6 0.8
Source: Company, Angel Research
Exhibit 9: Segment-wise revenue contribution
Source: Company, Angel Research
Exhibit 10: Geographical break-up of revenue
Source: Company, Angel Research
Growing concerns regarding the environmental impact of carbon dioxide emissions from automobiles, high crude oil prices and depleting fossil fuel resources resulted in significant investments by global auto majors to develop alternative fuel base vehicles. JCI is the global leader in lead-acid automotive batteries and advanced batteries for hybrid and electric vehicles. JCI has been offering various solutions for new generation automotive batteries such as lithium-ion and hybrid technology, which would help ARBL in the long run (leverage on these technologies implemented in the developed market).
42%
44%
14%
Automotive Experience (AE) Building Efficiency (BE) Power Solutions (PS)
39%
53%
62%
52%
30%
34%
9%
17%
4%
0% 10% 20% 30% 40% 50% 60% 70%
AE
BE
PS
Rest of world Europe America

Amara Raja Batteries | Auto Ancillary
September 2010 36
Financial performance
Net sales to grow at a 23% CAGR over FY2010–13E
ARBL’s net sales grew at a 35.1% CAGR over FY2007–10, led by strong growth in the automobile and industrial battery businesses. Growth in sales can be attributed to the rise in volumes, which reported a 28.1% CAGR over FY2007–10.
We expect ARBL’s revenue to register a 23% CAGR over FY2010–13E, led by increased volumes in the automobile battery business and demand for UPS batteries in the industrial battery business. As such, we expect automobile battery and industrial battery businesses to witness CAGRs of 30.8% and 15.9%, respectively.
Exhibit 11: Sales momentum to continue
Source: Company, Angel Research
Exhibit 12: Revenue break-up
Source: Company, Angel Research
Going forward, we believe the proportion of automobile revenue to total revenue will increase to ~59% from the current level of ~50% by FY2013E.
Exhibit 13: Key assumptions Y/E March FY2010P FY2011E FY2012E FY2013E
Volumes (‘000 units)
Automotive Battery
Four Wheeler 3,318 3,825 4,386 4,881
Motorcycle/Small VRLA 1,776 2,592 3,096 3,445
Industrial Battery
Large VRLA (mn Ah) 622 630 675 720
Medium VRLA 1,221 1,548 1,848 2,195
% utilization
Automotive 81 84 86 91
Industrial 72 79 81 87
Revenue (Rs cr)
Automotive Battery 846 1,237 1,531 1,893
Industrial Battery 846 939 1,105 1,316
Large VRLA 507 504 540 583
Medium VRLA 338 435 565 732
Gross Revenue 1,691 2,176 2,636 3,208
Source: Company, Angel Research
594
1,083 1,313
1,465
1,871
2,267
2,727
0
10
20
30
40
50
60
70
80
90
0
500
1,000
1,500
2,000
2,500
3,000
FY07 FY08 FY09 FY10 FY11E FY12E FY13E
(%)(Rs cr) Net sales yoy growth (RHS)
50.0 56.8 58.1 59.0
50.0 43.2 41.9 41.0
0
10
20
30
40
50
60
70
FY10 FY11E FY12E FY13E
(%) Auto battery segment Ind battery segment

Amara Raja Batteries | Auto Ancillary
September 2010 37
EBITDA to grow at CAGR of 11% over FY2010-13E
ARBL’s margins improved considerably by 774bp to 19.2% in FY2010 from 11.5% in FY2009 due to inventory gains, led by softening lead prices, appreciating Indian rupee, cost rationalisation and optimisation measures. Lead prices have risen considerably from their lows and are currently trading at US $2,100–2,200/tonne. Lead prices, which have been volatile in the past, pose a threat to our margin estimates. We have modeled 10% annual increase in average lead price over next two years. Since the company passes on increases in lead prices to its industrial and automotive customers (with lag effect), we expect the company to operate at 14-15% operating margin going forward. Thus, we model EBITDA to witness a 11% CAGR over FY2010–13E.
Exhibit 14: High inventory levels to stabilise lead prices
Source: Bloomberg, Company, Angel Research
Exhibit 15: ...leading to steady EBITDA margins
Source: Bloomberg, Company, Angel Research
Since ARBL imports ~60% of its lead requirement, the company’s margin is expected to be lower compared to Exide, which procures ~50% of its lead requirements from captive smelters, which gives Exide a significant cost advantage.
Return ratios to remain high
We expect ARBL’s net profit to increase in line with its EBITDA, at a 10.7% CAGR, over FY2010–13E. We estimate EPS to increase to Rs26.5 in FY2013E from Rs19.6 in FY2010. On the back of improved fundamentals we estimate ARBL to register RoE of 23–25% and RoCE of 28–29% over the next two years.
Exhibit 16: Net profit to register a CAGR of 10.7%
Source: Company, Angel Research
Exhibit 17: Return rations to better historical levels
Source: Company, Angel Research
0
50,000
100,000
150,000
200,000
250,000
0
1,000
2,000
3,000
4,000
5,000
Aug
-01
Aug
-02
Aug
-03
Aug
-04
Aug
-05
Aug
-06
Aug
-07
Aug
-08
Aug
-09
Aug
-10
Lead inventory (RHS) Lead prices (LHS)(USD/tonne) (tonne)
0
5
10
15
20
25
30
0
500
1,000
1,500
2,000
2,500
3,000
1QF
Y09
2QF
Y09
3QF
Y09
4QF
Y09
1QF
Y10
2QF
Y10
3QF
Y10
4QF
Y10
1QF
Y11
FY
11E
FY
12E
FY
13E
(%)(US $/tonne) Lead prices EBITDA margins
47
94 80
167 152
197
227
(40)
(20)
0
20
40
60
80
100
120
0
50
100
150
200
250
FY07 FY08 FY09 FY10 FY11E FY12E FY13E
(%)(Rs cr) Net profit yoy growth (RHS)
21.1
32.7
21.8
35.2
24.8 25.5 23.4 20.3 26.0
16.8
34.9 28.5 28.6 28.5
0
5
10
15
20
25
30
35
40
FY07 FY08 FY09 FY10 FY11E FY12E FY13E
(%) RoE RoCE
Higher ratios on accountof exceptional marginsdue to inventory gains
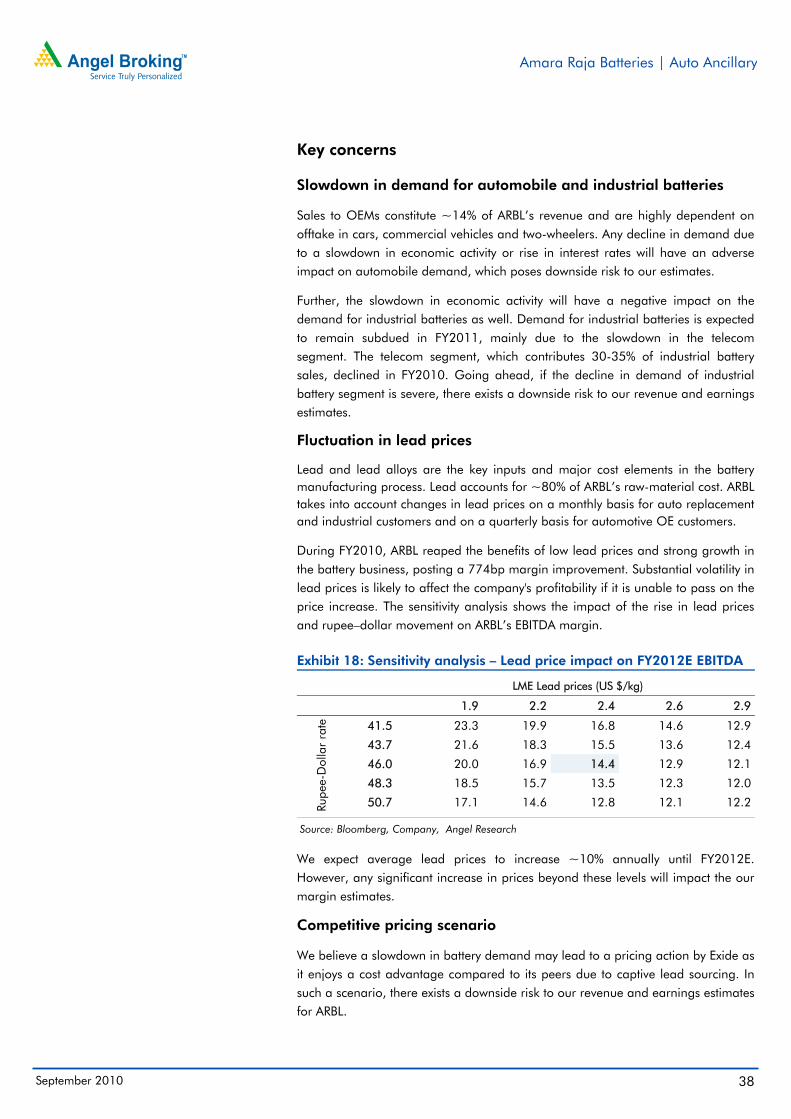
Amara Raja Batteries | Auto Ancillary
September 2010 38
Key concerns
Slowdown in demand for automobile and industrial batteries
Sales to OEMs constitute ~14% of ARBL’s revenue and are highly dependent on offtake in cars, commercial vehicles and two-wheelers. Any decline in demand due to a slowdown in economic activity or rise in interest rates will have an adverse impact on automobile demand, which poses downside risk to our estimates.
Further, the slowdown in economic activity will have a negative impact on the demand for industrial batteries as well. Demand for industrial batteries is expected to remain subdued in FY2011, mainly due to the slowdown in the telecom segment. The telecom segment, which contributes 30-35% of industrial battery sales, declined in FY2010. Going ahead, if the decline in demand of industrial battery segment is severe, there exists a downside risk to our revenue and earnings estimates.
Fluctuation in lead prices
Lead and lead alloys are the key inputs and major cost elements in the battery manufacturing process. Lead accounts for ~80% of ARBL’s raw-material cost. ARBL takes into account changes in lead prices on a monthly basis for auto replacement and industrial customers and on a quarterly basis for automotive OE customers.
During FY2010, ARBL reaped the benefits of low lead prices and strong growth in the battery business, posting a 774bp margin improvement. Substantial volatility in lead prices is likely to affect the company's profitability if it is unable to pass on the price increase. The sensitivity analysis shows the impact of the rise in lead prices and rupee–dollar movement on ARBL’s EBITDA margin. Exhibit 18: Sensitivity analysis – Lead price impact on FY2012E EBITDA
LME Lead prices (US $/kg)
1.9 2.2 2.4 2.6 2.9
Rupe
e-D
olla
r ra
te
41.5 23.3 19.9 16.8 14.6 12.9
43.7 21.6 18.3 15.5 13.6 12.4
46.0 20.0 16.9 14.4 12.9 12.1
48.3 18.5 15.7 13.5 12.3 12.0
50.7 17.1 14.6 12.8 12.1 12.2
Source: Bloomberg, Company, Angel Research
We expect average lead prices to increase ~10% annually until FY2012E. However, any significant increase in prices beyond these levels will impact the our margin estimates.
Competitive pricing scenario
We believe a slowdown in battery demand may lead to a pricing action by Exide as it enjoys a cost advantage compared to its peers due to captive lead sourcing. In such a scenario, there exists a downside risk to our revenue and earnings estimates for ARBL.
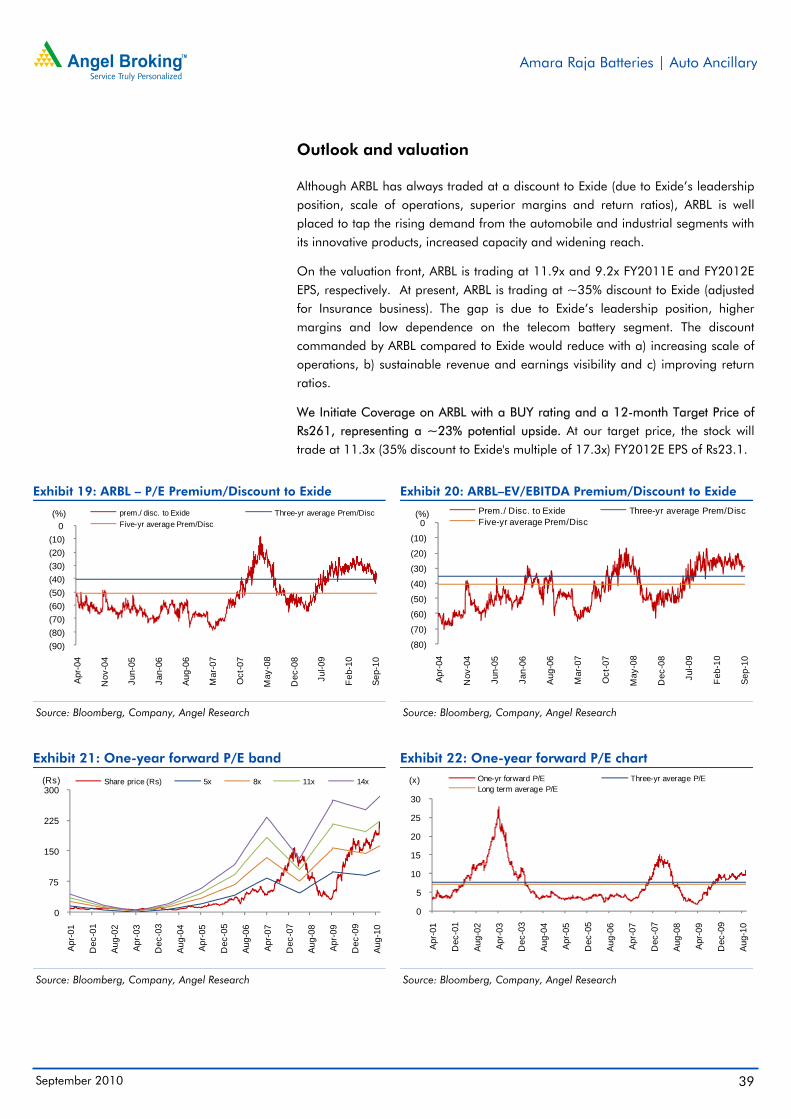
Amara Raja Batteries | Auto Ancillary
September 2010 39
Outlook and valuation
Although ARBL has always traded at a discount to Exide (due to Exide’s leadership position, scale of operations, superior margins and return ratios), ARBL is well placed to tap the rising demand from the automobile and industrial segments with its innovative products, increased capacity and widening reach.
On the valuation front, ARBL is trading at 11.9x and 9.2x FY2011E and FY2012E EPS, respectively. At present, ARBL is trading at ~35% discount to Exide (adjusted for Insurance business). The gap is due to Exide’s leadership position, higher margins and low dependence on the telecom battery segment. The discount commanded by ARBL compared to Exide would reduce with a) increasing scale of operations, b) sustainable revenue and earnings visibility and c) improving return ratios.
We Initiate Coverage on ARBL with a BUY rating and a 12-month Target Price of Rs261, representing a ~23% potential upside. At our target price, the stock will trade at 11.3x (35% discount to Exide's multiple of 17.3x) FY2012E EPS of Rs23.1.
Exhibit 19: ARBL – P/E Premium/Discount to Exide
Source: Bloomberg, Company, Angel Research
Exhibit 20: ARBL–EV/EBITDA Premium/Discount to Exide
Source: Bloomberg, Company, Angel Research
Exhibit 21: One-year forward P/E band
Source: Bloomberg, Company, Angel Research
Exhibit 22: One-year forward P/E chart
Source: Bloomberg, Company, Angel Research
(90)(80)(70)(60)(50)(40)(30)(20)(10)
0
Apr
-04
Nov
-04
Jun-
05
Jan-
06
Aug-
06
Mar
-07
Oct
-07
May
-08
Dec
-08
Jul-0
9
Feb
-10
Sep-
10
(%) prem./ disc. to Exide Three-yr average Prem/DiscFive-yr average Prem/Disc
(80)
(70)
(60)
(50)
(40)
(30)
(20)
(10)
0
Apr
-04
Nov
-04
Jun-
05
Jan-
06
Aug
-06
Mar
-07
Oct
-07
May
-08
Dec
-08
Jul-0
9
Feb
-10
Sep
-10
(%) Prem./ Disc. to Exide Three-yr average Prem/DiscFive-yr average Prem/Disc
0
75
150
225
300
Apr
-01
Dec
-01
Aug-
02
Apr
-03
Dec
-03
Aug-
04
Apr
-05
Dec
-05
Aug-
06
Apr
-07
Dec
-07
Aug-
08
Apr
-09
Dec
-09
Aug-
10
(Rs) Share price (Rs) 5x 8x 11x 14x
0
5
10
15
20
25
30
Apr
-01
Dec
-01
Aug-
02
Apr
-03
Dec
-03
Aug-
04
Apr
-05
Dec
-05
Aug-
06
Apr
-07
Dec
-07
Aug-
08
Apr
-09
Dec
-09
Aug-
10
(x) One-yr forward P/E Three-yr average P/ELong term average P/E

Amara Raja Batteries | Auto Ancillary
September 2010 40
Exhibit 23: One-year forward EV/EBITDA band
Source: Bloomberg, Company, Angel Research
Exhibit 24: One-year forward EV/EBITDA chart
Source: Bloomberg, Company, Angel Research
0
500
1,000
1,500
2,000
2,500
3,000
3,500
Apr-
01
Dec
-01
Aug
-02
Apr-
03
Dec
-03
Aug
-04
Apr-
05
Dec
-05
Aug
-06
Apr-
07
Dec
-07
Aug
-08
Apr-
09
Dec
-09
Aug
-10
(Rs cr) EV (Rs cr) 2x 5x 8x 11x
0
2
4
6
8
10
Apr-0
1
Dec
-01
Aug-
02
Apr-0
3
Dec
-03
Aug-
04
Apr-0
5
Dec
-05
Aug-
06
Apr-0
7
Dec
-07
Aug-
08
Apr-0
9
Dec
-09
Aug-
10
(x) One-yr forward EV/EBITDA Three-yr average EV/EBITDA
Long term average EV/EBITDA

Amara Raja Batteries | Auto Ancillary
September 2010 41
DCF-based valuation
Taking into account the prospects of ARBL’s future free cash flow generation capability, we have used a DCF methodology to arrive at an intrinsic/fair value for ARBL. Assuming a WACC of 14.4% and a terminal growth rate of 3%, our fair value works out to Rs264, at which ARBL would trade at a P/E multiple of 11.4x and an EV/EBITDA multiple of 6.9x FY2012E earnings. We believe the DCF model is conservative and captures most of the concerns related to the uncertainty in lead prices.
Exhibit 25: DCF model (Rs cr) FY2010A FY2011E FY2012E FY2013E FY2014E FY2015E FY2017E FY2019E FY2022E
EBIT 238 217 266 310 367 435 572 724 981
Depreciation 43 56 61 75 89 102 134 168 226
Change in Work Cap 17 (130) (101) (102) (124) (123) (92) (108) (63)
Capex 47 164 116 161 193 195 200 225 250
Free Cash Flows 169 (93) 27 22 20 77 226 320 571
Years Discounted - 1.0 2.0 3.0 4.0 5.0 7.0 9.0 12.0
Discount Factor 1.00 0.87 0.76 0.67 0.58 0.51 0.39 0.30 0.20
DCF (2 year forward) 27 20 15 51 115 124 148
Terminal growth rate 3.0%
WACC (@100% Equity and beta* of 0.8) 14.4%
Terminal Value 5,143
PV of terminal value 1,335
NPV of cash flows 929
Total value of firm 2,264
Net Debt 11
Equity Value of Firm 2,252
No of Shares (cr) 8.5
Fair Value/Share (in Rs) 264
CMP 213
Upside 23.9%
Source: Company, Angel Research; Note:* Beta based on three year price movement, Market price as of September 20, 2010
Exhibit 26: Sensitivity analysis
Terminal Growth Rate (%)
2.3 2.5 2.8 3.0 3.3 3.5 3.8
WA
CC
(%)
13.2 295 300 305 310 315 321 327
13.6 280 284 289 293 298 303 308
14.0 266 270 274 278 282 287 291
14.4 253 256 260 264 268 272 276
14.8 241 244 247 251 254 258 262
15.2 230 233 236 239 242 245 249
15.6 219 222 225 227 230 233 236
Source: Company, Angel Research

Amara Raja Batteries | Auto Ancillary
September 2010 42
Company background
ARBL is India’s second largest manufacturer of VRLA batteries for both industrial and automotive applications. The company is a JV between the Galla family and JCI, with each holding a 26% stake in the venture. Based in Andhra Pradesh, ARBL has a fully integrated manufacturing unit for its batteries at Tirupati. Automotive and industrial batteries contribute 50% each to the company’s total revenue.
Exhibit 27: Auto battery segment’s revenue break-up
Source: Company, Angel Research
Exhibit 28: Ind. battery segment’s revenue break-up
Source: Company, Angel Research
ARBL’s battery product portfolio comprises batteries with capacities ranging from 4.5Ah to 5,000Ah. The company has developed a niche for itself in the telecom battery space and is the preferred battery supplier to major cellular service providers, with a market share of ~32%. In the automotive battery space, ARBL has a market share of ~27% in the OEM and ~26% in the replacement segment.
Exhibit 29: Major brands Automotive batteries PRO, FLO, GO, BLACK, HI-WAY, FRESH, PRO BIKE RIDER
Industries batteries Power Stack, Quanta, Shield
Source: Company, Angel Research
Exhibit 30: Key management team Name Designation
Ramachandra Galla Promoter & Non-Executive Chairman
Jayadev Galla Promoter & Managing Director
P Lakshmana Rao Non-Executive Director (Independent)
Nagarjun Valluripalli Non-Executive Director (Independent)
N Sri Vishnu Raju Non-Executive Director (Independent)
T R Narayanaswamy Non-Executive Director (Independent)
K Suresh Chief Finance Controller
N Ramnathan Company Secretary
Source: Company, Angel Research
ARBL has contracts with most of the four-wheeler makers in India, including Maruti, Hyundai, Ashok Leyland, Tata Motors, M&M and TAFE. The company has a tie-up with Maruti and has launched a co-branded replacement battery under the Amaron MGB brand, which will be available across Maruti’s network of over 3,000 authorised outlets. ARBL also has a tie-up with Tata International for exporting automobile batteries to select African countries.
OEM28%
Replacement65%
Export7%
Telecom60%
UPS/Inverter25%
Others15%

Amara Raja Batteries | Auto Ancillary
September 2010 43
Strategic initiatives: Automotive battery segment
ARBL was the first company to launch ‘Maintenance Free’ batteries for the automotive segment and since then it has come a long way in capturing a sizeable market share in the automotive market.
To build upon sales momentum, ARBL introduced VRLA technology for two-wheelers under the Amaron Pro Bike Rider brand name with a 60-month warranty. The initiative has been taken off well in the market. ARBL has also entered into a development agreement with Honda, Japan, for motor cycle VRLA batteries. The company has also launched a second variant of motorcycle battery Amaron Pro Bike Rider Beta based on VRLA technology with a 48-month warranty.
ARBL has introduced low-price products at its outlets to boost volumes and improve its market share in the high-margin replacement market. These low-price products have been accepted well by customers.
ARBL has also entered into an alliance with Maruti Suzuki to strengthen its aftermarket presence. ARBL’s Amaron brand will be branded as Maruti Genuine Battery and will be marketed through Maruti’s authorised service networks across India.
On the distribution front, ARBL has strengthened its Amaron distribution network to 200 franchises and 18,000 retailers. This has enabled the company to gain increased presence in rural and urban India.
ARBL conceptualised PowerZone retail outlets in rural and semi-urban areas to provide customised batteries for rural applications. The outlets also offer complete power solutions for automobile and domestic applications, making it a one-stop shop for all power needs.
Strategic initiatives: Industrial battery segment
ARBL was the first to introduce VRLA batteries for industry standby applications. The company introduced PowerStack and Quanta brands of batteries to cater to the telecom and UPS segments. PowerStack (Large VRLA) and Quanta (Medium VRLA) remain the preferred battery brands in the telecom and UPS segments. ARBL has steadily increased its market share in the telecom and UPS segments to 32% and 28%, respectively.
In FY2010, ARBL developed PowerSleek (front terminal access) batteries to strengthen its position in the telecom and UPS segments. The company is also designing solar power batteries for its UPS segment.
ARBL widened its reach through 75 strong Authorised Quanta Alliance (AQuA) partners with a pan India distribution network to service replacement demand in industrial batteries.
In FY2010, ARBL enhanced its capacity to 1.8mn units per year from 1.2mn units per year.
ARBL developed small VRLA batteries for commercial and household applications.
Going forward, ARBL plans to enter the tubular battery segment. Tubular batteries are mainly used in material handling equipment.

Amara Raja Batteries | Auto Ancillary
September 2010 44
Profit and Loss Statement
Y/E March (Rs cr) FY07 FY08 FY09 FY10 FY11E FY12E FY13E
Gross sales 745 1,350 1,579 1,691 2,176 2,636 3,208
Less: Excise duty 151 267 266 226 305 369 481
Net Sales 594 1,083 1,313 1,465 1,871 2,267 2,727
Total operating income 594 1,083 1,313 1,465 1,871 2,267 2,727
% chg 63.6 82.3 21.2 11.6 27.7 21.2 20.3
Total Expenditure 511 921 1,163 1,184 1,599 1,940 2,342
Net Raw Materials 376 722 888 889 1,262 1,556 1,913
Other Mfg costs 27 41 48 58 67 72 81
Personnel 27 41 52 62 70 81 89
Other 82 117 175 174 199 231 259
EBITDA 83 163 150 281 273 327 385
% chg 74.7 95.5 (7.4) 87.0 (3.1) 19.9 17.6
(% of Net Sales) 14.0 15.0 11.5 19.2 14.6 14.4 14.1
Depreciation & Amortisation 17 24 35 43 56 61 75
EBIT 66 138 116 238 217 266 310
% chg 101.1 108.8 (16.1) 105.7 (9.2) 22.8 16.5
(% of Net Sales) 11.1 12.7 8.8 16.3 11.6 11.7 11.4
Interest & other charges 5 14 20 8 14 9 7
Other Income 10 22 27 24 25 29 32
(% of PBT) 14 15 22 9 11 10 10
Recurring PBT 71 146 123 255 228 286 334
% chg 90.8 105.0 (16.0) 107.6 (10.5) 25.6 16.9
Extraordinary Expense/(Inc.) - - - - - - -
PBT (reported) 71 146 123 255 228 286 334
Tax 24 52 42 88 75 89 108
(% of PBT) 33.9 35.3 34.4 34.4 33.1 31.1 32.2
PAT (reported) 47 94 81 167 152 197 227
ADJ. PAT 47 94 80 167 152 197 227
% chg 97.3 100.6 (14.7) 107.6 (8.8) 29.3 15.0
(% of Net Sales) 7.9 8.7 6.1 11.4 8.1 8.7 8.3
Basic EPS (Rs) 8.3 16.6 9.4 19.6 17.8 23.1 26.5
Fully Diluted EPS (Rs) 8.3 16.6 9.4 19.6 17.8 23.1 26.5
% chg 97.3 100.6 (43.1) 107.6 (8.8) 29.3 15.0

Amara Raja Batteries | Auto Ancillary
September 2010 45
Balance Sheet
Y/E March (Rs cr) FY07 FY08 FY09 FY10 FY11E FY12E FY13E
SOURCES OF FUNDS
Equity Share Capital 11 11 17 17 17 17 17
Preference Capital - - - - - - -
Reserves& Surplus 232 322 389 527 666 848 1,057
Shareholder’s Funds 244 333 406 544 683 865 1,074
Minority Interest - - - - - - -
Total Loans 141 316 286 91 161 111 91
Deferred Tax Liability 14 17 18 22 22 16 13
Total Liabilities 398 666 710 656 866 992 1,179
APPLICATION OF FUNDS
Gross Block 258 311 427 491 645 756 909
Less: Acc. Depreciation 101 122 146 185 242 303 378
Net Block 157 189 281 306 404 453 531
Capital Work-in-Progress 6 66 40 23 32 38 45
Goodwill - - - - - - -
Investments 16 16 47 16 22 30 47
Current Assets 350 575 526 631 787 894 1,050
Cash 26 51 70 62 95 70 70
Loans & Advances 86 103 87 109 131 153 177
Other 238 421 369 460 561 671 803
Current liabilities 131 179 184 319 379 423 495
Net Current Assets 219 396 342 312 408 472 555
Mis. Exp. not written off - - - - - -
Total Assets 398 666 710 656 866 992 1,179
Cash Flow Statement Y/E March (Rs cr) FY07 FY08 FY09 FY10 FY11E FY12E FY13E
Profit before tax 71 146 123 255 228 286 334
Depreciation 17 24 35 43 56 61 75
Change in Working Capital 84 142 (65) (0) 30 79 77
Less: Other income 165 270 (177) 12 59 164 161
Direct taxes paid 24 52 42 88 75 89 108
Cash Flow from Operations (17) (9) 227 198 179 174 217
(Inc.)/Dec. in Fixed Assets (68) (112) (90) (47) (164) (116) (161)
(Inc.)/Dec. in Investments 16 (0) (31) 31 (6) (8) (17)
(Inc.)/Dec. in loans & adv. (20) (8) 9 16 (100) (22) (24)
Other income (3) (4) (13) (4) 0 0 0
Cash Flow from Investing (76) (125) (125) (4) (270) (146) (202)
Issue of Equity 0 0 6 0 0 0 0
Inc./(Dec.) in loans 100 176 (30) (195) 70 (50) (20)
Dividend Paid (Incl. Tax) 5 5 8 8 29 13 15
Others (7) (21) (67) (15) 24 (16) (10)
Cash Flow from Financing 98 159 (83) (202) 123 (53) (15)
Inc./(Dec.) in Cash 5 26 19 (8) 32 (25) (0)
Opening Cash balances 21 26 51 70 62 95 70
Closing Cash balances 26 51 70 62 95 70 70
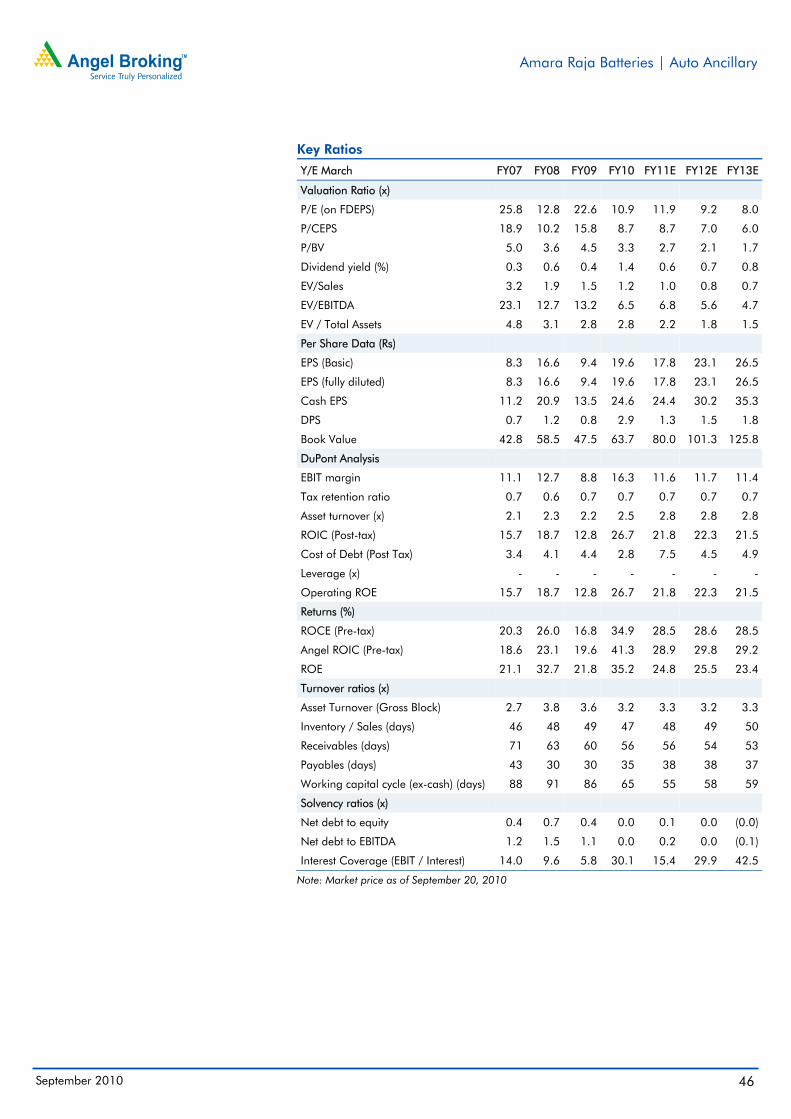
Amara Raja Batteries | Auto Ancillary
September 2010 46
Key Ratios
Y/E March FY07 FY08 FY09 FY10 FY11E FY12E FY13E
Valuation Ratio (x)
P/E (on FDEPS) 25.8 12.8 22.6 10.9 11.9 9.2 8.0
P/CEPS 18.9 10.2 15.8 8.7 8.7 7.0 6.0
P/BV 5.0 3.6 4.5 3.3 2.7 2.1 1.7
Dividend yield (%) 0.3 0.6 0.4 1.4 0.6 0.7 0.8
EV/Sales 3.2 1.9 1.5 1.2 1.0 0.8 0.7
EV/EBITDA 23.1 12.7 13.2 6.5 6.8 5.6 4.7
EV / Total Assets 4.8 3.1 2.8 2.8 2.2 1.8 1.5
Per Share Data (Rs)
EPS (Basic) 8.3 16.6 9.4 19.6 17.8 23.1 26.5
EPS (fully diluted) 8.3 16.6 9.4 19.6 17.8 23.1 26.5
Cash EPS 11.2 20.9 13.5 24.6 24.4 30.2 35.3
DPS 0.7 1.2 0.8 2.9 1.3 1.5 1.8
Book Value 42.8 58.5 47.5 63.7 80.0 101.3 125.8
DuPont Analysis
EBIT margin 11.1 12.7 8.8 16.3 11.6 11.7 11.4
Tax retention ratio 0.7 0.6 0.7 0.7 0.7 0.7 0.7
Asset turnover (x) 2.1 2.3 2.2 2.5 2.8 2.8 2.8
ROIC (Post-tax) 15.7 18.7 12.8 26.7 21.8 22.3 21.5
Cost of Debt (Post Tax) 3.4 4.1 4.4 2.8 7.5 4.5 4.9
Leverage (x) - - - - - - -
Operating ROE 15.7 18.7 12.8 26.7 21.8 22.3 21.5
Returns (%)
ROCE (Pre-tax) 20.3 26.0 16.8 34.9 28.5 28.6 28.5
Angel ROIC (Pre-tax) 18.6 23.1 19.6 41.3 28.9 29.8 29.2
ROE 21.1 32.7 21.8 35.2 24.8 25.5 23.4
Turnover ratios (x)
Asset Turnover (Gross Block) 2.7 3.8 3.6 3.2 3.3 3.2 3.3
Inventory / Sales (days) 46 48 49 47 48 49 50
Receivables (days) 71 63 60 56 56 54 53
Payables (days) 43 30 30 35 38 38 37
Working capital cycle (ex-cash) (days) 88 91 86 65 55 58 59
Solvency ratios (x)
Net debt to equity 0.4 0.7 0.4 0.0 0.1 0.0 (0.0)
Net debt to EBITDA 1.2 1.5 1.1 0.0 0.2 0.0 (0.1)
Interest Coverage (EBIT / Interest) 14.0 9.6 5.8 30.1 15.4 29.9 42.5
Note: Market price as of September 20, 2010
Amara Raja Batteries | Auto Ancillary
September 2010 47
Annexure

Auto Ancillary | Auto Sector Report
September 2010 48
Battery industry – Overview
In the Rs9,700cr Indian storage batteries sector (as estimated in FY2010), organised batteries market account for ~Rs7,300cr. Automotive batteries account for nearly ~52% of the organised market by value at ~Rs3800, while industrial batteries account for the balance ~48%. In the unorganised space, automotive battery segment accounts for ~90% of the market and the players cater mainly to the replacement demand.
Exhibit 1: Indian storage battery industry’s revenue
Source: Company, Angel Research
Exhibit 2: Auto battery – Segment-wise offtake
Source: Crisil Research, Company, Angel Research
Well-spread distribution network – Crucial to retain competitive edge
A wide distribution network and after-sales and service reach are key parameters to gain competitive strength and increase market share in the industry. OEMs prioritise operational efficiency, quality and after-sales and service reach. Hence, most battery manufacturers distribute their products through exclusive dealerships/service centres, retail distributors and OEM service centres.
In the replacement market too brand perception, after-sales service and product differentiation play an important role. Thus, a well-entrenched distribution network is a vital link in retaining customers as the costs involved in switching brands are negligible. Leader Exide has the widest distribution in India with around 38,500 retail outlets for after-market sales in comparison to competitor ARBL, which has 18,000 retail outlets.
Automotive batteries to ride on auto sector’s secular growth
Automotive battery sales are driven by the production of automobiles and replacement market. Around 30-35% of demand mix is derived from the OEM’s, while the replacement segment contributes the balance 65-70%. In case of the OEM’s, demand is derived from the different segments with cars and utility vehicles accounting for the largest share of 38-40% followed by commercial vehicles (CV) at 29-31%. Though the OEM segment is important as it assures big volumes, brand visibility and quality, the profit margins are low in the range of 6-8%, whereas in the replacement segment margins are at a healthy 15-18%.
Organised auto
38.8%
Organised indutrial36.4%
Auto90.9%
Industrial9.1%
Unorganised24.8%
Commercial Vehicles
29%
Cars and Utility Vehicles
38%
Tractors12%
Two Wheelers21%

Auto Ancillary | Auto Sector Report
September 2010 49
Exhibit 3: Vehicle sales and population in India
Source: SIAM, Angel Research
Exhibit 4: OEM, Replacement battery volume trend
Source: Industry, Companies, Angel Research
Automotive OEM segment revving up: The automobile sector registered a robust 10% volume CAGR during FY2005-10, which resulted in strong demand for automotive batteries particularly from the OEM segment. Going ahead too, the automobile volumes are expected to register an impressive ~12% CAGR over FY2010-13E. Moreover, with the global automobile majors setting up manufacturing plants in India, we expect the automotive battery sector to register healthy growth over the medium term.
Exhibit 5: Four-wheeler sales
Source: SIAM, Industry, Companies, Angel Research
Exhibit 6: Two-wheeler sales
Source: SIAM, Industry, Companies, Angel Research
The OEM market is dominated largely by brands such as Exide, Amaron and AMCO. Exide is the market leader in the OEM segment with a market share of 60-65%, while ARBL enjoys market share of 24-27%.
41 45 49 55 5967 73
8190
100107
116126
137150
4 5 5 5 6 7 8 9 11 11 11 14 15 17 18
0
20
40
60
80
100
120
140
160
FY
99
FY
00
FY
01
FY
02
FY
03
FY
04
FY
05
FY
06P
FY
07P
FY
08P
FY
09P
FY
10E
FY
11E
FY
12E
FY
13E
(mn units) Total Vehicle Population Total Vehicle Sales
10.1 11.1 13.4 15.8 17.5 19.0
20.6 23.9 27.3
32.1 37.2
41.4
0
10
20
30
40
50
60
70
FY08 FY09 FY10P FY11E FY12E FY13E
(mn units) OEM volume Replacement volume
0
5
10
15
20
25
0
1,000
2,000
3,000
4,000
5,000
FY08 FY09 FY10 FY11E FY12E FY13E
(mn units)('000 units) 4-wheeler sales 4-wheeler battery sales
0
10
20
30
40
0
3,000
6,000
9,000
12,000
15,000
FY08 FY09 FY10 FY11E FY12E FY13E
(mn units)('000 units) 2-wheeler sales 2-wheeler battery sales

Auto Ancillary | Auto Sector Report
September 2010 50
Exhibit 7: Four-wheeler OEM market share
Source: Industry, Companies, Angel Research
Exhibit 8: Two-wheeler OEM market share
Source: Industry, Companies, Angel Research
Replacement battery demand rising on increasing vehicle base: The replacement segment constitutes the largest share of automotive batteries. On an average, a battery comes up for replacement once in three to four years and there could be as much as three replacements during the life-time of a vehicle. The buoyant growth in the automobile segment over the past four years (~9.1% CAGR over FY2006-10) has percolated into the replacement market. We estimate vehicle population to grow at ~9% CAGR over FY10-13E (~9.5% over FY2006-10). Moreover, increasing usage of electrical and electronic equipment (power windows, central locking, etc) in automobiles is expected to boost the demand for power from the batteries, which would in turn bolster the replacement demand.
Exhibit 9: Four-wheeler replacement market share
Source: Industry, Companies, Angel Research
Exhibit 10: Two-wheeler replacement market share
Source: Industry, Companies, Angel Research
The replacement segment is highly concentrated in the hands of few players in the organised sector (Exide and ARBL), but a large portion continues to be dominated by the unorganised players. The unorganised players cater to the lower end of the market especially in the CV and tractor segments. Over the last few years however, share of the unorganised players has been declining on the back of rising disposable income levels, increasing quality consciousness, environmental restrictions and better technology in the automotive industry.
66.7
26.3
7.0
64.7
26.5
8.8
0
10
20
30
40
50
60
70
Exide ARBL Others
(%) FY08 FY0956.3
42.3
1.4
53.9
40.8
5.3
0
10
20
30
40
50
60
Exide Amco Others
(%) FY08 FY09
54.5
22.7 22.7
49.0
23.5 27.5
0
10
20
30
40
50
60
Exide ARBL Others
(%) FY08 FY09
58.8
27.5
13.7
53.1
25.0 21.9
0
10
20
30
40
50
60
70
Exide Amco Others
(%) FY08 FY09

Auto Ancillary | Auto Sector Report
September 2010 51
Transformation of an industry – Battery electric vehicle (BEV)
The size of world battery industry is expected to be about US $71bn in CY2009. The global battery demand is expected to increase 4.8% annually through CY2012. The migration from densely populated urban areas to the suburbs in the cities has transformed people’s lifestyles and social interactions, even their employment patterns. While the effects of modern automobile use continues to generate philosophical discussions, perhaps the most controversial debate centers around the impact that nearly one billion cars worldwide are having on the environment. Environmental sensitivities have begun to drive demand for an alternative to the conventional internal combustion engine (ICE) vehicles. Among the front-runner technologies the battery electric vehicle (BEV) has zero emission.
Exhibit 11: Driving the world towards electric vehicles
Source: National Strategy Conference E-Mobility – United Nations, Angel Research
According to a market forecast, the BEV market will comprise approximately 13mn vehicles in 2020. Given that total vehicle sales are estimated at around 100mn in 2020, the share of BEVs in the vehicle market is likely to be small, while ICE vehicles continue to dominate the market for at least another decade.
By 2020, around 5% of the global auto production, or nearly two million cars, will be electric. As per industry estimates, in India electric cars are expected to account for less than 5% of the overall automobile market in the next 8-10 years. With rising fuel cost and environmental concerns boosting demand for electric cars, auto majors in India such as Mahindra & Mahindra, Tata Motors, Maruti Suzuki, Hero Electric and Hyundai are assessing the electric car market. While the domestic auto sales in India increased by 25% in value terms this year, the surge in demand for auto components and accessories presents an opportunity for partnerships that will help cut the manufacturing costs and boost energy savings.
Driver Development Impact in long term
1) Reducing anthropogenic CO2 emission. 2)Resource constraints making alternative fuel and power train concepts necessary.
1) National targets for BEV parcs
2) Government subsidizing and incentivizing Evs.
3) Regulation on CO2 emission standards.
1) consumers are getting more sensible for environment friendly labels
2)Reduction in total cost of ownership for BEVs expected
1) BEVs suits short distance commuters
2) People's average driving distance less than 50km
3) 60% of world population in cities by 2030 (70% by 2050)Urbanization
Policies
Environment
Consumer

Auto Ancillary | Auto Sector Report
September 2010 52
Exhibit 12: Electric vehicle model launches globally
Source: Industry, OEM’s, Angel Research
A review of the key trends suggests that catalysts may be aligning for BEVs. Economic trends such as strong and potentially rising oil prices, as well as a pervasive awareness of environmental impacts and an ongoing, contentious debate surrounding climate change are likely to keep the BEVs in the spotlight. Policy changes, evolving technology and changes in the market from consumer tastes to personal economics like-wise suggest that while the ICE will continue to play an important role, it may no longer have the stage to itself. However, the BEV’s distinctive characteristics, such as simplicity of its vehicle structure and driving capability, could bring about major changes to an industry that has progressed without significant changes for a century.
Exhibit 13: Traditional structure has to change – Opportunity forexisting and new battery manufacturers
Source: Industry, Angel Research
Nonetheless, battery technology is unable to keep up with the hybrid and electric vehicle market (HEV). Improving infrastructure and growing power requirements lead to greater instability in the batteries thereby limiting the miles covered. In case of the BEVs, battery technology is not advanced enough to cover long distances on
Seg OEM CY2008 CY2009 CY2010 CY2011 CY2012Through -
CY2012 ('in 000)
Qingyuan Happy Messen 335Renault City EV 140REVA G-Wiz 126Think City 53Mitsubishi iMiEV 30Subaru R1e 12Daimler Smart EV 30
OtherNice Cars Zero, Tata Indica
Tata Nano, Nissan Cube
Mercedes A-/B-class EV
Toyota iQ EV, VW up EV, 40
Wanxiang WXEV7050 130Renault Megane EV 140Tesla 10Miles XS500 8Toyota Prius Plug-in 10
Other
BYD F3e, F3DM, GM Volt/Ampera
Kangoo EV, Ford Connect EV
Ford Mondeo PHEV 60
Wanxiang ZN5490EV 50Fisker Karma 30Tesla Roadster 42
G/SUV
A/B
C/D
Investment in energy storage
Compensationfor electricity trade
Utilitycompanies Consumers
Demand-pull
Infra-structure
Distribution fornew E-market
Reduced life-cycle cost
Batterymanufacturers
Newsuppliers New market for
other industries
Vehiclemanufacturers

Auto Ancillary | Auto Sector Report
September 2010 53
one charge. Increasing the number of cells to augment the energy capacity and density of the batteries increases the weight of the vehicle rendering it incapable of covering greater distances. The battery cost also increases, thereby discouraging demand. However, since this is an upcoming segment, the level of enthusiasm and investments or participants entering the market is at an all-time high. In 2004, revenues generated by the World BEV/HEV battery market were approximately US $349 million. Revenues are expected at US $1,867mn in 2011, logging a CAGR of 27.1%.
Industrial batteries – Growing with economy
The industrial battery segment accounts for around 48% (approx. Rs3,500cr) of the total organised Indian storage battery market. Demand for industrial batteries is driven by industrial growth (reflected through IIP), infrastructure spending in the telecom, railways and power sectors.
Industrial batteries are classified into conventional (lead acid), valve-regulated lead acid (VRLA) and nickel-cadmium batteries. The VRLA batteries have been gaining increasing acceptance and currently comprise ~75% of the Indian industrial storage battery market Overall, the industrial battery sales majorly driven by VRLA batteries logged CAGR of ~18.8% over FY2008-10.
The industrial battery market is highly concentrated with three-four players. Exide is the market leader with a share of 40-45%. ARBL and HBL Power are the other major players with a market share of 25-27% and 30-33%, respectively.
Telecom – Growth to taper off
The telecom batteries, which accounts for around 35% of the industrial battery market, witnessed a boost in demand over the past couple of years on the back of the boom in the telecom services sector. The telecom boom led to huge investments being drawn up for setting up the network infrastructure to cater to the increasing subscriber base and consequent increase in traffic. The telecom towers form an essential part of the telecom infrastructure. Currently, there are ~300,000 telecom towers in the country. The unprecedented growth in the telecom infrastructure led to a CAGR of 39.8% for telecom towers during FY2006-10.
Exhibit 14: Slowdown in tower addition to hit telecom battery demand
Source: TRAI, Crisil Research, Industry, Angel Research
8 15
23
34
50
63 70
72
0
20
40
60
80
0
100
200
300
400
500
FY06 FY07 FY08 FY09 FY10 FY11E FY12E FY13E
(%)('000 units) Towers TeleDensity
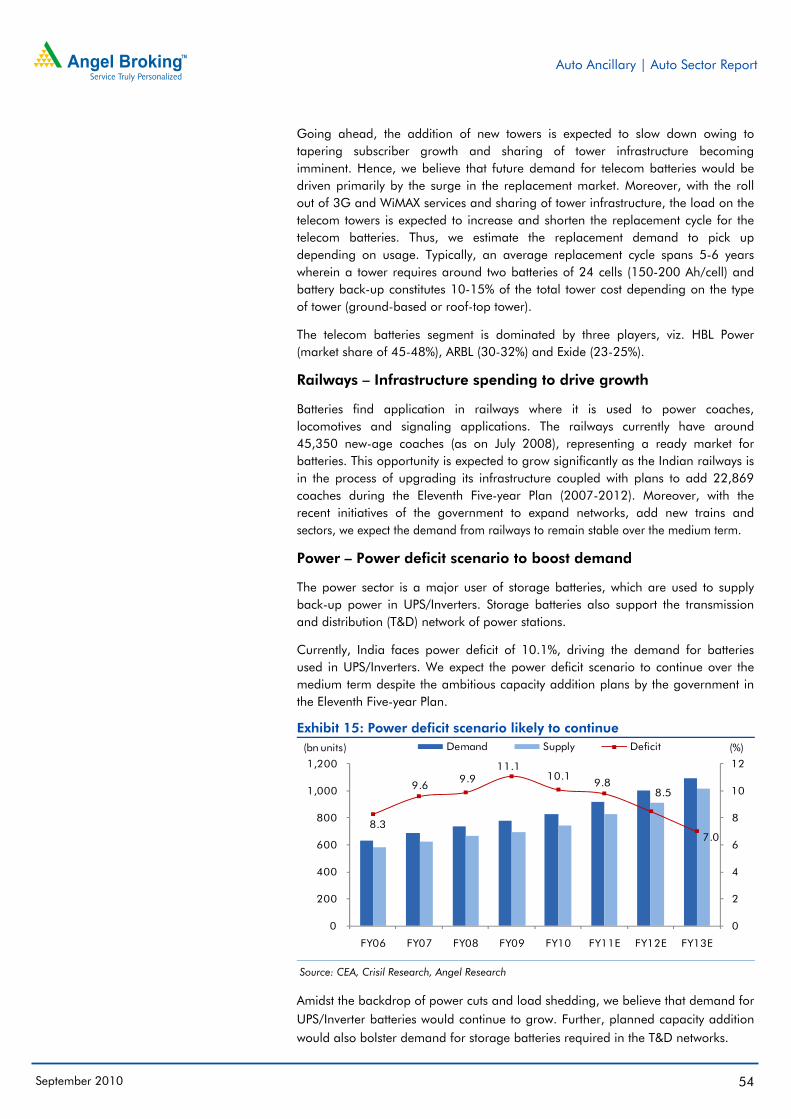
Auto Ancillary | Auto Sector Report
September 2010 54
Going ahead, the addition of new towers is expected to slow down owing to tapering subscriber growth and sharing of tower infrastructure becoming imminent. Hence, we believe that future demand for telecom batteries would be driven primarily by the surge in the replacement market. Moreover, with the roll out of 3G and WiMAX services and sharing of tower infrastructure, the load on the telecom towers is expected to increase and shorten the replacement cycle for the telecom batteries. Thus, we estimate the replacement demand to pick up depending on usage. Typically, an average replacement cycle spans 5-6 years wherein a tower requires around two batteries of 24 cells (150-200 Ah/cell) and battery back-up constitutes 10-15% of the total tower cost depending on the type of tower (ground-based or roof-top tower).
The telecom batteries segment is dominated by three players, viz. HBL Power (market share of 45-48%), ARBL (30-32%) and Exide (23-25%).
Railways – Infrastructure spending to drive growth
Batteries find application in railways where it is used to power coaches, locomotives and signaling applications. The railways currently have around 45,350 new-age coaches (as on July 2008), representing a ready market for batteries. This opportunity is expected to grow significantly as the Indian railways is in the process of upgrading its infrastructure coupled with plans to add 22,869 coaches during the Eleventh Five-year Plan (2007-2012). Moreover, with the recent initiatives of the government to expand networks, add new trains and sectors, we expect the demand from railways to remain stable over the medium term.
Power – Power deficit scenario to boost demand
The power sector is a major user of storage batteries, which are used to supply back-up power in UPS/Inverters. Storage batteries also support the transmission and distribution (T&D) network of power stations.
Currently, India faces power deficit of 10.1%, driving the demand for batteries used in UPS/Inverters. We expect the power deficit scenario to continue over the medium term despite the ambitious capacity addition plans by the government in the Eleventh Five-year Plan.
Exhibit 15: Power deficit scenario likely to continue
Source: CEA, Crisil Research, Angel Research
Amidst the backdrop of power cuts and load shedding, we believe that demand for UPS/Inverter batteries would continue to grow. Further, planned capacity addition would also bolster demand for storage batteries required in the T&D networks.
8.3
9.6 9.9
11.1 10.1
9.8 8.5
7.0
0
2
4
6
8
10
12
0
200
400
600
800
1,000
1,200
FY06 FY07 FY08 FY09 FY10 FY11E FY12E FY13E
(%)(bn units) Demand Supply Deficit

Auto Ancillary | Auto Sector Report
September 2010 55
Key risks
Lead price volatility
Volatility in lead prices makes inventory management and pricing policy a challenge for players, as lead and lead alloys are the primary materials consumed in the manufacturing of batteries, representing 75–80% of overall raw materials consumed. An increase in lead prices will impact margins, thus affecting profitability and return ratios.
Cheap Chinese imports
Cheap imports from China are a concern for the industry. However, the price differential has shrunk to 5–10% after China cancelled the export refund for all lead-acid battery manufacturers in a bid to control high energy-consuming and highly polluting products. Given the general industry concerns regarding the quality of Chinese batteries, these imports are not likely to be a major threat over the long term.
Competition to intensify due to new entrants
The industry is likely to witness increased competition over the medium term. Buoyant demand outlook has prompted existing players such as Exide and ARBL to increase their capacity. Among new players, Tata Autocomp plans to scale up to 2mn units by FY2011E. Among prominent global players, JCI and Exide Technologies have already entered India through JVs with ARBL and Tudor, respectively. Other global majors such as East Penn and EnerSys, might enter India in the future owing to higher growth opportunity, which can intensify competition in the industry.

Auto Ancillary | Auto Sector Report
September 2010 56
Research Team Tel: 022 - 4040 3800 E-mail: [email protected] Website: www.angeltrade.com
DISCLAIMER This document is solely for the personal information of the recipient, and must not be singularly used as the basis of any investment decision. Nothing in this document should be construed as investment or financial advice. Each recipient of this document should make such investigations as they deem necessary to arrive at an independent evaluation of an investment in the securities of the companies referred to in this document (including the merits and risks involved), and should consult their own advisors to determine the merits and risks of such an investment.
Angel Broking Limited, its affiliates, directors, its proprietary trading and investment businesses may, from time to time, make investment decisions that are inconsistent with or contradictory to the recommendations expressed herein. The views contained in this document are those of the analyst, and the company may or may not subscribe to all the views expressed within.
Reports based on technical and derivative analysis center on studying charts of a stock's price movement, outstanding positions and trading volume, as opposed to focusing on a company's fundamentals and, as such, may not match with a report on a company's fundamentals.
The information in this document has been printed on the basis of publicly available information, internal data and other reliable sources believed to be true, but we do not represent that it is accurate or complete and it should not be relied on as such, as this document is for general guidance only. Angel Broking Limited or any of its affiliates/ group companies shall not be in any way responsible for any loss or damage that may arise to any person from any inadvertent error in the information contained in this report. Angel Broking Limited has not independently verified all the information contained within this document. Accordingly, we cannot testify, nor make any representation or warranty, express or implied, to the accuracy, contents or data contained within this document. While Angel Broking Limited endeavours to update on a reasonable basis the information discussed in this material, there may be regulatory, compliance, or other reasons that prevent us from doing so.
This document is being supplied to you solely for your information, and its contents, information or data may not be reproduced, redistributed or passed on, directly or indirectly.
Angel Broking Limited and its affiliates may seek to provide or have engaged in providing corporate finance, investment banking or other advisory services in a merger or specific transaction to the companies referred to in this report, as on the date of this report or in the past.
Neither Angel Broking Limited, nor its directors, employees or affiliates shall be liable for any loss or damage that may arise from or in connection with the use of this information.
Note: Please refer to the important `Stock Holding Disclosure' report on the Angel website (Research Section). Also, please refer to the latest update on respective stocks for the disclosure status in respect of those stocks. Angel Broking Limited and its affiliates may have investment positions in the stocks recommended in this report.
Disclosure of Interest Statement Exide Industries Amara Raja Batteries 1. Analyst ownership of the stock No No 2. Angel and its Group companies ownership of the stock No Yes 3. Angel and its Group companies' Directors ownership of the stock No No 4. Broking relationship with company covered No No Note: We have not considered any Exposure below Rs 1 lakh for Angel, its Group companies and Directors.
Ratings (Returns): Buy (> 15%) Accumulate (5% to 15%) Neutral (-5 to 5%) Reduce (-5% to 15%) Sell (< -15%)

Auto Ancillary | Auto Sector Report
September 2010 57
Address: Acme Plaza, ‘A’ Wing, 3rd Floor, M.V. Road, Opp. Sangam Cinema, Andheri (E), Mumbai - 400 059.
Tel: (022) 3952 4568 / 4040 3800
Research Team
Fundamental:
Sarabjit Kour Nangra VP-Research, Pharmaceutical [email protected]
Vaibhav Agrawal VP-Research, Banking [email protected]
Vaishali Jajoo Automobile [email protected]
Shailesh Kanani Infrastructure, Real Estate [email protected] Anand Shah FMCG, Media [email protected]
Deepak Pareek Oil & Gas [email protected]
Sushant Dalmia Pharmaceutical [email protected]
Rupesh Sankhe Cement, Power [email protected]
Param Desai Real Estate, Logistics, Shipping [email protected]
Sageraj Bariya Fertiliser, Mid-cap [email protected]
Viraj Nadkarni Retail, Hotels, Mid-cap [email protected]
Paresh Jain Metals & Mining [email protected]
Amit Rane Banking [email protected]
John Perinchery Capital Goods [email protected]
Srishti Anand IT, Telecom [email protected]
Jai Sharda Mid-cap [email protected]
Sharan Lillaney Mid-cap [email protected]
Amit Vora Research Associate (Oil & Gas) [email protected]
V Srinivasan Research Associate (Cement, Power) [email protected]
Mihir Salot Research Associate (Logistics, Shipping) [email protected]
Chitrangda Kapur Research Associate (FMCG, Media) [email protected]
Pooja Jain Research Associate (Metals & Mining) [email protected]
Yaresh Kothari Research Associate (Automobile) [email protected]
Shrinivas Bhutda Research Associate (Banking) [email protected]
Sreekanth P.V.S Research Associate (FMCG, Media) [email protected]
Hemang Thaker Research Associate (Capital Goods) [email protected]
Nitin Arora Research Associate (Infra, Real Estate) [email protected]
Technicals:
Shardul Kulkarni Sr. Technical Analyst [email protected]
Mileen Vasudeo Technical Analyst [email protected]
Derivatives: Siddarth Bhamre Head - Derivatives [email protected] Jaya Agarwal Derivative Analyst [email protected]
Institutional Sales Team:
Mayuresh Joshi VP - Institutional Sales [email protected]
Abhimanyu Sofat AVP - Institutional Sales [email protected]
Nitesh Jalan Sr. Manager [email protected]
Pranav Modi Sr. Manager [email protected]
Sandeep Jangir Sr. Manager [email protected]
Ganesh Iyer Sr. Manager [email protected]
Jay Harsora Sr. Dealer [email protected]
Meenakshi Chavan Dealer [email protected]
Gaurang Tisani Dealer [email protected]
Production Team:
Bharathi Shetty Research Editor [email protected]
Simran Kaur Research Editor [email protected]
Bharat Patil Production [email protected]
Dilip Patel Production [email protected]
Angel Broking Ltd: BSE Sebi Regn No : INB 010996539 / CDSL Regn No: IN - DP - CDSL - 234 - 2004 / PMS Regn Code: PM/INP000001546 Angel Securities Ltd:BSE: INB010994639/INF010994639 NSE: INB230994635/INF230994635 Membership numbers: BSE 028/NSE:09946
Angel Capital & Debt Market Ltd: INB 231279838 / NSE FNO: INF 231279838 / NSE Member code -12798 Angel Commodities Broking (P) Ltd: MCX Member ID: 12685 / FMC Regn No: MCX / TCM / CORP / 0037 NCDEX : Member ID 00220 / FMC Regn No: NCDEX / TCM / CORP / 0302