battery testing in the us - anl.gov soc in
TRANSCRIPT

Battery Testing and Life Estimation in the US
Ira Bloom
US-China EV Initiative Workshop
Argonne National Laboratory
August 4-5, 2011

Battery Testing in the US
Battery performance and life testing in the US is an application-driven, analytical process
Current focus is on HEVs, PHEVs and EVs
For simplicity, this presentation will be focused on test methods for PHEVs and EVs at the pre-competitive stage
General testing philosophy– Obtain sufficient information in a limited amount of time to gauge the performance of a
battery without exhausting it
– The test procedures employ accelerated aging techniques
– The test procedures used are applicable to cells, modules and complete battery systems
Anatomy of battery testing– Characterize the performance of a battery
– Age it under controlled conditions
– Measure changes in performance by repeating portions of the characterization tests• A reference performance test

Vehicle Stress on Battery
Each type of electric vehicle uses the capacity/energy of the battery differently– EV: use about 80% of available battery energy for vehicle propulsion (all electric range,
AER)
– PHEV: use about 70% for electric propulsion (high SOC, AER) and about 5% for hybrid operation (low SOC)
– HEV: use about the central 50% of the battery for operation (charge sustaining)
Thus, the battery has to be sized and engineered to accommodate demands from the vehicle
0% 20% 40% 60% 80% 100%
SOC Range
EV
PHEV
HEV
Used capacity (CD)Unused capacity
CS Used capacity (CD)Unused capacity
Charge sustaining (CS)
Unused/unchargedcapacity
Unused capacity
Available capacity
Available capacity

Vehicle Assumptions At Pre-competitive Stage
Other considerations: vehicle mass, aerodynamic and rolling resistances, vehicle performance (top speed/acceleration), electric range, operating strategy and usable energy window
Three vehicle types were selected to resent different energy requirements and to represent various sectors of the light-duty US vehicle market
– Midsize car (ex: Chevy Malibu)
– Midsize crossover utility vehicle (CUV, ex: Chrysler Pacifico)
– Midsize sport utility vehicle (SUV, ex: Ford Explorer)
Parameter Units Midsize car Midsize crossover UV
Midsize SUV
Approximate Vehicle mass
kg 1600 1950 2000
Frontal area m2 2.2 2.7 2.9 Drag coefficient
0.3 0.4 0.4
Rolling resistance
0.009 0.010 0.011
Accessory electrical load
W 800 1000 1200
Data from: Pesaran, Markel, Tataria and Howell, EVS23 Symposium, Anaheim, CA, December 2007

Vehicle Modeling Shows Energy/Power Requirements for PHEVs
Urban Dynamometer Driving Schedule (UDDS) was used as basis for modeling the vehicles, with a minimum AER of 10 mi (16 km)
Analysis of energy requirements showed:– Midsize car consumed about ~280 Wh/mi (~175 Wh/km)
– Midsize CUV, ~340 Wh/mi (~210 Wh/km)
– Midsize SUV, ~420 Wh/mi (~260 Wh/km)
Analysis of power requirements showed (mid AER power, 2s):– Midsize car, 46 kW
– Midsize CUV, 50 kW
– Midsize SUV, 70 kW
For a 10-s pulse, the power would be about 75% of these values– Midsize car, ~35 kW
– Midsize CUV, ~37 kW
– Midsize SUV, ~53 kW
Using These Results, Goals Were Established
In the near-term (2012), batteries are expected to have high power:energy ratio, based on work with current hybrid electric vehicles; early market penetration
– 10 mi AER vehicles
In the longer-term (2015-16), higher energy batteries (lower power:energy ratio) are expected to become available
– 40 mi AER vehicles
A mid-term goal was also established, representing an intermediate stage of development
– 20 mi AER vehicles
The results were then generalized to be free of the specific vehicles mentioned earlier and are used in battery development
It should also be noted that the starting SOC for the capacity/energy range that is used in the CD was left to the battery developer

PHEV Battery Testing The US Advanced Battery Consortium
(USABC) has established performance and life targets for PHEVs
Intended vehicle platforms– Minimum PHEV battery target: a sport
utility vehicle with a mass of 2000 kg and with an equivalent electric range of 10 miles (16 km)
– Medium PHEV battery target: a passenger car with a mass of 1600 kg and with an equivalent electric range of 20 miles (32 km)
– Maximum PHEV battery target: a passenger car with a mass of 1500 kg and with an equivalent electric range of 40 miles (64 km)
The goals are directly applicable to complete battery systems; most can be applied to the testing of modules, cells or sub-scale cells with appropriate scaling (battery scale factor)
Characteristics at EOL (End-of-Life) Unit
Min PHEV Battery
Med PHEV Battery
Max PHEV Battery
Equivalent Electric Range
Miles(km)
10(16)
20(32)
40(64)
Peak Discharge Pulse Power (2 sec /10 s)
kW 50/45 45/37 46/38
Peak Regen Pulse Power (10 s)
kW 30 25 25
Max. Current -10s A 300 300 300
Available Energy for CD Mode, 10-kW Rate
kWh 3.4 5.8 11.6
Available Energy for CS Mode, 10-kW Rate
kWh 0.5 0.3 0.3
Minimum Efficiency % 90 90 90
Cold cranking power at -30°C kW 7 7 7
CD Life Cycle 5,000 5,000 5,000
CS HEV Cycle Life, 50 Wh Profile
Cycles 300,000 300,000 300,000
Calendar Life, 35°C Year 15 15 15
Selected Energy Storage SystemTarget Values
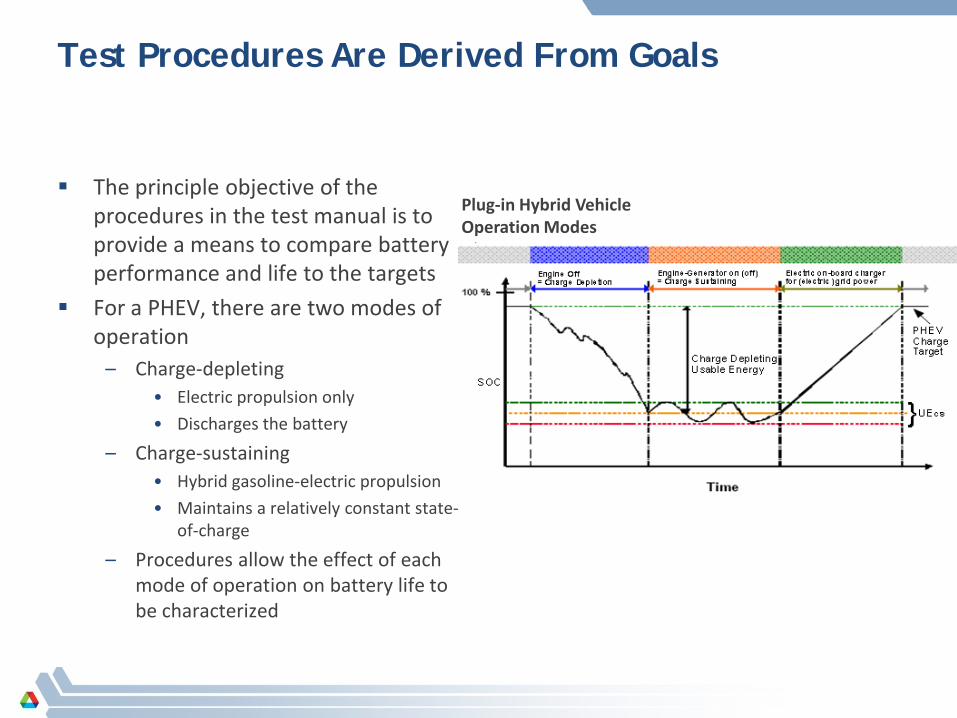
Test Procedures Are Derived From Goals
The principle objective of the procedures in the test manual is to provide a means to compare battery performance and life to the targets
For a PHEV, there are two modes of operation
– Charge-depleting • Electric propulsion only
• Discharges the battery
– Charge-sustaining• Hybrid gasoline-electric propulsion
• Maintains a relatively constant state-of-charge
– Procedures allow the effect of each mode of operation on battery life to be characterized
Plug-in Hybrid VehicleOperation Modes

PHEV Test Procedures: Characterize Battery Performance Batteries are characterized in terms of constant-current capacity, self-discharge,
hybrid pulse-power capability (HPPC), cold cranking (5 kW at -30oC), thermal performance and energy efficiency
HPPC Test: Measure battery impedance and power/energy characteristics
Rd= ∆V/ ∆I = (Vt1-Vt0)/(It1- It0); Rr= (Vt3-Vt2)/(It3- It2) End-of-test: Power or
energy values are less than target values
-6
-5
-4
-3
-2
-1
0
1
2
3
4
0 10 20 30 40 50 60 70
Time, s
Rel
. cur
rent
Volta
ge (a
rb. u
nits
)
t0 t1
t2 t3
Discharge
Charge
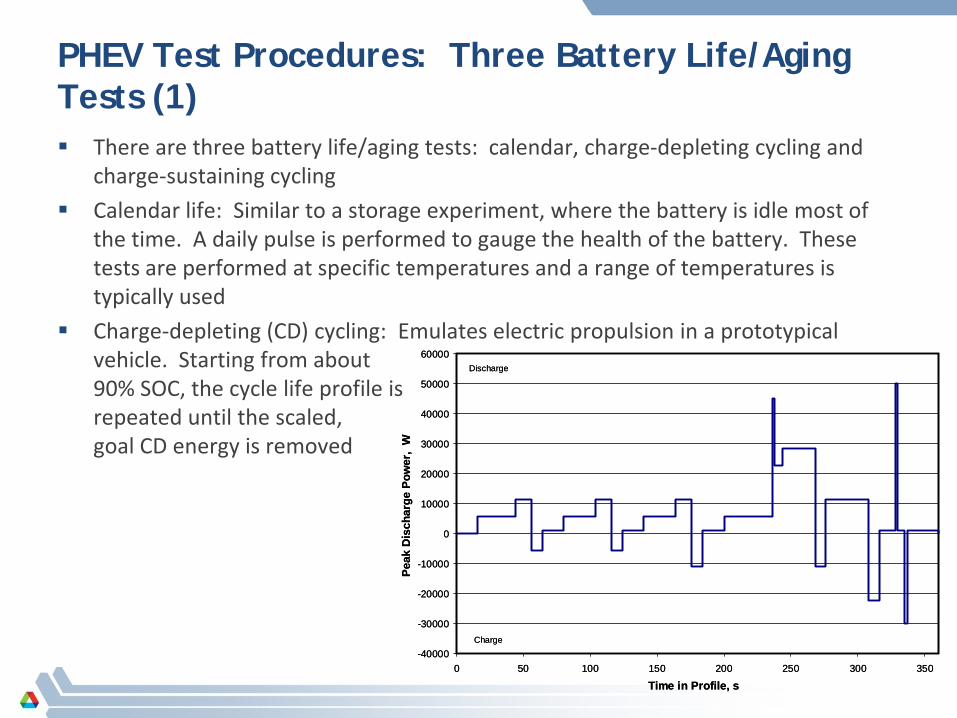
PHEV Test Procedures: Three Battery Life/Aging Tests (1) There are three battery life/aging tests: calendar, charge-depleting cycling and
charge-sustaining cycling
Calendar life: Similar to a storage experiment, where the battery is idle most of the time. A daily pulse is performed to gauge the health of the battery. These tests are performed at specific temperatures and a range of temperatures is typically used
Charge-depleting (CD) cycling: Emulates electric propulsion in a prototypical vehicle. Starting from about 90% SOC, the cycle life profile is repeated until the scaled, goal CD energy is removed
-40000
-30000
-20000
-10000
0
10000
20000
30000
40000
50000
60000
0 50 100 150 200 250 300 350
Time in Profile, s
Peak
Dis
char
ge P
ower
, W
Discharge
Charge
-40000
-30000
-20000
-10000
0
10000
20000
30000
40000
50000
60000
0 50 100 150 200 250 300 350
Time in Profile, s
Peak
Dis
char
ge P
ower
, W
Discharge
Charge

PHEV Test Procedures: Three Battery Life/Aging Tests (2)
Charge-sustaining (CS) cycling: Emulates the operation of a PHEV in hybrid electric vehicle mode. This profile is performed continuously and at low SOC
CD and CS cycle profiles can be combined to better capture the operation of a PHEV
– Perform CD profile to removed scaled amount of energy then perform 50 CS profiles
Reference performance tests (RPTs) are performed every 32 days, 400 cycles and 30,000 cycles for calendar, CS cycle and CD cycle life, respectively
– RPTs consist of constant-current capacity measurement and HPPC test at 30oC
-25
-20
-15
-10
-5
0
5
10
15
20
25
30
0 10 20 30 40 50 60 70 80 90 100
Time in Profile, s
Pow
er, k
W
Discharge
Charge
-25
-20
-15
-10
-5
0
5
10
15
20
25
30
0 10 20 30 40 50 60 70 80 90 100
Time in Profile, s
Pow
er, k
W
Discharge
Charge

Example Results (Calculated)
Hypothetic test: accelerated calendar life test at 30, 40, 50 and 60oC
Reference performance tests every 4 weeks– Gauge capacity and resistance changes using capacity tests and HPPC
– Calculate changes in power and energy abilities
HPPC results with time
3.53.63.73.83.944.14.2
OCV, V
0
0.005
0.01
0.015
0.02
0.025
0.03
Res
ista
nce,
ohm
s
Time
Discharge
Regen

Energy and Power Ability Also Change with Time
Power goal
0
1000
2000
3000
4000
5000
6000
7000
8000
0 10000 20000 30000 40000 50000 60000 70000 80000 90000 100000
BSF-scaled Power, W
BSF-
scal
ed E
nerg
y, W
h
CD Energy
CS Energy
CS energy goal
CD energy goal

Model can use any of the parameters of interest: capacity, CD/CS energy, power at either 3400 or 500 Wh, resistance
Arrhenius plot using relative resistance as metric
Estimate life using power fade– In example, battery reached EOL at RPT4 (20 weeks)
Use Result to Model Changes
0
1
2
3
4
5
6
7
8
0 0.1 0.2 0.3 0.4 0.5 0.6 0.7 0.8
Time, y
Rel
. res
ista
nce
303 K
313 K323 K
333 K

EV Battery Testing
The USABC has established performance and life targets for EVs
Intended platform is a four-passenger, car which weighs about 1800-2000 kg and has a driving range of ~100 mi (160 km)
Goals are based on battery weight and volume
ParameterTarget
Mid-Term Long Term
Power density, W/L 460 600
Specific power (discharge; 80% DOD for 30 sec), W/kg
300 400
Specific power (regen; 20% DOD for 10 sec), W/kg
150 200
Energy density at C/3 rate, Wh/L
230 300
Specific energy at C/3 rate, Wh/kg
150 200
Specific Energy:Specific Power ratio
2:1 2:1
Total pack size, kWh 40 40
Life, years 10 10
Cycle life (80% DOD), cycles
1,000 1,000
Power and capacity degradation, % of rated
20 20
Operating environment -40 to 50oC(20%
performance loss; 10% desired)
-40 to 85oC
Normal recharge time, h 6 3 to 6
Fast recharge time 20-70% SOC in <30
min
40-80% SOC in 15 min
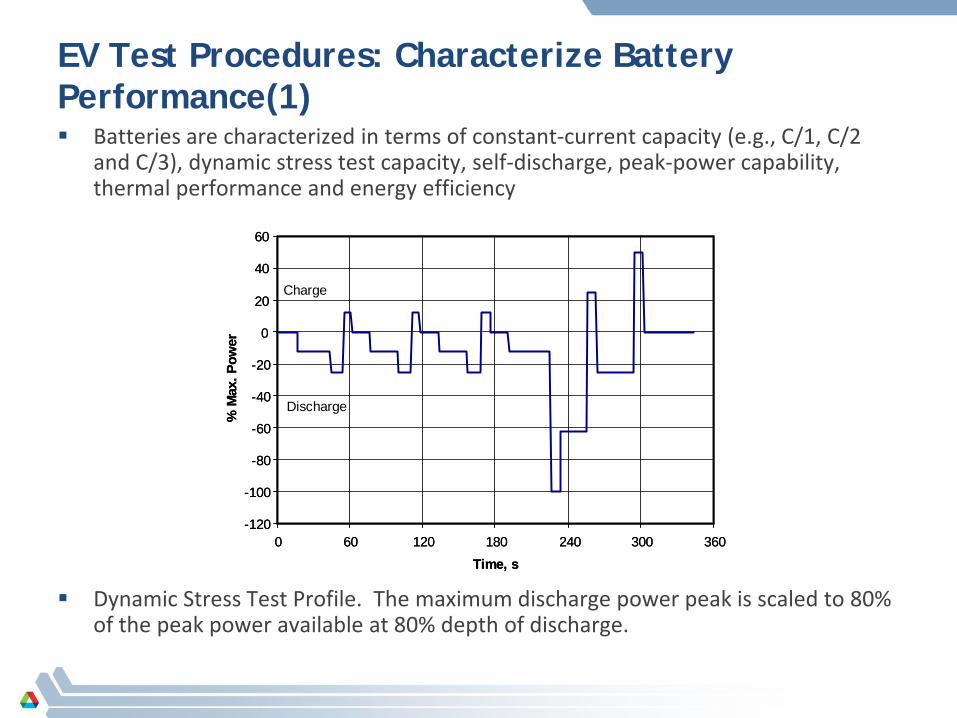
EV Test Procedures: Characterize Battery Performance(1) Batteries are characterized in terms of constant-current capacity (e.g., C/1, C/2
and C/3), dynamic stress test capacity, self-discharge, peak-power capability, thermal performance and energy efficiency
Dynamic Stress Test Profile. The maximum discharge power peak is scaled to 80% of the peak power available at 80% depth of discharge.
-120
-100
-80
-60
-40
-20
0
20
40
60
0 60 120 180 240 300 360Time, s
% M
ax. P
ower
Charge
Discharge
-120
-100
-80
-60
-40
-20
0
20
40
60
0 60 120 180 240 300 360Time, s
% M
ax. P
ower
Charge
Discharge
EV Test Procedures: Characterize Battery Performance (2)
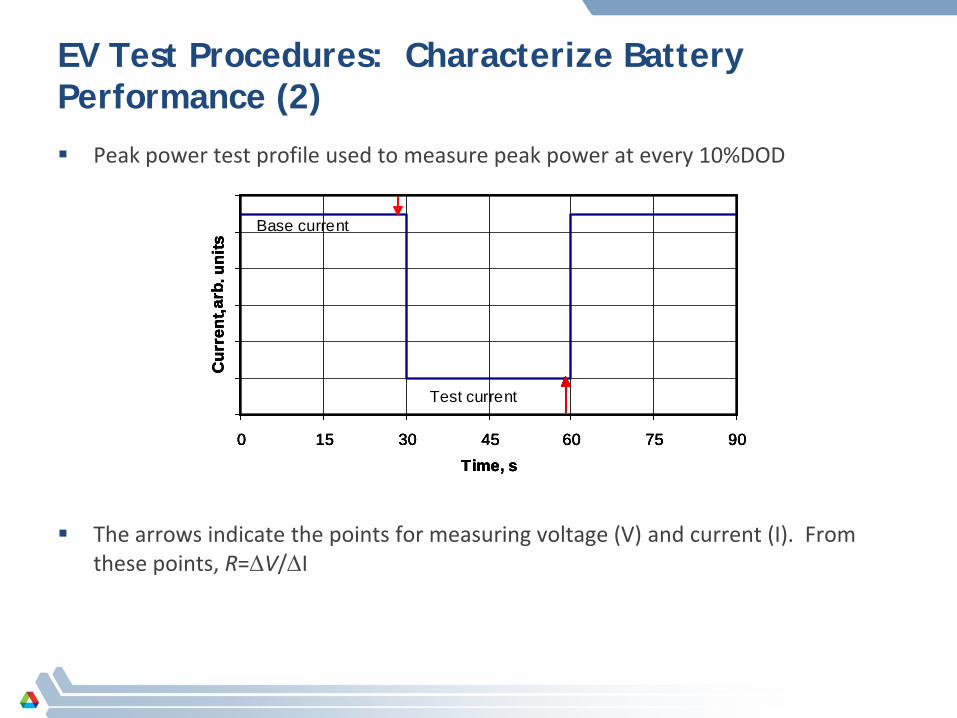
Peak power test profile used to measure peak power at every 10%DOD
The arrows indicate the points for measuring voltage (V) and current (I). From these points, R=∆V/∆I
0 15 30 45 60 75 90Time, s
Cur
rent
, arb
. uni
tsBase current
Test current
0 15 30 45 60 75 90Time, s
Cur
rent
, arb
. uni
tsBase current
Test current
0 15 30 45 60 75 90Time, s
Cur
rent
, arb
. uni
tsBase current
Test current
0 15 30 45 60 75 90Time, s
Cur
rent
, arb
. uni
tsBase current
Test current

EV Test Procedures: Characterize Battery Performance (3)
Using the results from the peak-power test, the power capability at each %DOD is calculated using Equations (1), (2) and (3)
where Pn is peak power at n% DOD, ViR-free is the iR-corrected voltage at a given %DOD, R is resistance, Vlim is the limiting discharge voltage and Imax is the maximum current for the battery
Report the minimum power value calculated
( )
( )
( )3),(
2
192
maxmax
limlim
2
IRVIPR
VVVP
RV
P
freeIRn
freeIRn
freeIRn
×+−=
−−=
−=
−
−
−
EV Test Procedures: Two Life/Aging Tests
There are two life/aging tests, calendar life and cycle life
Calendar life: This test is similar to a storage test and can be performed at many different %DOD and temperatures. Typically, it is performed at low %DOD and in the temperature range of 25 to 60oC. RPTs are performed every 28 days at 25oC
Cycle life: This test uses the DST profile, scaled for the power characteristics and repeated many times, to discharge the battery from 0 to 80% DOD, followed by recharging it according to the developers recommendations. Increasing the temperature at which the battery is cycled will further increase the rate of performance decline. RPTs are conducted every 50 cycles at 25oC
RPTs consist of C/3 constant-current capacity, DST-discharge capacity and the peak power test

EV Test Procedures: Calculated Results
0
0.002
0.004
0.006
0.008
0.01
0.012
0 200 400 600 800 1000 1200
Cycle count
Resi
stan
ce, o
hms
2
2.7
3.4
4.1
Cell
OCV
, V
Vir-f ree
Resistance
0
500
1000
1500
2000
2500
0 200 400 600 800 1000 1200
Cycle count
Pow
er, W
/kg
Imax
Vlim2/9Vir-f ree
2/R
EOL
21
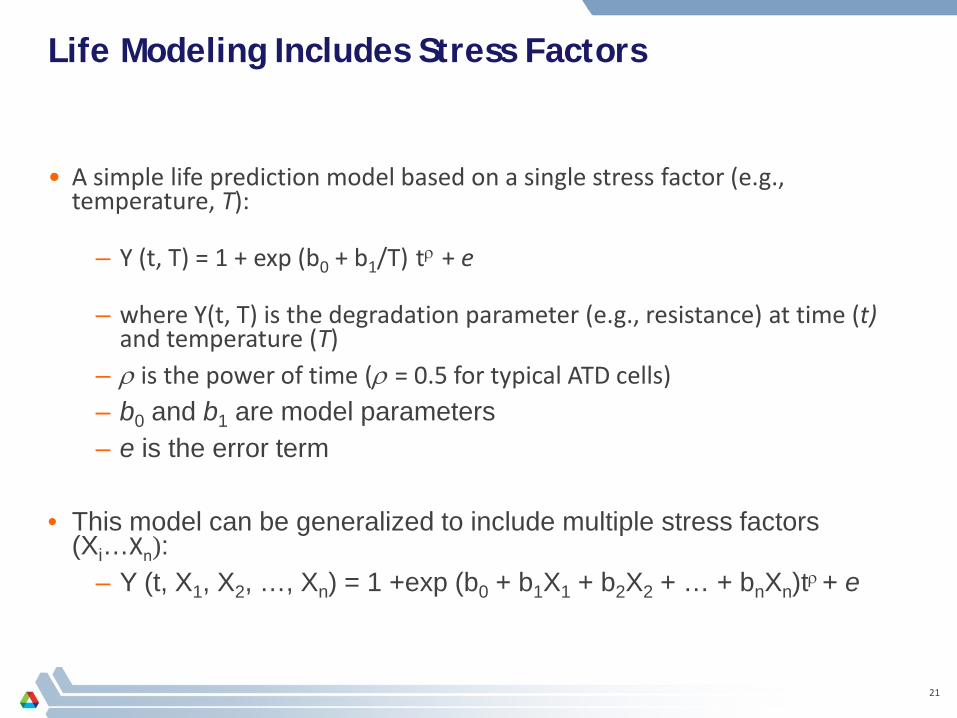
Life Modeling Includes Stress Factors
• A simple life prediction model based on a single stress factor (e.g., temperature, T):
– Y (t, T) = 1 + exp (b0 + b1/T) tρ + e
– where Y(t, T) is the degradation parameter (e.g., resistance) at time (t)and temperature (T)
– ρ is the power of time (ρ = 0.5 for typical ATD cells)– b0 and b1 are model parameters– e is the error term
• This model can be generalized to include multiple stress factors (Xi…Xn):
– Y (t, X1, X2, …, Xn) = 1 +exp (b0 + b1X1 + b2X2 + … + bnXn)tρ + e

22
Error Modeling
The error model should include a combination of cell-to-cell effects (δ) and measurement error (ε):
– e = Var (Y(i, t)) = σδ2 (Ypop(i,t)-1)2 + 2 σε
2
– where Var(Y(i,t)) is the variance of Y at time t for the ith experimental condition defined by the combined levels of the stress factors
– σδ2 is the variance of the cell-to-cell effects
– σε2 is the measurement error variance
– Ypop (i, t) is the value of Y at (i,t) predicted by the life model

23
Apply Methodology to Cell Test Data*
A model was applied to a set of cells that were calendar-life aged at various temperatures (an isothermal experiment)
The 30°C data were not used to construct the model
(K) re temperatu(years) time
1ˆˆexp1ˆ 5.010
==
⋅
⋅++=
Tt
tT
Y ββ
6236ˆ11.18ˆ
1
0
−=
=
β
β
0 0.2 0.4 0.61
1.05
1.1
1.15
1.2
1.25
1.3
1.35
Time (years)
Rel
ativ
e R
esis
tanc
e
304047.555
* E.V. Thomas, I. Bloom, J.P. Christophersen, V.S. Battaglia, J. Power Sources, 184 (2008) 312–317
24
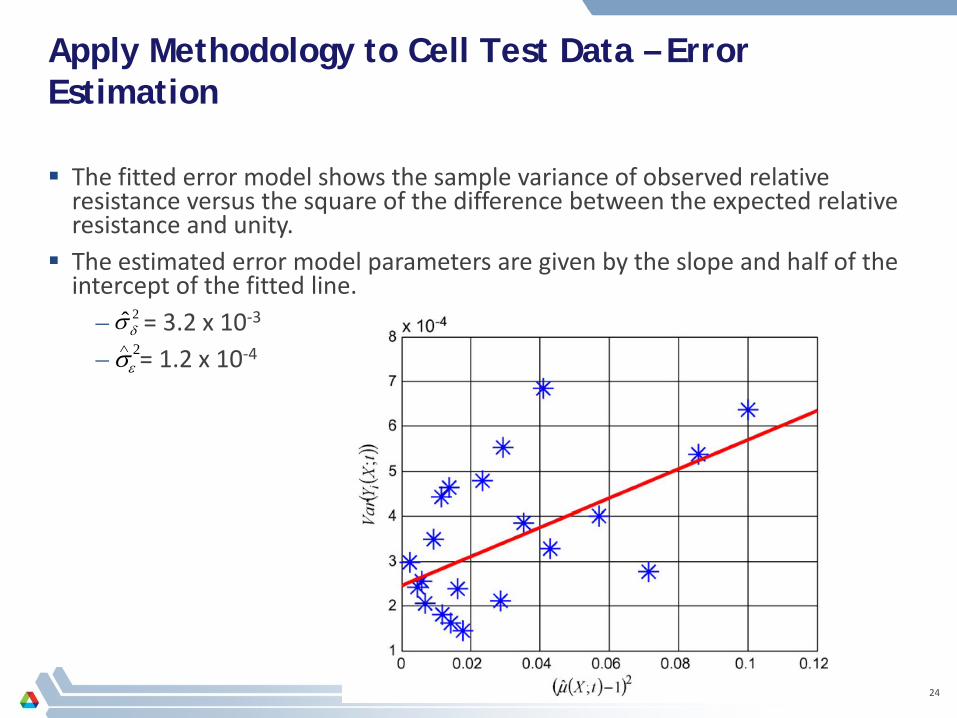
Apply Methodology to Cell Test Data – Error Estimation
The fitted error model shows the sample variance of observed relative resistance versus the square of the difference between the expected relative resistance and unity.
The estimated error model parameters are given by the slope and half of the intercept of the fitted line.
– = 3.2 x 10⁻³
– = 1.2 x 10⁻⁴
2ˆδσ2
εσ∧

25
Estimate Battery Life Within a Confidence Interval
Use results of curve fitting and error estimation in Monte Carlo simulations (a probabilistic approach)
Life estimation was completed with 1000 Monte Carlo simulations The estimated life for these cells is in the range of 7.6 and 13.8 years
– Estimated life does not meet USABC Goal of 15 years

Summary
Pre-competitive battery testing in the US is application-based and, thus, has many targets and procedures
The test procedures can be used on any size cell, module or battery and on battery technologies at different levels of maturity
The results of testing provide a guide to actual battery performance in the vehicle
A statistically-valid modeling methodology has been illustrated
AcknowledgmentThis work was performed under the auspices of the US Department of Energy, Office of Vehicle Technologies, Hybrid and Electric Systems, under Contract No. DE-AC02-06CH11357.