baudot, a., haller, m., mrschtik, m., tait, s., and ryan...
TRANSCRIPT

Baudot, A., Haller, M., Mrschtik, M., Tait, S., and Ryan, K. (2015) Using enhanced-mitophagy to measure autophagic flux. Methods, 75, pp. 105-111. Copyright © 2014 The Authors. This work is made available under the Creative Commons Attribution 3.0 Unported License (CC BY 3.0).
Version: Published
http://eprints.gla.ac.uk/105480/ Deposited on: 27 April 2015. Enlighten – Research publications by members of the University of Glasgow http://eprints.gla.ac.uk

Methods 75 (2015) 105–111
Contents lists available at ScienceDirect
Methods
journal homepage: www.elsevier .com/locate /ymeth
Using enhanced-mitophagy to measure autophagic flux
http://dx.doi.org/10.1016/j.ymeth.2014.11.0141046-2023/� 2014 The Authors. Published by Elsevier Inc.This is an open access article under the CC BY license (http://creativecommons.org/licenses/by/3.0/).
⇑ Corresponding authors at: Cancer Research UK Beatson Institute, GarscubeEstate, Switchback Rd, Glasgow G61 1BD, UK. Fax: +44 1419426521.
E-mail addresses: [email protected] (S.W.G. Tait), [email protected] (K.M. Ryan).
1 These two authors contributed equally to this work.
Alice D. Baudot a,1, Martina Haller a,b,1, Michaela Mrschtik a,b, Stephen W.G. Tait a,b,⇑, Kevin M. Ryan a,b,⇑a Cancer Research UK Beatson Institute, Garscube Estate, Switchback Rd, Glasgow G61 1BD, UKb Institute of Cancer Sciences, University of Glasgow, Garscube Estate, Switchback Rd, Glasgow G61 1BD, UK
a r t i c l e i n f o a b s t r a c t
Article history:Received 3 September 2014Received in revised form 18 November 2014Accepted 21 November 2014Available online 9 December 2014
Keywords:MacroautophagyAutophagic fluxMitophagyParkin
Macroautophagy (hereafter termed autophagy) is a cellular membrane-trafficking process that functionsto deliver cytoplasmic constituents to lysosomes for degradation. Autophagy operates at basal levels toturn over damaged and misfolded proteins and it is the only process for the turnover of organelles.The process is therefore critically important for the preservation of cellular integrity and viability.Autophagy is also highly adaptable and the rate and cargoes of autophagy can be altered to bring aboutdesired cellular responses to intracellular and environmental cues, disease states and a spectrum ofpharmaceutical drugs. As a result, there is much interest in understanding the dynamics of autophagyin a variety of situations. To date, the majority of assays to monitor autophagy either measure changesin a parameter of the process at a set point in time or use markers/tracers to monitor flow ofmembrane-bound proteins from one point in the process to another. As such, these assays do notmeasure changes in endogenous cargo degradation which is the ultimate end-point of the autophagy pro-cess. We describe here an assay to measure autophagic cargo degradation by engineering cells to degrademitochondria en masse. We show that this ‘enhanced-mitophagy’ assay can be used to measuredifferences in the rate of autophagy between different cells or in response to agents which are knownto promote or inhibit autophagic flux. We consider therefore that this assay will prove to be a valuableresource for investigations in which autophagy is considered important and is believed to be modulated.
� 2014 The Authors. Published by Elsevier Inc. This is an open access article under the CC BY license(http://creativecommons.org/licenses/by/3.0/).
1. Introduction
Autophagy which literally means self-eating (auto – self; phagy– eating) is a group of cellular processes that deliver cytoplasmiccargoes to lysosomes for subsequent degradation. Three forms ofautophagy have been described – macroautophagy, microauto-phagy and chaperone-mediated autophagy – which are individu-ally characterized by the mechanism through which lysosomaldelivery occurs [1]. Macroautophagy is the most extensively stud-ied of these processes and for simplicity we will refer to it hereafteras autophagy.
Autophagy is initiated upon the formation of a structure calledthe isolation membrane which has been shown to originate frommultiple locations within the cell [2–5]. Two ubiquitin-like mech-anisms are then engaged to grow the membrane into a double-membraned ball termed an autophagosome, which is the charac-teristic organelle of this specific process. Upon autophagosome
formation, two specific events must occur that are critical for cargorecruitment [6]. Firstly, as the membrane grows, it must incorpo-rate a lipidated form of microtubule-associated protein light chain3 (LC3). In cells with basal autophagy, the majority of LC3 exists asan un-lipidated soluble form termed LC3-I in the cytoplasm. Uponpromotion of autophagy a greater proportion of LC3 becomesconjugated to phosphatidylethanolamine to form a version of theprotein called LC3-II which integrates into the autophagosomemembrane via the lipid moiety [7]. LC3-II serves both as astructural component of the autophagosome membrane as wellas a critical factor involved in accrual of cargo.
The second important factor for cargo recruitment is theengagement of adaptor proteins. This group of proteins whichincludes p62/SQSTM1, NBR1, OPTN and BNIP3L (Nix) act as bridgesbetween LC3 on the autophagosome membrane and cargoesmarked for autophagic degradation [8]. The utilization of adapterproteins enables selectivity in autophagy. Various forms of selec-tive autophagy have been described including pexophagy – theselective removal of peroxisomes and mitophagy – the selectiveremoval of mitochondria.
Following autophagosome formation and cargo recruitment,membrane fusions can then occur between autophagosomes and

106 A.D. Baudot et al. / Methods 75 (2015) 105–111
endosomes/multivesicular bodies, but ultimately fusion occurswith a lysosome resulting in the formation of a new organelle,the autolysosome. In this organelle, the acidic hydrolases providedby the lysosome break down the cargo of the autophagosome intoconstituent parts which are then transferred into the cytoplasmwhere they are either catabolized further or recycled intobiosynthetic pathways [1].
The study of autophagy has in recent years received consider-able attention due to its involvement and/or perturbation invarious forms of human disease [1]. In addition, because thedynamics of autophagy can be easily regulated, there is also a lotof interest in manipulating autophagy for therapeutic gain. Forexample, studies have shown that the promotion of autophagycan facilitate clearance of the aggregated proteins associated withneurodegenerative diseases such as Huntington’s and Parkinson’sdisease [9]. Conversely, several studies have indicated that certaintumours can be dependent on autophagy indicating that autoph-agy inhibitors may be useful agents for cancer chemotherapy[10–12].
In order to understand and have the ability to manipulateautophagy in any given context, it is critical to be able to determinethe rate of autophagic flux in normal versus diseased cells andbefore and after drug treatments. To date, the majority of studieson autophagy utilize Western blotting to measure LC3-II levels orimmunofluorescence (IF) to detect the balance of LC3-I (diffusestaining) versus LC3-II (punctate staining indicative of autophago-somes). While this gives a measure of the number of autophago-somes within either individual cells (IF) or a cell population(Western blotting), making assessments regarding autophagic fluxby these means is problematic. This is due to the fact that auto-phagosomes represent a transient mid-point in the entire autoph-agy process. As a result, increased numbers of LC3-positive punctaand/or increased LC3-II levels can represent an increase in auto-phagosome formation, but this can conversely also represent ablockage or impairment in autophagosome turnover followingautophagosome formation [13]. Because of this limitation, a num-ber of other assays have been developed to monitor flux betweenautophagosomes and lysosomes by monitoring for example, thetraffic of fluorescent-tagged versions of LC3 which give different
Fig. 1. Parkin overexpression promotes mitophagy upon mitochondrial depolarizationmitochondria. After overexpression of exogenous YFP-Parkin and treatment with antimmitochondria en masse.
fluorescent signals at neutral pH (i.e., while in the autophagosome)versus the more acidic pH in the lysosome [14]. These assays yielda considerable amount of information when compared to analysisof steady-state levels of LC3. However, they are still limited in thatthey do not measure cargo digestion which is the ultimateendpoint of the autophagy process.
The ability to monitor cargo degradation during autophagy hasbeen hampered by the current paucity of known specific cargos. Asa surrogate, analysis of the degradation of adapter proteins such asp62/SQSTM1 is useful in some situations, but not in others, forinstance in cases where p62/SQSTM1 is not utilized as an adaptorprotein. In addition, the levels of p62/SQSTM1 have been shown tobe modulated at the transcriptional level in response to changes inp62/SQSTM1 protein levels [15–17] – an event which clearly con-founds to the ability to monitor loss of p62/SQSTM1 degradationby autophagy. Bearing in mind the issues regarding many currentautophagy assays, we describe here the development of an assayto monitor the autophagic degradation of mitochondria whichcan be used to determine differences in the rate of autophagiccargo digestion between different cells or in response to externalstimuli.
2. Materials and methods
2.1. Cell culture and treatments
All cell lines were cultured in DMEM (Gibco) containing 10%FBS, 4.5 g l�1 glucose, 1 mM L-glutamine, 0.11 g l�1 pyruvate andmaintained at 37 �C in 5% CO2 atmosphere. For mitochondriadepletion, cells were treated with 1 lM antimycin A (SigmaA8674) and 1 lM oligomycin (Sigma O4876) every 12 h for theindicated time periods as previously described [18]. We recom-mend that a titration of these drugs is undertaken in different cellsystems in order to determine the most effective concentration tocause mitochondrial damage and depletion in any given system.
In order to activate autophagy, cells were treated with 100 nMrapamycin (LCL laboratories R-5000) or 150 lM of deferoxaminemesylate (DFO) for 2 h prior treatment with oligomycin andantimycin A. For the inhibition of the autophagic flux cells were
. In normal conditions the ser/thr kinase PINK1 is constitutively localized at theycin A and oligomycin, mitochondrial proteins are depleted due to elimination of
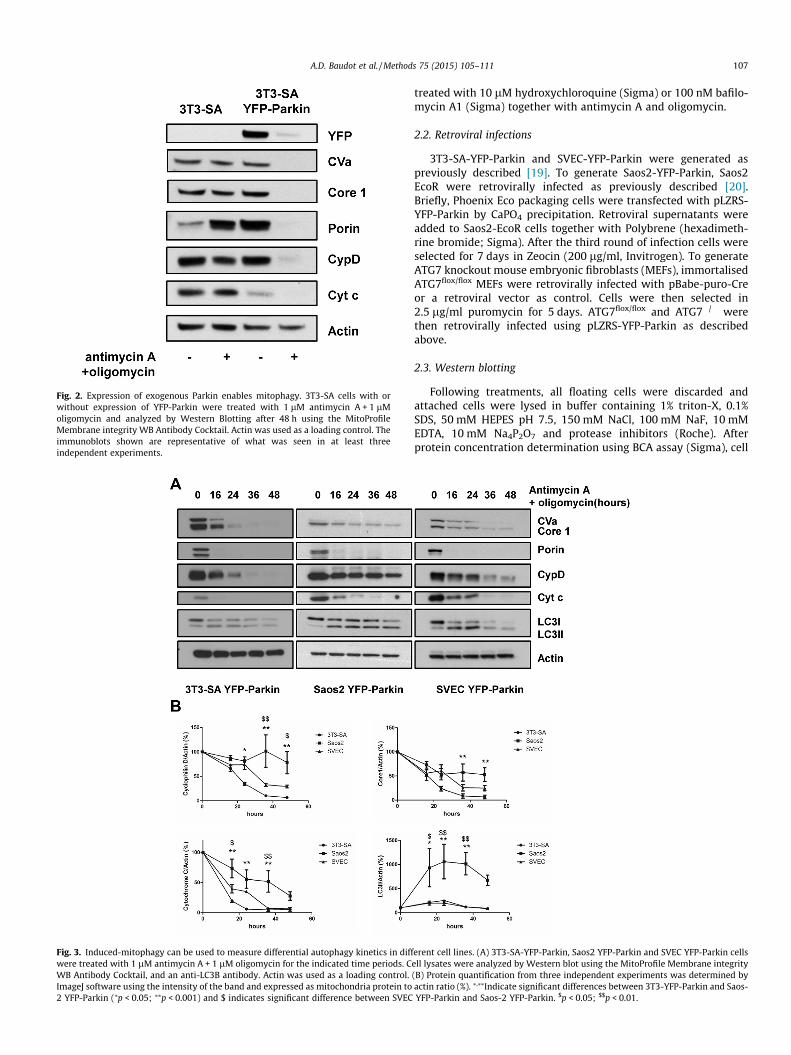
Fig. 2. Expression of exogenous Parkin enables mitophagy. 3T3-SA cells with orwithout expression of YFP-Parkin were treated with 1 lM antimycin A + 1 lMoligomycin and analyzed by Western Blotting after 48 h using the MitoProfileMembrane integrity WB Antibody Cocktail. Actin was used as a loading control. Theimmunoblots shown are representative of what was seen in at least threeindependent experiments.
Fig. 3. Induced-mitophagy can be used to measure differential autophagy kinetics in diffwere treated with 1 lM antimycin A + 1 lM oligomycin for the indicated time periods. CWB Antibody Cocktail, and an anti-LC3B antibody. Actin was used as a loading control.ImageJ software using the intensity of the band and expressed as mitochondria protein to2 YFP-Parkin (⁄p < 0.05; ⁄⁄p < 0.001) and $ indicates significant difference between SVEC
A.D. Baudot et al. / Methods 75 (2015) 105–111 107
treated with 10 lM hydroxychloroquine (Sigma) or 100 nM bafilo-mycin A1 (Sigma) together with antimycin A and oligomycin.
2.2. Retroviral infections
3T3-SA-YFP-Parkin and SVEC-YFP-Parkin were generated aspreviously described [19]. To generate Saos2-YFP-Parkin, Saos2EcoR were retrovirally infected as previously described [20].Briefly, Phoenix Eco packaging cells were transfected with pLZRS-YFP-Parkin by CaPO4 precipitation. Retroviral supernatants wereadded to Saos2-EcoR cells together with Polybrene (hexadimeth-rine bromide; Sigma). After the third round of infection cells wereselected for 7 days in Zeocin (200 lg/ml, Invitrogen). To generateATG7 knockout mouse embryonic fibroblasts (MEFs), immortalisedATG7flox/flox MEFs were retrovirally infected with pBabe-puro-Creor a retroviral vector as control. Cells were then selected in2.5 lg/ml puromycin for 5 days. ATG7flox/flox and ATG7�/� werethen retrovirally infected using pLZRS-YFP-Parkin as describedabove.
2.3. Western blotting
Following treatments, all floating cells were discarded andattached cells were lysed in buffer containing 1% triton-X, 0.1%SDS, 50 mM HEPES pH 7.5, 150 mM NaCl, 100 mM NaF, 10 mMEDTA, 10 mM Na4P2O7 and protease inhibitors (Roche). Afterprotein concentration determination using BCA assay (Sigma), cell
erent cell lines. (A) 3T3-SA-YFP-Parkin, Saos2 YFP-Parkin and SVEC YFP-Parkin cellsell lysates were analyzed by Western blot using the MitoProfile Membrane integrity(B) Protein quantification from three independent experiments was determined byactin ratio (%). ⁄,⁄⁄Indicate significant differences between 3T3-YFP-Parkin and Saos-YFP-Parkin and Saos-2 YFP-Parkin. $p < 0.05; $$p < 0.01.
108 A.D. Baudot et al. / Methods 75 (2015) 105–111
lysates were separated by SDS–PAGE and transferred onto Immobi-lon�-P membranes (Millipore). Membranes were probed withMitoProfile�Membrane Integrity WB Antibody cocktail (Abcamab110414), anti-LC3B (Cell Signaling Technology 2775) and antib-actin (Abcam ab8227) antibodies.
2.4. Statistical analysis
For time course studies, data were analyzed using a general lin-ear model repeated ANOVA.
3. Theory
Parkin-dependent mitophagy involves PTEN-induced putativekinase 1 (PINK1) and a ubiquitin ligase complex containing Parkin(Fig. 1). Studies have shown that the ectopic expression of Parkin incells followed by treatment with agents that perturb mitochondrialfunction results in the complete removal of mitochondria overtime [21,19]. We reasoned that by providing the cell with an excessendogenous cargo (damaged mitochondria), then the rate of loss of
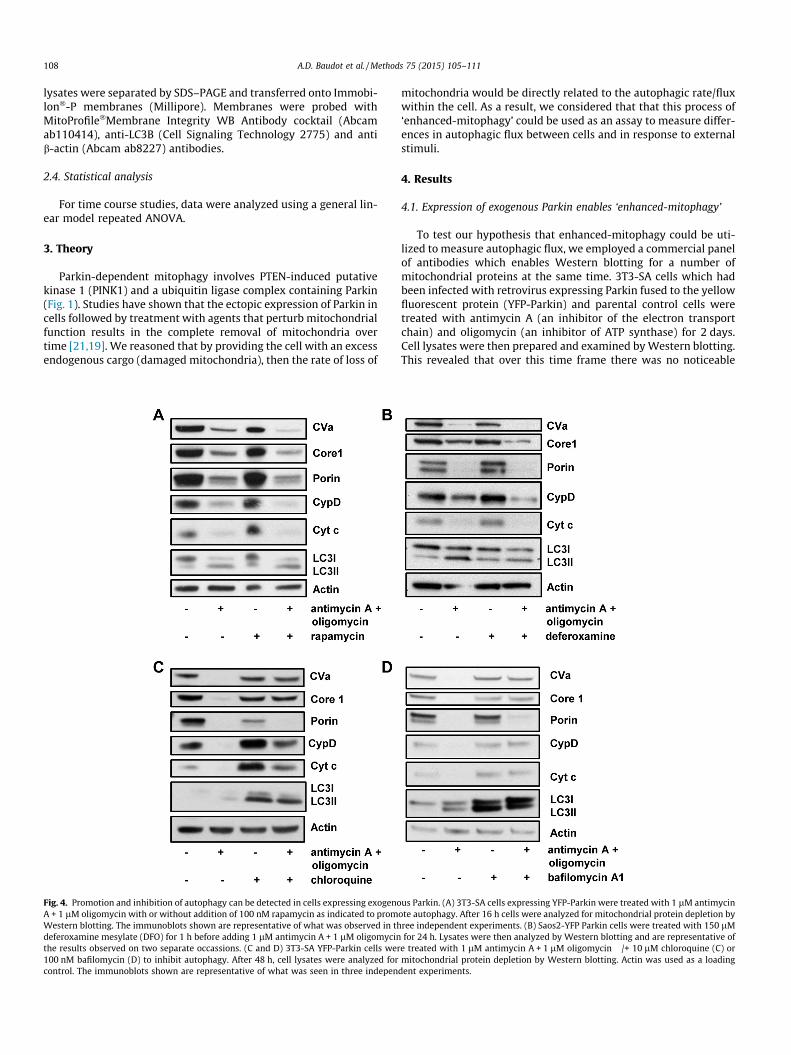
Fig. 4. Promotion and inhibition of autophagy can be detected in cells expressing exogenoA + 1 lM oligomycin with or without addition of 100 nM rapamycin as indicated to promWestern blotting. The immunoblots shown are representative of what was observed in thdeferoxamine mesylate (DFO) for 1 h before adding 1 lM antimycin A + 1 lM oligomycinthe results observed on two separate occassions. (C and D) 3T3-SA YFP-Parkin cells wer100 nM bafilomycin (D) to inhibit autophagy. After 48 h, cell lysates were analyzed forcontrol. The immunoblots shown are representative of what was seen in three indepen
mitochondria would be directly related to the autophagic rate/fluxwithin the cell. As a result, we considered that that this process of‘enhanced-mitophagy’ could be used as an assay to measure differ-ences in autophagic flux between cells and in response to externalstimuli.
4. Results
4.1. Expression of exogenous Parkin enables ‘enhanced-mitophagy’
To test our hypothesis that enhanced-mitophagy could be uti-lized to measure autophagic flux, we employed a commercial panelof antibodies which enables Western blotting for a number ofmitochondrial proteins at the same time. 3T3-SA cells which hadbeen infected with retrovirus expressing Parkin fused to the yellowfluorescent protein (YFP-Parkin) and parental control cells weretreated with antimycin A (an inhibitor of the electron transportchain) and oligomycin (an inhibitor of ATP synthase) for 2 days.Cell lysates were then prepared and examined by Western blotting.This revealed that over this time frame there was no noticeable
us Parkin. (A) 3T3-SA cells expressing YFP-Parkin were treated with 1 lM antimycinote autophagy. After 16 h cells were analyzed for mitochondrial protein depletion byree independent experiments. (B) Saos2-YFP Parkin cells were treated with 150 lMfor 24 h. Lysates were then analyzed by Western blotting and are representative of
e treated with 1 lM antimycin A + 1 lM oligomycin �/+ 10 lM chloroquine (C) ormitochondrial protein depletion by Western blotting. Actin was used as a loading
dent experiments.

Fig. 5. Enhanced-mitophagy can detect genetic loss of autophagy. ATG7flox/flox MEFsexpressing YFP-Parkin together with either a retrovirus expressing Cre recombinaseor control virus were treated with 1 lM antimycin A + 1 lM oligomycin for 24 h.Lysates were analyzed by Western blotting was undertaken using the MitoProfileMembrane integrity WB Antibody Cocktail, an anti-LC3B antibody and an anti-actinantibody as a loading control. The immunoblots shown are representative of whatwas seen in three independent experiments.
A.D. Baudot et al. / Methods 75 (2015) 105–111 109
depletion of mitochondrial proteins in control cells whereas allmitochondrial proteins were dramatically depleted in cellsexpressing exogenous YFP-Parkin (Fig. 2).
4.2. Enhanced-mitophagy can be used to reveal differences inautophagic flux between cells
Since autophagy is the only cellular mechanism for mitochon-drial removal, we were interested to know if enhanced-mitophagycould be used to reveal differences in autophagic flux betweencells. Saos-2 osteosarcoma cells and SVEC endothelial cells weretherefore infected with YFP-Parkin to enable mass elimination ofmitochondria by autophagy and the depletion of mitochondrialproteins was measured in these and YFP-Parkin-expressing 3T3-SA cells following treatment with antimycin A and oligomycin. Thisrevealed that not only were there significant differences in the rateof loss of mitochondrial proteins between different cell lines, butthere were also differences in the rate of depletion of differentmitochondrial proteins in each individual cell line Fig. 3A and B).Notably, cytochrome c and Porin (also known as VDAC1) aredepleted very rapidly in SVEC and 3T3-SA after treatment withantimycin A and oligomycin (Fig. 3A and B). As a result, we didnot consider them useful in determining differential rates ofautophagy in these cells over this time frame.
By contrast to the rapid loss of cytochrome c and Porin, deple-tion of Complex Va (CVa), Complex III Core 1 (Core 1) and cyclophi-lin D occurred at a progressive rate following treatment withantimycin A and oligomycin that was differential between thethree cell lines analyzed (Fig. 3A). Quantification of the rate of lossof Core 1 and cyclophilin D revealed that depletion was signifi-cantly more rapid in 3T3-SA and SVEC when compared to Saos-2(Fig. 3B). This indicates a quicker loss of mitochondria in 3T3-SAand SVEC which we consider is due to differences in the autophagicrate between these cells and Saos-2. To address this point further,we also analyzed the relative accumulation of the classical autoph-agy markers LC3-II and p62 in the three cell lines following treat-ment with the autophagy inhibitor, chloroquine. This revealed thatthe accumulation of LC3-II and p62 was much slower in Saos-2cells when compared with 3T3-SA and SVEC indicating that Saos-2 have a lower autophagic rate (Supplementary Fig. 1A and B).Since this result is completely in line with what we observed usingenhanced-mitophagy, we conclude that by providing a large poolof endogenous substrate our assay measures differences in thegeneral autophagic flux/capacity of the cell and does not simplyreveal differences in mitophagy.
4.3. Enhanced-mitophagy can detect changes in autophagic fluxcaused by external stimuli or genetic loss of an essential autophagygene
To determine if loss of CVa, Core 1 and cyclophilin D followingtreatment with antimycin A and oligomycin was occurring byautophagy, we sought to determine if the loss of these proteinscould be affected by agents that are known to affect autophagicflux. To this end, we firstly treated cells with rapamycin which isa well characterized inhibitor of mTOR Complex 1 and a potentinducer of autophagy (Supplementary Fig. 2A and B) [22] and withdeferoxamine mesylate (DFO), a hypoxia mimetic and previouslydescribed inducer of autophagy [23]. Treatment with these drugsalone had little impact on the levels of mitochondrial proteins.However, in cells treated with rapamycin or DFO together withantimycin A and oligomycin there was a marked depletion of mito-chondrial proteins that was greater than that observed in cellstreated with antimycin A and oligomycin alone (Fig. 4A and B).The difference in loss of CVa, Core 1 and cyclophilin D caused bytreatment was particularly clear, underscoring the usability of
these proteins as markers of autophagic flux in these cells. A smalldifference was also seen for Porin in response to rapamycin, how-ever, no change in cytochrome c levels was evident with eitherdrug, ruling out its applicability in this assay.
We next assessed if the loss of mitochondrial proteins followingtreatment with antimycin A and oligomycin was affected by inhi-bition of autophagy. To do this we treated cells with the lysosomo-tropic agents hydroxychloroquine (Cq) or bafilomycin A1 (Baf A1)which raise the pH of the lysosome, thereby restricting the turn-over stage of autophagy. As evidence of the effectiveness of thesetreatments, an accumulation of LC3-II was observed upon treat-ment with either drug (Fig. 4C and D). Treatment with Cq or BafA1 also raised the levels of cytochrome c and reduced the levelsof Porin (Fig. 4C and D). By contrast, the levels of CVa, Core 1 andcyclophilin D were largely unaffected (Fig. 4C and D).
The effect of Cq and Baf A1 on the loss of mitochondrial proteinsupon exposure to antimycin A and oligomycin was also assessed.This revealed that the loss of CVa, Core 1 and cyclophilin D causedby antimycin A and oligomycin could be reversed by treatmentwith Cq and Baf A1 (Fig. 4C, D and Supplementary Fig. 3A, B). A sta-tistically significant restoration of CVa, Core 1 and cyclophilin D lev-els was observed in response Cq (Fig. 4C and Supplementary Fig. 3A)and a statistically significant restoration of CVa and Core 1 wasachieved by treatment with Baf A1 (Fig. 4D and SupplementaryFig. 3B). These data therefore confirm that CVa, Core 1 and cyclophi-lin D are indeed lost by autophagy upon treatment with antimycinA and oligomycin and that they can be used as reliable readouts ofautophaghic flux in this method of enhanced-mitophagy.
We lastly decided to test if enhanced-mitophagy can detectgenetic loss of autophagy. To do this we isolated fibroblasts fromE13.5 mouse embryos which were homozygous for a floxed alleleof the essential autophagy gene Atg7. Following isolation andimmortalization, this floxed allele was recombined in vitro byinfection with a retrovirus expressing Cre recombinase, with an
110 A.D. Baudot et al. / Methods 75 (2015) 105–111
‘empty’ retroviral vector being used as control (Fig. 5). Subsequentinfection of these cells with YFP-Parkin resulted in virtually com-plete ablation of CVA, Core 1, Porin, cyclophilin D and cytochromec when control cells were treated with antimycin A and oligomycin(Fig. 5). By contrast, in YFP-Parkin-expressing Atg7-null cells whileloss of Porin and cytochrome c occurs in a similar manner to whatwas observed in control cells, the depletion of CVa, Core 1 andcyclophilin D was markedly impaired due to loss of autophagy(Fig. 5). We therefore conclude that enhanced-mitophagy can beused to detect genetic loss of autophagy and that CVa, Core 1and cyclophilin D are once again the reliable mitochondrialproteins to monitor when using this assay.
5. Concluding remarks
We describe here a method to analyze autophagic flux based ona system we have termed ‘enhanced-mitophagy’. We show thatusing this system we can detect differences in autophagic fluxbetween different cell lines, in response to external stimuli andupon genetic loss of an essential autophagy gene. We believe thisassay to be a true measure of the autophagic capacity of cells todegrade an endogenous cargo. As such, we consider it is muchmore informative than many current assays to measure autophagy.In this regard, it is notable that the changes we observed in theautophagic degradation of mitochondrial proteins is in line withwhat could be inferred regarding flux rates from LC3 and p62Westerns in these cells. However, the analysis of LC3 by Westernblotting alone cannot be extrapolated to make definitive state-ments regarding cargo digestion and p62 analysis is known to behampered in some systems by changes in the expression as wellas the degradation of the protein [15–17]. As a result, since analysisof LC3 and p62 has limitations, we believe that the enhanced-mito-phagy assay has great value in complementing analysis of theseproteins as markers of successful autophagy. It should be noted,however, that while we consider that enhanced-mitophagy canbe used to assay the general autophagic flux/capacity of the celland not just mitophagy, it cannot be used as a measure of the deg-radation rate of all potential autophagic cargoes. While it can beassumed that all cargoes are affected by the general autophagicflux/capacity of the cell, their degradation will for example, alsobe dependent on specific cues, protein modifications and the avail-ability of sufficient amounts of any required adaptor proteins.
Perhaps one surprising outcome from this study was the reali-zation that the depletion of different mitochondrial proteins wasnot equivalent upon treatment with antimycin A and oligomycin.We found that CVa, Core 1 and cyclophilin D were progressivelydepleted in a way that could reveal differences in autophagic ratebetween cells and that the levels of these proteins behaved asexpected when autophagy was either promoted or inhibited. Wetherefore consider these proteins to be reliable readouts of auto-phagic flux when using this enhanced-mitophagy assay in thesecells. By contrast, the levels of Porin and cytochrome c underwentchanges following treatment with antimycin A and oligomycin thatcannot be explained solely by changes in autophagic flux. Forexample, Porin levels decreased upon treatment with Cq and cyto-chrome c levels increased in this context without an equivalentincrease in other mitochondrial proteins such as CVa and Core 1.It is easy to rationalize that cytochrome c may be affected in amanner independent of the absolute levels of mitochondria sincefor example, it is well established that cytochrome c can bereleased from mitochondria in response to certain apoptotic stim-uli [24]. Changes in Porin levels, are though less easy to explainsince it is an integral membrane protein in the outer mitochondrialmembrane. It has, however, previously been shown that Tom20 –another mitochondrial outer membrane protein – is ubiquitylated
by Parkin and turned over in the proteasome [25]. Since Porin isalso directly ubiquitylated by Parkin it may also be possible thatit is targeted for degradation in a manner independent of mito-phagy [26]. This is undoubtedly worthy of further investigationin future studies. For the purposes of this study, however, fromwhat we have observed we do not consider Porin and cytochromec to be reliable markers of autophagic flux in the cells analyzed. Asa result, we would advocate caution in the analysis of these pro-teins when using this enhanced-mitophagy assay in other systems.We would also like to make clear why we used antimycin A andoligomycin in our study and not the more conventional mitochon-drial uncoupler carbonyl cyanide m-chlorophenylhydrazone(CCCP). This decision was made in light of previous studies whichhave shown that CCCP can interfere with the degradation of auto-phagic cargoes in the lysosome [27]. As a result, we do not recom-mend using CCCP in the enhanced-mitophagy assay.
Finally, while we conclude from this study that enhanced-mito-phagy is a reliable assay of autophagic flux in 3T3-SA, Saos-2 andSVEC cells, we would also argue that this assay would be broadlyapplicable in multiple situations. Using the retroviral constructthat we describe here, we believe that the assay could be utilizedin multiple cell culture systems. In addition, the production of aYFP-Parkin lentivirus should also permit application of this assayin non-dividing cells, for example in senescent cell cultures or inthe analysis of non-dividing tissue ex vivo. Moreover, through theutilization of different fluorescent tags (YFP or otherwise), it mayalso be possible to measure changes in autophagic flux in vivo,for example following drug treatment of animals carrying tumorxenografts which have been engineered to express a fluorescent-tagged Parkin and a fluorescent-tagged mitochondrial protein suchCVa or cyclophilin D. We hope therefore that the findings wedescribe in this study act as a starting point for future studiesdesigned to analyze autophagic flux in multiple experimental sys-tems and in a variety of situations in which autophagy is consid-ered important.
Acknowledgements
We are grateful to members of the Ryan and Tait labs for adviceand for critical reading of the manuscript. This work was supportedby the Cancer Research UK core grant to the Beatson Institute (KR)and BBSRC grant (BB/K008374/1) (S.T.). S.T. is a Royal SocietyUniversity Research Fellow.
Appendix A. Supplementary data
Supplementary data associated with this article can be found, inthe online version, at http://dx.doi.org/10.1016/j.ymeth.2014.11.014.
References
[1] N. Mizushima, B. Levine, A.M. Cuervo, D.J. Klionsky, Nature 451 (2008) 1069–1075.
[2] E.L. Axe, S.A. Walker, M. Manifava, P. Chandra, H.L. Roderick, A. Habermann, G.Griffiths, N.T. Ktistakis, J. Cell Biol. 182 (2008) 685–701.
[3] B. Ravikumar, K. Moreau, L. Jahreiss, C. Puri, D.C. Rubinsztein, Nat. Cell Biol. 12(2010) 747–757.
[4] D.W. Hailey, A.S. Rambold, P. Satpute-Krishnan, K. Mitra, R. Sougrat, P.K. Kim, J.Lippincott-Schwartz, Cell 141 (2010) 656–667.
[5] M. Hamasaki, N. Furuta, A. Matsuda, A. Nezu, A. Yamamoto, N. Fujita, H.Oomori, T. Noda, T. Haraguchi, Y. Hiraoka, A. Amano, T. Yoshimori, Nature 495(2013) 389–393.
[6] D.J. Klionsky, B.A. Schulman, Nat. Struct. Mol. Biol. 21 (2014) 336–345.[7] Y. Kabeya, N. Mizushima, T. Ueno, A. Yamamoto, T. Kirisako, T. Noda, E.
Kominami, Y. Ohsumi, T. Yoshimori, EMBO J. 19 (2000) 5720–5728.[8] A. Stolz, A. Ernst, I. Dikic, Nat. Cell Biol. 16 (2014) 495–501.[9] H. Harris, D.C. Rubinsztein, Nat. Rev. Neurol. 8 (2012) 108–117.

A.D. Baudot et al. / Methods 75 (2015) 105–111 111
[10] S. Yang, X. Wang, G. Contino, M. Liesa, E. Sahin, H. Ying, A. Bause, Y. Li, J.M.Stommel, G. Dell’antonio, J. Mautner, G. Tonon, M. Haigis, O.S. Shirihai, C.Doglioni, N. Bardeesy, A.C. Kimmelman, Genes Dev. 25 (2011) 717–729.
[11] G. Karsli-Uzunbas, J.Y. Guo, S. Price, X. Teng, S.V. Laddha, S. Khor, N.Y. Kalaany,T. Jacks, C.S. Chan, J.D. Rabinowitz, E. White, Cancer Discov. 4 (2014) 914–927.
[12] A. Yang, N.V. Rajeshkumar, X. Wang, S. Yabuuchi, B.M. Alexander, G.C. Chu,D.D. Von Hoff, A. Maitra, A.C. Kimmelman, Cancer Discov. 4 (2014) 905–913.
[13] N. Mizushima, T. Yoshimori, Autophagy 3 (2007) 542–545.[14] S. Kimura, T. Noda, T. Yoshimori, Autophagy 3 (2007) 452–460.[15] A. Jain, T. Lamark, E. Sjottem, K.B. Larsen, J.A. Awuh, A. Overvatn, M. McMahon,
J.D. Hayes, T. Johansen, J. Biol. Chem. 285 (2010) 22576–22591.[16] K. Nakaso, Y. Yoshimoto, T. Nakano, T. Takeshima, Y. Fukuhara, K. Yasui, S.
Araga, T. Yanagawa, T. Ishii, K. Nakashima, Brain Res. 1012 (2004) 42–51.[17] K. Fujita, D. Maeda, Q. Xiao, S.M. Srinivasula, Proc. Natl. Acad. Sci. U.S.A. 108
(2011) 1427–1432.[18] C. Vives-Bauza, C. Zhou, Y. Huang, M. Cui, R.L. de Vries, J. Kim, J. May, M.A.
Tocilescu, W. Liu, H.S. Ko, J. Magrane, D.J. Moore, V.L. Dawson, R. Grailhe, T.M.
Dawson, C. Li, K. Tieu, S. Przedborski, Proc. Natl. Acad. Sci. U.S.A. 107 (2010)378–383.
[19] S.W. Tait, A. Oberst, G. Quarato, S. Milasta, M. Haller, R. Wang, M. Karvela, G.Ichim, N. Yatim, M.L. Albert, G. Kidd, R. Wakefield, S. Frase, S. Krautwald, A.Linkermann, D.R. Green, Cell Rep. 5 (2013) 878–885.
[20] K.M. Ryan, J. O’Prey, K.H. Vousden, Cancer Res. 64 (2004) 4415–4418.[21] D. Narendra, A. Tanaka, D.F. Suen, R.J. Youle, J. Cell Biol. 183 (2008) 795–803.[22] A.J. Meijer, P. Codogno, Int. J. Biochem. Cell Biol. 36 (2004) 2445–2462.[23] I. De Domenico, D.M. Ward, J. Kaplan, Blood 114 (2009) 4546–4551.[24] S.W. Tait, D.R. Green, Nat. Rev. Mol. Cell Biol. 11 (2010) 621–632.[25] N.C. Chan, A.M. Salazar, A.H. Pham, M.J. Sweredoski, N.J. Kolawa, R.L. Graham,
S. Hess, D.C. Chan, Hum. Mol. Genet. 20 (2011) 1726–1737.[26] S. Geisler, K.M. Holmstrom, D. Skujat, F.C. Fiesel, O.C. Rothfuss, P.J. Kahle, W.
Springer, Nat. Cell Biol. 12 (2010) 119–131.[27] B.S. Padman, M. Bach, G. Lucarelli, M. Prescott, G. Ramm, Autophagy 9 (2013)
1862–1875.