bay area climate change education needs assessment...
TRANSCRIPT
PAGE 1 B A Y A R E A C L I M A T E C H A N G E E D U C A T I O N N E E D S A S S E S S M E N T
DECEMBER 2014
Bay Area Climate Change EducationNeeds Assessment Report

EXECUTIVE SUMMARYEnvironmental educators in the Bay Area are deeply interested in climate education and a vast majority support greater collabora-tion around this topic. This is one of the key findings from a regional needs assessment of environmental educators and their climate change programs conducted in 2014 by the Institute at the Golden Gate. The assessment aimed to capture the current landscape of climate change education in the Bay Area, as well as the main needs and challenges asso-ciated with climate programming. The find-ings—which highlight staff capacity issues and the value of educational models—will be used in the formation of a regional climate literacy collaborative that will enhance and foster climate change education and action in the Bay Area.
Respondents were primarily program devel-opers and implementers at a range of envi-ronmental and educational organizations. Interviews were conducted from late June until mid-September of 2014. A total of
78 individuals and 44 organizations partici-
pated in the needs assessment process.
The assessment showed that the main needs and challenges related to climate change education include:
■■ Internal capacity and time
■■ Models and curriculum for program delivery
■■ Support on designing for behavior change
■■ Relevant, accurate data
■■ Guidance on age appropriateness
■■ Evaluation models and support
In particular, staff capacity and time, as well as a lack of educational models and curricula, stood as the most widespread challenges, affecting more than 80% of respondents. In identifying potential solutions to these challenges, 84% supported greater regional collaboration.
This report discusses the findings in-depth and is designed to help inform the priorities, direction, and structure of future efforts to promote climate literacy within the region.
PAGE 2 B A Y A R E A C L I M A T E C H A N G E E D U C A T I O N N E E D S A S S E S S M E N T

PAGE 3 B A Y A R E A C L I M A T E C H A N G E E D U C A T I O N N E E D S A S S E S S M E N T
INTRODUCTIONOver the past year, members of the Institute at the Golden Gate team have met with a variety of informal environmental education organizations around the Bay Area to learn more about climate change education and related programming. In particular, the Institute explored how to enhance and foster climate literacy and action throughout the region.
We found that the Bay Area has a strong community of environmental educators with an articulated interest in expanding and elevating climate change programming. At the same time, we also found that organiza-tions vary greatly in how, when, and if they incorporate climate change into their exist-ing education programs. The level of activity ran the gamut—some organizations launched entire outreach initiatives based on climate change; others hold one docent-led hike per year or lecture on the topic; and others expressed an interest in climate change but currently do not integrate that content into programs.
Through these conversations, a number of common challenges and needs began to emerge. Many of the educators highlighted the need for sharing information and coordinating efforts between organizations. However, it was clear that a more thorough understanding of the field and the diverse needs was necessary in order to design a collaborative that would effectively build capacity around climate education in the region.
To better evaluate the current state of informal climate change education in the Bay Area, the Institute at the Golden Gate conducted a needs assessment of environmental education orga-nizations throughout the region. What follows is a discussion of the results of this assessment.
ASSESSMENT PROCESS
The needs assessment was conducted from late June until mid-September 2014 and targeted Bay Area-based, informal, environmental education organizations. A total of 78 individu-als from 44 different organizations participated.1 The assessment was conducted primarily through individual phone interviews lasting 45 minutes to an hour. Participants were asked two different tracks of questions depending on whether they were currently incorporating cli-mate change into their programming.2 Results have been aggregated and individual responses have been kept anonymous. A list of participating organizations and assessment questions can be found in the appendix.

PAGE 4 B A Y A R E A C L I M A T E C H A N G E E D U C A T I O N N E E D S A S S E S S M E N T
ASSESSMENT RESULTS
The following sections analyze the results of the needs assessment. The analysis focuses on the organizational landscape of climate education in the Bay Area, the common needs and challenges, and desired outcomes from a regional climate literacy collaborative.
Current Landscape
Participant DemographicsParticipants represented a range of perspectives, organizations, and geographic locations. This section outlines the types of organizations surveyed, organizational distribution by county, as well as the regional breakdown of those served through existing climate change education programs.
FIGURE ONE
Organization Type
0
Interviews included more than one staff member at some organizations. The total number of interviews by organization type was 43 non-profit compared to 35 public agency.3
5 10 15 20 25 30
Public Agency 15
Nonprofit
San Mateo
Contra Costa
Sonoma
Santa Clara
Alameda
Marin
San Francisco
29
FIGURE TWO
Organizational Distributionby County
34%
24%14%
12%
10%
4%2%
Organizations with staff in multiple locations were counted in all applicable counties. There were zero participating organizations with staff based in Napa and Solano counties.4
FIGURE THREE
What Bay Area Counties Do You Serve?
0 5 10 15 20 25 30 35 40
Alameda
Contra Costa
Solano
San Francisco
Marin
Napa
Sonoma
San Mateo
Santa Clara
34
32
27
39
32
28
31
32
33

PAGE 5 B A Y A R E A C L I M A T E C H A N G E E D U C A T I O N N E E D S A S S E S S M E N T
0 5 10 15 20 25 30 35 40
FIGURE FIVE
When Did You Begin Incorporating Climate Change?
7
8
11
0 3 6 9 12 15
FIGURE FOUR
How Are You Incorporating Climate Change?
21%
0 5 10 15 20 25 30
Consistent Program
Consistent Elements
Inconsistent Elements
Developing Program or Elements
Interested
Not Interested
29%
19%
10+ years ago
6–10 years ago
3–5 years ago
1–2 years ago
In development
14
14
FIGURE SEVEN
How Is Your Climate Programming Funded?
6
4
39General Operating Budget
Grants
Other
Private Donations
Program Fees
15
13
FIGURE SIX
What Grade Levels Do You Serve?
23
8
11
0 5 10 15 20 25
K-2
3-5
6-8
9-12
13-16
Adults
Teachers
General Public
Senior Citizens
20
22
19
12
16
4
The above categories were selected to reflect age delineations mentioned by many participants.6
This graph shows funding sources specifically for climate education programs.7
FIGURE EIGHT
Have You Received Funding Specifically for Climate Education?
This graph shows funding sources specifically for climate education programs.7
YES47%
NO53%
8%
22%
1%
Climate Program OverviewThis section discusses the extent to which organizations are incorporating climate change, when they started incorporating climate change, the age groups they serve, and the funding sources they use.
“Are you currently incorporating climate change into your educational programs?” proved to be a challenging question for many respondents. Answers varied widely and often included qualifiers and descriptions. As answers did not fit into a strict “yes” or “no” dichotomy, they were arranged into the following categories5:
■■ Consistently delivered program
■■ Consistently delivered elements
■■ Inconsistently delivered elements
■■ Currently in developments
■■ Interested
■■ Not interested
0 5 10 15 20 25 30 35 40
FIGURE FIVE
When Did You Begin Incorporating Climate Change?
7
8
11
0 3 6 9 12 15
FIGURE FOUR
How Are You Incorporating Climate Change?
21%
0 5 10 15 20 25 30
Consistent Program
Consistent Elements
Inconsistent Elements
Developing Program or Elements
Interested
Not Interested
29%
19%
10+ years ago
6–10 years ago
3–5 years ago
1–2 years ago
In development
14
14
FIGURE SEVEN
How Is Your Climate Programming Funded?
6
4
39General Operating Budget
Grants
Other
Private Donations
Program Fees
15
13
FIGURE SIX
What Grade Levels Do You Serve?
23
8
11
0 5 10 15 20 25
K-2
3-5
6-8
9-12
13-16
Adults
Teachers
General Public
Senior Citizens
20
22
19
12
16
4
The above categories were selected to reflect age delineations mentioned by many participants.6
This graph shows funding sources specifically for climate education programs.7
FIGURE EIGHT
Have You Received Funding Specifically for Climate Education?
This graph shows funding sources specifically for climate education programs.7
YES47%
NO53%
8%
22%
1%
Figures 5-9 provide additional information from respondents currently incorporating climate change into their education programs.
PAGE 6 B A Y A R E A C L I M A T E C H A N G E E D U C A T I O N N E E D S A S S E S S M E N T
0 5 10 15 20 25 30 35 40
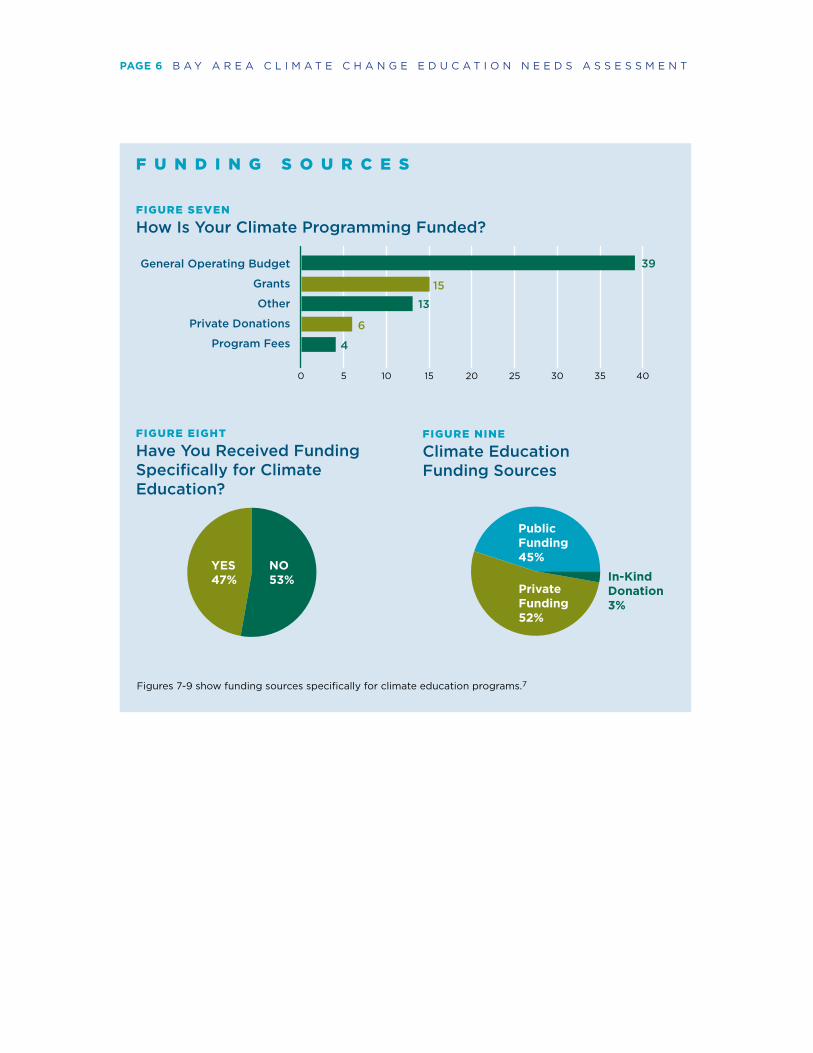
FIGURE SEVEN
How Is Your Climate Programming Funded?
F U N D I N G S O U R C E S
6
4
39General Operating Budget
Grants
Other
Private Donations
Program Fees
15
13
FIGURE EIGHT
Have You Received Funding Specifically for Climate Education?
Figures 7-9 show funding sources specifically for climate education programs.7
YES47%
NO53%
FIGURE NINE
Climate Education Funding Sources
PublicFunding45%
In-Kind Donation3%
PrivateFunding52%

PAGE 7 B A Y A R E A C L I M A T E C H A N G E E D U C A T I O N N E E D S A S S E S S M E N T
Overall Needs
In assessing the needs and challenges identified by the interviewees, we found that both those who were and who were not incorporating climate change into their programs expressed a similar set of challenges. Six broad categories emerged from our assessment8 — see figure 10.
CapacityThe overwhelming majority of participants (95%) mentioned needs or challenges related to internal capacity. Of capacity-related needs, time was a significant factor, mentioned most often by respondents. Specifically, participants mentioned time as a challenge as it relates to the staff time necessary to think strategically, plan for incorporating new topics, and conduct research to find program models and activities.
Professional development and training was another frequently mentioned need. Interests included training on the latest scientific information, basic communication strategies, and how to best handle disparate opinions about climate change. Those who are not currently incor-porating climate change expressed concerns about how it could be received politically. While some expressed concerns about audience perceptions and reception of climate change top-ics, respondents with existing programs stressed that training and supporting interpreters so that they feel comfortable introducing the topic are keys to overcoming this issue.
Competing priorities and a lack of organizational leadership were other critical challenges. With limited instruction time, program managers and implementers often struggle to include a diverse range of environmental topics—of which climate change is only one. A lack of orga-nizational leadership articulating climate change as a priority further adds to this challenge.
ModelsIn this assessment, 83% of respondents mentioned that they currently lack curriculum and models for specific climate change activities. Many people are interested in incorporating climate change into existing programs and are looking for simple, effective ways to do that. They are seeking successful examples of curriculum and models that they can adapt to their programs, including metaphors, hands-on activities, visuals, and ways to incorporate climate into existing programs.
FIGURE TEN
Overall Needs & Challenges
21%
0 20 40 60 80 100
Capacity
Models
Data
Behavior Change
Age Appropriateness
Evaluation
95%
22%
FIGURE NINE
Climate Education Funding Sources
This graph shows funding sources specifically for climate education programs.7
PublicFunding45%
In-Kind Donation3%
PrivateFunding52%
22%
83%
9%
FIGURE ELEVEN
Do You Promote Specific Actions?
YES55%
NO20%
GrayArea25%
FIGURE TWELVE
Evaluating Climate Education
0
20%
40%
60%
YES56%
NO44%

PAGE 8 B A Y A R E A C L I M A T E C H A N G E E D U C A T I O N N E E D S A S S E S S M E N T
Many respondents specifically mentioned the need to connect climate change to topics that are already part of their curricula. Specifics topics included: cultural and topographical his-tory, drought, wildfires, native plant restoration, and marine debris. In general, participants are looking for best practices that have been proven to work. There is a need for models and curricula that connect people to the issue and make it personal, fun, relevant, positive, and engaging for a range of audiences.
Many of the programs provide hands-on, inquiry-based learning and have had trouble finding models that fit this approach.
Data Respondents regularly mentioned the need for data on how climate change is going to affect their particular site, community, or local area. Participants also expressed interest in guidance to navigate the latest scientific information and identify reliable data sources.
There is also a desire for data on audience expectations and perceptions, primarily from those not currently incorporating climate change programming. This interest stems primarily from concerns on how audiences and partners may react to climate education.
Additionally, respondents would like feedback from teachers about their needs in the class-room and information on how to implement climate change elements from the upcoming Next Generation Science Standards.
Finally, people are looking for infographics, visual interpretations of data, and social math. Social math, as defined by the Berkeley Media Studies Group, is “the practice of making large numbers comprehensible and compelling by placing them in a social context that provides meaning.”9 In practical terms, this means expressing numbers in terms of units and objects that are familiar to your audience.
Behavior Change Twenty-two percent of respondents mentioned challenges relating to facilitating behavior change and action on climate issues. Some participants mentioned that incorporating climate education is a process of behavior change in itself, as it asks practitioners to go outside of their comfort zone and build new habits.
Respondents want to know more about how to facilitate behavior change and effectively move people to action. Participants mentioned needing a menu of actions that can be inte-grated into programming. A few identified an additional challenge around presenting the information in a way that leaves the audience feeling empowered to take action. This includes connecting solutions to community level/collective actions within the Bay Area and providing actions that address the scale of the problem.
Finally, respondents expressed a need for training on behavior change models, the latest in behavioral science, and methods for evaluating behavior change.

PAGE 9 B A Y A R E A C L I M A T E C H A N G E E D U C A T I O N N E E D S A S S E S S M E N T
Do you promote specific actions or behaviors through your program?
Many organizations were reluctant to say that they promote specific behaviors and preferred to frame it in terms of offering potential solutions. There were also respondents who focus on sus-tainability generally, but not climate change behaviors specifically. The following categories outline the nuances inherent to this question:
■ Yes: if they said yes and if their program specifies solutions or actions people can take
■ No: if they said no or if their program models behaviors without presenting them as choices to others
■ Gray Area: participants weren’t sure how to answer or answered yes with concerns about promoting specific actions
If yes, what behaviors do you encourage?Below is a list of climate-related actions that participant organizations incorporate into their edu-cation programming. The behaviors were not filtered according to their impact or efficacy.
Transportation: Walk and bike, use public transportation, carpool, use electric vehicles, ride shuttles to parks, use bike shares
Food & Plant Systems: Choose locally grown food, plant gardens, replace meat with vegetables, join a CSA, observe Meatless Mondays, remove non-native species, help with habitat restoration
Water Use: Wash clothes in cold water, landscape with native plants, take shorter showers
Energy Use: Shift electricity use to off peak hours, use power strips, choose energy efficient appli-ances and lighting options, choose renewable energy, turn off unused lights, lower the thermostat
Waste Streams: Develop zero waste programs, reduce waste streams, compost, reuse, recycle, refuse packaging, use reusable bags, use green building materials, buy used clothes, find ways to replace plastic use
Civic Action: Send messages to elected representatives, teach others what you’ve learned, pro-mote city and personal adaptation planning, support renewable energy initiatives, volunteer for local climate organizations, join the student environmental club, support collective solutions If no, why not? Below are select responses on why participants are not currently promoting specific behaviors related to climate education.
■ Promote a sustainability ethic rather than specific behaviors
■ Prefer to lead by example and model sustainable behaviors
■ Want their audience to extrapolate what they want and need to do on their own
■ Prefer to focus on the science and information and offer solutions only if people ask for them
■ Not within the scope of their organization to try and change behavior
Moving People to Action
0 20 40 60 80 100
YES 55% NO 20% GRAY AREA 25%

PAGE 10 B A Y A R E A C L I M A T E C H A N G E E D U C A T I O N N E E D S A S S E S S M E N T
Age AppropriatenessTwenty-one percent of respondents expressed concerns about wanting to present climate change at an age-appropriate level. There is a need for more information and training about childhood development as it relates to climate change. Participants are curious not only about when and how to introduce the concepts of climate change to younger grades, but also how to build a foundation of stewardship that can support climate education at later stages.
We heard often that the abstract nature and technical complexity of climate change may be inappropriate for certain age groups. At the same time, there are programs that have designed activities and tailored their curriculum to younger students. Finally, respondents asked for curricula, models, and activities designed for specific age groups.
Evaluation An additional 9% of respondents mentioned that evaluation of climate education programs is a challenge. Participants expressed the need for evaluation models and simple ways to evalu-ate program effectiveness. The answers included in the evaluation category were separated from the needs associated with evaluating behavior change—although the two are related.
Have you measured the success or impact of your climate education? 10 If yes, how?
Surveys were the most common method of program evaluation but other methods of program evaluation included feedback cards, external evaluators, interviews, and observation. The charts below show whether current evaluation methods target those delivering or receiving the program11 and how respondents are defining success.12
How many people participate in your climate education programming annually?13
Responses to this question varied widely in terms of specificity and precision. As the responses were difficult to standardize, instead of looking at the numbers served we decided to look at those who were able to offer an exact number in response to this question and those who were not.14
Program Evaluation
FIGURE ELEVEN
Program Delivery vs. Reception
11
0 5 10 15 20 25
Program Delivery
Program Reception 20
FIGURE TWELVE
What Are You Measuring?
11
0 2 4 6 10 128
Knowledge
Behavior Change
Experience 3
Attitudes 2
Touch 2
8
0 20 40 60 80 100
YES 56% NO 44%
0 20 40 60 80 100
UNABLE TO SAY 73% EXACT NUMBERS 27%
FIGURE ELEVEN
Program Delivery vs. Reception
11
0 5 10 15 20 25
Program Delivery
Program Reception 20
FIGURE TWELVE
What Are You Measuring?
11
0 2 4 6 10 128
Knowledge
Behavior Change
Experience 3
Attitudes 2
Touch 2
8
0 20 40 60 80 100
YES 56% NO 44%
0 20 40 60 80 100
UNABLE TO SAY 73% EXACT NUMBERS 27%FIGURE ELEVEN
Program Delivery vs. Reception
11
0 5 10 15 20 25
Program Delivery
Program Reception 20
FIGURE TWELVE
What Are You Measuring?
11
0 2 4 6 10 128
Knowledge
Behavior Change
Experience 3
Attitudes 2
Touch 2
8
0 20 40 60 80 100
YES 56% NO 44%
0 20 40 60 80 100
UNABLE TO SAY 73% EXACT NUMBERS 27%

PAGE 11 B A Y A R E A C L I M A T E C H A N G E E D U C A T I O N N E E D S A S S E S S M E N T
Regional Collaborative
In response to the question “Would you be interested in participating in a potential Bay Area collaborative around climate change education?,” 84% of participants said that they are interested in a collaborative effort, while 14% said maybe and 2% said no. The “maybe” category included yes answers that depended on the time commitment and other factors, as well as those who were unsure.
What might you hope to get out of the Collaborative?Participants’ hopes for the Bay Area Climate Education Collaborative were closely linked to their expressed needs and challenges. The main themes that emerged were:
■■ The opportunity to see what’s working within other programs, and observe existing programming
■■ Models for activities, curriculum, and citizen science
■■ Help integrating climate change into existing programs, and connecting climate change to other topics
■■ Potential partnerships, networking opportunities, and knowledge of ongoing events and trainings
■■ Sharing resources, and going after additional funding streams together
■■ Collaboration around what’s not working; shared problem solving
■■ Developing unified messaging for the Bay Area and collective solutions
■■ Ways to bring climate education into the parks and connect with others working in similar sites
■■ Knowledge of the larger learning ecosystem, how best to connect people to different pro-grams, and how to situate programs within a larger context and logical series
■■ Tools for action, behavior change, developing a menu of solutions
■■ Help with evaluation, identifying effective techniques, measuring impact
■■ Navigating the latest science, filtering the science, accessing data on local impacts
FIGURE THIRTEEN
Organizations Interested in a Collaborative
YES84%
14%MAYBE
NO2%

PAGE 12 B A Y A R E A C L I M A T E C H A N G E E D U C A T I O N N E E D S A S S E S S M E N T
ConclusionThroughout this assessment, it has been inspiring to see the widespread passion for and inter-est in tackling climate change through environmental education. While the challenges are real and significant, there is a strong consensus around the important role that informal education can play and the need to come together as a community to address these challenges. With the diversity of organizations and programs interested in pursuing this work, it is clear that the community will significantly benefit from the opportunity to share ideas, exchange experi-ences, and pursue partnerships around climate change.
It is our hope that this needs assessment will be used as a tool to help inform collaborative efforts to support and enhance climate literacy programs throughout the region. We hope that this sparks deep conversation and analysis on how we can work together as a community of practitioners to become a hub for collaboration, innovation, and impact on climate literacy and action.

PAGE 13 B A Y A R E A C L I M A T E C H A N G E E D U C A T I O N N E E D S A S S E S S M E N T
Alliance for Climate Education
Aquarium of the Bay
California Academy of Sciences
California State Parks: Mount Tamalpais, Angel Island
Chabot Space & Science Center
Climate Protection Campaign
East Bay Regional Park District
EcoCenter at Heron’s Head Park
Education Outside
The Energy Coalition: PEAK Program
Environmental Volunteers
Exploratorium
Farallones Marine Sanctuary Association
Garden for the Environment
Golden Gate National Parks Conservancy
Guadalupe River Park Conservancy
Hayward Area Recreation & Park District
Literacy for Environmental Justice
Marin County Parks
Marin Municipal Water District
The Marine Mammal Center
Midpeninsula Open Space District
NatureBridge
National Park Service: East Bay National Parks, Golden Gate National Recreation Area, Point Reyes National Seashore, San Francisco Maritime National Historical Park
National Oceanic and Atmospheric Administration: Cordell Bank National Marine Sanctuary, Gulf of the Farallones National Marine Sanctuary, San Francisco Bay National Estuarine Research Reserve
Pepperwood Preserve
Point Bonita YMCA
Point Blue Conservation Science
Point Reyes National Seashore Association
The Presidio Trust
Richmond District Neighborhood Center
San Francisco Bay Bird Observatory
San Francisco Bay Marine Science Institute
San Francisco Bay National Estuarine Research Reserve
San Francisco Recreation and Park
San Francisco Unified School District, Environmental Science Center
Santa Clara County Parks
Save the Redwoods League
Slide Ranch
Sonoma Ecology Center
Strategic Energy Innovations
Tuolumne River Trust
University of California Berkeley, Lawrence Hall of Science
United States Fish & Wildlife Service: Don Edwards National Wildlife Refuge, San Francisco Bay National Wildlife Refuge Complex
APPENDIX ONE
Needs Assessment Participating Organization List

PAGE 14 B A Y A R E A C L I M A T E C H A N G E E D U C A T I O N N E E D S A S S E S S M E N T
PRE-INTERVIEW RESEARCH1. Name
2. Organization
3. Position
4. Location (City of operation)
5. Type of Organization
PERSONAL INFORMATION1. Can you give a brief overview of the primary responsibilities and activities of your current
position?
PROGRAM DETAILS2. Are you currently incorporating climate change into your educational programs?
If yes:
3. Can you briefly tell me how you’re incorporating climate change into your programs? a) When did you begin incorporating climate change into your programs?b) What age groups do you serve? c) How many people participate in your climate education program(s) annually? d) What geographic areas do you serve? e) Are there other specific demographics that you target? f) How is your climate programming funded? g) Have you received any funding specifically for climate change education? h) Do you have an articulated, overarching goal for your climate change education
program?i) If yes, what is it?j) Do you promote specific actions or behaviors through your program? k) If yes, what behaviors do you encourage? l) If no, why not?
Continue on to Program Evaluation Questions
APPENDIX TWO
Needs Assessment Interview Questions

PAGE 15 B A Y A R E A C L I M A T E C H A N G E E D U C A T I O N N E E D S A S S E S S M E N T
If no:
4. Why not?a) What are the primary challenges to incorporating climate change into your programs?b) Are you potentially interested in incorporating climate change into your education
programs?c) What would enable you to incorporate climate change into your programming? Are
there any resources or types of support that you feel would be particularly useful to you?
d) Have you had climate education programs in the past?e) If yes, please describe.f) Have any of your staff participated in climate education trainings now or in the past?g) If yes, what were they?
Skip to Collaborative Questions
PROGRAM EVALUATION5. Have you measured the success or impact of your climate education?
6. If yes, how?
7. What aspects of your climate programming have been particularly successful or well-received?
8. What are the primary challenges to incorporating climate change into your programs?
9. Have any of your staff participated in climate education trainings now or in past positions?
10. If yes, what were they?
11. Are there any resources that you’ve found particularly useful in implementing your program?
12. What would you find most useful in developing your climate programming? Any identi-fied needs, additional resources that you could use, etc.?

PAGE 16 B A Y A R E A C L I M A T E C H A N G E E D U C A T I O N N E E D S A S S E S S M E N T
COLLABORATIVE13. Would you be interested in participating in a potential Bay Area Collaborative around
climate change education?
If no:
14. Would you mind sharing why not?
15. Are there others at your organization that we should include in the Collaborative?
If yes:
16. What might you hope to get out of the Collaborative? What would most attract you to this type of initiative?
17. Is there anything in particular that you might be interested in contributing to this type of collaborative? Any particular knowledge or experiences that you think might be useful to others? (We’re not asking for a commitment, just looking to get an idea of existing resources within our community that might be able to strengthen this initiative.)
18. Would you be the best point of contact for this type of initiative?
19. How much time would you or your organization be willing/able to commit to a regional collaborative of this kind?
20. Are there any other ideas or recommendations that you might have as we move this potential collaborative forward?
REFERRALS21. Do you have any recommendations for additional contacts that we should include in this
needs assessment (within or outside of your organization)?

PAGE 17 B A Y A R E A C L I M A T E C H A N G E E D U C A T I O N N E E D S A S S E S S M E N T
1 The analysis shown throughout represents the number of responses by interview rather than organization, unless otherwise noted.
2 The two different question tracks account for the different number of responses shown throughout the report (i.e. the number of responses does not always add up to 78). As can be seen in Appendix II, the track was determined by whether participants felt they were incorporating climate change. Answers were often inconsistent across interviews and where appropriate we recoded their answers to interpret the data.
3 “Nonprofits” include museums, aquariums, environmental educational organizations, conservation organizations, and research institutions. “Public Agencies” include federal, state, county, regional, and city government, water, and school districts, public partnerships, public-private partnerships, and public universities.
4 When we asked the question “Are there other specific demographics that you target?,” we got a range of interpretations and inconsistent responses that were difficult to compare. We learned that the ques-tion should have been framed more precisely, especially with respect to defining what it means to target a specific demographic.
5 If respondents described a substantial and consistent climate education curriculum or an entire pro-gram, then they were coded as “consistently delivered program or curriculum.” If they had consistent activities, then they were coded as “consistently delivered program elements or activities.” Those who were unsure about how often their climate education programming is being delivered, or who host one climate education event per year, were coded as “inconsistently delivered program elements or activities.”
6 A couple of respondents mentioned pre-K pilots, which are not reflected in the data.
7 “Other” included rate payer funding, endowments, public and private organizations, government contracts, oil spill settlement funding, and SFUSD Title I Improvement Category. “Private funding” was defined as grants from private organizations, and private or foundation donations. “Public funding” included grants from public organizations. The one in-kind donation was given as graduate student research time.
8 “Capacity” included: time to think strategically and develop programming; funding and staff; training on handling disparate opinions, scientific knowledge, and communication skills; competing priorities; limited instruction time; organizational leadership; ability to get more people out to places; generating interest in existing programs from teachers and students; help integrating climate change into existing programs. “Models” included: activities; metaphors; visuals; ways to connect climate change to existing program topics (e.g. drought, marine debris, pollution); best practices; successes; ways to make it fun, personal, and interactive; inquiry-based learning models; ways to make it engaging; examples for showing sea level rise. “Data” included: sources on local impacts and site impacts, background information on audience perceptions, the latest science, help filtering existing data and finding reliable data sources, feedback from teachers about their needs. “Behavior Change” included: models for how behavior change works; how to move people to action effectively, a menu of potential actions (collective and individual, coordinated with other organizations), training on behavior change, access to the latest in behavioral science, methods for evaluating behavior change. “Age Appropriateness” included: knowledge about childhood development; models for activities, analogies, and metaphors for specific age groups; concern about when and how to introduce climate change to younger kids. “Evaluation” included: models, simple ways to evaluate, help with evaluation generally.
Endnotes

PAGE 18 B A Y A R E A C L I M A T E C H A N G E E D U C A T I O N N E E D S A S S E S S M E N T
9 Berkeley Media Studies Group: Activity: Presenting Data Using Social Math http://www.sierrahealth.org/assets/HSC/Presenting_Data_Using_Social_Math.pdf
10 “Yes” included respondents that evaluate part or the entirety of their climate programming or that are designing an evaluation approach that will be implemented in the near future. “No” included participants that evaluate the delivery of their programs broadly, but not specifically climate education; that are not evaluating at all; that performed an evaluation in the past; and that piloted a one-time evaluation.
11 “Program Delivery” evaluated the perspective of those delivering the program (teachers, docents, volunteers, and staff educators). “Program Reception” evaluated the perspective of those receiving the program (students, visitors, workshop attendees, teachers in a teacher training program).
12 “Attendance” measured participation, attendance, and multiple touch points. “Attitudes” measured confidence and desire or intention to act. “Experience” measured enjoyment and the overall experience. “Behavior Change” measured change in actions, often pre- and post-delivery. “Knowledge” measured knowledge retention, facts, and knowledge about potential actions.
13 It should also be noted that to really get at this question we should have requested data for a specific year (2013–2014). As it was, when asked this question, respondents often approximated numbers without specifying the source of their data or clarifying whether those numbers pertained to climate-specific programming.
14 “Exact Numbers” included those whose response clearly represented climate specific programming and was a precise or closely approximated number. “Unable to Say” included those who mentioned that it was too difficult to say, estimated the amount as part of their broader program delivery, or gave a number that was not clearly specific to climate programming.
PHOTO CREDITS
Cover: Alison Taggart-Barone, page 2: Mason Cummings; page 3: Alison Taggart- Barone