bayesian networks and linear regression models of...
TRANSCRIPT
1
Bayesian Networks and Linear Regression Models of Students’ Goals, Moods and Emotions
Ivon Arroyo1, David G. Cooper1, Winslow Burleson2, Beverly P. Woolf1
1Department of Computer Science, University of Massachusetts Amherst 2Department of Computer Science and Engineering, Arizona State University INTRODUCTION
If computers are to interact naturally with humans, they should recognize students’ affect and
express social competencies. Research has shown that learning is enhanced when empathy or
support is provided and that improved personal relationships between teachers and students
leads to increased student motivation.1-4 Therefore, if tutoring systems can embed affective
support for students they should be more effective. However, previous research has tended to
privilege the cognitive over the affective and to view learning as information processing,
marginalizing or ignoring affect.5 This chapter describes two data-driven approaches toward
the automatic prediction of affective variables by creating models from students’ past
behavior (log-data). The first case study shows the methodology and accuracy of an empirical
model that helps predict students’ general attitudes, goals and perceptions of the software and
the second develops empirical models for predicting students’ fluctuating emotions while
using the system. The vision is to use these models to predict students’ learning and positive
attitudes in real time. Special emphasis is placed in this chapter on understanding and
inspecting these models, to understand how students express their emotions, attitudes, goals
and perceptions while using a tutoring system.
1. PREDICTING GOALS AND ATTITUDES
The first case study demonstrates a methodology for predicting students’ attitudes and goals
from their behavior within the tutor. In earlier research,6 a taxonomy of help seeking bugs
and possible hints was created to encourage positive behavior. In other research,7 a Bayesian

2
model was used to infer students’ emotions and personality in a mathematics game. Later
work from these same authors27 has used student goals collected from a pretest survey to help
predict student emotions within the tutor. Instead, this work tries to understand student goals
and attitudes to take remedial action upon the appearance of goals that are unproductive (e.g.
performance orientation goals, or clear goals that indicate a desire to not use the system).
Corrective action does not necessarily have to come from the system itself, but could consist
of informing the teacher, so that she/he takes corrective action.
Crude generic descriptors of students’ behavior in a tutoring system were used to predict
students’ goals, attitudes and learning for a large database of student actions. Some of the
behaviors may reflect unproductive students’ behavior that has been studied in the past, and
classified as “gaming” behavior, e.g., clicking through hints to get the right answer.8 In this
section, we present statistics that show that such dependencies do exist, describe how the
Bayesian Network created from data, and evaluate its accuracy.
A Data Description
The data used in the first case study comes from a population of 230 high school students
from two schools in rural and urban areas of Massachusetts. Students used Wayang Outpost,
a multimedia web-based tutoring system for high school mathematics.9-10 Wayang Outpost
provides step-by-step instruction to students in the form of animations supplemented with
sound, which help students solve mathematics problems. All actions taken by students or
system are logged in a database in a central server, allowing researchers to extract variables
such as time spent, number of problems seen and speed of response for each student. Students
took a mathematics pretest and then used Wayang Outpost for about 2-3 hours during a
week’s time. After using the tutor, students took a mathematics post-test and took a survey
that asked them about their goals when using the system, how they felt about mathematics

3
and the tutoring system. Table 1 shows the specific questions asked to the student, with code
names for each question (in bold). In addition, we identified features that describe student
behaviors, specific ways in which they interacted with the system. These summaries of
student behavior fall into four categories: (1) Problem-solving behavior, e.g., average
incorrect responses, specifically for those problems where help was requested; average
seconds spent in any problem and where help was requested; and average time spent between
pairs of attempts. (2) Help activity, average hints requested per problem; average hints in
helped problems (when a student asks for help, how much help is requested?); average
seconds spent in helped problems (time/effort the student invested when she asked for help);
the percentage of helped problems in the tutoring session (how often the student asked for
help). (3) Help timing, when help was sought as a percentage of all helped problems: help
before making an attempt; help after making an attempt; help after entering the correct
answer. (4) Other descriptors, math pretest score; gender; time between pairs of attempts.
We may attempt to interpret these dependencies among variables to understand
students’ use of the system. For instance, learning gains from pre to post-test (%
improvement) is not correlated to ‘average hints seen per problem’, but it is correlated to
‘average hints seen in helped problems.’ The trend suggests that students who search deeply
for help are more likely to learn. In addition, learning gain is not significantly correlated with
‘time spent in a problem,’ but instead to ‘time spent in problems in which help was seen.’
This suggests that spending much time struggling in a problem and not seeing help will not
lead to learning; instead, a student should spend significant time seeing help. Learning is
negatively correlated to average incorrect attempts per problem, suggesting that students who
tend to make many incorrect responses per problem will not improve much from pre to
posttest. Many of these correlations are not very strong (in general, neither of them by
themselves accounts for more than 15% of the variance). However, a model that accounts for

4
all these variables together should allow for a better prediction of the dependent variables (i.e.
goals, attitudes, perceptions of the software and learning).
B Identifying Dependencies Among Variables
Bi-variate Pearson correlations were computed to search for dependencies among latent and
observable variables from student behavior in the tutor. A high number of significant
correlations found among help seeking attitudes, help seeking behaviors, perceptions of the
system, gender and other behaviors such as problems seen and reports such as how often a
student heard the audio for explanations. These dependencies are among latent variables --
such as significant correlations among student goals and attitudes. In addition, students’
general perceptions and attitudes are significantly correlated to student behaviors in the tutor.
For instance, making asking for help in problems where mistakes were made seems to be a
positive action and is correlated to ‘seriousness’ and ‘liking of the system,’ though not
directly associated to higher learning gains. It is also correlated to the ‘challenge’ attitude,
showing that students might want to make an attempt even if they risk a wrong answer. One
interesting dependency is that a high number of mistakes per problem is correlated to a higher
chance of a student saying he/she wants to ‘get over with’ (probably just “gaming” and
clicking through to get the answer). However, making a high number of mistakes in problems
where they also request help is associated to a lower likelihood of wanting to ‘get over with’
the session, again suggesting that failing and asking for help is associated to a positive
attitude towards learning. Positive perceptions of the software, such as willingness to return
to use the system, are correlated to productive behaviors that lead to higher learning gains
(e.g. ‘average hints per problem’). Students who see decide to seek for hints seem to be
genuinely trying to learn.
5
C An Integrated Model of Behavior, Attitude And Perceptions
The next step is to build a model to predict a student’s goals and attitudes from summaries of
student interactions with the tutor. If an accurate inference of attitudes, goals and even
learning can be made while the student is using the system, then the tutor can anticipate these
attitudes and take corrective action.
Bayesian belief networks (BBNs) are used to model knowledge that is uncertain, e.g.,
student knowledge, emotion and teaching strategies. For example, teachers don’t know
which teaching actions will encourage students in the short term or inspire them in the long
run.11 Evidence that a student knows a topic might result from authentic skills, a lucky guess,
or a random choice. These uncertainties necessitate that intelligent tutors reason under
uncertainty. BBNs are a representation of knowledge or emotion in which every path through
the space describes a collection of believed or observed facts.12 Yet every representation must
remain incomplete due to uncertainty about learning and incomplete understanding human
emotion. Bayesian theory can roughly be boiled down to one principle: To see the future, one
must look at the past. Bayesian methods reason about the probability of future events, given
their past and current probabilities and enable computers to combine new data to predict
values with prior beliefs about data.
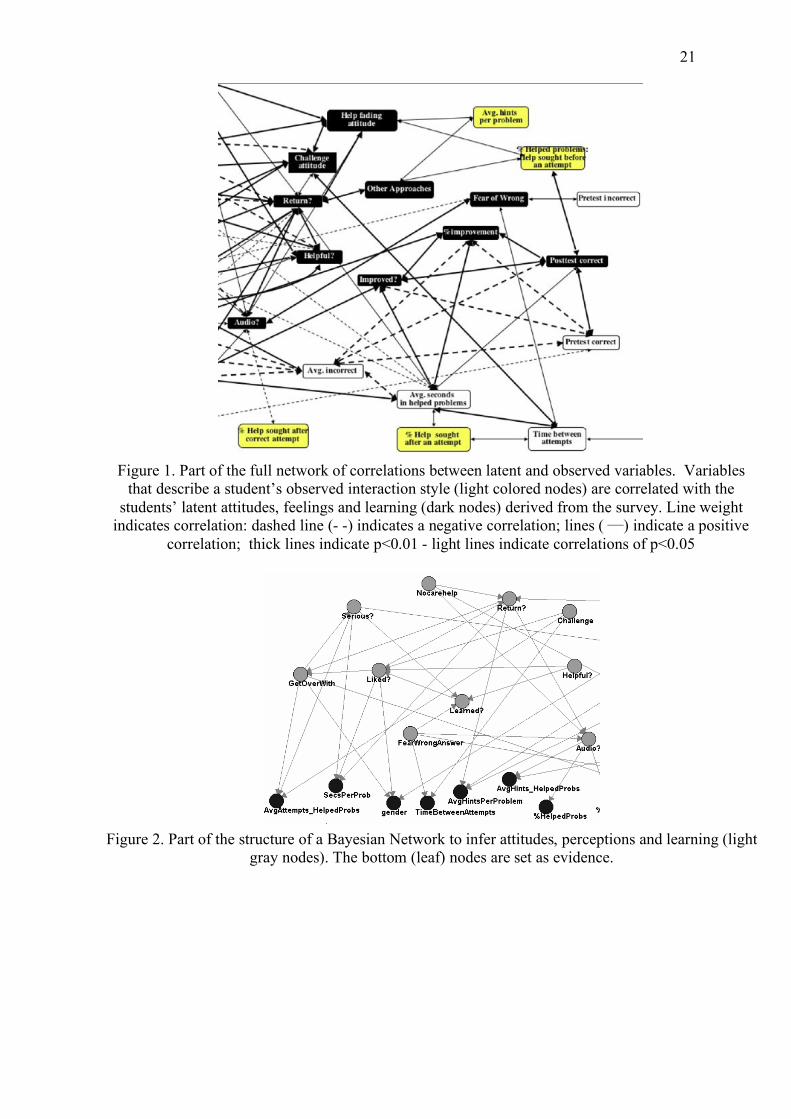
Our team built a BBN to predict student emotion by starting with observed student
actions and inferring the probability of unobserved (hidden) emotion (e.g., topics that
students know), Figure 1. The correlation network first represents the observed variable
(AvgIncorrect, %helped problems) as well as the unobserved variable (don’t care about help,
seriousness). Arcs lists the probability that one variable can be inferred from another (e.g.,
unobserved variable from an observed variable). If an arc joins two nodes, it means the
probability of all possible values for the pointed-at-node depends on the value of the previous
node. If no arc joins two nodes, it means that the values for these nodes do not correlate to

6
each other. Bayesian networks that are learned from data such as this correlation network can
capture complex dependencies among variables, as they can predict the probability of some
unknown (latent) variables, given a few others that have been observed. We constructed the
Bayesian network shown in Figure 2 from the correlation graph in Figure 1, by: 1)
eliminating the correlation links among student interaction variables; 2) giving a single
direction to the links from goals/attitudes to observable behavior variables; 3) providing a
single direction for links between goals/attitudes variables (from the nodes that are more
likely “causes” to the nodes that are more likely effects); 4) eliminating links that create
cycles, basing the elimination choice on correlation strength. This resulted in the directed
acyclic graph shown Figure 2.
---INSERT FIGURE 2 APPROXIMATELY HERE ---
Next, the parameters of the network were generated by: 1) discretizing all variables in two
levels (high/low) with a median-split; 2) simplifying the model further by discarding existing
links whose connecting nodes do not pass a Chi-Square test (the dependency is not
maintained after making the variables discrete); 3) creating conditional probability tables
(CPTs) from the cross-tabulations of the students’ data (“maximum likelihood” method for
parameter learning in discrete models.12
The probability that a student has a goal/attitude given that we know his observable
actions is stated as a conditional probability; dependencies in the network are defined by
conditional probability with one entry for each different combination of values that variables
can jointly take.11 This is represented as a table that lists the probability that the child node
takes on, based on different values for each combination of values of its parents, see Table 2.
Assume that a BBN represents whether students have a fear of getting the problem
wrong (Figure 2, Middle Row). Consider that the tutor begins with no clear knowledge about
whether students will express this fear in the survey: There is 50% probability that the student

7
will state this fear or not. All nodes in this case study are binary—that is, nodes have two
possible values denoted by T (true) and F (false). Either students will express this attitude in
the surveys or they will not. The strength of the relationship for two nodes is shown in Table
2. When a hidden node, such as “Fear of wrong” is queried, its probability distribution is
updated to incorporate all the leaf nodes in Figure 2. Two propositions P(Fear of wrong) and
P(time between attempts) are dependent if a change in belief about one affects belief in the
other. In general, if we are interested in the probability of a proposition, S, and we have
accumulated evidence, E, then the quantity to calculate is P (S | E). If this conditional
probability is not directly available in the knowledge base, then probabilistic inference can be
used to determine it.
--- TABLE 2 GOES APPROXIMATELY HERE ---
As an example, Table 2 shows the conditional probability table corresponding to the
node ‘Time Between Attempts’, which has two parents: ‘Fear of wrong’ and ‘challenge,’ see
Figure 2. Many interesting relationships between variables are captured, e.g., when a student
reports a ‘challenge’ attitude, the chance of spending a long time between subsequent
attempts is higher than when a student does not report wanting to ‘challenge’ herself
(compare (4) to (2) and (8) to (6) in Table 2). When a student reports ‘fear of the wrong
answer,’ there is also higher likelihood of spending a long time between attempts (compare
(8) to (4) and (6) to (2) in Table 2).
D Model Accuracy
A 10-fold cross-validation was carried out to test the accuracy of the model. The following
process was repeated 10 times: the conditional probability tables were learned from 90% of a
random student data-fold; the remaining 10% data was used to test the model, in the
following way: leaf nodes (observable student behavior within the tutor) were evidenced with

8
the behavior that the student displayed and other student descriptors. Then, the latent nodes
(goals, attitudes, learning improvement, post-test score, perceptions of the system) were
inferred with the Bayesian network. Table 3 shows that all of the latent nodes were predicted
with accuracy above random level, half of them with an accuracy of 75% or above.
---TABLE 3 GOES APPROXIMATELY HERE----
E Case Study Summary
A data-driven Bayesian model was created from a dataset of 230 high school students’ logs.
This model predicts latent affective and motivational variables related to the learning
experience: their goals, attitudes and whether they learn. We showed how a methodology that
combines machine learning methods and classical statistical analysis were combined to create
a fairly accurate model of students’ latent variables. This model can be used in real-time so
that the tutoring software can make inferences about student emotion --by keeping “running
averages” of behavioral variables (e.g. average hints per problem). This provides the tutor
with an estimation of students’ attitudes and likely outcomes while students interact with the
program. It is interesting that many of the students’ negative attitudes and unlearning were
expressed with different forms of “speeding” within the software (consistent with past
research11,6). Corrective pedagogical decisions can be made by the tutoring software to
change the standard course of action whenever attitudes are inferred to be negative, and the
teacher can be informed via web-based report tools that are permanently updated.
II. PREDICTING EMOTIONS
While tracing students’ attitudes is valuable (e.g. the teacher could be hinted that certain students
are not having a positive and potentially successful experience with the software) it seems
valuable to trace more detailed and fine-grained fluctuating student emotions during a tutoring
system use. Tracing emotions is a powerful approach because the tutoring system could

9
potentially make different pedagogical moves when a student is in a certain emotional state (e.g.,
frustrated or bored). This section describes how students’ emotions were inferred from
physiological sensors (camera facial detection software, mouse pressure sensors, chair posture
sensors, and skin-conductance wrist-band), see Figure 3, in concert with “standard” tutor context
variables similar to the previous section.
---FIGURE 3 GOES APPROXIMATELY HERE ---
A Background and Related Work
No comprehensive, validated, theory of emotion exists that addresses learning, explains which
emotions are most important in learning, or identifies how emotion influences learning.5
Additionally, most educational technologies do not take into consideration natural affective
student characteristics, e.g., interest, boredom, or surprise. Since recognition of student emotion
is a key aspect of tailored affective support, researchers have focused on automated detection
of affective states in a variety of learning contexts.13-15 This prior research has shown
promising results having detected affective states such as frustration or boredom.15-16
----TABLE 4 GOES APPROXIMATELY HERE ----
The research described in this section is based on recognizing a set of emotions, first
identified by Ekman17 from analysis of facial expressions. These emotions (joy, anger, surprise,
fear, and interest) were grounded in an educational setting and certain names changed to express
emotions observed during learning. Our team produced four orthogonal bipolar axes of
cognitive-affect (e.g. “I feel anxious . . . very confident.”), see Table 4.
Hardware sensors have the potential to provide information on students’ physiological
responses linked to various affective states.18 Dialog and posture features were used to
discriminate among affective states of boredom, confusion, flow and frustration.18 Most prior
efforts, however, have been conducted in laboratory experiment settings, and have not been
brought to real educational settings such as mathematics classes in public schools.
10
B Data Description
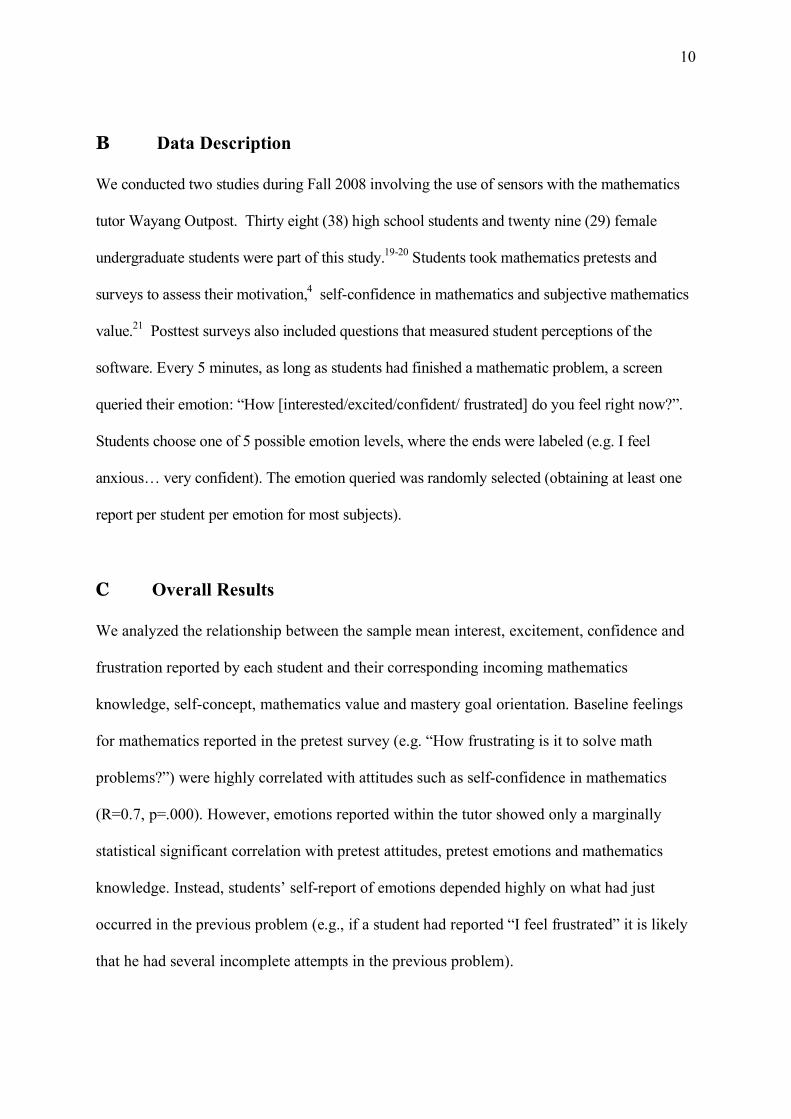
We conducted two studies during Fall 2008 involving the use of sensors with the mathematics
tutor Wayang Outpost. Thirty eight (38) high school students and twenty nine (29) female
undergraduate students were part of this study.19-20 Students took mathematics pretests and
surveys to assess their motivation,4 self-confidence in mathematics and subjective mathematics
value.21 Posttest surveys also included questions that measured student perceptions of the
software. Every 5 minutes, as long as students had finished a mathematic problem, a screen
queried their emotion: “How [interested/excited/confident/ frustrated] do you feel right now?”.
Students choose one of 5 possible emotion levels, where the ends were labeled (e.g. I feel
anxious… very confident). The emotion queried was randomly selected (obtaining at least one
report per student per emotion for most subjects).
C Overall Results
We analyzed the relationship between the sample mean interest, excitement, confidence and
frustration reported by each student and their corresponding incoming mathematics
knowledge, self-concept, mathematics value and mastery goal orientation. Baseline feelings
for mathematics reported in the pretest survey (e.g. “How frustrating is it to solve math
problems?”) were highly correlated with attitudes such as self-confidence in mathematics
(R=0.7, p=.000). However, emotions reported within the tutor showed only a marginally
statistical significant correlation with pretest attitudes, pretest emotions and mathematics
knowledge. Instead, students’ self-report of emotions depended highly on what had just
occurred in the previous problem (e.g., if a student had reported “I feel frustrated” it is likely
that he had several incomplete attempts in the previous problem).

11
Our team analyzed each student’s reported emotion in relation to the following
contextual variables regarding the last problem seen before the emotion self-report: number
of incorrect attempts (#IncompleteAttempts), whether the problem was solved correctly in the
first attempt (Solved?), time elapsed since log-on (TimeInSession), time so far using the tutor
(TimeInTutor), number of hints seen in the last problem (#HintsSeen), seconds until the first
attempt to answer (Secsto1stAttempt), seconds until the problem was solved correctly
(SecsToSolve), presence/absence of a character that gave feedback (LearningCompanion?)
and the gender of the learning companion (GenderPedAgent). Stepwise linear regression was
used to identify good predictors of each emotion. Stepwise regression finds those variables
that are good predictors of the dependent variable (in this case, the emotion reported) and
eliminates those that don’t contribute significantly to the prediction.22
Figure 4 suggests that student emotions (middle row) can be predicted from
contextual variables (top row), as they depend significantly on what has just happened in the
previous problem. Confidence can be predicted from #HintsSeen and whether the previous
problem was solved correctly. Frustration can be predicted from #HintsSeen,
#IncorrectAttempts and TimeInTutor. Excitement can be predicted from Solved?. Interest
can be predicted from #IncorrectAttempts and the gender of the learning companion. All
these statistically significant dependencies indicate that students’ emotion self-reports depend
on what has just happened and only marginally depend on students’ incoming beliefs.
Table 5 describes variables that were entered in the model with the stepwise
regression method. For instance, in the first cell, there are 62 reports of students’ confidence.
The regression model generated has a fit of R=0.49. The variables found to predict
confidence in this case were Solved? Seconds to first attempt, and seconds to solve.
D Students Express their Emotions Physically

12
As mentioned before, a set of non-invasive hardware sensors recorded students’ physiological
behavior.23-24 The hardware (with the exception of the camera developed at MIT) was
manufactured at Arizona State University from validated instruments first developed by the
Affective Computing group at MIT. Twenty-five sets of each sensor were manufactured for
simultaneous use in classrooms in Massachusetts and Arizona. The four sensors, shown in
Figure 3, include a facial expression recognition system that incorporates a computational
framework to infer a user’s state of mind,25 a wireless conductance bracelet based on an
earlier glove that sensed skin conductance developed at the MIT Media Lab, a pressure
mouse to detect the increasing amounts of pressure that students place on mice related to
increased levels of frustration18 and low-cost/low resolution pressure sensitive seat cushions
and back pads with an incorporated accelerometer to measure elements of a student’s posture.
Our team examined the extent of the benefits of using sensor data to detect students’
emotions, above and beyond making inferences from contextual variables (time, hints,
attempts, etc) as shown above. This was addressed by analyzing the improved emotion
predictions when sensor data was available compared to when inferences were limited to
information about student behavior in the tutor context. One caveat is that regression works
with a full set of data; not all sensors were available at all times for all students, because of
several real-life classroom problems and this resulted in approximately full data for each
emotion for half of the students. Figure 4 shows the generated models with reduced (but
complete) data set that includes all sensors. However, in order to be more precise about the
potential contribution of each sensor, we created another set of models showing the
contribution of each individual sensor separately, shown in Table 5. The second cell towards
the left shows that when we add in the camera information, we can create a linear model of
R=0.72, accounting for 52% of the variance (more than double than without sensors). The
variables that were found to predict confidence after the camera data is added were Solved?

13
and ConcentratingMax (the maximum probability of “concentrating” for the last problem
before the student confidence report, given by the facial recognition software). The third cell
towards the left shows that when we consider only those emotion reports for students who
also have seat posture data, the seat features (SitForwardMax, Min, Mean, and Stdev)
generate a worse model.
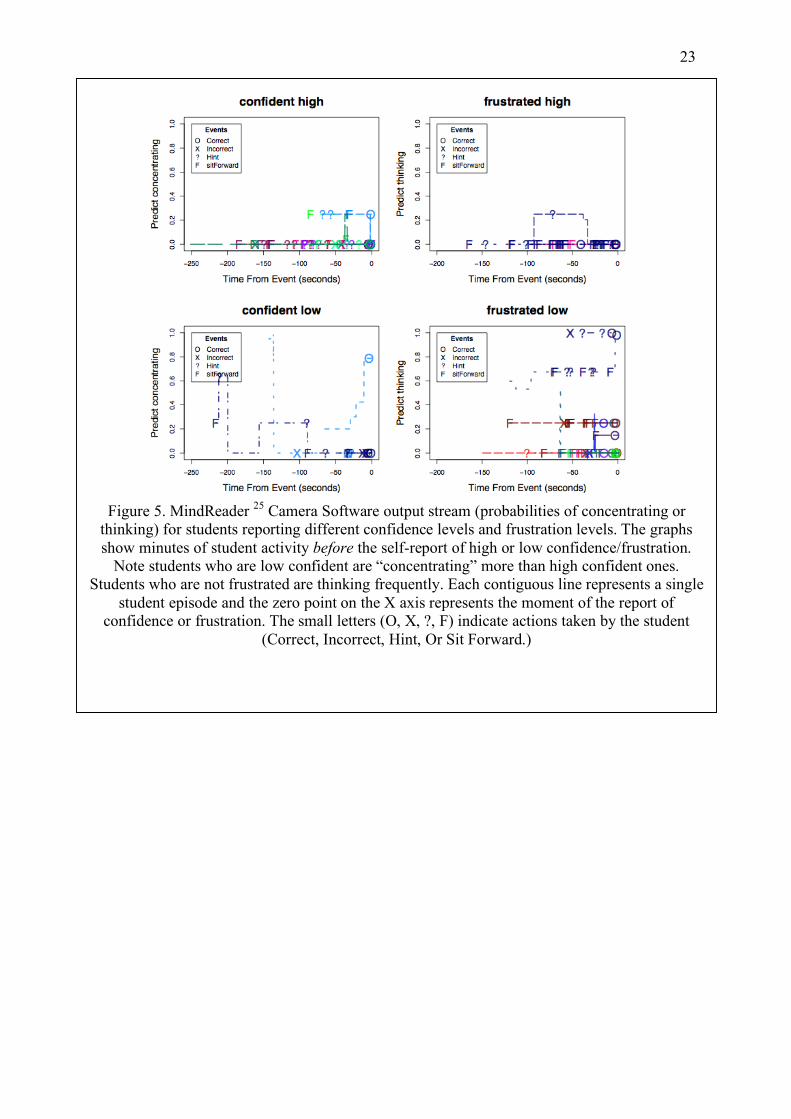
Figure 5 provides an example of data analyzed from the camera for student self-
reports on confidence and frustration. The left two graphs show that the facial recognition
software predicts that students reporting low confidence (bottom left) are concentrating
minutes before the self report, whereas students who report high confidence (top left) does
not seem to be concentrating. That is, students who are working hard trying to figure out a
problem feel unsure/anxious about their ability to solve it. The right two graphs show that a
student who self-reports little frustration (bottom) is predicted to be thinking before stating
the self-report. The small letters (O, X, ?, F) indicate actions taken by students in the tutor
(correct, incorrect, Hint or sit forward.)
III. SUMMARY AND FUTURE WORK
This chapter makes several important contributions to the data mining of affective models of
students using tutoring systems. In the first case described, Bayesian belief networks were
mined from student logs to predict student goals while using the system, with the objective of
detecting unproductive goals and attitudes that don’t contribute to learning. In the second
case, linear models were data-mined to predict state-based fluctuating emotions that are
related to longer-term affective variables (e.g., self-concept and value in mathematics) known
to predict long-term success in mathematics26 A great opportunity exists for tutoring systems
to optimize not only learning, but also attitudes and goals that are related to students'
emotions. Instead of asking students to say how they feel or what their goals are when using

14
the software, we can infer what the student will say on a minute-to-minute basis. We have
shown that these predictions can be enhanced with physiological data that is streamed to the
tutoring software, in real time. Summaries of this physiological activity, in particular data
streams from facial detection software, can help tutors predict more than 60% of the variance
of some student emotions, which is better than when these sensors are absent.
Future work consists of validating these models with new populations of students and
verify that the loss of accuracy is relatively small. The final goal is to dynamically predict
emotional states, goals and attitudes of new students from these models created from previous
students. We are working on pedagogical strategies to help students cope with states of
negative emotion and support their return to on-task behavior19 , as well as teacher reports.
Further down the line, we intend to create tutor modules that re-compute these affective
models as new student data arrives, thus producing self-improving tutoring software.
Acknowledgement
We acknowledge contributions to the sensor software development from Rana el Kaliouby, Ashish Kapoor, Selene Mota and Carson Reynolds. We also thank Joshua Richman, Roopesh Konda, and Assegid Kidane at ASU for their work on sensor manufacturing.
This research was funded by two awards, one from the National Science Foundation, #0705554, IIS/HCC Affective Learning Companions: Modeling and supporting emotion during teaching, Woolf and Burleson (PIs) with Arroyo, Barto, and Fisher,and a second award from the U.S. Department of Education to Woolf, B. P. (PI) with Arroyo, Maloy and the Center for Applied Special Technology (CAST), Teaching Every Student: Using Intelligent Tutoring and Universal Design To Customize The Mathematics Curriculum. Any opinions, findings, conclusions or recommendations expressed in this material are those of the authors and do not necessarily reflect the views of the funding agencies.

15
References 1. Graham, S., & Weiner, B. (1996). Theories and principles of motivation. In Berliner, D. &
Calfee, R (Eds), Handbook of Educational Psychology. 63-84. New York: Macmillan. 2. Zimmerman, B. J. (2000). Self-Efficacy: An Essential Motive to Learn. Contemporary
Educational Psychology, 25, 82-91. 3. Wentzel K and Asher S R, 1995, Academic lives of neglected, rejected, popular, and
controversial children’, Child Development, 66, pp 754-763 (1995). 4. Mueller, C.M. and Dweck, C.S. (1998). Praise for intelligence can undermine children’s
and performance. Journal of Personality and Social Psychology, 75 (1), 33-52. 5. Picard, R. W., Papert, S., Bender, W., Blumberg, B., Breazeal, C., Cavallo, D., Machover,
T., Resnick, M., Roy, D., Strohecker, C. (2004). Affective Learning--A Manifesto. BT Technical Journal, 2(4), 253-269.
6. Aleven, V., McLaren, B., Roll, I. & Koedinger, K. (2004). Toward Tutoring Help Seeking: Applying Cognitive Modeling to Meta-Cognitive Skills. In the Proceedings of the 7th International Conference on Intelligent Tutoring Systems (ITS-2004). Springer.
7. Zhou X. and Conati C. (2003). Inferring User Goals from Personality and Behavior in a Causal Model of User Affect . In Proceedings of the International Conference on Intelligent User Interfaces, pp. 211-218.
8. Baker, R., Corbett, A.T. and Koedinger, K.R. (2001). Toward a Model of Learning Data Representations. Proceedings of the Twenty-Third Annual Conference of the Cognitive Science Society, 45-50
9. Arroyo, I., Beal, C.R., Murray, T.,Walles, R., Woolf, B.P. (2004). Web-Based Intelligent Multimedia Tutoring for High Stakes Achievement Tests. In J. C. Lester, R. M. Vicari & F. Paraguaçu (Eds.), Intelligent Tutoring Systems, 7th International Conference, ITS 2004, (pp. 468-477). Maceiò, Alagoas, Brazil, Proceedings. Lecture Notes in Computer Science 3220: Springer 2004.
10. Arroyo, I., Ferguson, K., Johns, J., Dragon, T., Mehranian, H., Fisher, D., Barto, A., Mahadevan, S., Woolf, B. (2007). Repairing Disengagement With Non Invasive Interventions. International Conference on Artificial Intelligence in Education, Marina del Rey, CA.
11. Woolf, B., (2009) Building Intelligent Tutors: Bridging Theory and Practice. Elsevier Inc., Morgan Kauffman, San Francisco, CA.
12. Russell, S. and Norvig, P. (2002). Artificial Intelligence: A Modern Approach (2nd Edition). Chapter 14: Probabilistic Reasoning Systems.
13. Conati C. & Mclaren H. (2004). Evaluating A Probabilistic Model of Student Affect. Proceedings of ITS 2004, 7th International Conference on Intelligent Tutoring Systems, Lecture Notes in Computer Science, Volume 3220/2004, Springer Berlin / Heidelberg p. 55-66.
14. D’Mello, S. & Graesser, A. (2007). Mind and Body: Dialogue and Posture for Affect Detection in Learning Environments. Paper presented at the Frontiers in Artificial Intelligence and Applications.
15. Graesser, A. C. , Chipman, P., King, B., McDaniel, B., and D’Mello, S (2007). Emotions and Learning with AutoTutor. 13th International Conference on Artificial Intelligence in Education (AIED 2007). R. Luckin, K. Koedinger, and J. Greer (Eds), (pp 569-571). IOS Press.
16. D'Mello, S. K., Picard, R. W., and Graesser, A. C. (2007). Towards an Affect-Sensitive AutoTutor. Special issue on Intelligent Educational Systems IEEE Intelligent Systems, 22 (4), 53-61.

16
17. Ekman, P. (1999). Facial Expressions. New York: John Wiley & Sons Ltd. 18. Burleson, W. (2006). Affective Learning Companions: Strategies for Empathetic Agents
with Real-Time Multimodal Affective Sensing to Foster Meta-Cognitive Approaches to Learning, Motivation, and Perseverance. MIT PhD thesis.
19. Arroyo, I., Cooper, D.; Burleson, W., Woolf, B.P., Muldner, K., Christopherson, R. (2009a) Emotion Sensors Go To School. Proceedings of the 14th International Conference on Artificial Intelligence in Education: Building Learning Systems that Care: From Knowledge Representation to Affective Modelling. IOS Press. pp. 17-24.
20. Arroyo, I.; Muldner, K.; Burleson, W.; Woolf, B.P.; Cooper, D. (2009b) Designing Affective Support to Foster Learning, Motivation and Attribution. Workshop on Closing the Affective Loop in Intelligent Learning Environments. The 14th International Conference on Artificial Intelligence in Education.
21. Wigfield, A., and Karpathian, M. (1991). Who am I and what can I do? Children’s self-concepts and motivation in achievement solutions. Educational Psychologist, 26, 233–261.
22. Draper, N. and Smith, H. (1981) Applied Regression Analysis, 2d Edition, New York: John Wiley & Sons, Inc.
23. Cooper, D.; Arroyo, I.; Woolf, B.P.; Muldner, K.; Burleson, W.; Christopherson, R. (2009). Sensors Model Student Self Concept in the Classroom. International Conference on User Modeling and Adaptive Presentation (UMAP 2009).
24. Dragon, T., Arroyo, I., Woolf, B.P., Burleson, W., El Kaliouby, R., Eydgahi, H. (2008) Viewing Student Affect and Learning through Classroom Observation and Physical Sensors. Intelligent Tutoring Systems 2008: 29-39
25. El Kaliouby, R. (2005). Mind-Reading Machines: Automated Inference of Complex Mental States. Unpublished Ph. D. thesis, University of Cambridge.
26. Royer, J. M., & Walles, R. (2007). Influences of gender, motivation and socioeconomic status on mathematics performance. In D. B. Berch and M. M. M. Mazzocco, (Eds), Why is math so hard for some children. Baltimore, MD: Paul H. Brookes Publishing Co. (pp. 349-368).
27. Conati C. and Maclaren H (2009). Empirically Building and Evaluating a Probabilistic Model of User Affect. User Modeling and User-Adapted Interaction.

17
Goals/Attitudes while learning Seriously try learn. How seriously did you try to learn from the tutoring system? Get it over with (fast). I just wanted to get the session over with, so I went as fast as possible without paying much attention.
Challenge. I wanted to challenge myself: I wanted to see how many I could get right, asking as little help as possible. No care help. I wanted to get the correct answer, but didn’t care about the help or about learning with the software. Help fading attitude. I wanted to ask for help when necessary, but tried to become independent of help as time went by. Other approaches. I wanted to see other approaches to solving the problem, and thus asked for help even if I got it right. Fear of Wrong. I didn’t want to enter a wrong answer, so I asked for help before attempting an answer, even if I had a clear idea of what the answer could be.
Student Perceptions of the tutor. Learned? Do you think you learned how to tackle SAT-Math problems by using the system? Liked? How much did you like the system? Helpful? What did you think about the help in the system? Return? Would you use the system again if there were more problems and help for you to see? How many more times would you use it again? Interaction with the tutor. Audio? How much did you use the audio for the explanations?
Table 1. Post-tutor student Goals, Attitudes, and Perceptions

18
‘Fear of wrong’
‘Challenge’ Time between attempts
Cases Probability
Low 43 0.64 (1) False High 24 0.36 (2) Low 35 0.42 (3)
False
True High 48 0.58 (4) Low 8 0.50 (5) False High 8 0.50 (6) Low 7 0.32 (7)
True
True High 15 0.68 (8)
Table 2. Learning parameters to the BBN. Maximum likelihood to learn conditional probability tables for ‘fear of wrong’ attitude from students’ data

19
Cognitive-Affective Term
Emotion Scale Ekman’s Categorization
High Enjoyment Joy
Little Enjoyment
“I am enjoying this.” . . .
“This is not fun.”
High Frustration Anger
Little frustration
“I am very frustrated.” . .
“I am not frustrated at all.”
Interest/Novelty Interest and Surprise
Boredom/Dullness
“I am very interested.” . . .
“I am bored.” Anxiety Fear
Confidence
“I feel anxious” .. . .
“I feel very confident”
Table 4. Cognitive-affective terms based on human face studies (Ekman et al., 1972; Ekman 1999)
Attribute Accuracy Highly Certain Predictions
%Times P(T)>0.7 or P(T)<0.3
Get Over With? (Attitude) 0.89 96% Liked? (Perception) 0.82 80%
Learned? (Perception) 0.81 97% Fear of Wrong (Attitude) 0.81 83% No Care Help? (Attitude) 0.76 92%
Help Fading Attitude (Attitude) 0.76 41% Other Approaches (Attitude) 0.75 59%
Gain Pre-Post test (Cognitive Outcome) 0.72 37% Challenge Attitude 0.70 28%
Improved? (Cognitive Outcome) 0.69 57% Return? (Perception) 0.65 34%
Audio? (Cognitive Outcome) 0.58 57% Seriousness? (Attitude) 0.54 11%
Table 3: Accuracy of predictions, 10-fold cross validation

20
Table 6. Variables entered into each model. These are significant predictors of the emotion reported.
Tutor context
only Camera + Tutor
Seat + Tutor Wrist + Tutor Mouse + Tutor All Sensors + Tutor
Confident R=0.49, N=62 R=0.72, N=20 R=0.35, N=32 R=0.55, N=28 R=0.82, N=17
Frustrated R=0.53, N=69 R=0.63, N=25 R=0.68, N=25 R=0.56, N=45 R=0.54, N=44 R=0.72, N=37
Excited R=0.43, N=66 R=0.83, N=21 R=0.65, N=39 R=0.42, N=37 R=0.57, N=37 R=0.70, N=15
Interested R=0.37, N=94 R=0.54, N=36 R=0.28, N=51 R=0.33, N=51
Table 5. Each cell corresponds to a linear model to predict emotion self-reports. Models were generated using Stepwise Regression, and variables entered into the model are shown in Table 6.
The top row lists the feature sets that are available. The left column lists the emotional self-reports being predicted. R values correspond to the fit of the model (best fit models for each
emotion are in bold). N values vary because students may be missing data for a sensor. R values for Linear Regression Models (best fit models for each emotion in bold). Empty cells mean that
no fit model was found for that data set. N values vary because each case corresponds to one emotion report crossed with the data for each sensor –mean, minimum value and maximum value
corresponding to each sensor for the last problem before the report. Full data for all sensors is limited to a subset of students.
21
Figure 1. Part of the full network of correlations between latent and observed variables. Variables
that describe a student’s observed interaction style (light colored nodes) are correlated with the students’ latent attitudes, feelings and learning (dark nodes) derived from the survey. Line weight
indicates correlation: dashed line (- -) indicates a negative correlation; lines ( ___) indicate a positive correlation; thick lines indicate p<0.01 - light lines indicate correlations of p<0.05
figure
Figure 2. Part of the structure of a Bayesian Network to infer attitudes, perceptions and learning (light
gray nodes). The bottom (leaf) nodes are set as evidence.

22
Figure 3. Sensors used in the classroom (clockwise): Facial Expression Sensor; Conductance
Bracelet, Pressure Mouse and Posture Analysis Seat.
Figure 4: Variables that help predict self-report of emotions. The result suggest that emotion depends
on the context in which the emotion occurs (math problem just solved) and also can be predicted from physiological activity captured by the sensors (bottom row).
23
Figure 5. MindReader 25 Camera Software output stream (probabilities of concentrating or
thinking) for students reporting different confidence levels and frustration levels. The graphs show minutes of student activity before the self-report of high or low confidence/frustration.
Note students who are low confident are “concentrating” more than high confident ones. Students who are not frustrated are thinking frequently. Each contiguous line represents a single
student episode and the zero point on the X axis represents the moment of the report of confidence or frustration. The small letters (O, X, ?, F) indicate actions taken by the student
(Correct, Incorrect, Hint, Or Sit Forward.)