bbc newsbeat – teenagers and social media · pdf filebbc newsbeat – teenagers and...
TRANSCRIPT
BBC Newsbeat – Teenagers and Social Media Survey
METHODOLOGY NOTE
ComRes interviewed 1,015 British 15-18 year olds online between 21st and 28th August 2014. Data were weighted to be representative of all 15-18 year old Britons by age, gender and region. ComRes is a member of the British Polling Council and abides by its rules.
All press releases or other publications must be checked with ComRes before use. ComRes requires 48 hours to check a press release unless otherwise agreed.
To commission a voting intention poll or a public opinion survey please contact Katharine Peacock: [email protected]
To register for Pollwatch, a monthly newsletter update on the polls, please email: [email protected]

Table 1
Q1 What are your favourite online sites and apps?Base: All respondents
Youth Online Habits and Attitudes Survey Online Fieldwork: 21st – 28th August 2014
Page 1
Absolutes/col percents
Prepared by ComRes
Total Gender Age SEG Social media use Where online Education Feel at least most of time
Male Fe- male
15 16 17 18 AB C1 C2 DE More than every hour
At leastonce a
day
Less than daily
By themsel
ves
With other people
At school/ college
Not in educati
on
Lonely Depressed
Unweighted base 1,015 504 511 252 259 254 250 305 273 220 217 337 606 72 747 268 813 87 150 148
Weighted base 1,015 521 494 243 252 256 265 307 272 219 217 335 608 72 747 268 805 90 149 147
Facebook 828 423 404 192 204 205 227 245 227 173 183 273 517 37 608 220 651 77 125 131
82% 81% 82% 79% 81% 80% 86% 80% 83% 79% 84% 81% 85% 52% 81% 82% 81% 86% 84% 89%
Twitter 558 267 291 133 131 149 146 169 172 118 100 228 317 13 414 144 447 46 85 85
55% 51% 59% 55% 52% 58% 55% 55% 63% 54% 46% 68% 52% 18% 55% 54% 56% 51% 57% 58%
Snapchat 527 236 291 119 132 139 136 182 136 104 105 232 280 15 383 144 417 38 90 84
52% 45% 59% 49% 52% 54% 51% 59% 50% 48% 48% 69% 46% 21% 51% 54% 52% 42% 60% 57%
Instagram 482 192 290 118 129 125 110 152 136 111 84 214 258 10 341 141 392 34 75 72
48% 37% 59% 49% 51% 49% 42% 50% 50% 50% 39% 64% 42% 14% 46% 53% 49% 37% 50% 49%
WhatsApp 396 201 195 101 86 104 105 116 108 82 90 153 223 20 275 121 307 41 62 64
39% 39% 39% 42% 34% 41% 40% 38% 40% 38% 41% 46% 37% 27% 37% 45% 38% 45% 41% 44%
Tumblr 247 80 167 54 67 68 57 85 66 54 42 104 131 12 198 49 200 14 52 65
24% 15% 34% 22% 27% 27% 22% 28% 24% 25% 19% 31% 22% 17% 27% 18% 25% 16% 35% 44%
Xbox Live 225 175 50 66 60 52 47 65 57 46 57 86 126 14 170 55 192 20 32 31
22% 34% 10% 27% 24% 21% 18% 21% 21% 21% 26% 26% 21% 20% 23% 20% 24% 22% 21% 21%
Playstation Network 167 133 34 43 37 45 42 37 49 35 47 64 92 11 123 44 137 15 28 31
16% 25% 7% 18% 15% 18% 16% 12% 18% 16% 22% 19% 15% 15% 16% 16% 17% 16% 19% 21%
Minecraft 163 116 47 54 43 33 32 51 42 37 33 57 96 10 121 41 138 10 30 27
16% 22% 9% 22% 17% 13% 12% 17% 15% 17% 15% 17% 16% 14% 16% 15% 17% 11% 20% 18%
BBM 155 71 83 55 30 44 26 37 49 36 33 68 80 7 100 55 133 13 32 22
15% 14% 17% 23% 12% 17% 10% 12% 18% 17% 15% 20% 13% 10% 13% 21% 17% 15% 22% 15%
Ask FM 93 55 37 34 23 22 14 18 31 22 21 46 46 1 68 25 84 6 24 27
9% 11% 8% 14% 9% 9% 5% 6% 11% 10% 10% 14% 7% 1% 9% 9% 10% 7% 16% 18%

Table 1 Cont'd
Q1 What are your favourite online sites and apps?Base: All respondents
Youth Online Habits and Attitudes Survey Online Fieldwork: 21st – 28th August 2014
Page 2
Absolutes/col percents
Prepared by ComRes
Total Gender Age SEG Social media use Where online Education Feel at least most of time
Male Fe- male
15 16 17 18 AB C1 C2 DE More than every hour
At leastonce a
day
Less than daily
By themsel
ves
With other people
At school/ college
Not in educati
on
Lonely Depressed
Unweighted base 1,015 504 511 252 259 254 250 305 273 220 217 337 606 72 747 268 813 87 150 148
Weighted base 1,015 521 494 243 252 256 265 307 272 219 217 335 608 72 747 268 805 90 149 147
Other 99 51 48 17 35 25 23 29 22 25 23 32 49 18 84 15 87 5 15 15
10% 10% 10% 7% 14% 10% 9% 9% 8% 11% 11% 9% 8% 25% 11% 5% 11% 6% 10% 10%

Table 2
Q2 Why is being online important to you, if at all?Base: All respondents
Youth Online Habits and Attitudes Survey Online Fieldwork: 21st – 28th August 2014
Page 3
Absolutes/col percents
Prepared by ComRes
Total Gender Age SEG Social media use Where online Education Feel at least most of time
Male Fe- male
15 16 17 18 AB C1 C2 DE More than every hour
At leastonce a
day
Less than daily
By themsel
ves
With other people
At school/ college
Not in educati
on
Lonely Depressed
Unweighted base 1,015 504 511 252 259 254 250 305 273 220 217 337 606 72 747 268 813 87 150 148
Weighted base 1,015 521 494 243 252 256 265 307 272 219 217 335 608 72 747 268 805 90 149 147
For interacting with individual people (chatting to friends, making new friends, looking up ex-boyfriends/girlfriends etc.)
708 346 362 167 176 184 181 226 182 150 150 268 409 31 531 177 567 55 108 109
70% 66% 73% 69% 70% 72% 68% 74% 67% 68% 69% 80% 67% 43% 71% 66% 70% 61% 72% 74%
For social reasons 665 340 325 156 150 173 186 210 173 145 136 244 398 23 474 191 511 69 110 97
66% 65% 66% 64% 60% 67% 70% 69% 64% 66% 63% 73% 66% 31% 63% 71% 63% 77% 74% 66%
For interacting with social groups (chatting in blogs/forums, finding things out, posting photos/videos, arranging events)
557 280 277 126 142 146 143 183 156 113 104 225 312 20 419 139 445 43 83 87
55% 54% 56% 52% 57% 57% 54% 60% 57% 52% 48% 67% 51% 28% 56% 52% 55% 47% 56% 59%
For gaming 418 294 125 102 107 104 106 116 111 88 103 143 240 35 326 92 332 41 61 72
41% 56% 25% 42% 43% 40% 40% 38% 41% 40% 47% 43% 40% 49% 44% 34% 41% 45% 41% 49%
For my work 228 117 111 41 57 65 65 80 58 50 40 69 136 22 171 57 184 16 41 38
22% 22% 23% 17% 23% 25% 25% 26% 21% 23% 19% 21% 22% 31% 23% 21% 23% 18% 28% 26%
None of the above 13 6 7 2 4 3 5 3 4 5 2 - 8 6 10 4 11 2 - -
1% 1% 2% 1% 2% 1% 2% 1% 1% 2% 1% - 1% 8% 1% 1% 1% 2% - -

Table 3
Q3 How often are you online for social reasons (on social networking sites like Facebook or Instagram or gaming with other people online)?Base: All respondents
Youth Online Habits and Attitudes Survey Online Fieldwork: 21st – 28th August 2014
Page 4
Absolutes/col percents
Prepared by ComRes
Total Gender Age SEG Social media use Where online Education Feel at least most of time
Male Fe- male
15 16 17 18 AB C1 C2 DE More than every hour
At leastonce a
day
Less than daily
By themsel
ves
With other people
At school/ college
Not in educati
on
Lonely Depressed
Unweighted base 1,015 504 511 252 259 254 250 305 273 220 217 337 606 72 747 268 813 87 150 148
Weighted base 1,015 521 494 243 252 256 265 307 272 219 217 335 608 72 747 268 805 90 149 147
Every half hour 150 73 77 31 39 44 35 48 45 27 30 150 - - 105 45 126 10 31 31
15% 14% 16% 13% 15% 17% 13% 16% 16% 12% 14% 45% - - 14% 17% 16% 11% 21% 21%
Every hour 186 92 94 39 60 46 40 69 40 43 33 186 - - 137 48 149 13 39 32
18% 18% 19% 16% 24% 18% 15% 22% 15% 20% 15% 55% - - 18% 18% 19% 15% 26% 22%
5-10 times a day 437 213 224 105 98 112 123 132 118 93 94 - 437 - 322 116 338 41 56 56
43% 41% 45% 43% 39% 44% 46% 43% 43% 42% 43% - 72% - 43% 43% 42% 46% 38% 38%
Once a day 171 102 69 51 33 38 48 40 48 41 42 - 171 - 127 44 135 19 17 19
17% 20% 14% 21% 13% 15% 18% 13% 18% 19% 19% - 28% - 17% 16% 17% 21% 11% 13%
Not every day 48 25 23 12 16 9 11 11 15 11 11 - - 48 40 8 39 5 5 7
5% 5% 5% 5% 6% 3% 4% 4% 5% 5% 5% - - 67% 5% 3% 5% 6% 3% 5%
Hardly ever 18 12 7 4 3 5 6 7 3 3 5 - - 18 11 7 13 1 1 1
2% 2% 1% 2% 1% 2% 2% 2% 1% 1% 2% - - 25% 1% 3% 2% 1% 1% 1%
I never go online for social reasons 6 5 1 1 2 2 1 - 3 1 2 - - 6 6 - 5 1 - -
1% 1% 0% 0% 1% 1% 0% - 1% 0% 1% - - 8% 1% - 1% 1% - -

Table 4
Q5 Where are you mainly online, are you usually…Base: All respondents
Youth Online Habits and Attitudes Survey Online Fieldwork: 21st – 28th August 2014
Page 5
Absolutes/col percents
Prepared by ComRes
Total Gender Age SEG Social media use Where online Education Feel at least most of time
Male Fe- male
15 16 17 18 AB C1 C2 DE More than every hour
At leastonce a
day
Less than daily
By themsel
ves
With other people
At school/ college
Not in educati
on
Lonely Depressed
Unweighted base 1,015 504 511 252 259 254 250 305 273 220 217 337 606 72 747 268 813 87 150 148
Weighted base 1,015 521 494 243 252 256 265 307 272 219 217 335 608 72 747 268 805 90 149 147
In a room by yourself 747 394 353 164 193 195 195 236 204 154 153 242 448 57 747 - 592 65 123 118
74% 76% 71% 67% 77% 76% 74% 77% 75% 70% 70% 72% 74% 79% 100% - 74% 72% 82% 80%
In a room with other people in 268 127 141 79 59 61 70 71 68 66 64 93 160 15 - 268 213 25 26 29
26% 24% 29% 33% 23% 24% 26% 23% 25% 30% 30% 28% 26% 21% - 100% 26% 28% 18% 20%

Table 5
Q6 Where are you mainly online? Please think about how much time you spend online rather than how ofte n you check it.Base: All respondents
Youth Online Habits and Attitudes Survey Online Fieldwork: 21st – 28th August 2014
Page 6
Absolutes/col percents
Prepared by ComRes
Total Gender Age SEG Social media use Where online Education Feel at least most of time
Male Fe- male
15 16 17 18 AB C1 C2 DE More than every hour
At leastonce a
day
Less than daily
By themsel
ves
With other people
At school/ college
Not in educati
on
Lonely Depressed
Unweighted base 1,015 504 511 252 259 254 250 305 273 220 217 337 606 72 747 268 813 87 150 148
Weighted base 1,015 521 494 243 252 256 265 307 272 219 217 335 608 72 747 268 805 90 149 147
In your bedroom on a computer or games console 361 228 133 88 88 92 93 104 96 73 89 99 227 36 331 30 288 32 56 58
36% 44% 27% 36% 35% 36% 35% 34% 35% 33% 41% 29% 37% 50% 44% 11% 36% 35% 38% 39%
In a room in your house other than your bedroom (for example, on a family computer or a games console in theliving room)
177 93 84 41 49 44 44 56 39 44 38 42 119 17 93 84 146 19 21 20
17% 18% 17% 17% 19% 17% 16% 18% 14% 20% 17% 12% 20% 23% 12% 31% 18% 21% 14% 13%
On your phone wherever you may be at the time 455 184 271 109 110 117 118 145 123 99 88 188 250 17 312 142 353 39 66 63
45% 35% 55% 45% 44% 46% 45% 47% 45% 45% 40% 56% 41% 24% 42% 53% 44% 43% 44% 42%
On a computer at school 14 11 3 5 4 1 4 2 9 2 1 4 8 2 6 8 14 - 6 4
1% 2% 1% 2% 2% 0% 2% 1% 3% 1% 0% 1% 1% 3% 1% 3% 2% - 4% 3%
On a computer at work 7 4 3 - - 2 5 - 4 1 2 3 4 - 4 3 4 1 - 3
1% 1% 1% - - 1% 2% - 2% 0% 1% 1% 1% - 1% 1% 1% 1% - 2%

Table 6
Q7 When you are online in a room by yourself, check ing social networking sites or gaming with other pe ople other the internet, do you...?Base: All respondents
Youth Online Habits and Attitudes Survey Online Fieldwork: 21st – 28th August 2014
Page 7
Absolutes/col percents
Prepared by ComRes
Total Gender Age SEG Social media use Where online Education Feel at least most of time
Male Fe- male
15 16 17 18 AB C1 C2 DE More than every hour
At leastonce a
day
Less than daily
By themsel
ves
With other people
At school/ college
Not in educati
on
Lonely Depressed
Unweighted base 1,015 504 511 252 259 254 250 305 273 220 217 337 606 72 747 268 813 87 150 148
Weighted base 1,015 521 494 243 252 256 265 307 272 219 217 335 608 72 747 268 805 90 149 147
not care whether you are alone or not 446 219 227 109 116 120 101 131 125 89 100 161 254 31 318 128 367 37 57 56
44% 42% 46% 45% 46% 47% 38% 43% 46% 41% 46% 48% 42% 43% 43% 48% 46% 41% 39% 38%
feel more comfortable than when there are other people in the room too
267 165 102 72 66 64 64 78 76 54 58 103 152 12 198 68 225 17 46 50
26% 32% 21% 30% 26% 25% 24% 26% 28% 25% 27% 31% 25% 17% 27% 26% 28% 18% 31% 34%
find it’s easier to talk more openly 343 177 166 85 95 76 87 108 97 76 64 137 193 14 267 76 280 27 68 71
34% 34% 34% 35% 38% 30% 33% 35% 36% 34% 29% 41% 32% 19% 36% 29% 35% 30% 46% 48%
notice the difference when someone walks in 271 150 121 54 67 80 69 103 77 44 47 100 157 14 214 57 209 25 56 58
27% 29% 25% 22% 27% 31% 26% 34% 28% 20% 22% 30% 26% 19% 29% 21% 26% 27% 38% 39%
cut off from outside world 139 61 77 30 36 26 46 39 40 24 36 48 82 8 113 25 109 11 36 39
14% 12% 16% 12% 14% 10% 18% 13% 15% 11% 16% 14% 14% 11% 15% 9% 14% 12% 24% 26%
feel more connected to people/groups 268 150 118 71 76 63 58 83 73 68 44 113 144 12 215 54 229 16 48 46
26% 29% 24% 29% 30% 25% 22% 27% 27% 31% 20% 34% 24% 16% 29% 20% 28% 17% 33% 31%
feel less part of a group 58 29 29 14 17 10 17 15 19 12 12 19 35 4 46 12 45 5 19 18
6% 5% 6% 6% 7% 4% 6% 5% 7% 5% 5% 6% 6% 5% 6% 4% 6% 6% 13% 12%
None of the above 76 31 46 16 13 22 25 22 20 20 14 13 51 12 53 24 52 10 5 8
8% 6% 9% 7% 5% 8% 10% 7% 7% 9% 6% 4% 8% 16% 7% 9% 6% 11% 3% 5%

Table 7
Q8a Which of the following do you have active accou nts with, if any?Base: All respondents
Youth Online Habits and Attitudes Survey Online Fieldwork: 21st – 28th August 2014
Page 8
Absolutes/col percents
Prepared by ComRes
Total Gender Age SEG Social media use Where online Education Feel at least most of time
Male Fe- male
15 16 17 18 AB C1 C2 DE More than every hour
At leastonce a
day
Less than daily
By themsel
ves
With other people
At school/ college
Not in educati
on
Lonely Depressed
Unweighted base 1,015 504 511 252 259 254 250 305 273 220 217 337 606 72 747 268 813 87 150 148
Weighted base 1,015 521 494 243 252 256 265 307 272 219 217 335 608 72 747 268 805 90 149 147
Facebook 899 463 437 205 221 228 245 279 239 189 192 307 545 47 668 232 706 81 137 136
89% 89% 88% 85% 88% 89% 93% 91% 88% 86% 89% 92% 90% 65% 89% 86% 88% 90% 92% 92%
Twitter 630 307 323 141 155 168 165 201 184 126 119 250 359 20 468 162 505 46 107 99
62% 59% 65% 58% 62% 66% 62% 66% 68% 57% 55% 75% 59% 28% 63% 60% 63% 51% 72% 67%
Instagram 500 209 291 116 137 127 120 171 132 110 87 217 270 14 359 141 404 38 83 74
49% 40% 59% 48% 54% 50% 45% 56% 49% 50% 40% 65% 44% 19% 48% 53% 50% 42% 56% 51%
Snapchat 585 262 323 122 147 155 161 209 147 121 108 245 318 22 435 150 455 40 98 87
58% 50% 65% 50% 59% 60% 61% 68% 54% 55% 50% 73% 52% 31% 58% 56% 57% 44% 66% 59%
WhatsApp 463 225 238 115 102 119 127 141 130 89 104 192 250 21 326 137 359 43 76 72
46% 43% 48% 47% 41% 46% 48% 46% 48% 41% 48% 57% 41% 29% 44% 51% 45% 47% 51% 49%
Ask FM 135 67 68 36 44 35 20 33 42 26 34 73 60 2 108 27 120 10 31 33
13% 13% 14% 15% 18% 14% 8% 11% 16% 12% 15% 22% 10% 3% 14% 10% 15% 12% 21% 23%
BBM 198 97 101 62 48 48 40 53 56 44 46 91 102 5 131 67 167 19 38 28
20% 19% 21% 26% 19% 19% 15% 17% 20% 20% 21% 27% 17% 7% 18% 25% 21% 21% 26% 19%
Tumblr 281 98 183 60 82 75 64 103 76 55 47 122 149 10 226 55 232 13 59 68
28% 19% 37% 25% 33% 29% 24% 33% 28% 25% 22% 36% 25% 14% 30% 21% 29% 15% 40% 46%
Gaming platforms such as Xbox Live or Playstation Network
299 233 66 81 80 72 65 80 74 60 84 112 167 21 237 62 250 22 47 47
29% 45% 13% 33% 32% 28% 25% 26% 27% 28% 39% 33% 27% 29% 32% 23% 31% 25% 31% 32%
None of these 23 19 5 8 4 7 4 6 5 5 7 - 11 13 16 8 19 3 2 3
2% 4% 1% 3% 2% 3% 2% 2% 2% 2% 3% - 2% 18% 2% 3% 2% 3% 1% 2%

Table 8
Q8b Roughly how many friends, followers or contacts do you have on each of the following...FacebookBase: All who have an account with site
Youth Online Habits and Attitudes Survey Online Fieldwork: 21st – 28th August 2014
Page 9
Absolutes/col percents
Prepared by ComRes
Total Gender Age SEG Social media use Where online Education Feel at least most of time
Male Fe- male
15 16 17 18 AB C1 C2 DE More than every hour
At leastonce a
day
Less than daily
By themsel
ves
With other people
At school/ college
Not in educati
on
Lonely Depressed
Unweighted base 898 448 450 213 228 226 231 277 240 189 192 309 542 47 667 231 713 78 137 136
Weighted base 899 463 437 205 221 228 245 279 239 189 192 307 545 47 668 232 706 81 137 136
Mean 369.52 365.78 373.48 325.13 409.16 382.67 358.66 339.22 341.18 382.11 436.44 401.14 366.13 201.19 366.22 379.00 359.72 402.28 364.60 388.84
Standard deviation 557.36 688.75 370.31 440.36 765.79 580.59 362.55 288.85 476.05 498.48 894.08 372.19 652.89 242.69 583.13 475.35 535.32 582.65 525.79 546.26
Standard error 36.42 62.75 34.73 60.25 100.89 75.38 45.39 33.87 60.32 71.13 126.38 41.61 54.80 69.54 44.24 61.17 39.49 126.50 88.20 91.85

Table 9
Q8b Roughly how many friends, followers or contacts do you have on each of the following...TwitterBase: All who have an account with site
Youth Online Habits and Attitudes Survey Online Fieldwork: 21st – 28th August 2014
Page 10
Absolutes/col percents
Prepared by ComRes
Total Gender Age SEG Social media use Where online Education Feel at least most of time
Male Fe- male
15 16 17 18 AB C1 C2 DE More than every hour
At leastonce a
day
Less than daily
By themsel
ves
With other people
At school/ college
Not in educati
on
Lonely Depressed
Unweighted base 631 297 334 146 160 168 157 201 185 127 118 252 359 20 468 163 511 44 108 99
Weighted base 630 307 323 141 155 168 165 201 184 126 119 250 359 20 468 162 505 46 107 99
Mean 458.71 413.46 501.61 773.97 490.58 326.55 293.12 609.19 387.51 412.55 362.74 728.50 289.77 122.96 516.05 293.15 510.79 209.54 435.76 429.56
Standard deviation 2,177.88
2,802.31
1,338.02
4,190.28
1,547.61
530.92 615.44 3,556.07
990.40 1,157.00
850.90 3,340.40
674.27 220.73 2,505.51
525.96 2,418.12
222.65 1,363.17
1,166.01
Standard error 170.09 313.70 145.86 690.47 243.57 80.19 93.96 491.26 143.13 202.05 153.14 413.88 69.73 95.97 227.06 80.98 210.82 64.15 258.00 229.86

Table 10
Q8b Roughly how many friends, followers or contacts do you have on each of the following...InstagramBase: All who have an account with site
Youth Online Habits and Attitudes Survey Online Fieldwork: 21st – 28th August 2014
Page 11
Absolutes/col percents
Prepared by ComRes
Total Gender Age SEG Social media use Where online Education Feel at least most of time
Male Fe- male
15 16 17 18 AB C1 C2 DE More than every hour
At leastonce a
day
Less than daily
By themsel
ves
With other people
At school/ college
Not in educati
on
Lonely Depressed
Unweighted base 504 202 302 122 142 126 114 172 133 112 87 220 271 13 361 143 411 37 84 75
Weighted base 500 209 291 116 137 127 120 171 132 110 87 217 270 14 359 141 404 38 83 74
Mean 343.62 362.50 330.03 325.11 494.78 378.06 152.81 350.63 308.20 237.98 517.78 408.41 306.15 53.96 358.24 306.54 367.55 160.58 553.05 520.78
Standard deviation 1,013.87
1,062.48
977.17 667.45 1,474.40
1,092.69
217.42 1,188.31
733.31 385.89 1,444.02
1,242.91
809.52 54.50 1,106.61
725.97 1,070.88
198.39 1,898.18
1,399.20
Standard error 88.84 143.92 112.29 121.24 247.16 189.89 38.91 177.97 125.04 72.08 303.84 165.45 96.58 28.98 114.50 119.65 104.46 62.82 407.96 317.77

Table 11
Q8b Roughly how many friends, followers or contacts do you have on each of the following...SnapchatBase: All who have an account with site
Youth Online Habits and Attitudes Survey Online Fieldwork: 21st – 28th August 2014
Page 12
Absolutes/col percents
Prepared by ComRes
Total Gender Age SEG Social media use Where online Education Feel at least most of time
Male Fe- male
15 16 17 18 AB C1 C2 DE More than every hour
At leastonce a
day
Less than daily
By themsel
ves
With other people
At school/ college
Not in educati
on
Lonely Depressed
Unweighted base 588 253 335 128 154 153 153 209 149 122 108 247 319 22 437 151 463 39 99 89
Weighted base 585 262 323 122 147 155 161 209 147 121 108 245 318 22 435 150 455 40 98 87
Mean 56.54 72.45 43.60 49.38 56.82 84.30 34.99 43.14 48.89 34.90 116.84 55.43 58.80 36.36 61.02 43.58 44.52 46.80 42.56 39.27
Standard deviation 297.04 432.37 87.11 72.80 122.41 558.38 41.72 81.01 87.94 43.41 667.95 98.63 392.98 63.73 342.67 59.90 82.59 62.34 100.71 58.53
Standard error 24.07 52.32 9.51 12.92 19.76 87.94 6.45 10.98 14.23 7.74 125.71 12.36 43.18 26.55 32.21 9.57 7.59 19.27 19.94 12.28

Table 12
Q8b Roughly how many friends, followers or contacts do you have on each of the following...WhatsappBase: All who have an account with site
Youth Online Habits and Attitudes Survey Online Fieldwork: 21st – 28th August 2014
Page 13
Absolutes/col percents
Prepared by ComRes
Total Gender Age SEG Social media use Where online Education Feel at least most of time
Male Fe- male
15 16 17 18 AB C1 C2 DE More than every hour
At leastonce a
day
Less than daily
By themsel
ves
With other people
At school/ college
Not in educati
on
Lonely Depressed
Unweighted base 464 217 247 120 105 118 121 139 130 91 104 194 250 20 326 138 364 41 77 72
Weighted base 463 225 238 115 102 119 127 141 130 89 104 192 250 21 326 137 359 43 76 72
Mean 64.88 93.50 37.81 49.14 38.33 120.36 48.56 58.89 43.01 48.64 114.39 57.29 73.51 30.80 71.72 48.61 45.76 31.33 48.36 43.21
Standard deviation 334.32 474.81 52.69 75.52 44.32 642.79 100.91 111.06 55.96 120.41 680.74 102.98 445.47 36.13 395.71 70.55 81.46 27.25 123.10 71.98
Standard error 30.44 62.01 6.69 13.82 8.59 115.52 17.53 18.35 9.62 25.01 131.08 14.55 55.19 15.60 42.95 11.80 8.43 8.18 27.67 16.59

Table 13
Q8b Roughly how many friends, followers or contacts do you have on each of the following...AskFMBase: All who have an account with site
Youth Online Habits and Attitudes Survey Online Fieldwork: 21st – 28th August 2014
Page 14
Absolutes/col percents
Prepared by ComRes
Total Gender Age SEG Social media use Where online Education Feel at least most of time
Male Fe- male
15 16 17 18 AB C1 C2 DE More than every hour
At leastonce a
day
Less than daily
By themsel
ves
With other people
At school/ college
Not in educati
on
Lonely Depressed
Unweighted base 136 65 71 37 46 34 19 33 42 27 34 73 61 2 109 27 122 10 31 34
Weighted base 135 67 68 36 44 35 20 33 42 26 34 73 60 2 108 27 120 10 31 33
Mean 111.30 150.97 72.39 60.33 243.43 43.17 31.10 115.41 41.85 44.81 246.39 75.94 158.22 128.85 40.85 121.54 32.35 54.16 85.23
Standard deviation 601.60 813.10 255.71 94.55 1,033.23
87.64 45.38 365.74 52.16 57.79 1,135.90
252.32 856.18 670.70 52.69 636.41 39.37 97.80 166.61
Standard error 101.47 194.90 60.70 31.06 304.93 28.99 19.78 124.60 15.73 22.16 384.27 57.92 216.65 126.43 19.90 113.71 23.83 34.63 56.46

Table 14
Q8b Roughly how many friends, followers or contacts do you have on each of the following...BBMBase: All who have an account with site
Youth Online Habits and Attitudes Survey Online Fieldwork: 21st – 28th August 2014
Page 15
Absolutes/col percents
Prepared by ComRes
Total Gender Age SEG Social media use Where online Education Feel at least most of time
Male Fe- male
15 16 17 18 AB C1 C2 DE More than every hour
At leastonce a
day
Less than daily
By themsel
ves
With other people
At school/ college
Not in educati
on
Lonely Depressed
Unweighted base 198 93 105 64 49 47 38 52 56 45 45 91 102 5 131 67 169 18 39 28
Weighted base 198 97 101 62 48 48 40 53 56 44 46 91 102 5 131 67 167 19 38 28
Mean 93.79 142.74 47.06 58.35 82.75 196.75 38.03 74.60 45.18 30.82 236.26 61.94 125.63 24.00 109.75 62.69 55.85 50.04 46.34 40.13
Standard deviation 506.13 716.40 79.42 87.12 209.77 990.82 57.80 203.78 44.86 31.99 1,017.14
155.84 687.64 17.09 609.35 174.47 127.46 72.67 76.01 52.08
Standard error 70.50 142.80 15.47 21.66 59.57 279.80 17.90 54.96 11.79 9.45 295.42 32.09 133.36 14.59 104.42 41.73 19.31 33.04 24.11 19.34

Table 15
Q8b Roughly how many friends, followers or contacts do you have on each of the following...TumblrBase: All who have an account with site
Youth Online Habits and Attitudes Survey Online Fieldwork: 21st – 28th August 2014
Page 16
Absolutes/col percents
Prepared by ComRes
Total Gender Age SEG Social media use Where online Education Feel at least most of time
Male Fe- male
15 16 17 18 AB C1 C2 DE More than every hour
At leastonce a
day
Less than daily
By themsel
ves
With other people
At school/ college
Not in educati
on
Lonely Depressed
Unweighted base 284 94 190 62 86 74 62 104 76 57 47 123 151 10 228 56 236 13 61 69
Weighted base 281 98 183 60 82 75 64 103 76 55 47 122 149 10 226 55 232 13 59 68
Mean 449.10 176.32 594.19 196.54 428.72 860.18 228.40 896.44 153.75 242.73 190.94 769.17 212.92 78.42 502.65 231.19 486.64 93.02 221.97 193.16
Standard deviation 3,271.51
523.66 4,023.55
475.44 2,214.22
5,823.47
615.27 5,351.07
422.03 471.95 376.65 4,921.08
496.09 115.42 3,642.10 467.40 3,586.46 193.07 505.66 362.00
Standard error 382.49 103.90 582.23 120.63 478.64 1,316.94
150.70 1,034.58
94.91 124.17 107.90 874.08 79.61 71.19 475.27 123.03 461.63 103.33 129.12 86.02

Table 16
Q8b Roughly how many friends, followers or contacts do you have on each of the following...Gaming platforms such as XBox Live or Playstation N etworkBase: All who have an account with site
Youth Online Habits and Attitudes Survey Online Fieldwork: 21st – 28th August 2014
Page 17
Absolutes/col percents
Prepared by ComRes
Total Gender Age SEG Social media use Where online Education Feel at least most of time
Male Fe- male
15 16 17 18 AB C1 C2 DE More than every hour
At leastonce a
day
Less than daily
By themsel
ves
With other people
At school/ college
Not in educati
on
Lonely Depressed
Unweighted base 296 228 68 83 81 72 60 79 74 60 83 111 164 21 235 61 250 21 47 48
Weighted base 299 233 66 81 80 72 65 80 74 60 84 112 167 21 237 62 250 22 47 47
Mean 64.57 75.63 25.37 38.41 27.77 167.19 28.26 23.84 38.64 30.75 150.66 123.58 30.08 23.63 70.85 40.67 71.64 32.38 243.56 242.89
Standard deviation 574.28 649.53 35.07 43.82 26.72 1,158.52
28.46 24.53 48.82 26.10 1,076.92
935.49 34.49 24.82 644.64 50.33 627.38 34.86 1,435.84
1,427.28
Standard error 65.12 83.39 8.48 9.55 5.86 266.75 6.90 5.38 11.09 6.58 230.33 173.53 5.24 10.72 82.14 12.51 77.77 14.46 411.41 406.51

Table 17
Q9 Roughly how many of your friends on social media do you regularly meet with in person?Base: All respondents
Youth Online Habits and Attitudes Survey Online Fieldwork: 21st – 28th August 2014
Page 18
Absolutes/col percents
Prepared by ComRes
Total Gender Age SEG Social media use Where online Education Feel at least most of time
Male Fe- male
15 16 17 18 AB C1 C2 DE More than every hour
At leastonce a
day
Less than daily
By themsel
ves
With other people
At school/ college
Not in educati
on
Lonely Depressed
Unweighted base 1,015 504 511 252 259 254 250 305 273 220 217 337 606 72 747 268 813 87 150 148
Weighted base 1,015 521 494 243 252 256 265 307 272 219 217 335 608 72 747 268 805 90 149 147
None 24 13 11 4 9 5 5 5 8 4 7 4 10 10 17 7 20 2 5 3
2% 2% 2% 2% 4% 2% 2% 2% 3% 2% 3% 1% 2% 14% 2% 3% 2% 2% 3% 2%
A few 254 115 139 57 56 68 72 68 60 57 69 84 148 21 184 70 199 33 53 49
25% 22% 28% 24% 22% 27% 27% 22% 22% 26% 32% 25% 24% 29% 25% 26% 25% 36% 36% 33%
Some 319 161 158 58 79 75 106 97 76 68 77 102 208 9 237 82 237 27 37 40
31% 31% 32% 24% 32% 29% 40% 32% 28% 31% 36% 30% 34% 12% 32% 31% 29% 30% 25% 27%
About half 192 97 95 56 49 48 39 65 61 37 30 70 112 11 149 43 159 12 30 33
19% 19% 19% 23% 20% 19% 15% 21% 22% 17% 14% 21% 18% 15% 20% 16% 20% 13% 20% 23%
Almost all 175 104 71 45 47 49 33 57 52 42 24 63 98 13 121 53 145 14 17 15
17% 20% 14% 19% 19% 19% 13% 19% 19% 19% 11% 19% 16% 19% 16% 20% 18% 16% 11% 10%
All 45 29 16 20 8 10 6 16 11 8 9 10 27 7 34 11 39 2 6 6
4% 6% 3% 8% 3% 4% 2% 5% 4% 4% 4% 3% 4% 10% 4% 4% 5% 2% 4% 4%
Don't know 7 2 5 2 2 1 3 - 4 3 1 2 4 1 5 2 6 - 1 1
1% 0% 1% 1% 1% 0% 1% - 1% 1% 0% 1% 1% 1% 1% 1% 1% - 1% 1%

Table 18
Q10 How do you feel when you don’t check in regular ly with your friends online?Base: All respondents
Youth Online Habits and Attitudes Survey Online Fieldwork: 21st – 28th August 2014
Page 19
Absolutes/col percents
Prepared by ComRes
Total Gender Age SEG Social media use Where online Education Feel at least most of time
Male Fe- male
15 16 17 18 AB C1 C2 DE More than every hour
At leastonce a
day
Less than daily
By themsel
ves
With other people
At school/ college
Not in educati
on
Lonely Depressed
Unweighted base 1,015 504 511 252 259 254 250 305 273 220 217 337 606 72 747 268 813 87 150 148
Weighted base 1,015 521 494 243 252 256 265 307 272 219 217 335 608 72 747 268 805 90 149 147
Like you might be missing out on something 387 179 208 91 100 101 95 128 109 77 73 165 213 9 287 100 319 23 75 65
38% 34% 42% 38% 40% 40% 36% 42% 40% 35% 34% 49% 35% 12% 38% 37% 40% 26% 50% 44%
Not at all bothered 362 210 152 87 83 104 88 118 100 70 74 89 232 41 266 96 284 39 43 47
36% 40% 31% 36% 33% 41% 33% 39% 37% 32% 34% 26% 38% 57% 36% 36% 35% 43% 29% 32%
A sense of curiosity 313 137 176 71 82 75 86 100 87 61 66 117 185 12 247 66 256 21 59 54
31% 26% 36% 29% 33% 29% 32% 33% 32% 28% 30% 35% 30% 16% 33% 25% 32% 23% 40% 37%
Like you should be checking to see what’s going on 289 130 159 65 87 73 63 84 85 66 54 139 143 7 210 79 251 16 46 49
28% 25% 32% 27% 35% 29% 24% 27% 31% 30% 25% 41% 24% 10% 28% 30% 31% 17% 31% 33%
Disconnected 240 108 132 47 66 55 72 84 58 56 42 101 129 10 182 58 195 13 54 46
24% 21% 27% 19% 26% 22% 27% 27% 21% 25% 19% 30% 21% 13% 24% 22% 24% 15% 37% 31%
Worried 57 26 31 8 14 17 19 15 19 11 13 35 21 1 42 15 47 5 20 20
6% 5% 6% 3% 5% 7% 7% 5% 7% 5% 6% 10% 4% 1% 6% 6% 6% 6% 14% 14%
Stressed 38 15 23 8 5 8 17 10 13 6 8 18 19 1 26 12 31 3 11 8
4% 3% 5% 3% 2% 3% 6% 3% 5% 3% 4% 5% 3% 1% 3% 5% 4% 3% 7% 5%
Upset 30 10 20 7 5 11 8 9 11 6 5 13 17 - 22 8 25 3 14 15
3% 2% 4% 3% 2% 4% 3% 3% 4% 3% 2% 4% 3% - 3% 3% 3% 3% 9% 10%
None of the above 52 32 20 13 11 13 15 8 17 14 13 12 31 10 33 19 39 5 4 3
5% 6% 4% 5% 4% 5% 6% 3% 6% 6% 6% 3% 5% 13% 4% 7% 5% 5% 3% 2%

Table 19
Q11 How important if at all are each of the followi ng to you personally - The number of friends/followers I have onlineBase: All respondents
Youth Online Habits and Attitudes Survey Online Fieldwork: 21st – 28th August 2014
Page 20
Absolutes/col percents
Prepared by ComRes
Total Gender Age SEG Social media use Where online Education Feel at least most of time
Male Fe- male
15 16 17 18 AB C1 C2 DE More than every hour
At leastonce a
day
Less than daily
By themsel
ves
With other people
At school/ college
Not in educati
on
Lonely Depressed
Unweighted base 1,015 504 511 252 259 254 250 305 273 220 217 337 606 72 747 268 813 87 150 148
Weighted base 1,015 521 494 243 252 256 265 307 272 219 217 335 608 72 747 268 805 90 149 147
Very important 58 32 26 18 14 13 13 14 21 9 12 31 26 - 35 22 50 2 17 15
6% 6% 5% 7% 6% 5% 5% 5% 8% 4% 6% 9% 4% - 5% 8% 6% 2% 11% 10%
Fairly important 224 115 109 65 64 47 48 68 66 53 37 88 128 8 166 58 193 17 40 42
22% 22% 22% 27% 26% 18% 18% 22% 24% 24% 17% 26% 21% 11% 22% 21% 24% 19% 27% 28%
Not very important 421 211 209 98 106 107 110 124 109 91 96 131 261 29 306 115 321 45 52 55
41% 41% 42% 40% 42% 42% 41% 40% 40% 42% 44% 39% 43% 40% 41% 43% 40% 50% 35% 37%
Not at all important 306 164 143 60 67 88 92 100 73 63 71 86 187 34 235 71 235 26 40 34
30% 31% 29% 25% 26% 34% 35% 32% 27% 29% 33% 26% 31% 48% 32% 27% 29% 28% 27% 23%
Don’t know 7 - 7 3 1 1 2 1 2 3 1 - 6 1 4 3 6 - - 1
1% - 1% 1% 0% 0% 1% 0% 1% 1% 0% - 1% 1% 1% 1% 1% - - 1%
Net: Important 281 146 135 82 78 60 61 82 88 62 49 119 155 8 202 80 243 19 56 57
28% 28% 27% 34% 31% 23% 23% 27% 32% 28% 23% 35% 25% 11% 27% 30% 30% 21% 38% 39%
Net: Not important 727 375 352 158 172 195 202 224 182 154 167 216 448 63 541 186 556 71 92 89
72% 72% 71% 65% 69% 76% 76% 73% 67% 70% 77% 65% 74% 88% 72% 69% 69% 79% 62% 61%

Table 20
Q11 How important if at all are each of the followi ng to you personally - The number of friends I have in personBase: All respondents
Youth Online Habits and Attitudes Survey Online Fieldwork: 21st – 28th August 2014
Page 21
Absolutes/col percents
Prepared by ComRes
Total Gender Age SEG Social media use Where online Education Feel at least most of time
Male Fe- male
15 16 17 18 AB C1 C2 DE More than every hour
At leastonce a
day
Less than daily
By themsel
ves
With other people
At school/ college
Not in educati
on
Lonely Depressed
Unweighted base 1,015 504 511 252 259 254 250 305 273 220 217 337 606 72 747 268 813 87 150 148
Weighted base 1,015 521 494 243 252 256 265 307 272 219 217 335 608 72 747 268 805 90 149 147
Very important 253 131 122 69 61 73 51 85 68 60 41 95 147 11 186 67 206 21 36 32
25% 25% 25% 28% 24% 28% 19% 28% 25% 27% 19% 28% 24% 16% 25% 25% 26% 23% 24% 22%
Fairly important 418 213 205 98 107 93 120 121 116 85 96 126 261 31 303 116 324 35 56 49
41% 41% 42% 40% 43% 36% 45% 40% 43% 39% 44% 38% 43% 44% 41% 43% 40% 38% 38% 33%
Not very important 247 127 120 57 62 61 68 80 61 51 56 87 140 21 185 62 201 21 36 44
24% 24% 24% 24% 25% 24% 26% 26% 22% 23% 26% 26% 23% 29% 25% 23% 25% 23% 24% 30%
Not at all important 86 45 41 17 19 28 23 20 25 20 23 24 55 7 65 21 65 14 19 22
9% 9% 8% 7% 8% 11% 9% 6% 9% 9% 10% 7% 9% 10% 9% 8% 8% 16% 13% 15%
Don’t know 10 4 6 2 3 2 3 1 3 4 2 3 6 1 8 2 9 - 1 -
1% 1% 1% 1% 1% 1% 1% 0% 1% 2% 1% 1% 1% 1% 1% 1% 1% - 1% -
Net: Important 672 345 327 167 168 166 171 206 184 145 137 221 408 43 489 183 530 55 93 81
66% 66% 66% 69% 67% 65% 65% 67% 68% 66% 63% 66% 67% 59% 65% 68% 66% 61% 62% 55%
Net: Not important 333 172 161 74 81 88 90 100 85 70 78 111 194 28 250 84 266 35 55 67
33% 33% 33% 30% 32% 35% 34% 33% 31% 32% 36% 33% 32% 39% 33% 31% 33% 39% 37% 45%

Table 21
Q11 How important if at all are each of the followi ng to you personally - The number of likes/retweets/comments I get on when I post something onlineBase: All respondents
Youth Online Habits and Attitudes Survey Online Fieldwork: 21st – 28th August 2014
Page 22
Absolutes/col percents
Prepared by ComRes
Total Gender Age SEG Social media use Where online Education Feel at least most of time
Male Fe- male
15 16 17 18 AB C1 C2 DE More than every hour
At leastonce a
day
Less than daily
By themsel
ves
With other people
At school/ college
Not in educati
on
Lonely Depressed
Unweighted base 1,015 504 511 252 259 254 250 305 273 220 217 337 606 72 747 268 813 87 150 148
Weighted base 1,015 521 494 243 252 256 265 307 272 219 217 335 608 72 747 268 805 90 149 147
Very important 67 36 31 17 15 22 13 13 26 17 11 37 28 2 42 24 58 5 14 10
7% 7% 6% 7% 6% 9% 5% 4% 9% 8% 5% 11% 5% 3% 6% 9% 7% 6% 9% 7%
Fairly important 296 153 143 82 76 66 72 100 76 54 67 102 185 9 208 88 250 20 58 55
29% 29% 29% 34% 30% 26% 27% 32% 28% 25% 31% 30% 30% 12% 28% 33% 31% 22% 39% 38%
Not very important 374 187 187 81 94 93 105 115 92 87 80 116 233 24 285 89 275 42 42 47
37% 36% 38% 34% 37% 36% 40% 37% 34% 40% 37% 35% 38% 34% 38% 33% 34% 46% 28% 32%
Not at all important 270 142 128 60 65 73 73 78 77 59 55 77 157 36 203 67 214 24 34 34
27% 27% 26% 25% 26% 28% 27% 26% 28% 27% 26% 23% 26% 50% 27% 25% 27% 26% 23% 23%
Don’t know 9 4 5 3 2 2 2 1 2 2 4 3 5 1 9 - 8 - 2 1
1% 1% 1% 1% 1% 1% 1% 0% 1% 1% 2% 1% 1% 1% 1% - 1% - 1% 1%
Net: Important 363 188 174 99 91 88 85 113 101 70 78 139 213 11 250 112 308 25 71 65
36% 36% 35% 41% 36% 35% 32% 37% 37% 32% 36% 41% 35% 15% 34% 42% 38% 27% 48% 44%
Net: Not important 643 329 315 141 159 165 178 193 168 147 135 193 390 60 487 156 489 66 75 81
63% 63% 64% 58% 63% 65% 67% 63% 62% 67% 62% 58% 64% 84% 65% 58% 61% 73% 51% 55%

Table 22
Q11 How important if at all are each of the followi ng to you personally - Going out with friendsBase: All respondents
Youth Online Habits and Attitudes Survey Online Fieldwork: 21st – 28th August 2014
Page 23
Absolutes/col percents
Prepared by ComRes
Total Gender Age SEG Social media use Where online Education Feel at least most of time
Male Fe- male
15 16 17 18 AB C1 C2 DE More than every hour
At leastonce a
day
Less than daily
By themsel
ves
With other people
At school/ college
Not in educati
on
Lonely Depressed
Unweighted base 1,015 504 511 252 259 254 250 305 273 220 217 337 606 72 747 268 813 87 150 148
Weighted base 1,015 521 494 243 252 256 265 307 272 219 217 335 608 72 747 268 805 90 149 147
Very important 373 177 196 79 87 106 101 128 98 75 71 154 207 12 272 101 284 28 52 45
37% 34% 40% 33% 35% 41% 38% 42% 36% 34% 33% 46% 34% 16% 36% 38% 35% 31% 35% 31%
Fairly important 468 243 225 112 117 114 124 137 126 111 94 122 301 44 344 124 375 45 58 60
46% 47% 46% 46% 47% 45% 47% 45% 46% 51% 43% 37% 50% 62% 46% 46% 47% 50% 39% 41%
Not very important 123 74 48 35 34 26 29 29 36 22 36 40 73 10 89 34 106 8 25 26
12% 14% 10% 14% 13% 10% 11% 9% 13% 10% 16% 12% 12% 14% 12% 13% 13% 8% 17% 17%
Not at all important 44 27 17 13 14 10 7 10 10 8 16 18 21 5 37 6 35 9 14 15
4% 5% 3% 5% 6% 4% 3% 3% 4% 4% 7% 5% 3% 7% 5% 2% 4% 9% 10% 10%
Don’t know 8 1 7 4 - - 4 3 2 2 1 1 6 1 4 4 5 1 - 1
1% 0% 1% 2% - - 1% 1% 1% 1% 0% 0% 1% 1% 1% 1% 1% 1% - 1%
Net: Important 841 419 422 192 204 220 225 265 224 187 165 277 508 56 616 225 659 73 110 105
83% 80% 85% 79% 81% 86% 85% 86% 82% 85% 76% 83% 84% 78% 83% 84% 82% 81% 74% 71%
Net: Not important 167 101 66 48 47 36 36 39 46 31 51 57 94 15 127 40 141 16 39 41
16% 19% 13% 20% 19% 14% 13% 13% 17% 14% 24% 17% 16% 21% 17% 15% 18% 18% 26% 28%

Table 23
Q11 How important if at all are each of the followi ng to you personally - Regularly speaking to friends from home/schoolBase: All respondents
Youth Online Habits and Attitudes Survey Online Fieldwork: 21st – 28th August 2014
Page 24
Absolutes/col percents
Prepared by ComRes
Total Gender Age SEG Social media use Where online Education Feel at least most of time
Male Fe- male
15 16 17 18 AB C1 C2 DE More than every hour
At leastonce a
day
Less than daily
By themsel
ves
With other people
At school/ college
Not in educati
on
Lonely Depressed
Unweighted base 1,015 504 511 252 259 254 250 305 273 220 217 337 606 72 747 268 813 87 150 148
Weighted base 1,015 521 494 243 252 256 265 307 272 219 217 335 608 72 747 268 805 90 149 147
Very important 311 143 169 72 84 90 65 98 101 63 49 125 172 14 215 97 254 17 38 37
31% 27% 34% 30% 33% 35% 25% 32% 37% 29% 23% 37% 28% 20% 29% 36% 32% 18% 25% 25%
Fairly important 549 292 257 133 136 126 153 161 129 126 132 161 342 46 413 136 425 56 71 73
54% 56% 52% 55% 54% 49% 58% 53% 48% 58% 61% 48% 56% 64% 55% 51% 53% 62% 48% 50%
Not very important 113 69 44 28 21 28 36 38 28 23 24 33 71 8 87 26 91 12 29 29
11% 13% 9% 12% 8% 11% 14% 12% 10% 10% 11% 10% 12% 12% 12% 10% 11% 14% 20% 19%
Not at all important 34 15 19 7 10 10 7 7 11 6 11 12 19 3 28 6 30 4 9 7
3% 3% 4% 3% 4% 4% 3% 2% 4% 3% 5% 4% 3% 5% 4% 2% 4% 5% 6% 5%
Don’t know 8 2 6 3 - 2 3 3 3 1 1 4 4 - 4 4 6 1 2 2
1% 0% 1% 1% - 1% 1% 1% 1% 0% 0% 1% 1% - 1% 1% 1% 1% 1% 1%
Net: Important 860 435 425 205 220 216 218 259 230 189 181 286 514 60 628 233 679 72 109 110
85% 83% 86% 85% 88% 84% 82% 85% 85% 86% 83% 85% 85% 84% 84% 87% 84% 80% 73% 74%
Net: Not important 147 84 63 35 31 38 43 44 39 29 35 45 90 12 115 32 121 17 38 36
14% 16% 13% 14% 12% 15% 16% 14% 14% 13% 16% 14% 15% 16% 15% 12% 15% 19% 26% 24%

Table 24
Q11 How important if at all are each of the followi ng to you personally - Regularly speaking to friends online, even if I’ve never met themBase: All respondents
Youth Online Habits and Attitudes Survey Online Fieldwork: 21st – 28th August 2014
Page 25
Absolutes/col percents
Prepared by ComRes
Total Gender Age SEG Social media use Where online Education Feel at least most of time
Male Fe- male
15 16 17 18 AB C1 C2 DE More than every hour
At leastonce a
day
Less than daily
By themsel
ves
With other people
At school/ college
Not in educati
on
Lonely Depressed
Unweighted base 1,015 504 511 252 259 254 250 305 273 220 217 337 606 72 747 268 813 87 150 148
Weighted base 1,015 521 494 243 252 256 265 307 272 219 217 335 608 72 747 268 805 90 149 147
Very important 95 54 41 22 24 26 23 27 28 25 16 50 44 1 68 27 80 8 21 23
9% 10% 8% 9% 9% 10% 9% 9% 10% 11% 7% 15% 7% 1% 9% 10% 10% 9% 14% 15%
Fairly important 326 173 153 79 81 87 79 79 88 79 81 121 188 18 254 72 269 26 50 45
32% 33% 31% 33% 32% 34% 30% 26% 32% 36% 37% 36% 31% 25% 34% 27% 33% 29% 34% 30%
Not very important 315 161 154 79 84 76 75 102 86 68 58 102 192 20 220 95 248 35 41 45
31% 31% 31% 32% 33% 30% 28% 33% 32% 31% 27% 31% 32% 28% 29% 35% 31% 39% 28% 31%
Not at all important 248 110 137 54 55 60 79 88 63 45 52 57 162 28 184 63 184 21 29 27
24% 21% 28% 22% 22% 23% 30% 29% 23% 20% 24% 17% 27% 39% 25% 24% 23% 23% 19% 19%
Don’t know 31 22 9 9 8 7 7 11 7 3 10 5 21 5 20 11 24 1 8 7
3% 4% 2% 4% 3% 3% 3% 4% 2% 1% 5% 1% 4% 7% 3% 4% 3% 1% 6% 5%
Net: Important 421 228 194 101 105 113 103 106 116 103 96 171 232 19 322 99 348 34 71 67
42% 44% 39% 42% 42% 44% 39% 34% 43% 47% 44% 51% 38% 26% 43% 37% 43% 37% 48% 46%
Net: Not important 562 271 291 133 139 136 155 190 149 112 111 159 355 48 404 158 432 56 70 73
55% 52% 59% 55% 55% 53% 58% 62% 55% 51% 51% 48% 58% 67% 54% 59% 54% 61% 47% 49%
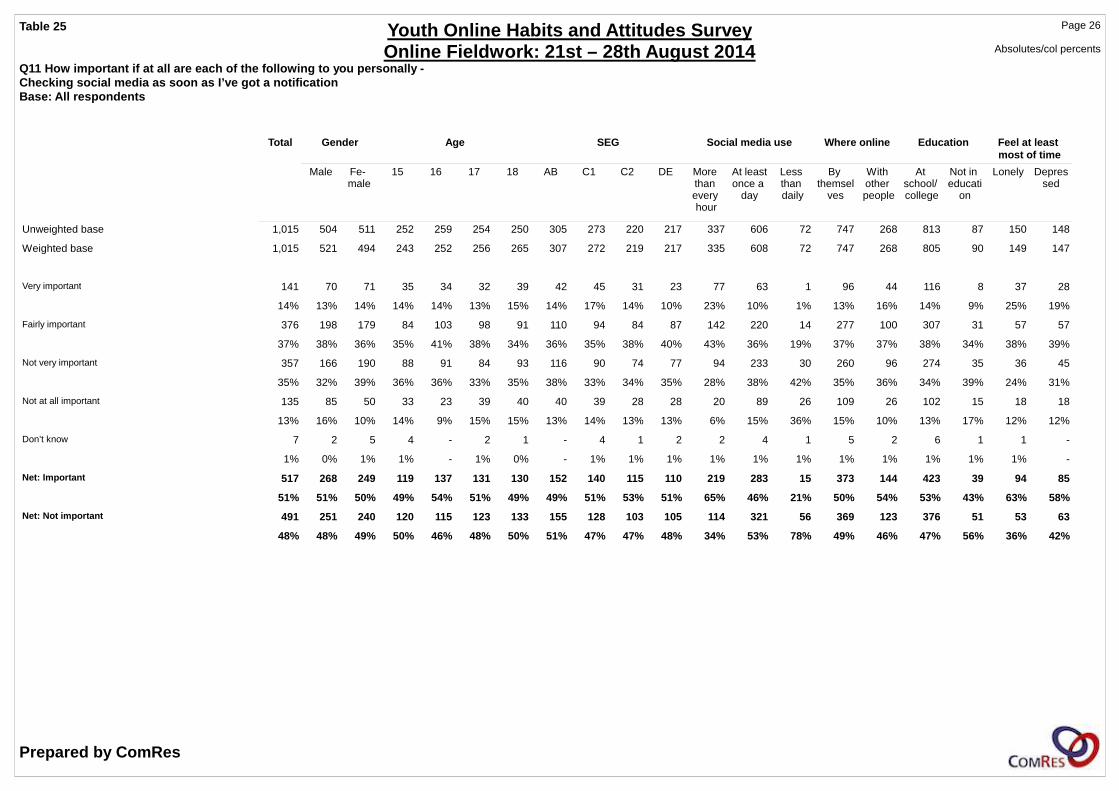
Table 25
Q11 How important if at all are each of the followi ng to you personally - Checking social media as soon as I’ve got a notific ationBase: All respondents
Youth Online Habits and Attitudes Survey Online Fieldwork: 21st – 28th August 2014
Page 26
Absolutes/col percents
Prepared by ComRes
Total Gender Age SEG Social media use Where online Education Feel at least most of time
Male Fe- male
15 16 17 18 AB C1 C2 DE More than every hour
At leastonce a
day
Less than daily
By themsel
ves
With other people
At school/ college
Not in educati
on
Lonely Depressed
Unweighted base 1,015 504 511 252 259 254 250 305 273 220 217 337 606 72 747 268 813 87 150 148
Weighted base 1,015 521 494 243 252 256 265 307 272 219 217 335 608 72 747 268 805 90 149 147
Very important 141 70 71 35 34 32 39 42 45 31 23 77 63 1 96 44 116 8 37 28
14% 13% 14% 14% 14% 13% 15% 14% 17% 14% 10% 23% 10% 1% 13% 16% 14% 9% 25% 19%
Fairly important 376 198 179 84 103 98 91 110 94 84 87 142 220 14 277 100 307 31 57 57
37% 38% 36% 35% 41% 38% 34% 36% 35% 38% 40% 43% 36% 19% 37% 37% 38% 34% 38% 39%
Not very important 357 166 190 88 91 84 93 116 90 74 77 94 233 30 260 96 274 35 36 45
35% 32% 39% 36% 36% 33% 35% 38% 33% 34% 35% 28% 38% 42% 35% 36% 34% 39% 24% 31%
Not at all important 135 85 50 33 23 39 40 40 39 28 28 20 89 26 109 26 102 15 18 18
13% 16% 10% 14% 9% 15% 15% 13% 14% 13% 13% 6% 15% 36% 15% 10% 13% 17% 12% 12%
Don’t know 7 2 5 4 - 2 1 - 4 1 2 2 4 1 5 2 6 1 1 -
1% 0% 1% 1% - 1% 0% - 1% 1% 1% 1% 1% 1% 1% 1% 1% 1% 1% -
Net: Important 517 268 249 119 137 131 130 152 140 115 110 219 283 15 373 144 423 39 94 85
51% 51% 50% 49% 54% 51% 49% 49% 51% 53% 51% 65% 46% 21% 50% 54% 53% 43% 63% 58%
Net: Not important 491 251 240 120 115 123 133 155 128 103 105 114 321 56 369 123 376 51 53 63
48% 48% 49% 50% 46% 48% 50% 51% 47% 47% 48% 34% 53% 78% 49% 46% 47% 56% 36% 42%

Table 26
Q12 Please select each of the following statements that applies to you.Base: All respondents
Youth Online Habits and Attitudes Survey Online Fieldwork: 21st – 28th August 2014
Page 27
Absolutes/col percents
Prepared by ComRes
Total Gender Age SEG Social media use Where online Education Feel at least most of time
Male Fe- male
15 16 17 18 AB C1 C2 DE More than every hour
At leastonce a
day
Less than daily
By themsel
ves
With other people
At school/ college
Not in educati
on
Lonely Depressed
Unweighted base 1,015 504 511 252 259 254 250 305 273 220 217 337 606 72 747 268 813 87 150 148
Weighted base 1,015 521 494 243 252 256 265 307 272 219 217 335 608 72 747 268 805 90 149 147
Talking to people online is easier than in person 435 231 204 104 128 103 99 133 115 92 96 174 246 15 329 105 367 30 89 90
43% 44% 41% 43% 51% 40% 38% 43% 42% 42% 44% 52% 40% 21% 44% 39% 46% 33% 60% 61%
I have lots of friends/followers online that I’ve never met in person
381 179 202 81 100 100 100 108 101 88 83 158 216 7 284 97 308 35 72 73
38% 34% 41% 33% 40% 39% 38% 35% 37% 40% 38% 47% 36% 10% 38% 36% 38% 39% 48% 50%
It is easier to say how I feel online than when talking to someone in person
371 176 195 81 105 100 84 118 100 79 74 161 200 9 293 77 309 30 80 90
37% 34% 39% 34% 42% 39% 32% 38% 37% 36% 34% 48% 33% 13% 39% 29% 38% 33% 54% 61%
I don’t speak to most of my online friends in person 269 131 138 50 69 73 78 68 75 62 64 102 157 11 205 64 219 24 61 55
27% 25% 28% 21% 27% 28% 29% 22% 28% 28% 30% 30% 26% 15% 27% 24% 27% 27% 41% 37%
I prefer talking to people online than in person 200 97 103 49 65 41 44 55 50 52 43 94 99 6 149 50 171 15 52 52
20% 19% 21% 20% 26% 16% 17% 18% 18% 24% 20% 28% 16% 8% 20% 19% 21% 17% 35% 36%
I would hate my parents to see my Facebook page 149 86 63 39 37 39 34 37 46 38 28 66 80 3 113 36 122 15 34 43
15% 16% 13% 16% 15% 15% 13% 12% 17% 17% 13% 20% 13% 4% 15% 14% 15% 17% 23% 29%
My friends online know me better than people I know in person
131 57 74 34 35 31 31 38 34 28 30 67 63 1 97 35 110 12 43 35
13% 11% 15% 14% 14% 12% 12% 12% 13% 13% 14% 20% 10% 1% 13% 13% 14% 13% 29% 24%
People I only speak to online aren’t my real friends 121 65 56 27 25 35 35 33 42 21 25 39 68 15 88 33 99 8 26 21
12% 12% 11% 11% 10% 14% 13% 11% 16% 10% 11% 12% 11% 21% 12% 12% 12% 9% 18% 14%
My friends online are worth more to me than people I know in person
75 39 36 22 23 17 13 15 20 16 23 35 37 3 62 14 69 5 30 31
7% 8% 7% 9% 9% 6% 5% 5% 8% 7% 11% 11% 6% 4% 8% 5% 9% 6% 20% 21%
None of these 209 106 103 59 47 41 62 72 47 49 42 43 130 36 139 71 151 20 8 5
21% 20% 21% 24% 19% 16% 23% 23% 17% 22% 19% 13% 21% 51% 19% 26% 19% 22% 6% 3%

Table 27
Q13 Do each of the following statements apply to yo u or not -I think some of my friends are addicted to online s ocial networking sitesBase: All respondents
Youth Online Habits and Attitudes Survey Online Fieldwork: 21st – 28th August 2014
Page 28
Absolutes/col percents
Prepared by ComRes
Total Gender Age SEG Social media use Where online Education Feel at least most of time
Male Fe- male
15 16 17 18 AB C1 C2 DE More than every hour
At leastonce a
day
Less than daily
By themsel
ves
With other people
At school/ college
Not in educati
on
Lonely Depressed
Unweighted base 1,015 504 511 252 259 254 250 305 273 220 217 337 606 72 747 268 813 87 150 148
Weighted base 1,015 521 494 243 252 256 265 307 272 219 217 335 608 72 747 268 805 90 149 147
Applies to you 634 328 306 165 157 149 163 198 166 132 139 220 367 46 464 170 499 58 108 102
62% 63% 62% 68% 62% 58% 61% 64% 61% 60% 64% 66% 60% 65% 62% 63% 62% 64% 73% 69%
Does not apply to you 280 151 128 58 73 80 68 85 76 63 56 83 178 18 202 78 230 20 30 35
28% 29% 26% 24% 29% 31% 26% 28% 28% 29% 26% 25% 29% 26% 27% 29% 29% 22% 20% 24%
Don’t know 102 42 60 20 22 26 34 24 30 24 22 32 62 7 81 21 76 13 10 10
10% 8% 12% 8% 9% 10% 13% 8% 11% 11% 10% 10% 10% 10% 11% 8% 9% 14% 7% 7%

Table 28
Q13 Do each of the following statements apply to yo u or not -I think I am addicted to social mediaBase: All respondents
Youth Online Habits and Attitudes Survey Online Fieldwork: 21st – 28th August 2014
Page 29
Absolutes/col percents
Prepared by ComRes
Total Gender Age SEG Social media use Where online Education Feel at least most of time
Male Fe- male
15 16 17 18 AB C1 C2 DE More than every hour
At leastonce a
day
Less than daily
By themsel
ves
With other people
At school/ college
Not in educati
on
Lonely Depressed
Unweighted base 1,015 504 511 252 259 254 250 305 273 220 217 337 606 72 747 268 813 87 150 148
Weighted base 1,015 521 494 243 252 256 265 307 272 219 217 335 608 72 747 268 805 90 149 147
Applies to you 232 111 122 59 59 58 56 64 61 51 56 119 111 2 170 62 194 17 55 54
23% 21% 25% 24% 23% 22% 21% 21% 22% 23% 26% 36% 18% 3% 23% 23% 24% 19% 37% 36%
Does not apply to you 697 372 325 161 173 173 189 226 190 136 146 187 445 65 514 183 541 63 84 83
69% 71% 66% 66% 69% 68% 72% 74% 70% 62% 67% 56% 73% 90% 69% 68% 67% 70% 56% 56%
Don’t know 86 39 47 23 19 25 19 17 21 32 16 28 52 5 63 23 69 11 10 11
8% 7% 10% 9% 8% 10% 7% 5% 8% 15% 7% 8% 9% 7% 8% 9% 9% 12% 7% 7%

Table 29
Q13 Do each of the following statements apply to yo u or not -I post stuff online to try and get as many likes/re tweets etc as possibleBase: All respondents
Youth Online Habits and Attitudes Survey Online Fieldwork: 21st – 28th August 2014
Page 30
Absolutes/col percents
Prepared by ComRes
Total Gender Age SEG Social media use Where online Education Feel at least most of time
Male Fe- male
15 16 17 18 AB C1 C2 DE More than every hour
At leastonce a
day
Less than daily
By themsel
ves
With other people
At school/ college
Not in educati
on
Lonely Depressed
Unweighted base 1,015 504 511 252 259 254 250 305 273 220 217 337 606 72 747 268 813 87 150 148
Weighted base 1,015 521 494 243 252 256 265 307 272 219 217 335 608 72 747 268 805 90 149 147
Applies to you 197 106 91 51 36 60 49 60 60 36 40 83 109 5 134 63 160 15 43 37
19% 20% 18% 21% 14% 24% 18% 20% 22% 17% 18% 25% 18% 7% 18% 23% 20% 17% 29% 25%
Does not apply to you 751 384 367 172 199 180 200 227 193 165 166 232 454 64 560 191 590 70 100 101
74% 74% 74% 71% 79% 70% 75% 74% 71% 75% 76% 69% 75% 89% 75% 71% 73% 78% 67% 68%
Don’t know 68 32 36 20 16 15 16 19 19 18 12 20 45 3 53 15 55 5 6 10
7% 6% 7% 8% 6% 6% 6% 6% 7% 8% 5% 6% 7% 4% 7% 6% 7% 6% 4% 7%

Table 30
Q13 Do each of the following statements apply to yo u or not -I often check my social media when I am out with fr iends or familyBase: All respondents
Youth Online Habits and Attitudes Survey Online Fieldwork: 21st – 28th August 2014
Page 31
Absolutes/col percents
Prepared by ComRes
Total Gender Age SEG Social media use Where online Education Feel at least most of time
Male Fe- male
15 16 17 18 AB C1 C2 DE More than every hour
At leastonce a
day
Less than daily
By themsel
ves
With other people
At school/ college
Not in educati
on
Lonely Depressed
Unweighted base 1,015 504 511 252 259 254 250 305 273 220 217 337 606 72 747 268 813 87 150 148
Weighted base 1,015 521 494 243 252 256 265 307 272 219 217 335 608 72 747 268 805 90 149 147
Applies to you 591 278 313 148 146 151 146 183 160 127 121 262 316 12 414 176 482 40 94 96
58% 53% 63% 61% 58% 59% 55% 60% 59% 58% 56% 78% 52% 17% 55% 66% 60% 44% 63% 65%
Does not apply to you 373 218 155 85 93 87 108 114 90 84 84 61 256 56 292 81 281 48 51 43
37% 42% 31% 35% 37% 34% 41% 37% 33% 38% 39% 18% 42% 78% 39% 30% 35% 54% 34% 29%
Don’t know 51 25 26 10 12 18 11 9 22 8 12 12 35 4 40 11 42 2 4 9
5% 5% 5% 4% 5% 7% 4% 3% 8% 4% 6% 3% 6% 6% 5% 4% 5% 2% 3% 6%

Table 31
Q13 Do each of the following statements apply to yo u or not -My friends/family tell me I am online too muchBase: All respondents
Youth Online Habits and Attitudes Survey Online Fieldwork: 21st – 28th August 2014
Page 32
Absolutes/col percents
Prepared by ComRes
Total Gender Age SEG Social media use Where online Education Feel at least most of time
Male Fe- male
15 16 17 18 AB C1 C2 DE More than every hour
At leastonce a
day
Less than daily
By themsel
ves
With other people
At school/ college
Not in educati
on
Lonely Depressed
Unweighted base 1,015 504 511 252 259 254 250 305 273 220 217 337 606 72 747 268 813 87 150 148
Weighted base 1,015 521 494 243 252 256 265 307 272 219 217 335 608 72 747 268 805 90 149 147
Applies to you 373 201 172 113 86 86 88 111 98 85 79 154 200 18 277 96 311 27 79 77
37% 39% 35% 46% 34% 34% 33% 36% 36% 39% 36% 46% 33% 25% 37% 36% 39% 30% 53% 52%
Does not apply to you 568 280 288 118 151 141 157 179 157 107 125 157 362 49 412 156 437 55 60 59
56% 54% 58% 49% 60% 55% 59% 58% 58% 49% 57% 47% 60% 68% 55% 58% 54% 61% 40% 40%
Don’t know 75 40 34 12 14 29 19 16 18 27 14 24 46 5 58 17 57 8 9 11
7% 8% 7% 5% 6% 11% 7% 5% 6% 12% 6% 7% 7% 7% 8% 6% 7% 9% 6% 7%

Table 32
Q13 Do each of the following statements apply to yo u or not -I sometimes wish I could give up social mediaBase: All respondents
Youth Online Habits and Attitudes Survey Online Fieldwork: 21st – 28th August 2014
Page 33
Absolutes/col percents
Prepared by ComRes
Total Gender Age SEG Social media use Where online Education Feel at least most of time
Male Fe- male
15 16 17 18 AB C1 C2 DE More than every hour
At leastonce a
day
Less than daily
By themsel
ves
With other people
At school/ college
Not in educati
on
Lonely Depressed
Unweighted base 1,015 504 511 252 259 254 250 305 273 220 217 337 606 72 747 268 813 87 150 148
Weighted base 1,015 521 494 243 252 256 265 307 272 219 217 335 608 72 747 268 805 90 149 147
Applies to you 256 122 135 60 66 60 70 82 59 60 56 87 152 17 189 68 203 20 60 53
25% 23% 27% 25% 26% 23% 27% 27% 22% 27% 26% 26% 25% 24% 25% 25% 25% 22% 40% 36%
Does not apply to you 649 349 300 153 161 165 170 197 179 135 138 216 387 46 479 171 508 63 76 80
64% 67% 61% 63% 64% 65% 64% 64% 66% 62% 64% 65% 64% 64% 64% 64% 63% 70% 51% 54%
Don’t know 110 50 59 30 25 31 24 28 34 24 23 31 69 9 79 30 94 8 13 15
11% 10% 12% 12% 10% 12% 9% 9% 13% 11% 11% 9% 11% 12% 11% 11% 12% 9% 9% 10%

Table 33
Q13 Do each of the following statements apply to yo u or not -I have met someone in person that I first met throu gh social mediaBase: All respondents
Youth Online Habits and Attitudes Survey Online Fieldwork: 21st – 28th August 2014
Page 34
Absolutes/col percents
Prepared by ComRes
Total Gender Age SEG Social media use Where online Education Feel at least most of time
Male Fe- male
15 16 17 18 AB C1 C2 DE More than every hour
At leastonce a
day
Less than daily
By themsel
ves
With other people
At school/ college
Not in educati
on
Lonely Depressed
Unweighted base 1,015 504 511 252 259 254 250 305 273 220 217 337 606 72 747 268 813 87 150 148
Weighted base 1,015 521 494 243 252 256 265 307 272 219 217 335 608 72 747 268 805 90 149 147
Applies to you 365 191 174 73 81 112 99 97 96 89 83 165 192 9 270 96 284 42 69 73
36% 37% 35% 30% 32% 44% 37% 32% 35% 41% 38% 49% 32% 13% 36% 36% 35% 46% 46% 50%
Does not apply to you 612 310 301 159 162 135 156 199 162 122 128 156 394 61 453 159 487 47 72 66
60% 60% 61% 66% 64% 53% 59% 65% 60% 56% 59% 47% 65% 85% 61% 59% 61% 52% 48% 45%
Don’t know 38 20 18 11 8 9 10 11 13 7 6 14 22 2 24 14 33 2 8 8
4% 4% 4% 4% 3% 4% 4% 4% 5% 3% 3% 4% 4% 3% 3% 5% 4% 2% 6% 5%

Table 34
Q13 Do each of the following statements apply to yo u or not -I hate it when I’m online and my parents come and l ook at what I’m doingBase: All respondents
Youth Online Habits and Attitudes Survey Online Fieldwork: 21st – 28th August 2014
Page 35
Absolutes/col percents
Prepared by ComRes
Total Gender Age SEG Social media use Where online Education Feel at least most of time
Male Fe- male
15 16 17 18 AB C1 C2 DE More than every hour
At leastonce a
day
Less than daily
By themsel
ves
With other people
At school/ college
Not in educati
on
Lonely Depressed
Unweighted base 1,015 504 511 252 259 254 250 305 273 220 217 337 606 72 747 268 813 87 150 148
Weighted base 1,015 521 494 243 252 256 265 307 272 219 217 335 608 72 747 268 805 90 149 147
Applies to you 566 266 300 130 151 138 148 198 148 122 98 221 316 29 430 136 452 44 106 98
56% 51% 61% 53% 60% 54% 56% 64% 55% 56% 45% 66% 52% 40% 58% 51% 56% 49% 71% 67%
Does not apply to you 410 232 178 106 93 108 103 98 115 85 112 106 264 40 287 123 325 42 40 48
40% 44% 36% 43% 37% 42% 39% 32% 42% 39% 52% 32% 43% 55% 38% 46% 40% 46% 27% 33%
Don’t know 39 24 15 7 8 10 14 11 9 12 8 8 28 3 30 9 28 4 3 1
4% 5% 3% 3% 3% 4% 5% 4% 3% 5% 4% 2% 5% 4% 4% 3% 3% 5% 2% 1%

Table 35
Q14 How often, if ever, do you feel any of the foll owing emotions -LonelyBase: All respondents
Youth Online Habits and Attitudes Survey Online Fieldwork: 21st – 28th August 2014
Page 36
Absolutes/col percents
Prepared by ComRes
Total Gender Age SEG Social media use Where online Education Feel at least most of time
Male Fe- male
15 16 17 18 AB C1 C2 DE More than every hour
At leastonce a
day
Less than daily
By themsel
ves
With other people
At school/ college
Not in educati
on
Lonely Depressed
Unweighted base 1,015 504 511 252 259 254 250 305 273 220 217 337 606 72 747 268 813 87 150 148
Weighted base 1,015 521 494 243 252 256 265 307 272 219 217 335 608 72 747 268 805 90 149 147
All the time 48 21 27 12 14 11 11 6 14 9 19 21 24 2 40 8 39 7 48 39
5% 4% 5% 5% 5% 4% 4% 2% 5% 4% 9% 6% 4% 3% 5% 3% 5% 8% 32% 27%
Most of the time 101 37 64 24 18 26 33 34 21 22 24 48 48 4 83 18 84 7 101 48
10% 7% 13% 10% 7% 10% 12% 11% 8% 10% 11% 14% 8% 6% 11% 7% 10% 8% 68% 32%
Sometimes 399 175 225 80 106 107 106 127 110 80 82 129 247 24 295 105 313 32 - 46
39% 33% 46% 33% 42% 42% 40% 41% 40% 37% 38% 38% 41% 33% 39% 39% 39% 35% - 31%
Hardly ever 287 164 123 75 75 66 72 104 61 68 55 73 189 25 208 80 224 31 - 9
28% 32% 25% 31% 30% 26% 27% 34% 22% 31% 25% 22% 31% 35% 28% 30% 28% 34% - 6%
Never 169 120 49 49 38 42 39 34 61 39 34 61 91 16 114 55 137 13 - 3
17% 23% 10% 20% 15% 17% 15% 11% 23% 18% 16% 18% 15% 22% 15% 20% 17% 15% - 2%
Don’t know 11 4 7 3 1 3 4 2 5 1 3 2 8 1 8 3 8 - - 2
1% 1% 1% 1% 0% 1% 2% 1% 2% 1% 1% 1% 1% 1% 1% 1% 1% - - 1%
Net: At least most of the time 149 58 90 36 32 37 44 40 35 31 43 70 73 6 123 26 123 14 149 87
15% 11% 18% 15% 13% 15% 17% 13% 13% 14% 20% 21% 12% 9% 16% 10% 15% 16% 100% 59%
Net: At least sometimes 548 233 315 116 138 145 150 167 145 111 125 198 320 30 417 131 436 46 149 134
54% 45% 64% 48% 55% 57% 57% 54% 53% 51% 57% 59% 53% 41% 56% 49% 54% 51% 100% 91%

Table 36
Q14 How often, if ever, do you feel any of the foll owing emotions -DepressedBase: All respondents
Youth Online Habits and Attitudes Survey Online Fieldwork: 21st – 28th August 2014
Page 37
Absolutes/col percents
Prepared by ComRes
Total Gender Age SEG Social media use Where online Education Feel at least most of time
Male Fe- male
15 16 17 18 AB C1 C2 DE More than every hour
At leastonce a
day
Less than daily
By themsel
ves
With other people
At school/ college
Not in educati
on
Lonely Depressed
Unweighted base 1,015 504 511 252 259 254 250 305 273 220 217 337 606 72 747 268 813 87 150 148
Weighted base 1,015 521 494 243 252 256 265 307 272 219 217 335 608 72 747 268 805 90 149 147
All the time 42 16 26 10 12 8 12 1 10 14 17 23 15 4 36 6 34 5 34 42
4% 3% 5% 4% 5% 3% 5% 0% 4% 6% 8% 7% 3% 6% 5% 2% 4% 6% 23% 28%
Most of the time 106 40 66 22 22 26 36 35 30 18 22 41 61 4 82 24 81 14 54 106
10% 8% 13% 9% 9% 10% 14% 12% 11% 8% 10% 12% 10% 6% 11% 9% 10% 15% 36% 72%
Sometimes 318 143 175 60 78 92 89 107 82 62 67 111 190 17 240 78 247 26 42 -
31% 27% 35% 25% 31% 36% 34% 35% 30% 28% 31% 33% 31% 23% 32% 29% 31% 29% 28% -
Hardly ever 310 170 140 74 81 78 77 93 80 67 69 87 196 27 232 78 248 29 12 -
30% 33% 28% 31% 32% 30% 29% 30% 29% 31% 32% 26% 32% 37% 31% 29% 31% 32% 8% -
Never 226 145 81 74 56 51 46 68 66 55 37 71 136 19 145 81 184 16 7 -
22% 28% 16% 30% 22% 20% 17% 22% 24% 25% 17% 21% 22% 27% 19% 30% 23% 18% 5% -
Don’t know 14 7 7 4 4 2 4 3 3 3 5 3 10 1 12 2 12 - 1 -
1% 1% 1% 2% 2% 1% 2% 1% 1% 1% 2% 1% 2% 1% 2% 1% 1% - 1% -
Net: At least most of the time 147 56 91 32 33 34 49 36 40 32 39 63 76 8 118 29 115 19 87 147
15% 11% 19% 13% 13% 13% 18% 12% 15% 15% 18% 19% 12% 12% 16% 11% 14% 21% 59% 100%
Net: At least sometimes 465 199 266 91 111 126 138 143 122 94 106 175 266 25 358 107 362 45 129 147
46% 38% 54% 38% 44% 49% 52% 47% 45% 43% 49% 52% 44% 35% 48% 40% 45% 50% 87% 100%

Table 37
Q14 How often, if ever, do you feel any of the foll owing emotions -HappyBase: All respondents
Youth Online Habits and Attitudes Survey Online Fieldwork: 21st – 28th August 2014
Page 38
Absolutes/col percents
Prepared by ComRes
Total Gender Age SEG Social media use Where online Education Feel at least most of time
Male Fe- male
15 16 17 18 AB C1 C2 DE More than every hour
At leastonce a
day
Less than daily
By themsel
ves
With other people
At school/ college
Not in educati
on
Lonely Depressed
Unweighted base 1,015 504 511 252 259 254 250 305 273 220 217 337 606 72 747 268 813 87 150 148
Weighted base 1,015 521 494 243 252 256 265 307 272 219 217 335 608 72 747 268 805 90 149 147
All the time 89 51 38 27 20 26 17 21 38 16 14 34 51 4 58 31 75 6 16 17
9% 10% 8% 11% 8% 10% 6% 7% 14% 7% 6% 10% 8% 5% 8% 11% 9% 7% 11% 11%
Most of the time 550 288 262 136 143 135 135 174 145 128 102 185 320 45 395 154 426 49 31 24
54% 55% 53% 56% 57% 53% 51% 57% 54% 58% 47% 55% 53% 62% 53% 57% 53% 54% 21% 16%
Sometimes 293 146 148 62 72 72 88 95 64 58 76 93 187 13 232 62 242 21 62 64
29% 28% 30% 25% 29% 28% 33% 31% 24% 27% 35% 28% 31% 18% 31% 23% 30% 24% 42% 43%
Hardly ever 61 23 38 13 13 18 18 12 16 12 21 19 35 7 48 14 44 11 34 37
6% 4% 8% 5% 5% 7% 7% 4% 6% 5% 10% 6% 6% 10% 6% 5% 5% 13% 23% 25%
Never 15 10 5 3 3 5 4 3 6 2 4 4 9 2 7 8 13 2 6 6
1% 2% 1% 1% 1% 2% 2% 1% 2% 1% 2% 1% 2% 3% 1% 3% 2% 2% 4% 4%
Don’t know 7 3 4 3 1 1 2 2 2 2 1 - 6 1 7 - 4 1 - -
1% 1% 1% 1% 0% 0% 1% 1% 1% 1% 0% - 1% 1% 1% - 0% 1% - -
Net: At least most of the time 638 339 299 162 163 161 152 195 183 144 115 219 371 49 453 185 502 54 47 41
63% 65% 61% 67% 65% 63% 57% 64% 67% 66% 53% 65% 61% 67% 61% 69% 62% 60% 32% 28%
Net: At least sometimes 931 485 447 224 235 232 240 290 247 203 191 312 558 62 685 247 744 76 109 104
92% 93% 90% 92% 93% 91% 91% 95% 91% 93% 88% 93% 92% 86% 92% 92% 92% 84% 73% 71%

Table 38
Q14 How often, if ever, do you feel any of the foll owing emotions -ExcitedBase: All respondents
Youth Online Habits and Attitudes Survey Online Fieldwork: 21st – 28th August 2014
Page 39
Absolutes/col percents
Prepared by ComRes
Total Gender Age SEG Social media use Where online Education Feel at least most of time
Male Fe- male
15 16 17 18 AB C1 C2 DE More than every hour
At leastonce a
day
Less than daily
By themsel
ves
With other people
At school/ college
Not in educati
on
Lonely Depressed
Unweighted base 1,015 504 511 252 259 254 250 305 273 220 217 337 606 72 747 268 813 87 150 148
Weighted base 1,015 521 494 243 252 256 265 307 272 219 217 335 608 72 747 268 805 90 149 147
All the time 56 32 24 18 15 12 11 8 25 18 6 24 26 6 38 18 48 4 13 13
6% 6% 5% 7% 6% 5% 4% 3% 9% 8% 3% 7% 4% 8% 5% 7% 6% 4% 9% 9%
Most of the time 222 116 106 53 55 54 60 73 63 49 37 87 123 12 142 80 174 14 19 22
22% 22% 21% 22% 22% 21% 23% 24% 23% 22% 17% 26% 20% 16% 19% 30% 22% 16% 13% 15%
Sometimes 571 291 280 134 138 148 152 175 146 117 133 172 356 43 427 145 448 57 59 59
56% 56% 57% 55% 55% 58% 57% 57% 54% 53% 61% 51% 59% 59% 57% 54% 56% 63% 40% 40%
Hardly ever 138 64 73 28 37 38 35 46 30 30 31 45 85 7 121 17 114 11 51 48
14% 12% 15% 12% 15% 15% 13% 15% 11% 14% 14% 13% 14% 10% 16% 6% 14% 12% 34% 32%
Never 20 13 7 5 6 4 5 3 6 2 9 7 10 3 11 9 16 3 7 6
2% 3% 1% 2% 2% 2% 2% 1% 2% 1% 4% 2% 2% 4% 1% 4% 2% 3% 5% 4%
Don’t know 8 4 4 4 1 1 2 2 2 4 1 - 7 1 8 - 5 1 - -
1% 1% 1% 2% 0% 0% 1% 1% 1% 2% 0% - 1% 1% 1% - 1% 1% - -
Net: At least most of the time 278 148 130 72 70 66 70 81 88 66 43 111 149 18 181 97 222 18 32 35
27% 28% 26% 29% 28% 26% 27% 26% 32% 30% 20% 33% 24% 25% 24% 36% 28% 20% 22% 24%
Net: At least sometimes 849 439 410 205 208 214 222 256 234 183 176 284 505 60 607 242 670 75 91 94
84% 84% 83% 85% 83% 83% 84% 83% 86% 84% 81% 85% 83% 84% 81% 90% 83% 83% 61% 64%

Table 39
Q14 How often, if ever, do you feel any of the foll owing emotions -AngryBase: All respondents
Youth Online Habits and Attitudes Survey Online Fieldwork: 21st – 28th August 2014
Page 40
Absolutes/col percents
Prepared by ComRes
Total Gender Age SEG Social media use Where online Education Feel at least most of time
Male Fe- male
15 16 17 18 AB C1 C2 DE More than every hour
At leastonce a
day
Less than daily
By themsel
ves
With other people
At school/ college
Not in educati
on
Lonely Depressed
Unweighted base 1,015 504 511 252 259 254 250 305 273 220 217 337 606 72 747 268 813 87 150 148
Weighted base 1,015 521 494 243 252 256 265 307 272 219 217 335 608 72 747 268 805 90 149 147
All the time 24 10 14 3 8 6 7 4 8 3 9 15 8 1 18 6 20 3 16 19
2% 2% 3% 1% 3% 2% 3% 1% 3% 1% 4% 4% 1% 1% 2% 2% 2% 3% 11% 13%
Most of the time 75 29 45 15 18 13 29 20 19 24 12 31 40 3 59 16 59 7 33 34
7% 6% 9% 6% 7% 5% 11% 6% 7% 11% 5% 9% 7% 4% 8% 6% 7% 8% 22% 23%
Sometimes 532 258 274 124 128 135 145 171 132 111 118 173 328 31 403 129 398 56 69 73
52% 49% 56% 51% 51% 53% 55% 56% 49% 51% 54% 52% 54% 43% 54% 48% 50% 62% 46% 50%
Hardly ever 306 173 133 83 78 85 60 95 81 66 64 93 183 30 213 93 266 20 23 18
30% 33% 27% 34% 31% 33% 23% 31% 30% 30% 29% 28% 30% 42% 28% 35% 33% 22% 15% 12%
Never 66 47 19 16 18 15 17 14 25 14 13 23 37 6 43 22 53 5 7 2
6% 9% 4% 6% 7% 6% 6% 5% 9% 6% 6% 7% 6% 9% 6% 8% 7% 6% 4% 1%
Don’t know 13 4 9 2 2 2 8 3 6 2 2 - 12 1 11 2 9 - 1 1
1% 1% 2% 1% 1% 1% 3% 1% 2% 1% 1% - 2% 1% 1% 1% 1% - 1% 1%
Net: At least most of the time 98 40 59 18 26 18 36 24 28 27 21 46 49 4 77 21 79 10 49 53
10% 8% 12% 8% 10% 7% 14% 8% 10% 12% 10% 14% 8% 6% 10% 8% 10% 11% 33% 36%
Net: At least sometimes 630 297 333 143 154 153 180 194 160 137 139 219 376 35 480 151 477 65 118 127
62% 57% 67% 59% 61% 60% 68% 63% 59% 63% 64% 65% 62% 48% 64% 56% 59% 72% 79% 86%

Table 40
Q15 How often, if ever, do you feel any of the foll owing emotions while you are online?LonelyBase: All respondents
Youth Online Habits and Attitudes Survey Online Fieldwork: 21st – 28th August 2014
Page 41
Absolutes/col percents
Prepared by ComRes
Total Gender Age SEG Social media use Where online Education Feel at least most of time
Male Fe- male
15 16 17 18 AB C1 C2 DE More than every hour
At leastonce a
day
Less than daily
By themsel
ves
With other people
At school/ college
Not in educati
on
Lonely Depressed
Unweighted base 1,015 504 511 252 259 254 250 305 273 220 217 337 606 72 747 268 813 87 150 148
Weighted base 1,015 521 494 243 252 256 265 307 272 219 217 335 608 72 747 268 805 90 149 147
All the time 30 14 16 8 7 8 7 6 8 5 11 12 15 3 22 8 24 5 25 22
3% 3% 3% 3% 3% 3% 3% 2% 3% 2% 5% 4% 2% 4% 3% 3% 3% 5% 17% 15%
Most of the time 50 26 24 11 9 13 17 16 15 7 12 21 26 3 42 8 38 7 35 23
5% 5% 5% 5% 3% 5% 6% 5% 5% 3% 6% 6% 4% 4% 6% 3% 5% 8% 23% 15%
Sometimes 284 141 144 56 63 83 82 88 77 52 67 104 168 13 214 71 218 22 56 49
28% 27% 29% 23% 25% 32% 31% 29% 28% 24% 31% 31% 28% 18% 29% 26% 27% 24% 38% 33%
Hardly ever 347 158 189 80 101 77 89 114 90 79 64 111 214 22 255 92 285 28 23 45
34% 30% 38% 33% 40% 30% 34% 37% 33% 36% 30% 33% 35% 30% 34% 34% 35% 31% 16% 31%
Never 277 170 108 80 64 73 61 75 74 70 58 81 169 27 193 85 220 27 9 8
27% 33% 22% 33% 26% 28% 23% 25% 27% 32% 27% 24% 28% 38% 26% 32% 27% 30% 6% 5%
Don’t know 27 13 14 7 8 3 9 8 8 7 4 6 16 4 22 4 20 1 1 1
3% 3% 3% 3% 3% 1% 4% 3% 3% 3% 2% 2% 3% 6% 3% 2% 2% 1% 1% 1%
Net: At least most of the time 80 40 40 19 16 21 24 21 23 12 24 33 41 6 64 16 62 12 60 45
8% 8% 8% 8% 6% 8% 9% 7% 8% 5% 11% 10% 7% 8% 9% 6% 8% 13% 40% 30%
Net: At least sometimes 364 180 184 76 79 104 106 109 100 64 91 137 209 19 277 87 280 34 116 94
36% 35% 37% 31% 31% 41% 40% 36% 37% 29% 42% 41% 34% 26% 37% 32% 35% 38% 78% 64%

Table 41
Q15 How often, if ever, do you feel any of the foll owing emotions while you are online?Connected to my friendsBase: All respondents
Youth Online Habits and Attitudes Survey Online Fieldwork: 21st – 28th August 2014
Page 42
Absolutes/col percents
Prepared by ComRes
Total Gender Age SEG Social media use Where online Education Feel at least most of time
Male Fe- male
15 16 17 18 AB C1 C2 DE More than every hour
At leastonce a
day
Less than daily
By themsel
ves
With other people
At school/ college
Not in educati
on
Lonely Depressed
Unweighted base 1,015 504 511 252 259 254 250 305 273 220 217 337 606 72 747 268 813 87 150 148
Weighted base 1,015 521 494 243 252 256 265 307 272 219 217 335 608 72 747 268 805 90 149 147
All the time 131 73 58 35 36 31 29 41 32 30 27 59 68 4 101 29 106 8 26 24
13% 14% 12% 14% 14% 12% 11% 13% 12% 14% 13% 18% 11% 5% 14% 11% 13% 9% 17% 17%
Most of the time 422 208 214 103 105 105 109 135 108 94 85 147 258 17 310 112 340 32 48 50
42% 40% 43% 42% 42% 41% 41% 44% 40% 43% 39% 44% 42% 24% 42% 42% 42% 35% 33% 34%
Sometimes 324 168 156 69 79 87 88 101 95 62 67 90 209 25 236 88 249 32 49 48
32% 32% 32% 29% 32% 34% 33% 33% 35% 28% 31% 27% 34% 35% 32% 33% 31% 35% 33% 32%
Hardly ever 80 43 38 16 18 22 25 19 18 23 20 31 38 12 57 23 64 10 17 15
8% 8% 8% 6% 7% 9% 9% 6% 7% 10% 9% 9% 6% 17% 8% 9% 8% 11% 12% 10%
Never 38 19 18 14 5 10 9 5 12 8 13 7 22 9 23 15 29 6 8 9
4% 4% 4% 6% 2% 4% 4% 2% 4% 4% 6% 2% 4% 12% 3% 6% 4% 7% 6% 6%
Don’t know 20 10 10 6 8 2 4 6 7 3 5 2 13 5 19 1 16 2 - 1
2% 2% 2% 2% 3% 1% 2% 2% 3% 1% 2% 1% 2% 7% 3% 0% 2% 2% - 1%
Net: At least most of the time 553 281 271 138 141 135 138 176 140 124 112 206 326 21 411 142 446 40 74 74
54% 54% 55% 57% 56% 53% 52% 57% 51% 57% 52% 61% 54% 29% 55% 53% 55% 44% 50% 50%
Net: At least sometimes 876 449 427 207 220 222 226 277 234 186 179 296 535 46 647 229 695 72 123 122
86% 86% 87% 85% 88% 87% 85% 90% 86% 85% 82% 88% 88% 64% 87% 85% 86% 80% 83% 83%

Table 42
Q15 How often, if ever, do you feel any of the foll owing emotions while you are online?AddictedBase: All respondents
Youth Online Habits and Attitudes Survey Online Fieldwork: 21st – 28th August 2014
Page 43
Absolutes/col percents
Prepared by ComRes
Total Gender Age SEG Social media use Where online Education Feel at least most of time
Male Fe- male
15 16 17 18 AB C1 C2 DE More than every hour
At leastonce a
day
Less than daily
By themsel
ves
With other people
At school/ college
Not in educati
on
Lonely Depressed
Unweighted base 1,015 504 511 252 259 254 250 305 273 220 217 337 606 72 747 268 813 87 150 148
Weighted base 1,015 521 494 243 252 256 265 307 272 219 217 335 608 72 747 268 805 90 149 147
All the time 40 20 20 7 7 12 14 7 13 10 9 26 14 - 27 12 33 3 17 17
4% 4% 4% 3% 3% 5% 5% 2% 5% 5% 4% 8% 2% - 4% 5% 4% 3% 11% 12%
Most of the time 103 54 49 24 30 19 30 25 30 21 28 51 46 6 81 22 87 6 34 33
10% 10% 10% 10% 12% 7% 11% 8% 11% 9% 13% 15% 8% 8% 11% 8% 11% 7% 23% 22%
Sometimes 227 120 107 60 62 53 52 76 52 53 46 67 144 16 174 53 185 25 26 31
22% 23% 22% 25% 25% 21% 20% 25% 19% 24% 21% 20% 24% 22% 23% 20% 23% 27% 17% 21%
Hardly ever 261 135 125 58 67 71 65 84 65 51 61 91 153 17 192 69 203 20 36 29
26% 26% 25% 24% 27% 28% 24% 27% 24% 23% 28% 27% 25% 24% 26% 26% 25% 22% 24% 20%
Never 357 175 182 86 79 95 97 108 104 79 67 94 233 30 250 107 274 35 33 36
35% 34% 37% 35% 31% 37% 37% 35% 38% 36% 31% 28% 38% 42% 33% 40% 34% 39% 22% 24%
Don’t know 28 18 11 8 7 6 8 8 8 5 7 7 18 3 23 5 23 2 3 2
3% 3% 2% 3% 3% 2% 3% 3% 3% 2% 3% 2% 3% 4% 3% 2% 3% 2% 2% 1%
Net: At least most of the time 143 74 69 31 37 31 44 31 43 31 37 77 60 6 108 35 120 9 51 50
14% 14% 14% 13% 15% 12% 16% 10% 16% 14% 17% 23% 10% 8% 14% 13% 15% 10% 34% 34%
Net: At least sometimes 369 193 176 91 99 84 95 108 95 84 83 144 204 22 282 88 306 34 77 81
36% 37% 36% 38% 39% 33% 36% 35% 35% 38% 38% 43% 33% 31% 38% 33% 38% 37% 52% 55%

Table 43
Q15 How often, if ever, do you feel any of the foll owing emotions while you are online?JealousBase: All respondents
Youth Online Habits and Attitudes Survey Online Fieldwork: 21st – 28th August 2014
Page 44
Absolutes/col percents
Prepared by ComRes
Total Gender Age SEG Social media use Where online Education Feel at least most of time
Male Fe- male
15 16 17 18 AB C1 C2 DE More than every hour
At leastonce a
day
Less than daily
By themsel
ves
With other people
At school/ college
Not in educati
on
Lonely Depressed
Unweighted base 1,015 504 511 252 259 254 250 305 273 220 217 337 606 72 747 268 813 87 150 148
Weighted base 1,015 521 494 243 252 256 265 307 272 219 217 335 608 72 747 268 805 90 149 147
All the time 20 10 10 3 3 6 8 4 7 2 7 9 11 - 13 7 16 3 12 10
2% 2% 2% 1% 1% 2% 3% 1% 3% 1% 3% 3% 2% - 2% 3% 2% 3% 8% 7%
Most of the time 97 46 51 22 22 27 26 32 26 23 17 52 41 3 72 24 74 9 30 28
10% 9% 10% 9% 9% 10% 10% 10% 9% 10% 8% 15% 7% 5% 10% 9% 9% 10% 20% 19%
Sometimes 350 149 201 77 91 83 99 123 86 79 61 121 211 17 257 93 274 29 55 57
34% 29% 41% 32% 36% 33% 37% 40% 32% 36% 28% 36% 35% 24% 34% 35% 34% 32% 37% 39%
Hardly ever 277 150 126 69 65 76 67 80 77 51 69 90 172 15 215 62 225 21 35 33
27% 29% 26% 28% 26% 30% 25% 26% 28% 23% 32% 27% 28% 20% 29% 23% 28% 23% 24% 22%
Never 252 157 95 66 67 61 58 64 71 58 59 61 157 34 171 81 200 28 15 17
25% 30% 19% 27% 27% 24% 22% 21% 26% 27% 27% 18% 26% 47% 23% 30% 25% 31% 10% 12%
Don’t know 20 9 11 7 4 3 7 5 5 5 5 2 15 3 19 1 16 1 2 2
2% 2% 2% 3% 2% 1% 3% 2% 2% 2% 2% 1% 2% 4% 3% 0% 2% 1% 1% 1%
Net: At least most of the time 117 56 61 25 25 33 34 35 33 25 24 61 53 3 85 31 90 12 42 38
11% 11% 12% 10% 10% 13% 13% 12% 12% 11% 11% 18% 9% 5% 11% 12% 11% 13% 28% 26%
Net: At least sometimes 466 204 262 101 116 116 133 158 119 104 85 182 264 20 342 124 364 40 97 96
46% 39% 53% 42% 46% 45% 50% 52% 44% 48% 39% 54% 43% 28% 46% 46% 45% 45% 65% 65%

Table 44
Q15 How often, if ever, do you feel any of the foll owing emotions while you are online?HappyBase: All respondents
Youth Online Habits and Attitudes Survey Online Fieldwork: 21st – 28th August 2014
Page 45
Absolutes/col percents
Prepared by ComRes
Total Gender Age SEG Social media use Where online Education Feel at least most of time
Male Fe- male
15 16 17 18 AB C1 C2 DE More than every hour
At leastonce a
day
Less than daily
By themsel
ves
With other people
At school/ college
Not in educati
on
Lonely Depressed
Unweighted base 1,015 504 511 252 259 254 250 305 273 220 217 337 606 72 747 268 813 87 150 148
Weighted base 1,015 521 494 243 252 256 265 307 272 219 217 335 608 72 747 268 805 90 149 147
All the time 89 51 37 28 24 24 13 21 27 23 18 44 42 3 62 26 76 4 17 13
9% 10% 8% 12% 9% 9% 5% 7% 10% 11% 8% 13% 7% 4% 8% 10% 9% 4% 11% 8%
Most of the time 447 240 207 109 117 116 106 142 126 100 79 159 258 30 324 123 355 41 50 45
44% 46% 42% 45% 46% 45% 40% 46% 46% 45% 37% 47% 42% 42% 43% 46% 44% 46% 34% 30%
Sometimes 379 188 192 77 91 92 119 117 86 80 96 99 251 29 281 98 297 33 52 58
37% 36% 39% 32% 36% 36% 45% 38% 31% 37% 44% 30% 41% 41% 38% 37% 37% 36% 35% 40%
Hardly ever 56 25 31 15 12 16 13 17 18 11 10 17 36 3 48 9 46 5 21 22
6% 5% 6% 6% 5% 6% 5% 6% 7% 5% 5% 5% 6% 4% 6% 3% 6% 5% 14% 15%
Never 25 12 13 9 5 6 5 4 9 3 9 9 11 5 13 12 19 5 9 10
2% 2% 3% 4% 2% 2% 2% 1% 3% 1% 4% 3% 2% 6% 2% 4% 2% 6% 6% 6%
Don’t know 19 6 13 5 4 3 8 6 6 2 5 7 10 2 18 1 12 2 - -
2% 1% 3% 2% 2% 1% 3% 2% 2% 1% 2% 2% 2% 3% 2% 0% 1% 2% - -
Net: At least most of the time 536 291 245 137 140 139 120 163 153 123 97 202 300 33 387 149 431 45 67 57
53% 56% 50% 56% 56% 54% 45% 53% 56% 56% 45% 60% 49% 46% 52% 56% 54% 50% 45% 39%
Net: At least sometimes 915 478 437 214 231 231 239 280 238 203 193 301 551 62 668 247 728 78 119 116
90% 92% 88% 88% 92% 90% 90% 91% 88% 93% 89% 90% 91% 86% 89% 92% 90% 86% 80% 78%

Table 45
Q15 How often, if ever, do you feel any of the foll owing emotions while you are online?ExcitedBase: All respondents
Youth Online Habits and Attitudes Survey Online Fieldwork: 21st – 28th August 2014
Page 46
Absolutes/col percents
Prepared by ComRes
Total Gender Age SEG Social media use Where online Education Feel at least most of time
Male Fe- male
15 16 17 18 AB C1 C2 DE More than every hour
At leastonce a
day
Less than daily
By themsel
ves
With other people
At school/ college
Not in educati
on
Lonely Depressed
Unweighted base 1,015 504 511 252 259 254 250 305 273 220 217 337 606 72 747 268 813 87 150 148
Weighted base 1,015 521 494 243 252 256 265 307 272 219 217 335 608 72 747 268 805 90 149 147
All the time 57 35 22 17 15 13 12 14 17 17 8 33 24 - 39 18 45 4 13 13
6% 7% 4% 7% 6% 5% 5% 5% 6% 8% 4% 10% 4% - 5% 7% 6% 4% 9% 9%
Most of the time 237 127 110 59 59 54 65 71 52 66 48 84 139 14 174 63 191 16 31 29
23% 24% 22% 24% 23% 21% 25% 23% 19% 30% 22% 25% 23% 19% 23% 23% 24% 18% 21% 20%
Sometimes 498 263 234 112 127 130 129 157 133 99 109 154 305 38 360 137 394 49 60 65
49% 51% 47% 46% 50% 51% 49% 51% 49% 45% 50% 46% 50% 53% 48% 51% 49% 54% 40% 44%
Hardly ever 146 54 92 32 31 43 39 47 43 25 31 44 93 8 117 28 111 15 33 33
14% 10% 19% 13% 12% 17% 15% 15% 16% 12% 14% 13% 15% 11% 16% 11% 14% 16% 22% 22%
Never 59 34 25 17 15 13 13 13 20 8 17 14 36 9 37 22 50 4 12 8
6% 6% 5% 7% 6% 5% 5% 4% 7% 4% 8% 4% 6% 13% 5% 8% 6% 5% 8% 5%
Don’t know 19 9 11 6 5 3 6 5 7 4 4 6 10 3 19 - 14 2 - -
2% 2% 2% 2% 2% 1% 2% 2% 3% 2% 2% 2% 2% 4% 3% - 2% 2% - -
Net: At least most of the time 294 162 132 76 74 67 77 85 69 83 57 117 163 14 213 81 237 20 44 41
29% 31% 27% 31% 29% 26% 29% 28% 25% 38% 26% 35% 27% 19% 29% 30% 29% 22% 30% 28%
Net: At least sometimes 791 425 366 188 200 197 206 242 202 182 166 271 469 51 574 218 631 69 104 106
78% 82% 74% 77% 80% 77% 78% 79% 74% 83% 76% 81% 77% 71% 77% 81% 78% 77% 70% 72%

Table 46
Q15 How often, if ever, do you feel any of the foll owing emotions while you are online?StressedBase: All respondents
Youth Online Habits and Attitudes Survey Online Fieldwork: 21st – 28th August 2014
Page 47
Absolutes/col percents
Prepared by ComRes
Total Gender Age SEG Social media use Where online Education Feel at least most of time
Male Fe- male
15 16 17 18 AB C1 C2 DE More than every hour
At leastonce a
day
Less than daily
By themsel
ves
With other people
At school/ college
Not in educati
on
Lonely Depressed
Unweighted base 1,015 504 511 252 259 254 250 305 273 220 217 337 606 72 747 268 813 87 150 148
Weighted base 1,015 521 494 243 252 256 265 307 272 219 217 335 608 72 747 268 805 90 149 147
All the time 16 8 8 4 4 4 4 2 7 3 4 8 6 2 13 3 14 2 12 11
2% 2% 2% 2% 1% 2% 2% 1% 3% 1% 2% 2% 1% 3% 2% 1% 2% 2% 8% 8%
Most of the time 60 25 35 15 14 11 20 16 18 11 16 27 31 2 46 14 43 9 26 29
6% 5% 7% 6% 5% 4% 8% 5% 7% 5% 7% 8% 5% 3% 6% 5% 5% 10% 17% 20%
Sometimes 254 128 126 47 52 75 80 90 57 47 60 83 156 15 188 66 197 23 48 44
25% 25% 25% 19% 21% 29% 30% 29% 21% 21% 28% 25% 26% 20% 25% 25% 24% 25% 32% 30%
Hardly ever 378 188 190 99 95 96 89 110 105 88 75 122 231 25 290 88 303 34 36 45
37% 36% 38% 41% 38% 37% 34% 36% 39% 40% 35% 36% 38% 35% 39% 33% 38% 38% 24% 30%
Never 285 159 126 73 80 68 63 83 78 66 59 88 171 27 191 94 233 21 25 18
28% 31% 26% 30% 32% 27% 24% 27% 29% 30% 27% 26% 28% 37% 26% 35% 29% 23% 17% 12%
Don’t know 21 12 9 5 7 2 8 6 7 4 4 7 12 2 18 3 15 1 2 -
2% 2% 2% 2% 3% 1% 3% 2% 2% 2% 2% 2% 2% 3% 2% 1% 2% 1% 1% -
Net: At least most of the time 76 33 43 19 17 15 24 18 25 14 19 35 37 4 59 17 57 11 38 41
7% 6% 9% 8% 7% 6% 9% 6% 9% 6% 9% 10% 6% 5% 8% 6% 7% 13% 25% 28%
Net: At least sometimes 330 162 168 66 70 90 104 108 82 61 79 118 194 18 247 83 254 34 86 84
33% 31% 34% 27% 28% 35% 39% 35% 30% 28% 36% 35% 32% 26% 33% 31% 32% 38% 58% 57%

Table 47
Q15 How often, if ever, do you feel any of the foll owing emotions while you are online?WorriedBase: All respondents
Youth Online Habits and Attitudes Survey Online Fieldwork: 21st – 28th August 2014
Page 48
Absolutes/col percents
Prepared by ComRes
Total Gender Age SEG Social media use Where online Education Feel at least most of time
Male Fe- male
15 16 17 18 AB C1 C2 DE More than every hour
At leastonce a
day
Less than daily
By themsel
ves
With other people
At school/ college
Not in educati
on
Lonely Depressed
Unweighted base 1,015 504 511 252 259 254 250 305 273 220 217 337 606 72 747 268 813 87 150 148
Weighted base 1,015 521 494 243 252 256 265 307 272 219 217 335 608 72 747 268 805 90 149 147
All the time 23 12 11 6 6 4 7 3 10 4 6 13 6 4 18 5 19 2 12 15
2% 2% 2% 2% 2% 2% 3% 1% 4% 2% 3% 4% 1% 5% 2% 2% 2% 2% 8% 10%
Most of the time 39 22 17 10 12 7 11 9 13 5 12 15 22 2 32 7 32 6 21 24
4% 4% 4% 4% 5% 3% 4% 3% 5% 2% 6% 4% 4% 3% 4% 3% 4% 7% 14% 16%
Sometimes 268 134 135 60 58 72 78 80 73 58 56 91 159 17 206 62 210 26 50 54
26% 26% 27% 25% 23% 28% 29% 26% 27% 27% 26% 27% 26% 24% 28% 23% 26% 28% 34% 36%
Hardly ever 368 185 183 90 96 92 90 129 86 82 72 122 226 20 266 102 300 25 40 34
36% 36% 37% 37% 38% 36% 34% 42% 32% 37% 33% 36% 37% 28% 36% 38% 37% 28% 27% 23%
Never 289 154 135 71 70 76 72 76 84 62 67 83 180 26 201 88 222 30 21 19
28% 30% 27% 29% 28% 30% 27% 25% 31% 28% 31% 25% 30% 36% 27% 33% 28% 34% 14% 13%
Don’t know 27 15 12 7 9 4 8 9 6 8 4 10 14 3 23 4 22 1 4 2
3% 3% 3% 3% 3% 2% 3% 3% 2% 4% 2% 3% 2% 4% 3% 2% 3% 1% 3% 1%
Net: At least most of the time 62 34 28 15 18 11 18 12 23 9 18 28 28 6 50 12 51 8 33 39
6% 7% 6% 6% 7% 4% 7% 4% 8% 4% 8% 8% 5% 8% 7% 4% 6% 9% 22% 26%
Net: At least sometimes 330 168 163 76 76 83 95 92 96 67 75 120 188 23 256 74 261 34 84 93
33% 32% 33% 31% 30% 33% 36% 30% 35% 31% 34% 36% 31% 32% 34% 28% 32% 38% 56% 63%

Table 48
Q15 How often, if ever, do you feel any of the foll owing emotions while you are online?BulliedBase: All respondents
Youth Online Habits and Attitudes Survey Online Fieldwork: 21st – 28th August 2014
Page 49
Absolutes/col percents
Prepared by ComRes
Total Gender Age SEG Social media use Where online Education Feel at least most of time
Male Fe- male
15 16 17 18 AB C1 C2 DE More than every hour
At leastonce a
day
Less than daily
By themsel
ves
With other people
At school/ college
Not in educati
on
Lonely Depressed
Unweighted base 1,015 504 511 252 259 254 250 305 273 220 217 337 606 72 747 268 813 87 150 148
Weighted base 1,015 521 494 243 252 256 265 307 272 219 217 335 608 72 747 268 805 90 149 147
All the time 12 7 5 4 1 1 6 5 3 2 2 7 5 - 11 1 9 3 9 11
1% 1% 1% 2% 0% 0% 2% 2% 1% 1% 1% 2% 1% - 1% 0% 1% 3% 6% 7%
Most of the time 22 16 7 9 3 9 2 2 12 4 4 11 11 - 15 7 20 2 12 11
2% 3% 1% 4% 1% 3% 1% 1% 4% 2% 2% 3% 2% - 2% 3% 3% 2% 8% 7%
Sometimes 70 38 32 27 18 11 15 16 22 20 12 26 40 5 45 25 62 4 23 24
7% 7% 7% 11% 7% 4% 6% 5% 8% 9% 6% 8% 7% 7% 6% 9% 8% 5% 15% 16%
Hardly ever 208 103 105 45 60 48 55 72 55 38 43 72 129 7 164 43 165 13 39 39
20% 20% 21% 19% 24% 19% 21% 24% 20% 17% 20% 22% 21% 10% 22% 16% 20% 15% 26% 26%
Never 682 345 337 151 163 186 180 206 173 152 150 216 410 55 492 189 532 67 65 61
67% 66% 68% 62% 65% 73% 68% 67% 64% 69% 69% 64% 68% 77% 66% 71% 66% 74% 44% 41%
Don’t know 21 13 8 7 7 1 6 6 6 3 6 3 13 5 19 2 17 1 1 2
2% 2% 2% 3% 3% 0% 2% 2% 2% 2% 3% 1% 2% 7% 3% 1% 2% 1% 1% 1%
Net: At least most of the time 34 23 12 13 4 10 8 7 15 6 6 18 16 - 26 8 29 5 21 22
3% 4% 2% 5% 2% 4% 3% 2% 6% 3% 3% 5% 3% - 3% 3% 4% 5% 14% 15%
Net: At least sometimes 105 61 44 39 21 21 23 23 37 26 18 44 56 5 71 33 91 9 44 46
10% 12% 9% 16% 9% 8% 9% 8% 14% 12% 9% 13% 9% 7% 10% 12% 11% 10% 30% 31%

Table 49
Q15 How often, if ever, do you feel any of the foll owing emotions while you are online?Important Base: All respondents
Youth Online Habits and Attitudes Survey Online Fieldwork: 21st – 28th August 2014
Page 50
Absolutes/col percents
Prepared by ComRes
Total Gender Age SEG Social media use Where online Education Feel at least most of time
Male Fe- male
15 16 17 18 AB C1 C2 DE More than every hour
At leastonce a
day
Less than daily
By themsel
ves
With other people
At school/ college
Not in educati
on
Lonely Depressed
Unweighted base 1,015 504 511 252 259 254 250 305 273 220 217 337 606 72 747 268 813 87 150 148
Weighted base 1,015 521 494 243 252 256 265 307 272 219 217 335 608 72 747 268 805 90 149 147
All the time 38 24 14 16 6 9 7 10 13 9 6 24 13 1 24 15 34 2 10 11
4% 5% 3% 7% 2% 4% 3% 3% 5% 4% 3% 7% 2% 1% 3% 5% 4% 2% 7% 7%
Most of the time 124 75 49 37 33 23 31 24 39 30 31 47 73 4 96 28 102 8 27 25
12% 14% 10% 15% 13% 9% 12% 8% 14% 14% 14% 14% 12% 5% 13% 10% 13% 8% 18% 17%
Sometimes 400 221 179 92 108 102 97 133 101 88 77 131 244 24 288 112 324 33 32 37
39% 42% 36% 38% 43% 40% 37% 43% 37% 40% 36% 39% 40% 33% 39% 42% 40% 37% 21% 25%
Hardly ever 252 112 140 49 59 63 81 80 58 51 63 81 150 21 193 59 192 23 47 47
25% 22% 28% 20% 24% 25% 30% 26% 21% 23% 29% 24% 25% 29% 26% 22% 24% 26% 32% 32%
Never 151 70 81 37 35 48 31 42 48 28 33 38 95 18 109 42 115 20 31 26
15% 13% 16% 15% 14% 19% 12% 14% 18% 13% 15% 11% 16% 25% 15% 16% 14% 22% 21% 17%
Don’t know 50 18 31 12 10 10 18 18 12 13 7 13 33 4 36 14 38 5 2 3
5% 4% 6% 5% 4% 4% 7% 6% 4% 6% 3% 4% 5% 6% 5% 5% 5% 5% 1% 2%
Net: At least most of the time 163 100 63 53 39 33 38 34 53 39 37 72 86 5 120 42 136 9 37 35
16% 19% 13% 22% 15% 13% 14% 11% 19% 18% 17% 21% 14% 7% 16% 16% 17% 10% 25% 24%
Net: At least sometimes 562 321 241 145 147 135 135 167 154 127 114 203 330 29 408 154 460 43 69 72
55% 62% 49% 60% 58% 53% 51% 54% 57% 58% 53% 61% 54% 40% 55% 58% 57% 47% 46% 49%

Table 50
Q15 How often, if ever, do you feel any of the foll owing emotions while you are online?Self-conscious Base: All respondents
Youth Online Habits and Attitudes Survey Online Fieldwork: 21st – 28th August 2014
Page 51
Absolutes/col percents
Prepared by ComRes
Total Gender Age SEG Social media use Where online Education Feel at least most of time
Male Fe- male
15 16 17 18 AB C1 C2 DE More than every hour
At leastonce a
day
Less than daily
By themsel
ves
With other people
At school/ college
Not in educati
on
Lonely Depressed
Unweighted base 1,015 504 511 252 259 254 250 305 273 220 217 337 606 72 747 268 813 87 150 148
Weighted base 1,015 521 494 243 252 256 265 307 272 219 217 335 608 72 747 268 805 90 149 147
All the time 47 22 25 14 10 5 17 10 13 14 10 21 24 2 30 17 34 4 23 25
5% 4% 5% 6% 4% 2% 6% 3% 5% 6% 5% 6% 4% 3% 4% 6% 4% 4% 15% 17%
Most of the time 132 64 68 32 22 40 38 43 41 23 25 57 71 4 102 30 103 9 35 38
13% 12% 14% 13% 9% 16% 14% 14% 15% 11% 12% 17% 12% 5% 14% 11% 13% 10% 23% 26%
Sometimes 328 160 168 68 91 83 86 115 89 59 66 102 209 17 249 79 267 24 38 46
32% 31% 34% 28% 36% 33% 32% 37% 33% 27% 30% 30% 34% 24% 33% 29% 33% 27% 26% 31%
Hardly ever 228 114 114 54 59 54 60 66 53 55 54 68 139 21 173 55 179 25 28 25
22% 22% 23% 22% 23% 21% 23% 22% 20% 25% 25% 20% 23% 29% 23% 21% 22% 28% 19% 17%
Never 254 146 109 66 63 68 57 66 69 63 56 79 150 25 171 84 202 24 23 12
25% 28% 22% 27% 25% 27% 22% 22% 26% 29% 26% 24% 25% 35% 23% 31% 25% 27% 16% 8%
Don’t know 26 16 10 7 6 5 8 7 7 6 7 9 14 3 22 4 20 4 2 2
3% 3% 2% 3% 2% 2% 3% 2% 2% 3% 3% 3% 2% 4% 3% 1% 2% 5% 1% 1%
Net: At least most of the time 179 86 93 47 33 45 55 53 54 37 35 78 95 6 132 47 137 13 57 63
18% 17% 19% 19% 13% 18% 21% 17% 20% 17% 16% 23% 16% 8% 18% 17% 17% 14% 39% 43%
Net: At least sometimes 507 246 261 115 124 128 140 168 142 96 101 180 304 23 381 125 404 37 96 109
50% 47% 53% 47% 49% 50% 53% 55% 52% 44% 46% 54% 50% 32% 51% 47% 50% 41% 64% 74%

Table 51
Q15 How often, if ever, do you feel any of the foll owing emotions while you are online?AngryBase: All respondents
Youth Online Habits and Attitudes Survey Online Fieldwork: 21st – 28th August 2014
Page 52
Absolutes/col percents
Prepared by ComRes
Total Gender Age SEG Social media use Where online Education Feel at least most of time
Male Fe- male
15 16 17 18 AB C1 C2 DE More than every hour
At leastonce a
day
Less than daily
By themsel
ves
With other people
At school/ college
Not in educati
on
Lonely Depressed
Unweighted base 1,015 504 511 252 259 254 250 305 273 220 217 337 606 72 747 268 813 87 150 148
Weighted base 1,015 521 494 243 252 256 265 307 272 219 217 335 608 72 747 268 805 90 149 147
All the time 20 12 8 3 4 5 9 2 8 3 7 13 6 1 16 4 15 3 17 17
2% 2% 2% 1% 2% 2% 3% 1% 3% 1% 3% 4% 1% 1% 2% 1% 2% 3% 11% 12%
Most of the time 40 20 20 11 6 13 9 9 11 11 9 19 18 3 31 9 31 4 15 15
4% 4% 4% 5% 2% 5% 4% 3% 4% 5% 4% 6% 3% 4% 4% 3% 4% 5% 10% 10%
Sometimes 354 180 174 79 93 90 92 110 91 85 67 125 211 18 263 91 276 35 53 55
35% 34% 35% 32% 37% 35% 35% 36% 33% 39% 31% 37% 35% 25% 35% 34% 34% 38% 36% 38%
Hardly ever 367 183 184 85 90 91 100 123 97 65 82 106 233 28 272 95 292 27 43 44
36% 35% 37% 35% 36% 36% 38% 40% 36% 30% 38% 32% 38% 39% 36% 35% 36% 30% 29% 30%
Never 218 118 99 60 55 54 49 59 60 51 48 69 128 20 149 69 178 19 20 15
21% 23% 20% 25% 22% 21% 18% 19% 22% 23% 22% 21% 21% 28% 20% 26% 22% 22% 13% 10%
Don’t know 17 8 9 5 4 3 6 4 6 3 4 3 12 2 16 1 12 2 1 1
2% 2% 2% 2% 2% 1% 2% 1% 2% 2% 2% 1% 2% 3% 2% 0% 1% 2% 1% 1%
Net: At least most of the time 60 32 28 14 10 18 18 11 19 15 16 32 24 4 47 13 46 7 32 32
6% 6% 6% 6% 4% 7% 7% 3% 7% 7% 7% 9% 4% 5% 6% 5% 6% 8% 21% 21%
Net: At least sometimes 414 212 202 93 103 108 110 121 110 100 83 157 235 22 310 104 323 42 85 87
41% 41% 41% 38% 41% 42% 42% 39% 40% 46% 38% 47% 39% 30% 41% 39% 40% 46% 57% 59%

Table 52
Q15 How often, if ever, do you feel any of the foll owing emotions while you are online?DepressedBase: All respondents
Youth Online Habits and Attitudes Survey Online Fieldwork: 21st – 28th August 2014
Page 53
Absolutes/col percents
Prepared by ComRes
Total Gender Age SEG Social media use Where online Education Feel at least most of time
Male Fe- male
15 16 17 18 AB C1 C2 DE More than every hour
At leastonce a
day
Less than daily
By themsel
ves
With other people
At school/ college
Not in educati
on
Lonely Depressed
Unweighted base 1,015 504 511 252 259 254 250 305 273 220 217 337 606 72 747 268 813 87 150 148
Weighted base 1,015 521 494 243 252 256 265 307 272 219 217 335 608 72 747 268 805 90 149 147
All the time 23 12 11 6 4 6 7 2 7 4 10 14 6 3 17 6 18 4 20 21
2% 2% 2% 2% 2% 2% 3% 1% 3% 2% 5% 4% 1% 4% 2% 2% 2% 4% 14% 14%
Most of the time 50 19 31 10 11 12 16 15 12 11 12 25 24 1 39 11 42 6 31 40
5% 4% 6% 4% 4% 5% 6% 5% 4% 5% 6% 8% 4% 1% 5% 4% 5% 7% 21% 27%
Sometimes 257 118 139 57 58 66 75 81 72 46 58 90 157 10 201 56 200 22 58 60
25% 23% 28% 23% 23% 26% 28% 27% 26% 21% 27% 27% 26% 14% 27% 21% 25% 24% 39% 41%
Hardly ever 313 159 154 70 78 76 90 100 77 76 60 100 190 23 233 80 237 30 24 16
31% 31% 31% 29% 31% 30% 34% 32% 28% 35% 28% 30% 31% 32% 31% 30% 29% 33% 16% 11%
Never 349 202 148 93 94 91 71 102 100 78 69 100 218 32 237 112 288 28 15 9
34% 39% 30% 38% 37% 36% 27% 33% 37% 36% 32% 30% 36% 44% 32% 42% 36% 31% 10% 6%
Don’t know 23 11 11 7 7 4 5 7 4 4 8 6 14 3 20 3 20 1 1 2
2% 2% 2% 3% 3% 2% 2% 2% 1% 2% 4% 2% 2% 4% 3% 1% 2% 1% 1% 1%
Net: At least most of the time 73 31 42 16 15 18 23 17 19 15 22 39 30 4 56 17 60 10 51 61
7% 6% 9% 7% 6% 7% 9% 5% 7% 7% 10% 12% 5% 5% 7% 6% 7% 11% 34% 41%
Net: At least sometimes 330 149 181 73 73 85 99 98 91 60 80 130 186 14 257 73 260 32 109 121
32% 29% 37% 30% 29% 33% 37% 32% 33% 28% 37% 39% 31% 19% 34% 27% 32% 35% 73% 82%

Table 53
Q16 For each of the following, do you think you fee l them more when you are online or when you are not online?LonelyBase: All feeling this emotion
Youth Online Habits and Attitudes Survey Online Fieldwork: 21st – 28th August 2014
Page 54
Absolutes/col percents
Prepared by ComRes
Total Gender Age SEG Social media use Where online Education Feel at least most of time
Male Fe- male
15 16 17 18 AB C1 C2 DE More than every hour
At leastonce a
day
Less than daily
By themsel
ves
With other people
At school/ college
Not in educati
on
Lonely Depressed
Unweighted base 363 174 189 80 81 102 100 108 100 65 90 137 207 19 275 88 282 33 116 93
Weighted base 364 180 184 76 79 104 106 109 100 64 91 137 209 19 277 87 280 34 116 94
Feel more when I’m online 146 78 68 28 35 46 37 45 43 26 32 50 85 11 112 34 117 8 39 29
40% 43% 37% 37% 44% 45% 35% 42% 43% 41% 35% 37% 41% 58% 41% 39% 42% 23% 34% 31%
Feel more when I’m not online 218 103 115 47 44 57 69 64 57 38 59 87 123 8 165 53 163 26 77 65
60% 57% 63% 63% 56% 55% 65% 58% 57% 59% 65% 63% 59% 42% 59% 61% 58% 77% 66% 69%

Table 54
Q16 For each of the following, do you think you fee l them more when you are online or when you are not online?DepressedBase: All feeling this emotion
Youth Online Habits and Attitudes Survey Online Fieldwork: 21st – 28th August 2014
Page 55
Absolutes/col percents
Prepared by ComRes
Total Gender Age SEG Social media use Where online Education Feel at least most of time
Male Fe- male
15 16 17 18 AB C1 C2 DE More than every hour
At leastonce a
day
Less than daily
By themsel
ves
With other people
At school/ college
Not in educati
on
Lonely Depressed
Unweighted base 328 144 184 76 75 84 93 98 90 60 80 130 184 14 255 73 261 30 109 121
Weighted base 330 149 181 73 73 85 99 98 91 60 80 130 186 14 257 73 260 32 109 121
Feel more when I’m online 108 56 51 22 26 26 35 33 30 21 24 38 65 5 83 25 84 11 31 32
33% 38% 28% 30% 35% 30% 35% 34% 33% 34% 30% 29% 35% 34% 32% 34% 32% 35% 28% 27%
Feel more when I’m not online 222 93 129 51 48 59 64 65 61 40 56 91 122 9 174 48 176 21 78 89
67% 62% 72% 70% 65% 70% 65% 66% 67% 66% 70% 71% 65% 66% 68% 66% 68% 65% 72% 73%

Table 55
Q16 For each of the following, do you think you fee l them more when you are online or when you are not online?HappyBase: All feeling this emotion
Youth Online Habits and Attitudes Survey Online Fieldwork: 21st – 28th August 2014
Page 56
Absolutes/col percents
Prepared by ComRes
Total Gender Age SEG Social media use Where online Education Feel at least most of time
Male Fe- male
15 16 17 18 AB C1 C2 DE More than every hour
At leastonce a
day
Less than daily
By themsel
ves
With other people
At school/ college
Not in educati
on
Lonely Depressed
Unweighted base 914 462 452 222 238 229 225 278 239 204 193 303 549 62 668 246 735 75 121 116
Weighted base 915 478 437 214 231 231 239 280 238 203 193 301 551 62 668 247 728 78 119 116
Feel more when I’m online 346 193 152 79 91 77 99 104 87 71 84 144 185 16 264 81 281 30 75 72
38% 40% 35% 37% 39% 33% 42% 37% 37% 35% 43% 48% 34% 26% 40% 33% 39% 38% 63% 62%
Feel more when I’m not online 569 285 284 135 140 154 140 176 151 133 110 157 366 46 404 166 447 49 44 44
62% 60% 65% 63% 61% 67% 58% 63% 63% 65% 57% 52% 66% 74% 60% 67% 61% 62% 37% 38%

Table 56
Q16 For each of the following, do you think you fee l them more when you are online or when you are not online?ExcitedBase: All feeling this emotion
Youth Online Habits and Attitudes Survey Online Fieldwork: 21st – 28th August 2014
Page 57
Absolutes/col percents
Prepared by ComRes
Total Gender Age SEG Social media use Where online Education Feel at least most of time
Male Fe- male
15 16 17 18 AB C1 C2 DE More than every hour
At leastonce a
day
Less than daily
By themsel
ves
With other people
At school/ college
Not in educati
on
Lonely Depressed
Unweighted base 790 411 379 195 206 195 194 240 202 183 165 272 466 52 573 217 637 66 104 106
Weighted base 791 425 366 188 200 197 206 242 202 182 166 271 469 51 574 218 631 69 104 106
Feel more when I’m online 320 185 135 72 88 75 86 95 83 68 75 131 178 11 246 74 258 29 61 67
40% 43% 37% 38% 44% 38% 42% 39% 41% 37% 45% 48% 38% 21% 43% 34% 41% 42% 59% 63%
Feel more when I’m not online 471 240 231 116 113 122 120 147 119 114 91 140 291 40 328 143 373 40 43 40
60% 57% 63% 62% 56% 62% 58% 61% 59% 63% 55% 52% 62% 79% 57% 66% 59% 58% 41% 37%

Table 57
Q16 For each of the following, do you think you fee l them more when you are online or when you are not online?AngryBase: All feeling this emotion
Youth Online Habits and Attitudes Survey Online Fieldwork: 21st – 28th August 2014
Page 58
Absolutes/col percents
Prepared by ComRes
Total Gender Age SEG Social media use Where online Education Feel at least most of time
Male Fe- male
15 16 17 18 AB C1 C2 DE More than every hour
At leastonce a
day
Less than daily
By themsel
ves
With other people
At school/ college
Not in educati
on
Lonely Depressed
Unweighted base 414 205 209 97 105 108 104 120 108 102 84 158 234 22 310 104 326 41 85 87
Weighted base 414 212 202 93 103 108 110 121 110 100 83 157 235 22 310 104 323 42 85 87
Feel more when I’m online 157 89 68 34 37 44 41 48 36 39 34 59 90 8 122 35 125 18 26 28
38% 42% 34% 37% 36% 41% 38% 40% 33% 39% 41% 38% 38% 36% 39% 33% 39% 44% 31% 32%
Feel more when I’m not online 257 123 134 58 66 64 69 73 74 61 49 98 145 14 188 69 198 23 58 59
62% 58% 66% 63% 64% 59% 62% 60% 67% 61% 59% 62% 62% 64% 61% 67% 61% 56% 69% 68%

Table 58
Q19 - Do you agree or disagree with each of the fol lowing statements?I’m more connected and happier online than I am in real lifeBase: All respondents
Youth Online Habits and Attitudes Survey Online Fieldwork: 21st – 28th August 2014
Page 59
Absolutes/col percents
Prepared by ComRes
Total Gender Age SEG Social media use Where online Education Feel at least most of time
Male Fe- male
15 16 17 18 AB C1 C2 DE More than every hour
At leastonce a
day
Less than daily
By themsel
ves
With other people
At school/ college
Not in educati
on
Lonely Depressed
Unweighted base 1,015 504 511 252 259 254 250 305 273 220 217 337 606 72 747 268 813 87 150 148
Weighted base 1,015 521 494 243 252 256 265 307 272 219 217 335 608 72 747 268 805 90 149 147
Agree 257 144 113 66 69 59 63 63 63 60 71 117 131 9 192 65 216 22 71 71
25% 28% 23% 27% 27% 23% 24% 21% 23% 27% 32% 35% 21% 13% 26% 24% 27% 24% 48% 48%
Disagree 555 274 281 120 137 149 149 179 154 117 106 153 357 45 392 163 426 52 43 39
55% 53% 57% 49% 54% 58% 56% 58% 57% 53% 49% 46% 59% 62% 52% 61% 53% 57% 29% 27%
Don’t know 203 103 99 57 45 48 52 65 54 42 41 65 120 18 162 40 163 17 34 37
20% 20% 20% 23% 18% 19% 20% 21% 20% 19% 19% 19% 20% 25% 22% 15% 20% 19% 23% 25%

Table 59
Q19 - Do you agree or disagree with each of the fol lowing statements?Having most of my social life online makes me feel lonely and cut-offBase: All respondents
Youth Online Habits and Attitudes Survey Online Fieldwork: 21st – 28th August 2014
Page 60
Absolutes/col percents
Prepared by ComRes
Total Gender Age SEG Social media use Where online Education Feel at least most of time
Male Fe- male
15 16 17 18 AB C1 C2 DE More than every hour
At leastonce a
day
Less than daily
By themsel
ves
With other people
At school/ college
Not in educati
on
Lonely Depressed
Unweighted base 1,015 504 511 252 259 254 250 305 273 220 217 337 606 72 747 268 813 87 150 148
Weighted base 1,015 521 494 243 252 256 265 307 272 219 217 335 608 72 747 268 805 90 149 147
Agree 134 67 67 28 32 40 34 43 39 24 28 48 74 12 103 31 106 12 36 28
13% 13% 14% 12% 13% 16% 13% 14% 14% 11% 13% 14% 12% 16% 14% 12% 13% 13% 24% 19%
Disagree 706 373 333 176 176 176 178 208 182 162 154 239 427 40 515 190 567 62 87 93
70% 72% 67% 72% 70% 69% 67% 68% 67% 74% 71% 71% 70% 56% 69% 71% 70% 69% 59% 63%
Don’t know 175 81 94 39 44 40 53 56 51 33 36 49 107 20 129 47 131 16 25 26
17% 16% 19% 16% 18% 16% 20% 18% 19% 15% 16% 15% 18% 28% 17% 17% 16% 18% 17% 18%

Table 60
Q19 - Do you agree or disagree with each of the fol lowing statements?I like being in a room by myself when I’m online co nnecting with my friendsBase: All respondents
Youth Online Habits and Attitudes Survey Online Fieldwork: 21st – 28th August 2014
Page 61
Absolutes/col percents
Prepared by ComRes
Total Gender Age SEG Social media use Where online Education Feel at least most of time
Male Fe- male
15 16 17 18 AB C1 C2 DE More than every hour
At leastonce a
day
Less than daily
By themsel
ves
With other people
At school/ college
Not in educati
on
Lonely Depressed
Unweighted base 1,015 504 511 252 259 254 250 305 273 220 217 337 606 72 747 268 813 87 150 148
Weighted base 1,015 521 494 243 252 256 265 307 272 219 217 335 608 72 747 268 805 90 149 147
Agree 518 274 244 118 145 139 116 164 139 106 108 188 298 32 453 65 429 40 103 99
51% 53% 49% 49% 58% 54% 44% 54% 51% 48% 50% 56% 49% 45% 61% 24% 53% 45% 69% 67%
Disagree 331 167 164 83 70 77 102 96 87 77 70 99 206 26 176 156 251 30 24 30
33% 32% 33% 34% 28% 30% 39% 31% 32% 35% 32% 29% 34% 36% 24% 58% 31% 34% 16% 20%
Don’t know 166 80 85 42 37 41 46 46 45 36 39 48 104 14 118 48 124 20 21 19
16% 15% 17% 17% 15% 16% 17% 15% 17% 16% 18% 14% 17% 19% 16% 18% 15% 22% 14% 13%

Table 61
Q19 - Do you agree or disagree with each of the fol lowing statements?I like being around my family when I’m online conne cting with my friendsBase: All respondents
Youth Online Habits and Attitudes Survey Online Fieldwork: 21st – 28th August 2014
Page 62
Absolutes/col percents
Prepared by ComRes
Total Gender Age SEG Social media use Where online Education Feel at least most of time
Male Fe- male
15 16 17 18 AB C1 C2 DE More than every hour
At leastonce a
day
Less than daily
By themsel
ves
With other people
At school/ college
Not in educati
on
Lonely Depressed
Unweighted base 1,015 504 511 252 259 254 250 305 273 220 217 337 606 72 747 268 813 87 150 148
Weighted base 1,015 521 494 243 252 256 265 307 272 219 217 335 608 72 747 268 805 90 149 147
Agree 202 102 100 48 44 44 65 51 59 48 44 66 126 10 93 109 147 23 13 18
20% 20% 20% 20% 18% 17% 25% 16% 22% 22% 20% 20% 21% 14% 12% 41% 18% 26% 9% 12%
Disagree 564 297 267 127 148 143 145 181 154 113 116 187 339 38 465 99 450 48 102 98
56% 57% 54% 53% 59% 56% 55% 59% 57% 52% 53% 56% 56% 53% 62% 37% 56% 53% 69% 66%
Don’t know 249 122 127 67 59 69 55 75 59 58 57 82 143 24 189 60 208 19 33 32
25% 23% 26% 28% 23% 27% 21% 24% 22% 27% 26% 25% 24% 33% 25% 22% 26% 21% 22% 21%