bbee aa ppaalleeooaanntthhrrooppoollooggiisstt ffoorr aa
TRANSCRIPT
This work is licensed under the Creative Commons Attribution-NonCommercial 4.0 International License.
BBee aa PPaalleeooaanntthhrrooppoollooggiisstt ffoorr aa DDaayy!!
Instructor Curriculum
Fall 2019
Authored by: Michael Luberda and Dr. Chris Bayer
Reviewed by: Dr. Trenton Holliday, Dr. Grant McCall, Barbara Forrest, Larry Flammer, Dustin Eirdosh,
Dr. Susan Hanisch and Molly Selba
2
Table of Contents
Foreword ............................................................................................................................................... 3
I. Course Specs ..................................................................................................................................... 4
II. Course Content .................................................................................................................................. 6
A. Brief introductory lecture ................................................................................................................ 6
B. Measurement demo ..................................................................................................................... 11
C. Open lab ...................................................................................................................................... 11
Measurement 1: Foramen Magnum .............................................................................................. 13
Measurement 2: Maxillary Prognathism ........................................................................................ 15
Measurement 3: Cranial Capacity ................................................................................................. 17
D. Discussion of results and interpretation ....................................................................................... 19
1. Review of measurements ......................................................................................................... 20
2. Morphological function .............................................................................................................. 23
3. Fossil dating methods and DNA evidence ................................................................................. 26
4. The hominin family tree ............................................................................................................. 28
5. Chronology-based discussion ................................................................................................... 29
6. Conclusion ................................................................................................................................ 32
III. Student Handouts ........................................................................................................................... 33
IV. Other Resources ............................................................................................................................ 43
V. Bibliography .................................................................................................................................... 43
3
Foreword Observing the finches of the Galápagos, Darwin noted that their beaks were variously shaped — some broad, others elongated, still others small and short. He surmised that in spite of these differences, the island’s finches were close cousins: "Seeing this gradation and diversity of structure in one small, intimately related group of birds," he wrote in The Voyage of the Beagle, "one might really fancy that from an original paucity of birds in this archipelago, one species had been taken and modified for different ends." The idea of a hands-on, inquiry-based lab on hominin evolution was born out of a 2004 "discovery" made by Chris Bayer at the National Museum of Kenya in Nairobi, where a visitor was welcomed to inspect and prod an array of fossil replicas, native originals unearthed from the East African soil. "Why should one have to come all the way to Nairobi to come face-to-face with humanity's forefathers and mothers?" he wondered. A serendipitous meeting at a New Orleans bike shop between recent Tulane graduate Michael Luberda and then grad student Chris Bayer in 2011 led to a dialectic that is now AncientAncestors. Together we developed this curriculum, fine-tuning the nuances of pedagogy and subject, allowing the student to inspect the skulls of which Darwin could only dream. With early guidance from Tulane anthropology professor Dr. Trenton Holliday, the 'Be a Paleoanthropologist for a Day' lab was further refined. After assembling the main components of this lab – the eleven skulls, protractors, calipers, and this curriculum – we delivered the lab free of charge to interested teachers in the greater New Orleans area. Post-lab survey data and exit interviews with the teachers allowed us to hone our curriculum to what it is today, encouraging also biology teachers to administer this lab. We believe that this tactile, hands-on approach compellingly allows students to answer specific questions concerning our distant past. In fact, this curriculum places your students in the driver seat of discovery. At first, students gain an appreciation for the morphological diversity and similarities of our hominin ancestors, and, like Darwin, may conclude that at the very least they are looking at close cousins. At best, students are able to empirically grasp the major adaptations that became hallmarks of human evolution. The question 'Where do we come from?' is timeless. Today, the field of Paleoanthropology provides more answers than ever before, which, through an engaging lab, can be conveyed in your classroom. We’d like to thank subject matter and pedagogical experts, Trenton Holliday, Grant McCall, Barbara Forrest, Larry Flammer, Dustin Eirdosh, Susan Hanisch and Molly Selba for their critique and input on this lab. With this lab, dear instructor, you are offering your students a unique, meaningful learning opportunity!
- Michael Luberda and Chris Bayer
4
I. Course Specs
Objectives: The objective of this lab-based course is to enhance the biology student’s
understanding of the discipline of paleoanthropology – i.e. the multidisciplinary study of human
evolution – deepen his/her knowledge about the hominid fossil record, and awaken an interest
in the subject of human origins.
Purpose: Granting high school students hands-on exposure to anthropological facts – in the
form of cranium replicas of our early biological ancestors and relatives – has a profound effect
on their understanding of evolution and the prehistory of humankind. Having in many cases
survived for millions of years until they were found, hominin skulls provide irrefutable evidence
for human evolution. Through lab-based analysis, high school biology students are challenged
to become the paleoanthropologists and discover facts about human evolution from guided
observations and measurements of skull replicas. In doing so, this course will help the student
answer the questions: “Where do we come from?” and “What methods are applied to generate
knowledge about human evolution?” This learning experience on the essential subject of
human evolution will place the young mind in the driver’s seat of discovery and knowledge.
Timeframe: The course may be completed between 2 and 5 hours of lab time, depending on
the teacher’s time parameters.
Learning format: This course emphasizes scientific inquiry in the lab setting. While the
subject will be briefly introduced through a mini lecture, the principal pedagogical method
employed by the workshop is inquiry-based learning – data collection, interpretation and
discussion. This course thus moves away from the lecture-and-demonstration model and
textbook-based treatments of the subject. Through hands-on analyses of replicas of hominin
crania and participative discussion to interpret the findings, students' inductive reasoning skills
are tested and rewarded, enabling first-hand learning.
Prerequisite Knowledge: While not required, it would be helpful if students had prior
knowledge with regard to: (1) the concept of ratio, (2) concept of index, (3) taxonomical
groupings (genus, species), and (4) evolutionary principles (common ancestry, descent with
modification, survival of the best adapted, natural selection). No prerequisite knowledge of
paleoanthropology is needed. Pertinent terms will be taught and no prior knowledge on the
subject is presumed.
Learning Objectives:
A. Knowledge
Clearly articulated knowledge that the student will be able to acquire from this lab-based
course are the following:
• Paleoanthropology is the multidisciplinary study of human evolution.

5
• A fossilized skull of a hominin is harder to find than a diamond.
• A skull replica is a copy of the original fossilized skull.
• The origins of principal hominin fossil finds and the importance of Africa.
• Foramen magnum progressively moves to the center of the cranium as hominins
increasingly walk upright.
• The increase of cranial capacity and the emergence of a pronounced frontal lobe over
time is correlated with the flowering of intelligence.
• The face becomes generally less prognathic (more orthognathic) over time – linked to
the improved diet (less fibrous food) consumed by hominins.
• The chronology of the three milestones of hominin evolution – in terms of dramatic
change over time – are bipedalism, orthognathism, and encephalization.
• The smart, social, versatile, bipedal human is the sole surviving hominin species.
B. Skills
Students will have the opportunity to hone the following skills:
• conduct angle and length measurements with specialized tools;
• analyze a multi-indicator dataset and apply inductive reasoning to come to conclusions.
Materials: 11 hominin skull replicas (as listed in Handout #2), a selection which comprises
some of the best-preserved examples of hominin species, 11 protractors (custom, bevel angle
gauge) and 11 calipers (long jaw) and a few handouts are employed.
Target Audience: This short course has been tailored for high school biology students.
Procedures:
1. Place a caliper and a protractor at each station (11);
2. Divide into groups and assign station;
3. Introduce paleoanthropology and the skull replicas and provide Handouts #1 – #5 to
students;
4. Demo measurement with Homo sapiens;
5. Have students measure skull replicas, record the measurement data, and perform the
calculations on the worksheet;
6. Have students rotate until they have visited each station or until the time limit has been
reached;
7. Collate the data and together analyze the graphed data;
8. Discuss morphological function of each main analyzed trait;
9. Have students propose a phylogenetic tree and then reveal the dated order (pass out
Handout #6 - #7).
10. Hold chronology-based discussion, such as how the brain in the Homo genus likely
increased, and conclude lab.
6
II. Course Content
A. Brief introductory lecture
Learning objectives
Students will be able to answer the following questions:
• What is the field of paleoanthropology?
• What is a skull replica?
• What are fossils and how did they come into being?
• What is the distinction between a hominin and a hominid?
• What is the significance of skull locations and the Great Rift Valley?
● Paleoanthropology: The multidisciplinary study of human origins, of which the two main
branches are human paleontology and paleolithic archaeology.
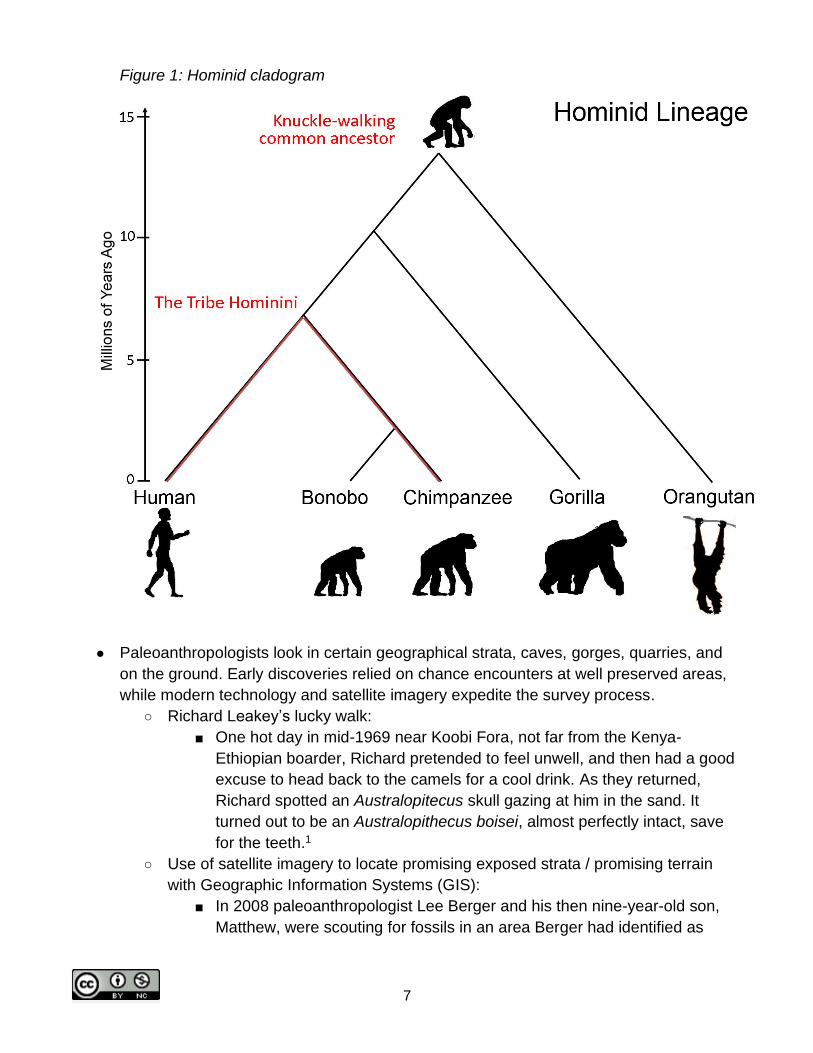
● Humans, chimpanzees, and the other great apes are hominids. Hominins are
hominids that belong to the taxonomic tribe Hominini that are probable ancestors to
humans. Homo sapiens is the only surviving hominin species, while extant great apes
are present day examples of other hominid lineages.
● Figure 1 below is a helpful resource for showing the difference between Hominid and
Hominin, but also is helpful for noting the shared common ancestors. 13-15 million
years ago, we have the origin of all great apes, and 5-7 million years ago the split
between chimpanzees and humans occurs. These findings are based on genetic data,
not archaeology data.
● Fossilization processes proceed differently for different kinds of tissues and under
different kinds of conditions. The most common process is permineralization or
petrification, in which rock-like minerals seep in slowly and replace the original organic
tissues with silica, calcite or pyrite, forming a rock-like fossil – it can preserve hard and
soft parts, and discoloration is a result of specific minerals in the soil.
● A fossilized skull of a hominin is harder to find than a diamond: simply put, the
environmental conditions under which fossilization takes place are quite rare – and it is
highly unlikely that any given organism will leave behind a fossil.
● Paleoanthropology fieldwork is hard work – it often takes place in unforgiving terrain
where you are exposed to the elements.
7
Figure 1: Hominid cladogram
● Paleoanthropologists look in certain geographical strata, caves, gorges, quarries, and
on the ground. Early discoveries relied on chance encounters at well preserved areas,
while modern technology and satellite imagery expedite the survey process.
○ Richard Leakey’s lucky walk:
■ One hot day in mid-1969 near Koobi Fora, not far from the Kenya-
Ethiopian boarder, Richard pretended to feel unwell, and then had a good
excuse to head back to the camels for a cool drink. As they returned,
Richard spotted an Australopitecus skull gazing at him in the sand. It
turned out to be an Australopithecus boisei, almost perfectly intact, save
for the teeth.1
○ Use of satellite imagery to locate promising exposed strata / promising terrain
with Geographic Information Systems (GIS):
■ In 2008 paleoanthropologist Lee Berger and his then nine-year-old son,
Matthew, were scouting for fossils in an area Berger had identified as
8
promising through Google Earth. Matthew stumbled upon a fossilized
bone which led to the Australopithecus sediba find in South Africa.
● Skull finds are the real thing! One “find” – “Piltdown man” – was exposed as forgery in
1953, consisting of a human skull and orangutan jaw.2
● A skull replica is a copy of the original skull: skull replicas are made either through:
○ careful casting techniques in which a mold is made from the original skull, and
then a cast is made from the mold, or
○ utilizing 3D printing technology (3D computer model & a printer).
This is the end of the introductory lecture. Following this phase is the lab demo where students
will learn to accurately measure the crania. Lab group sizes are flexible to class size, but
certain measurements are best conducted with one or two partners. Briefly review the hominin
species, discoverer/anthropologist, year of discovery as well as the location of the skull finds
using Handout #2. Below are a few intriguing anecdotes related to some species that can be
mentioned as skulls are being announced and distributed to groups. Also mentioned in each
classification are notable skull finds not included in this lab analysis at the high school level.
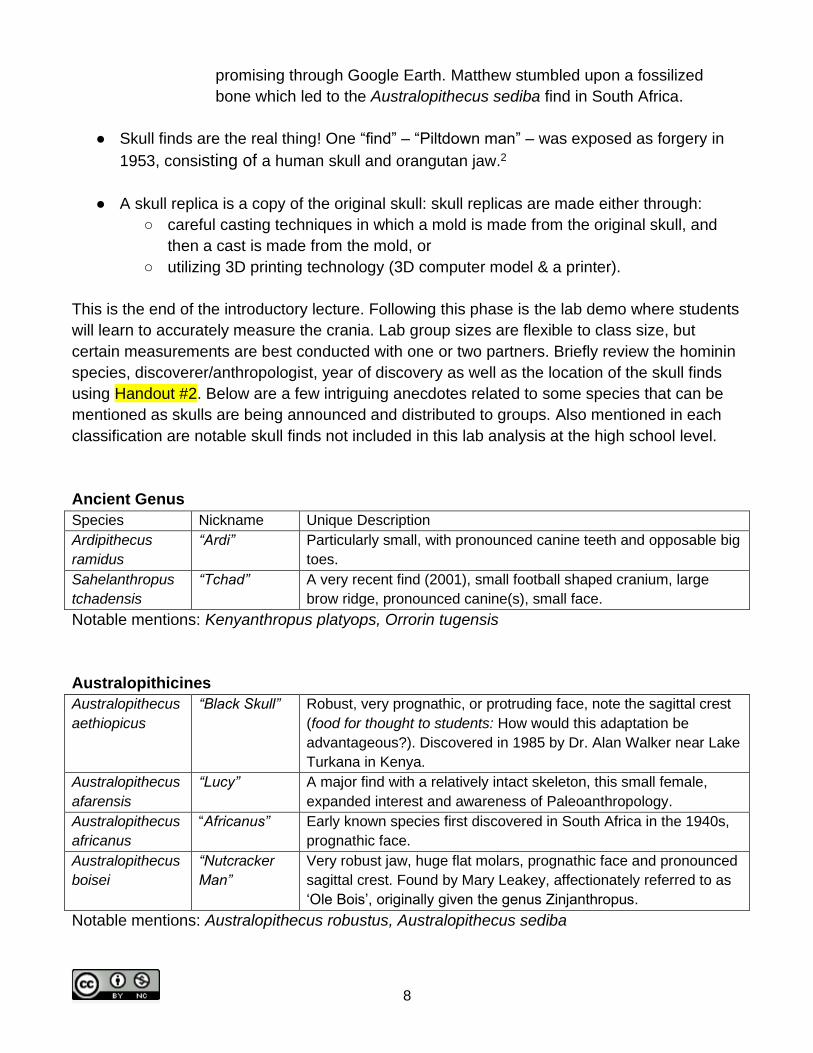
Ancient Genus
Species Nickname Unique Description
Ardipithecus
ramidus
“Ardi” Particularly small, with pronounced canine teeth and opposable big
toes.
Sahelanthropus
tchadensis
“Tchad” A very recent find (2001), small football shaped cranium, large
brow ridge, pronounced canine(s), small face.
Notable mentions: Kenyanthropus platyops, Orrorin tugensis
Australopithicines
Australopithecus
aethiopicus
“Black Skull” Robust, very prognathic, or protruding face, note the sagittal crest
(food for thought to students: How would this adaptation be
advantageous?). Discovered in 1985 by Dr. Alan Walker near Lake
Turkana in Kenya.
Australopithecus
afarensis
“Lucy” A major find with a relatively intact skeleton, this small female,
expanded interest and awareness of Paleoanthropology.
Australopithecus
africanus
“Africanus” Early known species first discovered in South Africa in the 1940s,
prognathic face.
Australopithecus
boisei
“Nutcracker
Man”
Very robust jaw, huge flat molars, prognathic face and pronounced
sagittal crest. Found by Mary Leakey, affectionately referred to as
‘Ole Bois’, originally given the genus Zinjanthropus.
Notable mentions: Australopithecus robustus, Australopithecus sediba
9
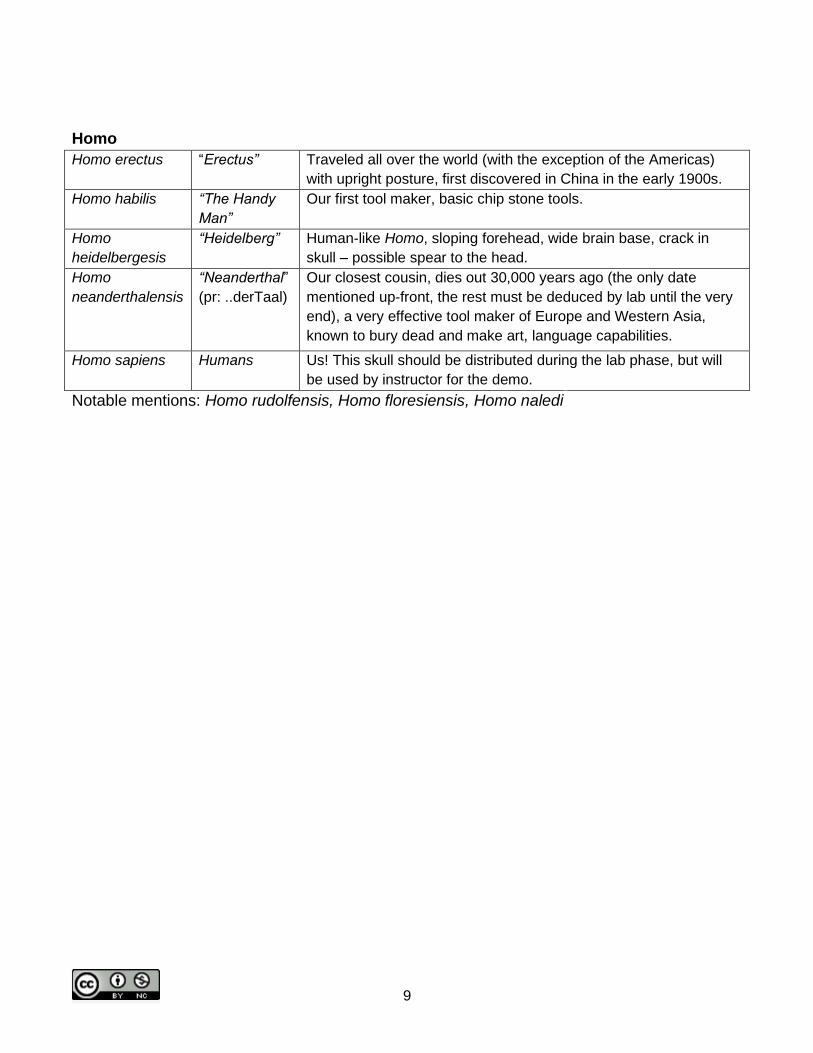
Homo
Homo erectus “Erectus” Traveled all over the world (with the exception of the Americas)
with upright posture, first discovered in China in the early 1900s.
Homo habilis “The Handy
Man”
Our first tool maker, basic chip stone tools.
Homo
heidelbergesis
“Heidelberg” Human-like Homo, sloping forehead, wide brain base, crack in
skull – possible spear to the head.
Homo
neanderthalensis
“Neanderthal”
(pr: ..derTaal)
Our closest cousin, dies out 30,000 years ago (the only date
mentioned up-front, the rest must be deduced by lab until the very
end), a very effective tool maker of Europe and Western Asia,
known to bury dead and make art, language capabilities.
Homo sapiens Humans Us! This skull should be distributed during the lab phase, but will
be used by instructor for the demo.
Notable mentions: Homo rudolfensis, Homo floresiensis, Homo naledi
This work is licensed under the Creative Commons Attribution-NonCommercial 4.0 International License.
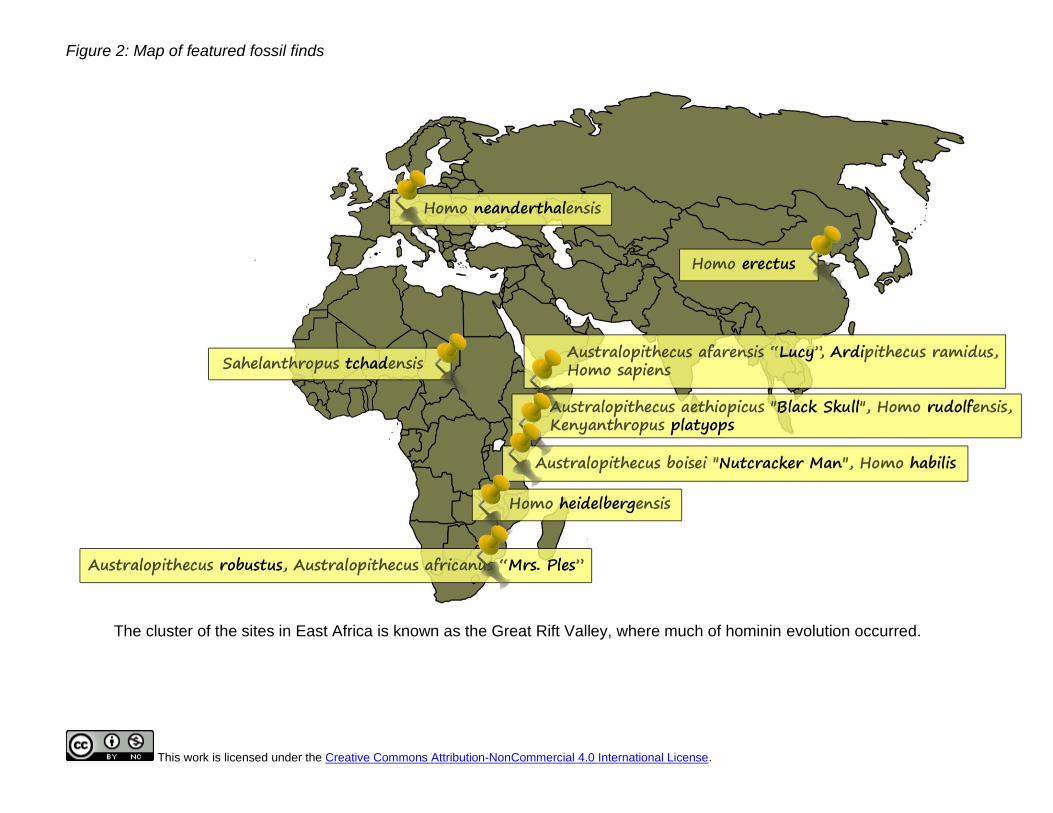
Figure 2: Map of featured fossil finds
The cluster of the sites in East Africa is known as the Great Rift Valley, where much of hominin evolution occurred.
11
B. Measurement demo
Learning objectives
Students will be able to answer the following questions:
• What are the 3 important milestones of human evolution?
• What are the cranium, maxilla, and foramen magnum?
• How do you use measurement tools to conduct measurements?
• There are number of milestones in hominin evolution; 3 very important ones are:
o bipedalism – walking on two legs
o orthognathism – a less protruding jaw and reduced midface resulting in a more
vertical face
o encephalization – an increasing cranial capacity
Using Homo sapiens as the demo skull, students are introduced to the morphological feature,
then shown how to conduct the measurements featured in each of the 3 modules (which will
be further explained in successive sections as well as the video resources available online).
They will conduct their first skull measurement alongside the demo, and any measurement
questions will be answered at this time. The ‘Analyze’ questions may be posed to the students
during the lab demo to keep them focused on the purpose, but the discussion will go deeper
into these concepts.
C. Open lab
Learning objectives
Students will be able to answer the following questions:
• How does one measure and calculate the size of the cranium, maxillary angle, and the
position of the foramen magnum?
• How does one analyze and interpret the data?
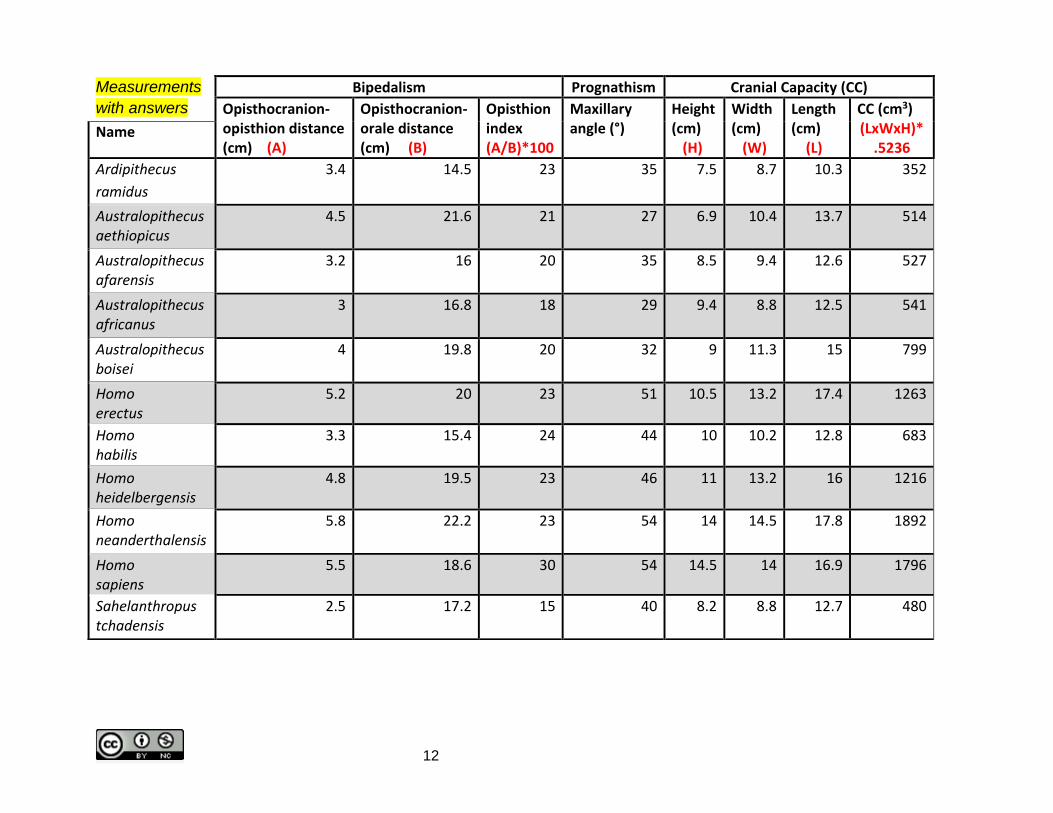
The open lab consists of 3 modules. Students have a few minutes at each station to
measure, record in their data sheet (shown below), calculate and analyze, until
switching to the next skull. Student measurements will vary, below are the expert
measurements.
12
Measurements
with answers
Bipedalism Prognathism Cranial Capacity (CC)
Opisthocranion- opisthion distance (cm) (A)
Opisthocranion- orale distance (cm) (B)
Opisthion index (A/B)*100
Maxillary angle (°)
Height (cm) (H)
Width(cm) (W)
Length (cm) (L)
CC (cm3) (LxWxH)*
.5236 Name
Ardipithecus
ramidus
3.4 14.5 23 35 7.5 8.7 10.3 352
Australopithecus aethiopicus
4.5 21.6 21 27 6.9 10.4 13.7 514
Australopithecus afarensis
3.2 16 20 35 8.5 9.4 12.6 527
Australopithecus africanus
3 16.8 18 29 9.4 8.8 12.5 541
Australopithecus boisei
4 19.8 20 32 9 11.3 15 799
Homo erectus
5.2 20 23 51 10.5 13.2 17.4 1263
Homo habilis
3.3 15.4 24 44 10 10.2 12.8 683
Homo heidelbergensis
4.8 19.5 23 46 11 13.2 16 1216
Homo neanderthalensis
5.8 22.2 23 54 14 14.5 17.8 1892
Homo sapiens
5.5 18.6 30 54 14.5 14 16.9 1796
Sahelanthropus tchadensis
2.5 17.2 15 40 8.2 8.8 12.7 480
13
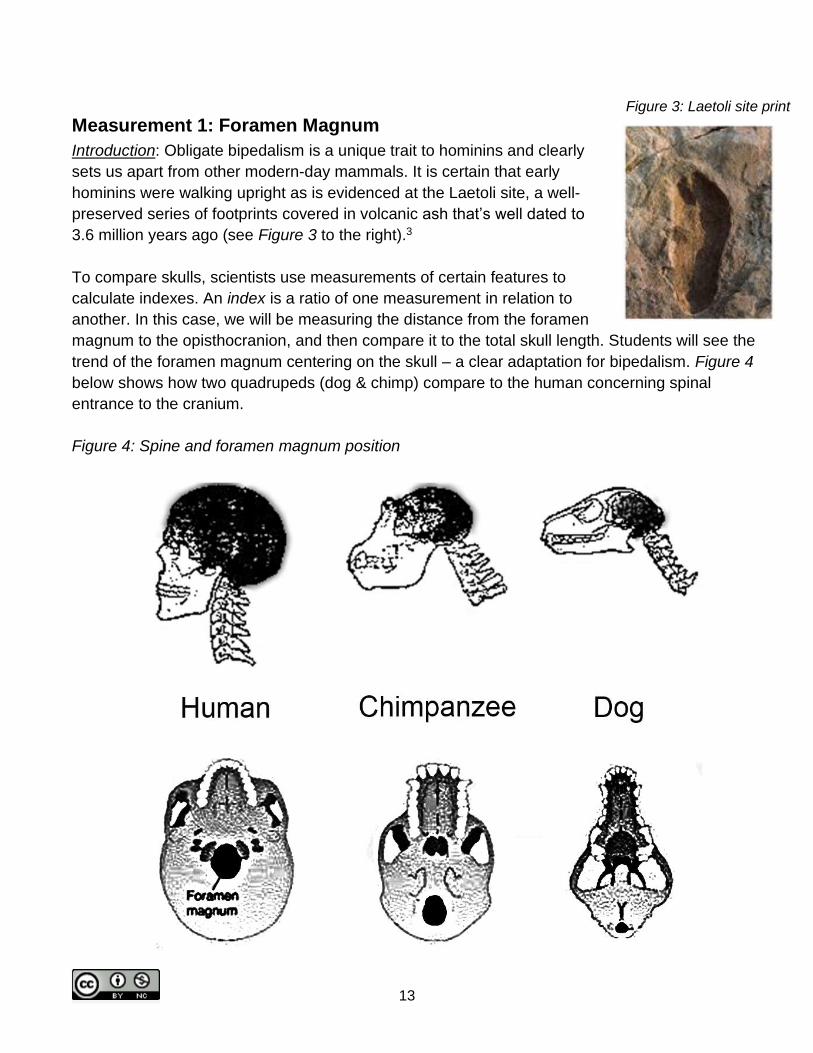
Measurement 1: Foramen Magnum
Introduction: Obligate bipedalism is a unique trait to hominins and clearly
sets us apart from other modern-day mammals. It is certain that early
hominins were walking upright as is evidenced at the Laetoli site, a well-
preserved series of footprints covered in volcanic ash that’s well dated to
3.6 million years ago (see Figure 3 to the right).3
To compare skulls, scientists use measurements of certain features to
calculate indexes. An index is a ratio of one measurement in relation to
another. In this case, we will be measuring the distance from the foramen
magnum to the opisthocranion, and then compare it to the total skull length. Students will see the
trend of the foramen magnum centering on the skull – a clear adaptation for bipedalism. Figure 4
below shows how two quadrupeds (dog & chimp) compare to the human concerning spinal
entrance to the cranium.
Figure 4: Spine and foramen magnum position
Figure 3: Laetoli site print
14
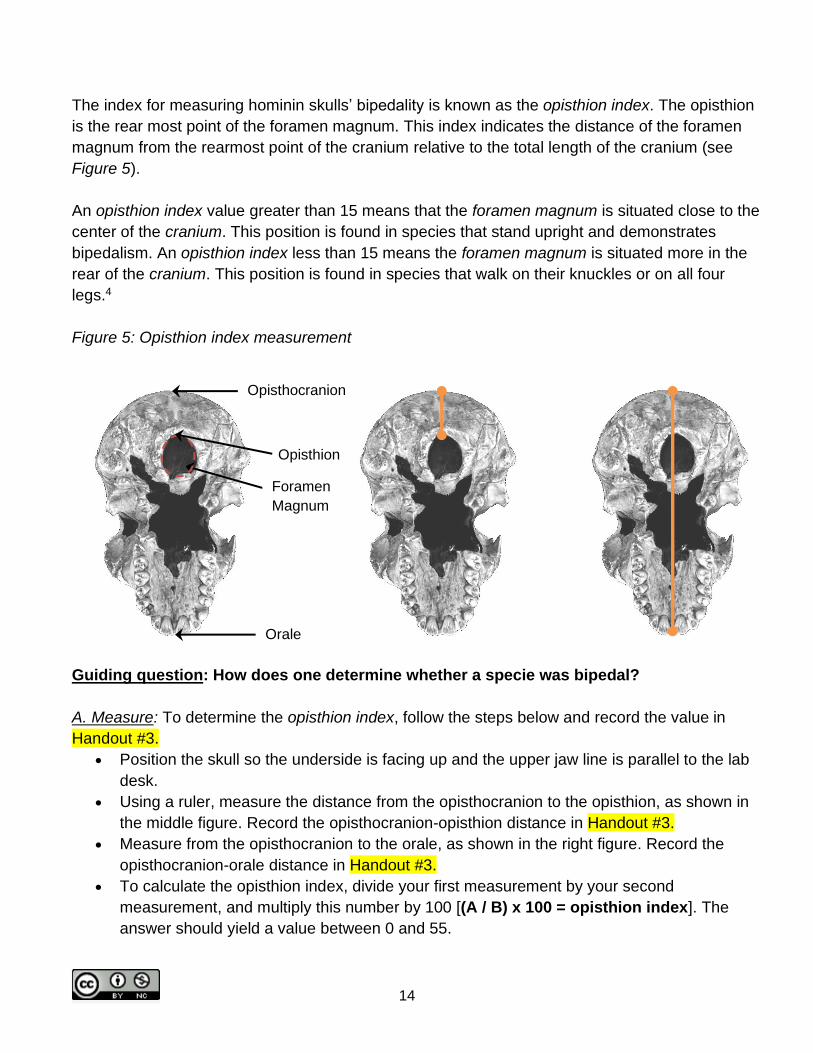
The index for measuring hominin skulls’ bipedality is known as the opisthion index. The opisthion
is the rear most point of the foramen magnum. This index indicates the distance of the foramen
magnum from the rearmost point of the cranium relative to the total length of the cranium (see
Figure 5).
An opisthion index value greater than 15 means that the foramen magnum is situated close to the
center of the cranium. This position is found in species that stand upright and demonstrates
bipedalism. An opisthion index less than 15 means the foramen magnum is situated more in the
rear of the cranium. This position is found in species that walk on their knuckles or on all four
legs.4
Figure 5: Opisthion index measurement
Guiding question: How does one determine whether a specie was bipedal?
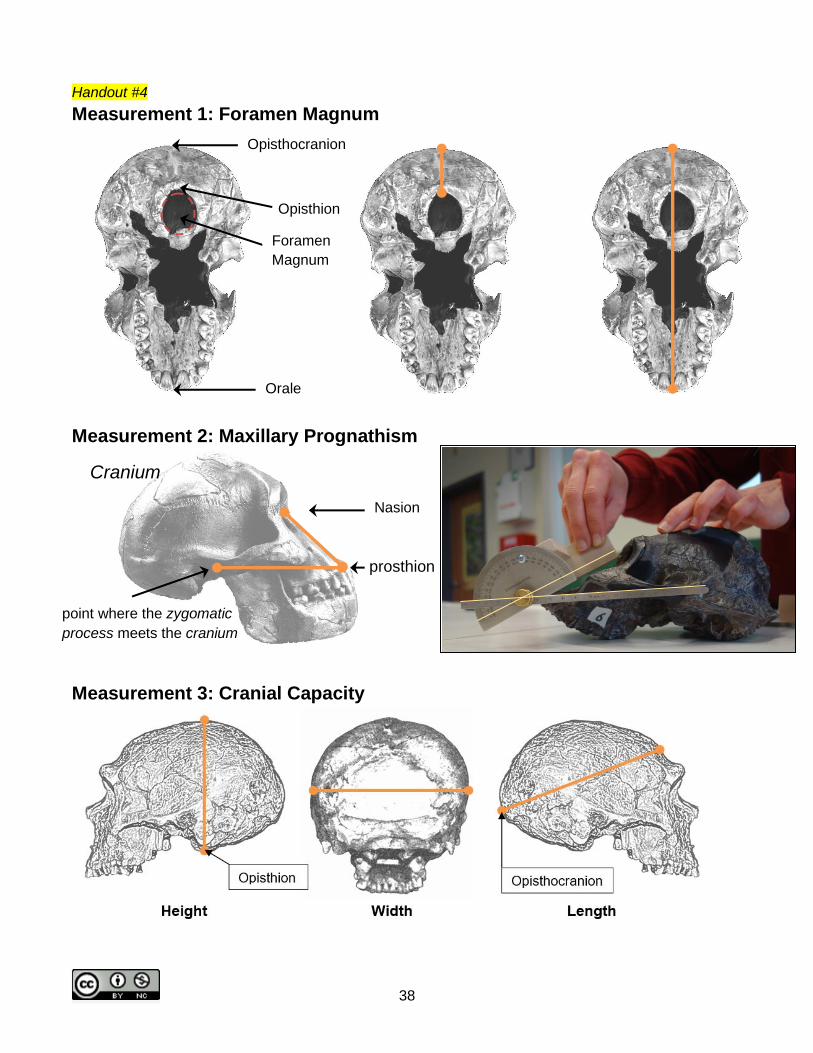
A. Measure: To determine the opisthion index, follow the steps below and record the value in
Handout #3.
• Position the skull so the underside is facing up and the upper jaw line is parallel to the lab
desk.
• Using a ruler, measure the distance from the opisthocranion to the opisthion, as shown in
the middle figure. Record the opisthocranion-opisthion distance in Handout #3.
• Measure from the opisthocranion to the orale, as shown in the right figure. Record the
opisthocranion-orale distance in Handout #3.
• To calculate the opisthion index, divide your first measurement by your second
measurement, and multiply this number by 100 [(A / B) x 100 = opisthion index]. The
answer should yield a value between 0 and 55.
Opisthocranion
Foramen
Magnum
Orale
Opisthion
15
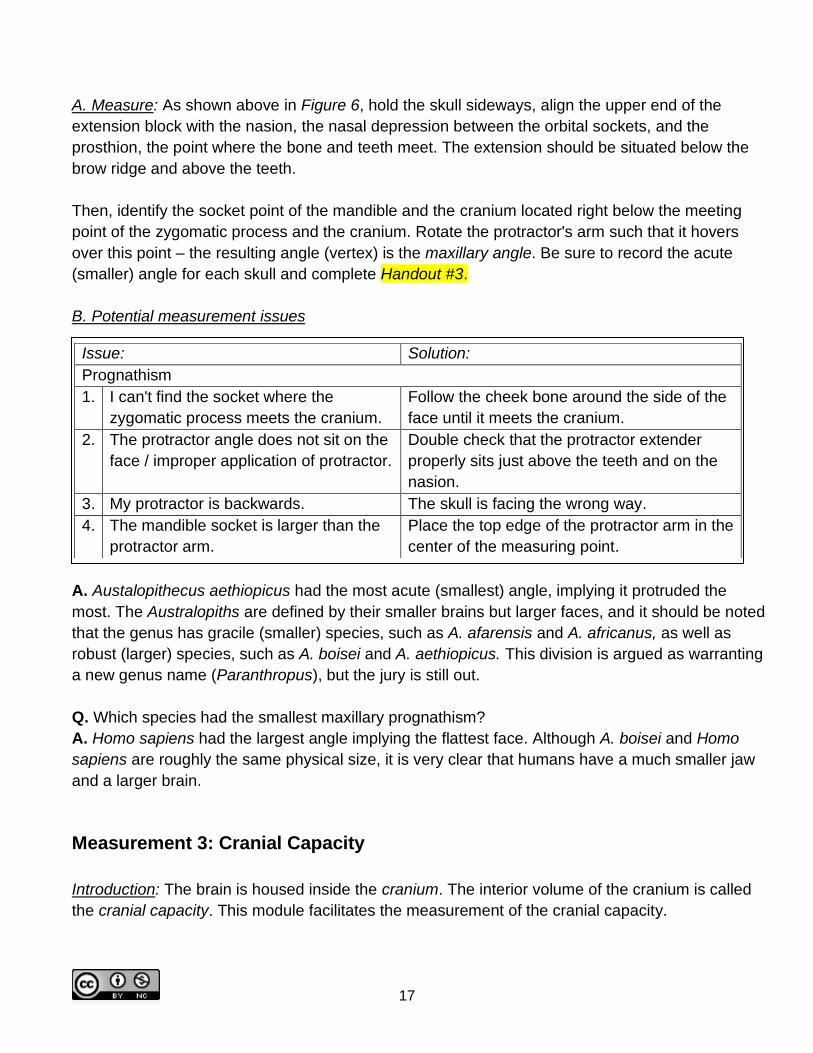
B. Potential measurement issues:
C. Analyze: Examine the opisthion indexes you calculated.
Q. Which of these hominins was potentially not bipedal?
A. With an opisthion index of 15, Sahelanthropus tchadensis was a species representing the
ancestral quadrupedal state, probably occupying an arboreal niche.
Q. Based on the opisthion indexes, which skulls are most similar to the Homo sapiens skull?
A. The Neanderthal is closest. In general, the genus Homo has a significantly larger opisthion
index than the Australopiths.
Q. Did the genus Australopithecus walk upright?
A. The four Australopiths were bipedal, but their stature was hunched over. This is also supported
by their larger torso length and shorter leg length.
Measurement 2: Maxillary Prognathism
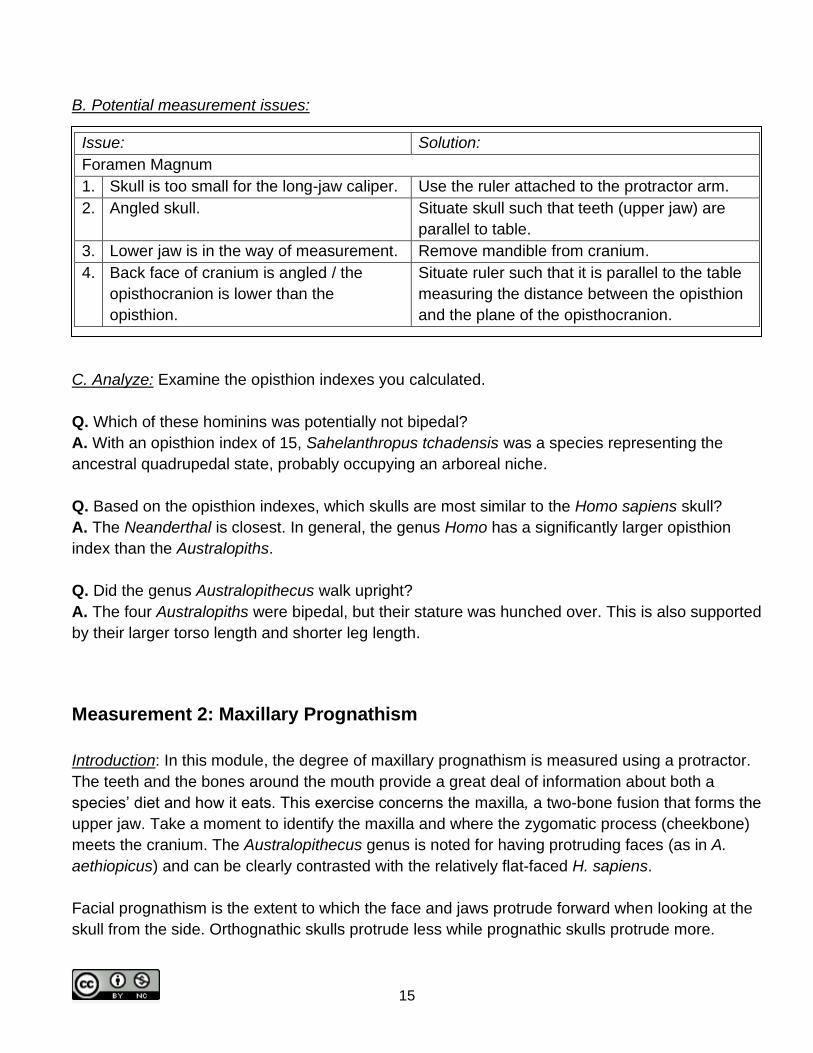
Introduction: In this module, the degree of maxillary prognathism is measured using a protractor.
The teeth and the bones around the mouth provide a great deal of information about both a
species’ diet and how it eats. This exercise concerns the maxilla, a two-bone fusion that forms the
upper jaw. Take a moment to identify the maxilla and where the zygomatic process (cheekbone)
meets the cranium. The Australopithecus genus is noted for having protruding faces (as in A.
aethiopicus) and can be clearly contrasted with the relatively flat-faced H. sapiens.
Facial prognathism is the extent to which the face and jaws protrude forward when looking at the
skull from the side. Orthognathic skulls protrude less while prognathic skulls protrude more.
Issue: Solution:
Foramen Magnum
1. Skull is too small for the long-jaw caliper. Use the ruler attached to the protractor arm.
2. Angled skull. Situate skull such that teeth (upper jaw) are
parallel to table.
3. Lower jaw is in the way of measurement. Remove mandible from cranium.
4. Back face of cranium is angled / the
opisthocranion is lower than the
opisthion.
Situate ruler such that it is parallel to the table
measuring the distance between the opisthion
and the plane of the opisthocranion.
16
Prognathic skulls are marked by larger mandibles, and consequentially larger teeth.
Australopithecus boisei is an excellent example with molars the size of cow’s teeth (an appropriate
hint when discussing the diet of Australopiths versus Homo).
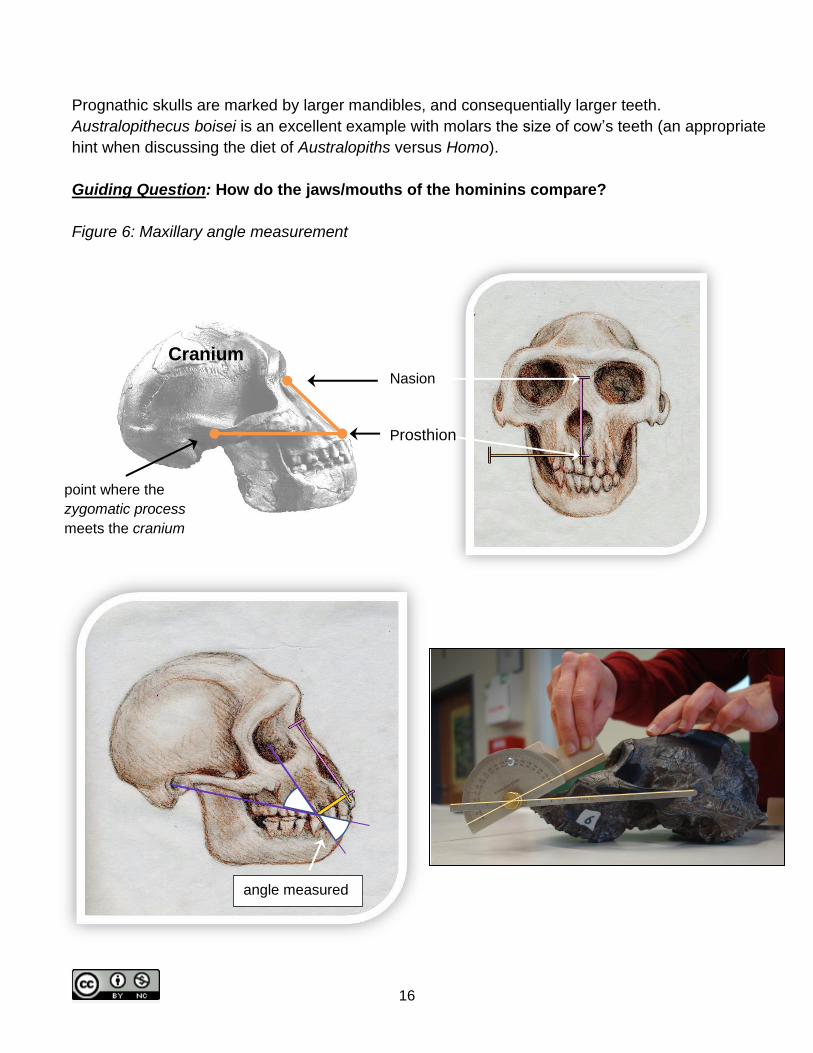
Guiding Question: How do the jaws/mouths of the hominins compare?
Figure 6: Maxillary angle measurement
Cranium
Prosthion
point where the
zygomatic process
meets the cranium
Nasion
angle measured
17
A. Measure: As shown above in Figure 6, hold the skull sideways, align the upper end of the
extension block with the nasion, the nasal depression between the orbital sockets, and the
prosthion, the point where the bone and teeth meet. The extension should be situated below the
brow ridge and above the teeth.
Then, identify the socket point of the mandible and the cranium located right below the meeting
point of the zygomatic process and the cranium. Rotate the protractor's arm such that it hovers
over this point – the resulting angle (vertex) is the maxillary angle. Be sure to record the acute
(smaller) angle for each skull and complete Handout #3.
B. Potential measurement issues
C. Analyze: Examine the maxillary prognathism you calculated.
Q. Which species had the largest maxillary prognathism?
A. Austalopithecus aethiopicus had the most acute (smallest) angle, implying it protruded the
most. The Australopiths are defined by their smaller brains but larger faces, and it should be noted
that the genus has gracile (smaller) species, such as A. afarensis and A. africanus, as well as
robust (larger) species, such as A. boisei and A. aethiopicus. This division is argued as warranting
a new genus name (Paranthropus), but the jury is still out.
Q. Which species had the smallest maxillary prognathism?
A. Homo sapiens had the largest angle implying the flattest face. Although A. boisei and Homo
sapiens are roughly the same physical size, it is very clear that humans have a much smaller jaw
and a larger brain.
Measurement 3: Cranial Capacity
Introduction: The brain is housed inside the cranium. The interior volume of the cranium is called
the cranial capacity. This module facilitates the measurement of the cranial capacity.
Issue: Solution:
Prognathism
1. I can't find the socket where the
zygomatic process meets the cranium.
Follow the cheek bone around the side of the
face until it meets the cranium.
2. The protractor angle does not sit on the
face / improper application of protractor.
Double check that the protractor extender
properly sits just above the teeth and on the
nasion.
3. My protractor is backwards. The skull is facing the wrong way.
4. The mandible socket is larger than the
protractor arm.
Place the top edge of the protractor arm in the
center of the measuring point.
18
Brain size has a long history of analysis and measurement, sometimes washed with racism and
sexism. Within hominin lineage, brain expansion almost quadruples, from S. tchadensis to H.
neanderthalensis, and this represents a very significant change. Students should be reminded that
within Homo sapiens, cranial capacity varies widely: from 1200 cubic centimeters (cc) up to
2000cc.
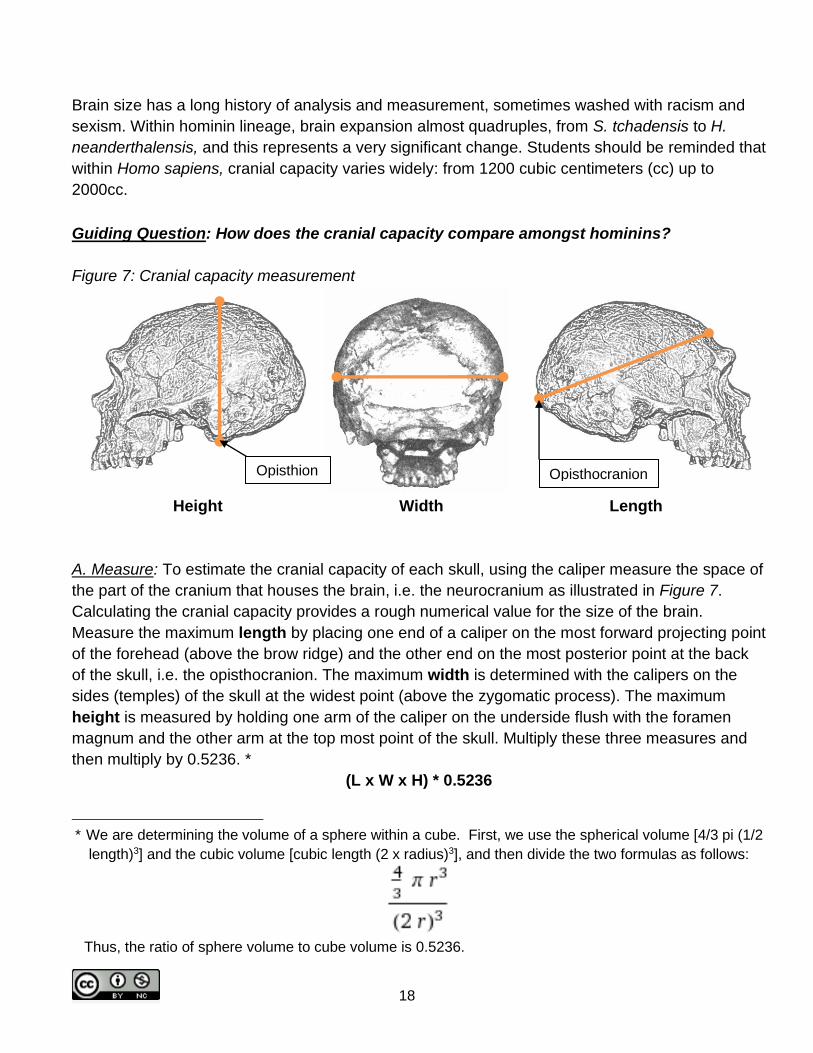
Guiding Question: How does the cranial capacity compare amongst hominins?
Figure 7: Cranial capacity measurement
Height Width Length
A. Measure: To estimate the cranial capacity of each skull, using the caliper measure the space of
the part of the cranium that houses the brain, i.e. the neurocranium as illustrated in Figure 7.
Calculating the cranial capacity provides a rough numerical value for the size of the brain.
Measure the maximum length by placing one end of a caliper on the most forward projecting point
of the forehead (above the brow ridge) and the other end on the most posterior point at the back
of the skull, i.e. the opisthocranion. The maximum width is determined with the calipers on the
sides (temples) of the skull at the widest point (above the zygomatic process). The maximum
height is measured by holding one arm of the caliper on the underside flush with the foramen
magnum and the other arm at the top most point of the skull. Multiply these three measures and
then multiply by 0.5236. *1
(L x W x H) * 0.5236
*1We are determining the volume of a sphere within a cube. First, we use the spherical volume [4/3 pi (1/2
length)3] and the cubic volume [cubic length (2 x radius)3], and then divide the two formulas as follows:
Thus, the ratio of sphere volume to cube volume is 0.5236.
Opisthion Opisthocranion
19
B. Potential measurement issues
C. Analyze: Examine the estimated cranial capacities you calculated.
Q. Which species had the largest cranial capacity?
A. Homo nanderthalensis had the largest brain. Although it should be noted where his brain is
larger compared to Homo sapiens, he has much less of a forehead, and a wider cranium towards
the back, in a similar fashion as Homo heidelbergensis.
Q. Of what is cranial capacity a good indicator, at least across genus?
A. The larger brain size of Homo has a bigger potential for higher brain functions, increased tool
use, and group complexity. Homo habilis – as the handy man – overcame his gracile stature to
compete and outlive his competitors, the robust Australopithicines.
D. Discussion of results and interpretation
Learning objectives
Students should understand the following questions:
• What are the morphological changes and patterns evident from the data?
• Which dating methods are used due to their accuracy and reliability?
• What is continuity, and where the dead ends of measured evolutionary features?
• What is the chronology of evolutionary features and where might there have been inter-
species competition?
Issue: Solution:
Cranial Capacity
1. While measuring height, the sagittal
crest is in the way.
Place caliper arm directly adjacent to it.
2. While measuring width, the zygomatic
processes are in the way/protruding.
Place caliper arm on inside or above the
zygomats/cheek bones.
3. Where does the caliper go to measure
the length?
Place one caliper arm above and behind the
brow ridge and the second arm extends
back to create the longest diagonal with the
opisthocranion.
20
1. Review of measurements
Review the observed values in plenary with Handout #3 in hand and present the graphs below of
the summarized results. Questions and answers follow each graph that may guide the classroom
discussion.
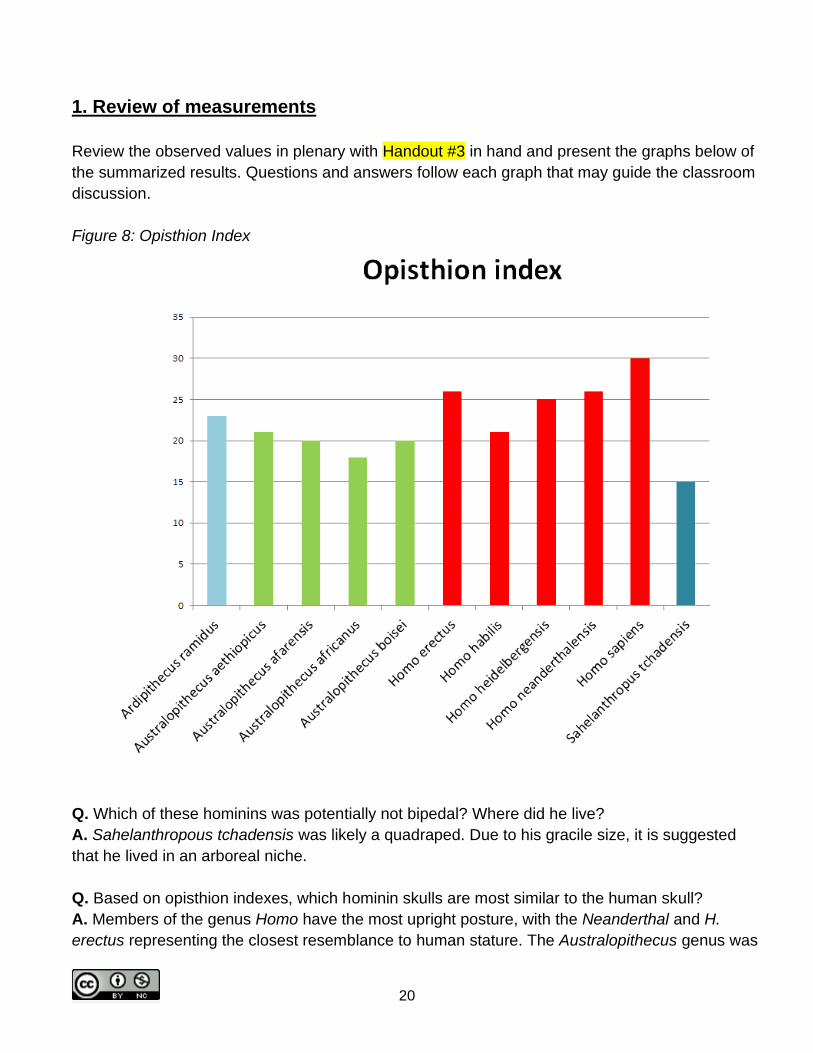
Figure 8: Opisthion Index
Q. Which of these hominins was potentially not bipedal? Where did he live?
A. Sahelanthropous tchadensis was likely a quadraped. Due to his gracile size, it is suggested
that he lived in an arboreal niche.
Q. Based on opisthion indexes, which hominin skulls are most similar to the human skull?
A. Members of the genus Homo have the most upright posture, with the Neanderthal and H.
erectus representing the closest resemblance to human stature. The Australopithecus genus was
21
bipedal, but would have had a more hunkered over stature. A visual example of hunched over
walking is helpful.
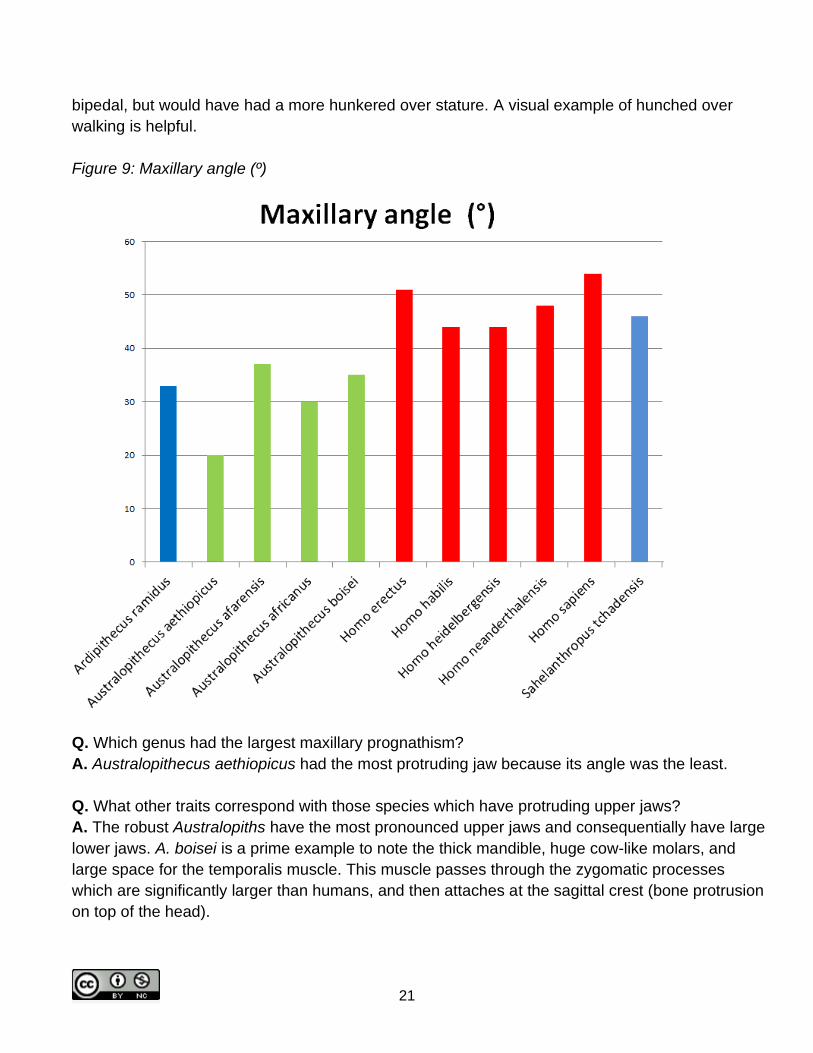
Figure 9: Maxillary angle (º)
Q. Which genus had the largest maxillary prognathism?
A. Australopithecus aethiopicus had the most protruding jaw because its angle was the least.
Q. What other traits correspond with those species which have protruding upper jaws?
A. The robust Australopiths have the most pronounced upper jaws and consequentially have large
lower jaws. A. boisei is a prime example to note the thick mandible, huge cow-like molars, and
large space for the temporalis muscle. This muscle passes through the zygomatic processes
which are significantly larger than humans, and then attaches at the sagittal crest (bone protrusion
on top of the head).
22
A helpful activity to show the function of the temporalis muscle is having students put the fingers
on their temples, move their jaw up and down, and it becomes apparent that the jaw (temporalis)
muscle attaches on the side of the head.
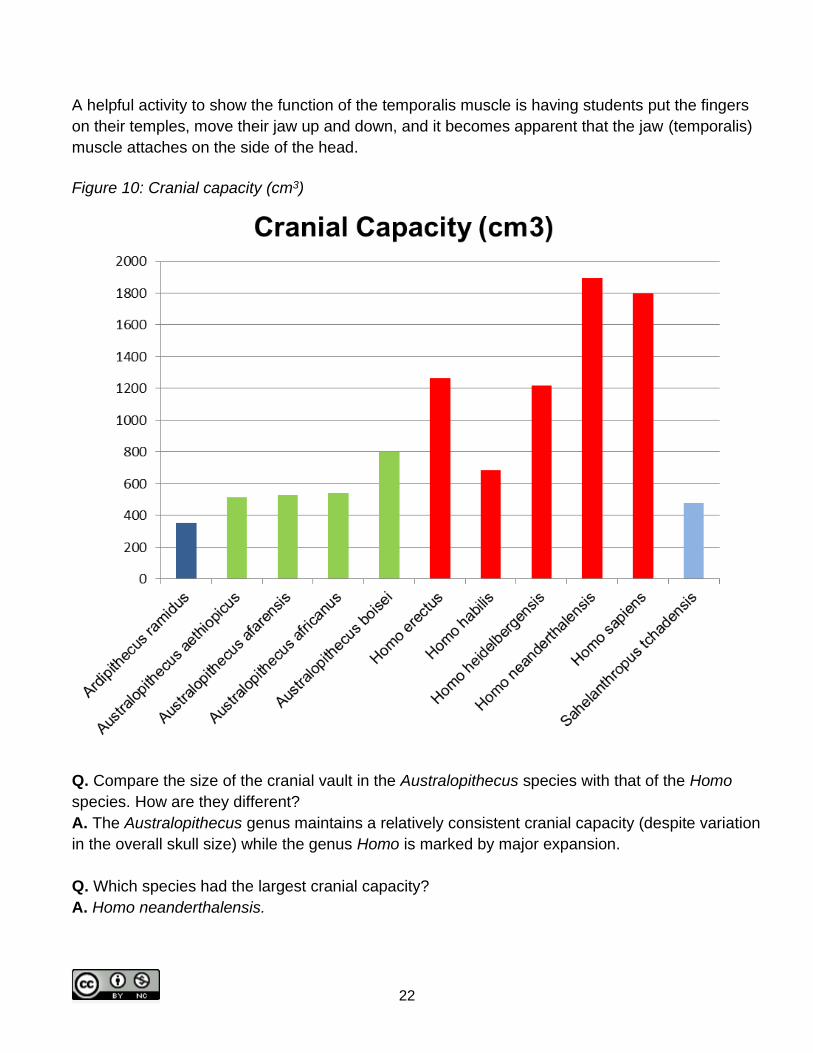
Figure 10: Cranial capacity (cm3)
Q. Compare the size of the cranial vault in the Australopithecus species with that of the Homo
species. How are they different?
A. The Australopithecus genus maintains a relatively consistent cranial capacity (despite variation
in the overall skull size) while the genus Homo is marked by major expansion.
Q. Which species had the largest cranial capacity?
A. Homo neanderthalensis.
23
Q. How does the cranial vault in Homo sapiens compare to other members of Homo?
A. The neanderthal has a sloping forehead behind the pronounced brow ridge as opposed to the
large vertical forehead of the Homo sapiens. The Neanderthal brain is longer and wider in the
back, while the Homo sapiens brain has a more pronounced frontal lobe region.
2. Morphological function
Depending on class size and table groupings, small groups of 3-5 are valuable for facilitating peer
discussion. Students first discuss the following questions in groups, and afterwards they are
discussed in plenary:
a. What are the evolutionary advantages and disadvantages of upright posture (centering
of the Foramen Magnum)?
As hominins walk more erect, the head is more centrally balanced over the spine. If the spine
were centrally located in quadrupeds or knuckle walkers, their head angle would be slanted
towards the ground instead of looking forward. Most importantly, the liberation of the hands adds
potential for experimentation with tools and diets.
An upright posture is more biomechanically efficient for long-distance marching and running. The
disadvantages of bipedalism include having a slower sprint and having less mobility in trees. Even
among contemporary hunting gathering societies (e.g. the San bushmen in Botswana), the
endurance factor allows hunter-gatherers to track their prey until they are too exhausted to
continue – a practice known as persistence hunting. Also, in tall grass, visibility improves.
In the case of Sahelanthropus tchadensis, with its opisthion index of 15, we observe a species
representing the ancestral quadrupedal state, probably occupying an arboreal niche. Homo
erectus, named for its upright stature, was the first species able to cover vast distances, and its
occupational range covered all corners of the old world, from Spain to East Asia.5 Discoveries in
Dmanisi, Georgia, reveal that H. erectus had reached the “Gates of Europe” by at least 1.8 million
years ago.6
b. What are the evolutionary advantages and disadvantages of a bigger or smaller jaw
(maxillary prognathism or orthognathism)?
A larger jaw opened up hominins to a specialized variety of nutrition. Foods such as grasses and
tubers could be processed with specialized stronger jaws and larger teeth, best highlighted by the
nutcracker man, A. boisei. Intimidation of predators is theorized in addition to a more formidable
defense from physical attack. The “protective buttressing hypothesis” postulates that less damage
24
occurred from blows to the face in prognathic species compared to orthognathic species.7
Maxillary prognathism and mandibular expansion was costlier in terms of energy efficiency during
gestation and development. “Nutcracker” is somewhat a misnomer; recent research has shown
that A. boisei subsisted on grasses and sedges, and could thus digest cellulose.8
Modern humans occasionally mimic the grazing habits of the Australopiths when eating celery
(roughly 6 calories from one stalk), but we do not obtain a large net caloric gain from celery as our
bodies can no longer break down the cellulose. The energy required to chew it and the energy
needed to break it down in our stomachs is barely below the energy it provides.
Orthognathism reflects a trend towards efficient tissue development, and metabolic efficiency
during active mastication. The larger the organism, the greater the metabolic cost of maintaining
and utilizing its bone, muscle, brain and other tissues. There is thus a metabolic equilibrium that
must be attained. The evolution of an orthognathic face (a jaw and midface that does not protrude)
in hominins is likely related to a reduction in the size of teeth, chewing muscles and jaw size,
reflecting a reduced need for production of powerful grinding force. These changes reflect dietary
shifts in human evolution away from tough skinned fruits and fibrous plant matter and towards
greater consumption of meat and cooked foods. Students should be guided to consider what
technological adaptations reduced the need for these large grinding jaws – stone tools, fire and a
diet that includes animal-protein.
c. What are the evolutionary advantages and disadvantages of bigger brain (cranial
capacity)?
A larger brain meant a greater behavioral flexibility that led to a number of evolutionary
advantages. Establishing ecological niches in varied climate and landscape conditions, as well as
the retention of complex tool traditions (to hunt prey and process food) were early distinctions. The
investigation of fire and language was also critical, along with the ability to maintain a larger
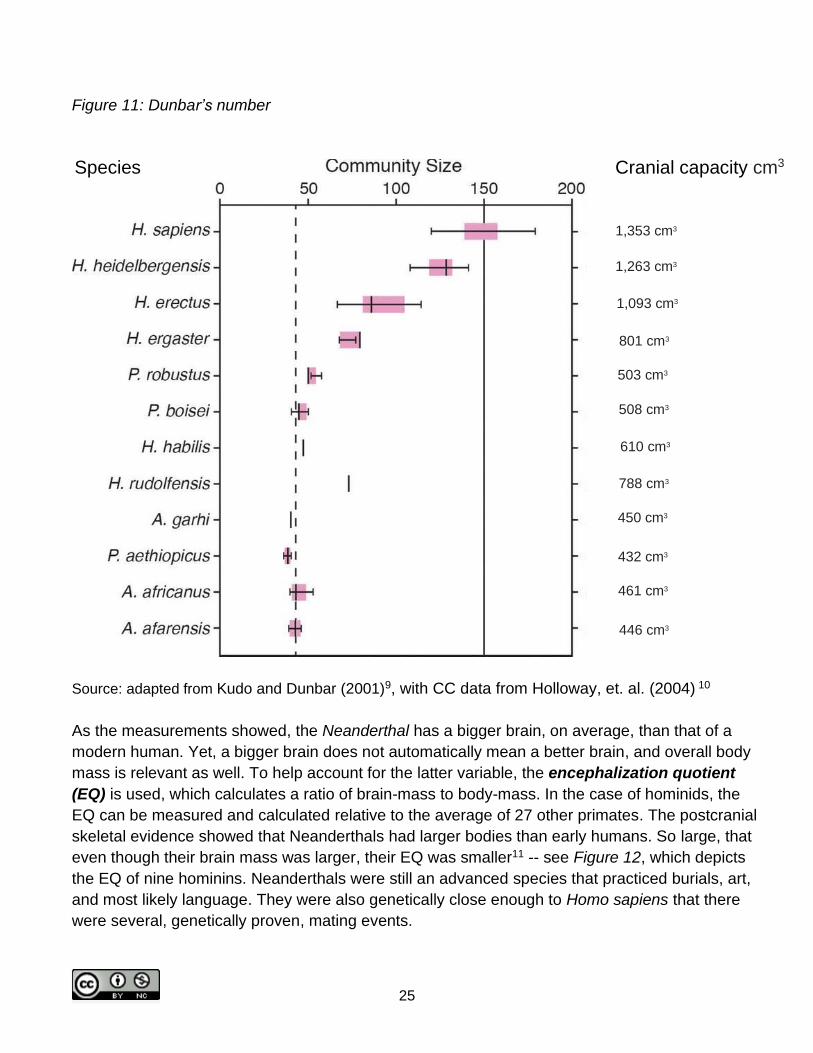
number of social relationships. Anthropologists developed an equation called Dunbar’s Number,
which they use to predict how many “friends” an animal is likely to have based on
its neocortex size (see Figure 11). For example, according to this equation, modern humans can
maintain stable relationships with an average of 150 people.
Also, tool culture is clearly correlated with increased brain size in the genus Homo. H. erectus
highlights hominins’ adaptive ability as it thrived in a variety of environments, including in Asia and
Europe. Students should be posed the question of what thought processes occur in the frontal
lobe: logical reasoning, memory, and language – all integral parts of human culture. These
adaptations enabled population expansion around the world and eventually lead to the rise of
civilization, which marked the end of the Pleistocene and beginning of the Holocene, around
10,000 BCE.
25
Figure 11: Dunbar’s number
Source: adapted from Kudo and Dunbar (2001)9, with CC data from Holloway, et. al. (2004) 10
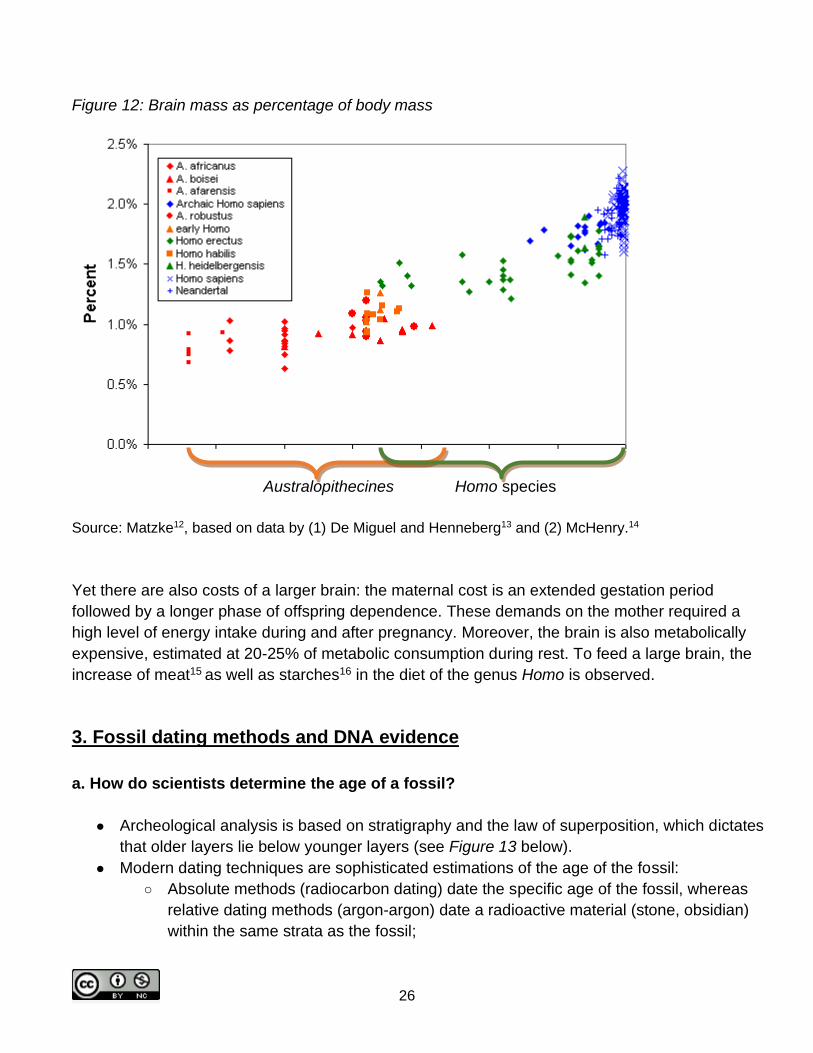
As the measurements showed, the Neanderthal has a bigger brain, on average, than that of a
modern human. Yet, a bigger brain does not automatically mean a better brain, and overall body
mass is relevant as well. To help account for the latter variable, the encephalization quotient
(EQ) is used, which calculates a ratio of brain-mass to body-mass. In the case of hominids, the
EQ can be measured and calculated relative to the average of 27 other primates. The postcranial
skeletal evidence showed that Neanderthals had larger bodies than early humans. So large, that
even though their brain mass was larger, their EQ was smaller11 -- see Figure 12, which depicts
the EQ of nine hominins. Neanderthals were still an advanced species that practiced burials, art,
and most likely language. They were also genetically close enough to Homo sapiens that there
were several, genetically proven, mating events.
1,353 cm3
Cranial capacity cm3
1,263 cm3
1,093 cm3
Species
801 cm3
503 cm3
508 cm3
610 cm3
788 cm3
450 cm3
432 cm3
461 cm3
446 cm3
26
Figure 12: Brain mass as percentage of body mass
Australopithecines Homo species
Source: Matzke12, based on data by (1) De Miguel and Henneberg13 and (2) McHenry.14
Yet there are also costs of a larger brain: the maternal cost is an extended gestation period
followed by a longer phase of offspring dependence. These demands on the mother required a
high level of energy intake during and after pregnancy. Moreover, the brain is also metabolically
expensive, estimated at 20-25% of metabolic consumption during rest. To feed a large brain, the
increase of meat15 as well as starches16 in the diet of the genus Homo is observed. 10
3. Fossil dating methods and DNA evidence
a. How do scientists determine the age of a fossil?
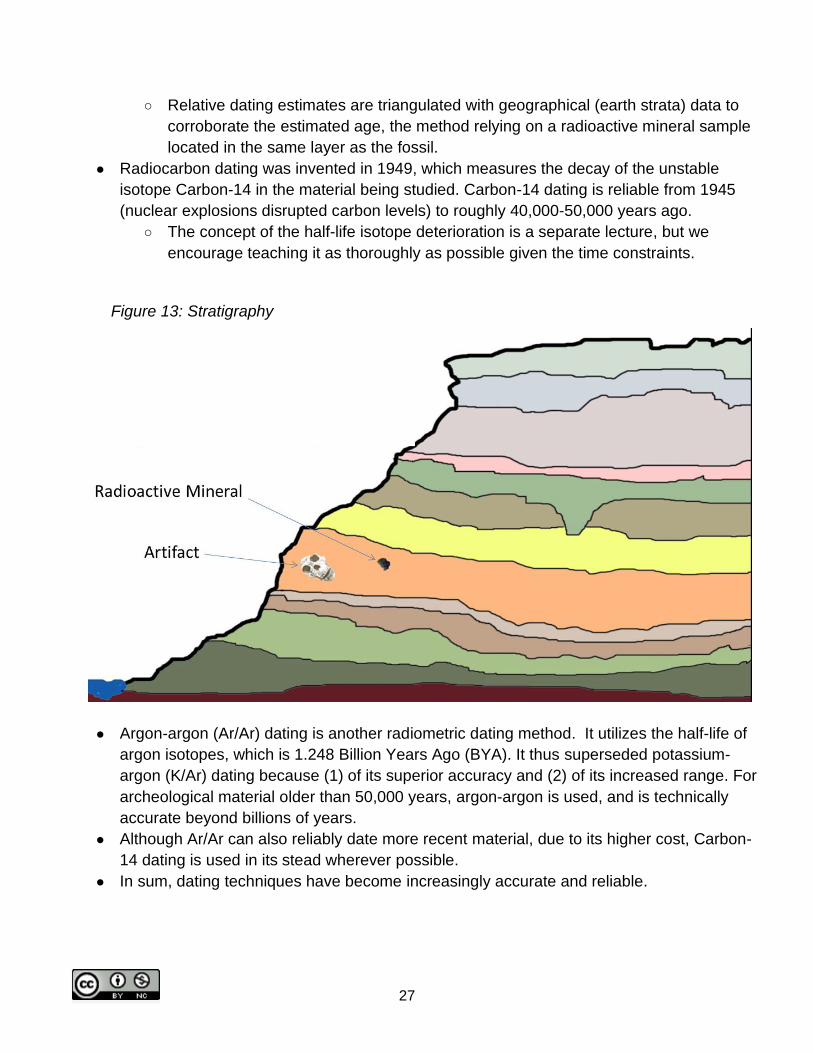
● Archeological analysis is based on stratigraphy and the law of superposition, which dictates
that older layers lie below younger layers (see Figure 13 below).
● Modern dating techniques are sophisticated estimations of the age of the fossil:
○ Absolute methods (radiocarbon dating) date the specific age of the fossil, whereas
relative dating methods (argon-argon) date a radioactive material (stone, obsidian)
within the same strata as the fossil;
27
○ Relative dating estimates are triangulated with geographical (earth strata) data to
corroborate the estimated age, the method relying on a radioactive mineral sample
located in the same layer as the fossil.
● Radiocarbon dating was invented in 1949, which measures the decay of the unstable
isotope Carbon-14 in the material being studied. Carbon-14 dating is reliable from 1945
(nuclear explosions disrupted carbon levels) to roughly 40,000-50,000 years ago.
○ The concept of the half-life isotope deterioration is a separate lecture, but we
encourage teaching it as thoroughly as possible given the time constraints.
● Argon-argon (Ar/Ar) dating is another radiometric dating method. It utilizes the half-life of
argon isotopes, which is 1.248 Billion Years Ago (BYA). It thus superseded potassium-
argon (K/Ar) dating because (1) of its superior accuracy and (2) of its increased range. For
archeological material older than 50,000 years, argon-argon is used, and is technically
accurate beyond billions of years.
● Although Ar/Ar can also reliably date more recent material, due to its higher cost, Carbon-
14 dating is used in its stead wherever possible.
● In sum, dating techniques have become increasingly accurate and reliable.
Figure 13: Stratigraphy
28
How does DNA evidence help paleoanthropologists assess hominin lineage?
● Studies of mitochondrial DNA (mtDNA) and Y-chromosome DNA have made profound
advancements in analyzing the question: ‘When did humans become anatomically
modern?’ A study searching for the oldest coalescent group of Homo sapiens found that
modern humans originated and emerged from East Africa roughly 150,000 years ago
based on the variety of mtDNA mutations.1711While there were other "Out-of-Africa"
movements, notably with the expansion of Homo erectus throughout Asia,1812more recent
‘Out-of-Africa’ movement saw Homo sapiens populating, bit by bit, the entire world,
displacing and sometimes interbreeding with “local” ancient humans such as the
Neanderthal.
● The notion of interbreeding among regional archaic groups and Homo sapiens has recently
been reinforced with the sequencing of mtDNA of Homo neanderthalensis.1913A 0.3 gram
sample of 38,000 year old Neanderthal mtDNA from Croatia has shown that Neanderthals
contributed approximately 1% to 4% of non-African modern humans’ genome. This finding
has refuted claims that there was a strict replacement of regional groups after the most
recent Out-of-Africa movement.
● Recent genetic sequencing of bone fragments and teeth found in southern Russia also
revealed the existence of another "archaic population" – the Denisovans – who, once
numerous, inhabited central and eastern Asia. In sum, in light of the genomic data, most
geneticists now hold a middle-of-the-road view that modern humans arose in and spread
out of Africa, then interbred with “local” archaic peoples to a limited degree.
● Along with DNA evidence, the common ancestry of humans and apes is additionally
confirmed by the striking similarity of the chromosome banding patterns of human and
chimp chromosomes. Even more compelling is the very strong evidence of human
chromosome No.2 being the result of the fusion of two shorter chromosomes still found in
apes today.2014
4. The hominin family tree
A further inquiry-based activity involves the students working as a group around a central table.
Ask the students to look at the collected data (Handout #3) and use the opisthion index, cranial
capacity, and the degree of maxillary prognathism, to deduce the phylogenetic position and order
of each fossil. Presented with all of the skulls, they are tasked with piecing together the tree,
aided by a helpful suggestion or a question posed at the right time.
29
It is important to guide them through the ages of the Australopithecines, then moving to Homo
habilis and note that he co-existed with A. boisei and A. africanus. This is a prime moment to
reiterate some of the key pitfalls of Australopithecus such as a specialized diet that is less
adaptive, and less efficient due to robusticity. The final point to hammer home is that human
evolution is not a linear process, but that there were often multiple hominin species competing in
the same region, driving our ancestors to what we have become today.
As students see the greater picture of the last 7 million years of hominin evolution, they can connect the data to our evolutionary history. Only after this exercise are students provided the phylogenetic tree and each fossil’s age (Handout #6).
5. Chronology-based discussion
a. Which evolved first in hominins: bipedalism or large brains?
Bipedalism. The development of a "thinking machine," as Alan Walker put it, was a
significantly later trend that followed the development of bipedality. Bipedalism freed hands,
allowing hominins the potential to fashion tools expanding dietary options.
b. Which evolved first in hominins: encephalization (big brains) or orthognathism (flat faces)?
Orthognathism. Initially, Australopiths increased mastication potential with larger jaws.
Other features such as a large sagittal crest and temporalis muscle size support this. Homo
habilis begins the pattern of receding prognathism and Homo erectus exhibits a leap of
cranial capacity as prognathism further declines.
c. Why may the cranial capacity be getting larger in the Homo species? Larger brains do not automatically mean greater intelligence. Beyond a certain point, it is
the surface area (represented by convolutions) and configuration, rather than the volume
that is important. While neurological functions are determined more by the organization of
the brain rather than the volume, it is used to as a proxy indicator of intelligence. The
general demarcation between Australopiths and the genus Homo is encephalization2115– a
marked increase in cranial capacity, illustrated in Figure 14.
30
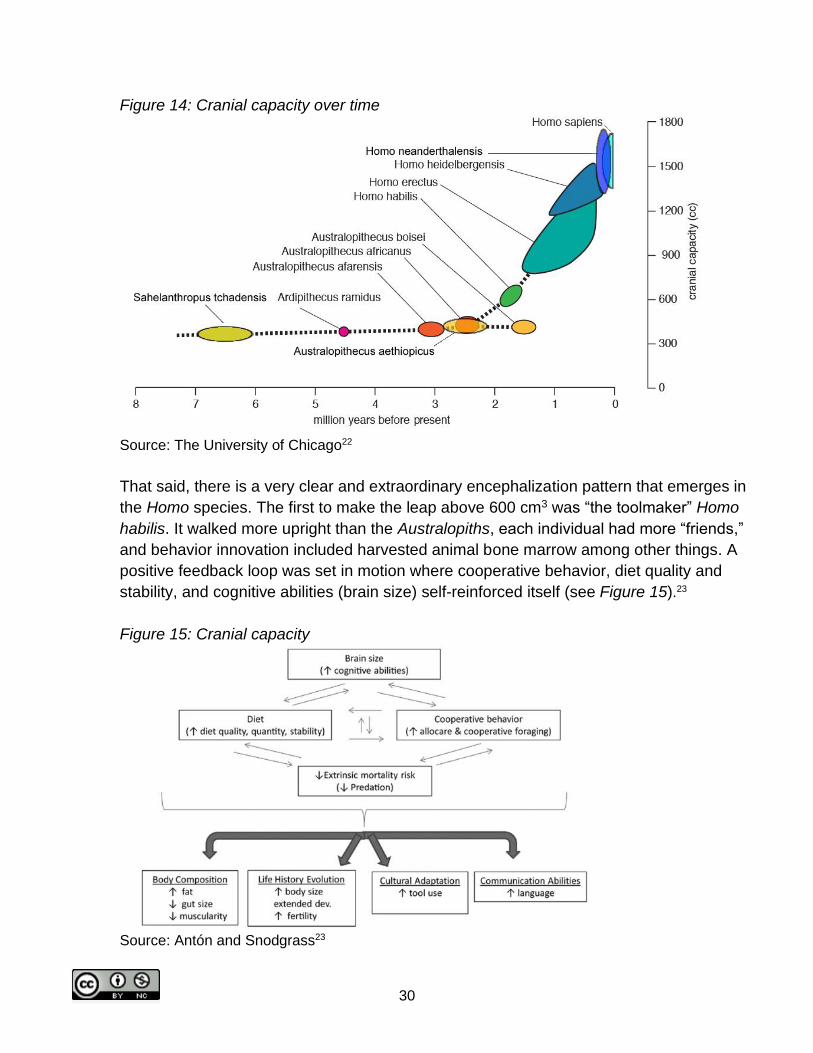
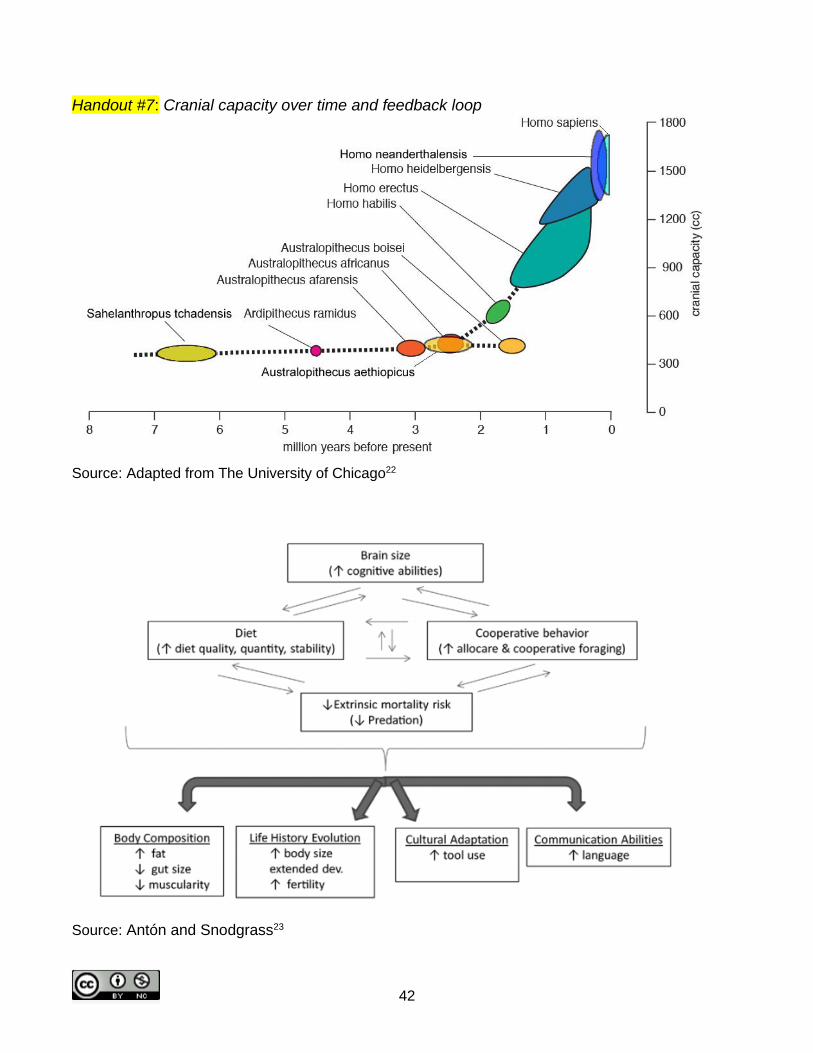
Figure 14: Cranial capacity over time
Source: The University of Chicago22
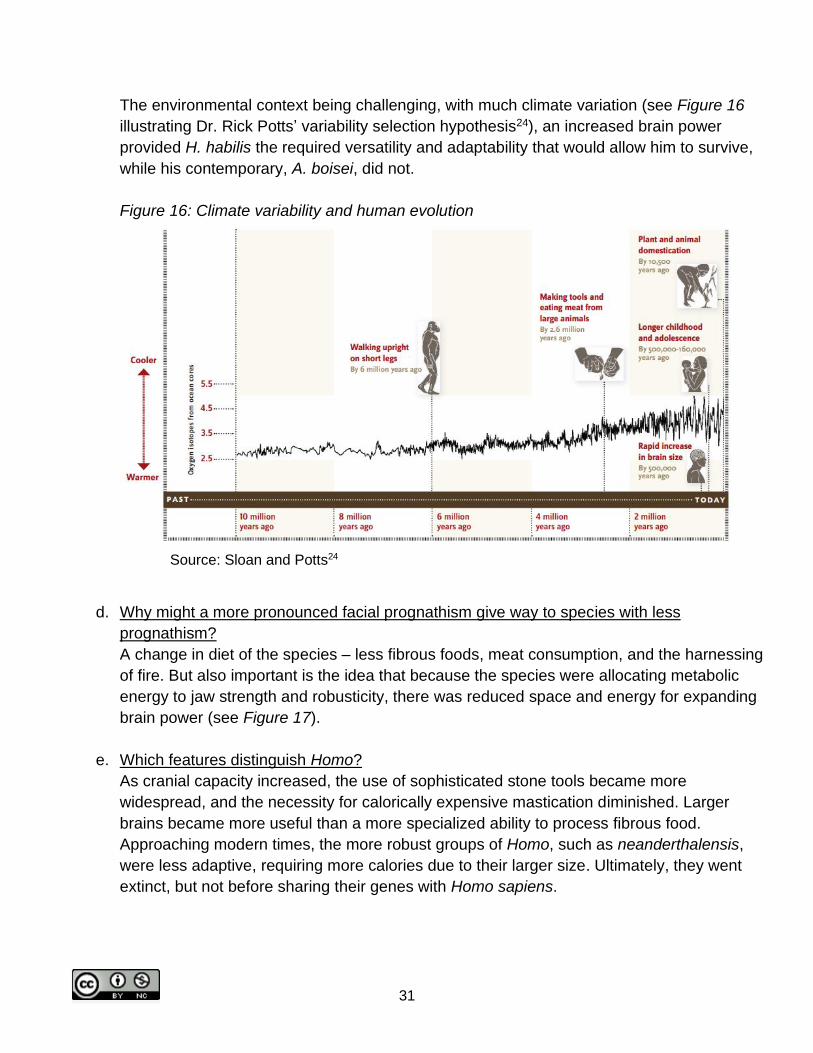
That said, there is a very clear and extraordinary encephalization pattern that emerges in
the Homo species. The first to make the leap above 600 cm3 was “the toolmaker” Homo
habilis. It walked more upright than the Australopiths, each individual had more “friends,”
and behavior innovation included harvested animal bone marrow among other things. A
positive feedback loop was set in motion where cooperative behavior, diet quality and
stability, and cognitive abilities (brain size) self-reinforced itself (see Figure 15).23
Figure 15: Cranial capacity
Source: Antón and Snodgrass23
31
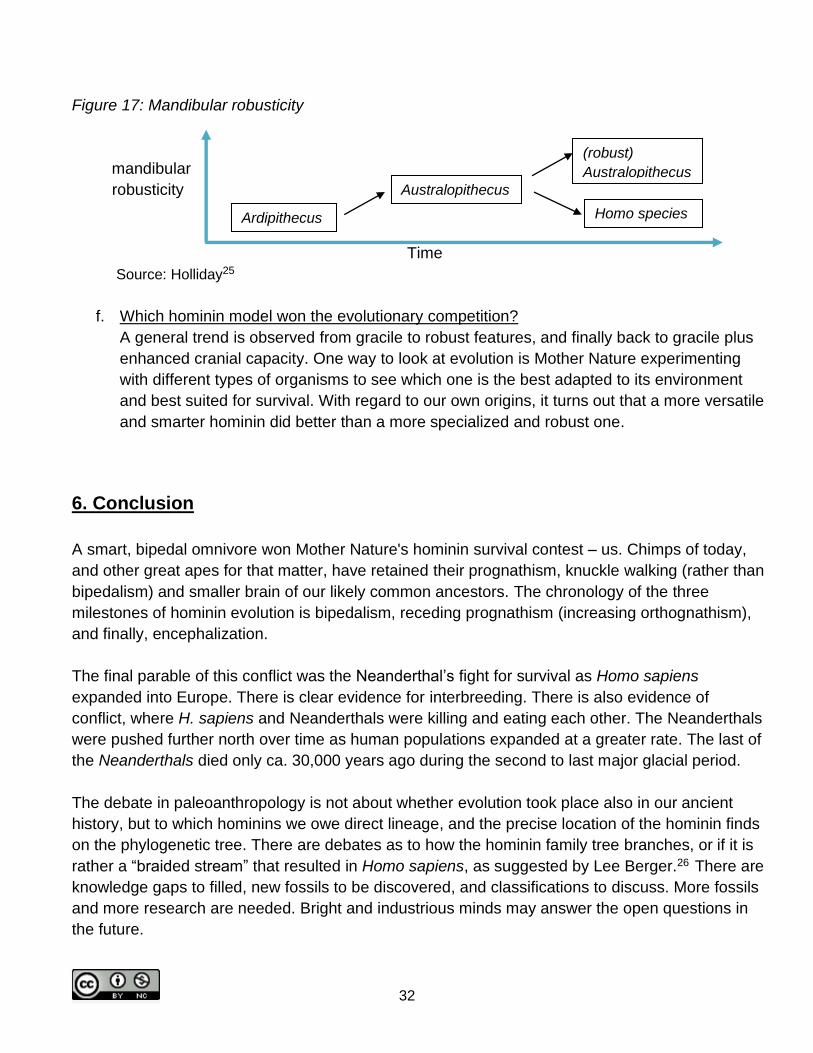
The environmental context being challenging, with much climate variation (see Figure 16
illustrating Dr. Rick Potts’ variability selection hypothesis24), an increased brain power
provided H. habilis the required versatility and adaptability that would allow him to survive,
while his contemporary, A. boisei, did not.
Figure 16: Climate variability and human evolution
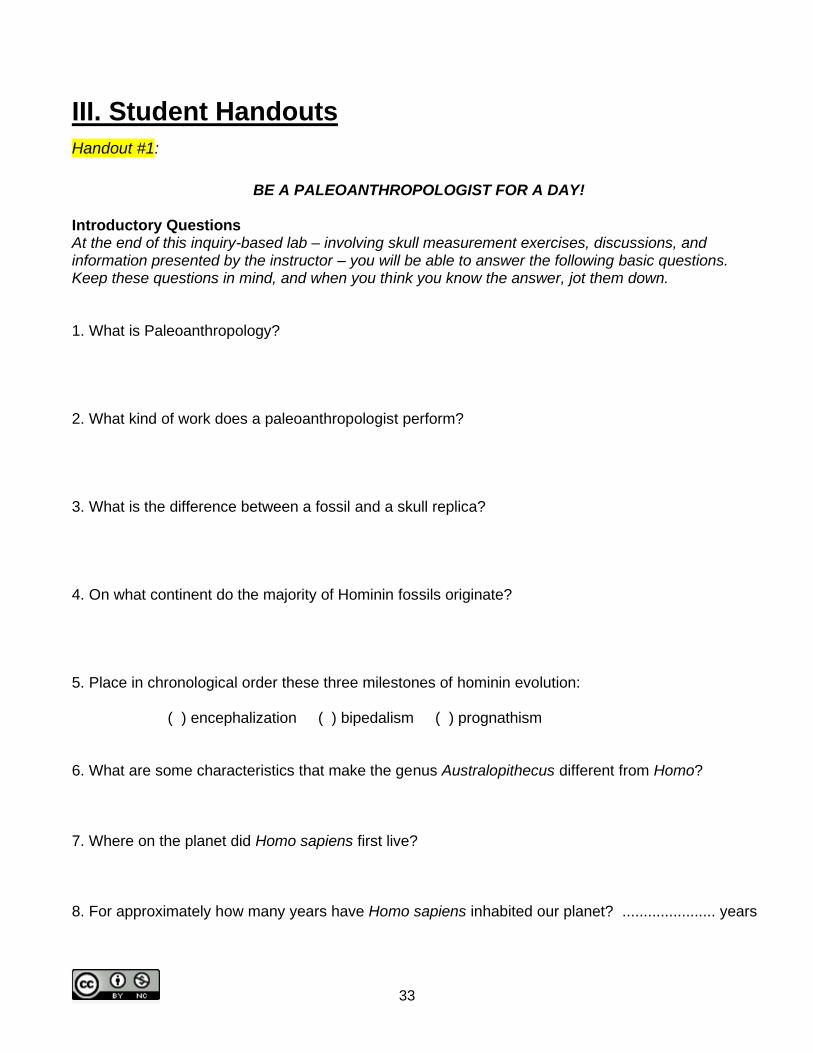
d. Why might a more pronounced facial prognathism give way to species with less
prognathism?
A change in diet of the species – less fibrous foods, meat consumption, and the harnessing
of fire. But also important is the idea that because the species were allocating metabolic
energy to jaw strength and robusticity, there was reduced space and energy for expanding
brain power (see Figure 17).
e. Which features distinguish Homo?
As cranial capacity increased, the use of sophisticated stone tools became more
widespread, and the necessity for calorically expensive mastication diminished. Larger
brains became more useful than a more specialized ability to process fibrous food.
Approaching modern times, the more robust groups of Homo, such as neanderthalensis,
were less adaptive, requiring more calories due to their larger size. Ultimately, they went
extinct, but not before sharing their genes with Homo sapiens.
Source: Sloan and Potts24
32
Figure 17: Mandibular robusticity
mandibular
robusticity
Time
Source: Holliday2516
f. Which hominin model won the evolutionary competition?
A general trend is observed from gracile to robust features, and finally back to gracile plus
enhanced cranial capacity. One way to look at evolution is Mother Nature experimenting
with different types of organisms to see which one is the best adapted to its environment
and best suited for survival. With regard to our own origins, it turns out that a more versatile
and smarter hominin did better than a more specialized and robust one.
6. Conclusion
A smart, bipedal omnivore won Mother Nature's hominin survival contest – us. Chimps of today,
and other great apes for that matter, have retained their prognathism, knuckle walking (rather than
bipedalism) and smaller brain of our likely common ancestors. The chronology of the three
milestones of hominin evolution is bipedalism, receding prognathism (increasing orthognathism),
and finally, encephalization.
The final parable of this conflict was the Neanderthal’s fight for survival as Homo sapiens
expanded into Europe. There is clear evidence for interbreeding. There is also evidence of
conflict, where H. sapiens and Neanderthals were killing and eating each other. The Neanderthals
were pushed further north over time as human populations expanded at a greater rate. The last of
the Neanderthals died only ca. 30,000 years ago during the second to last major glacial period.
The debate in paleoanthropology is not about whether evolution took place also in our ancient
history, but to which hominins we owe direct lineage, and the precise location of the hominin finds
on the phylogenetic tree. There are debates as to how the hominin family tree branches, or if it is
rather a “braided stream” that resulted in Homo sapiens, as suggested by Lee Berger.26 There are
knowledge gaps to filled, new fossils to be discovered, and classifications to discuss. More fossils
and more research are needed. Bright and industrious minds may answer the open questions in
the future.
Ardipithecus
Australopithecus
(robust)
Australopithecus
Homo species
33
III. Student Handouts
Handout #1:
BE A PALEOANTHROPOLOGIST FOR A DAY! Introductory Questions At the end of this inquiry-based lab – involving skull measurement exercises, discussions, and information presented by the instructor – you will be able to answer the following basic questions. Keep these questions in mind, and when you think you know the answer, jot them down. 1. What is Paleoanthropology? 2. What kind of work does a paleoanthropologist perform? 3. What is the difference between a fossil and a skull replica? 4. On what continent do the majority of Hominin fossils originate? 5. Place in chronological order these three milestones of hominin evolution:
( ) encephalization ( ) bipedalism ( ) prognathism 6. What are some characteristics that make the genus Australopithecus different from Homo? 7. Where on the planet did Homo sapiens first live? 8. For approximately how many years have Homo sapiens inhabited our planet? ...................... years

34
Measurement Notes
Feature How do you measure it?
How is it physically apparent in the species?
Reflection: What advantage did this trait likely provide?
1. Position of foramen magnum
2. Degree of prognathism
3. Size of cranial capacity
35
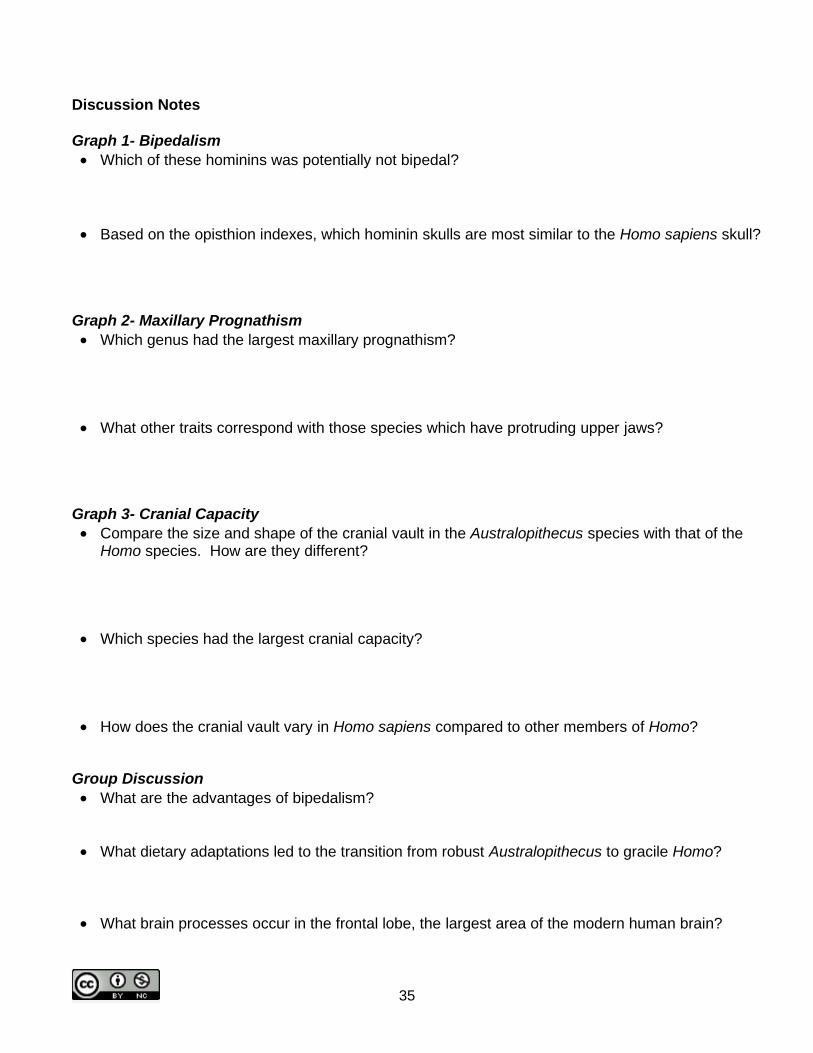
Discussion Notes Graph 1- Bipedalism
• Which of these hominins was potentially not bipedal?
• Based on the opisthion indexes, which hominin skulls are most similar to the Homo sapiens skull?
Graph 2- Maxillary Prognathism
• Which genus had the largest maxillary prognathism?
• What other traits correspond with those species which have protruding upper jaws?
Graph 3- Cranial Capacity
• Compare the size and shape of the cranial vault in the Australopithecus species with that of the Homo species. How are they different?
• Which species had the largest cranial capacity?
• How does the cranial vault vary in Homo sapiens compared to other members of Homo?
Group Discussion
• What are the advantages of bipedalism?
• What dietary adaptations led to the transition from robust Australopithecus to gracile Homo?
• What brain processes occur in the frontal lobe, the largest area of the modern human brain?
36
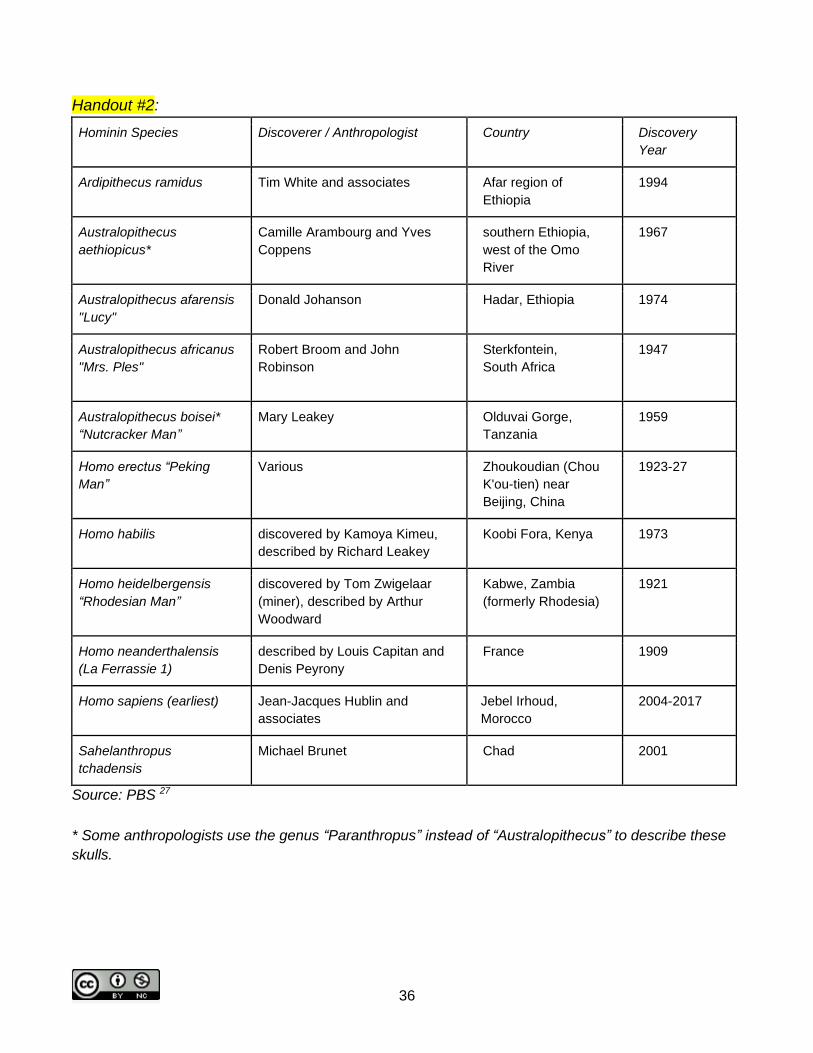
Handout #2:
Hominin Species Discoverer / Anthropologist Country Discovery
Year
Ardipithecus ramidus Tim White and associates Afar region of
Ethiopia
1994
Australopithecus
aethiopicus*
Camille Arambourg and Yves
Coppens
southern Ethiopia,
west of the Omo
River
1967
Australopithecus afarensis
"Lucy"
Donald Johanson Hadar, Ethiopia 1974
Australopithecus africanus
"Mrs. Ples"
Robert Broom and John
Robinson
Sterkfontein,
South Africa
1947
Australopithecus boisei*
“Nutcracker Man”
Mary Leakey Olduvai Gorge,
Tanzania
1959
Homo erectus “Peking
Man”
Various Zhoukoudian (Chou
K'ou-tien) near
Beijing, China
1923-27
Homo habilis discovered by Kamoya Kimeu,
described by Richard Leakey
Koobi Fora, Kenya 1973
Homo heidelbergensis
“Rhodesian Man”
discovered by Tom Zwigelaar
(miner), described by Arthur
Woodward
Kabwe, Zambia
(formerly Rhodesia)
1921
Homo neanderthalensis
(La Ferrassie 1)
described by Louis Capitan and
Denis Peyrony
France 1909
Homo sapiens (earliest) Jean-Jacques Hublin and
associates
Jebel Irhoud,
Morocco
2004-2017
Sahelanthropus
tchadensis
Michael Brunet Chad 2001
Source: PBS 27 17
* Some anthropologists use the genus “Paranthropus” instead of “Australopithecus” to describe these
skulls.
37
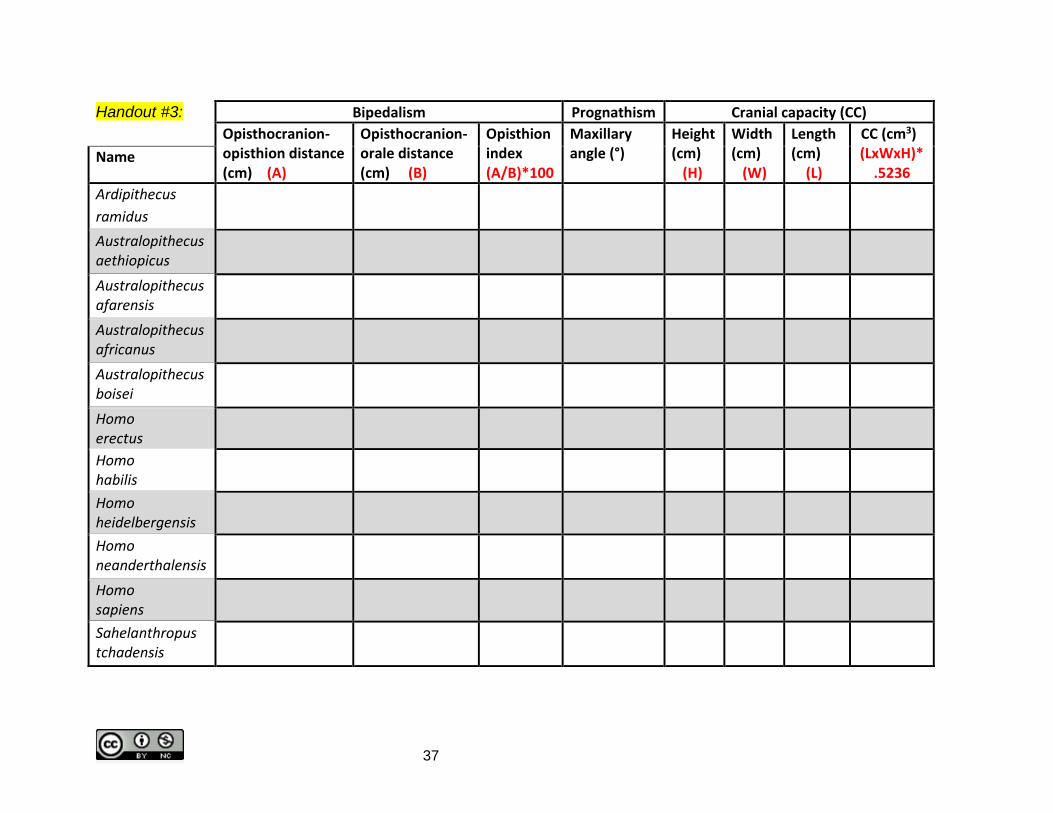
Handout #3: Bipedalism Prognathism Cranial capacity (CC)
Opisthocranion- opisthion distance (cm) (A)
Opisthocranion- orale distance (cm) (B)
Opisthion index (A/B)*100
Maxillary angle (°)
Height (cm) (H)
Width(cm) (W)
Length (cm) (L)
CC (cm3) (LxWxH)*
.5236 Name
Ardipithecus
ramidus
Australopithecus aethiopicus
Australopithecus afarensis
Australopithecus africanus
Australopithecus boisei
Homo erectus
Homo habilis
Homo heidelbergensis
Homo neanderthalensis
Homo sapiens
Sahelanthropus tchadensis
38
Handout #4
Measurement 1: Foramen Magnum
Measurement 2: Maxillary Prognathism
Measurement 3: Cranial Capacity
prosthion
Cranium
point where the zygomatic
process meets the cranium
Nasion
Opisthocranion
Foramen
Magnum
Orale
Opisthion
39
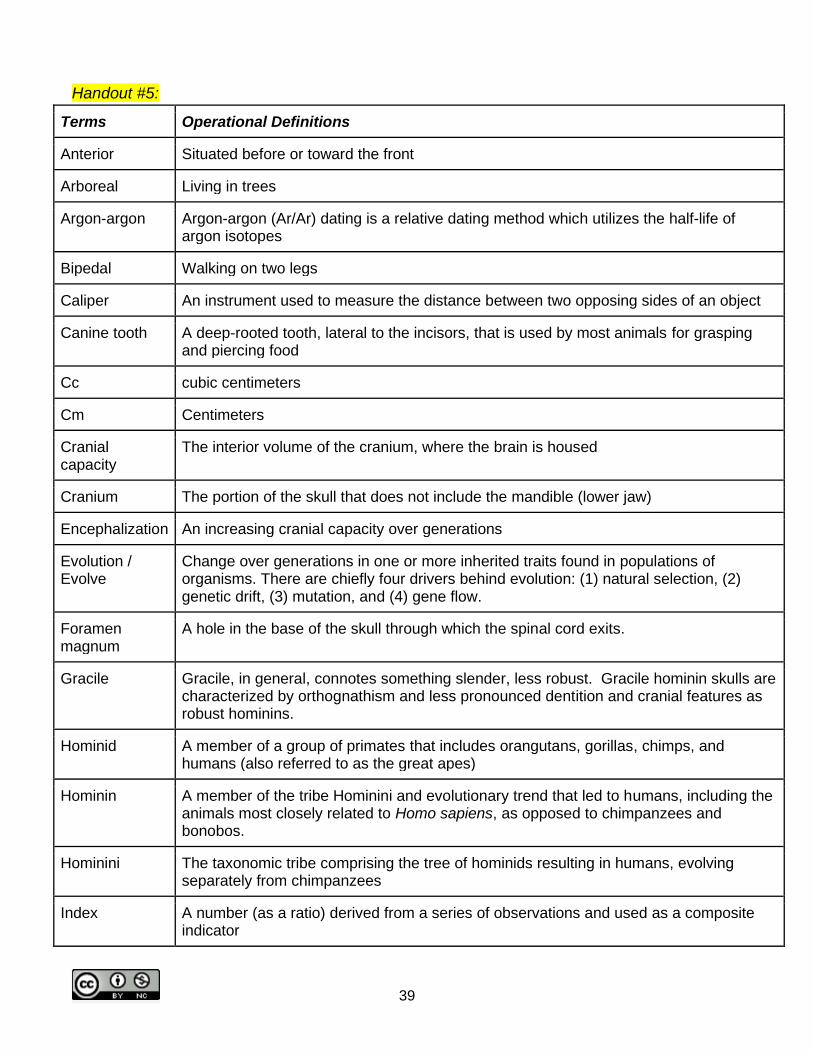
Handout #5:
Terms Operational Definitions
Anterior Situated before or toward the front
Arboreal Living in trees
Argon-argon Argon-argon (Ar/Ar) dating is a relative dating method which utilizes the half-life of argon isotopes
Bipedal Walking on two legs
Caliper An instrument used to measure the distance between two opposing sides of an object
Canine tooth A deep-rooted tooth, lateral to the incisors, that is used by most animals for grasping and piercing food
Cc cubic centimeters
Cm Centimeters
Cranial capacity
The interior volume of the cranium, where the brain is housed
Cranium The portion of the skull that does not include the mandible (lower jaw)
Encephalization An increasing cranial capacity over generations
Evolution / Evolve
Change over generations in one or more inherited traits found in populations of organisms. There are chiefly four drivers behind evolution: (1) natural selection, (2) genetic drift, (3) mutation, and (4) gene flow.
Foramen magnum
A hole in the base of the skull through which the spinal cord exits.
Gracile Gracile, in general, connotes something slender, less robust. Gracile hominin skulls are characterized by orthognathism and less pronounced dentition and cranial features as robust hominins.
Hominid A member of a group of primates that includes orangutans, gorillas, chimps, and humans (also referred to as the great apes)
Hominin A member of the tribe Hominini and evolutionary trend that led to humans, including the animals most closely related to Homo sapiens, as opposed to chimpanzees and bonobos.
Hominini The taxonomic tribe comprising the tree of hominids resulting in humans, evolving separately from chimpanzees
Index A number (as a ratio) derived from a series of observations and used as a composite indicator
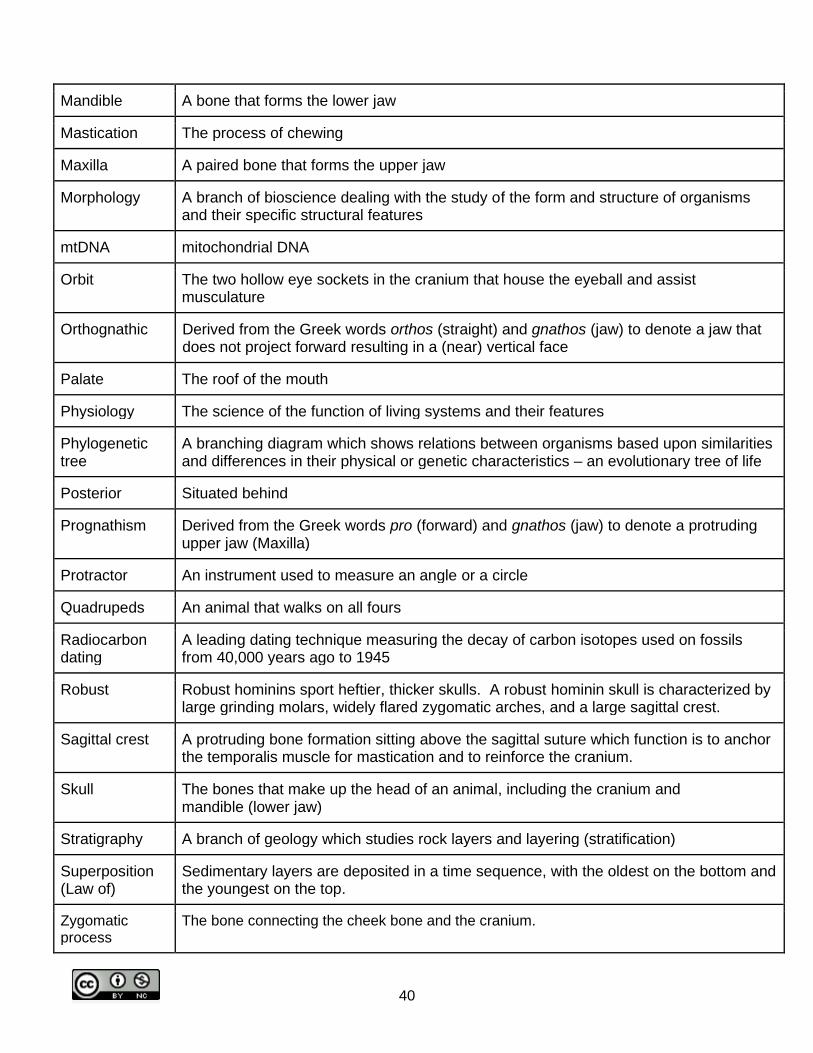
40
Mandible A bone that forms the lower jaw
Mastication The process of chewing
Maxilla A paired bone that forms the upper jaw
Morphology A branch of bioscience dealing with the study of the form and structure of organisms and their specific structural features
mtDNA mitochondrial DNA
Orbit The two hollow eye sockets in the cranium that house the eyeball and assist musculature
Orthognathic Derived from the Greek words orthos (straight) and gnathos (jaw) to denote a jaw that does not project forward resulting in a (near) vertical face
Palate The roof of the mouth
Physiology The science of the function of living systems and their features
Phylogenetic tree
A branching diagram which shows relations between organisms based upon similarities and differences in their physical or genetic characteristics – an evolutionary tree of life
Posterior Situated behind
Prognathism Derived from the Greek words pro (forward) and gnathos (jaw) to denote a protruding upper jaw (Maxilla)
Protractor An instrument used to measure an angle or a circle
Quadrupeds An animal that walks on all fours
Radiocarbon dating
A leading dating technique measuring the decay of carbon isotopes used on fossils from 40,000 years ago to 1945
Robust Robust hominins sport heftier, thicker skulls. A robust hominin skull is characterized by large grinding molars, widely flared zygomatic arches, and a large sagittal crest.
Sagittal crest A protruding bone formation sitting above the sagittal suture which function is to anchor the temporalis muscle for mastication and to reinforce the cranium.
Skull The bones that make up the head of an animal, including the cranium and mandible (lower jaw)
Stratigraphy A branch of geology which studies rock layers and layering (stratification)
Superposition (Law of)
Sedimentary layers are deposited in a time sequence, with the oldest on the bottom and the youngest on the top.
Zygomatic process
The bone connecting the cheek bone and the cranium.
41
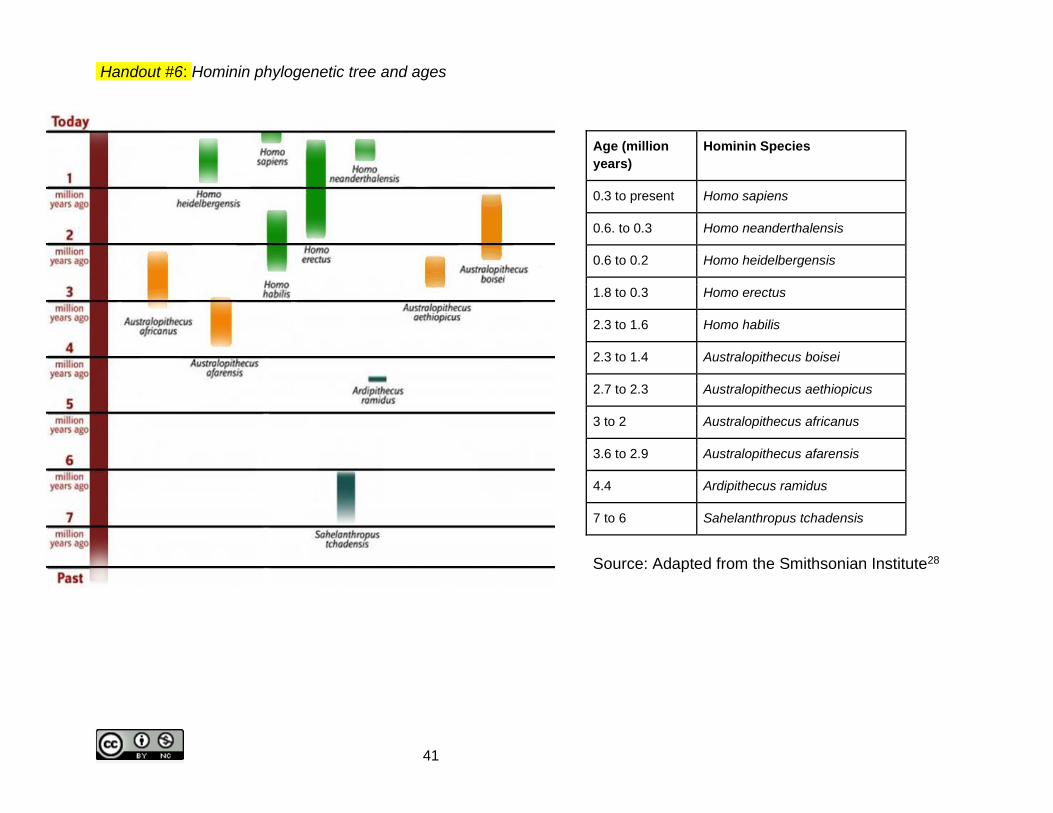
Handout #6: Hominin phylogenetic tree and ages
17
Age (million
years)
Hominin Species
0.3 to present Homo sapiens
0.6. to 0.3 Homo neanderthalensis
0.6 to 0.2 Homo heidelbergensis
1.8 to 0.3 Homo erectus
2.3 to 1.6 Homo habilis
2.3 to 1.4 Australopithecus boisei
2.7 to 2.3 Australopithecus aethiopicus
3 to 2 Australopithecus africanus
3.6 to 2.9 Australopithecus afarensis
4.4 Ardipithecus ramidus
7 to 6 Sahelanthropus tchadensis
16 Source: Adapted from the Smithsonian Institute28
42
Handout #7: Cranial capacity over time and feedback loop
Source: Adapted from The University of Chicago22
Source: Antón and Snodgrass23
43
IV. Other Resources
IHO. Becoming Human. http://www.becominghuman.org
UC-Berkeley. Understanding Evolution. http://evolution.berkeley.edu
The Leakey Foundation. African Fossils. http://www.africanfossils.org
Smithsonian Institution. Human Origins Initiative. http://humanorigins.si.edu
V. Bibliography
[1] Leakey R (1984). One life. Salem House Publisher.
[2] Brain CK (2003). Raymond Dart and our African origins. A Century of Nature: Twenty-One
Discoveries that Changed Science and the World. Laura Garwin and Tim Lincoln, editors. The
University of Chicago. http://www.press.uchicago.edu/Misc/Chicago/284158_brain.html
[3] White T (1980). Evolutionary Implications of Pliocene Hominid Footprints. Science. Vol. 208 Apr. 11,
1980. (pp 175-176).
[4] Russo G (2013). Foramen Magnum Position in Biped Mammals. Journal of Human Evolution.
Volume 65. Issue 6. November 2013. pp. 656-670.
[5] Costello R. Early Homo and Homo erectus.
http://www.mesacc.edu/dept/d10/asb/origins/hominid_journey/early_homo.html
[6] Gabunia L, et al. Earliest Pleistocene hominid cranial remains from Dmanisi, Republic of Georgia:
taxonomy, geological setting, and age. Science. 2000; 288:1019–25.
[7] Carrier DR (2014). Protective buttressing of the hominin face. Biological Reviews. 9 June 2014.
[8] van der Merwel NJ, Masaoll FT, Bamford MK (2008). Isotopic evidence for contrasting diets of early hominins Homo habilis and Australopithecus boisei of Tanzania. South African Journal of Science. Vol.104 no.3-4. Pretoria Mar/Apr 2008. http://www.scielo.org.za/scielo.php?script=sci_arttext&pid=S0038-23532008000200016
[9] Kudo H, Dunbar, RIM (2001), Neocortex size and social network size in primates, Animal Behaviour,
Volume 62, Issue 4, October 2001, Pages 711-722, https://doi.org/10.1006/anbe.2001.1808
44
[10] Holloway RL, Yuan MS, Broadfield DC (2004). The Human Fossil Record: Brain Endocasts: The
Paleoneurological Evidence. New York. John Wiley & Sons Publishers.
http://www.columbia.edu/~rlh2/PartII.pdf
[11] Ruff C, Trinkaus E, Holliday T (1997), Body mass and encephalization in Pleistocene Homo.
Nature. Vol. 387. 8 May 1997.
[12] Matzke N. Brain mass as percentage of body mass. NCSE. www.ncseweb.org
[13] De Miguel C, Henneberg M (2001). Variation in hominid brain size: How much is due to method?
Homo 52(1), pp. 3-58.
[14] McHenry HM (1994). Cranial capacity of modern humans: Tempo and mode in human evolution.
Proceedings of the National Academy of Sciences, 91:6780-6.
https://www.pnas.org/content/pnas/91/15/6780.full.pdf
[15] Leonard WR, Robertson ML (1994). Evolutionary perspectives on human nutrition: The influence of
brain and body size on diet and metabolism. Am. J. Hum. Biol., 6: 77–88.
[16] Compared to our primate relatives, who mostly consume high-fiber, low-carb plant materials,
humans have three times as many copies of the amylase gene, which would have enabled us to better
break down carbohydrates and benefit from the extra energy. See:
Hardy K, Brand-Miller J, Brown KD, Thomas MG, Copeland L (2015). The importance of dietary
carbohydrate in human evolution. The Quarterly Review of Biology; 90(3).
[17] Wilson AC, Cann RL, Stoneking M (1987). Mitochondrial DNA and human evolution, Nature
325 (6099): 31–36.
[18] Templeton A (2002). Out of Africa again and again. Nature. 7 March 2002. pp. 45-51.
[19] Green RE, Malaspinas AS, Krause J, Briggs AW, Johnson PL, Uhler C, Meyer M, Good JM,
Maricic T, Stenzel U, Prüfer K, Siebauer M, Burbano HA, Ronan M, Rothberg JM, Egholm M, Rudan P,
Brajković D, Kućan Z, Gusić I, Wikström M, Laakkonen L, Kelso J, Slatkin M, Pääbo S (2008). A
complete Neandertal mitochondrial genome sequence determined by high-throughput
sequencing. Cell, 134(3), 416–426. http://doi.org/10.1016/j.cell.2008.06.021
[20] See ENSI lessons: Chromosome Comparisons, Chromosome Connection 2, and/or Chromosome
Fusion, labs that drive home the notion of evidence confluence and triangulation. See:
Flammer L. Evolution Lessons. Evolution & the Nature of Science Institutes (ENSI).
http://www.indiana.edu/~ensiweb/evol.fs.html
45
[21] Nickels M, Flammer L. Hominid Cranium Comparison. Evolution & the Nature of Science Institutes
(ENSI). http://www.indiana.edu/~ensiweb/lessons/hom.cran.html
[22] Babbitt C, Warner LR, Fedrigo O, Wall CE, Wray GA (2010). Genomic signatures of diet-related
shifts during human origins. Proc Biol Sci. 2011 Apr 7;278(1708):961-9. doi: 10.1098/rspb.2010.2433.
Epub 2010 Dec 22. https://www.ncbi.nlm.nih.gov/pmc/articles/PMC3049039/
[23] Antón SC, Snodgrass JJ (2012). Origins and Evolution of Genus Homo New Perspectives. Current
Anthropology. Vol. 53, No. S6. Human Biology and the Origins of Homo (December 2012). The
University of Chicago Press. http://www.jstor.org/stable/10.1086/667692
[24] Sloan C, Potts R (2010). What does it mean to be human?
http://humanorigins.si.edu/sites/default/files/HO_044_055_CHAP_3.pdf
[25] Holliday, Trenton (2011). Notes.
[26] Keep S (2015). Is there anything truly surprising about Homo naledi? October 2015. University of
California. Berkeley. http://evolution.berkeley.edu/evolibrary/news/151009_homonaledi
[27] PBS. Evolution. http://www.pbs.org/wgbh/evolution/
[28] Smithsonian Institute. What does it mean to be Human?
http://humanorigins.si.edu/evidence/human-fossils/species