bbnda msw project
TRANSCRIPT
Draft
Environmental Impact Assessment Report
ForIntegrated Municipal Solid Waste Management Project
at Kinduwal Village, Tehsil Baddi, District Solan, Himachal Pradesh.
Submitted to
Himachal Pradesh State Pollution Control BoardHim Parivesh,
New Shimla‐171009, HP.
Project Proponent
Baddi Barotiwala Nalagarh Development Authority (BBNDA)
EPIP Phase 1, Jharmajri, Baddi, District Solan , Himachal Pradesh - 173205
Telephone No. 01795-271121/23
Project Consultant
M/s. Ramky Enviro Engineers . LtdGulmohar Avenue, Somajiguda, Rajbhavan Road
Hyderabad-500 082Ph:040-23306773,23305726

TABLE OF CONTENTS
S. No. Description Page No Chapter-1 Introduction 1.0 Introduction 1.1 1.1 Purpose of the Report 1.1 1.2 Indemnification of Project and Project Proponent 1.2 1.21 Project 1.2 1.2.2 Project Proponent 1.2 1.3 Description of Nature, Size, Location of Project and its
importance to Country and region 1.3
1.3.1 Importance of MSW 1.6 1.4 Scope of the Study 1.6 1.4.1 Proposed TOR 1.6 1.4.2 Additional TOR issued by MOEF 1.9 1.4.3 Draft EIA Report 1.11 1.5 Existing Solid Waste Scenario in GHMC 1.4 Chapter-2 Project Description 2.1 Type of project 2.1 2.2 Need of the Project 2.1 2.3 Location of the project 2.2 2.4 Size of the project & Associated Activities 2.9 2.4.1 Land 2.9 2.4.2 Manpower Requirement 2.10 2.4.3 Water requirement 2.10 2.4.4 Power & Fuel requirement 2.10 2.5 Technology and Process Description 2.11 2.6 Compost Plant 2.14 2.6.1 Composting Process 2.15 2.6.2 Pre – Processing System 2.16 2.6.3 Windrows Process 2.16 2.6.4 Curing System 2.17 2.6.5 Refinement System 2.17 2.6.6 Packing & Storage system 2.17 2.7 Recycling Unit 2.17 2.8 Landfill 2.18
S. No. Description Page No 2.8.1 Landfill Volume 2.18 2.8.2 Landfill Life 2.18 2.8.3 Standard Design Requirements 2.19 2.9 Leachate Generation 2.19 Chapter-3 Description of the Environment 3.0 Preamble 3.1 3.1 Study Area& Period 3.1 3.2 Meteorological Conditions 3.1 3.2.1 Analysis of the IMD Chandigarh Meteorological Data 3.2 3.2.2 Meteorological Scenario of the Study area 3.3 3.3 Wind Pattern 3.5 3.4 Ambient Air Quality 3.10 3.4.1 Regional Scenario 3.14 3.5 Water Environment 3.18 3.5.1 Analysis and Observation 3.20 3.5.2 Discussions 3.22 3.6 Noise Environment 3.23 3.6.1 Noise Levels in the Study area 3.24 3.6.2 Observations 3.27 3.7 Traffic Study 3.27 3.8 Soil Quality 3.28 3.8.1 Observations 3.31 3.9 Assessment of the Bio Diversity (Flora & Fauna) 3.33 3.9.1 Ecology of the Study Area 3.33 3.9.2 Methodology Adopted for the Survey 3.33 3.9.3 Terrestrial Fauna of the Study Area 3.37 3.9.4 Common reptile species observed in the Study Area 3.37 3.9.5 Common bird species observed in the Study Area 3.37. 3.9.6 Aquatic Flora and Fauna 3.38 3.9.7 Land use Land cover details of the Study Area 3.38 3.10 Socio- Economic Environment 3.43 Chapter-4 Anticipated Environmental Impacts& Mitigation Measures 4.1 Identification of Impacts 4.1 4.2 Methodology 4.1 4.3 Potential Impacts 4.1

S. No. Description Page No 4.3.1 Air Environment 4.2 4.3.2 Water Environment 4.2 4.3.3 Land Environment 4.2 4.3.4 Socio Economics 4.2 4.3.5 Indirect Impacts 4.2 4.4 Prediction of Impacts 4.2 4.4.1 Impacts during development Phase 4.2 4.4.1.1 Impacts on the Air Quality 4.2 4.4.1.2 Mitigation Measures Proposed - Air Quality 4.3 4.4.1.3 Impacts on Water Quality 4.4 4.4.1.4 Mitigation Measures - Water Quality 4.5 4.1.5 Impacts ofNoise Levels 4.5 4.1.6 Mitigation Measures - NoiseQuality 4.5 4.1.7 Impacts Due to Solid Waste Generation 4.5 4.1.8 Mitigation Measures – Solid Waste 4.6 4.1.9 Impact on Land Use 4.6 4.1.10 Demography and Socio Economics 4.7 4.2 Impacts During operation 4.7 4.2.1 Prediction of Impacts on the Air Environment 4.7 4.2.2 Atmospheric Dispersion of Stack Emission 4.7 4.2.3 Emission from the proposed activities 4.7 4.2.4 Details of Mathematical modeling 4.8 4.2.5 Meteorological Data 4.8 4.2.6 Air Quality Predictions 4.9 4.2.7 Post Project Scenario 4.10 4.2.8 Mitigation Measures 4.14 4.2.9 Impact on water Quality 4.14 4.2.10 Strom Water Management 4.15 4.2.11 Rain water harvesting system 4.15 4.2.12 Impact of the Transportation 4.15 4.2.13 Noise Environment 4.15 4.2.14 Prediction of Impacts on Land Environment 4.16 4.2.15 Predicted impacts of the landfill 4.16 4.2.16 Impacts on community 4.16 4.2.17 Impacts on Ecology 4.17

S. No. Description Page No 4.2.18 Impacts on the socio-economics 4.17 Chapter-5Analysis of Alternatives 5.1 Introduction 5.1 5.1.1 Alternative Sites 5.1 5.1.2 Compliance of the Site with site Selection Criteria 5.2 Technological Aspects 5.6 5.2.1 Landfills 5.7 5.2.2 Composting 5.8 5.2.3 Biomethanation 5.10 5.2.4 Refuse Derived Fuel 5.10 5.2.5 Incineration 5.11
5.2.6 Pyrolysis and Gasification 5.11 5.2.7 Recycling / Reuse 5.12 Chapter-6 Environmental Monitoring Program
6 Surveillance and Monitoring Plan 6.1
6.1 Scope of Environmental Monitoring Program 6.1
6.1.1 Air Environment 6.2
6.1.2 Noise Environment 6.2
6.1.3 Water Environment 6.2
6.1.4 Land Environment 6.2
6.2 Operations Monitoring 6.4
6.3 Public Health Monitoring 6.4
6.4 Post Closure Monitoring 6.5
Chapter-7-Additional Studies 7.1 Risk Assessment 7.1 7.2 Major Hazardous 7.1 7.3 Disaster Management Plan (DMP) 7.1 7.4 Hazardous Control Measures 7.1 7.4.1 Fires 7.1 7.4.2 Natural Disasters 7.2 7.4.3 Electrical Accidents 7.4 7.4.3.1 Prevention of Electrical Accidents 7.4 7.4.3.2 First Aid and Emergency Procedures 7.8

S. No. Description Page No Chapter-8 Project Benefits 8.1 Introduction 8.1 8.1.1 Compost Enriches soils 8.1 8.1.2 Compost Helps Cleanup(remediate) contaminated Soil 8.2 8.1.3 Compost Used as Erosion Deterrent 8.2 8.1.4 Using Compost offers economic Benefits 8.2 8.2 Benefits of recycling Process 8.2 8.2.1 Plastic Recycling Benefits 8.2 8.2.2 Paper Recycling Benefits 8..2 8.3 Benefits of land fill 8.3 8.4 Improvements in the physical infrastructure 8.3 8.5 Clean Development Mechanism (CDM) 8.3 8.6 Improvements in the social infrastructure 8.3 8.7 Employment potential 8.4 8.8 Other tangible benefits 8.4 Chapter-9 Environmental Management Plan 9.1 Introduction 9.1 9.2 Environmental Management Plan during construction 9.1 9.2.1 Air Quality Mitigation Measures 9.1 9.2.2 Water Quality Mitigation Measures 9.2 9.2.3 Noise Mitigation Measures 9.2 9.2.4 Solid Waste Mitigation Measures 9.3 9.2.5 Ecological Aspects 9.4 9.2.6 Site Security 9.4 9.3 Management during Operation Stage 9.4 9.3.1 Air Quality Management 9.4 9.3.2 Odour Control 9.5 9.3.3 Gas Management 9.5 9.3.4 Water Quality Mitigation Measures 9.5 9.3.5 Noise Mitigation Measures 9.6 9.3.6 Solid Waste Mitigation Measures 9.7 9.4 Post Operation of Landfill 9.7 9.5 Management of Flora & Fauna Green Belt
development 9.7
9.6 Environmental Control during Composting Process 9.9

S. No. Description Page No 9.7 Socio Economic Development Activities under CEP. 9.9 9.7.1 Planning 9.10 9.7.2 Implementation 9.10 9.7.3 Possible areas of activities under CEP 9.12 9.7.4 Funding 9.13 9.8 Occupational Health Management 9.13 9.9 Fire Protection System 9.14 9.10 Environmental Management Cell 9.14 Chapter-10 Summary 10.0 Introduction 10.1 10.1 Project Capacity Details 10.1 10.2 Project requirements 10.2 10.2.1 Land Details 10.2 10.2.2 Water requirement 10.3 10.2.3 Power & Fuel requirement 10.3 10.2.4 Manpower Requirement 10.3 10.3 Baseline Environmental Status 10.4 10.4 Anticipated Environmental Impacts 10.5 10.6 Environmental Monitoring Plan 10.6 10.7 Risk Analysis 10.7 10.8 Project Benefits 10.7 10.9 Environmental Management Plan 10.8 10.9.1 Air Quality Management 10.8 10.9.2 Odour Control 10.9 10.9.3 Water Quality Mitigation Measures 10.9 10.9.4 Noise Mitigation Measures 10.9 10.9.5 Greenbelt 10.9 10.9.6 Socio Economic Development Activities under
Corporate Environmental Policy 10.10
Chapter-11 Disclosure Of Consultants 11.1 Ramky Group 11.1 11.2 Ramky Enviro Engineers Limited 11.1 11.2.1 Consultancy Services 11.1 11.2.2 Laboratory Services 11.2 11.2.3 Training Services 11.2

S. No. Description Page No 11.2.4 Field Services 11.2 11.2.5 Treatment Plant Services 11.3 11.2.6 Solid Waste Management Services 11.3 11.3 EIA Coordinator and FAEs involved in Report 11.3
Sl. No. LIST OF TABLES
Table Description Page No
Chapter-1 Introduction 1.1 Chronology of Events for Obtaining EC 1.1 1.2 Project Details 1.2 1.3 Salient Features of the Site 1.3 Chapter-2 Project Description 2.1 Land Area Breakup 2.9 2.2 Man Power Details 2.10 2.3 Water requirement details in m3 2.10 /day 2.4 Power and Fuel requirement 2.10 2.5 Details of Machinery Required 2.14 2.6 Factors affecting Compost Process 2.15 2.7 Estimation of Landfill Life 2.18 2.8 Standard Design Requirement for Sanitary landfill 2.19 2.9 Leachate generation cum/day 2.20 Chapter-3 Description of the Environment 3.1 Observed Meteorological Data 3.3 3.2 Wind pattern during March in m/s 3.6 3.3 Wind pattern during April in m/s 3.7 3.4 Wind pattern during May in m/s 3.8 3.5 Wind Pattern during Summer (March to May) in m/s 3.9 3.6 Ambient Air Quality Locations 3.10 3.7 Ambient Air Quality levels in the study area 3.13 3.8 Ambient Air Quality levels in the study area 3.13 3.9 Ambient Air Quality levels in the study area 3.14 3.10 Water Sampling Locations (>2.0km) 3.19 3.11 Water Quality characteristics (Ground Water) 3.21 3.12 Analytical Results of Surface Water 3.22 3.13 Noise Monitoring Locations 3.24 3.14 Noise levels in the study area 3.26 3.15 Location name 3.27 3.16 Soil Sampling Locations 3.29 3.17 Soil Quality in the study area 3.31 3.18 Standard soil classification – (Indian council of agricultural
research, New Delhi) 3.31
3.19 Land utilization of study area 3.38 3.20 Socio Economic details of the study area – census 2001 3.45 Chapter-4 Anticipated Environmental Impacts
4.1 Emissions from the utilities 4.8
4.2 Micro – Meteorological Data Used for Prediction of Impacts 4.8
4.3 Post Project Scenario-Units:µg/m3 4.10
4.4 Wastewater generation 4.14
4.5 Wastewater Characteristics 4.15 4.1 Emissions from the utilities 4.8 Chapter-5Analysis of Alternatives
5.1 Site Selection Criteria – Area to be avoided 5.3 5.2 Details of the Site 5.4 Chapter-6Environmental Monitoring Program
6.1 Environmental Monitoring Plan 6.3 6.2 Budget of Implementation of Environmental Management Plan 6.3 Chapter-7 Additional Studies 7.1 First Aid for Burns 7.7 Chapter-9 Environmental Management Plan 9.1 Wastewater generation details in m3 9.6 /day 9.2 List if plants identified for road side plantations and green belt 9.8 9.3 Funds for implementing Corporate Social Responsibilities CEP 9.13 Chapter-10-Summary 10.1 Project Details 10.1 10.2 Land Area break-up 10.2 10.3 Water requirement details in m3 10.3 /day 10.4 Power and Fuel requirement 10.3 10.5 Manpower Details 10.3 10.6 Ambient Air Quality Results(µg/m3 10.4 ) 10.7 Summary of water analysis 10.4 10.8 Noise Levels –dB(A) 10.4 10.9 Soil Quality in Study area 10.5 10.10 Environmental Monitoring Plan 10.6 10.11 Budget of implementation of Environmental Management Plan 10.7 10.12 Funds for implanting Corporate Social responsibilities under CEP 10.10 Chapter-11-Disclosure of consultants 11.1 The List of Experts 11.3

Sl .No. LIST OF FIGURES
Figure Description Page No Chapter- Introduction 1.1 Project Location Map 1.15 1.2 Topo Map of the Study area 1.14 1.3 Base Map of the study area 1.15 Chapter-2 Project Description 2.1 Project Location Map 2.3 2.2 Study Area Map of 10 km Radius 2.4 2.3 Google Image of the proposed Site – 2 km radius 2.5 2.4 Project Layout showing CETP and MSW 2.6 2.5 Project Layout MSW 2.7 2.6 Site Photographs 2.8 2.7 Proposed Concept of IMSWMF 2.12 2.8 Material balance of the proposed facility 2.13 2.9 Aerobic Composting 2.18 Chapter-3 Baseline Environmental Status 3.1 Base Map of the study area (10 km) 3.4 3.2 Wind Rose for March 2011 3.6 3.3 Wind Rose for April 2011 3.7 3.4.1 Wind Rose for May 2011 3.8 3.4.2 Wind Rose for Summer (March – May) 2012 3.9 3.5 Ambient air quality Monitoring stations in the study area (10km) 3.12 3.6 Water sampling locations 3.20 3.7 Noise Monitoring stations in the study area 3.28 3.8 Water Quality sampling locations (<2.0km) 3.22 3.9 Soil Monitoring in the study area 3.30 3.10 Land use Map 3.39 3.11 Map showing drainage, village roads of the study area 3.40 3.12 Vegetation Cover Map of the Study Area 3.41 3.13 Drainage Map of the study area 3.42 3.14 Habitations located in 10 km radius 3.44 Chapter-4 Anticipated Environmental Impacts 4.1 Predicted Ground level Concentration for SO2 4.12 4.2 Predicted Ground level Concentration for NOx 4.13 4.3 Post Project Scenario-Units:µg/m3 4.10 4.4 Wastewater generation 4.14 4.5 Wastewater Characteristics 4.15 Chapter-5Analysis of Alternatives 5.1 Google map of the proposed site 5.5 Chapter-9 Environmental Management Plan 9.1 Gas Flaring System 9.6


Draft EIA Report for Proposed IMSWMF, Kinduwal (V), Baddi (T), Solan (D) Himachal Pradesh
M/s. BaddiBarotiwalaNalagarh Development Authority EPIP Phase I, Jharmajri, Baddi,Solan (D)
Himachal Pradesh
Ramky Enviro Engineers Ltd, Hyderabad
Chapter 1.1
CHAPTER -1 INTRODUCTION 1.1 Purpose of the Report BaddiBarotiwalaNalagarh Development Authority (BBNDA) is a Special Area Development Authority created by the state government of Himachal Pradesh in 2006 for comprehensive and regulated development of the Baddi, Barotiwala, Nalagarh area (BBNA), which is one of the important growth centre’s of Himachal Pradesh having two major urban settlements,. BaddiMunicipal Council and Nalagarh Municipal Council and 41 Gram Panchyats. BBNA is the leading industrial area of Himachal Pradesh with an estimated presence of around 1477 industrial units. The area has grown erratically with many industries coming up in a short span with their associated human settlements and colonies. This growth could not be managed with the existing civic management services, leading to degradation of quality of life in the area, typically as seen in the case of municipal solid waste (MSW) management. To overcome the deficient solid waste management (SWM) system in the area, BBNDA intends to facilitate an integrated Municipal Solid Waste Management facility by creating an efficient waste segregation, collection, transportation, processing and disposal mechanism in conformity with the Municipal Solid Waste (Management and Handling) Rules, 2000. As per EIA Notification S.O.No 1533 dated 14th
10
Sep 2006 and its subsequent amendments the proposed project if falling under Project / Activity 7 (i) Common Municipal Solid Waste Management Facility (CMSWMF), Category “A” [even though the project is Category ‘B’ it is treated as Category ‘A’ as the project is located within 10km from interstate boundary (Punjab and Haryana)] and requires environmental clearance from Expert Appraisal Committee, MOEF, New Delhi. To obtain the environmental clearance BBNDA has carried out the following activities as given in Table 1.1.
Table 1.1
Chronology of Events for Obtaining EC th Form 1 Submission to MOEF, New Delhi April 2012
10th Finalization of TOR in 112 May 2012 th Meeting Infrastructure and Miscellaneous Projects and CRZ
5th Additional TOR issued for preparation of Draft EIA for conducting Public Hearing
June 2012
1

Draft EIA Report for Proposed IMSWMF, Kinduwal (V), Baddi (T), Solan (D) Himachal Pradesh
M/s. BaddiBarotiwalaNalagarh Development Authority EPIP Phase I, Jharmajri, Baddi,Solan (D)
Himachal Pradesh
Ramky Enviro Engineers Ltd, Hyderabad
Chapter 1.2
1.2Indemnification of Project and Project Proponent 1.2.1Project Government of India announced incentive package for setting up industries in the State of Himachal Pradesh during 2003. During this period the BBNA has grown exponentially, new industries were setup resulting in increase in population by intra state and interstate migration. Decadal growth in 1991-2001 was 40.8%, existing civil management services were unable to cope the situation. Projected decadal trend for solid waste for 2021 is 36.63%, hence immediate need to take up suitable measures to develop waste processing and treatment facilities in BBNA is proposed. As per CWPPIL 13/2006 titled as “Court on its Own Mission” vs State of Himachal Pradesh and Others is pending in the Hon’ble High Court of H.P. in which Ministry of Environment and Forest, Government of India is also imp-leaded as respondent No. 7 and the Hon’ble High Court of H.P is monitoring this case from time to time and directing the State Government to set up a Municipal Solid Waste Plant in BBNA at the earliest. To meet the Hon’ble High Court of H.P directions BBNDA is proposing to establish IMSWMF to improve and develop a socially and environmentally sustainable system for solid waste management which will reduce the associated environmental and public health problems of BBNA. To achieve this it is designing a strategic framework to ensure that the local bodies discharge their responsibilities efficiently with appropriate private sector participation in the design, management and operations of collection, transportation, processing and sanitary disposal of municipal solid waste in the area. The detailed capacities of the proposed project are given in Table 1.2.
Table 1.2 Project Details
Components Capacity Remarks Receiving Facility 40 TPD Project Capacity Compost Plant 30 TPD Compost/manure 6 TPD Recycling complex 6 TPD Plastic, Paper, Metal, Rubber, Glass, etc Secured Land fill 9 TPD Inert’s Lechate collection 15.5 TPD Reuse for windrow sprinkling Project Cost Rs. 970.00 Lakhs Development will be in Phased manner MSW expected to increase @5% per annum To cater the increased capacity, individual treatment facilities components will be augmented proportionately
1.2.2Project Proponent Baddi Barotiwala Nalagarh development authority (BBNDA) has been constituted as a Special area development authority under Section 67 of the HP town and country planning act 1977 vide government order no GAD-C-(F)-501/2006 dated 30th November 2006 with Chief Minister of the State as its Chairman. BBNA is a fast and upcoming industrial township which has emerged as a major industrial hub in Himachal Pradesh.

Draft EIA Report for Proposed IMSWMF, Kinduwal (V), Baddi (T), Solan (D) Himachal Pradesh
M/s. BaddiBarotiwalaNalagarh Development Authority EPIP Phase I, Jharmajri, Baddi,Solan (D)
Himachal Pradesh
Ramky Enviro Engineers Ltd, Hyderabad
Chapter 1.3
Located at a distance of 45km from Chandigarh on the foothills of Kasauli hills, the BBN area has tracts of plain land suitable for industrial activity spread over 318square km. Vision: To develop BBN area on modern lines into an integrated industrial township having provisions for Industrial, Residential, Commercial, Institutional and Recreational areas and put it in league with the other major cities in the region. Aims and objectives:
Development of BBN area on modern lines. Infrastructural development for integrated growth as an urban area. To make BBN as an attractive destination for investment by industrial, housing
projects and other investors not only during the special industrial package but even beyond it.
To go for planned development of the area and for this purpose acquire and develop government and private lands in a phased manner.
Protection and preservation of natural resources, environment, forests, and greenery of the area.
Encourage Public private partnership (PPP) in infrastructure development and delivery.
Provide for a single line of governance in an effective, transparent, responsive and accountable manner.
Promote the development of more linkages (rail/road) of BBN with other states to facilitate movement of goods and persons.
Development of new sectors for various needs of an industrial area comprising industrial, residential, commercial, institutional and recreational areas.
For achieving all these objectives, prepare a perspective master development plan. 1.3 Description of Nature, Size, Location of Project and its importance to Country and region The proposed project is to handle present Municipal Waste generation of BBN area. The project is proposed adjacent to Common Effluent Treatment Plant (CETP) in Kinduwal Village, BaddiThesil, Solan District. The salientfeatures of the project site are given in Table 1.3.The Project Location map is given as Figure 1.1.
Table 1.3
Salient Features of the Site Land area 2.42 Ha (6 Acres) Location Survey No 349/49/1/1 and 387/211,
Kinduwal Village, Baddi, SolanDist (HP) Land Coordinates 30056’16.98” North; and 76046’23.77” East Elevation 372 m State Boundary :Punjab Punjab 3.0 km West;
Haryana 3.5 km South Nearest Habitation Kinduwal Village 0.40km West

Draft EIA Report for Proposed IMSWMF, Kinduwal (V), Baddi (T), Solan (D) Himachal Pradesh
M/s. BaddiBarotiwalaNalagarh Development Authority EPIP Phase I, Jharmajri, Baddi,Solan (D)
Himachal Pradesh
Ramky Enviro Engineers Ltd, Hyderabad
Chapter 1.4
Nearest Railway Station Kalka Railway Station : 22km Nearest Airport Chandigarh Airport : 40 km South Nearest Highway NH 21 A – Nalagarh to Pinjore0.75kmEast Nearest Water Bodies Sirsa River 0.10km West
RattaNadi4.0km North BaladNadi3kmSE
Nearest Forests Kolhai Dun RF 0.5 kmWest KholNalagarhRF5.0km NW MandhalaRF9.0km SE BijliRF8.0km East AmbkaRetwaliRF6.0kmNE
The proposed project will be designed on lines to meet MSW Rules 2000. At present the municipal solid waste generated by domestic, commercial and industrial activities in BBN area is indiscriminately disposed in low lying and open areas. Unscientific management of MSW leads to serious environmental problems. Insanitary methods being adopted for disposal of solid wastes is a serious health concern. Open dumping of garbage serves as bredding ground for disease vector such as flies, mosquitoes, cockroaches, rats, and other pests.High risks of spreading diseases like typhoid, cholera, dysentery, yellow fever, encephalitis, plague and dengue fever may not be rules out.

Draft EIA Report for Proposed IMSWMF, Kinduwal (V), Baddi (T), Solan (D) Himachal Pradesh
M/s. BaddiBarotiwalaNalagarh Development Authority EPIP Phase I, Jharmajri, Baddi,Solan (D)
Himachal Pradesh
Ramky Enviro Engineers Ltd, Hyderabad
Chapter 1.5
Figure 1.1
Project Location Map

Draft EIA Report for Proposed IMSWMF, Kinduwal (V), Baddi (T), Solan (D) Himachal Pradesh
M/s. BaddiBarotiwalaNalagarh Development Authority EPIP Phase I, Jharmajri, Baddi,Solan (D)
Himachal Pradesh
Ramky Enviro Engineers Ltd, Hyderabad
Chapter 1.6
1.3.1 Importance of MSW The importance of effective Municipal Solid Waste Management (MSWM) services is to protect public health, the environment and natural resources (water, land, air). To promote the ecological management of solid waste in compliance with the principle of the 4Rs: Reduce, Reuse, Recycle, Recover and safe disposal. An effective MSWM service can be achieved only by improving the efficiency of MSWM activities, thereby leading to the reduction of waste generation, separation of MSW and recycling and recovery of materials, and generation of compost and energy. The principles which govern the future approach to provision of MSWM services include the following:
• Promoting awareness of waste management principles among citizens and other stake holders
• Minimizing multiple and manual handling of waste and designing a system to ensure that MSW does not touch the ground till treatment and final disposal
• Defining the roles and responsibilities of various stakeholders and putting in place an operational frame work, which would include appropriate contractual structures
• Developing systems for effective resources utilization and deployment • Promoting recovery of value from MSW; developing treatment and final disposal
facilities, which, while adhering to the statutory requirements are sustainable, environmental friendly and economical.
1.4Scope of the Study 1.4.1Proposed TOR The Scope of the study is to carry out the Environmental Impact Assessment (EIA) studies to identify, predict and evaluate potential environmental and socio-economic impacts which may result from the proposed Integrated Municipal Solid Waste Management Facility and to develop suitable Environment Management Plan (EMP) to mitigate the undesirable effects. The study is aimed at:
a) Establishing the existing environmental conditions, identifying potential environmental impacts and identifying areas of significant environmental concerns due to the proposed project;
b) Prediction of impacts on environment, socio-economic conditions of the people etc. due to the proposed project.
c) Preparation of Environmental Management Plan (EMP); d) Development of post project environmental monitoring programme.
The EIA study shall be conducted as per the applicable rules/guidelines of Ministry of Environment and Forests, Govt. of India including general/sectoral provisions

Draft EIA Report for Proposed IMSWMF, Kinduwal (V), Baddi (T), Solan (D) Himachal Pradesh
M/s. BaddiBarotiwalaNalagarh Development Authority EPIP Phase I, Jharmajri, Baddi,Solan (D)
Himachal Pradesh
Ramky Enviro Engineers Ltd, Hyderabad
Chapter 1.7
The EIA study will necessarily include but not get restricted to the following: (a) literature review, (b) field studies (c) impact assessment and preparation of the EIA/EMP document covering the disciplines of Meteorology, Air quality, Noise, Water Quality, Land Use, Soils, Water Use, Demography and Socio-economics, Ecology etc. Stage A Establishing the relevant features of the project that are likely to have an
impact on the environment during construction and operation phases. Collection of baseline data for weather conditions from March 2012 to May 2012 (one season study).
Stage ‘B’ Assessment of likely emissions from the proposed facility.Assessment of
impacts using scientific tools to delineate post project scenario.
Stage ‘C’ Suggesting adequate pollution control measures to offset adverse impacts if any. Preparation of the EIA and EMP document.Defense of the study findings before the regulatory authorities.
Stages A, B & C may have concurrent activities. An outline of the activities to be undertaken for each stage is given below: Stage ‘A’: The study area shall be up to 10 KM radial distance from the proposed project with reference to air, water, soil, noise, Socio economic and ecological studies. The baseline environmental conditions shall be established using GSITopo sheets, through literature survey and field investigations. In addition to the above, information on the location of towns/cities, national parks, wildlife sanctuaries and ecologically sensitive areas like tropical forests, important lakes, bio-sphere reserves and sanctuaries within impact area shall be furnished. A review and analysis of the information available with various governmental, educational and other institutions shall be carried out for each discipline. Based upon preliminary review of the available data, detailed field work shall be planned to collect information on the parameters critical to characterize the environment of the area. The baseline environmental studies shall be undertaken for Meteorology, Air quality, Noise, Water Quality, Water Use, various aspects to be covered under different disciplines is as follows: (a) Meteorology Following meteorological parameters of the area shall be measured at the project site. In addition, data shall be collected from the nearest IMD observatory also for reference.
1) Temperature (Dry & Wet) 2) Rainfall

Draft EIA Report for Proposed IMSWMF, Kinduwal (V), Baddi (T), Solan (D) Himachal Pradesh
M/s. BaddiBarotiwalaNalagarh Development Authority EPIP Phase I, Jharmajri, Baddi,Solan (D)
Himachal Pradesh
Ramky Enviro Engineers Ltd, Hyderabad
Chapter 1.8
3) Relative humidity 4) Wind speed and direction, and
(b) Air Quality Ambient Air Quality shall be monitored at requisite number of locations considering the prevailing meteorological conditions, topography, nearby villages etc. The parameters for monitoring shall bePM10 and PM2.5, SO2, NOxand CO. Adequacy of the existing air pollution control measures shall be studied. (c) Noise Noise monitoring survey shall be carried out to characterize the noise environment in the study area. The noise level shall be measured using high level precision sound level meter at suggested number of locations. Attenuation model shall be developed to predict the noise level in the surrounding areas. (d) Water Surface water samples and Ground water samples within study area shall be collected and analyzed for physic chemical analysis covering major, minor ions, some important heavy metals. (e) Soil and others The following data will also be collected. from the study area 1. Soil 2. Land Use 3. Demography and socio Economics 4. Ecology Stage ‘B’ Assessment of Environmental impacts of proposed project With the knowledge of baseline conditions in the study area and proposed project activities, impact on the environment shall be discussed in detail covering air emissions, discharge of liquid effluents and particulates emission during construction, noise & solid waste generation etc. Detailed projections shall be made ISCST3 to reflect influence of the proposed project on different environmental components. Assessment of potential damage to terrestrial and aquatic flora and fauna due to air emissions, discharge of effluents, noise pollution, ash disposal, and change in land use pattern, habitat degradation and fragmentation, anthropogenic activities from the proposed project and delineation of guidelines to minimize adverse impacts is to be done. Assessment of economic benefits arising out of the project shall be done.

Draft EIA Report for Proposed IMSWMF, Kinduwal (V), Baddi (T), Solan (D) Himachal Pradesh
M/s. BaddiBarotiwalaNalagarh Development Authority EPIP Phase I, Jharmajri, Baddi,Solan (D)
Himachal Pradesh
Ramky Enviro Engineers Ltd, Hyderabad
Chapter 1.9
Stage ‘C’ Environmental Management Plan At this stage, it may become apparent that certain mitigation measures are necessary to offset the impacts from the proposed project. Environmental management plan and pollution control measures shall be necessary to meet the requirements of the regulatory agencies. Environmental Management Plan shall consist of mitigation measures for item-wise activity to be undertaken for construction and operation of the facility for its entire life cycle to minimize adverse environmental impacts. It shall also delineate the environmental monitoring plan for compliance of various environmental regulations. 1.4.2 Additional TOR issued by MOEF During the discussions, the Committee finalized the following TOR for further study:
I. Submit the details of Site selection criteria adopted vis-a vis the guidelines and the justification for selection of the proposed site out of 8 sites.
II. The project should be designed based on the population projections as per Master Plan of the city.
III. Submit a 10 km. radius map (on survey of India toposheet) showing co-ordinates of project site, national highway, state highway, district road/approach road, river, canal, natural drainage; protected areas, under Wild Life (Protection) Act, archaeological site, natural lake, flood area, human settlements (with population), industries, high tension electric line, prominent wind direction (summer and winter), effluent drain, if any and ponds etc. should be presented and impacts assessed on the same.
IV. Examine and submit details of storm water/ leachate collection from the composted area.
V. Examine and submit details of monitoring of water quality around the landfill site. Water analysis shall also include for nitrate and phosphate.
VI. Examine and submit details of the odour control measures. VII. Examine and submit details of impact on water bodies/rivers/ ponds and mitigative
measures during rainy season. VIII. Submit the criteria for assessing waste generation. IX. Submit a copy of the layout plan of project site showing solid waste storage, green
belt (width & length, 33% of the project area), all roads, prominent wind direction, processing plant & buildings etc. should be provided.
X. Submit a copy of the land use certificate from the competent authority. XI. Submit a copy of the status of ambient air quality and surface and ground water
quality, soil type, cropping pattern, land use pattern, population, socio-economic status, anticipated air and water pollution.

Draft EIA Report for Proposed IMSWMF, Kinduwal (V), Baddi (T), Solan (D) Himachal Pradesh
M/s. BaddiBarotiwalaNalagarh Development Authority EPIP Phase I, Jharmajri, Baddi,Solan (D)
Himachal Pradesh
Ramky Enviro Engineers Ltd, Hyderabad
Chapter 1.10
XII. Submit a copy of the topography of the area indicating whether the site requires any filling, if so, the details of filling, quantity of fill material required, its source and transportation, etc.
XIII. Examine and submit the details of impact on the drainage and nearby habitats/settlements (surroundings).
XIV. Examine and submit the details of surface hydrology and water regime and impact on the same.
XV. Examine and submit the details of one complete season AAQ data (except monsoon) with the dates of monitoring, impact of the project on the AAQ of the area (including H2S, CH4
XVI. Submit a copy of detailed plan of waste management. ).
XVII. Submit the details of sanitary land fill site impermeability and whether it would be lined, if so details thereof.
XVIII. Submit the details of assessment of the site in view of impact on smooth movement in religious/pilgrimage areas.
XIX. Examine and submit the details of impact on environmental sensitive areas. XX. Examine and submit the details of rehabilitation/compensation package for the
project effected people, if any. XXI. Submit Environmental Management Plan and Environmental Monitoring Plan with
costs and parameters. XXII. A high level advisory and monitoring committee which should include to plan,
execute and maintain the environmental issues/ recommendations mentioned above. The monitoring shall be done at various stages (planning, construction, operation) of project for compliance of conditions. Budgetory provisions shall be made to the satisfaction of this Committee.
1.4.3Draft EIA Report Based on the proposed TOR and additional TOR issued by MOEF, the draft EIA report will be prepared as per Generic Structure of Environmental Impact Assessment Document. The draft EIA report consists of 11 Chapters.

Draft EIA Report for Proposed IMSWMF, Kinduwal (V), Baddi (T), Solan (D), Himachal Pradesh
M/s. Baddi Barotiwala Nalagarh Development Authority EPIP Phase I, Jharmajri, Baddi, Solan (D),
Himachal Pradesh
Ramky Enviro Engineers Ltd, Hyderabad
Chapter 2.1
CHAPTER -2 PROJECT DESCRIPTION 2.1 Type of the Project The proposed project is an Integrated Municipal Solid Waste Management Facility to cater the needs of municipal solid waste generated from domestic, commercial, industrial activities in BBN Area. The proposed project is planned in accordance to the MSW rules 2000 and it consists of Compost plant, Recyclable segregation facility, Secured Landfill, Leachate treatment and reuse facility. 2.2. Need of the Project During year 2003 Government of India announced incentive package for setting up industries in the State of Himachal Pradesh. During this period the BBNA has grown exponentially, new industries were setup resulting in increase in population by intra state and interstate migration. Decadal growth rate in 1991-2001 was 40.8% and existing civil management services are unable to cope up the situation. Projected decadal trend for solid waste for 2021 is 36.63%, hence immediate need to take up suitable measures to develop a suitable waste processing and treatment facilities in BBNA is proposed. In BBN area at present there are 1477 industrial units, which is attracting migration of nearby people due to change in the lifestyle of the locals. Due to this, the per capita municipal solid waste generation is also increasing regularly. As per CWP PIL 13/2006 titled as “Court on its Own Mission” vs State of Himachal Pradesh and Others is pending in the Hon’ble High Court of H.P. in which Ministry of Environment and Forest, Government of India is also imp-leaded as respondent No. 7 and the Hon’ble High Court of H.P is monitoring this case from time to time and directing the State Government to set up a Municipal Solid Waste Plant in BBNA at the earliest. To meet the Hon’ble High Court of H.P directions BBNDA is proposing to establish IMSWMF to improve and develop a socially and environmentally sustainable system for solid waste management which will reduce the associated environmental and public health problems of BBNA. To achieve this it is designing a strategic framework to ensure that the local bodies discharge their responsibilities efficiently with appropriate private sector participation in the design, management and operations of collection, transportation, processing and sanitary disposal of municipal solid waste in the area.
2

Draft EIA Report for Proposed IMSWMF, Kinduwal (V), Baddi (T), Solan (D), Himachal Pradesh
M/s. Baddi Barotiwala Nalagarh Development Authority EPIP Phase I, Jharmajri, Baddi, Solan (D),
Himachal Pradesh
Ramky Enviro Engineers Ltd, Hyderabad
Chapter 2.2
2.3 Location of the Project The proposed project is in Kinduwal Village, Baddi Thesil, Solan District, HP, adjacent to proposed CETP. The region lies in the periphery of Solan District which is branded by hills in the north and plains in the south. It is characterized by undulating topography and located in the plains with good connectivity with neighboring states of Haryana and Punjab. The Himachal Pradesh State Industrial Development Corporation (HPSIDC) is the nodal agency for promotion and establishment of industrial units in the state, which functions under the BBNDA which is playing key role in creating and maintaining very healthy communication between government, industries and society at large, besides dissemination of information to its constituent members The BBNDA has been created by State Government of Himachal Pradesh for comprehensive and regulated development of BBNA and to cater the needs of local population. BBNDA has been given 10.115 Ha (25 Acres) of Land in Kinduwal Village for development of CETP in an area of 7.69 Ha (19 Acres) of land and IMSWMF in an area of 2.42 Ha (6 Acres) of land. The nearest habitation is in Kinduwal village, nearest Railway station is Kalka Railway Station around 22 km away, where as nearest Airport is Chandigarh Airport around 40km. The nearest highway is NH 21A connecting Nalagarh to Pinchore is around 0.75 km East direction. The nearest river is Sirsa River flowing in West directionat a distance of around 200 m. The state boundaries of Harayana is 3.5 km S and Punjab is around 3 km W. The nearest town is Baddi and nearest industrial areas Baddi & Barotiwala Industrial areas. The proposed project site is barren land, no clearance of vegetation or demolition of any structures is required for the proposed MSWM Project. The General Location map of the project is given as Figure 2.1 and Study area map of 10 km radius showing specific location is given as Figure 2.2. The Google image of project site is shown as Figure 2.3 and project layout showing neighboring CETP is shown as Figure 2.4, and the project layout of proposed MSW is shown as Figure 2.5. Some of the site photographs are given as Figure 2.6.

Draft EIA Report for Proposed IMSWMF, Kinduwal (V), Baddi (T), Solan (D), Himachal Pradesh
M/s. Baddi Barotiwala Nalagarh Development Authority EPIP Phase I, Jharmajri, Baddi, Solan (D),
Himachal Pradesh
Ramky Enviro Engineers Ltd, Hyderabad
Chapter 2.3
Figure 2.1
Project Location Map

Draft EIA Report for Proposed IMSWMF, Kinduwal (V), Baddi (T), Solan (D), Himachal Pradesh
M/s. Baddi Barotiwala Nalagarh Development Authority EPIP Phase I, Jharmajri, Baddi, Solan (D),
Himachal Pradesh
Ramky Enviro Engineers Ltd, Hyderabad
Chapter 2.4
Figure 2.2 Study Area Map of 10 km Radius

Draft EIA Report for Proposed IMSWMF, Kinduwal (V), Baddi (T), Solan (D), Himachal Pradesh
M/s. Baddi Barotiwala Nalagarh Development Authority EPIP Phase I, Jharmajri, Baddi, Solan (D),
Himachal Pradesh
Ramky Enviro Engineers Ltd, Hyderabad
Chapter 2.5
Figure 2.3 Google Image of the proposed Site – 2 km radius

Draft EIA Report for Proposed IMSWMF, Kinduwal (V), Baddi (T), Solan (D), Himachal Pradesh
M/s. Baddi Barotiwala Nalagarh Development Authority EPIP Phase I, Jharmajri, Baddi, Solan (D),
Himachal Pradesh
Ramky Enviro Engineers Ltd, Hyderabad
Chapter 2.6
Figure 2.4
Project Layout showing CETP and MSW

Draft EIA Report for Proposed IMSWMF, Kinduwal (V), Baddi (T), Solan (D), Himachal Pradesh
M/s. Baddi Barotiwala Nalagarh Development Authority EPIP Phase I, Jharmajri, Baddi, Solan (D),
Himachal Pradesh
Ramky Enviro Engineers Ltd, Hyderabad
Chapter 2.7
Figure 2.5 Project Layout MSW

Draft EIA Report for Proposed IMSWMF, Kinduwal (V), Baddi (T), Solan (D), Himachal Pradesh
M/s. Baddi Barotiwala Nalagarh Development Authority EPIP Phase I, Jharmajri, Baddi, Solan (D),
Himachal Pradesh
Ramky Enviro Engineers Ltd, Hyderabad
Chapter 2.8
Figure 2.6
Site Photographs

Draft EIA Report for Proposed IMSWMF, Kinduwal (V), Baddi (T), Solan (D), Himachal Pradesh
M/s. Baddi Barotiwala Nalagarh Development Authority EPIP Phase I, Jharmajri, Baddi, Solan (D),
Himachal Pradesh
Ramky Enviro Engineers Ltd, Hyderabad
Chapter 2.9
2.4 Size of the Project & Associated Activities The Proposed IMSWMF comprises of processing units like receiving yard, Compost Plant, Recycling yard and Secured landfill for catering the BBN Area. The proposed project is designed to handle the present municipal waste along with future increased quantity depending on the population growth of the area.
Population on Decadal Growth rate S. No Region 1981 1991 2001 2011 Decadal Growth Rate
% 1 Nalagarh MC 5647 7448 9443 10499 31.9 26.8 11.2 2 Baddi MC - - 22601 30000 - - 32.7 3 41 gram
panchayat 61754 91571 107406 139627 48.3 17.3 30.0
4 Total BBN 67401 99019 139450 180126 46.9 40.8 29.2 Source: Census data and analysis 2011 numbers are based on provisional census numbers
Waste generation scenario of BBNDA Region 2011 2021 2031
Po
pula
tion
Gm
/Cap
ita/D
ay
Was
te g
ener
ated
TP
D
Po
pula
tion
G
m/C
apita
/Day
Was
te g
ener
ated
TP
D
Po
pula
tion
G
m/C
apita
/Day
Was
te g
ener
ated
TP
D
Baddi MC 30,000 355 10.65 39,167 404 15.82 50,999 459 23.44 Nalagarh MC 10,499 355 3.73 11,463 404 4.63 12,000 459 5.52 Grampanchayat 91,695 199 18.25 106,139 228 24.20 120,187 259 31.13 BBNDA 132,194 - 32.68 156,769 - 44.65 183,186 - 60.09
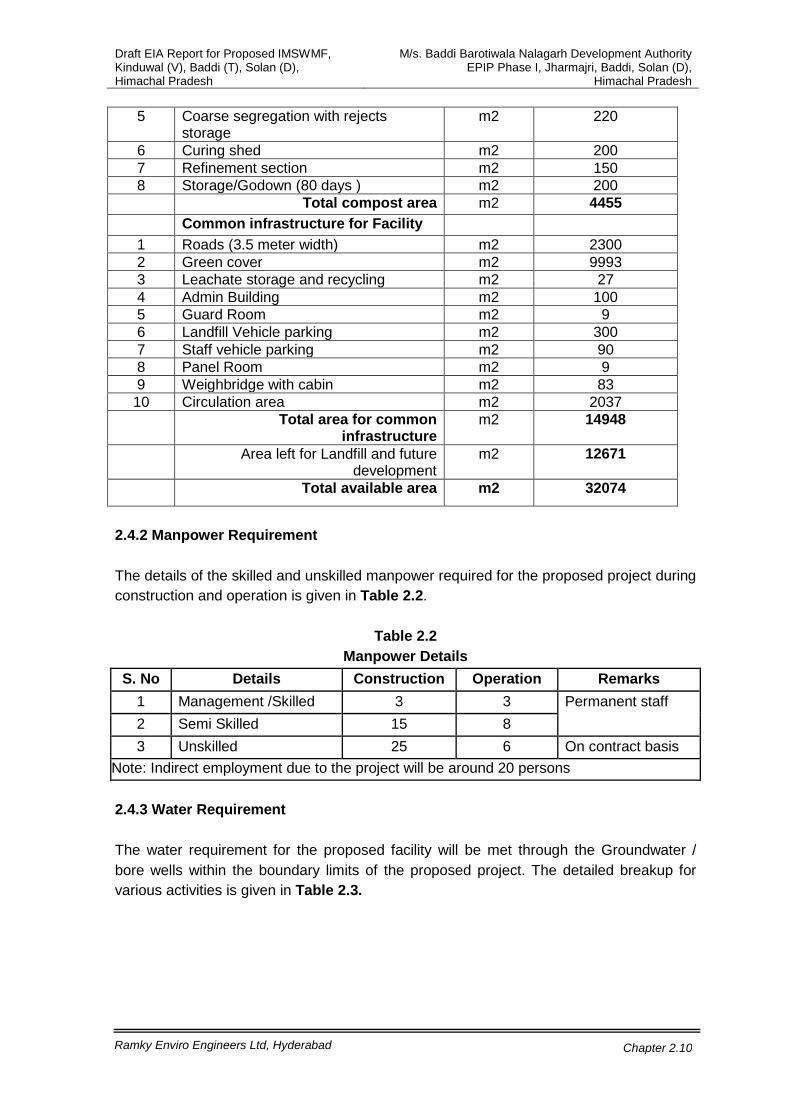
2.4.1 Land The proposed project is coming up in an identified municipal dump area by Municipal Authorities and the site will be cleared to certain extent and will be developed in planned manner so that it can be used for further few decades. Details of land break up for present and for catering future needs are given in Table 2.1.
Table 2.1
Land Area break-up Sl. No Compost Plant Area requirement units Total area
required 1 Tipping area / receiving of MSW m2 225 2 Pre-processing facility m2 480 3 Compost pad m2 2280 4 Monsoon Shed m2 700
Draft EIA Report for Proposed IMSWMF, Kinduwal (V), Baddi (T), Solan (D), Himachal Pradesh
M/s. Baddi Barotiwala Nalagarh Development Authority EPIP Phase I, Jharmajri, Baddi, Solan (D),
Himachal Pradesh
Ramky Enviro Engineers Ltd, Hyderabad
Chapter 2.10
5 Coarse segregation with rejects storage
m2 220
6 Curing shed m2 200 7 Refinement section m2 150 8 Storage/Godown (80 days ) m2 200 Total compost area m2 4455 Common infrastructure for Facility
1 Roads (3.5 meter width) m2 2300 2 Green cover m2 9993 3 Leachate storage and recycling m2 27 4 Admin Building m2 100 5 Guard Room m2 9 6 Landfill Vehicle parking m2 300 7 Staff vehicle parking m2 90 8 Panel Room m2 9 9 Weighbridge with cabin m2 83 10 Circulation area m2 2037 Total area for common
infrastructure m2 14948
Area left for Landfill and future development
m2 12671
Total available area m2 32074
2.4.2 Manpower Requirement
The details of the skilled and unskilled manpower required for the proposed project during construction and operation is given in Table 2.2.
Table 2.2
Manpower Details S. No Details Construction Operation Remarks
1 Management /Skilled 3 3 Permanent staff 2 Semi Skilled 15 8 3 Unskilled 25 6 On contract basis
Note: Indirect employment due to the project will be around 20 persons 2.4.3 Water Requirement The water requirement for the proposed facility will be met through the Groundwater / bore wells within the boundary limits of the proposed project. The detailed breakup for various activities is given in Table 2.3.

Draft EIA Report for Proposed IMSWMF, Kinduwal (V), Baddi (T), Solan (D), Himachal Pradesh
M/s. Baddi Barotiwala Nalagarh Development Authority EPIP Phase I, Jharmajri, Baddi, Solan (D),
Himachal Pradesh
Ramky Enviro Engineers Ltd, Hyderabad
Chapter 2.11
Table 2.3 Water Requirement details in m3
S No. /day
Utility Fresh Treated Total 1 Domestic 1.0 0 1.0 2 Floor Washings / mopping 1.0 0 1.0 3 Work Shop/ Vehicle maintenance shed 1.0 0 1.0 4 Compost Plant 4.0 15.5 19.5 5 Plastic Recycling 1.0 0 1.0 6 Green belt 2.0 0.5 2.5
Total 10.0 16.0 26.0 Source: Groundwater
2.4.4 Power & Fuel Requirement The details of the power and fuel required for running DG sets for emergency use during power failure are given in Table 2.4.
Table 2.4
Power and Fuel Requirement Details Capacity Remarks
Power 100 KVA Source: HP State Electricity Board. DG set 2 x 50 KVA For emergency power backup (one DG set as
spare), Fuel will be procured from local dealers Diesel 10 Ltrs/hr Sulphur - content <0.05% 2.5 Technology and Process Description The activities planned in the proposed project includes collection, transportation, treatment & disposal of municipal solid waste in compliance to the MSW Handling Rules (2000). The basic concept for the solid waste management of the BBNDA project area is presented in the form of the flow chart in s Figure 2.7. This concept has been developed keeping into considerations the following design criteria, for the design period of 15 years.
• Compliance to the MSW handling rules (2000) for waste collection, transportation,
treatment & disposal; • Providing Door to door collection of waste from source in segregated manner with
the introduction of 2-bin system (for green waste and dry waste); • Introduction of an efficient secondary waste collection & transportation system
using refuse collectors etc; • Adapting the 4Rs principal of waste minimization through reduction, reuse, recycle
and recover. Hence, proposed a mechanism for recovery of recyclables at the processing facility and waste reuse through composting of food waste and other green waste;
• Final disposal of only rejects/inerts at the scientifically developed landfill with an

Draft EIA Report for Proposed IMSWMF, Kinduwal (V), Baddi (T), Solan (D), Himachal Pradesh
M/s. Baddi Barotiwala Nalagarh Development Authority EPIP Phase I, Jharmajri, Baddi, Solan (D),
Himachal Pradesh
Ramky Enviro Engineers Ltd, Hyderabad
Chapter 2.12
attempt to dispose not more than 25% of the generated waste quantity at the landfill.
The municipal waste received at the site is processed at waste management facility by segregating the waste into recyclable and composting material. After separation of recyclables the compostable material will be diverted to compost plant. The detailed material balance flow diagram for processing of MSW is described in Figure 2.8. The list of the important major machinery, vehicles, sheds; etc required for the proposed project is given in Table 2.3
Figure 2.7
Proposed Concept of IMSWMF

Draft EIA Report for Proposed IMSWMF, Kinduwal (V), Baddi (T), Solan (D), Himachal Pradesh
M/s. Baddi Barotiwala Nalagarh Development Authority EPIP Phase I, Jharmajri, Baddi, Solan (D),
Himachal Pradesh
Ramky Enviro Engineers Ltd, Hyderabad
Chapter 2.13
Figure 2.8 Material balance of the proposed facility

Draft EIA Report for Proposed IMSWMF, Kinduwal (V), Baddi (T), Solan (D), Himachal Pradesh
M/s. Baddi Barotiwala Nalagarh Development Authority EPIP Phase I, Jharmajri, Baddi, Solan (D),
Himachal Pradesh
Ramky Enviro Engineers Ltd, Hyderabad
Chapter 2.14
Table 2.5 Details of Machinery Required For Compost Plant
Item Equipments Capacity (40 TPD) Presorting Feed Conveyor : 01 No 8 TPH Section Sorting Belt Conveyor: 01 No
Trommel (100 mm): 01 No Accept Conveyor: 01 No Reject Conveyor: 01 No Sorting Belt Conveyor: 01 No Hydraulic power Pack: 01 No Electrical Panel: 01 No
(Considering 5 hrs of operation)
Refinement Feed conveyor: 01 No 5 TPH Section Trommel (35mm): 01 No
Accept Conveyor: 01 No Reject Conveyor: 01 No Trommel (16mm): 01 No Accept Conveyor: 01 No Reject Conveyor: 01 No Hydraulic Power Pack: 02 Nos Electrical Panel: 01 No
(Considering 4 hrs of operation)
Finishing Drag Chain Conveyor: 01 No 3 TPH Section Bucket Elevator: 01 No
Rotary Screen (4mm): 01 No Accept Conveyor: 01 No Reject Conveyor: 01 No Rejects Conveyor:01 No Hydraulic Power Pack: 01 No Electrical Panel: 01 No
(Considering 4 hours of operation )
Packaging section
Bag stitching machine Weigh scale
2.5 Compost Plant The compost plant is based on the concept of open windrow aerobic composting of organic (biodegradable) component of solid waste. All activities associated with composting operations need careful selection of design and control to produce good quality product while minimizing environmental impacts. Activities which should be considered for composting include,
• Transportation of raw material/feed • Raw material handling • Windrowing of the waste material • Weekly turning • Screening, Sorting, Grinding, Blending & Mixing • Curing, Storage & Packing

Draft EIA Report for Proposed IMSWMF, Kinduwal (V), Baddi (T), Solan (D), Himachal Pradesh
M/s. Baddi Barotiwala Nalagarh Development Authority EPIP Phase I, Jharmajri, Baddi, Solan (D),
Himachal Pradesh
Ramky Enviro Engineers Ltd, Hyderabad
Chapter 2.15
2.6.1 Composting Process Aerobic composting is the process of degradation of biodegradable waste matter into simple organic compounds by certain micro organisms in the presence of air. The process begins at ambient temperature by the activity of mesophilic bacteria which oxidize carbon to CO2, thus liberating large amount of heat. Usually, the temperature of the waste piles reaches 500C within two days, and this represents the limit of temperature tolerance of the mesophilic organisms. At this point the process is taken over by thermophilic bacteria and the temperature continues to rise. Most of the thermophilic phase, which lasts about two weeks, takes place in the temperature range 550C – 650C, should the temperature increase beyond 650
Factors
C, activity temporarily declines. The process is dependent of course, on the provision of a suitable environment for the bacteria, in addition to the nutrients provided by the wastes. The main requirements are adequate supplies of air and moisture. Compared to anaerobic process, aerobic conversion process is preferable as it is fast, exothermic and free from odour. Aerobic process also helps to eliminate pathogenic bacteria weed seeds, larva etc. as a result of high temperature developed during the process. Main factors affecting the composting through aerobic process are listed in below Table 2.4.
Table 2.6
Factors affecting Compost Process Desirable ranges
Moisture content 50% to 60% optimum Temperature 50 to 60 OC (for 5 to 7 days, pathogens get killed) Aeration Adequate oxygen through out the mass-normally ensured by
turning every 5-7 days C/N ratio Between 20-40 If C/N ratio is less -straw, saw dust, paper to be added If C/N ratio is more -sewage sludge, slaughter waste etc. to be added At end of composting C/N=20. As per MSW regulations C/N permitted is 20-40
The complete process of Composting can be summarized as follows: Reception of raw waste • Visual Inspection of waste • Weighing of vehicle • Manual Sorting of Inert and removal of rejected material to landfill • Sorted material moved to compost pad to form windrows • Yard Management activities • Periodic turning of Windrows for four weeks • Process monitoring & controlling activities • After four weeks stabilization in the monsoon shed, feeding of material to coarse
segregation section.
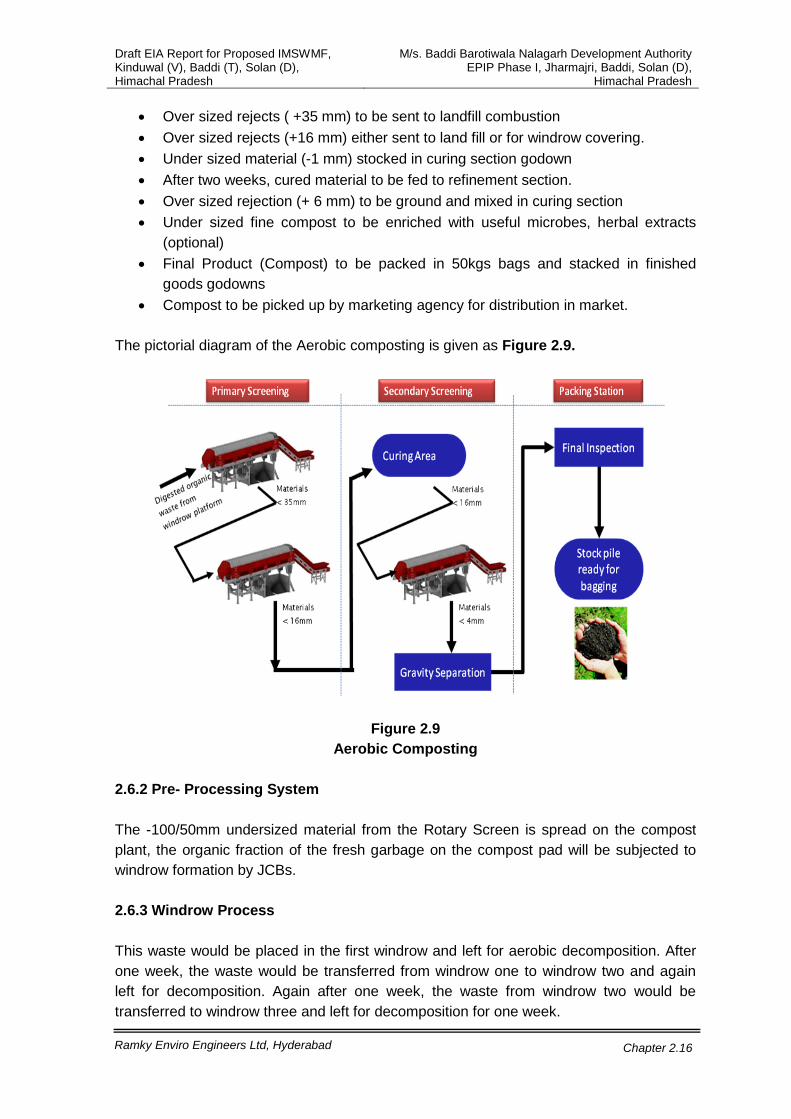
Draft EIA Report for Proposed IMSWMF, Kinduwal (V), Baddi (T), Solan (D), Himachal Pradesh
M/s. Baddi Barotiwala Nalagarh Development Authority EPIP Phase I, Jharmajri, Baddi, Solan (D),
Himachal Pradesh
Ramky Enviro Engineers Ltd, Hyderabad
Chapter 2.16
• Over sized rejects ( +35 mm) to be sent to landfill combustion • Over sized rejects (+16 mm) either sent to land fill or for windrow covering. • Under sized material (-1 mm) stocked in curing section godown • After two weeks, cured material to be fed to refinement section. • Over sized rejection (+ 6 mm) to be ground and mixed in curing section • Under sized fine compost to be enriched with useful microbes, herbal extracts
(optional) • Final Product (Compost) to be packed in 50kgs bags and stacked in finished
goods godowns • Compost to be picked up by marketing agency for distribution in market.
The pictorial diagram of the Aerobic composting is given as Figure 2.9.
Figure 2.9 Aerobic Composting
2.6.2 Pre- Processing System The -100/50mm undersized material from the Rotary Screen is spread on the compost plant, the organic fraction of the fresh garbage on the compost pad will be subjected to windrow formation by JCBs. 2.6.3 Windrow Process This waste would be placed in the first windrow and left for aerobic decomposition. After one week, the waste would be transferred from windrow one to windrow two and again left for decomposition. Again after one week, the waste from windrow two would be transferred to windrow three and left for decomposition for one week.

Draft EIA Report for Proposed IMSWMF, Kinduwal (V), Baddi (T), Solan (D), Himachal Pradesh
M/s. Baddi Barotiwala Nalagarh Development Authority EPIP Phase I, Jharmajri, Baddi, Solan (D),
Himachal Pradesh
Ramky Enviro Engineers Ltd, Hyderabad
Chapter 2.17
Material after digestion needs further stabilization and loss of moisture so that it can be segregated in to different fractions. Also a monsoon shed is provided for protection during rainy season. Decomposed material coming from the Compost Pad is kept here for about 15 – 20 days. The shed will be 8 m high open shed covered with fiber glass/ sheet roof. The shed must be open from all sides for easy vehicle movement and for ventilation. Material from shed is then fed to the Coarse Segregation Section using a Loader for intermediate screening. After processing, material is conveyed to the curing section. The equipment line-up contains a Feeder Conveyor and two Trommel with their associated conveyors. The two stage screening system is adopted to achieve maximum screening efficiency. Cascading action in Trommel ensures better screening of the lumpy and highly heterogeneous material. Equipments in this section are hydraulically driven to ensure greater safety against breakdowns and to reduce power consumption. Hydraulic drive also introduces features like on-load starting, centralized control etc. PLC based controls allows automatic shutdown in case of any emergency. Screened material coming out of this section is uniform in texture and contains semi – stabilized organic compost, which is further transferred to curing section for complete stabilization. 2.6.4 Curing System Material coming out of the Coarse Segregation Section is stored in curing section for 15 days for further stabilization and moisture control. Some additives added at this stage to improve quality of final product, if required. 2.6.5 Refinement System The cured material is first fed to a drag feeder conveyor which in turn gradually feeds the same to the Trommel Screen at a controlled rate. The screened material coming out of the Trommel screen is sent to the gravity separator, which further removes the impurities such as glass, metals, sand, silica etc. from the compost. From here, the compost is passed through a liquid add mixer where quality enhancer in powder or liquid form is added. 2.6.6 Packing and Storage System From the refinement section, high quality compost is packed in bags and then weighed. Bags are then stitched using a portable sewing machine and finally stacked in the finished goods godown. 2.7 Recycling Unit In the recycling complex the segregated recyclable waste will be processed to produce value added products.
• Paper will be bailed and sold to authorized dealers • Plastic collected will be sold to authorized dealers • Cloths separated are bailed and sold

Draft EIA Report for Proposed IMSWMF, Kinduwal (V), Baddi (T), Solan (D), Himachal Pradesh
M/s. Baddi Barotiwala Nalagarh Development Authority EPIP Phase I, Jharmajri, Baddi, Solan (D),
Himachal Pradesh
Ramky Enviro Engineers Ltd, Hyderabad
Chapter 2.18
• Metals separated will be sold to authorized dealers • Rubber separated will be sold to authorized dealers • Glass separated will be sold to authorized dealers
2.8 Land fill Landfill design involves development of concept, adoption of suitable procedure and safety considerations. Landfill is a typical combination of different component and each of these components has to be designed separately. For this process standard design procedure by CPHEEO Manual on Municipal Solid Waste Management, United States Environmental Protection Agency’s Manual on Solid Waste Management (Subpart – D, Design Criteria) and Municipal Solid Waste (Management & Handling) Rules have been adopted. Design concepts for the following components have been developed,
• Assessment of landfill volume and area required • Landfill life • Evaluation of concept development plan – Foot Print of Landfill Site • Design of leachate collection system • Design of liner system • Assessment of landfill gas generation • Design of landfill gas collection system • Design of final cover system
2.8.1 Landfill Volume The volume of the landfill has been estimated based on the topography of the site and using the AutoCAD software. Before estimating the volume maximum height that can be achieved is estimated as 30m. 2.8.2 Landfill Life The waste comprising silt, sand, rejects from each process line is required to be disposed at the landfill. The details considered for estimating landfill life are given in Table 2.5.
Table 2.7
Estimation of Landfill Life Quantity of inerts 2737 tons/annum @ 7.5TPD Life of landfill 15 years (phase wise) Volume of inerts 48300 m3 @ 0.85tons/m3 Leachate generation from landfill 0.5 m3/day Landfill area 1.5 acre @ 15 years Depth of the landfill above ground 10 m Dimensions of the landfill 60mX90m

Draft EIA Report for Proposed IMSWMF, Kinduwal (V), Baddi (T), Solan (D), Himachal Pradesh
M/s. Baddi Barotiwala Nalagarh Development Authority EPIP Phase I, Jharmajri, Baddi, Solan (D),
Himachal Pradesh
Ramky Enviro Engineers Ltd, Hyderabad
Chapter 2.19
2.8.3 Standard Design Requirements For design and development of landfill recommendation from MSW Rules, 2000 have been adopted. Apart from that CPHEEO Manual and United States Environmental Protection Agency’s Manual on Solid Waste Management (Subpart – Design Criteria) are also been referred to establish the design requirements is given in Table 2.6.
Table 2.8
Standard Design Requirements for Sanitary Landfill Landfill
Component Requirement Reference
Bottom Liner / Composite Liner
• A 90cm thick compacted clay or amended soil (amended with bentonite) of permeability not greater than 1X10⁻⁷
• A HDPE geomembrane liner of thickness 1.5mm
cm/sec
• 285 GSM Geo textile • A drainage layer of 300mm thick granular
material of permeability not greater than 1X10⁻²
• 285 GSM Geo textile cm/sec.
MSW Rules, 2000
Final Cover • Vegetative layer of 450mm thick with good vegetation supporting soil
• Drainage layer of 150mm thick granular material with permeability 1 X 10⁻²
• Barrier layer of 600mm thick clay/amended soil with permeability 1 X 10-
cm/sec
7
• Gas venting layer of 200mm thick granular material with permeability 1 X 10-
cm/sec
2
MSW Rules, 2000
cm/sec Max Allowable Leachate Head with in Landfill
30 cm USEPA’s Manual on Solid Waste Management (Subpart – D, Design Criteria)
Base Slope 2% CPHEEO Manual Cover Slope Not steeper than 1:4 CPHEEO Manual
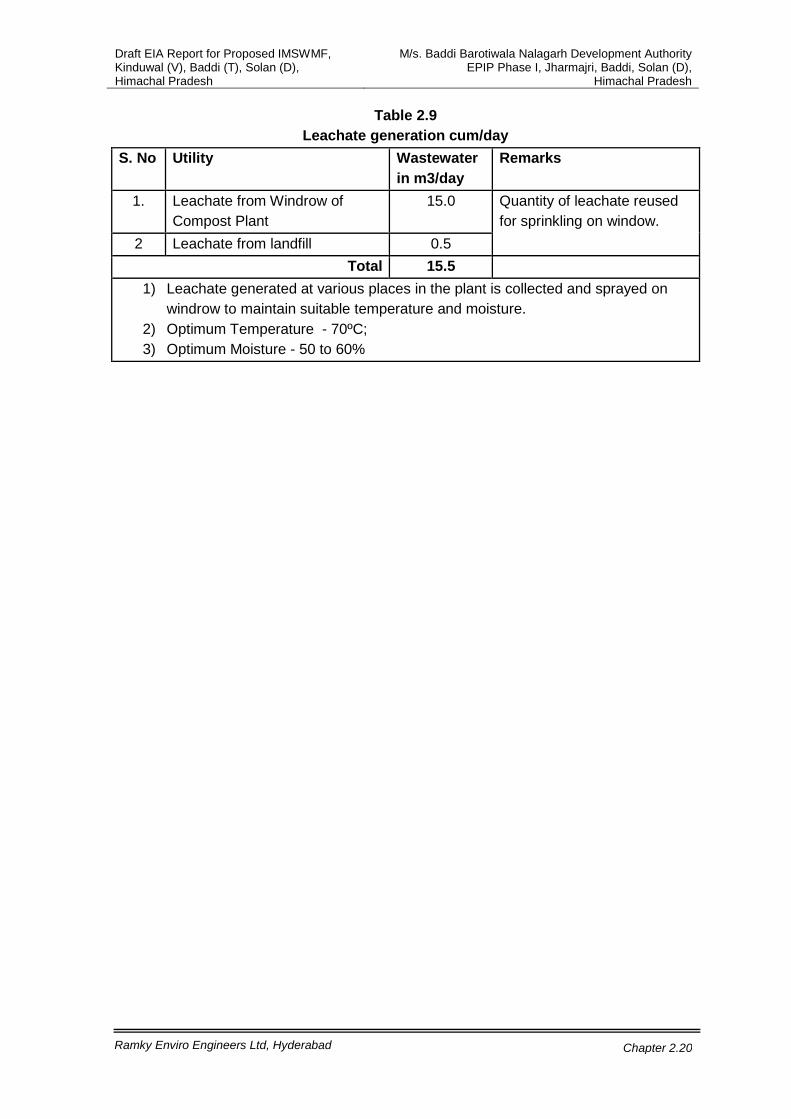
2.9 Leachate Generation The leachate generation from the each area of the proposed facility is estimated and tabulated in the below Table 2.9.
Draft EIA Report for Proposed IMSWMF, Kinduwal (V), Baddi (T), Solan (D), Himachal Pradesh
M/s. Baddi Barotiwala Nalagarh Development Authority EPIP Phase I, Jharmajri, Baddi, Solan (D),
Himachal Pradesh
Ramky Enviro Engineers Ltd, Hyderabad
Chapter 2.20
Table 2.9 Leachate generation cum/day
S. No Utility Wastewater in m3/day
Remarks
1. Leachate from Windrow of Compost Plant
15.0 Quantity of leachate reused for sprinkling on window.
2 Leachate from landfill 0.5 Total 15.5
1) Leachate generated at various places in the plant is collected and sprayed on windrow to maintain suitable temperature and moisture.
2) Optimum Temperature - 70ºC; 3) Optimum Moisture - 50 to 60%

Draft EIA Report for Proposed IMSWMF, Kinduwal (V), Baddi (T), Solan (D), Himachal Pradesh
M/s. Baddi Barotiwala Nalagarh Development Authority EPIP Phase I, Jharmajri, Baddi, Solan (D),
Himachal Pradesh
Ramky Enviro Engineers Ltd, Hyderabad
Chapter 3.1
CHAPTER-3 DESCRIPTION OF THE ENVIRONMENT 3.0 Preamble Baseline environmental status in and around the proposed project depicts the existing environmental conditions of air, water, noise, soil, biological and socio-economic environment. With proposed project as the center, a radial distance of 10 Km is considered as ‘study area’ for baseline data collection. Baseline data was collected for various environmental attributes so as to compute the impacts that are likely to arise due to proposed developmental activity. The main aim of the impact assessment study is to find out the impact of the project on the environment. This study is carried out during the project planning stage itself, so that the proponent can implement the project in a technically, financially and environmentally viable way. The success of any impact assessment study depends mainly on two factors. First is estimation of impact from proposed project on the environment and the second is assessment of the environmental condition. Both are key factors to arrive at the post project scenario. The estimated impact due to the proposal can be superimposed over the existing conditions to arrive at the post project scenario. 3.1 Study Area & Period The site area is consisting hard rock terrain, composed of granites. The study area covering 10 km radially all around the center of the project site is fairly undulating with considerable number of small hillocks. Map of the study area is shown in Figure 3.1. The baseline data generation has been carried out for summer season (March to May) 2012. 3.2 Meteorological Conditions The study of meteorological conditions forms an intrinsic part of the environment impact assessment study. The meteorological conditions of an area and the industrial process are both intertwined and each has a definite influence over the other. Favorable weather
3
Draft EIA Report for Proposed IMSWMF, Kinduwal (V), Baddi (T), Solan (D), Himachal Pradesh
M/s. Baddi Barotiwala Nalagarh Development Authority EPIP Phase I, Jharmajri, Baddi, Solan (D),
Himachal Pradesh
Ramky Enviro Engineers Ltd, Hyderabad
Chapter 3.2
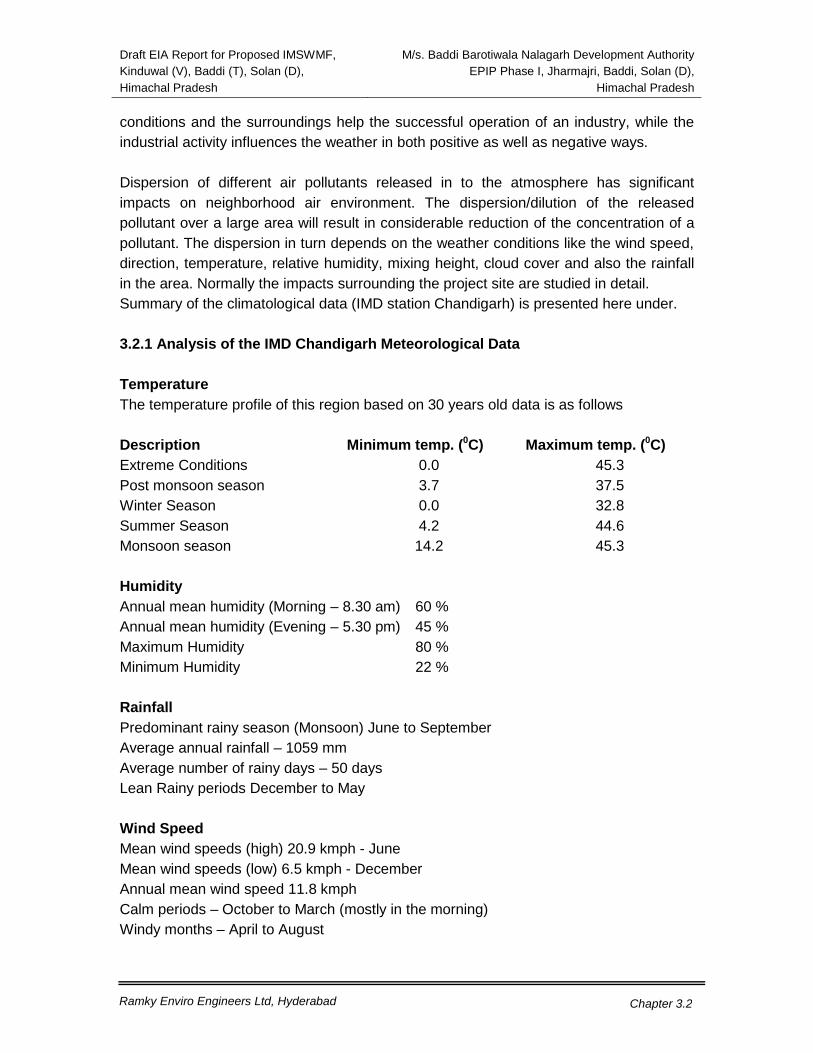
conditions and the surroundings help the successful operation of an industry, while the industrial activity influences the weather in both positive as well as negative ways. Dispersion of different air pollutants released in to the atmosphere has significant impacts on neighborhood air environment. The dispersion/dilution of the released pollutant over a large area will result in considerable reduction of the concentration of a pollutant. The dispersion in turn depends on the weather conditions like the wind speed, direction, temperature, relative humidity, mixing height, cloud cover and also the rainfall in the area. Normally the impacts surrounding the project site are studied in detail. Summary of the climatological data (IMD station Chandigarh) is presented here under.
3.2.1 Analysis of the IMD Chandigarh Meteorological Data Temperature The temperature profile of this region based on 30 years old data is as follows Description Minimum temp. (0 Maximum temp. (C) 0
Extreme Conditions C)
0.0 45.3 Post monsoon season 3.7 37.5 Winter Season 0.0 32.8 Summer Season 4.2 44.6 Monsoon season 14.2 45.3 Humidity Annual mean humidity (Morning – 8.30 am) 60 % Annual mean humidity (Evening – 5.30 pm) 45 % Maximum Humidity 80 % Minimum Humidity 22 % Rainfall Predominant rainy season (Monsoon) June to September Average annual rainfall – 1059 mm Average number of rainy days – 50 days Lean Rainy periods December to May
Wind Speed Mean wind speeds (high) 20.9 kmph - June Mean wind speeds (low) 6.5 kmph - December Annual mean wind speed 11.8 kmph Calm periods – October to March (mostly in the morning) Windy months – April to August
Draft EIA Report for Proposed IMSWMF, Kinduwal (V), Baddi (T), Solan (D), Himachal Pradesh
M/s. Baddi Barotiwala Nalagarh Development Authority EPIP Phase I, Jharmajri, Baddi, Solan (D),
Himachal Pradesh
Ramky Enviro Engineers Ltd, Hyderabad
Chapter 3.3
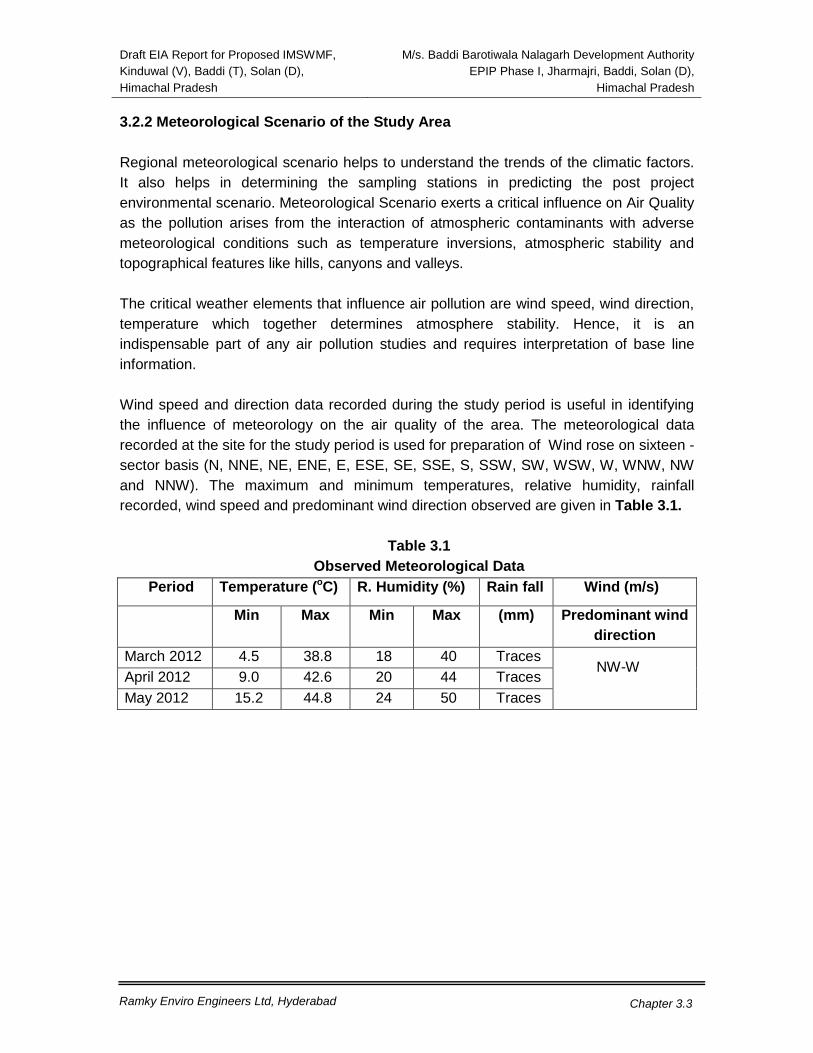
3.2.2 Meteorological Scenario of the Study Area Regional meteorological scenario helps to understand the trends of the climatic factors. It also helps in determining the sampling stations in predicting the post project environmental scenario. Meteorological Scenario exerts a critical influence on Air Quality as the pollution arises from the interaction of atmospheric contaminants with adverse meteorological conditions such as temperature inversions, atmospheric stability and topographical features like hills, canyons and valleys. The critical weather elements that influence air pollution are wind speed, wind direction, temperature which together determines atmosphere stability. Hence, it is an indispensable part of any air pollution studies and requires interpretation of base line information. Wind speed and direction data recorded during the study period is useful in identifying the influence of meteorology on the air quality of the area. The meteorological data recorded at the site for the study period is used for preparation of Wind rose on sixteen - sector basis (N, NNE, NE, ENE, E, ESE, SE, SSE, S, SSW, SW, WSW, W, WNW, NW and NNW). The maximum and minimum temperatures, relative humidity, rainfall recorded, wind speed and predominant wind direction observed are given in Table 3.1.
Table 3.1
Observed Meteorological Data Period Temperature (o R. Humidity (%) C) Rain fall Wind (m/s)
Min Max Min Max (mm) Predominant wind direction
March 2012 4.5 38.8 18 40 Traces NW-W
April 2012 9.0 42.6 20 44 Traces May 2012 15.2 44.8 24 50 Traces

Draft EIA Report for Proposed IMSWMF, Kinduwal (V), Baddi (T), Solan (D), Himachal Pradesh
M/s. Baddi Barotiwala Nalagarh Development Authority EPIP Phase I, Jharmajri, Baddi, Solan (D),
Himachal Pradesh
Ramky Enviro Engineers Ltd, Hyderabad
Chapter 3.4
Figure 3.1 Base map of the Study Area (10 km)

Draft EIA Report for Proposed IMSWMF, Kinduwal (V), Baddi (T), Solan (D), Himachal Pradesh
M/s. Baddi Barotiwala Nalagarh Development Authority EPIP Phase I, Jharmajri, Baddi, Solan (D),
Himachal Pradesh
Ramky Enviro Engineers Ltd, Hyderabad
Chapter 3.5
3.3 Wind Pattern The detailed analysis of the wind pattern during different periods for summer season is given in Table 3.2 to 3.5 and the wind roses of the same are given in Figure 3.2 to 3.5. The predominant wind direction during month of March was North West followed by South West with wind speeds recording upto > 5.4 m/s. Maximum wind range recorded was 0.3 to 1.4 m/s, calms recorded was about 8.47% of the total time and the average wind speed was 2.15 m/s. The predominant wind direction during month of April was North West followed by West with wind speeds recording upto >5.4 m/s. Maximum wind range recorded was 0.3 to 1.4 m/s, calms recorded was about 8.8% of the total time and average wind speed was 2.32 m/s. The predominant wind direction during month of May was North West followed by West with wind speeds recording upto >5.4 m/s. Maximum wind range recorded was 0.3 to 1.4 m/s, calms recorded was about 9.68% of the total time and average wind speed was 2.46 m/s. The predominant wind direction during Summer season was North West followed by West with wind speeds recording upto >5.4 m/s. Maximum wind range recorded was 0.3 to 1.4 m/s, calms recorded was about 8.92% of the total time and average wind speed was 2.31 m/s.

Draft EIA Report for Proposed IMSWMF, Kinduwal (V), Baddi (T), Solan (D), Himachal Pradesh
M/s. Baddi Barotiwala Nalagarh Development Authority EPIP Phase I, Jharmajri, Baddi, Solan (D),
Himachal Pradesh
Ramky Enviro Engineers Ltd, Hyderabad
Chapter 3.6
Table 3.2 Wind Pattern during March in m/s
Wind Dir 0.3 - 1.4 1.4 - 2.7 2.7 - 4.1 4.1 - 5.4 >= 5.4 Total N 1.48 0.94 1.08 0.27 0.27 4.04 NNE 0.40 0.27 0.40 0.00 0.13 1.21 NE 1.75 0.54 1.08 0.81 0.13 4.31 ENE 0.94 0.54 0.27 0.27 0.00 2.02 E 3.10 1.35 0.67 1.35 0.27 6.73 ESE 0.94 0.40 0.67 0.54 0.13 2.69 SE 2.29 1.48 2.29 1.08 0.54 7.67 SSE 2.02 0.54 0.94 0.81 0.13 4.44 S 0.67 0.54 0.54 0.54 0.00 2.29 SSW 2.02 1.35 1.88 0.54 0.13 5.92 SW 4.44 1.48 2.29 1.21 0.94 10.36 WSW 0.81 0.13 0.67 1.08 0.27 2.96 W 3.63 1.62 2.15 1.35 0.40 9.15 WNW 2.96 1.08 1.62 0.94 0.13 6.73 NW 5.65 2.69 2.02 1.88 0.67 12.92 NNW 3.23 1.88 1.48 0.94 0.67 8.21 Sub-Total 36.34 16.82 20.05 13.59 4.85 91.53 Calms 8.47% Avrg. wind speed 2.15m/s Total 100.00
Figure 3.2 Windrose for March 2012

Draft EIA Report for Proposed IMSWMF, Kinduwal (V), Baddi (T), Solan (D), Himachal Pradesh
M/s. Baddi Barotiwala Nalagarh Development Authority EPIP Phase I, Jharmajri, Baddi, Solan (D),
Himachal Pradesh
Ramky Enviro Engineers Ltd, Hyderabad
Chapter 3.7
Table 3.3 Wind Pattern during April in m/s
Wind Dir 0.3 - 1.4 1.4 - 2.7 2.7 - 4.1 4.1 - 5.4 >= 5.4 Total N 0.70 0.42 0.83 0.56 0.14 2.64 NNE 1.81 0.97 1.53 0.70 0.14 5.15 NE 0.97 0.42 0.28 0.42 0.28 2.36 ENE 0.28 0.42 0.70 0.14 0.14 1.67 E 0.14 0.28 0.42 0.14 0.00 0.97 ESE 0.42 0.14 0.42 0.14 0.28 1.39 SE 0.83 0.56 1.11 1.39 0.42 4.31 SSE 0.28 0.42 0.70 0.42 0.28 2.09 S 2.23 0.70 1.25 0.83 0.97 5.98 SSW 1.11 0.70 0.28 0.28 0.00 2.36 SW 3.76 0.83 2.23 1.25 0.28 8.34 WSW 2.09 1.81 1.39 2.09 0.14 7.51 W 5.84 2.50 2.64 2.64 1.11 14.74 WNW 3.20 1.11 0.70 1.53 0.28 6.82 NW 9.60 3.76 4.17 3.48 0.42 21.42 NNW 0.97 0.83 1.11 0.42 0.14 3.48 Sub-Total: 34.21 15.86 19.75 16.41 5.01 91.11 Calms 8.89% Avrg. wind speed 2.32 m/s Total 100.00
Figure 3.3 Windrose for April 2012

Draft EIA Report for Proposed IMSWMF, Kinduwal (V), Baddi (T), Solan (D), Himachal Pradesh
M/s. Baddi Barotiwala Nalagarh Development Authority EPIP Phase I, Jharmajri, Baddi, Solan (D),
Himachal Pradesh
Ramky Enviro Engineers Ltd, Hyderabad
Chapter 3.8
Table 3.4 Wind Pattern during May in m/s
Wind Dir 0.3 - 1.4 1.4 - 2.7 2.7 - 4.1 4.1 - 5.4 >= 5.4 Total N 0.54 0.27 1.08 0.67 0.13 2.69 NNE 0.67 0.27 0.27 0.40 0.40 2.02 NE 2.56 0.54 1.08 1.48 0.40 6.06 ENE 0.40 0.67 0.67 0.54 0.13 2.42 E 1.62 0.81 1.62 0.40 0.00 4.44 ESE 1.62 1.35 0.40 0.40 0.13 3.90 SE 2.42 0.81 1.21 1.08 0.40 5.92 SSE 1.21 0.81 0.81 0.81 0.13 3.77 S 1.62 0.94 0.81 0.54 0.27 4.17 SSW 0.27 0.13 0.40 0.13 0.00 0.94 SW 3.36 1.08 2.69 1.75 0.94 9.83 WSW 2.42 1.48 1.21 1.21 0.54 6.86 W 4.17 2.02 2.15 2.96 0.94 12.25 WNW 1.08 0.67 1.48 0.27 0.00 3.50 NW 6.19 3.63 4.44 2.96 1.48 18.71 NNW 0.81 0.67 0.54 0.40 0.54 2.96 Sub-Total: 30.96 16.15 20.86 16.02 6.46 90.32 Calms 9.68% Avrg. wind speed 2.46 m/s Total 100.00
Figure 3.4 Windrose for May 2012

Draft EIA Report for Proposed IMSWMF, Kinduwal (V), Baddi (T), Solan (D), Himachal Pradesh
M/s. Baddi Barotiwala Nalagarh Development Authority EPIP Phase I, Jharmajri, Baddi, Solan (D),
Himachal Pradesh
Ramky Enviro Engineers Ltd, Hyderabad
Chapter 3.9
Table 3.5 Wind Pattern duringSummer (March to May) in m/s
Wind Dir 0.3 - 1.4 1.4 - 2.7 2.7 - 4.1 4.1 - 5.4 >= 5.4 Total N 0.91 0.54 1.00 0.50 0.18 3.13 NNE 0.95 0.50 0.73 0.36 0.23 2.76 NE 1.77 0.50 0.82 0.91 0.27 4.26 ENE 0.54 0.54 0.54 0.32 0.09 2.04 E 1.63 0.82 0.91 0.63 0.09 4.08 ESE 1.00 0.63 0.50 0.36 0.18 2.67 SE 1.86 0.95 1.54 1.18 0.45 5.98 SSE 1.18 0.59 0.82 0.68 0.18 3.44 S 1.50 0.73 0.86 0.63 0.41 4.12 SSW 1.13 0.73 0.86 0.32 0.05 3.08 SW 3.85 1.13 2.40 1.40 0.73 9.52 WSW 1.77 1.13 1.09 1.45 0.32 5.75 W 4.53 2.04 2.31 2.31 0.82 12.01 WNW 2.40 0.95 1.27 0.95 0.14 5.71 NW 7.16 3.35 3.53 2.76 0.86 17.67 NNW 1.68 1.13 1.04 0.59 0.45 4.89 Sub-Total 33.85 16.27 20.21 15.36 5.44 91.08 Calms 8.92% Avrg. wind speed 2.31 m/s Total 100.00
Figure 3.5 Windrose for Summer (March – May) 2012

Draft EIA Report for Proposed IMSWMF, Kinduwal (V), Baddi (T), Solan (D), Himachal Pradesh
M/s. Baddi Barotiwala Nalagarh Development Authority EPIP Phase I, Jharmajri, Baddi, Solan (D),
Himachal Pradesh
Ramky Enviro Engineers Ltd, Hyderabad
Chapter 3.10
3.4 Ambient Air Quality The ambient air quality was monitored in the impact area as per MoEF guidelines. The study area represents mostly rural and semi-urban environment. The baseline status of the ambient air quality has been assessed through a scientifically designed ambient air quality network. The design of monitoring network in the air quality surveillance programme has been based on the following considerations:
• Meteorological conditions on a synoptic scale • Topography of the study area • Representation of the regional background levels • Representation of the plant site • Influence of the existing sources • Major human settlements in the study area
Ambient Air Quality Monitoring (AAQM) stations were set up at 10 locations with due consideration to the above mentioned points. AAQ locations were selected in downwind, cross wind and upwind direction of the proposed project location. Ambient Air Quality Monitoring Location map is shown in Figure 3.5. The details of the monitoring stations are given in Table 3.5 to 3.8. At each sampling station monitoring was carried for a frequency of 2 days per week for 4 weeks in a month during study period. The Common air pollutants namely Particualte matter (PM10 & PM2.5), sulphur dioxide (SO2) and the oxides of nitrogen (NOx), were sampled on 8/24 hourly and results were averaged to 24 hours to meet the requirements of the MoEF and compared with the standards stipulated by CPCB. In addition to above parameters CH4
S. No
and CO are also monitored.
Table 3.5 Ambient Air Quality Locations
Name of the location Direction w.r.t site Distance w.r.t site in km
A1 Project Site Core zone 0.0 A2 Thana NE 4.5 A3 Mizapur SW 3.0 A4 Baddi SE 2.5 A5 Kunjahal ESE 6.0 A6 Rautanwala N 7.0 A7 Kishnapura NW 4.0 A8 Betawali W 6.5

Draft EIA Report for Proposed IMSWMF, Kinduwal (V), Baddi (T), Solan (D), Himachal Pradesh
M/s. Baddi Barotiwala Nalagarh Development Authority EPIP Phase I, Jharmajri, Baddi, Solan (D),
Himachal Pradesh
Ramky Enviro Engineers Ltd, Hyderabad
Chapter 3.11
S. No Name of the location Direction w.r.t site Distance w.r.t site in km
A9 Nawanagar SE 4.5 A10 Kona SE 7.5
Note: Monitoring is carried out in Summer season 2012. The existing values of air pollutants of concern as mentioned above are presented in Table 3.7 to 3.10. Statistical parameters like minimum, maximum and 98th percentiles have been computed from the observed raw data for all sampling stations. These are compared with the standards prescribed by Central Pollution Control Board (CPCB) for Industrial, residential and rural zone.

Draft EIA Report for Proposed IMSWMF, Kinduwal (V), Baddi (T), Solan (D), Himachal Pradesh
M/s. Baddi Barotiwala Nalagarh Development Authority EPIP Phase I, Jharmajri, Baddi, Solan (D),
Himachal Pradesh
Ramky Enviro Engineers Ltd, Hyderabad
Chapter 3.12
Figure 3.5 Ambient Air Quality Monitoring Stations in the study area (10km)

Draft EIA Report for Proposed IMSWMF, Kinduwal (V), Baddi (T), Solan (D), Himachal Pradesh
M/s. Baddi Barotiwala Nalagarh Development Authority EPIP Phase I, Jharmajri, Baddi, Solan (D),
Himachal Pradesh
Ramky Enviro Engineers Ltd, Hyderabad
Chapter 3.13
Table 3.6 Ambient Air Quality Levels in the Study Area (µg/m3
)
Particulate Matter <2.5µ Particulate Matter <10µ Location Min Max 98th Min Per Max 98th Per
Project Site 39.1 44.8 43.8 60.4 75.9 72.0 Thana 37.2 46.5 45.9 63.6 70.4 69.7 Karvana 38.7 48.3 47.8 64.1 74.3 72.8 Baddi 40.4 48.0 47.6 62.3 76.5 74.5 Kunjahal 35.6 46.1 45.5 50.8 68.3 64.1 Rautanwala 39.6 47.2 46.7 52.6 65.4 64.2 Kishnapura 35.7 44.8 44.0 45.5 58.7 57.2 Betawali 40.5 49.2 48.4 55.3 67.5 65.6 Nawanagar 40.0 49.7 49.0 43.2 56.4 55.3 Kona 38.3 47.3 46.8 54.5 68.4 65.4 AAQ Std – Indus, Resd, Rural 60 100
Table 3.7 Ambient Air Quality Levels in the Study Area-(µg/m3
Location
) SO NO2 X
Min Max 98th Min per Max 98th per Project Site 6.2 10.7 10.2 15.8 21.5 20.8 Thana 8.0 12.5 12.1 15.1 22.3 21.7 Karvana 7.3 11.3 11.0 14.2 19.7 18.9 Baddi 8.3 12.8 12.3 15.7 20.6 19.7 Kunjahal 7.6 12.0 11.8 13.9 20.1 19.4 Rautanwala 6.7 11.2 10.4 14.7 21.3 20.8 Kishnapura 5.6 7.9 7.7 13.5 20.6 18.9 Betawali 8.5 13.1 12.6 16.5 25.9 25.0 Nawanagar 7.4 11.9 11.2 13.8 21.7 21.1 Kona 7.3 11.5 11.1 15.2 24.7 23.4 AAQ Std – Indus, Resd, Rural 80 80

Draft EIA Report for Proposed IMSWMF, Kinduwal (V), Baddi (T), Solan (D), Himachal Pradesh
M/s. Baddi Barotiwala Nalagarh Development Authority EPIP Phase I, Jharmajri, Baddi, Solan (D),
Himachal Pradesh
Ramky Enviro Engineers Ltd, Hyderabad
Chapter 3.14
Table 3.8 Ambient Air Quality Levels in the Study Area
Location CO (mg/m3 CH) 4 (ppm) Min Max 98th Min per Max 98thper
Project Site 0.027 0.052 0.050 0.2 0.5 0.4 Thana 0.052 0.072 0.069 0.4 0.8 0.7 Karvana 0.043 0.064 0.059 0.2 0.6 0.5 Baddi 0.092 0.124 0.120 0.5 0.9 0.8 Kunjahal 0.089 0.098 0.095 0.3 0.7 0.6 Rautanwala 0.075 0.096 0.092 0.2 0.6 0.5 Kishnapura 0.066 0.089 0.087 0.3 0.7 0.6 Betawali 0.058 0.074 0.070 0.4 0.8 0.7 Nawanagar 0.047 0.067 0.620 0.2 0.6 0.5 Kona 0.056 0.072 0.690 0.1 0.4 0.3 AAQ Std – Indus, Resd, Rural 2.0 -
Note: H2S were below detectable limits(Where BDL is 1.1 µg/m3)
3.4.1Regional Scenario a) Particulate Matter <2.5µ & <10µ Particulate Matter (PM) is the term used for a mixture of solid particles and liquid droplets suspended in the air. These particles originate from a variety of sources, such as power plants, industrial processes, and diesel trucks. They are formed in the atmosphere by transformation of gaseous emissions. Their chemical and physical compositions depend on location, time of year and weather. Particulate matter is composed of both coarse and fine particles. Coarse particles (PM10) have an aerodynamic diameter between 2.5µ and 10µ. They are formed by mechanical disruption (e.g. crushing, grinding, and abrasion of surfaces) evaporation of sprays and suspension of dust. PM10 is composed of alumiosilicate and other oxides of crustal elements. Major sources including fugitive dust from roads, industry, agriculture, construction and demolition, and fly ash from fossil fuel combustion. The lifetime of PM10
Fine particles have an aerodynamic diameter less than 2.5µ (PM
is from minutes to hours and the travel distance varies from <1Km to 10Km.
2.5). They differ from PM10 in origin and chemistry. These particles are formed from gas and condensation of high temperature vapors during combustion, they are composed of various combinations of sulfate compounds, nitrate compounds, carbon compounds, ammonium, hydrogen ion, organic compounds, metals (Pb, Cd, V, Ni, Cu, Zn, Mn and Fe) and Particle bound

Draft EIA Report for Proposed IMSWMF, Kinduwal (V), Baddi (T), Solan (D), Himachal Pradesh
M/s. Baddi Barotiwala Nalagarh Development Authority EPIP Phase I, Jharmajri, Baddi, Solan (D),
Himachal Pradesh
Ramky Enviro Engineers Ltd, Hyderabad
Chapter 3.15
water. The major sources of PM2.5 are fossil fuel combustion, vegetation burning, smelting and processing of metals. Their lifetime is from days to weeks and travel distance ranges from 100s to >1000s Km. The minimum and maximum level of Particulate Matter <2.5µ recorded within the study area were in the range of 35.6 to 49.7 µg/m3. The minimum and maximum level of Particulate Matter <10µ recorded within the study area were in the range of 43.2 to 76.5 µg/m3. The 24 hourly average values of Particulate Matter <2.5µ & Particulate Matter <10µ were compared with the national ambient air quality standards and found that all sampling stations recorded values within the applicable limits of residential and rural area limits for all locations in study area. b) Sulfur Dioxide Sulfur dioxide gas is an inorganic gaseous pollutant. Sulfur dioxide emissions are expected to be emitted wherever combustion of any fuel containing sulfur takes place. The sulfur in the fuel will combine with oxygen to form sulfur dioxide. Sulfur trioxide and sulfuric acid mist are the other important pollutants in the sulfur group. In general some of the important sources of sulfur dioxide are power stations, sulfuric acid plants, oil refining, boilers in utilities in any industry and domestic use of coal. The following sources of Sulfur dioxide in the study area are identified: Emissions from domestic fuel (coal, diesel, etc.) Emissions from DG sets used by industries and local residents Information in the literature has indicated that the presence of sulfur dioxide in the photochemical smog reaction enhances the formation of visibility enhancing aerosols. Sulfur dioxide in atmosphere is significant because of its toxicity. Sulfur dioxide is capable of producing illness and lung injury. Further it can combine with water in the air to form toxic acid aerosols that can corrode metal surfaces, fabrics and the leaves of plants. Sulfur dioxide is irritating to the eyes and respiratory system. Excessive exposure to sulfur dioxide causes bronchial asthma and other breathing related diseases as it affects the lungs. The minimum and maximum level of SO2 recorded within the study area was in the range of 5.6µg/m3 to 13.1µg/m3. The 24 hourly average values of SO2 were compared with the national ambient air quality standards and it was found that all sampling stations recorded values much lower than the applicable limit of 80µg/m3 for industrial, residential and rural areas.

Draft EIA Report for Proposed IMSWMF, Kinduwal (V), Baddi (T), Solan (D), Himachal Pradesh
M/s. Baddi Barotiwala Nalagarh Development Authority EPIP Phase I, Jharmajri, Baddi, Solan (D),
Himachal Pradesh
Ramky Enviro Engineers Ltd, Hyderabad
Chapter 3.16
c) Oxides of Nitrogen Oxides of Nitrogen are also an inorganic gaseous pollutant like Sulfur dioxide. Oxides of Nitrogen emissions are expected to be emitted wherever combustion at high temperatures takes place. Nitrous oxide and nitric acid mist are the other important pollutants in the inorganic nitrogen group. In general some of the important sources of oxides of nitrogen are boilers (Utilities) in any industry and Auto exhaust. In a metropolitan town NOx
• Emissions from industrial and domestic burning of coal
levels are predominantly due to automobile emissions. The following sources of oxides of nitrogen in the study area are identified:
• Emissions from automobiles Oxides of Nitrogen have far greater significance in photochemical smog reaction than any of the other inorganic gaseous contaminants. NOx in the presence of sunlight will undergo reactions with a number of organic compounds to produce all the effects associated with photochemical smog. NOx has inherent ability to produce deleterious effects by themselves like toxicity. It acts as an asphyxiate when in concentrations great enough to reduce the normal oxygen supply from the air. The minimum and maximum level of NOx recorded within the study area was in the range of 13.5µg/m3 to 25.9µg/m3. The 24 hourly average values of NOx were compared with the national ambient air quality standards and it was found that all the sampling stations recorded values much lower than the applicable limit of 80µg/m3
Carbon monoxide is a colorless, odorless, and tasteless gas that is slightly lighter than air. It can be toxic to humans and animals when encountered in higher concentrations, although it is also produced in normal animal metabolism in low quantities, and is thought to have some normal biological functions. In the atmosphere however, it is short lived and spatially variable, since it combines with oxygen to form carbon dioxide and
for industrial, residential and rural areas. d) Carbon Monoxide
ozone. Carbon monoxide is formed due to partial oxidation of carbon-containing compounds; it forms when there is not enough oxygen to produce carbon dioxide (CO2), such as when operating a stove or an internal combustion engine in an enclosed space. In the presence of oxygen, carbon monoxide burns with a blue flame. Worldwide, the largest

Draft EIA Report for Proposed IMSWMF, Kinduwal (V), Baddi (T), Solan (D), Himachal Pradesh
M/s. Baddi Barotiwala Nalagarh Development Authority EPIP Phase I, Jharmajri, Baddi, Solan (D),
Himachal Pradesh
Ramky Enviro Engineers Ltd, Hyderabad
Chapter 3.17
source of carbon monoxide is natural in origin is due to photochemical reactions in the troposphere. Other natural sources of CO include volcanoes, forest fires, and other forms of combustion. The major man made source is mobile sources (Vehicles on road) and non-road sources are gasoline and diesel powered vehicles, engines, and equipment used for construction, agriculture, recreation, and many other purposes. In the study area CO found in the range of 0.027 to 0.124 µg/m3
Hydrogen sulfide is a colorless, very poisonous, flammable
. e) Methane Hydrocarbons are organic compounds consisting of hydrogen and carbon. Hydrocarbons in ambient air are sub divided into methane and non methane hydrocarbons. Hydrocarbons are primary energy source for current civilizations. The predominant use of hydrocarbons is as a combustible fuel source. Hydrocarbons are often volatile but not necessarily so. Wax is hydrocarbon which is not volatile. The ones tested for in car exhausts are the unburnt gases which tell that the engine is not burning the fuel efficiently and pollutes the environment. Methane is greenhouse gas with a global warming potential of 25, methane traps 25 times more heat per mass unit than Carbon dioxide. The methane is formed due to natural emissions (Wetlands, Termites, Oceans, etc) and due to anthropogenic emissions (Energy, Landfills, Livestock, Waste treatment, Biomass burning, etc). in the study area. In the study area CO found in the range of 0.2 to 0.9 ppm. f) Hydrogen Sulfide
gas with the characteristic foul odor of rotten eggs. It often results from the bacterial breakdown of organic matter in the absence of oxygen, such as in swamps and sewers; this process is commonly known as anaerobic digestion. It also occurs in volcanic gases, natural gas, and some well waters. The human body produces small amounts of H2 signaling molecule
S and uses it as a .
About 10% of total global emissions of H2S is due to human activity. By far the largest industrial route to H2 petroleum refineriesS occurs in : Other anthropogenic sources of hydrogen sulfide include coke ovens, paper mills (using the sulfate method), and tanneries. H2S arises from virtually anywhere where elemental sulfur comes in contact with organic material, especially at high temperatures. In the study area H2S found BDL.

Draft EIA Report for Proposed IMSWMF, Kinduwal (V), Baddi (T), Solan (D), Himachal Pradesh
M/s. Baddi Barotiwala Nalagarh Development Authority EPIP Phase I, Jharmajri, Baddi, Solan (D),
Himachal Pradesh
Ramky Enviro Engineers Ltd, Hyderabad
Chapter 3.18
3.5 Water Environment Selected water quality parameters for water resources within 10 km of the study area have been used for describing the water environment and assessing the impacts on it. Studies on water environment aspects of ecosystem play an important role in preparation of environmental impact assessment report and to identify sensitive issues and take appropriate action by maintaining ecological homeostasis. To assess the water quality impacts, water resources in the impact area have been grouped into two classes.
• Surface water resources including streams, tanks, rivers etc. • Ground water resources in the deeper strata of the ground
Ground water from dug wells, tube wells and hand pumps cater to the drinking water needs of the villages in the region. The quality of ground water was assessed by taking samples and analyzed as per CPCB norms. Reconnaissance survey was undertaken and monitoring locations were selected based on the following consideration.
• Location of the aquifer • Usage and source
Water samples in the study area were collected from ground water sources and analyzed for physical and chemical characteristics as per CPCB guidelines and approved methods. The details of the sampling locations are given in the Table 3.9 and analytical results are given in Table 3.10 & Table 3.11.The water sampling locations are shown in Figure 3.7.
Table 3.9 Water Sampling Locations
S. No Name of the location Direction Distance (km) Remarks
W1 Plant Site - Kundiwala Core zone 0.0 Ground water W2 Thana NE 4.5 Ground water W3 Mirzapur SW 3.0 Ground water W4 Baddi SE 2.5 Ground water W5 Kunjahal ESE 6.0 Ground water W6 Routanwala N 7.0 Ground water W7 Kishanpura NW 4.0 Ground water W8 Betawali W 6.5 Ground water W9 Nawanagar SE 4.5 Ground water W10 Kona SE 7.5 Ground water W11 Siwan SW 8.0 Surface water W12 Nawanagar River SE 4.0 Surface water

Draft EIA Report for Proposed IMSWMF, Kinduwal (V), Baddi (T), Solan (D), Himachal Pradesh
M/s. Baddi Barotiwala Nalagarh Development Authority EPIP Phase I, Jharmajri, Baddi, Solan (D),
Himachal Pradesh
Ramky Enviro Engineers Ltd, Hyderabad
Chapter 3.19
S. No Name of the location Direction Distance (km) Remarks
W13 Industrial Domestic (Down) N 0.8 Waste Water W14 Industrial Domestic NE 0.5 Waste Water
Note: Samples collected in summer 2012. 3.5.1 Analysis & Observations The analysis results and the subsequent interpretations are given in this section.

Draft EIA Report for Proposed IMSWMF, Kinduwal (V), Baddi (T), Solan (D), Himachal Pradesh
M/s. Baddi Barotiwala Nalagarh Development Authority EPIP Phase I, Jharmajri, Baddi, Solan (D),
Himachal Pradesh
Ramky Enviro Engineers Ltd, Hyderabad
Chapter 3.20
Figure 3.7 Water sampling locations

Draft EIA Report for Proposed IMSWMF, Kinduwal (V), Baddi (T), Solan (D), Himachal Pradesh
M/s. Baddi Barotiwala Nalagarh Development Authority EPIP Phase I, Jharmajri, Baddi, Solan (D),
Himachal Pradesh
Ramky Enviro Engineers Ltd, Hyderabad
Chapter 3.21
Table 3.10 Water Quality characteristics (Ground Water)
S.No Parameter Unit Result Limit as per IS:10500 W1 W2 W3 W4 W5 W6 W7 W8 W9 W10 Desirable
Limit Permissible
Limit 1 Color PtCo 0.40 0.60 0.35 0.60 0.32 0.39 0.43 0.52 0.28 0.67 5.0 25, Max 2 Turbidity NTU 2.90 3.60 4.90 5.50 6.50 12.0 5.90 6.80 12.0 7.80 5.0 10 3 pH --- 7.78 8.03 7.48 7.86 7.63 7.65 7.95 7.60 7.53 7.59 6.5-8.5 - 4 Residural Chlorine as Cl mg/L <0.2 <0.2 <0.2 <0.2 <0.2 <0.2 <0.2 <0.2 <0.2 <0.2 - - 5 TDS mg/L 283 352 357 868 412 390 304 876 504 351 2000 - 6 Chloride as Cl mg/L - 14.78 44.3 147.8 54.2 162 49.28 14.7 374.5 88.7 24.6 250 1000 7 Sulpates as SO4 mg/L -2 11.91 23.97 38.12 23.29 25.08 29.02 7.95 40.49 37.5 17.18 200 400 8 Nitrate as NO mg/L 3 8.89 17.37 27.33 13.25 18.08 23.82 7.12 27.60 27.97 23.35 45.0 - 9 Phosphates mg/l 0.2 0.25 0.38 0.21 0.31 0.36 0.1 0.41 0.43 0.37 - -
10 Alkalinity as CaCO mg/L 3 23 23 34.5 23 11.5 11.5 23 23 23 11.5 200 600 11 Hexavalent Chromium mg/L <0.2 <0.2 <0.2 <0.2 <0.2 <0.2 <0.2 <0.2 <0.2 <0.2 0.05 - 12 Total Hardness CaCO3 mg/L 150 230 550 260 350 250 180 630 250 190 300 600 13 Calcium as Ca mg/L 80 130 280 140 190 130 90 320 120 100 75.0 200 14 Iron as Fe mg/L 0.23 0.18 0.34 0.42 0.51 0.41 0.38 0.27 0.55 0.74 0.30 1.0 15 Fluorides as F mg/L - 0.17 0.20 0.32 0.29 0.10 0.16 0.12 0.38 0.16 0.21 1.00 1.5 16 Phenolic Compounds Mg/L <0.2 <0.2 <0.2 <0.2 <0.2 <0.2 <0.2 <0.2 <0.2 <0.2 0.001 0.002 17 Mercury asHg mg/L <0.1 <0.1 <0.1 <0.1 <0.1 <0.1 <0.1 <0.1 <0.1 <0.1 0.001 - 18 Cadmium asCd mg/L <0.1 <0.1 <0.1 <0.1 <0.1 <0.1 <0.1 <0.1 <0.1 <0.1 0.01 - 19 Arsenic as As mg/L <0.05 <0.05 <0.05 <0.05 <0.05 <0.05 <0.05 <0.05 <0.05 <0.05 0.01 - 20 Lead as Pb mg/L <0.1 <0.1 <0.1 <0.1 <0.1 <0.1 <0.1 <0.1 <0.1 <0.1 0.05 - 21 Zinc as Zn mg/L <1.0 <1.0 <1.0 <1.0 <1.0 <1.0 <1.0 <1.0 <1.0 <1.0 5.0 15.0 22 Alluminium as Al mg/L <0.1 <0.1 <0.1 <0.1 <0.1 <0.1 <0.1 <0.1 <0.1 <0.1 0.03 0.2 23 Boron asB mg/L <1.0 <1.0 <1.0 <1.0 <1.0 <1.0 <1.0 <1.0 <1.0 <1 1.0 5.0 24 Manganese as Mn mg/L <0.5 <0.5 <0.5 <0.5 <0.5 <0.5 <0.5 <0.5 <0.5 <0.5 0.1 0.3 25 Copper as Cu mg/L <0.5 <0.5 <0.5 <0.5 <0.5 <0.5 <0.5 <0.5 <0.5 <0.5 0.05 1.5

Draft EIA Report for Proposed IMSWMF, Kinduwal (V), Baddi (T), Solan (D), Himachal Pradesh
M/s. Baddi Barotiwala Nalagarh Development Authority EPIP Phase I, Jharmajri, Baddi, Solan (D),
Himachal Pradesh
Ramky Enviro Engineers Ltd, Hyderabad
Chapter 3.22
Table 3.11 Analytical Results of Suface water
S.No Parameter Unit Result 120168/1 120168/2
1 TSS mg/L 10 29 2 pH --- 7.71 7.46 3 Chloride as Cl mg/L - 9.86 78.8 4 COD mg/L 8.0 24 5 BOD mg/L <4 <4 6 DO mg/L 4.90 3.90 7 Arsenic as As mg/L <0.05 <0.05 8 Calcium as Ca mg/L 50 80 9 Sulphate as SO4 mg/L -2 10.77 36.04 10 Alkalinity as CaCO mg/L 3 11.5 23.0 11 Turbidity NTU 7.20 17.0 12 Nitrate as NO mg/L 3 1.88 2.59 13 Toatal Hardness mg/L 70 110
3.5.2 Discussions
• The pH limit fixed for drinking water samples as per IS 10500 is 6.5 to 8.5 beyond this range the water will affect the mucus membrane and or water supply system. During study period the pH in the samples was varying from 7.48 to 8.03 in 10km radius.
• The desirable limit for total dissolved solids as per IS 10500 is 500 mg/l, where as the permissible limits in absence of alternate source is 2000 mg/l, beyond this palatability decreases and may cause gastro intestinal irritation. In water samples collected from the study area, the total dissolved solids are varying from 283 mg/l to 876mg/l in 10km radius. The TDS of two samples were within desirable limits, all the samples collected in the study area were within the permissible limit of 2000 mg/l.
• The desirable limit for chloride is 250mg/l as per IS10500 where as the permissible limit of the same is 1000 mg/l beyond this limit taste, corrosion and palatability are affected. The Chloride levels in the water samples collected in the study area were ranging from 14.78mg/l to a maximum of 374.5mg/l in 10km radius.

Draft EIA Report for Proposed IMSWMF, Kinduwal (V), Baddi (T), Solan (D), Himachal Pradesh
M/s. Baddi Barotiwala Nalagarh Development Authority EPIP Phase I, Jharmajri, Baddi, Solan (D),
Himachal Pradesh
Ramky Enviro Engineers Ltd, Hyderabad
Chapter 3.23
• The desirable limit as per IS10500 for hardness is 300mg/l where as the permissible limit for the same is 600mg/l beyond this limit encrustation in water supply structure and adverse effects on domestic use will be observed. In the water samples collected from the study area, the hardness is varying from 150 mg/l to 550 mg/l in 10km radius.
• Fluoride is the other important parameter, which has the desirable limit of 1 mg/l and permissible limit of 1.5mg/l. However the optimum content of fluoride in the drinking water is 0.6 to 1.5mg/l. If the fluoride content is less than 0.6 mg/l it causes dental carries, above 1.5mg/l it causes staining of tooth enamel, higher concentration in range of 3 - 10mg/l causes fluorosis. In the water samples of study area the fluoride value were in the range of 0.17mg/l to 0.38mg/l in 10 km radius.
• Overall all the samples collected from the study area were found to be fit for human consumption, however the hardness, chlorides, dissolved solids in most of water samples seem to be above desirable limit but well within the permissible limits, except in one sample. Most of the heavy metals in all samples are below detectable limits.
3.6 Noise Environment Noise can be defined as unwanted sound or sound in the wrong place at the wrong time. It can also be defined as any sound that is undesirable because it interferes with speech and hearing, is intense enough to damage hearing or is otherwise annoying. The definition noise as unwanted sound implies that it has an adverse effect on human beings and their environment including land, structures, and domestic animals. Noise can also disturb natural wildlife and ecological systems. Sound can be transmitted through gases, liquids, and solids. Noise impacts can be of concern during the construction and the operational phases of projects. Noise should also be considered in relation to present and future land use zoning and policies. Construction noise can be a significant source of community noise. Of concern are impacts on people near the construction site, who are totally unrelated to construction activities (e.g. area residents, office workers, school children, staff, etc.) Factors which are important in determining noise levels that will potentially impact such populations include distance from the noise source, natural or man-made barriers between the source and the impacted population, weather conditions which could potentially absorb, reflect or focus sound (such as wind speed, direction, temperature inversions), the scale and intensity of the particular construction phase (excavation, erection, or finishing).

Draft EIA Report for Proposed IMSWMF, Kinduwal (V), Baddi (T), Solan (D), Himachal Pradesh
M/s. Baddi Barotiwala Nalagarh Development Authority EPIP Phase I, Jharmajri, Baddi, Solan (D),
Himachal Pradesh
Ramky Enviro Engineers Ltd, Hyderabad
Chapter 3.24
The Environment/health impacts of noise can vary from noise induced hearing loss (NIHL) to annoyance depending on loudness of noise levels and tolerance levels of individual. While measuring the day-night equivalent noise levels (Ldn), it is considered that one event at night is equivalent to ten similar events during the day time. Ldn is similar to 24 hours equivalent sound level (LEq) except that, during the daytime 10 dB (A) weighing is added. The Ldn for a given location in a community may be calculated from the hourly (LEq) equivalent sound levels with a 10 dB (A) correction added to the night time value (Ln
L
).
dn = 10 Log (0.0416 [15 (10Ld/10] + 9 (10Ln+10/10]) + ...... Where Ld is the Equivalent noise levels at day (6.00 A.M to 10.00 P.M) and Ln
S. No
is the Equivalent noise levels at night (10.00 P.M to 6.00 A.M) 3.6.1 Noise Levels in the Study Area Baseline noise levels have been monitored at 10 locations within the study zone, using a spot noise measurement device. At random noise level measurement locations were identified for assessment of existing noise level status, keeping in view the land use pattern, residential areas in villages, schools, bus stands, etc., the day levels of noise have been monitored during 6 AM to 10 PM and the night levels during 10 PM to 6 AM. The noise monitoring stations are shown in Table 3.12 and presented in Figure 3.8. The results are presented in Table 3.13.
Table 3.12 Noise Monitoring Locations
Name of the location Direction w.r.t site Distance w.r.t site in km
N1 Project Site Core zone 0.0 N2 Thana NE 4.5 N3 Mizapur SW 3.0 N4 Baddi SE 2.5 N5 Kunjahal ESE 6.0 N6 Rautanwala N 7.0 N7 Kishnapura NW 4.0 N8 Betawali W 6.5 N9 Nawanagar SE 4.5 N10 Kona SE 7.5
Note: Monitoring is carried in Summer, 2012

Draft EIA Report for Proposed IMSWMF, Kinduwal (V), Baddi (T), Solan (D), Himachal Pradesh
M/s. Baddi Barotiwala Nalagarh Development Authority EPIP Phase I, Jharmajri, Baddi, Solan (D),
Himachal Pradesh
Ramky Enviro Engineers Ltd, Hyderabad
Chapter 3.25
Figure 3.8 Noise Monitoring Stations in the study area

Draft EIA Report for Proposed IMSWMF, Kinduwal (V), Baddi (T), Solan (D), Himachal Pradesh
M/s. Baddi Barotiwala Nalagarh Development Authority EPIP Phase I, Jharmajri, Baddi, Solan (D),
Himachal Pradesh
Ramky Enviro Engineers Ltd, Hyderabad
Chapter 3.26
Table 3.13 Noise Levels in the Study Area
Hours Location N1 N2 N3 N4 N5 N6 N7 N8 N9 N10 1 42.1 40.1 41.2 41.2 40.3 41.2 40.0 41.9 40.1 40.2 2 41.9 41.2 41.6 41.0 41.2 42.1 40.3 42.1 40.8 40.8 3 42.3 42.2 42.5 40.0 41.8 43.5 40.1 41.7 40.2 41.1 4 43.2 43.5 43.6 40.1 42.3 43.6 40.0 43.5 41.5 41.6 5 42.3 46.3 44.5 42.1 43.8 43.1 41.2 42.1 41.8 42.1 6 42.8 47.2 45.6 42.6 46.5 44.5 42.3 45.8 42.5 44.5 7 48.2 48.6 52.3 45.3 50.6 49.5 46.5 49.3 49.9 46.5 8 50.2 50.2 54.6 50.1 51.2 51.6 49.5 52.9 50.6 49.5 9 52.8 51.4 55.4 51.2 53.2 52.3 51.6 54.1 51.8 50.3 10 54.7 51.8 57.8 51.8 55.8 54.1 52.1 56.1 55.6 51.2 11 55.4 52.2 58.2 53.2 54.1 55.6 53.6 55.6 56.8 52.1 12 55.8 52.9 50.1 54.1 54.5 56.7 54.1 54.3 55.6 53.6 13 54.9 53.1 51.6 54.7 53.4 55.9 53.9 54.5 55.2 54.3 14 53.7 53.6 52.2 50.3 55.3 56.2 52.8 53.1 54.1 55.8 15 52.6 54.1 52.8 51.3 54.2 57.1 48.1 51.6 54.5 52.1 16 54.8 55.6 53.6 52.1 55.8 56.4 49.5 53.2 53.1 50.2 17 53.7 55.3 54.1 52.3 50.3 55.8 46.5 52.3 53.2 50.1 18 52.3 52.6 53.2 51.8 50.6 54.6 46.5 50.4 51.2 49.5 19 48.5 51.6 51.4 47.4 49.6 53.9 44.1 51.2 48.9 48.7 20 43.6 48.2 50.1 46.3 48.5 53.1 43.1 50.3 46.9 47.6 21 42.4 44.5 47.4 42.1 47.9 52.8 42.2 48.2 46.1 46.2 22 41.7 40.6 45.1 42.6 45.2 45.6 41.5 43.2 41.2 42.2 23 40.6 40.3 42.3 42.2 44.1 43.5 41.2 40.8 40.8 41.6 24 40.6 40.2 41.6 41.0 42.3 42.1 41.0 40.8 40.2 40.3
Minimum 40.6 40.1 41.2 40.0 40.3 41.2 40.0 40.8 40.1 40.2 Maximum 55.8 55.6 58.2 54.7 55.8 57.1 54.1 56.1 56.8 55.8 Day Equivalent 52.6 52.3 53.6 51.1 52.8 54.6 50.2 52.8 53.0 51.1 Night Equivalent 41.3 40.7 42.2 40.7 42.2 42.7 40.0 41.5 40.1 40.6 Standard Day Equivalent Night Equivalent Industrial 75 70 Commercial 65 55 Residentail 55 45

Draft EIA Report for Proposed IMSWMF, Kinduwal (V), Baddi (T), Solan (D), Himachal Pradesh
M/s. Baddi Barotiwala Nalagarh Development Authority EPIP Phase I, Jharmajri, Baddi, Solan (D),
Himachal Pradesh
Ramky Enviro Engineers Ltd, Hyderabad
Chapter 3.27
3.6.2 Observations The values of noise observed in some of the rural areas are primarily owing to vehicular traffic and other anthropogenic activities. In rural areas wind blowing and movements of birds would contribute to noise levels especially during the nights. Assessment of day and night noise levels around the study area are ranging between 40.0 to 58.2 dB (A). The day equivalents during the study period are ranging between 50.2 to 54.6 dB (A), where as the night equivalents were in the range of 40.0 to 42.7 dB (A). From the results it can be seen that the day equivalents and the Night equivalents were within the Ambient Noise standards of residential areas standards. 3.7 Traffic Study The automobile source is currently the major source of air pollutant emission in many air quality impact analyses. A traffic study is required for the no-build alternative as well as the build-out alternative. This information is required to assess the Traffic density pattern of the region and to assist the proponent in planning vehicular movement during the project and the air quality due to vehicular emissions for the study period, should the project not be implemented whereas the latter information is required to assess the air quality for the study period should the project be implemented. The methodology adopted for carrying out the traffic study was to select the major roads around the project site and count the various categories of vehicles moving on these roads. The traffic study details area given in Table 3.14.
Table 3.14
Location Name: NH 21A – Nalagarh to Pinjore – East 0.75km Hours 2- Wheelers 3 & 4
Wheelers Medium Vehicles
Heavy Vehicles
Total
No.s @0.75 PCU
No.s @1.0 PCU
No.s @2.0 PCU
No.s @3.7 PCU
No.s PCU’s / Hr
07.00-08.00 42 32 20 20 95 190 10 37 167 279 08.00-09.00 52 39 15 15 109 218 15 56 191 328 09.00-10.00 82 62 20 20 120 240 20 74 242 396 10:00-11:00 115 86 25 25 125 250 21 78 286 439 11:00-12:00 125 94 30 766 130 260 15 56 300 1175 12:00-13:00 132 99 28 28 136 272 24 89 320 488 13:00-14:00 135 101 30 600 145 290 26 96 336 1087 14:00-15:00 140 105 28 28 94 188 25 93 287 414 15:00-16:00 132 99 43 43 121 242 26 96 322 480 16:00-17:00 105 79 35 35 105 210 30 111 275 435
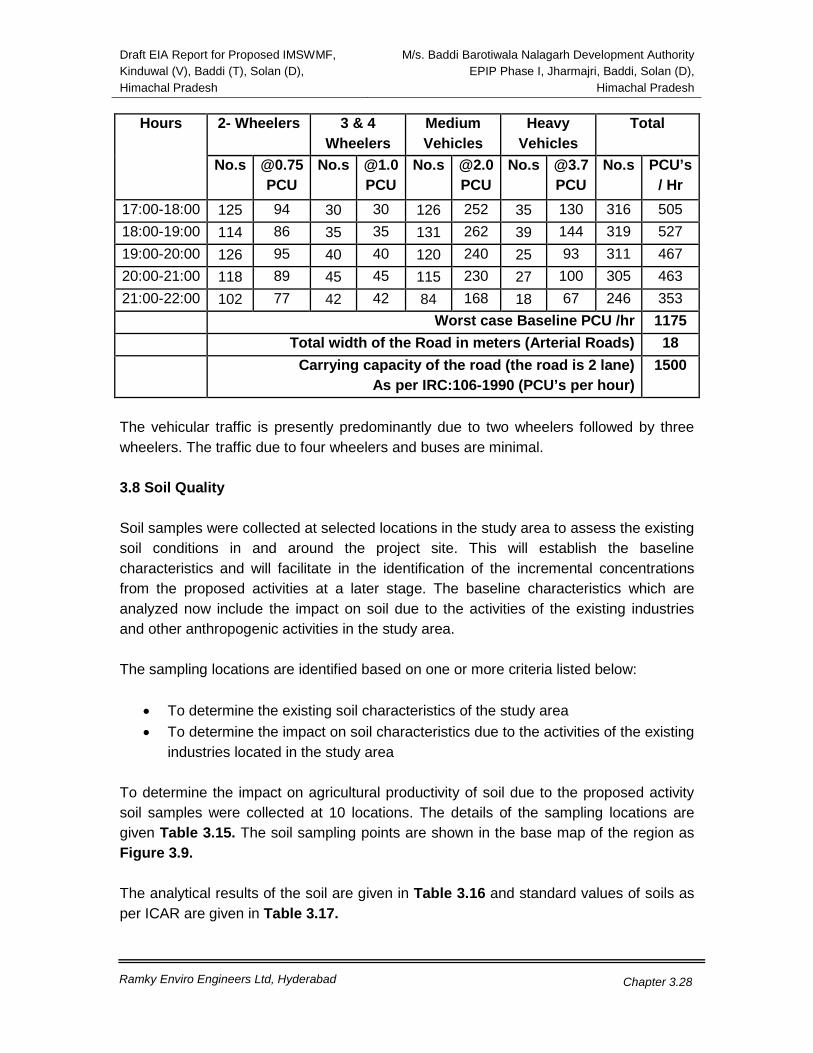
Draft EIA Report for Proposed IMSWMF, Kinduwal (V), Baddi (T), Solan (D), Himachal Pradesh
M/s. Baddi Barotiwala Nalagarh Development Authority EPIP Phase I, Jharmajri, Baddi, Solan (D),
Himachal Pradesh
Ramky Enviro Engineers Ltd, Hyderabad
Chapter 3.28
Hours 2- Wheelers 3 & 4 Wheelers
Medium Vehicles
Heavy Vehicles
Total
No.s @0.75 PCU
No.s @1.0 PCU
No.s @2.0 PCU
No.s @3.7 PCU
No.s PCU’s / Hr
17:00-18:00 125 94 30 30 126 252 35 130 316 505 18:00-19:00 114 86 35 35 131 262 39 144 319 527 19:00-20:00 126 95 40 40 120 240 25 93 311 467 20:00-21:00 118 89 45 45 115 230 27 100 305 463 21:00-22:00 102 77 42 42 84 168 18 67 246 353 Worst case Baseline PCU /hr 1175 Total width of the Road in meters (Arterial Roads) 18 Carrying capacity of the road (the road is 2 lane)
As per IRC:106-1990 (PCU’s per hour) 1500
The vehicular traffic is presently predominantly due to two wheelers followed by three wheelers. The traffic due to four wheelers and buses are minimal. 3.8 Soil Quality Soil samples were collected at selected locations in the study area to assess the existing soil conditions in and around the project site. This will establish the baseline characteristics and will facilitate in the identification of the incremental concentrations from the proposed activities at a later stage. The baseline characteristics which are analyzed now include the impact on soil due to the activities of the existing industries and other anthropogenic activities in the study area. The sampling locations are identified based on one or more criteria listed below:
• To determine the existing soil characteristics of the study area • To determine the impact on soil characteristics due to the activities of the existing
industries located in the study area
To determine the impact on agricultural productivity of soil due to the proposed activity soil samples were collected at 10 locations. The details of the sampling locations are given Table 3.15. The soil sampling points are shown in the base map of the region as Figure 3.9. The analytical results of the soil are given in Table 3.16 and standard values of soils as per ICAR are given in Table 3.17.

Draft EIA Report for Proposed IMSWMF, Kinduwal (V), Baddi (T), Solan (D), Himachal Pradesh
M/s. Baddi Barotiwala Nalagarh Development Authority EPIP Phase I, Jharmajri, Baddi, Solan (D),
Himachal Pradesh
Ramky Enviro Engineers Ltd, Hyderabad
Chapter 3.29
Table 3.15
Soil Sampling Locations S.No Name of the location Direction Distance (km) S1 Project Site Core zone 0.0
S2 Thana NE 4.5
S3 Mizapur SW 3.0
S4 Baddi SE 2.5
S5 Kunjahal ESE 6.0
S6 Rautanwala N 7.0
S7 Kishnapura NW 4.0
S8 Betawali W 6.5
S9 Nawanagar SE 4.5
S10 Kona SE 7.5
Note: Samples collected in Summer,2012
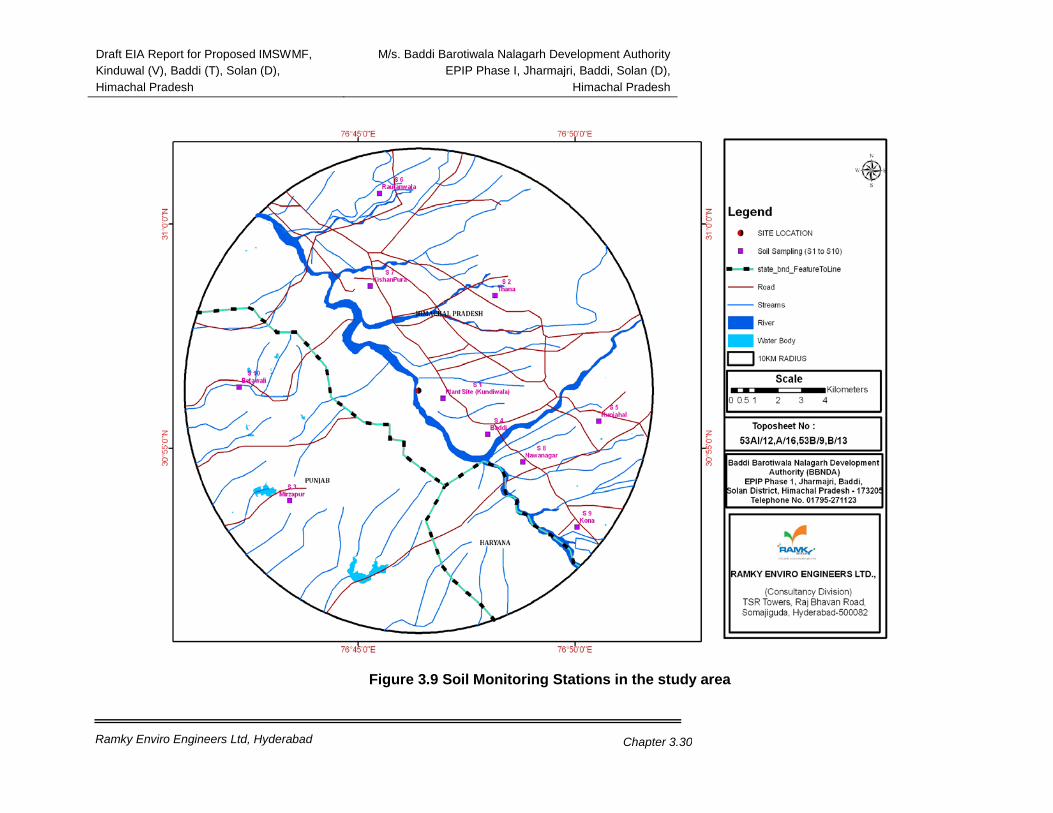
Draft EIA Report for Proposed IMSWMF, Kinduwal (V), Baddi (T), Solan (D), Himachal Pradesh
M/s. Baddi Barotiwala Nalagarh Development Authority EPIP Phase I, Jharmajri, Baddi, Solan (D),
Himachal Pradesh
Ramky Enviro Engineers Ltd, Hyderabad
Chapter 3.30
Figure 3.9 Soil Monitoring Stations in the study area

Draft EIA Report for Proposed IMSWMF, Kinduwal (V), Baddi (T), Solan (D), Himachal Pradesh
M/s. Baddi Barotiwala Nalagarh Development Authority EPIP Phase I, Jharmajri, Baddi, Solan (D),
Himachal Pradesh
Ramky Enviro Engineers Ltd, Hyderabad
Chapter 3.31
Table 3.16 Soil Quality in the Study Area
Parameter Units S1 S2 S3 S4 S5 S6 S7 S8 S9 S10
pH --- 8.23 8.20 7.45 8.01 6.67 8.18 8.02 8.23 8.13 7.01 EC μs 144 88 170 175 69 158 292 116 122 128 Organic Matter % 0.33 0.26 0.97 0.30 0.52 0.68 1.02 0.94 0.48 1.73 CEC meq/100gr 0.54 1.03 1.06 1.43 1.49 1.80 0.85 1.54 1.25 1.54 SAR meq/100gr 0.13 0.33 0.28 0.51 0.81 0.47 0.34 0.38 0.28 0.64 Lead as Pb mg/Kg 10.12 9.84 5.67 12.45 8.56 10.84 7.56 11.20 5.62 4.85 Cadmium as Cd mg/Kg <0.5 <0.5 <0.5 <0.5 <0.5 <0.5 <0.5 <0.5 <0.5 <0.5 Chromium as Cr mg/Kg 4.25 2.13 2.57 3.47 3.12 1.25 2.42 1.54 2.02 1.98 Nickel as Ni mg/Kg 0.12 0.35 0.45 0.24 0.24 0.28 0.31 0.34 0.34 0.26 Zinc as Zn mg/Kg 146 157 125 137 186 159 212 214 174 188 Copper as Cu mg/Kg 14.50 51.20 31.70 22.80 11.40 9.84 7.45 6.58 9.85 7.44 Nitrogen as N Kg/Ha 449 285 467 330 282 385 323 428 257 404 Phosphates as P Kg/Ha 2.1 1.8 4.6 4.5 3.2 4.8 3.6 1.9 2.1 4.8 Potassium as K Kg/Ha 63 104 79 100 73 80 65 65 107 82
Table 3.17
Standard Soil Classification – (Indian Council of Agricultural Research, New Delhi) Soil Tests Classification pH Normal to saline 6.0 to 8.5
Tending to become alkaline 8.5 to 9.0 Alkaline Above 9.0
Electrical Conductivity (mmhos/cm)
Up to 1.00 – Normal 1.01- 2.00- Critical to germination 2.01-4.00- Critical for growth of the sensitive crops Above 4.00 – Injurious to most crops
Organic Carbon Low Below 0.5 % Medium 0.5 to 0.75 % High Above 0.75 %
Nutirents Range Nitrogen (kg/Ha) Phosphorous (kg/Ha)
Potassium (kg/Ha)
Low Below 280 Below 10 Below 110 Medium 280 to 560 10 to 25 110 to 280 High Above 560 Above 25 Above 280
3.8.1 Observations

Draft EIA Report for Proposed IMSWMF, Kinduwal (V), Baddi (T), Solan (D), Himachal Pradesh
M/s. Baddi Barotiwala Nalagarh Development Authority EPIP Phase I, Jharmajri, Baddi, Solan (D),
Himachal Pradesh
Ramky Enviro Engineers Ltd, Hyderabad
Chapter 3.32
The analytical results of the soil samples collected during the study period are summarized below. The pH of the soil is an important property; plants cannot grow in low and high pH value soils. The normal range of the soils in 6.0 to 8.5 is called as normal to saline soils. Most of the essential nutrients like N, P, K, Cl and SO4 are available for plant at the neutral pH except for Fe, Mn and Al which are available at low pH range. The soils having pH below 7 are considered to be acidic from the practical standpoint, which respond to liming may be considered to qualify to be designated as acid soils. On the basis of pH measurements, the degree of soil acidity may be indicated. The pH values in the study area are varying from 6.67 to 8.23 indicating that the soils are falling in normal to saline class. Based on the electrical conductivity the soils are classified into 4 groups (Normal, Critical for germination, Critical for growth of the sensitive crops, Injurious to most crops). The electrical conductivity in the study area is varying from 69 to 292 μs. The organic matter in the study area is varying from 0.26 to 1.73%. The other important parameters for characterization of soil for irrigation are Nitrogen, Phosphorus and Potassium are known as primary nutrients; Calcium, Magnesium and Sulphur as secondary nutrients. The primary and secondary nutrient elements are known as major elements. This classification is based on their relative abundance and not on their relative importance. The Phosphates in the study area is varying from 1.8 to 4.8 Kg/Ha and the Potassium in the study area is varying from 6.3 to 107 Kg/Ha. Nitrogen encourages the vegetative development of plants by imparting a healthy green colour to the leaves. It also controls to some extent, the efficient utilization of phosphorus and potassium. Its deficiency retards growth and root development, turns the foliage yellowish or pale green, hastens maturity, causes the shriveling of grains and lowers crop yield. The older leaves are affected first. An excess of nitrogen produces leathery (and sometimes crinkled), dark green leaves and succulent growth. It also delays the maturation of plants, impairs the quality of crops like barley, potato, tobacco, sugarcane and fruits increases susceptibility to diseases and causes “lodging” of cereal crops by inducing an undue lengthening of the stem internodes. Nitrogen in the study area is varying from 257 to 467 Kg/Ha.

Draft EIA Report for Proposed IMSWMF, Kinduwal (V), Baddi (T), Solan (D), Himachal Pradesh
M/s. Baddi Barotiwala Nalagarh Development Authority EPIP Phase I, Jharmajri, Baddi, Solan (D),
Himachal Pradesh
Ramky Enviro Engineers Ltd, Hyderabad
Chapter 3.33
3.9 Assessment of the biodiversity (Flora & Faunna) Ecosystem is an integrated unit that contains both animals and plants whose survival is dependent on biotic and abiotic structure. Based on the type of distribution of organisms and its physical setting the study area can be classified in to cropland, terrestrial and aquatic ecosystems. In order to understand the factors governing the system both abiotic (physical setting) and biotic factors (flora and fauna) have been described. 3.9.1Ecology of the Study Area The conservation of biodiversity is based on a variety of perspectives like scientific, philosophical, economic, ethical, and aesthetic. Scientists contend that much remains to be learnt about species and ecosystems around the world, and that a loss of this diversity would foreclose that opportunity. Whether a species is economically important or not, every species has its own intrinsic value and hence every attempt should be made to conserve biological diversity and integrity of ecosystems. The major activity of Solan district is agricultural with pockets of industrial clusters in the south and south west. The proposed project site is an open plot near village Kainduwal. The core area consists of mainly grass species. Agriculture land and forest area is seen around the buffer zone. 3.9.2 Methodology Adopted for the Survey A detailed study was done within 10 km radius of the study area. Secondary data was compiled from the Dept. of Forests, Solan district and primary data was generated by observing plants, animals and interactions with local residents for uses of plants and animals. The compilation of primary and secondary data for flora and fauna is appended. 3.9.3 Terrestrial flora of the study Area Sl.No Botanical Name Family Common Name
1 Acacia catechu, Wild Mimoseae Khadiramu 2 Acacia dealbata Mimoseae Silver wattle 3 Acacia leucophloea Wild Mimoseae Tellatumma 4 Acacia nilotica (Linn) Wild Mimoseae Nallatumma 5 Acacia pennata Wild Mimoseae Karusikaya 6 Acacia senegal Wild Mimoseae

Draft EIA Report for Proposed IMSWMF, Kinduwal (V), Baddi (T), Solan (D), Himachal Pradesh
M/s. Baddi Barotiwala Nalagarh Development Authority EPIP Phase I, Jharmajri, Baddi, Solan (D),
Himachal Pradesh
Ramky Enviro Engineers Ltd, Hyderabad
Chapter 3.34
Sl.No Botanical Name Family Common Name 7 Acer campbelli Aceraceae - 8 Acer negundo Aceraceae Ash-leaved maple,
Boxeldes 9 Actinodaphne angustifolia
Nees Lauraceae
10 Aegle marmelos (Linn) Correa
Rutaceae Maaredu
11 Ailanthus excela Roxb Simarubaceae Peddamaanu 12 Alangium chinese (Lour)
Harms Alangiaceae
13 Albizia chinensis (Osbeck) Merrill
Mimoseae
14 Albizia lebbeck Benth Mimoseae Dirisana,Sirisha 15 Albizia moluccana Mig Mimoseae Kaniti 16 Albizia odoratissima Benth Mimoseae Chinduga 17 Albizia procera Benth Mimoseae Tellachinduga 18 Aleurites fordii Euphorbiaceae Tungoil tree 19 Alnus nepalensis Betulaceae - 20 Alnus nitida Betulaceae - 21 Alstona scholaris (Linn.) R.Br. Apocynaceae Marri chettu
22 Anogeissus latifolia Wall Combretaceae Chirumaanu 23 Anthocephalus chinensis
(Lamk.) Rubiaceae Kadambama
24 Aphanamixis polystachya (Wall) Parker.
Meliaceae Chawamanu
25 Balanties roxburghii Planch Balanitaceae Gara 26 Barringtonia acutangula (L)
Gaetn Barringtoniaceae Kanapachettu
27 Bauhinig acuminata Linn Caesalpinaceae Kanchan 28 Bauhinia purpurea Linn Caesalpinaceae Kaanchanamu 29 Bauhinia racemosa Lamk. Caesalpinaceae Ari 30 Bauhinia semla Wanderlin Caesalpinaceae Nirpa 31 Bauhinia varigata Linn Caesalpinaceae Devakanchanamu 32 Bischofia javanica Blume Bischofiaceae Nalupumusti 33 Bougainvillea spectabilis Wild Bischofiaceae Nalupumusti 34 Bridelia squamosa Lamk Euphorbiaceae Bontha-yepi 35 Broussonetia papyrifera Moraceae 36 Buchanania lanzan Spreng Anacarsdiceae Martichettu or Saara 37 Butea monosperma Lamk Fabaceae Mooduga

Draft EIA Report for Proposed IMSWMF, Kinduwal (V), Baddi (T), Solan (D), Himachal Pradesh
M/s. Baddi Barotiwala Nalagarh Development Authority EPIP Phase I, Jharmajri, Baddi, Solan (D),
Himachal Pradesh
Ramky Enviro Engineers Ltd, Hyderabad
Chapter 3.35
Sl.No Botanical Name Family Common Name 38 Callistemon citinus (Curtis)
stapf. Myrtaceae
39 Calophyllum inophyllum Linn Clusiaceae Ponnachettu 40 Calotropis gigantea R.Br Asclepiadaceae Peddajilleedu 41 Calotropis procera (R.Br) Ait Asclepiadaceae Chinnajilleedu 42 Cassia fistula Linn Caesalpinaceae Reelachettu 43 Cassia iavanica Caesalpinaceae 44 Cassia pumila Lamk Caesalpinaceae Nallajiluga 45 Cassia renigera Wall ex Caesalpinaceae Pink Cassia 46 Cassia siamea Lamk. Caesalpinaceae Seematangeedu 47 Ceiba pentandra (Linn)
Gaertn. Bombacaceae Kapok
48 Celtis australis Linn. Ulmaceae 49 Citrus aurantium Linn Rutaceae Mallikanarangi 50 Citrus Limon (Linn) Burn Rutaceae Bijapuram 51 Clerodendrum infortunatum
Linn (auct), Weight Verbenaceae Gurrapukattiyaku
52 Cardia dichotoma Forst Cordiaceae Chinn - anakkeru 53 Dalbergia latifolia Roxb. Fabaceae Irugudu, Cittegi. 54 Dalbergia sisoo Roxb. Fabaceae Errasissoo 55 Dendrocalamus Strictus Nees Poaceae Saadharanapuveduru. 56 Derris Indica (Lann.) Bennett. Fabaceae Gaanugachettu 57 Diospyros melanoxylon Roxb. Ebenaceae Tumki 58 Emblica officinalis Gaertn. Euphorbiaceae Amalakama, raatausirika 59 Embryopteris peregrina aertn. Ebenaceae - 60 Eucalyptus citriodora Hook Myrtaceae Lemon scented gum 61 Eucalyptus hybrid Myrtaceae Mysore gum 62 Exbucklandia populnea Hamamelidaceae - 63 Ficus benghalensis Linn Moraceae Peddamarri 64 Ficus benjamina Linn Moraceae - 65 Ficus elastica Roxb Moraceae Indian Rubber tree 66 Ficus gibbosa Blume Moraceae Tella - barinika 67 Grevillea robusta A. cunn Proteaceae. Silvery or silky oak 68 Grewia subinequalis DC. Tiliaceae Nallajana 69 Hibiscus rosa sinensis Malvaceae Dasanamu 70 Ixora arborea Rubiaceae 71 Ixora coccinea Rubiaceae Koranam 72 Ixora undulata Rubiaceae 73 Juniperus communis Pinaceae 74 Lagerstroemia parviflora Lythraceae Chinagoranta 75 Lagerstroemia speciosa Lythraceae Varagoogu 76 Lantana camara Verbenaceae Puulikampa
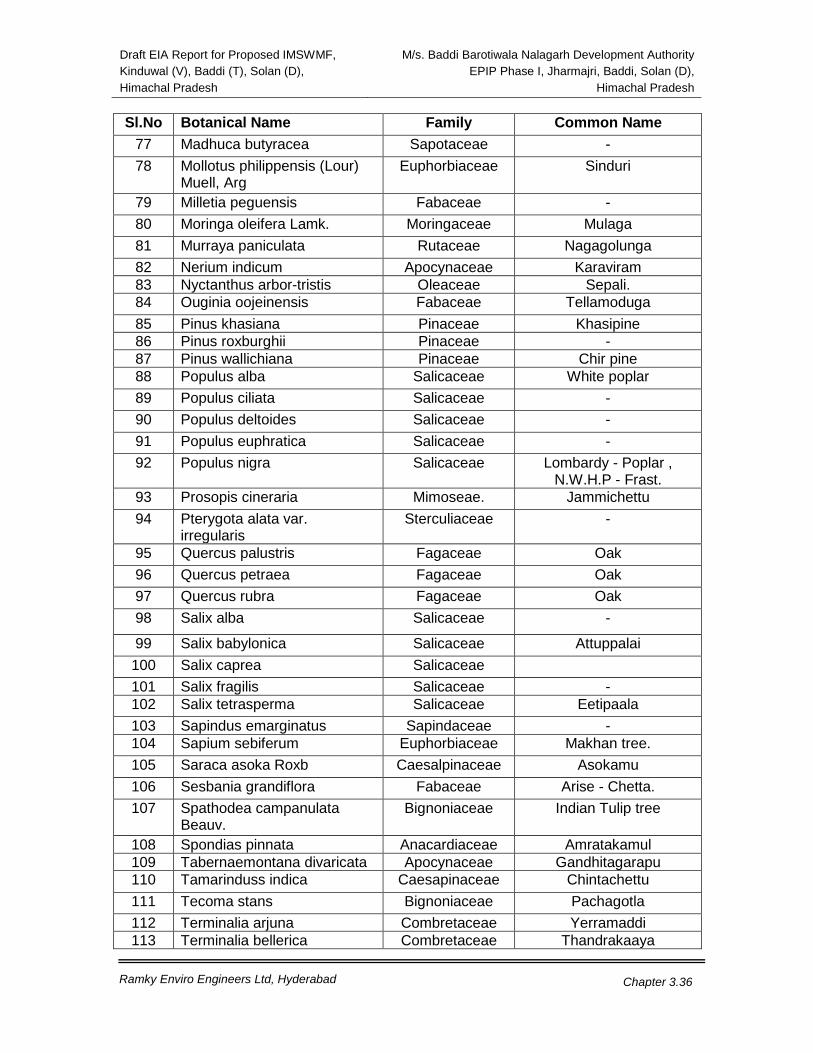
Draft EIA Report for Proposed IMSWMF, Kinduwal (V), Baddi (T), Solan (D), Himachal Pradesh
M/s. Baddi Barotiwala Nalagarh Development Authority EPIP Phase I, Jharmajri, Baddi, Solan (D),
Himachal Pradesh
Ramky Enviro Engineers Ltd, Hyderabad
Chapter 3.36
Sl.No Botanical Name Family Common Name 77 Madhuca butyracea Sapotaceae - 78 Mollotus philippensis (Lour)
Muell, Arg Euphorbiaceae Sinduri
79 Milletia peguensis Fabaceae - 80 Moringa oleifera Lamk. Moringaceae Mulaga 81 Murraya paniculata Rutaceae Nagagolunga 82 Nerium indicum Apocynaceae Karaviram 83 Nyctanthus arbor-tristis Oleaceae Sepali. 84 Ouginia oojeinensis Fabaceae Tellamoduga 85 Pinus khasiana Pinaceae Khasipine 86 Pinus roxburghii Pinaceae - 87 Pinus wallichiana Pinaceae Chir pine 88 Populus alba Salicaceae White poplar 89 Populus ciliata Salicaceae - 90 Populus deltoides Salicaceae - 91 Populus euphratica Salicaceae - 92 Populus nigra Salicaceae Lombardy - Poplar ,
N.W.H.P - Frast. 93 Prosopis cineraria Mimoseae. Jammichettu 94 Pterygota alata var.
irregularis Sterculiaceae -
95 Quercus palustris Fagaceae Oak 96 Quercus petraea Fagaceae Oak 97 Quercus rubra Fagaceae Oak 98 Salix alba Salicaceae -
99 Salix babylonica Salicaceae Attuppalai 100 Salix caprea Salicaceae 101 Salix fragilis Salicaceae - 102 Salix tetrasperma Salicaceae Eetipaala 103 Sapindus emarginatus Sapindaceae - 104 Sapium sebiferum Euphorbiaceae Makhan tree. 105 Saraca asoka Roxb Caesalpinaceae Asokamu 106 Sesbania grandiflora Fabaceae Arise - Chetta. 107 Spathodea campanulata
Beauv. Bignoniaceae Indian Tulip tree
108 Spondias pinnata Anacardiaceae Amratakamul 109 Tabernaemontana divaricata Apocynaceae Gandhitagarapu 110 Tamarinduss indica Caesapinaceae Chintachettu 111 Tecoma stans Bignoniaceae Pachagotla 112 Terminalia arjuna Combretaceae Yerramaddi 113 Terminalia bellerica Combretaceae Thandrakaaya

Draft EIA Report for Proposed IMSWMF, Kinduwal (V), Baddi (T), Solan (D), Himachal Pradesh
M/s. Baddi Barotiwala Nalagarh Development Authority EPIP Phase I, Jharmajri, Baddi, Solan (D),
Himachal Pradesh
Ramky Enviro Engineers Ltd, Hyderabad
Chapter 3.37
Sl.No Botanical Name Family Common Name 114 Terminalia chebula Combretaceae Krarakkaaya 115 Thuja occidentalis Cupressaceae American Arborvitae,
White cedar. 116 Thujaplicata Cupressaceae - 117 Zizyphus mauritiana Rhamnaceae Reegu
3.9.4 Terrestrial fauna of the study area Sl. No. Zoological Name Common Name
1. Hystrix indica Indian porcupine 2. Lepus nigricollis Indian hare 3. Valpes bengalensis Indian fox 4. Macaca mulatta Rhesus monkey 5. Canis aureus Jackal 6. Sus scrofa Wild Boar 7. Muntiacus muntjak Barking deer 8. Boselaphus tragocamelus Nilgai 9. Cervus unicolor Sambar deer 10. Hyelaphus porcinus Hog deer 11. Axis axis Black Buck
3.9.5 Common reptile species observed in the Study Area Sl. No. Zoological Name Common Name
1 Ptyas mucosus Indian Rat Snake 2 Bungarus caeruleus Common Krait 3 Hemidactylus frenatus House lizard
3.9.6 Common bird species observed in the Study Area Sl. No Scientific Name Common Name
1. Elanus caeruleus Black-shouldered Kite (Black wingedKite) 2. Gyps bengalensis White-rumped Vulture 3. Spilornis cheeela Crested serpent Eagle 4. Vanellus indicus Red-wattled Lapwing 5. Columba livia Rock pigeon (Blue Rock Pigeon) 6. Streptopelia chinensis Spotted Dove 7. Dendrocitta vagabunda Rufous Treepie (Indian treepie) 8. Dicrurus macrocercus Black drongo 9. Passer domesticus House Sparrow 10. Rhipidura albicollis White throated Fantail (Flycatcher) 11. Cuculus micropterus Indian cuckoo

Draft EIA Report for Proposed IMSWMF, Kinduwal (V), Baddi (T), Solan (D), Himachal Pradesh
M/s. Baddi Barotiwala Nalagarh Development Authority EPIP Phase I, Jharmajri, Baddi, Solan (D),
Himachal Pradesh
Ramky Enviro Engineers Ltd, Hyderabad
Chapter 3.38
Sl. No Scientific Name Common Name 12. Merops orientalis Green Bee-eater 13. Saxicoloides fulicata Indian robin 14. Parus mahjor Grey Tit 15. Perdicula aisatica Jungle bush quail 16. Gallus gallus Red Jungle fowl 17. Pavo cristatus Indian Peafowl 18. Hypsipetes leucocephalus Black bulbul 19. Acridotheres tristis Common myna 20. Garrulax lineatus Orthotomus sutorius
3.9.7 Aquatic flora and fauna The Phytoplankton species broadly belonged Class Cyanophyceae, Chloriphyceae and Bacillariophyceae. The identified phytoplanktons are Oscillatoria sp., Microcystis sp., Phormidium sp., Merismopedia sp., Chlorella sp., Scenedesmus sp., Navicula sp., Nitzschia sp. and Euglena sp. The available Zooplanktons at the study area are Brachionus sp., Keratella sp, Ceriodaphnia sp. and Moina sp. 3.10 Land use Land cover details of the Study Area The details of the various types of landuses present in the study area are given Table 3.18 and Landuse & Land cover map is given as Figure 3.10, Map showing drainage network, villages, roads, vegetative cover is shown in Figure 3.11 to Figure 3.13.
Table 3.18 Land utilization of Study Area
Sl.No Particulars Area in hectares 1 Build up 1288.003 2 Agricultural Land 4400.947 3 Current fallow 856.864 4 Plantation 163.814 5 Dense Forest 510.809 6 Open Forest 7484.838 7 Dense Scrub 8531.750 8 Other wasteland 2280.268 9 Water bodies 105.761 10 Open Scrubland 3302.361 11 River 1393.472 12 Industrial Area 291.000
Total 30609.891

Draft EIA Report for Proposed IMSWMF, Kinduwal (V), Baddi (T), Solan (D), Himachal Pradesh
M/s. Baddi Barotiwala Nalagarh Development Authority EPIP Phase I, Jharmajri, Baddi, Solan (D),
Himachal Pradesh
Ramky Enviro Engineers Ltd, Hyderabad
Chapter 3.39
Figure 3.10 Land Use Map

Draft EIA Report for Proposed IMSWMF, Kinduwal (V), Baddi (T), Solan (D), Himachal Pradesh
M/s. Baddi Barotiwala Nalagarh Development Authority EPIP Phase I, Jharmajri, Baddi, Solan (D),
Himachal Pradesh
Ramky Enviro Engineers Ltd, Hyderabad
Chapter 3.40
Figure 3.11 Map showing Drainage, Villagez, Roads of the study area

Draft EIA Report for Proposed IMSWMF, Kinduwal (V), Baddi (T), Solan (D), Himachal Pradesh
M/s. Baddi Barotiwala Nalagarh Development Authority EPIP Phase I, Jharmajri, Baddi, Solan (D),
Himachal Pradesh
Ramky Enviro Engineers Ltd, Hyderabad
Chapter 3.41
Figure 3.12 Vegitation cover Map of the study area

Draft EIA Report for Proposed IMSWMF, Kinduwal (V), Baddi (T), Solan (D), Himachal Pradesh
M/s. Baddi Barotiwala Nalagarh Development Authority EPIP Phase I, Jharmajri, Baddi, Solan (D),
Himachal Pradesh
Ramky Enviro Engineers Ltd, Hyderabad
Chapter 3.42
Figure 3.13 Drainage Map of the study area

Draft EIA Report for Proposed IMSWMF, Kinduwal (V), Baddi (T), Solan (D), Himachal Pradesh
M/s. Baddi Barotiwala Nalagarh Development Authority EPIP Phase I, Jharmajri, Baddi, Solan (D),
Himachal Pradesh
Ramky Enviro Engineers Ltd, Hyderabad
Chapter 3.43
3.10 Socio-Economic Environment The methodology adopted in the assessment of socio-economic condition is given below: To evaluate the parameters in the assessment of socio-economic conditions of the population, analysis of the identified social attributes like population distribution, sex ratio, literacy rate, occupational structure, availability of public utilities etc, through literature like District Census Handbook. The major part of study area of the proposed project falls in Kainduwal village of Solan District. The total number of households is 4382 and total population as per census of 2001 is 23965. However for every 13168 number of males there are 10797 females. The literates in the study area are 13264 consisting of around 55%. The SC and ST population in the area are 5055 (21.09%) and 451 (1.88%) of the total population. The total number of workers in the study area is 10964 coming to 45.7% most of the population in the study area belongs to the category of Main workers, which includes Cultivators, Agriculture Labourers, workers those engaged in Household industries, Construction activities, Forestry and other allied activities. Main sources of water supply are wells, hand pumps, ponds/cheruvus and taps in few villages. Market facilities are available in few villages. Communication facilities in the villages are quite good with all villages having Branch Post offices, Telephone facility. Police stations exist in all Taluks. The nearest habitions located in 1-2 km radius are shown in Figure 3.14.

Draft EIA Report for Proposed IMSWMF, Kinduwal (V), Baddi (T), Solan (D), Himachal Pradesh
M/s. Baddi Barotiwala Nalagarh Development Authority EPIP Phase I, Jharmajri, Baddi, Solan (D),
Himachal Pradesh
Ramky Enviro Engineers Ltd, Hyderabad
Chapter 3.44
Figure 3.14 Habitions located in 10Km radius

Draft EIA Report for Proposed IMSWMF, Kinduwal (V), Baddi (T), Solan (D), Himachal Pradesh
M/s. Baddi Barotiwala Nalagarh Development Authority EPIP Phase I, Jharmajri, Baddi, Solan (D),
Himachal Pradesh
Ramky Enviro Engineers Ltd, Hyderabad
Chapter 3.45
Table 3.19 Socio Economic Details of the Study Area – Census 2001
S.No NAME 1 2 3 4 5 6 7 8 9 1 Majra 113 590 309 281 84 53 31 131 73 2 Kainduwal 13 80 46 34 12 9 3 3 2 3 Majru 19 124 60 64 22 12 10 0 0 4 Lodi 128 675 349 326 126 70 56 258 133 5 Majra 202 1280 660 620 220 135 85 492 255 6 Bilanwalian 164 670 434 236 109 57 52 64 36 7 Kunjahal 349 1553 894 659 204 110 94 300 160 8 Bather 481 2038 1253 785 315 157 158 197 125 9 Mandhala 260 1425 752 673 237 125 112 198 102 10 Diwar 13 68 36 32 6 2 4 16 8 11 Kundi 35 174 90 84 27 13 14 74 37 12 Manpura 270 1549 797 752 289 150 139 397 212 13 Beli 96 626 330 296 104 55 49 50 29 14 Kishan Pura 326 1896 1049 847 287 161 126 401 221 15 Shahipur 22 114 58 56 19 12 7 0 0 16 Rautan Wala 83 463 247 216 70 34 36 38 21 17 Marzrawari 3 22 12 10 3 2 1 0 0 18 Karvena 158 797 457 340 118 64 54 4 4 19 Malri 9 58 30 28 4 1 3 19 11 20 Bhunri 24 145 71 74 29 17 12 10 6 21 Kona 205 1422 765 657 275 147 128 494 250 22 Siswan 60 320 180 140 31 21 10 117 70 23 Mirzapur 79 479 267 212 76 38 38 108 59 24 Bardar 163 981 594 387 99 52 47 38 23 25 Majri 30 252 133 119 33 19 14 13 7 26 Chak 84 473 272 201 60 33 27 19 8 27 Bardar 163 981 594 387 99 52 47 38 23 28 Dharampur 78 327 171 156 35 16 19 161 81 29 Beli Khol 96 626 330 296 104 55 49 50 29 30 Goera 63 410 212 198 90 52 38 70 39 31 Kuhwala 11 59 31 28 12 5 7 34 18 32 Nawan Nagar 28 144 75 69 19 13 6 38 21 33 Rogi 60 314 148 166 49 21 28 0 0 34 Maira 66 344 177 167 50 26 24 57 26 35 Taihar 7 37 21 16 2 2 0 35 19 36 Abnami 21 135 73 62 17 11 6 0 0 37 Alanwali 47 284 151 133 59 28 31 24 13

Draft EIA Report for Proposed IMSWMF, Kinduwal (V), Baddi (T), Solan (D), Himachal Pradesh
M/s. Baddi Barotiwala Nalagarh Development Authority EPIP Phase I, Jharmajri, Baddi, Solan (D),
Himachal Pradesh
Ramky Enviro Engineers Ltd, Hyderabad
Chapter 3.46
38 Lazapur 177 917 453 464 114 67 47 612 303 39 Marhanwala 58 384 203 181 66 39 27 295 161 40 Meriwala 118 729 384 345 86 49 37 200 105
Conti..
S.No NAME 10 11 12 13 14 15 16 17 18 1 Majra 58 0 0 0 372 222 150 218 87 2 Kainduwal 1 0 0 0 36 23 13 44 23 3 Majru 0 0 0 0 85 44 41 39 16 4 Lodi 125 0 0 0 388 229 159 287 120 5 Majra 237 0 0 0 693 375 318 587 285 6 Bilanwalian 28 0 0 0 357 272 85 313 162 7 Kunjahal 140 0 0 0 1051 681 370 502 213 8 Bather 72 156 83 73 1327 915 412 711 338 9 Mandhala 96 0 0 0 796 467 329 629 285
10 Diwar 8 0 0 0 46 26 20 22 10 11 Kundi 37 0 0 0 92 62 30 82 28 12 Manpura 185 0 0 0 925 532 393 624 265 13 Beli 21 0 0 0 369 207 162 257 123 14 Kishan Pura 180 0 0 0 1044 657 387 852 392 15 Shahipur 0 0 0 0 82 44 38 32 14 16 Rautan Wala 17 0 0 0 266 172 94 197 75 17 Marzrawari 0 0 0 0 17 10 7 5 2 18 Karvena 0 0 0 0 406 278 128 391 179 19 Malri 8 0 0 0 42 28 14 16 2 20 Bhunri 4 0 0 0 62 29 33 83 42 21 Kona 244 0 0 0 398 261 137 1024 504 22 Siswan 47 0 0 0 231 139 92 89 41 23 Mirzapur 49 0 0 0 158 117 41 321 150 24 Bardar 15 0 0 0 468 319 149 513 275 25 Majri 6 0 0 0 132 80 52 120 53 26 Chak 11 0 0 0 210 136 74 263 136 27 Bardar 15 0 0 0 468 319 149 513 275 28 Dharampur 80 0 0 0 269 147 122 58 24 29 Beli Khol 21 0 0 0 369 207 162 257 123 30 Goera 31 0 0 0 171 114 57 239 98 31 Kuhwala 16 0 0 0 23 18 5 36 13 32 Nawan
Nagar 17 0 0 0 80 47 33 64 28

Draft EIA Report for Proposed IMSWMF, Kinduwal (V), Baddi (T), Solan (D), Himachal Pradesh
M/s. Baddi Barotiwala Nalagarh Development Authority EPIP Phase I, Jharmajri, Baddi, Solan (D),
Himachal Pradesh
Ramky Enviro Engineers Ltd, Hyderabad
Chapter 3.47
33 Rogi 0 295 135 160 173 95 78 141 53 34 Maira 31 0 0 0 202 129 73 142 48 35 Taihar 16 0 0 0 30 18 12 7 3 36 Abnami 0 0 0 0 76 51 25 59 22 37 Alanwali 11 0 0 0 88 59 29 196 92 38 Lazapur 309 0 0 0 602 301 301 315 152 39 Marhanwala 134 0 0 0 226 133 93 158 70 40 Meriwala 95 0 0 0 434 239 195 295 145
Conti..
S.No NAME 19 20 21 22 23 24 25 26 27 1 Majra 131 291 158 133 173 148 25 97 79 2 Kainduwal 21 43 25 18 27 21 6 10 10 3 Majru 23 71 37 34 35 34 1 22 22 4 Lodi 167 220 163 57 161 153 8 43 42 5 Majra 302 481 344 137 446 333 113 285 183 6 Bilanwalian 151 330 295 35 330 295 35 21 21 7 Kunjahal 289 558 498 60 531 491 40 69 60 8 Bather 373 1055 818 237 816 736 80 121 71 9 Mandhala 344 713 392 321 391 330 61 77 72 10 Diwar 12 38 20 18 18 14 4 10 7 11 Kundi 54 44 40 4 29 29 0 9 9 12 Manpura 359 436 397 39 390 376 14 93 92 13 Beli 134 185 156 29 148 142 6 94 93 14 Kishan Pura 460 884 584 300 523 457 66 262 215 15 Shahipur 18 62 32 30 37 32 5 23 19 16 Rautan Wala 122 254 130 124 122 118 4 80 79 17 Marzrawari 3 17 9 8 4 4 0 1 1 18 Karvena 212 303 273 30 258 250 8 70 70 19 Malri 14 44 24 20 29 16 13 27 14 20 Bhunri 41 97 46 51 71 37 34 68 34 21 Kona 520 816 441 375 737 403 334 721 388 22 Siswan 48 220 122 98 125 120 5 0 0 23 Mirzapur 171 209 137 72 96 87 9 82 75 24 Bardar 238 572 384 188 464 363 101 218 215 25 Majri 67 69 67 2 62 60 2 1 1 26 Chak 127 115 94 21 114 93 21 12 11 27 Bardar 238 572 384 188 464 363 101 218 215 28 Dharampur 34 195 105 90 195 105 90 160 73

Draft EIA Report for Proposed IMSWMF, Kinduwal (V), Baddi (T), Solan (D), Himachal Pradesh
M/s. Baddi Barotiwala Nalagarh Development Authority EPIP Phase I, Jharmajri, Baddi, Solan (D),
Himachal Pradesh
Ramky Enviro Engineers Ltd, Hyderabad
Chapter 3.48
29 Beli Khol 134 185 156 29 148 142 6 94 93 30 Goera 141 156 82 74 74 74 0 64 64 31 Kuhwala 23 34 18 16 24 16 8 14 7 32 Nawan Nagar 36 73 39 34 52 39 13 42 29 33 Rogi 88 214 99 115 89 69 20 55 42 34 Maira 94 192 102 90 93 84 9 78 70 35 Taihar 4 21 11 10 10 10 0 6 6 36 Abnami 37 84 40 44 34 33 1 16 16 37 Alanwali 104 78 77 1 77 77 0 63 63 38 Lazapur 163 436 240 196 425 239 186 59 39 39 Marhanwala 88 213 110 103 180 98 82 15 14 40 Meriwala 150 384 205 179 378 200 178 95 94
Conti..
S.No NAME 28 29 30 31 32 33 34 35 36 1 Majra 18 3 3 0 2 2 0 71 64 2 Kainduwal 0 0 0 0 0 0 0 17 11 3 Majru 0 0 0 0 0 0 0 13 12 4 Lodi 1 2 2 0 5 4 1 111 105 5 Majra 102 0 0 0 1 1 0 160 149 6 Bilanwalian 0 6 6 0 34 33 1 269 235 7 Kunjahal 9 3 3 0 34 15 19 425 413 8 Bather 50 4 4 0 21 19 2 670 642 9 Mandhala 5 22 22 0 0 0 0 292 236
10 Diwar 3 0 0 0 0 0 0 8 7 11 Kundi 0 0 0 0 1 1 0 19 19 12 Manpura 1 2 2 0 2 2 0 293 280 13 Beli 1 0 0 0 0 0 0 54 49 14 Kishan Pura 47 2 2 0 1 1 0 258 239 15 Shahipur 4 0 0 0 0 0 0 14 13 16 Rautan Wala 1 2 2 0 0 0 0 40 37 17 Marzrawari 0 0 0 0 0 0 0 3 3 18 Karvena 0 7 7 0 0 0 0 181 173 19 Malri 13 0 0 0 0 0 0 2 2 20 Bhunri 34 0 0 0 0 0 0 3 3 21 Kona 333 3 2 1 0 0 0 13 13 22 Siswan 0 9 7 2 6 6 0 110 107 23 Mirzapur 7 0 0 0 2 2 0 12 10 24 Bardar 3 1 0 1 0 0 0 245 148

Draft EIA Report for Proposed IMSWMF, Kinduwal (V), Baddi (T), Solan (D), Himachal Pradesh
M/s. Baddi Barotiwala Nalagarh Development Authority EPIP Phase I, Jharmajri, Baddi, Solan (D),
Himachal Pradesh
Ramky Enviro Engineers Ltd, Hyderabad
Chapter 3.49
25 Majri 0 42 41 1 4 4 0 15 14 26 Chak 1 23 23 0 15 15 0 64 44 27 Bardar 3 1 0 1 0 0 0 245 148 28 Dharampur 87 2 1 1 0 0 0 33 31 29 Beli Khol 1 0 0 0 0 0 0 54 49 30 Goera 0 0 0 0 0 0 0 10 10 31 Kuhwala 7 0 0 0 0 0 0 10 9 32 Nawan Nagar 13 0 0 0 1 1 0 9 9 33 Rogi 13 1 1 0 6 4 2 27 22 34 Maira 8 0 0 0 1 1 0 14 13 35 Taihar 0 1 1 0 0 0 0 3 3 36 Abnami 0 0 0 0 0 0 0 18 17 37 Alanwali 0 0 0 0 0 0 0 14 14 38 Lazapur 20 26 23 3 5 4 1 335 173 39 Marhanwala 1 0 0 0 0 0 0 165 84 40 Meriwala 1 62 57 5 3 1 2 218 48
Conti.
S.No NAME 37 38 39 40 41 42 43 44 45 1 Majra 7 118 10 108 112 7 105 3 1 2 Kainduwal 6 16 4 12 15 3 12 0 0 3 Majru 1 36 3 33 36 3 33 0 0 4 Lodi 6 59 10 49 54 5 49 0 0 5 Majra 11 35 11 24 13 7 6 19 3 6 Bilanwalian 34 0 0 0 0 0 0 0 0 7 Kunjahal 12 27 7 20 25 6 19 1 0 8 Bather 28 239 82 157 195 51 144 3 2 9 Mandhala 56 322 62 260 315 56 259 4 3
10 Diwar 1 20 6 14 14 3 11 4 2 11 Kundi 0 15 11 4 15 11 4 0 0 12 Manpura 13 46 21 25 35 13 22 0 0 13 Beli 5 37 14 23 25 2 23 0 0 14 Kishan Pura 19 361 127 234 252 54 198 3 2 15 Shahipur 1 25 0 25 25 0 25 0 0 16 Rautan Wala 3 132 12 120 118 4 114 13 8 17 Marzrawari 0 13 5 8 13 5 8 0 0 18 Karvena 8 45 23 22 30 15 15 4 1 19 Malri 0 15 8 7 15 8 7 0 0 20 Bhunri 0 26 9 17 26 9 17 0 0

Draft EIA Report for Proposed IMSWMF, Kinduwal (V), Baddi (T), Solan (D), Himachal Pradesh
M/s. Baddi Barotiwala Nalagarh Development Authority EPIP Phase I, Jharmajri, Baddi, Solan (D),
Himachal Pradesh
Ramky Enviro Engineers Ltd, Hyderabad
Chapter 3.50
21 Kona 0 79 38 41 79 38 41 0 0 22 Siswan 3 95 2 93 1 1 0 0 0 23 Mirzapur 2 113 50 63 23 9 14 0 0 24 Bardar 97 108 21 87 29 2 27 79 19 25 Majri 1 7 7 0 0 0 0 4 4 26 Chak 20 1 1 0 0 0 0 0 0 27 Bardar 97 108 21 87 29 2 27 79 19 28 Dharampur 2 0 0 0 0 0 0 0 0 29 Beli Khol 5 37 14 23 25 2 23 0 0 30 Goera 0 82 8 74 82 8 74 0 0 31 Kuhwala 1 10 2 8 10 2 8 0 0 32 Nawan Nagar 0 21 0 21 21 0 21 0 0 33 Rogi 5 125 30 95 108 26 82 0 0 34 Maira 1 99 18 81 97 16 81 0 0 35 Taihar 0 11 1 10 10 0 10 0 0 36 Abnami 1 50 7 43 50 7 43 0 0 37 Alanwali 0 1 0 1 1 0 1 0 0 38 Lazapur 162 11 1 10 0 0 0 0 0 39 Marhanwala 81 33 12 21 1 0 1 0 0 40 Meriwala 170 6 5 1 1 1 0 0 0
Conti.
S.No NAME 46 47 48 49 50 51 52 53 54 55 1 Majra 2 0 0 0 3 2 1 299 151 148 2 Kainduwal 0 0 0 0 1 1 0 37 21 16 3 Majru 0 0 0 0 0 0 0 53 23 30 4 Lodi 0 0 0 0 5 5 0 455 186 269 5 Majra 16 0 0 0 3 1 2 799 316 483 6 Bilanwalian 0 0 0 0 0 0 0 340 139 201 7 Kunjahal 1 0 0 0 1 1 0 995 396 599 8 Bather 1 8 4 4 33 25 8 983 435 548 9 Mandhala 1 0 0 0 3 3 0 712 360 352
10 Diwar 2 0 0 0 2 1 1 30 16 14 11 Kundi 0 0 0 0 0 0 0 130 50 80 12 Manpura 0 0 0 0 11 8 3 1113 400 713 13 Beli 0 1 1 0 11 11 0 441 174 267 14 Kishan Pura 1 0 0 0 106 71 35 1012 465 547 15 Shahipur 0 0 0 0 0 0 0 52 26 26 16 Rautan Wala 5 0 0 0 1 0 1 209 117 92 17 Marzrawari 0 0 0 0 0 0 0 5 3 2

Draft EIA Report for Proposed IMSWMF, Kinduwal (V), Baddi (T), Solan (D), Himachal Pradesh
M/s. Baddi Barotiwala Nalagarh Development Authority EPIP Phase I, Jharmajri, Baddi, Solan (D),
Himachal Pradesh
Ramky Enviro Engineers Ltd, Hyderabad
Chapter 3.51
18 Karvena 3 0 0 0 11 7 4 494 184 310 19 Malri 0 0 0 0 0 0 0 14 6 8 20 Bhunri 0 0 0 0 0 0 0 48 25 23 21 Kona 0 0 0 0 0 0 0 606 324 282 22 Siswan 0 4 0 4 90 1 89 100 58 42 23 Mirzapur 0 0 0 0 90 41 49 270 130 140 24 Bardar 60 0 0 0 0 0 0 409 210 199 25 Majri 0 0 0 0 3 3 0 183 66 117 26 Chak 0 0 0 0 1 1 0 358 178 180 27 Bardar 60 0 0 0 0 0 0 409 210 199 28 Dharampur 0 0 0 0 0 0 0 132 66 66 29 Beli Khol 0 1 1 0 11 11 0 441 174 267 30 Goera 0 0 0 0 0 0 0 254 130 124 31 Kuhwala 0 0 0 0 0 0 0 25 13 12 32 NawanNagar 0 0 0 0 0 0 0 71 36 35 33 Rogi 0 8 0 8 9 4 5 100 49 51 34 Maira 0 0 0 0 2 2 0 152 75 77 35 Taihar 0 0 0 0 1 1 0 16 10 6 36 Abnami 0 0 0 0 0 0 0 51 33 18 37 Alanwali 0 0 0 0 0 0 0 206 74 132 38 Lazapur 0 5 0 5 6 1 5 481 213 268 39 Marhanwala 0 0 0 0 32 12 20 171 93 78 40 Meriwala 0 0 0 0 5 4 1 345 179 166

Draft EIA Report for Proposed IMSWMF, Kinduwal (V), Baddi (T), Solan (D), Himachal Pradesh
M/s. Baddi Barotiwala Nalagarh Development Authority EPIP Phase I, Jharmajri, Baddi, Solan (D),
Himachal Pradesh
Ramky Enviro Engineers Ltd, Hyderabad
Chapter 3.52
1. Number of House holds 29. Main Agricultural Labourers – Total 2. Total Population 30. Main Agricultural Labourers - Male 3. Total Male Population 31. Main Agricultural Labourers – Female 4. Total Female Population 32. Main House Hold - Total 5. Population age group 0-6 33. Main House Hold – Male 6. Male Population age group 0-6 34. Main House Hold – Female 7. Female Population age group 0-6 35. Main Others - Total 8. Schedule caste – Total 36. Main Others - Male 9. Schedule caste – Male 37. Main Others - Female
10. Schedule Caste – Female 38. Marginal workers – Total 11. Schedule Tribe – Total 39. Marginal workers – Male 12. Schedule Tribe – Male 40. Marginal workers – Female 13. Schedule Tribe – Female 41. Marginal Cultivators - Total 14. Literates – Total 42. Marginal Cultivators – Male 15. Literates – Male 43. Marginal Cultivators – Female 16. Literates – Female 44. Marginal Agricultural Labourers - Total 17. Illiterates – Total 45. Marginal Agricultural Labourers – Male 18. Illiterates – Male 46. Marginal Agricultural Labourers – Female 19. Illiterates – Female 47. Marginal House Hold - Total 20. Total Workers 48. Marginal House Hold - Male 21. Total Workers – Male 49. Marginal House Hold – Female 22. Total Workers – Female 50. Marginal Others – Total 23. Main Workers – Total 51. Marginal Others – Male 24. Main workers – Male 52. Marginal Others - Female 25. Main Workers – Female 53. Non workers – Total 26. Main Cultivators – Total 54. Non Workers – Male 27. Main Cultivators – Male 55. Non Workers – Female 28. Main Cultivators – Female

Draft EIA Report for Proposed IMSWMF, Kinduwal (V), Baddi (T), Solan (D), Himachal Pradesh
M/s. Baddi Barotiwala Nalagarh Development Authority EPIP Phase I, Jharmajri, Baddi, Solan (D),
Himachal Pradesh
Ramky Enviro Engineers Ltd, Hyderabad
Chapter 4.1
CHAPTER -4 ANTICIPATED ENVIRONMENTAL IMPACTS & MITIGATION MEASURES 4.1 Identification of Impacts Any developmental activity in its wake will bring about some impacts associated with its origin, which can be broadly classified as reversible, irreversible, long and short-term impacts. In this chapter, an endeavor has been made to identify various environmental impacts associated with the operation of facility and other activities wherein, there may be a chance of pollution. Based on the possible worst case emissions and waste generation from the proposed project and also taking into consideration the baseline environmental status at the proposed project site, the environmental factors that are likely to be affected (Impacts) are identified, quantified and assessed. Both instrumental (positive) and detrimental (negative) impacts are accounted for this purpose. The prediction of impacts helps in the preparation of a sound environmental management plan which has to be executed during the on-going activities for the proposed project to minimize the adverse impacts on the environmental quality. A large number of adverse impacts occur from facility operations. These impacts can be fatal accidents (e.g., scavengers buried under waste piles) infrastructure damage (e.g., damage to access roads by heavy vehicles) pollution of the local environment (such as contamination of groundwater and/or aquifers by leakage and residual soil contamination during landfill usage, as well as after landfill closure) off-gassing of methane generated by decaying organic wastes (methane is a greenhouse gas many times more potent than carbon dioxide, and can itself be a danger to inhabitants of an area); harbouring of disease vectors such as rats and flies, particularly from improperly operated landfills. 4.2 Methodology The potential impacts on the environment from the proposed project are identified based on the nature of the various activities associated not only with the project implementation and operation, but also on the current status of the environmental quality at the project site. 4.3 Potential Impacts The potential significant environmental impacts associated with the project are grouped as below.
4

Draft EIA Report for Proposed IMSWMF, Kinduwal (V), Baddi (T), Solan (D), Himachal Pradesh
M/s. Baddi Barotiwala Nalagarh Development Authority EPIP Phase I, Jharmajri, Baddi, Solan (D),
Himachal Pradesh
Ramky Enviro Engineers Ltd, Hyderabad
Chapter 4.2
4.3.1 Air Environment • Impacts on ambient air quality • Impacts on ambient odor • Impacts on ambient noise
4.3.2 Water Environment
• Impacts on surface & ground water quality • Impacts on aquatic life
4.3.3 Land Environment
• Impacts on land use • Impacts on soil fertility • Impacts on agriculture
4.3.4 Socio Economics
• Impacts on infrastructure • Impacts on employment
4.3.5 Indirect Impacts
• Impacts on public health and safety • Impacts on aesthetics
4.4 Prediction of Impacts The impact assessment is carried out for the following phases and presented in the following paragraphs.
• Impacts during development phase • Impacts during operation phase
4.4.1 Impacts during Development Phase Construction phase works include site clearance, site formation, building works, infrastructure provision and any other infrastructure activities. The impacts due to construction activities are short term and are limited to the construction phase. The impacts will be mainly on air quality, water quality, soil quality and socio-economics. 4.4.1.1 Impact on Air Quality The principal potential source of air quality impact arising from the construction of the proposed project is fugitive dust generation. The dust, measurable as Suspended Particulate Matter and Respirable Suspended Particulates would be generated as a result of

Draft EIA Report for Proposed IMSWMF, Kinduwal (V), Baddi (T), Solan (D), Himachal Pradesh
M/s. Baddi Barotiwala Nalagarh Development Authority EPIP Phase I, Jharmajri, Baddi, Solan (D),
Himachal Pradesh
Ramky Enviro Engineers Ltd, Hyderabad
Chapter 4.3
construction activities. The construction program of the projects shall commence immediately after obtaining statutory clearances. The potential dust sources associated with construction activities are loading and unloading of the materials, top soil removal, travel over unpaved roads and wind erosion etc. The construction works associated with the proposed development are broadly given below.
1. Site development and foundation works 2. Dust generation due to vehicles bringing raw materials 3. Un loading of raw materials, removal of un wanted waste material from site 4. Civil constructions and provision of infrastructure required for various activities
proposed Among all the construction activities, site formation has the highest potential for causing dust nuisance to the nearby air sensitive locations. During the construction of the project, existing houses nearby may be subject to the potential dust impacts. Exhaust emissions from vehicles and equipment deployed during the construction phase is also likely to result in marginal increase in the levels of SO2, NOX
1. The important dust suppression measures proposed will be regular water sprinkling on main haul roads in the project area, this activity will be carried out at least twice a day, if need arises frequency will be increased on windy days, in this way around 50% reduction on the dust contribution from the exposed surface will be achieved.
, SPM, CO and un-burnt hydrocarbons. The impact of such activities would be temporary and restricted to the construction phase. The impact is generally confined to the project area and is expected to be negligible outside the plant boundaries. 4.4.1.2 Mitigation Measures proposed – Air Quality
For the proposed project site levelling and grading will be carried out, where ever possible to maintain the natural elevations they will not be disturbed, only levelling activity will be carried out for providing roads, sewage network, storm water system, and places required for providing buildings for administrative and plant shed erection. According to the engineering assessment; most of the excavated material shall be reused within the project boundary. The movement of cut and fill material will be limited. Most of the construction dust will be generated from the movement of construction vehicles on unpaved roads. Unloading and removal of soil material shall also act as a potential source for dust nuisance. The control measures proposed to be taken up are given below.
2. The duration of stockpiling will be as short as possible as most of the material will be used as backfill material for the open cut trenches for road development.
3. Temporary tin sheets of sufficient height (3m) will be erected around the site of dust generation or all around the project site as barrier for dust control.
4. Tree plantations around the project boundary will be initiated at the early stages by
Draft EIA Report for Proposed IMSWMF, Kinduwal (V), Baddi (T), Solan (D), Himachal Pradesh
M/s. Baddi Barotiwala Nalagarh Development Authority EPIP Phase I, Jharmajri, Baddi, Solan (D),
Himachal Pradesh
Ramky Enviro Engineers Ltd, Hyderabad
Chapter 4.4
plantation of 2 to 3 years old saplings, regular watering will be done, so that the area will be moist for most part of the day.
5. To reduce the dust movement from civil construction site to the neighbourhood the external part of the building (administration, canteen, etc) will be covered by plastic sheets
Given the implementation of proper control measures for dust suppression, no adverse impacts are expected and compliance with the Ambient Air Quality is achieved at ASR’s (Air Pollution Sensitive Receivers) at all time. 4.4.1.3 Impact on Water Quality The proposed project will involve various construction activities. The following section summarizes the activities likely to be undertaken during the proposed development and describes the potential impacts on water quality from each activity. i) Site formation Preparation of designated area of land for subsequent development activities involves levelling of the ground surface, removal of vegetation, stockpiling and generation of construction waste. Construction of temporary infrastructure such as drainage culverts may be required. The site formation may produce large quantities of run-off with high suspended solids loading in the absence of appropriate mitigation measures. This potential problem may be aggravated during rainy season. ii)Construction of buildings In rainy season during the construction phase due to construction of various civil structures site runoff results significant pollution in the receiving water bodies. And washing of various construction equipments will also result in water pollution. iii) Site workshop
The used engine oil and lubricants, and their storage as waste materials as the potential to create impacts if spillage occurs. Waste oil may infiltrate into the surface soil layers, or runoff into local watercourses, increasing hydrocarbon levels. Proper precautionary measures should be taken to prevent any spillage of the above materials and their subsequent runoff into the water bodies. iv) Presence of workers During construction, impacts from the workers include waste and wastewater generated from eating areas, and sewage from temporary sanitary facilities. Sewage is characterized by high levels of BOD, ammonia and E.Coli. Significant water quality impact will happen only if the sewage is discharged directly into the receiving waters without any prior treatment.

Draft EIA Report for Proposed IMSWMF, Kinduwal (V), Baddi (T), Solan (D), Himachal Pradesh
M/s. Baddi Barotiwala Nalagarh Development Authority EPIP Phase I, Jharmajri, Baddi, Solan (D),
Himachal Pradesh
Ramky Enviro Engineers Ltd, Hyderabad
Chapter 4.5
4.4.1.4 Mitigation Measures – Water Quality During site development necessary precautions will be taken, so that the runoff water from the site gets collected to working pit and if any over flow is, will be diverted to near by greenbelt/ plantation area. During construction activity all the equipments washed water will be diverted to working pit to arrest the suspended solids if any and the settled water will be reused for construction purposes, and for sprinkling on roads to control the dust emission, etc. 4.1.5 Impact of Noise Levels The major activities, which produce periodic noise, during construction phase, are as follows:
• Foundation works • Fabrication of structures • Plant erection • Operation of construction equipment • Movement of vehicles etc
4.1.6 Mitigation Measures – Noise Quality All noise generating equipment will be used during day time for brief period of its requirement. Proper enclosures will be used for reduction in noise levels, where ever possible the noise generating equipment will be kept away from the human habituation. Therefore, impact on noise environment due to proposed project would be insignificant. All vehicles entering into the project will be informed to maintain speed limits, and not blow horns unless it is required. 4.1.7 Impacts due to Solid Waste Generation This category of waste generation in the proposed project is due to different types of raw materials being used during construction stage in general may comprise the following.
• Cement concrete • Bricks, tiles, • Cement plaster • Steel (RCC, door/ window frames, roofing support, railings of staircase etc) • Rubble, sand, Stone (Marble, granite, sand stone) • Timber/wood • Paints/varnishes
Besides above there are some major and minor components namely conduits, pipes, electrical fixtures, panels, etc. all the above items will be segregated and stored at the site and once the facility established will be process the same in respective treatment facilities within the site.

Draft EIA Report for Proposed IMSWMF, Kinduwal (V), Baddi (T), Solan (D), Himachal Pradesh
M/s. Baddi Barotiwala Nalagarh Development Authority EPIP Phase I, Jharmajri, Baddi, Solan (D),
Himachal Pradesh
Ramky Enviro Engineers Ltd, Hyderabad
Chapter 4.6
4.1.8 Mitigation Measures – Solid Waste The solid waste generated during this period being predominantly inert in nature. Hence maximum effort would be made to reuse and recycle them. The most of the solid waste material can be used for filing/ levelling of low-laying areas with in the site. All attempts should be made to stick to the following measures.
1. All construction waste shall be stored within the site itself. A proper screen will be provided so that the waste does not get scattered.
2. Attempts will be made to keep the waste segregated into different heaps as far as possible so that their further gradation and reuse is facilitated.
3. Materials, which can be reused for purpose of construction, levelling, making roads/ pavement will also be kept in separate heaps from those which are to be sold or land filled.
4. The local body or a private company may be arranged to provide appropriate number of skip containers/ trolleys on hire.
The use of the construction material basically depends on their separation and conditions of the separated material. A majority of these materials are durable and therefore, have a high potential for reuse. It would, however, be desirable to have quality standards for the recycled materials. Construction waste can be used in the following manner.
1. Reuse of bricks, tiles, stone slabs, timber, piping railings etc to the extent possible and depending upon their conditions.
2. Sale/ auction of materials which cannot be used at the site due to design constraint 3. Plastics, broken glass, scrap metal etc will be stored and processed with in the site
premises. 4. Rubble/ brick bats can be used for building activity, such as levelling, under coat of
lanes where the traffic does not constitute heavy moving loads. 5. Larger unusable pieces can be sent for filing up low laying areas. 6. Fine material such as sand, dust, etc can be used as cover material 7. The unearthed soil can be used for levelling as well as for lawn development 8. The broken pieces of the flooring material can be used for levelling in the building
or can be disposed off 9. The unused or remaining paints/varnishes/wood can either be reused or can be
disposed off. 4.1.9 Impact on Land use The proposed project is establishment of Municipal dump site in accordance to MSW Rules 2000. Due to the proposed development the existing unauthorised dumping in and around the BBN area will be reduced drastically, the aesthetics of the surrounding areas will also be improved.

Draft EIA Report for Proposed IMSWMF, Kinduwal (V), Baddi (T), Solan (D), Himachal Pradesh
M/s. Baddi Barotiwala Nalagarh Development Authority EPIP Phase I, Jharmajri, Baddi, Solan (D),
Himachal Pradesh
Ramky Enviro Engineers Ltd, Hyderabad
Chapter 4.7
4.1.10 Demography and Socio-economics The impact of the proposed unit on demography and socio economic conditions of the study area would be as follows.
1 Additional strain on civic amenities like road, transport, communication, drinking water, sanitation & other facilities to meet the work force requirement
2 Increase in demand for services like hotels, lodges, public transport etc. 3 Employment Opportunities for construction labourers, skilled and unskilled
workers etc., 4 Economic upliftment of the area. 5 Increase in Labour rates. 6 More work to the civil construction and transportation companies
4.2 Impacts during Operation During the operation phase of the proposed project there would be impacts on the air environment, water environment, Land environment and socio-economic aspects. 4.2.1 Prediction of Impacts on the Air Environment Prediction of impacts from the proposed project on the ambient air quality was carried out using air quality simulation models. The main sources of air pollution are vehicular emissions, emissions from Landfill and DG sets etc. The emissions from the DG sets are very less since they will be operated only during power failures. 4.2.2 Atmospheric Dispersion of Stack Emissions Prediction of impacts from air emissions from the proposed facility is carried out only for DG set emissions. 4.2.3 Emissions from the proposed activities The pollutants from the proposed facility are
• DG Sets of 2 x 50 KVA.
The emissions from the DG set are given in the following table. The point source emissions from the proposed project are from the standby DG sets which will be used only during power failure situation. The details of the air pollution expected from the DG set stacks are given Table 4.1. The stack proposed for the DG set meets the MoEF/CPCB norms.

Draft EIA Report for Proposed IMSWMF, Kinduwal (V), Baddi (T), Solan (D), Himachal Pradesh
M/s. Baddi Barotiwala Nalagarh Development Authority EPIP Phase I, Jharmajri, Baddi, Solan (D),
Himachal Pradesh
Ramky Enviro Engineers Ltd, Hyderabad
Chapter 4.8
Table 4.1 Emissions from the utilities
Source Height (m)
Dia. (m)
Temp in oC
Gas Vel. (m/sec)
Units in g/s
SPM SO NO2 x 2*50 KVA DG Set 6 0.2 195 8 - 0.0001 0.0005 Stack Height formula Ht of Building + 0.2√KVA Height of the stack 4 + 1.4 = 5.4m (Proposed 6 m) Fuel (Diesel) 10 L/hours Sulfur content 0.05% max Oxides of nitrogen 5.1 g/kg One DG set is standby
4.2.4 Details of Mathematical Modeling There are large numbers of mathematical models available for prediction of impacts on air environment. These models deal with different types of atmospheric dispersion computations, air pollution sources, topographic features and cater to different types of requirements. Some of the available mathematical models require large amount of meteorological data and large computer resources to handle this data, whereas, some models could be used with fewer amounts of data. Keeping in view the requirement and data availability, one has to identify a proper model suitable to the specific project for prediction of impacts on air environment. Accordingly, AERMOD has been identified for prediction of impacts. AERMOD supports computation of averaging time periods of 1 to 24 hours for multiple receptors and multiple sources of each type. The model was used to predict the impacts from point sources. 4.2.5. Meteorological Data The wind speed and direction of study period were recorded on continuous basis at proposed project site. The wind data were further analyzed to obtain predominant wind direction and average wind speed for 1 to 24 hrs and the same data were used in prediction of impacts on air environment.
Table 4.2 Micro – Meteorological Data Used for Prediction of Impacts
Hrs. Wind Direction in (Degrees)
Wind Speed (m/sec)
Ambient temperature(k)
Cloud cover
Relative Humidity %
1 325 2.50 298 1 50 2 315 2.48 302 2 35 3 310 2.43 292 2 37 4 300 2.41 300 2 44 5 315 2.41 297 2 38 6 300 2.40 298 2 42

Draft EIA Report for Proposed IMSWMF, Kinduwal (V), Baddi (T), Solan (D), Himachal Pradesh
M/s. Baddi Barotiwala Nalagarh Development Authority EPIP Phase I, Jharmajri, Baddi, Solan (D),
Himachal Pradesh
Ramky Enviro Engineers Ltd, Hyderabad
Chapter 4.9
Hrs. Wind Direction in (Degrees)
Wind Speed (m/sec)
Ambient temperature(k)
Cloud cover
Relative Humidity %
7 315 2.43 299 1 37 8 325 2.42 294 1 50 9 310 2.42 297 1 38 10 320 2.42 298 1 37 11 320 2.48 299 2 50 12 325 2.47 298 2 35 13 315 2.49 295 1 44 14 225 2.53 296 1 37 15 220 2.50 298 2 50 16 222 2.46 298 2 45 17 230 2.46 300 2 48 18 210 2.47 298 1 47 19 270 2.47 299 1 49 20 260 2.41 298 1 39 21 265 2.42 297 1 40 22 270 2.41 296 2 43 23 260 2.30 295 1 50 00 275 2.40 297 2 49
4.2.6 Air Quality Predictions AERMOD model which is an atmospheric dispersion algorithm was used to predict the ground level concentrations (GLC's) of SPM, NOx, and SO2 due to the proposed project. The GLC's of SPM, SO2 and NOx, were predicted on 24 hourly average basis and the concentrations are shown in the form of isopleths. The various GLC contours for SO2 and NOx, are superimposed on the study area map and shown in Figure 4.1 to 4.2. As the existing background level of dust and gaseous pollutants, as indicated by the baseline data (Chapter-3) are very less and well within the permissible standards, however prediction of air quality impact assessment using mathematical model provides the predicted emissions for the proposed project. The pollutants released into the atmosphere will disperse in the down wind direction and finally reach the ground at further distance from the source. The ground level concentrations mainly depend upon the strength of the emission source and meteorology of the study area. It is observed that the predicted maximum GLC of PM, SO2, and NOx are very low and are below the stipulated standards. The GLC values observed will not pose any adverse impacts in the surrounding areas.

Draft EIA Report for Proposed IMSWMF, Kinduwal (V), Baddi (T), Solan (D), Himachal Pradesh
M/s. Baddi Barotiwala Nalagarh Development Authority EPIP Phase I, Jharmajri, Baddi, Solan (D),
Himachal Pradesh
Ramky Enviro Engineers Ltd, Hyderabad
Chapter 4.10
4.2.7 Post Project Scenario Using the emission data and meteorological data, incremental concentrations of SPM, SO2 and NOx have been predicted are as follows.
Table 4.3
Post Project Scenario-Units:µg/mPollutant
3
Baseline Max. Value
Predicted Max contribution to GLC’s
Future Predicted concentration
NAAQ Std
SO2 13.1 0.0022 µg/m3 (1000m SE) 13.102 80 NOX 25.9 0.0110 µg/m3 (1000m SE) 25.91 80
(24 hrly average) From the above table it can be seen that the future predicted concentrations estimated by super imposing the predicted values over the base line values are well within the prescribed statutory limits no major deleterious impacts on the air environment from the project are felt.

Draft EIA Report for Proposed IMSWMF, Kinduwal (V), Baddi (T), Solan (D), Himachal Pradesh
M/s. Baddi Barotiwala Nalagarh Development Authority EPIP Phase I, Jharmajri, Baddi, Solan (D),
Himachal Pradesh
Ramky Enviro Engineers Ltd, Hyderabad
Chapter 4.12
Figure4.1
Predicted Ground level Concentration for SO2 Pollutant No of
stacks Ground Level concentration of
highest 24hrs value Contour Interval
(µg/m3Highest value at a
distance of ) Grid Area
SO2 2 0.0022 µg/m 0.0005 µg/m3 1000m SE 3 20000mX20000m SE = South East Direction
Wind rose for May 2012

Draft EIA Report for Proposed IMSWMF, Kinduwal (V), Baddi (T), Solan (D), Himachal Pradesh
M/s. Baddi Barotiwala Nalagarh Development Authority EPIP Phase I, Jharmajri, Baddi, Solan (D),
Himachal Pradesh
Ramky Enviro Engineers Ltd, Hyderabad
Chapter 4.13
Figure4.2
Predicted Ground level Concentration for NOx Pollutant No of
stacks Ground Level concentration
of highest 24hrs value Contour Interval
(µg/m3Highest value at a
distance of ) Grid Area
NOX 2 0.011 µg/m3 0.003 µg/m 1000m SE 3 20000mX20000m SE = South East Direction
Wind rose for May 2012

Draft EIA Report for Proposed IMSWMF, Kinduwal (V), Baddi (T), Solan (D), Himachal Pradesh
M/s. Baddi Barotiwala Nalagarh Development Authority EPIP Phase I, Jharmajri, Baddi, Solan (D),
Himachal Pradesh
Ramky Enviro Engineers Ltd, Hyderabad
Chapter 4.14
4.2.8 Mitigation Measures Particulate Matter Dust will be generated due to movement of the vehicles carrying municipal solid waste and also due to handling of waste in compost plant and landfill. The same will be controlled by sprinkling of water on haul roads, two times in a day, if required the frequency will be increased appropriately. At the compost plant the dust generation will be minimized by maintaining sufficient moisture, and at secured landfill except the current waste handling area rest will be covered by polyethylene sheets. Gases For proper dispersion of Sulphur dioxide & Oxides of Nitrogen emissions from the DG set, stack height meeting MOEF/CPCB guidelines will be provided for proper dispersion into atmosphere. 4.2.9 Impact on Water Quality The water demand of the project will be met through groundwater no surface water will be tapped. The minimize the water consumption, water saving options will be planned.
• Improve energy efficiency of operations • Installation of flow restrictors on tap water supply line • Dry sweeping of all areas before mopping/washing • Eliminate leaks of the pipelines • Storm water harvesting • Rain water holding tanks • Recycling of water etc
Table 4.4 Wastewater generation
S.No Utility Wastewater in m3/day
Remarks
1 Domestic Waste 0.8 Septic tank/soak pit 2 Leachate from Windrow of
Compost Plant 15 Quantity of leachate reused for
sprinkling on window. 3 Leachate from landfill 0.5
Total 16.3 1) Leachate generated at various places in the plant is collected and sprayed on
windrow to maintain suitable temperature and moisture. 2) Optimum Temperature - 70ºC; 3) Optimum Moisture - 50 to 60%

Draft EIA Report for Proposed IMSWMF, Kinduwal (V), Baddi (T), Solan (D), Himachal Pradesh
M/s. Baddi Barotiwala Nalagarh Development Authority EPIP Phase I, Jharmajri, Baddi, Solan (D),
Himachal Pradesh
Ramky Enviro Engineers Ltd, Hyderabad
Chapter 4.15
Table 4.5 Wastewater Characteristics
Parameter Units Domestic Purpose
Quantity m3 90 /d pH - 6.5 – 8.0 Oil & Grease mg/l 15
TSS mg/l 150 – 200
TDS mg/l 1000 - 1050
COD mg/l 300 – 400 BOD mg/l 200 – 275
4.2.10 Strom Water Management Based on the rainfall intensity of the plant area, storm water drainage system will be designed. Strom water drainage system consists of well-designed network of open surface drains with check dams at appropriate distances to improve the infiltration efficiency of the rain water into ground so that all the storm water is efficiently drained off without any water logging. 4.2.11Rain Water Harvesting System Project Management will make proper utilization of rainwater by harvesting by appropriate rain water-harvesting mechanism. Roof water will be collected by adopting proper treatment (O&G Trap), the collected water will be used for various uses. Rainwater from surface areas will be harvested by construction of check dams all along the storm water drainage network at a definite pitch. Necessary expert advice has been obtained in this regard. Artificial recharge measures like rain water-harvesting helps in reducing the urban run-off, decrease pollution of ground water and improve the ground water table, which augments the yields of, bore wells. 4.2.12 Impact of the Transportation Loading and unloading areas of municipal waste material and finished products are closed/ covered in order to decrease the air pollution in the nearby areas and hazards that it might cause due to the dust.. 4.2.13 Noise Environment The Major source of noise in proposed project will be from loading and unloading of MSW activities, DG set, Processing Blocks etc. Adequate measures for noise control, at the design stage shall be followed in terms of
• Noise level specification of the various Equipments as per the Occupational Safety and Health Association (OSHA) standards.
Draft EIA Report for Proposed IMSWMF, Kinduwal (V), Baddi (T), Solan (D), Himachal Pradesh
M/s. Baddi Barotiwala Nalagarh Development Authority EPIP Phase I, Jharmajri, Baddi, Solan (D),
Himachal Pradesh
Ramky Enviro Engineers Ltd, Hyderabad
Chapter 4.16
• Erecting suitable enclosures to minimize the impact of high noise generating sources. • As a whole the overall noise levels in and around the facility shall be kept well within
the standards and exposure will be minimized to the employees by providing the PPE. No major impact on Noise environment is envisaged.
4.2.14 Prediction of Impacts on Land Environment Environmental Impacts on land environment have been classified primarily into two broad aspects, i.e. direct impacts on the soil and land in the area and impacts on the flora and fauna of the area. Land environment in the area has potential for contamination due to wastewater discharges directly on to the land and from impacts arising out of municipal solid waste stored on to the land. The leachate is treated in the treatment plant and the treated water will be used back in the windrow process and domestic waste after septic tanks/soak pit sent to green belt development. As a result of this there is no contamination of the soil due to the wastewater generated and hence the impacts due to the proposed facility on the land environment are negligible. To address the impacts on flora and fauna, it has been observed that there are no endangered species in the project area and green belt will be developed along the boundary and adjacent to roads. Under CSR activities adjacent open lands, parks, etc will be improved by plantation. 4.2.15 Predicted impacts of the Landfill The project has proposed secured scientific landfill which comprises Govt. of India Regulations and MSW Rules (2000) with containment measures,
• Composite bottom liner to prevent Leachate percolation • Landfill gas management system • Rodent controlled • Dust control • Cockroaches, misquotes, House Flys control
There shall be no loss of carbon sequestration on account of the proposed activity since the area is almost barren. Development of a thick greenbelt all long the boundary of the site will more than compensate for the loss. As there are no rare or endangered or endemic or threatened (REET) species, the proposed project will not pose any problem to any REET species. Hence, the impact of the project on biota is negligible. The project improves the land environment due to arrest of plastic blowing into the surrounding agricultural lands. 4.2.16 Impacts on the Community Public Safety A number of activities that are likely to be carried out in the facility that have significant adverse impacts on the public safety are the wastewater discharges. With the

Draft EIA Report for Proposed IMSWMF, Kinduwal (V), Baddi (T), Solan (D), Himachal Pradesh
M/s. Baddi Barotiwala Nalagarh Development Authority EPIP Phase I, Jharmajri, Baddi, Solan (D),
Himachal Pradesh
Ramky Enviro Engineers Ltd, Hyderabad
Chapter 4.17
implementation of a strong environmental management plan, the communities residing near the project site are unlikely to be exposed to any long-term hazards. Aesthetics The project site is located away from the settlements and proposed greenbelt around the site, as a part of the environmental management plan will help in improving the aesthetics of the environment. 4.2.17 Impact on Ecology There is no wildlife sanctuary located within 10km radius of the project site. There are no known rare, endangered or ecologically significant animal and plant species. Except for a few wild species of plants and grasses and a few animals that are very commonly spotted in any rural environment, the study area does not have any endangered or endemic species of animals. Due to the development of green belt at the project vicinity the impact on the ecology will be minimal. 4.2.18 Impact on the Socio-Economics The proposed facility is likely to provide direct and indirect employment and likely to increase the socio-economic status of the villages in the study area especially that of Jawaharnagar village where the facility is being located. Due to proposed project the facilities for public transport, water supply telecommunications, education, public wealth etc are likely to improve.

Draft EIA Report for Proposed IMSWMF, Kinduwal (V), Baddi (T), Solan (D) Himachal Pradesh
M/s. Baddi Barotiwala Nalagarh Development Authority EPIP Phase I, Jharmajri, Baddi, Solan (D)
Himachal Pradesh
Ramky Enviro Engineers Ltd, Hyderabad
Chapter 5.1
CHAPTER -5 ANALYSIS OF ALTERNATIVES 5.1 Introduction BBNDA is proposing to establish an IMSWMF in accordance to MSW Rules 2000 by providing Receiving facility, Compost Plant, Recycling Complex, Secured landfill etc., adjacent to proposed CETP where government of Himachal Pradesh has allotted the land hence no alternative lands were considered. 5.1.1 Alternative Sites Various alternative sites were identified and their merits & demerits considered as per their suitability as a proposed site for te IMSWM facility. Disposal site at kenduwal The site is situated in village Kenduwal, adjoining to the site of ‘Proposed Common Effluent Treatment Plant’ and have sufficient area of 42 bighas (31600 sq. m). This site lies nearer to the Baddi and most of the Industrial areas, from where maximum waste will be generated. Thus will be economical in cost and also will help in improving environment by less consumption of fuel for transportation of waste. 1. Site Location---Located at Village Kenduwal in Baddi 2. Habitation 4-5 km from the site 500m from the site 3. Ground water Table--16 m below GL 4. Critical Habitat Area-- not present 5. Wet lands ---not present land 6. Highway/road 2.5 km from main road km of main road for easy accessibility 7. Public parks --not present 8. Proximity to Lake/pond/river--Near to River sirsa Around 500 m Disposal site at Bhatolikalan The site identified for Baddi MC area is the existing open dumping site located at Bhatolikalan, which is at a distance of 4 km from the Baddi town. The site is situated on the bank of Balad Nalla and near to Industrial area and village Bhatoli kalan and Jharmajri. Not suitable due to proximity to habitation and insufficient area ( 4000 sq. m)
5

Draft EIA Report for Proposed IMSWMF, Kinduwal (V), Baddi (T), Solan (D) Himachal Pradesh
M/s. Baddi Barotiwala Nalagarh Development Authority EPIP Phase I, Jharmajri, Baddi, Solan (D)
Himachal Pradesh
Ramky Enviro Engineers Ltd, Hyderabad
Chapter 5.2
Disposal site at Nalagarh As stated, earlier Nalagarh MC has already identified a site for their waste processing facility. This site is located adjacent to the existing dumping site and is around 10 km from Nalagarh town adjacent to the river. The area transferred to MC Nalagarh is only 5 Bigha (4000 sq. m.). This site is also located near the Sirsa river. The Local Gram Panchayat objected to the transfer of additional land. Moreover this site will be about 25 kms from Baddi, which is generating the more waste. Disposal site at Dabotta The site identified by BBNDA for developing the waste treatment and disposal facility is located approximately 30 KM from Baddi and 10 Km from Nalagarh area near village Dabotta. Location and Area The site is approximately 1.1 km from national highway NH21 A from Nalagarh to Bharatgarh. The total area of land available for developing the waste management facility is 4.823 acre (19500 sq. m) Site and Surroundings Adjacent to the site is the operating hazardous waste management facility of the region operated by M/s Shivalik Waste Management Ltd. The hazardous waste management facility was notified in March 2007 and is in operation since 2008. The hazardous waste facility comprise of waste pre-treatment and stabilisation unit, hazardous waste landfill and evaporator for leachate evaporation. The nearest habitation to the site is village Mazra approximately 1.5 km from the site. Hydrogeological The ground water table is expected to be located 10-12 m below ground level in the regions away from the river bed. Dabotta landfill is at a distance of more than 2-3 km from the river. The site is surrounded by the forest land on the three sides and Hazardous waste site on the 4th side. There is no independent approach to this site and the operators of the Hazardous waste processing facility have shown their reservation in providing the access through their site because of technical reason. As such more forest land is required to be diverted for approach road for this site , which will involve more time and expenditure also. Further the transportation cost of the municipal waste will increase considerably and long transportation leads will also add to the pollution in the environment

Draft EIA Report for Proposed IMSWMF, Kinduwal (V), Baddi (T), Solan (D) Himachal Pradesh
M/s. Baddi Barotiwala Nalagarh Development Authority EPIP Phase I, Jharmajri, Baddi, Solan (D)
Himachal Pradesh
Ramky Enviro Engineers Ltd, Hyderabad
Chapter 5.3
Conclusion After considering the merits and demerits of all four sites, we propose to have a common facility at Village Kainduwal in Baddi due to following reasons:
1. The waste generated in Baddi MC Area is more than the waste generated in Nalagarh MC Area,
2. The transportation cost for transferring waste from Nalagarh to Baddi will be completed in one-two trips in a day.
3. The proposal of having a independent processing facility with sanitary landfill for Nalagarh is not feasible.
4. 4.The site is located adjoining to the site of CETP. 5. There is no habitation nearby
5.1.2 Compliance of the Selected Site with Site Selection Criteria In order to help the concerned authorities and the entrepreneurs, MOEF, GOI has framed certain broad guidelines for siting an industry. The broad environmental guidelines recommended for siting of industries to ensure optimum use of natural and man-made resources in sustainable manner with minimal depletion, degradation and or destruction of environment are given in Table 5.1. The proposed IMSWMF site is meeting most of the conditions given in site selection criteria of MOEF, New Delhi, however shivalik hills are in East side around 10 km and Ramshehar Fort in North at around 17km.
Table 5.1
Site Selection Criteria – Areas to be avoided Particulars Conditions Proposed Site Land Procurement Sufficient land to meet the demand
of greenbelt development, reuse of treated water, storing of solid waste before final disposal.
2.42 Ha (6 Acres) land available
Coastal areas At least 500 m from high tide line None in study area Estuaries At least 200 m away from the
estuary boundaries None in study area
Flood plains of the Riverine system
At least 500 m from flood plain or modified flood plain, or by flood control systems
Sirsa River 0.1km West
Transport / communications system
At least 500 m from highway and railway
NH 21 A – Nalagarh to Pinjore 0.75km East
Major settlements At least 25 km from the project growth boundary of the settlement
Shimla is around 40 km NE
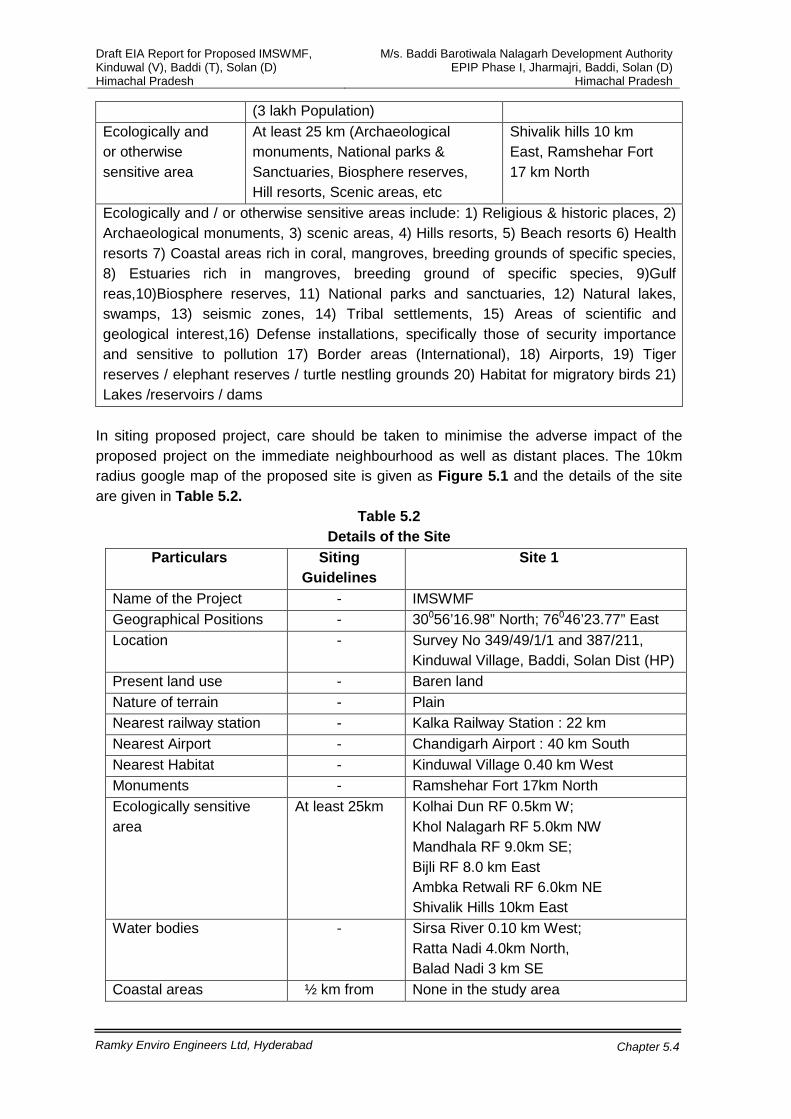
Draft EIA Report for Proposed IMSWMF, Kinduwal (V), Baddi (T), Solan (D) Himachal Pradesh
M/s. Baddi Barotiwala Nalagarh Development Authority EPIP Phase I, Jharmajri, Baddi, Solan (D)
Himachal Pradesh
Ramky Enviro Engineers Ltd, Hyderabad
Chapter 5.4
(3 lakh Population) Ecologically and or otherwise sensitive area
At least 25 km (Archaeological monuments, National parks & Sanctuaries, Biosphere reserves, Hill resorts, Scenic areas, etc
Shivalik hills 10 km East, Ramshehar Fort 17 km North
Ecologically and / or otherwise sensitive areas include: 1) Religious & historic places, 2) Archaeological monuments, 3) scenic areas, 4) Hills resorts, 5) Beach resorts 6) Health resorts 7) Coastal areas rich in coral, mangroves, breeding grounds of specific species, 8) Estuaries rich in mangroves, breeding ground of specific species, 9)Gulf reas,10)Biosphere reserves, 11) National parks and sanctuaries, 12) Natural lakes, swamps, 13) seismic zones, 14) Tribal settlements, 15) Areas of scientific and geological interest,16) Defense installations, specifically those of security importance and sensitive to pollution 17) Border areas (International), 18) Airports, 19) Tiger reserves / elephant reserves / turtle nestling grounds 20) Habitat for migratory birds 21) Lakes /reservoirs / dams
In siting proposed project, care should be taken to minimise the adverse impact of the proposed project on the immediate neighbourhood as well as distant places. The 10km radius google map of the proposed site is given as Figure 5.1 and the details of the site are given in Table 5.2.
Table 5.2 Details of the Site
Particulars Siting Guidelines
Site 1
Name of the Project - IMSWMF Geographical Positions - 30056’16.98” North; 76046’23.77” East Location - Survey No 349/49/1/1 and 387/211,
Kinduwal Village, Baddi, Solan Dist (HP) Present land use - Baren land Nature of terrain - Plain Nearest railway station - Kalka Railway Station : 22 km Nearest Airport - Chandigarh Airport : 40 km South Nearest Habitat - Kinduwal Village 0.40 km West Monuments - Ramshehar Fort 17km North Ecologically sensitive area
At least 25km Kolhai Dun RF 0.5km W; Khol Nalagarh RF 5.0km NW Mandhala RF 9.0km SE; Bijli RF 8.0 km East Ambka Retwali RF 6.0km NE Shivalik Hills 10km East
Water bodies - Sirsa River 0.10 km West; Ratta Nadi 4.0km North, Balad Nadi 3 km SE
Coastal areas ½ km from None in the study area

Draft EIA Report for Proposed IMSWMF, Kinduwal (V), Baddi (T), Solan (D) Himachal Pradesh
M/s. Baddi Barotiwala Nalagarh Development Authority EPIP Phase I, Jharmajri, Baddi, Solan (D)
Himachal Pradesh
Ramky Enviro Engineers Ltd, Hyderabad
Chapter 5.5
Particulars Siting Guidelines
Site 1
high tide line Flood plain of Riverine system
½ km from flood plain
Sirsa River 0.10 km West
Transport & Communication
½ km from highway &
railway
NH-21A: Nalagarh to Pinjore –0.75km East
R & R - No R & R is required

Draft EIA Report for Proposed IMSWMF, Kinduwal (V), Baddi (T), Solan (D) Himachal Pradesh
M/s. Baddi Barotiwala Nalagarh Development Authority EPIP Phase I, Jharmajri, Baddi, Solan (D)
Himachal Pradesh
Ramky Enviro Engineers Ltd, Hyderabad
Chapter 5.6
Figure 5.1 Goole map of the proposed Site (10km)
Draft EIA Report for Proposed IMSWMF, Kinduwal (V), Baddi (T), Solan (D) Himachal Pradesh
M/s. Baddi Barotiwala Nalagarh Development Authority EPIP Phase I, Jharmajri, Baddi, Solan (D)
Himachal Pradesh
Ramky Enviro Engineers Ltd, Hyderabad
Chapter 5.7
5.2Technological Aspects Considering India’s diversity in-respect of cultural, socio-political, geographical, meteorological and economical aspects; it is unlikely that a single model for MSW management is acceptable for application across the country. While the location specific considerations largely influence the choice of applicable technology, there are generic factors which are more or less in common. The MSW consists of biodegradable and non biodegradable waste. Non-biodegradable portion is mostly occupied by inert material but also include paper, plastics, glass etc., which have either recycling potential. Therefore, an integrated solution include, proper segregation of the MSW at the source, as promoted in few pockets i.e. either at the source (preferable) or at the transfer stations and processing centre, the organic portion can be sent for composting for use as a soil conditioner/bio fertilizer and the inerts after recovery of valued portion (plastic, glass, paper etc.) can be sent for landfilling. However, at all the locations, there may not be a demand for the compost material or the acceptability is less, in such situations, the intrinsic energy value of the MSW can be tapped by converting it into boiler chargeable pellets (refuse derived fuel (RDF)). There are also well controlled direct incineration facilities available in developed countries, where the heat is recovered in the form of hot water networking, steam supply to the nearby industries etc. As such, when the composting opportunity is limited, one can explore bio-methanation plants, having least power consumption and the degradable portion could be converted into methane, which can then be converted into energy. While there are number of technological options, each has its distinct merits and limitations, which guide us to choose appropriate technology for a given local condition. Despite the best efforts to reduce, reuse and recycle, there will always be residual waste requiring disposal. The alternative treatment and disposal technologies are:
• Recycle/Reuse • Composting • Anaerobic digestion / Biomethanation • Pelletisation / Refuse Derived Fuel (RDF) • Pyrolysis and Gasification • Incineration • Landfills - Sanitary Landfill/Bioreactor landfill/Secured landfill (for inert waste)
Among the various treatment (or waste diversion) and disposal options as mentioned above, MoEF has notified composting (windrow composting, vermi composting), anaerobic digestion, incineration, pelletization and landfill technologies and has given relevant standards for compost quality, leachate disposal, incineration operations and emissions and landfill specifications.

Draft EIA Report for Proposed IMSWMF, Kinduwal (V), Baddi (T), Solan (D) Himachal Pradesh
M/s. Baddi Barotiwala Nalagarh Development Authority EPIP Phase I, Jharmajri, Baddi, Solan (D)
Himachal Pradesh
Ramky Enviro Engineers Ltd, Hyderabad
Chapter 5.8
5.2.1Landfills Landfills are vital components of any well designed MSW management system. They are ultimate repositories of a city’s MSW after all other MSW management options have been exercised. In many cases, landfill is the only MSW management options available after the MSW is collected. The safe and effective operation of landfill depends on sound planning, administration, and management of the entire MSW management system. There are three types of landfills viz, Sanitary landfill, Bioreactor landfill, Secured landfill (for inert waste). Sanitary landfill is the process of dumping of solid waste in a scientifically designed land area spreading waste in thin layers, compacting to the smallest volume and covering with soil on daily basis. Sanitary landfill would be good option for disposal of existing/mixed waste which cannot be segregated. Landfill gas such as methane from the anaerobic conditions prevailing in the landfill due to the presence of organic material in mixed waste can be recovered. The facilities at the sanitary landfill include leachate collection and treatment system, storm water management system avoiding ground and surface water pollution. Bioreactor landfill is one idea that has gained significant attention now days. A bioreactor landfill is a sanitary landfill that uses enhanced microbiological processes to transform and stabilize the readily and moderately decomposable organic waste constituents within 5 to 10 years of bioreactor process implementation. The bioreactor landfill significantly increases the extent of organic waste decomposition, conversion rates and process effectiveness over what would otherwise occur within the landfill. The “bioreactor landfill” provides control and process optimization, primarily through the addition of leachate or other liquid amendments, the addition of sewage sludge or other amendments, temperature control, and nutrient supplementation. Beyond that, bioreactor landfill operation may involve the addition of air. Based on waste biodegradation mechanisms, different kinds of “bioreactor landfills” including anaerobic bioreactors, aerobic bioreactors, and aerobic-anaerobic (hybrid) bioreactors have been constructed and operated worldwide. Secured landfill is a carefully engineered depression in the ground (or built on top of the ground) into which wastes are dumped to avoid pollution to the surrounding environment. Secured MSW landfill should be restricted to non-biodegradable, inert waste and other waste not suitable for recycling or for biological processing. The important features that should be considered before designing a landfill are given in Schedule III - “Specifications for Landfill sites” of MSW rules 2000. These include:
• Site Selection • Facilities at the site • Specifications for land filling • Pollution prevention • Water quality monitoring • Plantation at landfill site

Draft EIA Report for Proposed IMSWMF, Kinduwal (V), Baddi (T), Solan (D) Himachal Pradesh
M/s. Baddi Barotiwala Nalagarh Development Authority EPIP Phase I, Jharmajri, Baddi, Solan (D)
Himachal Pradesh
Ramky Enviro Engineers Ltd, Hyderabad
Chapter 5.9
• Closure of landfill site and post care • Special provisions for hilly areas
In the proposed project the municipal solid waste is segregated a into compostable matter and recyclables and value added products are generated for further use. As only inerts are left at the end secured landfill is proposed. 5.2.2 Composting Composting is an organic method of producing compost manure by decomposition and stabilization of organic matter. Composting process is commonly used method and results in the production of stable compost product reduced in size (when compared to initial size) and free from offensive odors. Compost is particularly useful as organic manure which contains plant nutrients (nitrogen, phosphorous and potassium) as well as micro nutrients which can be utilized for the growth of plants. Composting can be carried out in two ways - aerobically (with the presence of oxygen) or anaerobically (without the presence of oxygen) or vermin-composting or by any other biological mechanism. By controlling some of the composting influencing factors, natural composting process could be accelerated. These influencing factors also have impact on quality of compost produced. Some of the important factors in the composting process are temperature, C/N ratio, phosphorous, sulphur, moisture, particle size, oxygen flow, etc.
• Temperature: Optimum temperature for aerobic composting - 70ºC. High temperature results in increase rate of biological activity and faster stabilization of the material. Very high temperature results Nitrogen loss. High temperatures ensure destruction of pathogens and parasites.
• C/N ratio: Optimum ratio is 30. To bring down the ratio sewage and sludge will be added. To increase the ratio straw, sawdust, paper will be added.
• Phosphorous: One of the essential nutrients for plant growth and determines the quality of compost. Phosphorous concentration might increase as composting proceeds.
• Sulphur: Presence of Sulphur in sufficient quantities can lead to the production of volatile, odorous compounds. The major sources of Sulphur are two amino acids (cysteine and methionine). Under well-aerated conditions, the sulfides are oxidized to sulfates, but under anaerobic conditions, they are converted to volatile organic sulfides or to H2S, leading to a bad odor. Some compounds like carbon disulfide, carbonyl sulfide, methyl mercaptum, diethyl sulfide, dimethyl sulfide, and dimethyl disulfide might also lead to bad odors.
• Moisture: Optimum 50 to 60%, very high moisture content will result anaerobic condition. Higher moisture content is essential for mechanical operated system and the waste contains high percentage of fibrous material.
• Oxygen and aeration: In case of aerobic process, helps to decompose the organic matter at a faster rate. However, care must be taken not to provide more oxygen which might dry the system and slow down the composting process.
• Particle size: Smaller particles produce homogenous particle size which helps to maintain optimum temperatures. But too fine may not allow air to flow into the piles

Draft EIA Report for Proposed IMSWMF, Kinduwal (V), Baddi (T), Solan (D) Himachal Pradesh
M/s. Baddi Barotiwala Nalagarh Development Authority EPIP Phase I, Jharmajri, Baddi, Solan (D)
Himachal Pradesh
Ramky Enviro Engineers Ltd, Hyderabad
Chapter 5.10
There are various methods of composting and the approach in selecting the appropriate method of composting depends on time to complete composting, the material and volume to be decomposed, space available, the availability of resources (labour, finances, etc.) and the quality of finished product required. In general composting process consists of four decomposition phases when a suitable environment is provided: Mesophilic phase (I): In this phase slightly rotted material exists, in which mainly bacterial degradation of easily degradable substances takes place. The temperature rises up to 42oC. Thermophilic phase (II): In this phase fresh compost is produced where further degradation of easily degradable materials as well as degradation of cellulose, caused by thermophilic fungi and bacteria. The temperature in this phase rises up to 65o
Windrow composting is proposed in this project as it is widely used in India at a large scale as the climatic condition is arid. Therefore, in areas where higher ambient temperatures are available, composting in open triangular or trapezoidal windrows is
C which causes self limitation or decrease in reproduction of micro organisms.
Cooling phase (III): Finished compost is produced in this phase, where degradation of cellulose by fungi and bacteria, and formation of humus substances takes place. A decrease in microbial activity and temperature occur in this phase. Maturing phase (IV): Matured compost is produced in this phase, with further decrease of temperature to the surrounding temperature. Very low microbial activity with further formation of humus substances and stabilization take place. Aerobic process needs high maintenance in monitoring air, moisture and high temperatures in the system. Some of the basic aerobic composting techniques are indore composting, windrow composting, vermi composting, in-vessel composting, etc. Aerobic composting of MSW is commonly carried out in windrows. Anaerobic composting is also called anaerobic digestion or bio-gasification. This technology is the biological conversion of biodegradable organic materials in the absence of oxygen at temperatures lower than 93°C. Therefore very slow working bacteria will be growing which does not require any air and the compost may take long period to break down. This breakdown process is carried out by anaerobic micro organisms that convert carbon-containing compounds to a biogas (primarily methane and carbon dioxide). A very small quantity of energy is released during this process and the temperature of the composting mass does not raise much. This is a reduction process and final product is subjected to minor oxidation when applied on land. The residue is a stabilized organic material that can be used as a soil amendment. Anaerobic composts may have awful smell. Anaerobic digestion is suitable for the bio-degradables, including food wastes, yard waste, animal wastes, and some paper fibers. Bangalore method is an example of anaerobic composting.

Draft EIA Report for Proposed IMSWMF, Kinduwal (V), Baddi (T), Solan (D) Himachal Pradesh
M/s. Baddi Barotiwala Nalagarh Development Authority EPIP Phase I, Jharmajri, Baddi, Solan (D)
Himachal Pradesh
Ramky Enviro Engineers Ltd, Hyderabad
Chapter 5.11
preferred. Windrow composting is the process of decomposing organic materials to form stabilized organic matter. It is defined as the controlled, heat dependent, microbiological process of decomposing organic materials into a biologically stable, humus-rich material. Compost is used in agriculture, horticulture, home gardening, land reclamation, wetland mitigation, and erosion prevention to help rebuild soil organic matter and to provide a good medium for plant growth. The major obstacles to this technology is the limited markets for compost used and environmental concerns about industrial or toxic wastes that may enter the waste stream and end up in the compost. Windrow area should be with an impermeable base made from concrete of compacted clay of 40 to 50 cm thick. The permeability co-efficient should be less than 10(-7) cm/sec. A slope of 1-2 % should be maintained in the base. The base should be circled with a lined drain for collection of leachate or surface runoff. Windrow composting is a two phase process. 5.2.3 Biomethanation Only for treatment of market waste, marriage halls, canteen waste etc in the proposed project biomethanation technology is proposed for which the capital investment is high. Biomethanation is the process of conversion of organic matter in the waste (liquid or solid) to biomethane (biogas) and manure by microbial action in the absence of air, known as “anaerobic digestion”. The solid waste and the slaughterhouse waste is first mixed with raw sewage and conveyed to the primary digester. Effluent from the primary digester is sent to the secondary digester after stabilization. The raw gas generated from the primary and the secondary digester is then sent to the gas storage/WTE plant. The excess effluent from the secondary digester will be re-circulated back to the primary digester for further generation of gas. The gas thus stored in the gas balloon is passed through a scrubber where gases like H2S and SO2 and moisture are removed from the gas. This clean gas is conveyed under pressure to the Power Plant to produce power. The excess sludge from the secondary digester is conveyed to the centrifuge to separate the liquid and solids for further disposal. 5.2.4 Refuse Derived Fuel Pellets are formed from the combustible portion of MSW. Pelletization initially involves segregation of waste into high and low calorific value materials and then shredded and compacted into pellets with the required bulk density and later can be dried to get the appropriate heat value. These pellets so produced have a calorific value of 4000 Kcal/kg of the product which is quite close to that of coal and therefore is a good substitute for coal, wood, etc. to RDF plant. Comparatively, pellets have advantages over coal and are clean, energy efficient, eco-friendly fuel for coal based industries, power generating industries. Additional advantage of Pellets is easy storage and transportation.

Draft EIA Report for Proposed IMSWMF, Kinduwal (V), Baddi (T), Solan (D) Himachal Pradesh
M/s. Baddi Barotiwala Nalagarh Development Authority EPIP Phase I, Jharmajri, Baddi, Solan (D)
Himachal Pradesh
Ramky Enviro Engineers Ltd, Hyderabad
Chapter 5.12
RDF can be produced from MSW through a sequence of processes consisting of: • Separation at source • Sorting or mechanical separation • Size reduction (shredding, chipping and milling) • Blending • Drying and pelletizing • Packaging • Storage
The MSW is initially dried to reduce its moisture content. It is then screened to remove inerts such as sand, silt and soil. It is then processed to remove and separate incombustible materials such as glass, metal and other contraries and wet organic matter such as garden and food waste containing high moisture and high ash material. Sometimes the waste is further subjected to air separation and then shredded. The reduced size material can be directly used in boilers on site. If the material is to be used offsite, it is usually densified into pellets and then transported to the place where it is to be used. RDF can be burned for fuel by itself or co-fired with other fuels. Previously, few RDF plants were setup with coal fired boilers when RDF was used along with coal but now due to strict emission standards it is burnt in dedicated boilers designed and built specifically for RDF. Some of the options of using RDF from MSW to energy include:
• Co-combustion in coal fired boilers • Co-incineration in cement kilns • Co-gasification with coal or biomass
5.2.5 Incineration Incineration is a process of controlled combustion for burning of waste and residue containing combustible material. The emissions from incineration of solid waste are of health concern, and the waste for incineration should be free from chlorinated plastics, hence this process is not proposed in the proposed project. 5.2.6 Pyrolysis and Gasification Pyrolysis is a thermal process where organic materials present in the waste are broken under pressure and at temperature greater than 496o
Gasification is the partial combustion of organic matter in the presence of restricted quantity of oxygen or air at high temperatures (than Pyrolysis). The gas so produced is
C in the absence of oxygen to become gas comprising small molecules (syngas), along with syngas, char and oil are also produced. The syngas burned in internal combustion engine generator sets or turbines to produce electricity.

Draft EIA Report for Proposed IMSWMF, Kinduwal (V), Baddi (T), Solan (D) Himachal Pradesh
M/s. Baddi Barotiwala Nalagarh Development Authority EPIP Phase I, Jharmajri, Baddi, Solan (D)
Himachal Pradesh
Ramky Enviro Engineers Ltd, Hyderabad
Chapter 5.13
producer gas. The producer gas is cleaned and burned in internal combustion (IC) engine generator sets or turbines to produce electricity. In developed countries, paper, plastics etc. form more than 50% of the waste resulting in a large proportion of gaseous as well as liquid products which have a heating value and can be easily used. However, the Indian MSW has a low projection of paper, plastics, etc. an hence its successful adoption is difficult. In developed countries a substantial proportion of the total cost is often spent on processing. Unfortunately, more than 80% of the total cost of MSW Management in India is spent on collection and transportation, and the expenditure on processing is meager. Hence Pyrolysis and gasification are not proposed in the present project. 5.2.7 Recycling / reuse Recycling refers to the collection, separation, processing, or use of materials that would otherwise become solid waste. The activities included under the term recycling are numerous, including the initial collection of materials; marketing those raw materials; producing products from those materials; and use of those products in the marketplace. Some of the materials from MSW that would be recycled are plastics, metals, paper, glass, rubber, rags, leather, etc. the recovery of the materials will reduce the need to use natural resources directly and may reduce emissions from extraction and processing of raw materials. On the other hand, there could be environmental or health effects from reprocessing materials which have been taken out of the waste stream. These could offset the benefits of recycling to some extent. In the proposed project for recycling and reuse of usable materials from solid waste a recycling complex is proposed and all the recycled items will be disposed to authorized recyclers and own recycling of collected materials are proposed for converting them into value added products. In the proposed project the municipal waste is first segregated into recyclable and compostable material. From recyclables the items like paper, plastic, rubber, metal, glass, cloths, etc are separated in the rest are sent directly to compost plant for composting followed by secured landfill for inerts.

Draft EIA Report for Proposed IMSWMF, Kinduwal (V), Baddi (T), Solan (D), Himachal Pradesh
M/s. Baddi Barotiwala Nalagarh Development Authority EPIP Phase I, Jharmajri, Baddi, Solan (D),
Himachal Pradesh
Ramky Enviro Engineers Ltd, Hyderabad
Chapter 6.1
CHAPTER -6 ENVIRONMENTAL MONITORING PROGRAM
6.0 Surveillance and Monitoring Plan Monitoring of the Municipal Solid Waste operations i.e. the physical environment and the public health in the vicinity of the Integrated Municipal Solid Waste Management Facility is an integral part to design, construction and operation of the facility. The proposed monitoring program for the proposed project has three interrelated objectives.
• To check implementation and management of the various aspects required for impact mitigation.
• To check how effective are the measures for mitigation and control of pollution. • In case of non compliance further measures for rectification.
6.1 Scope of Environmental Monitoring Program The main objective of environmental monitoring program is aimed such that there is not much of time lack between commencements of damage to environment mitigation measures to various environmental parameters that are being affected. The Environmental Monitoring Program involves the following.
• Planning a survey and sampling program for systematic data/information collection • Conducting survey and sampling program • Analysis of samples and data/information collected, and interpretation of data and
information • Preparation of reports for submitting to management and statutory authorities • Environmental monitoring is carried throughout project operation to detect changes in
the key environmental quality parameters, which can be attributed to the project. • The results of the monitoring program used to evaluate the following
a. Extent and severity of the environmental impacts against the predicted impacts; b. Performance of the environmental protection measures or compliance with
pertinent rules and regulations c. Trends in impacts and Overall effectiveness of the project EMP
Environmental monitoring program has been prepared for the proposed project for assessing the efficiency of implementation of Environment Management Plan and to take corrective measures in case of any degradation in the surrounding environment.
6

Draft EIA Report for Proposed IMSWMF, Kinduwal (V), Baddi (T), Solan (D), Himachal Pradesh
M/s. Baddi Barotiwala Nalagarh Development Authority EPIP Phase I, Jharmajri, Baddi, Solan (D),
Himachal Pradesh
Ramky Enviro Engineers Ltd, Hyderabad
Chapter 6.2
6.1.1Air Environment For the proposed project, the air emissions are from windrow process, DG sets and vehicular movement. DG set is proposed as standby to use during power failure for emergency needs using diesel as fuel and hence are not expected to contribute emissions to the environment on regular basis. Ambient air quality in and around the project site (nearby villages) will be monitored for important parameters 6.1.2 Noise Environment Monitoring of the noise levels and exposures is essential to assess the Environmental Management Plan implemented to reduce noise levels. A good quality integrated sound level meter and noise exposure meter may be procured for the same. Audiometric tests will be conducted periodically for the employees working close to the noise sources. Noise levels will be monitored within the project site on regular intervals. 6.1.3 Water Environment Leachate, domestic sewage, water from peizometers, nearby bore wells, nearby surface waters will be analyzed regularly for the parameters given below. They are as follows:
• pH & EC • Suspended Solids • Dissolved Solids • Oil and Grease • Chloride • Sulphide • COD and BOD • Nitrates • Phosphates
6.1.4 Land Environment The soil in the neighboring areas will be analyzed for the relevant parameters. The average canopy height of the greenbelt, number and types of plant species will be monitored. Air and noise pollution attenuation achieved by the greenbelt will also be evaluated. It would be ensured that trained and qualified staff supervises the monitoring of ambient air, stack gases, effluents, noise etc. to see that prescribed standards laid down are obtained. The post project monitoring schedule/plan is given in Table 6.1.

Draft EIA Report for Proposed IMSWMF, Kinduwal (V), Baddi (T), Solan (D), Himachal Pradesh
M/s. Baddi Barotiwala Nalagarh Development Authority EPIP Phase I, Jharmajri, Baddi, Solan (D),
Himachal Pradesh
Ramky Enviro Engineers Ltd, Hyderabad
Chapter 6.3
Table 6.1 Environmental Monitoring Plan
Environmental Component
Locations Frequency Parameters
Ambient Air Quality Nearby habitations, upwind, downwind, crosswind
Monthly once
PM10, PM2.5 SO2, NOx, CH4, CO, Ammonia, Odour
Stack Emissions DG Set Monthly once
SPM, SO2 and NOx
Noise Within site ( DG set, Compost yard, SLF area) and nearest habitation
Monthly once
Noise Levels
Ground water / surface waters
Piezometers around the landfill, groundwater & surface water from nearby villages
Monthly once
IS 10500:1991 drinking water parameters
Leachate Windrow, compost plant, Secured landfill,
Monthly once
SS, TDS, pH, BOD, COD, As, CN, Cl
Wastewater Septic tank/STP Monthly once
Landfill gas Landfill area Monthly once
Methane & CO2
Plantation Greenbelt Half yearly Survival of plants and replacement of immature plants
Compost Final product Monthly once
As, Cd, Cr, Cu, Pb, Hg, Ni, Zn, C/N ratio, pH
In order to comply with the environmental protection measures as suggested in the above sections, a budgetary provision for Environmental Protection is given in Table 6.2.
Table 6.2
Budget of Implementation of Environmental Management Plan S. No Particulars Capital
Cost (Rs) Lakhs
Recurring Cost (Rs)
Lakhs/annum 1 Air Pollution Control Systems
Water sprinklers, Water tanker, etc 5.0 0.50
2 LT collection system, holding tank, STP, etc 5.0 0.60 3 Gas collection, management, etc 2.5 0.20 4 Noise Control measures – Acoustic enclosures
for DG set, Noise barriers for pumps, boiler, 1.5 0.20

Draft EIA Report for Proposed IMSWMF, Kinduwal (V), Baddi (T), Solan (D), Himachal Pradesh
M/s. Baddi Barotiwala Nalagarh Development Authority EPIP Phase I, Jharmajri, Baddi, Solan (D),
Himachal Pradesh
Ramky Enviro Engineers Ltd, Hyderabad
Chapter 6.4
S. No Particulars Capital Cost (Rs)
Lakhs
Recurring Cost (Rs)
Lakhs/annum PPE, etc
5 Greenbelt development 2.0 0.50 6 Rainwater harvesting, storm water drains, 2.0 0.20 8 Ambient Air quality monitoring, Laboratory
equipments, etc 4.0 0.20
9 Third party monitoring, energy audit, environmental audit, training programs, etc
0 0.60
10 Construction of Embankment along Sirsa River 100m length
100 1.00
Total 122 4.00 Capital Cost of the project is Rs.970.00 Lakhs
6.2 Operations Monitoring Monitoring and auditing of the facility should be in conjunction with QA/QC procedures assist the operation of the facility by,
• Providing an early warning of potential liabilities. • Reducing operational costs • Training the staff and defining the responsibilities. • Facilitate adequate equipment and materials for proper handling of Municipal
Solid Waste. • Providing write up to-date procedures specifying operational methods. • Maintenance and calibration of the equipment both for operations and monitoring. • Retention of record
Regular monitoring of the various components of the physical environment is planned during the operations period of the facility and also during the post-closure period.
6.3 Public Health Monitoring The value of Public Health studies in seeking to establish whether or not a site or facility has caused significant adverse health effects is well known. In this situation the results form a public health study may not fulfill the primary objective of such a program, which is to detect health changes before the manifestation of adverse health effects. However, three-stage health-monitoring program is proposed.
• Monitor the health of workers within the project site to identify adverse health effects, and
• Periodically obtain feedback from local doctors regarding any potential indicators of adverse health effects due to environmental cause in the communities surrounding, and particularly down-stream of the landfill.
• By organizing health camps on a regular basis.

Draft EIA Report for Proposed IMSWMF, Kinduwal (V), Baddi (T), Solan (D), Himachal Pradesh
M/s. Baddi Barotiwala Nalagarh Development Authority EPIP Phase I, Jharmajri, Baddi, Solan (D),
Himachal Pradesh
Ramky Enviro Engineers Ltd, Hyderabad
Chapter 6.5
6.4 Post closure Monitoring Post-closure monitoring of the landfill will be done primarily as a compliance requirement in addition to social responsibility; this also provides an early warning towards possible adverse impacts on human health and the environment. The post-closure program of monitoring for water quality in the ground water and surface waters down gradient of the landfill will be similar to that established for the operational stage of the facility. The frequency of monitoring may be varied from time to time depending on changing circumstances. There is no need for the post-closure monitoring of air quality, noise or visual effects during the post-closure period however this need will be reviewed periodically and should any aspects warrant further monitoring they will be included in the program.

Draft EIA Report for Proposed IMSWMF, Kinduwal (V), Baddi (T), Solan (D), Himachal Pradesh
M/s. Baddi Barotiwala Nalagarh Development Authority EPIP Phase I, Jharmajri, Baddi, Solan (D),
Himachal Pradesh
Ramky Enviro Engineers Ltd, Hyderabad
Chapter 7.1
CHAPTER -7 ADDITIONAL STUDIES
7.1 Risk Assessment The principal objective of the risk assessment study is to identify and quantify the major hazards and the risk associated with various operations of the proposed project, which may lead to emergency consequences (disasters) affecting the public safety and health. Based on this information, an emergency preparedness plan is to be prepared to mitigate the consequences. The approach involves hazards identification, hazards assessment and evaluation, developing Disaster Management Plan (DMP). 7.2 Major Hazardous The major hazardous anticipated in the proposed project are illustrated below.
• Hazardous pertaining to fires in project/plant area • Fire in diesel storage areas, garbage storage areas and disposal areas • Natural disasters viz. Earthquakes, flooding, etc • Electrical accidents • Flooding from man-made causes
7.3 Disaster Management Plan (DMP) Emergency prevention through good design, operation, maintenance and inspection are essential to reduce the probability of occurrence and consequential effect of such eventualities. The overall objective of the DMP/Emergency Response Plan (ERP) is to make use of the combined resources at the site and outside services to achieve the following.
• Localize the emergency on property and people • Minimize effects on property and people • Effective rescue and medical treatment • Evacuation.
7.4 Hazardous Control Measures 7.4.1Fires To increase the level of safety in compost yard and buildings, installation of smoke alarms or automatic fire detection /alarm systems will be proposed at strategic locations as an early warning of fire to the occupants.
7

Draft EIA Report for Proposed IMSWMF, Kinduwal (V), Baddi (T), Solan (D), Himachal Pradesh
M/s. Baddi Barotiwala Nalagarh Development Authority EPIP Phase I, Jharmajri, Baddi, Solan (D),
Himachal Pradesh
Ramky Enviro Engineers Ltd, Hyderabad
Chapter 7.2
To prevent fire mishaps and to manage the emergency situation during fire in the proposed project the following activities and precautions are proposed.
• Emergency evacuation plan is important for all projects, and the same will be prepared as per Fire & Safety rules.
• Regular mock drills will be carried out to create awareness on procedures to be followed in times of emergency situation/evacuation
• It will be advised to keep oxygen cylinders, medical kits and masks to prevent smoke inhalation especially for those with respiratory disorders for whom smoke inhalation can be very dangerous.
• Plant manager will be advised to ensure that the fire fighting equipments are in good working conditions.
• The plant will be provided with sufficient fire fighting gadgets (water, soil, cylinders, etc)
Simple steps to be followed during emergency are as follows. Call the fire rescue department: During fire in plant, leave the premises by nearest available exit. Call fire department and do not assume anyone else has called the fire department. If your cloth catches fire, do not get panic or run, stop, drop and roll. Cover your nose and mouth with a wet clean cloth: Stay calm cover your nose and mouth with a wet, clean cloth to prevent smoke inhalation injury and choking. Never jump off or attempt to climb down the side of a tall structures as it will mean certain death. Do not run: During a fire, smoke containing poisonous gases such as CO tends to rise up. When you run in a smoke filled room, you tend to inhale the smoke faster. CO dulls the senses and prevents clear thinking, leading to panic. To prevent being asphyxiated, dip tissues or cloth in water and cover your noise with it. Head-count of the occupants: During an emergency, make good use of the evacuation procedure and help each other to reach out of plant/building safely. Ensure nobody is left behind by doing a head-count of occupants. Visitors should read and understand the evacuation plan before going into the plant/building area and ensure their safety. 7.4.2 Natural Disasters Disasters occur without notice. Most disasters are natural such as earthquake, floods, hurricanes, sandstorms, landslides, tsunamis and volcanoes. We have no way of stopping them, but we can learn to deal with the difficult situations that arise due to them. During disasters like floods, fire, earth quake, landslides, rescue beings at site. Even before external help arrives, people affected by the disasters help each other.
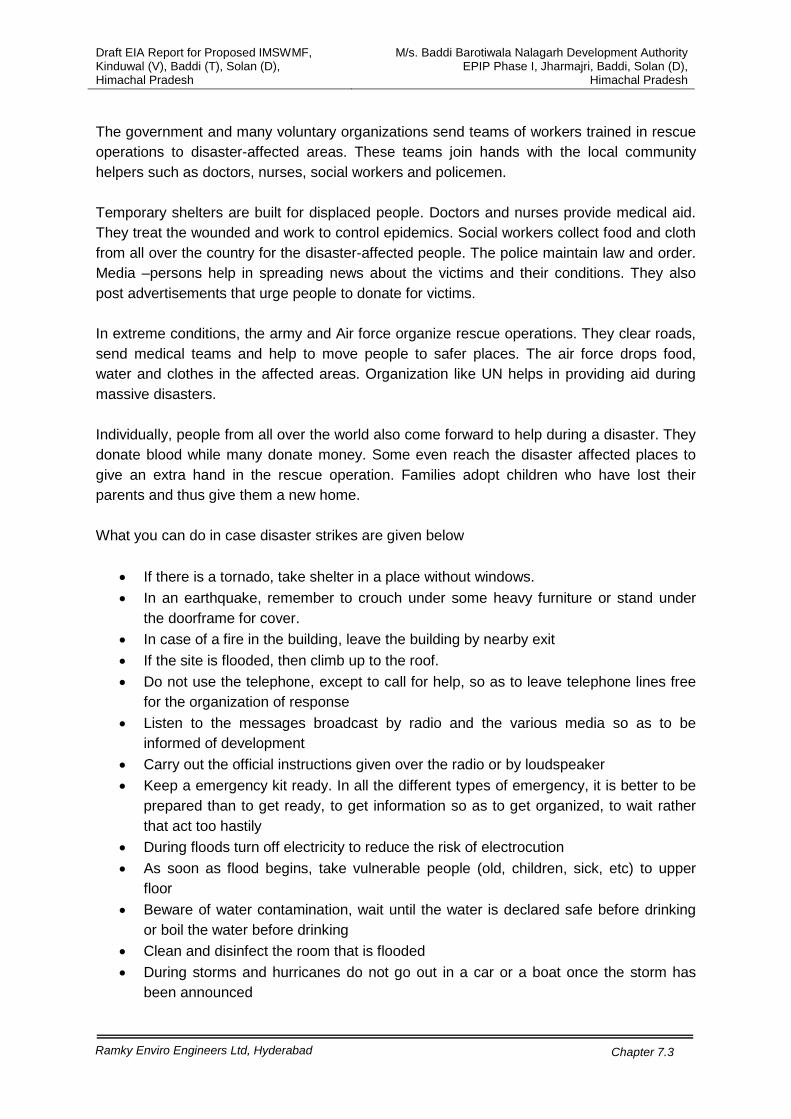
Draft EIA Report for Proposed IMSWMF, Kinduwal (V), Baddi (T), Solan (D), Himachal Pradesh
M/s. Baddi Barotiwala Nalagarh Development Authority EPIP Phase I, Jharmajri, Baddi, Solan (D),
Himachal Pradesh
Ramky Enviro Engineers Ltd, Hyderabad
Chapter 7.3
The government and many voluntary organizations send teams of workers trained in rescue operations to disaster-affected areas. These teams join hands with the local community helpers such as doctors, nurses, social workers and policemen. Temporary shelters are built for displaced people. Doctors and nurses provide medical aid. They treat the wounded and work to control epidemics. Social workers collect food and cloth from all over the country for the disaster-affected people. The police maintain law and order. Media –persons help in spreading news about the victims and their conditions. They also post advertisements that urge people to donate for victims. In extreme conditions, the army and Air force organize rescue operations. They clear roads, send medical teams and help to move people to safer places. The air force drops food, water and clothes in the affected areas. Organization like UN helps in providing aid during massive disasters. Individually, people from all over the world also come forward to help during a disaster. They donate blood while many donate money. Some even reach the disaster affected places to give an extra hand in the rescue operation. Families adopt children who have lost their parents and thus give them a new home. What you can do in case disaster strikes are given below
• If there is a tornado, take shelter in a place without windows. • In an earthquake, remember to crouch under some heavy furniture or stand under
the doorframe for cover. • In case of a fire in the building, leave the building by nearby exit • If the site is flooded, then climb up to the roof. • Do not use the telephone, except to call for help, so as to leave telephone lines free
for the organization of response • Listen to the messages broadcast by radio and the various media so as to be
informed of development • Carry out the official instructions given over the radio or by loudspeaker • Keep a emergency kit ready. In all the different types of emergency, it is better to be
prepared than to get ready, to get information so as to get organized, to wait rather that act too hastily
• During floods turn off electricity to reduce the risk of electrocution • As soon as flood begins, take vulnerable people (old, children, sick, etc) to upper
floor • Beware of water contamination, wait until the water is declared safe before drinking
or boil the water before drinking • Clean and disinfect the room that is flooded • During storms and hurricanes do not go out in a car or a boat once the storm has
been announced

Draft EIA Report for Proposed IMSWMF, Kinduwal (V), Baddi (T), Solan (D), Himachal Pradesh
M/s. Baddi Barotiwala Nalagarh Development Authority EPIP Phase I, Jharmajri, Baddi, Solan (D),
Himachal Pradesh
Ramky Enviro Engineers Ltd, Hyderabad
Chapter 7.4
• If caught outside in a storm, take refuge as quickly as possible in shelter (never under a tree), if there is no shelter, lie down flat in a ditch.
• In a thunderstorm keep away from doors, windows, and electrical conductors, unplug electrical appliances and aerials. Do not use any electrical appliances or the telephone
• During earthquake keep calm, do not get panic, People who are indoors should stay there but move to the central part of the building, people who are outside should stay there, keeping away from buildings to avoid collapsing walls and away from electrical cables. Anyone in a vehicle should park it, keeping away from bridges and buildings
• During spread of clouds of toxic fumes, close doors and windows, seal any cracks or gaps around windows and doors with adhesive tape. Organize a reserve of water (by filling wash basins, baths, etc. Turn off ventilators and air conditioners.
7.4.3 Electrical Accidents
Electrical hazards can cause burns, shocks, and electrocution which can lead to serious injury and even death. When dealing with potentially serious electrical hazards, stop and think! Instead of taking a chance and risking your personal safety, call trained professionals to handle problems. Many times people prefer to take electrical matters into their own hands. Other small aspects of electrical repair in a business setting may be taken care of without needing professional service technicians. If you do decide to take matters into your own hands, safety precautions can avoid injuries and other losses. 7.4.3.1 Prevention of Electrical Accidents Flexible cords connected to appliance should be wired to confirm to the international colour code. Colour of the insulation on the wire are
• Brown represents live wire, • Blue represents neutral wire and • Green/yellow stripes represent earth wire.
What you should look for when selecting an electrical appliance are given below
a. The appliance should be suitable for operation on local electrical supply of 240 volts
AC and frequency of 50 Hz. b. The appliance should preferably be tested and certified by a national or reputed
standards testing authority c. Look for certified plugs on the flexible cords connected to the appliances. If the
appliance is double insulated and has a 2-pin plug, then it should be fitted with a suitable certified plug.

Draft EIA Report for Proposed IMSWMF, Kinduwal (V), Baddi (T), Solan (D), Himachal Pradesh
M/s. Baddi Barotiwala Nalagarh Development Authority EPIP Phase I, Jharmajri, Baddi, Solan (D),
Himachal Pradesh
Ramky Enviro Engineers Ltd, Hyderabad
Chapter 7.5
d. An essential formality when buying any appliances is a duly completed guarantee card with the dealer's/retailer's official stamp and details of the appliance (serial number, etc.).
Safety precautions to be taken when using electrical appliances
a. Avoid using handheld appliances when your hand and/or body is wet. b. Do not use or leave appliances where liquid can splash onto them. c. Flexible cords connecting the appliance and the plug should be in good condition, if
the cord is frayed, chaffed, cut or melted, have the entire cord replaced by a competent person.
d. Check accessories such as plugs attached to appliances for cracks and burnt marks and have them replaced. If undue overheating occurs or burnt marks appear in any electrical appliance, have it checked
Some common causes of electrical accidents in the house
a. Faulty wiring : This usually occurs when unauthorised extension or rewiring is done
by unqualified persons. Some of the usual faults are the omission of earth wires and the reversing of the live and neutral wires. Without an earth wire, the exposed metal parts of appliances may deliver a lethal shock to the user when a fault develops.
b. Improper flexible cords : This can be caused by connecting the flexible cord wrongly to the plug. In the case of appliances which have exposed metallic parts, a 2-core instead of a 3-core flexible cord is used. When the appliance is faulty, the exposed metal parts may become live and a fatal accident could result.
c. Faulty appliance : Attempts to repair faults in electrical appliances by people not trained to do so can result in accidental shock.
To prevent Electrical accidents, the following points should be kept in mind:
• All electrical wiring, rewiring or extension work must be carried out by licensed
electrical contractors. On completion, the contractors should test before electricity supply is connected.
• Repair of appliances and replacement of flexible cords should be carried out only by competent persons.
• To ensure electrical safety in the house, a current-operated Earth Leakage Circuit Breaker (ELCB) or Residual Current Circuit Breaker (RCCB) set to operate at a very small leakage current is recommended. (This is usually marked 100mA or 0.1A on the label). In case of dangerous electrical leakage to earth, it should automatically cur off the supply of electricity.
• DO NOT repair your own electrical appliances. Engage the services of a competent technician.
• DO NOT use multi-way adaptors. Over loading can cause fire. One socket outlet is for one appliance only.

Draft EIA Report for Proposed IMSWMF, Kinduwal (V), Baddi (T), Solan (D), Himachal Pradesh
M/s. Baddi Barotiwala Nalagarh Development Authority EPIP Phase I, Jharmajri, Baddi, Solan (D),
Himachal Pradesh
Ramky Enviro Engineers Ltd, Hyderabad
Chapter 7.6
• DO NOT carry out wiring extension by yourself. Engage a licensed wiring contractor for the work.
• DO NOT use a two-way lighting adaptor for any extension. • DO NOT connect any electrical appliance to lighting outlets. A lighting outlet does not
have an earth wire to prevent danger. • ENSURE the switch is in "OFF" position before changing bulbs. • DO NOT make joints to lengthen the lead of the electrical appliances. If the lead wire
is worn out or too short, replace it with a new wire. • DO NOT drive nails carelessly on the wall. There may be concealed wiring. • USE individual socket outlet for every electrical appliance. • KEEP AWAY from danger areas such as a substation for whatsoever reasons. • CHECK before carrying out excavation work to prevent damaging any underground
cable. The operator may receive severe electric shock or even be electrocuted. • TAKE PRECAUTION when working in the vicinity of overhead lines to avoid any
unforeseen incident. • DO NOT meddle with any broken overhead wire. Report the matter immediately to
the nearest electric office. • DO NOT climb any electric pole. You may receive an electric shock or get
electrocuted. • DO NOT throw anything onto the overhead lines. • NEVER attempt to retrieve anything stuck to overhead lines by whatever means. • DO NOT climb transmission line towers. No one is safe from its high voltage shock. • DO NOT erect any structure close to transmission lines. • DO NOT fly kites close to overhead lines. • TAKE PRECAUTION when working in the vicinity of overhead lines to avoid any
unforeseen incident. • NEVER stand on a damp or wet surface when using electrical equipment. • USE a portable electrical tool, which is properly earthed. • DO NOT tap electrical power without a proper plug. • DO NOT use any electrical tool which has a damaged casing, cap, switch , lead or
plug. • BEFORE using portable electrical appliances and tools, always check for:
o Worn or defective insulation o Loose or broken connection o Earth wire connection
7.4.3.2 First Aid and Emergency Procedures Burns are caused by dry heat such as fire, electricity, strong acids and alkalies.

Draft EIA Report for Proposed IMSWMF, Kinduwal (V), Baddi (T), Solan (D), Himachal Pradesh
M/s. Baddi Barotiwala Nalagarh Development Authority EPIP Phase I, Jharmajri, Baddi, Solan (D),
Himachal Pradesh
Ramky Enviro Engineers Ltd, Hyderabad
Chapter 7.7
Table 7.1 First Aid for Burns
Burns Covering Small Area Burns Covering Extensive Area i. Allow cold tap water to run gently
over the area or immerse in cold water.
ii. It may be necessary to cover with gauze or a clean handkerchief, and bandage.
i. Allow person to lie down. ii. Cover burned areas with sterile
dressing or clean cloth and lightly bandage.
iii. If clothing is adhering, do not disturb; leave the clothing alone.
iv. Keep person warm. If person is not nauseated, he may have sips of water.
v. Arrange for immediate medical care. (Call 108 for ambulance.)
Note: Do not user ointments, greases, pastes or powder on burned area. Do not prick the blisters caused by burns. Tetanus Immunisation Protection against tetanus should be considered whenever the skin is broken by injuries
Against electrical shock i. If possible switch off current. ii. If not, remove casualty from contact with electric source using non-conductive articles like
a dry broom handle or dry rope. iii. Do not touch patient directly, nor with object that will conduct electricity.
(Examples of objects that are electricity conductors : iron, metal, wet clothing, etc.) iv. Give Rescue Breathing (Artificial Respiration if breathing has stopped. v. Arrange for emergency medical care.
(Call 108 for ambulance.) Artificial Respiration, Rescue Breatihing Technique To be used for a person who has CEASED BREATHING due to drowning, choking, electric shock or other causes. i. Wipe out any fluid vomitus, mucus or other objects from the mouth with fingers.
Be certain to reach into the throat with finger in case there is an object blocking the throat. Remove clothing to expose chest.
ii. Place person on his back, place hand or soft object under neck, and keep the head tilted back as far as possible.

Draft EIA Report for Proposed IMSWMF, Kinduwal (V), Baddi (T), Solan (D), Himachal Pradesh
M/s. Baddi Barotiwala Nalagarh Development Authority EPIP Phase I, Jharmajri, Baddi, Solan (D),
Himachal Pradesh
Ramky Enviro Engineers Ltd, Hyderabad
Chapter 7.8
iii. Grasp the angles of the jaw below the ears and lift the jaw so that it juts forward. This will keep the tongue away from the back of the throat, so that air can get in.
iv. Pinch nose with your fingers and blow breath into mouth with smooth, steady action until the chest is felt of seen to rise.
v. Remove your mouth. Allow lungs to empty. This action should be repeated at the normal breathing rate, i.e. 12-15 times a minute.
vi. The purpose is to make the chest move as it would normally. vii. Have someone contact physician.

Draft EIA Report for Proposed IMSWMF, Kinduwal (V), Baddi (T), Solan (D), Himachal Pradesh
M/s. Baddi Barotiwala Nalagarh Development Authority EPIP Phase I, Jharmajri, Baddi, Solan (D),
Himachal Pradesh
Ramky Enviro Engineers Ltd, Hyderabad
Chapter 8.1
CHAPTER -8 PROJECT BENEFITS 8.1 Introduction
The Compost produced from proposed IMSWMF is organic material that can be used as a soil amendment or as a medium to grow plants. Mature compost is a stable material with content called humus that is dark brown or black and has a soil-like, earthy smell. It is created by: combining organic wastes (e.g., yard trimmings, food wastes, manures) in proper ratios into piles, rows, or vessels; adding bulking agents (e.g., wood chips) as necessary to accelerate the breakdown of organic materials; and allowing the finished material to fully stabilize and mature through a curing process. Natural composting, or biological decomposition, began with the first plants on earth and has been going on ever since. As vegetation falls to the ground, it slowly decays, providing minerals and nutrients needed for plants, animals, and microorganisms. Mature compost, however, includes the production of high temperatures to destroy pathogens and weed seeds that natural decomposition does not destroy. Compost can
• Suppress plant diseases and pests. • Reduce or eliminate the need for chemical fertilizers. • Promote higher yields of agricultural crops. • Facilitate reforestation, wetlands restoration, and habitat revitalization efforts by
amending contaminated, compacted, and marginal soils. • Cost-effectively remediate soils contaminated by hazardous waste. • Remove solids, oil, grease, and heavy metals from storm water runoff. • Capture and destroy 99.6 percent of industrial volatile organic chemicals (VOCs)
in contaminated air. • Provide cost savings of at least 50 percent over conventional soil, water, and air
pollution remediation technologies, where applicable. Compost use can result in a variety of environmental benefits. The following are a few of the most important benefits: 8.1.1Compost enriches soils Compost has the ability to help regenerate poor soils. The composting process encourages the production of beneficial micro-organisms (mainly bacteria and fungi) which in turn break down organic matter to create humus. Humus--a rich nutrient-filled material--increases the nutrient content in soils and helps soils retain moisture. Compost
8

Draft EIA Report for Proposed IMSWMF, Kinduwal (V), Baddi (T), Solan (D), Himachal Pradesh
M/s. Baddi Barotiwala Nalagarh Development Authority EPIP Phase I, Jharmajri, Baddi, Solan (D),
Himachal Pradesh
Ramky Enviro Engineers Ltd, Hyderabad
Chapter 8.2
has also been shown to suppress plant diseases and pests, reduce or eliminate the need for chemical fertilizers, and promote higher yields of agricultural crops. 8.1.2 Compost helps cleanup (remediate) contaminated soil The composting process has been shown to absorb odors and treat semivolatile and volatile organic compounds (VOCs), including heating fuels, polyaromatic hydrocarbons (PAHs), and explosives. It has also been shown to bind heavy metals and prevent them from migrating to water resources or being absorbed by plants. The compost process degrades and, in some cases, completely eliminates wood preservatives, pesticides, and both chlorinated and no chlorinated hydrocarbons in contaminated soils. 8.1.3 Compost Used as Erosion Deterrent Composting organic materials that have been diverted from landfills ultimately avoids the production of methane and leachate formulation in the landfills. Compost has the ability to prevent pollutants in storm water runoff from reaching surface water resources. Compost has also been shown to prevent erosion and silting on embankments parallel to creeks, lakes, and rivers, and prevents erosion and turf loss on roadsides, hillsides, playing fields, and golf courses. 8.1.4 Using compost offers economic benefits Using compost can reduce the need for water, fertilizers, and pesticides. It serves as a marketable commodity and is a low-cost alternative to standard landfill cover and artificial soil amendments. Composting also extends municipal landfill life by diverting organic materials from landfills and provides a less costly alternative to conventional methods of remediating (cleaning) contaminated soil. 8.2 Benefits of Recycling process
•
8.2.1Plastic recycling The following are the benefits of the recycling of waste plastics.
• Reduction in Greenhouse Gas Emissions
• Can increase the life our landfill sites
• Energy Conservation
• Beneficial Reuse
Plastic Recycled Supply and Demand etc
• Energy conservation 60-70% energy savings over virgin paper production
8.2.2Paper Recycling Benefits
• Resource conservation Recycled paper uses 55% less water and helps preserve our forests

Draft EIA Report for Proposed IMSWMF, Kinduwal (V), Baddi (T), Solan (D), Himachal Pradesh
M/s. Baddi Barotiwala Nalagarh Development Authority EPIP Phase I, Jharmajri, Baddi, Solan (D),
Himachal Pradesh
Ramky Enviro Engineers Ltd, Hyderabad
Chapter 8.3
• Pollution reduction, Recycled paper reduces water pollution by 35%, reduces air pollution by 74%, and eliminates many toxic pollutants
• Livelihood creation Recycling of waste paper creates more jobs 8.3 Benefits of Land fill Land fills minimize the natural impact of solid waste on the environment by the following mechanics:
• Isolation of inert waste through containment • Elimination of polluting pathways
8.4 Improvements in the physical infrastructure The proposed project is expected to yield a positive impact on the socio economic environment. It helps sustain the development of this area including further development of physical infrastructural facilities. The following physical infrastructure facilities will improve due to proposed project.
• Road Transport facilities • Housing facilities • Water supply and sanitation • Power
8.5 Clean Development Mechanism (CDM) The Processing of MSW avoids the generation of methane and hence is eligible for CDM benefit. 8.6 Improvements in the social infrastructure Agriculture & plantation are one of the basic sectors of employment for the local people in this area. The project will lead to indirect and direct employment opportunity. Employment is expected during operation period, garbage lifting and other ancillary services. Employment in these sectors will be temporary or contractual and involvement of unskilled labour will be more. A major part of this labour force will be mainly from local villagers who are expected to engage themselves both in agriculture and project activities. This will enhance their income and lead to overall economic growth of the area. The following changes in socio-economic status are expected to take place with this project.
• The project is going to have positive impact on consumption behaviour by way of raising average consumption and income through multiplier effect.
• The project is going to bring about changes in the pattern of demand from food to non-food items and sufficient income is generated.
• Due to the corporate social responsible activities by project authorities, the socio economic condition of the people will be improved.

Draft EIA Report for Proposed IMSWMF, Kinduwal (V), Baddi (T), Solan (D), Himachal Pradesh
M/s. Baddi Barotiwala Nalagarh Development Authority EPIP Phase I, Jharmajri, Baddi, Solan (D),
Himachal Pradesh
Ramky Enviro Engineers Ltd, Hyderabad
Chapter 8.4
• People perceive that the project will in the long run help in the development of social infrastructures/such as.
• Education facilities • Banking facilities • Post offices and Communication facilities • Medical facilities • Plantation and parks • Community facilities
Industrial development and consequent economic development should lead to improvement of environment through better living and greater social awareness. On the other hand, the proposed project is likely to have several benefits like improvement in indirect employment generation and economic growth of the area, by way of improved infrastructure facilities and better socio-economic conditions. Better hygienic conditions, as municipal waste being dumped at several places will be brought to one place for further treatment and scientific disposal. 8.7 Employment potential The main advantage of the proposed project is direct employment generation (i) absorbs rural labour and unskilled workers (in addition to semi-skilled and some skilled); (ii) provides opportunity for seasonal employment thereby supplementing workers’ income from farming; and (iii) permits participation of women workers both during construction and operation phase. The maximum benefit will be for local villagers and rag pickers as they are easily accessible. Additionally it is estimated that good number of jobs will be created as an indirect employment opportunities at local/regional level due to contractual, marketing and associated jobs directly with the project. The other related employment due to transportation requirement, supply of essential items and services to the project site and other community services will be plenty.. Employment in these sectors will be permanent based on own initiatives and interest of the individual. Involvement of unskilled labour requirement will be continuous basis depending on the requirement of contractor at site. A major part of this labor force will be hired from nearby places. 8.8 Other tangible benefits
• Additional housing demand for rental accommodation will increase • Cultural, recreation and aesthetic facilities will also improve. • Improvement in communication, transport, education, community development
and medical facilities. • Overall change in employment and income opportunity.
The State Government will also benefit directly from the proposed project, through increased revenue from royalties, excise duty and stowing duty.

Draft EIA Report for Proposed IMSWMF, Kinduwal (V), Baddi (T), Solan (D) Himachal Pradesh
M/s. Baddi Barotiwala Nalagarh Development Authority EPIP Phase I, Jharmajri, Baddi, Solan (D)
Himachal Pradesh
Ramky Enviro Engineers Ltd, Hyderabad
Chapter 9.1
CHAPTER -9 ENVIRONMENTAL MANAGEMENT PLAN 9.1 Introduction The Environmental Management Plan (EMP) is proposed to ensure sustainable development during operation of the proposed project. Hence, it needs proper Environmental Management Plan (EMP) to meet these objectives. The management action plan aims at controlling pollution at the source level to the possible extent with the available and affordable technology followed by treatment measures before they are discharged. The following mitigation measures are proposed in order to synchronize the economic development of the study area with the environmental protection of the region. 9.2 Environmental Management during Construction The impacts during the construction phase on the environment would be basically of temporary nature and are expected to reduce gradually on completion of the construction activities. 9.2.1 Air Quality Mitigation Measures For the proposed project site leveling and grading will be carried out if required, where ever possible to maintain the natural elevations they will not be disturbed, only leveling activity will be carried out for providing roads, sewage network, storm water system, and places required for construction of compost plant and administrative buildings. According to the engineering assessment, most of the excavated mud generated during construction activities will be reused within the project site for leveling during road formation, bunds construction around the land fill site, etc. The excess if any will be given to local contractors for disposal in low lying areas, road construction use, etc. Most of the construction dust will be generated from the movement of construction vehicles on unpaved roads. Unloading and removal of soil material shall also act as a potential source for dust nuisance. The control measures proposed to be taken up are given below.
1. Water sprinkling on main haul roads in the project area will be done, this activity will be carried out at least twice a day, if need arises frequency will be increased
9

Draft EIA Report for Proposed IMSWMF, Kinduwal (V), Baddi (T), Solan (D) Himachal Pradesh
M/s. Baddi Barotiwala Nalagarh Development Authority EPIP Phase I, Jharmajri, Baddi, Solan (D)
Himachal Pradesh
Ramky Enviro Engineers Ltd, Hyderabad
Chapter 9.2
on windy days, in this way around 50% reduction on the dust contribution from the exposed surface will be achieved.
2. The duration of stockpiling of excavated mud will be as short as possible as most of the material will be used as backfill material for the open cut trenches for road development.
3. Temporary tin sheets of sufficient height (3m) will be erected around the site of dust generation or all around the project site as barrier for dust control.
4. Tree plantations around the project boundary will be initiated at the early stages by plantation of 2 to 3 years old saplings using drip irrigation or by regular watering so that the area will be moist for most part of the day.
5. All vehicles carrying raw materials will be instructed to cover with tarpaulin / plastic sheet, unloading and loading activity will be stopped during windy period.
6. To reduce the dust movement from civil construction site to the neighborhood the external part of the construction activity will be covered by plastic sheets
9.2.2 Water Quality Mitigation Measures During site development necessary precautions will be taken, so that the runoff water from the site gets collected to working pit and if any over flow is, will be diverted to nearby greenbelt / plantation area During construction activity all the equipments washed water will be diverted to working pit to arrest the suspended solids if any and the settled water will be reused for construction purposes, and for sprinkling on roads to control the dust emission, etc. The waste generated from the site work shop will be segregated like used oil, lubricants, etc and disposed to authorized recyclers the waste like soiled cotton, paper, etc will be disposed to municipal dump/Landfill. The domestic wastewater generated from temporary toilets used by the work force will be diverted to septic tank followed by soak pit. Therefore, impact on water quality due to proposed unit would be insignificant. 9.2.3 Noise Mitigation Measures Noise generating equipment will be used during day time for brief period of its requirement. Proper enclosures will be used for reduction in noise levels, where ever possible the noise generating equipment will be kept away from the human habituation. Temporary tin sheets of sufficient height (3m) will be erected around the noise generating activity or all around the project site as barrier for minimizing the noise travel to

Draft EIA Report for Proposed IMSWMF, Kinduwal (V), Baddi (T), Solan (D) Himachal Pradesh
M/s. Baddi Barotiwala Nalagarh Development Authority EPIP Phase I, Jharmajri, Baddi, Solan (D)
Himachal Pradesh
Ramky Enviro Engineers Ltd, Hyderabad
Chapter 9.3
surrounding areas. Therefore, impact on noise environment due to proposed project would be insignificant. All vehicles entering into the project will be informed to maintain speed limits, and not blow horns unless it is required. Personal protective equipment like earmuffs, helmets covering ears would be provided to the workers working near noise generating equipment and would see that workers use the protective gadgets regularly. 9.2.4Solid Waste Mitigation Measures The solid waste generated during construction period being predominantly inert in nature, construction and demolition waste does not create chemical or biochemical pollution. However maximum effort would be made to reuse and recycle them. The most of the solid waste material will be used for filing/ levelling of low-laying areas, as road construction material, if any excess given to local contractors for lifting and dumping in low lying areas. All attempts would be made to stick to the following measures.
1 All construction waste shall be stored within the site itself. A proper screen will be provided so that the waste does not get scattered.
2 Attempts will be made to keep the waste segregated into different heaps as far as possible so that their further gradation and reuse is facilitated.
3 Materials, which can be reused for purpose of construction, levelling, making roads/ pavement will also be kept in separate heaps from those which are to be sold or land filled.
The use of the construction material basically depends on their separation and conditions of the separated material. A majority of these materials are durable and therefore, have a high potential for reuse. It would, however, be desirable to have quality standards for the recycled materials. Construction waste can be used in the following manner.
1 Reuse of bricks, tiles, stone slabs, timber, piping railings etc to the extent possible and depending upon their conditions.
2 Sale/ auction of materials which can not be used at the site due to design constraint
3 Plastics, broken glass, scrap metal, used cement bags, etc can be sent for recycling in the industries.
4 Rubble/ brick bats can be used for building activity, such as levelling, under coat of lanes where the traffic does not constitute heavy moving loads.
5 Larger unusable pieces can be sent for filing up low laying areas. 6 Fine material such as sand, dust, etc can be used as cover material 7 The unearthed soil can be used for levelling as well as for lawn development 8 The broken pieces of the flooring material can be used for levelling in the building
or can be disposed off 9 The unused or remaining paints/varnishes/wood can either be reused or can be
disposed off.

Draft EIA Report for Proposed IMSWMF, Kinduwal (V), Baddi (T), Solan (D) Himachal Pradesh
M/s. Baddi Barotiwala Nalagarh Development Authority EPIP Phase I, Jharmajri, Baddi, Solan (D)
Himachal Pradesh
Ramky Enviro Engineers Ltd, Hyderabad
Chapter 9.4
9.2.5 Ecological Aspects During construction period, there could be clearing of vegetation in order to prepare the site for construction, the top soil from the construction area will collected and will be stored separately and will be used for greenbelt development. A comprehensive green belt program will be planned to improve the ecological condition of the region. 9.2.6 Site Security
Adequate security arrangement would be made to ensure that the local inhabitants and the stray cattle are not exposed to the potential hazards of construction activities. Round the clock security personnel will be appointed to restrict entry of unwanted people to the site. 9.3 Management during Operation Stage Necessary control measures will be undertaken at the design stage to meet the statutory requirements and towards minimizing environmental impacts. During project implementation period special emphasis will be made on measures to minimize lechate / effluent generation and dust control at source. The specific control measures related to air emissions, liquid effluent discharges, noise generation, solid waste disposal etc. are described below: 9.3.1 Air Quality Management The main activities from the proposed project which cause air pollution are as follows:
• Sulphur dioxide and Nitrogen oxide from DG sets • Dust particulates due to movement of vehicles and road sweepings • Temperature & Odour from Compost plant • Odour & Gas generation from secured landfill
The following methods of abatement will be employed for the air pollution control.
• DG set will be provided with a stack height meeting MOEF Guidelines or 1 m above the tallest structure in the project area for proper dispersion of sulfur dioxide and oxides of nitrogen.
• Internal roads will be concreted / asphalted to reduce dust emissions • Speed restriction will be followed within the project and speed breakers will be
provided at entry and exit points • Proper moisture, oxygen and C:N ratio will be maintained to minimize the
odour and to maintain adequate temperature in compost plant • Gas management system in secured landfill will be provided • Green belt will be provided along the internal roads and plant boundary.

Draft EIA Report for Proposed IMSWMF, Kinduwal (V), Baddi (T), Solan (D) Himachal Pradesh
M/s. Baddi Barotiwala Nalagarh Development Authority EPIP Phase I, Jharmajri, Baddi, Solan (D)
Himachal Pradesh
Ramky Enviro Engineers Ltd, Hyderabad
Chapter 9.5
9.3.2 Odour Control The odour management is one the issue in IMSWMF. The main aim is to minimize the number of sources of odour generation which exist in site. To undertake direct management of odour generating sources that give rise to odour problems. The mitigation measures proposed to minimize and control odour are as follows.
• Maintaining proper air and moisture in the compost plant and windrow area • Dilution of odourant by odour counteraction or neutralize by spraying Ecosorb
(organic and biodegradable chemical) around odour generation areas at regular intervals.
• Covering the landfill area under operation daily with layer of earth, clay or a similar material
• Covering by using heavy duty hessian, plastics and foams odour can be minimized.
9.3.3 Gas Management Land fill gas is generated as a product of waste biodegradation. In land fill, Organic waste is broken down by enzymes produced by bacteria in a manner. Considerable heat is generated by these reactions with methane, carbon dioxide, nitrogen, oxygen, hydrogen sulphide and other gases as by products. Methane and carbon dioxide are the principle gases produced with almost 50-50% share. When methane is present in the air in concentrations between 5 to 15%, it is explosive. Landfills generate gases with a pressure sufficient enough to damage the final cover and largely have the impact on vegetative cover. Also because only limited amount of oxygen are present in a land fill, when methane concentration reach this critical level, there is a little danger that the land fill will explode. To minimize the gas generation in the proposed project compost plant is proposed, hence gas generation is anticipated to be very less. To manage the gas generated a venting system with flaring arrangement is proposed if the gas generation is more it will be diverted to canteen. The typical gas collection and flaring system is shown in Figure 9.1. 9.3.4 Water Quality Mitigation Measures The main wastewater generation sources in the proposed project are domestic wastewater, leachate generation from compost plant and secured land fill area. Leachate generated at various places in the plant is collected and sprayed on windrow to maintain suitable temperature and moisture. The domestic waste water will be treated in septic tank followed soak pit and the treated water will be used for flushing, greenbelt development. The details of the wastewater generation are given in the Table 9.1

Draft EIA Report for Proposed IMSWMF, Kinduwal (V), Baddi (T), Solan (D) Himachal Pradesh
M/s. Baddi Barotiwala Nalagarh Development Authority EPIP Phase I, Jharmajri, Baddi, Solan (D)
Himachal Pradesh
Ramky Enviro Engineers Ltd, Hyderabad
Chapter 9.6
Figure 9.1
Gas Flaring System
Table 9.1
Wastewater Generation Details in m3/day S. No Utility Wastewater Remarks
1 Domestic 0,8 Septic tank followed by soak pit or portable STP
2 Leachate from Compost plant 15 Recycle/reuse 3 Leachate from Secured landfill 0.5 Total 16.3 1) Leachate generated at various places in the plant is collected and sprayed on
windrow to maintain suitable temperature and moisture. 2) Optimum Temperature - 70ºC 3) Optimum Moisture - 50 to 60%
9.3.5 Storm Water Management
Based on the rainfall intensity of the proposed area, storm water drainage system will be designed by BBNDA. Storm water drainage system consists of well-designed network of open surface drains and rainwater harvesting pits along the drains so that all the storm water is efficiently drained off without any water logging.

Draft EIA Report for Proposed IMSWMF, Kinduwal (V), Baddi (T), Solan (D) Himachal Pradesh
M/s. Baddi Barotiwala Nalagarh Development Authority EPIP Phase I, Jharmajri, Baddi, Solan (D)
Himachal Pradesh
Ramky Enviro Engineers Ltd, Hyderabad
Chapter 9.7
9.3.6 Rain Water Harvesting System
BBNDA is proposing to achieve proper utilization of rainwater by using appropriate rain water-harvesting mechanism. Rainwater harvesting will be done by the construction of harvesting pits all along the storm water drainage network at a definite pitch. Necessary expert advice will be taken in this regard. Artificial recharge measures like rain water-harvesting helps in reducing the urban run-off, decrease pollution of ground water and improve the ground water table, which augments the yields of bore wells.
The total area available: 3.2 Ha
Annual Rainfall in the area: 1100 mm
Quantity of runoff (m3): C x I x A
(Where C is coefficient of runoff, I is precipitation in meters and A is catchment area in m2)
Thus Quantity of Runoff: 0.5 x 1.10 x 32074
17640 m3
Considering evaporation transpiration rate as 70 % of the precipitation
Rainwater available for harvesting 5292 m3
However, rain water harvesting will be primarily limited to run off from paved areas and building roof tops.
9.3.7 Noise Mitigation Measures The main sources of noise generation is due movement of vehicles carrying municipal waste, all vehicle (drivers) entering into the project will be informed to maintain speed limits, and not blow horns unless it is required. Necessary speed controlling bumps will be placed near weighbridge and entrance of the site. The other areas where noise generation is anticipated is DG set room, necessary personal protective equipment like earmuffs, helmets covering ears would be provided to the workers working near noise generating equipment and would see that workers use the protective gadgets regularly. Regular maintenance of the equipment will be carried out as per the schedule given by suppliers. The noise pollution management measures proposed are given below.
• Acoustic Enclosure for all the high noise level equipments • All the design/installation precautions as specified by the manufacturers with
respect to noise control are strictly adhered to • Noise generating sources are insulated adequately by providing suitable
enclosures

Draft EIA Report for Proposed IMSWMF, Kinduwal (V), Baddi (T), Solan (D) Himachal Pradesh
M/s. Baddi Barotiwala Nalagarh Development Authority EPIP Phase I, Jharmajri, Baddi, Solan (D)
Himachal Pradesh
Ramky Enviro Engineers Ltd, Hyderabad
Chapter 9.8
• Other than the regular maintenance of the various equipment, ear plugs are provided to the personnel close to the noise generating units;
• All the openings like covers, partitions are designed properly.
9.3.8 Solid Waste Mitigation Measures The inerts coming from compost plant and recycling complex area will be sent to secured land fill. 9.4 Post Operation of Landfill A final landfill cover is usually composed of several layers, each with a specific function. The surface cover system must enhance surface drainage, minimise infiltration, support vegetation and control the release of landfill gases. The landfill cover to be adopted will depend on the gas management system. As recommended by the MoEF and CPHEEO the final cover system must consist of a vegetative layer supported by a drainage layer over barrier layer and gas vent layer. The details of the landfill cover are given below.
• A 90cm thick compacted clay or GCL of permeability not greater than 1X10⁻⁷ cm/sec
• A HDPE geo-membrane liner of thickness 1.5mm • A drainage layer of 15cm thick granular material of permeability not greater than
10-2 cm/sec. 9.5 Management of Flora & Fauna, Greenbelt development A few shrubs and trees are going to be damaged on account of the proposed project development. All of them occur in the core zone as well as in immediate neighborhood area. Hence, there are no chances of losing any valuable biodiversity. In order to consolidate the landfill, the management will develop greenbelt. Preference will be given to tall and evergreen native and local trees. A list trees proposed to be included for the development green belt and road side are given in Table 9.3. Apart from these several ornamental shrubs such as Nerium, Tabermontana, Lantanas, Cycas, Ixoras, Bougainvellias, Roses, Royal Palms, Fish tail palms, Traveller’s palms etc shall also be considered.
Table 9. 2 List of plants identified for green belt
Botanical name Local name Tolerance Importance Acacia Catechu Khair T Goat fodder, Cattle feed Ailanthus excelsa Mar Maharuk T Tree borne oil Albizia lebbeck Siris T Shade, timber and scented flowers Azadirachta indica Nim T Neem oil & neem products Bauhinia racemosa Astha T Ornamental tree

Draft EIA Report for Proposed IMSWMF, Kinduwal (V), Baddi (T), Solan (D) Himachal Pradesh
M/s. Baddi Barotiwala Nalagarh Development Authority EPIP Phase I, Jharmajri, Baddi, Solan (D)
Himachal Pradesh
Ramky Enviro Engineers Ltd, Hyderabad
Chapter 9.9
Botanical name Local name Tolerance Importance Colotrophis procera Akada T Flowering tea Coriaria nepalensis Masuri S Hill Stability Dalbergia latifolia Shisham T Avnue and timber tree Dendrocalamus strictus Banskaban T Bamboo products Emblica afficinalis Amla T Edible fruit Ficus benghalensis Bargod T Shade and a source of food for birds Ficus semicordata Jahepholi T Fodder tree
Grevilleaa robusta Silver oak T Avenue tree Hippophae rhamnoides Sirma T Edible fruit Maringa oleifera Sajina T Edible fruits and oil
Murrava Paniculata Marchula T Timber & Medicinal value Pinus roxburghii Chiri S Timber Salix tetrasperma Bod T Edible flowers
Spondias Pinnata Bemg T Edible fruits Tabernaemontana Divaricata
Tagar T Fragrant flowers
Terminalia arjuna Arjuna T Timber and shade tree Terminalia chebula Harra T Edible fruits Ulmus Wallichinana Mored pobuna T Firewood & fodder Zizyphus mauritiana Ber T Edible fruits Sensitive–S / Tolerant-T (to air pollution); As the area is barren and devoid of top soil in most locations, trenches will be dug out across the slope and filled with the compost obtained from the nearby old dump yards. Rain water will be diverted to the trenches. Tall and evergreen plants will be closely planted in the trenches. Watering and application of manure will be made as and when required. Planting stocks are readily available from the social Forest Department as well as from the local private nurseries. All plants are locally adapted and the present site can support their growth with suitable horticultural practices. Sufficient space, resources and man power for development and maintenance are provided in the plan.
The green belt developed helps to capture the emissions, attenuate the noise generated and improve the aesthetics. Attempts will be made to ensure that all open spaces, where tree plantation may not possible, will be covered with shrubs and grass to prevent erosion of topsoil. Adequate attention is will be paid to maintenance and protection of green belt. Apart from green belt all around the site, on the top of closed/capped landfills greenery would be developed.

Draft EIA Report for Proposed IMSWMF, Kinduwal (V), Baddi (T), Solan (D) Himachal Pradesh
M/s. Baddi Barotiwala Nalagarh Development Authority EPIP Phase I, Jharmajri, Baddi, Solan (D)
Himachal Pradesh
Ramky Enviro Engineers Ltd, Hyderabad
Chapter 9.10
9.6 Environmental Control during Composting Process
• Windrow areas will be provided with an impermeable base. Such a base will be made of concrete or of compacted clay, 50 centimeters thick, having permeability less than 10-7 centimeters/second. The base will be provided with 2 % slope and will be encircled by lined drains for collection of leachate. A treatment unit will be provided to ensure that the wastewater is reused / discharged after it meets all the regulatory standards
• On such days when waste cannot be accepted at the compost plant due to rains/plant maintenance, the waste will be diverted to a land fill
• The process rejects will be removed from the compost plant on daily basis. The recyclables will be diverted to recycling vendors. The non-recyclables should be sent to land fill.
• Temporary storage of rejects will be done in a covered area. • The height of the stock piled waste will not exceed 3 m. • The storage area will have a provision for odour control, litter control, fire control
and bird control. 9.7Socio-Economic Development Activities under CEP Corporate Environmental Policy (CEP), also known as Corporate Social Responsibility (CSR), is a form of corporate self-regulation integrated into a business model. Ideally, CEP policy would function as a built-in, self-regulating mechanism whereby business would monitor and ensure its support to ethical standards and international norms. Consequently, business would adopt responsibility for the impact of its activities on the environment, consumers, employees, Communities, Stakeholders and all other members of the public sector. CEP focused businesses would proactively promote the public interest by encouraging community growth and development, and voluntarily eliminating practices that harm the public sector, regardless of legality. Economic growth is possible only through consumption of inputs available in the environment and society. The harnessing of natural resources has a direct impact on the economy, the environment and society at large. CEP is a concept whereby organizations serve the interests of society by taking responsibility for the impact of their activities on customers, employees, shareholders, communities and the environment in all aspects of their operations. Thus CEP is a management’s commitment to operate in an economically, socially and environmentally sustainable manner, while recognizing the interests of its stakeholders. This commitment is beyond statutory requirements. CEP is, therefore, closely linked with the practice of sustainable Development.
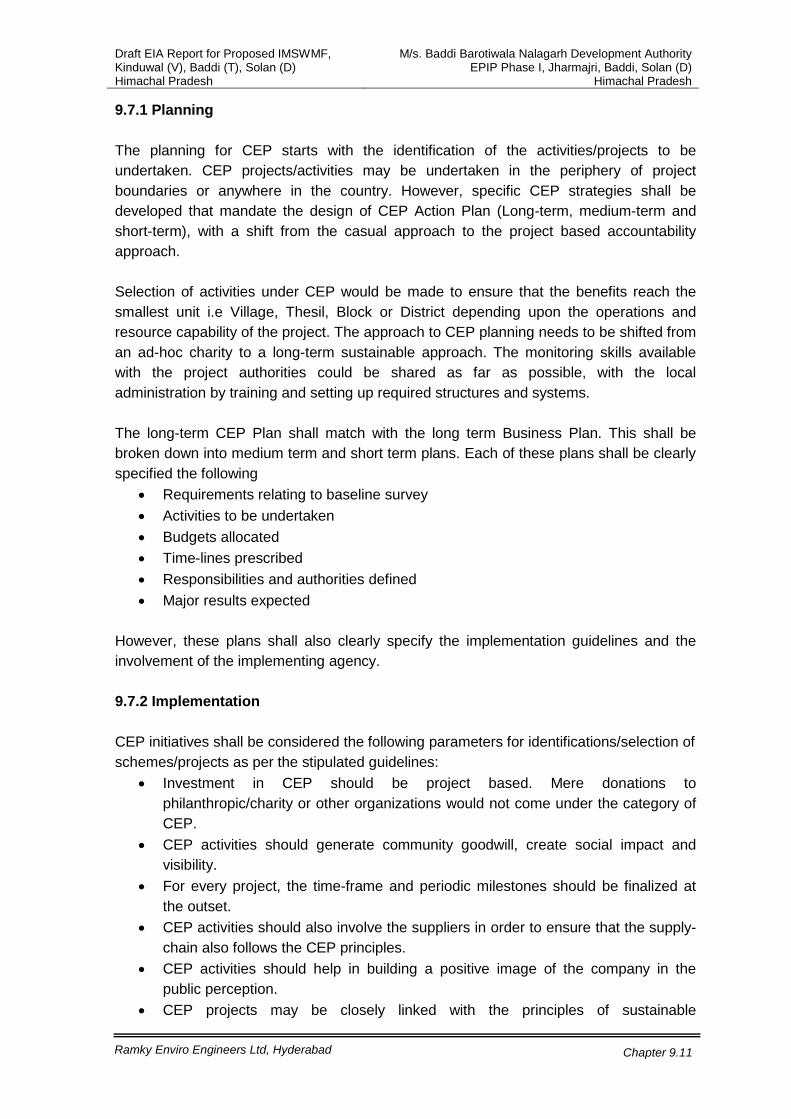
Draft EIA Report for Proposed IMSWMF, Kinduwal (V), Baddi (T), Solan (D) Himachal Pradesh
M/s. Baddi Barotiwala Nalagarh Development Authority EPIP Phase I, Jharmajri, Baddi, Solan (D)
Himachal Pradesh
Ramky Enviro Engineers Ltd, Hyderabad
Chapter 9.11
9.7.1 Planning The planning for CEP starts with the identification of the activities/projects to be undertaken. CEP projects/activities may be undertaken in the periphery of project boundaries or anywhere in the country. However, specific CEP strategies shall be developed that mandate the design of CEP Action Plan (Long-term, medium-term and short-term), with a shift from the casual approach to the project based accountability approach. Selection of activities under CEP would be made to ensure that the benefits reach the smallest unit i.e Village, Thesil, Block or District depending upon the operations and resource capability of the project. The approach to CEP planning needs to be shifted from an ad-hoc charity to a long-term sustainable approach. The monitoring skills available with the project authorities could be shared as far as possible, with the local administration by training and setting up required structures and systems. The long-term CEP Plan shall match with the long term Business Plan. This shall be broken down into medium term and short term plans. Each of these plans shall be clearly specified the following
• Requirements relating to baseline survey • Activities to be undertaken • Budgets allocated • Time-lines prescribed • Responsibilities and authorities defined • Major results expected
However, these plans shall also clearly specify the implementation guidelines and the involvement of the implementing agency. 9.7.2 Implementation CEP initiatives shall be considered the following parameters for identifications/selection of schemes/projects as per the stipulated guidelines:
• Investment in CEP should be project based. Mere donations to philanthropic/charity or other organizations would not come under the category of CEP.
• CEP activities should generate community goodwill, create social impact and visibility.
• For every project, the time-frame and periodic milestones should be finalized at the outset.
• CEP activities should also involve the suppliers in order to ensure that the supply-chain also follows the CEP principles.
• CEP activities should help in building a positive image of the company in the public perception.
• CEP projects may be closely linked with the principles of sustainable

Draft EIA Report for Proposed IMSWMF, Kinduwal (V), Baddi (T), Solan (D) Himachal Pradesh
M/s. Baddi Barotiwala Nalagarh Development Authority EPIP Phase I, Jharmajri, Baddi, Solan (D)
Himachal Pradesh
Ramky Enviro Engineers Ltd, Hyderabad
Chapter 9.12
Development. Based on the immediate and long term social and environmental consequences of their activities.
• Management should take the shoulder responsibility for restoring/Compensating for any ecological damage that is taking place as a result of its operations.
Project activities identified under CEP shall be implemented by Specialized Agencies and generally NOT by staff of the project management. Specialized agencies would be made to work singly or in tandem with other agencies.
• Specialized agencies would include:- • Community based organizations whether formal or informal • Elected local bodies such as Panchayats • Voluntary Agencies (NGOs) • Institutes/Academic Organisations • Trusts, Missions, etc • Self-help Groups • Government, Semi-Government and autonomous Organisations • Standing Conference of Public Enterprises (SCOPE) • Mahila Mandals/Samitis and the like • Contracted agencies for civil works • Professional Consultancy Organizations, etc.
Project Management will take responsibility to develop awareness among all levels of their staff about CEP activities and the integration of social processes with business processes. Those involved with the undertaking of CEP activities will be provided with adequate training and re-orientation. Initiatives of State Governments, District Administration, local administration as well as Central Government Departments/Agencies, self-Help Groups, etc., would be dovetailed/Synergised with the initiatives taken by the management. Every care will be taken to ensure that there is no duplication of CEP activities undertaken by the project with that of programmes run by Central State and Local Governments. While assigning CEP projects to specialized agencies, every possible effort will be made to verify the reliability and clean track record of such agencies or they may select from panels maintained by Government, Semi-Government, Autonomous Organization or the National CEP Hub, etc. Activities related to sustainable Development will form a significant element of the total initiatives of CEP. However, these activities will be carried out under the 3 UN Global compact principles, pertaining to the Environment. Nevertheless, business related with project activities will be asked to:
• Support a precautionary approach to environmental challenges • Undertake initiatives to promote greater environmental responsibility • Encourage the development and diffusion of environmentally friendly
technologies.

Draft EIA Report for Proposed IMSWMF, Kinduwal (V), Baddi (T), Solan (D) Himachal Pradesh
M/s. Baddi Barotiwala Nalagarh Development Authority EPIP Phase I, Jharmajri, Baddi, Solan (D)
Himachal Pradesh
Ramky Enviro Engineers Ltd, Hyderabad
Chapter 9.13
9.7.3 Possible Areas of Activities under CEP Some of the possible areas of activities under CEP are given below, they will be undertaken depending on the local requirement and its immediate need.
• Drinking Water Facility • Education • Electricity Facility • Solar Lighting System • Health and Family Welfare • Plantation/Irrigation Facilities • Sanitation and Public Health • Pollution Control • Animal Care • Promotion of Sports and Games • Promotion of Art and Culture • Environment Friendly technologies • Promotion of livelihood for economically weaker sections through forward and
backward linkages. • Relief to victims of Natural Calamities like earth-quake, Cyclone, drought & Flood
situation in any part of the country • Supplementing Development Programmes of the Government • Non-conventional Energy Sources • Construction of Community Centres/Night Shelters/Old Age Homes • Imparting Vocational Training • Setting up of skill development centers • Adoption of Villages • Scholarships to meritorious students belonging to SC, ST, OBC and disabled
categories • Adoption/Construction of Hostels (especially those for SC/ST and girls) • Skill training, entrepreneurship development and placement assistance
programmes for youth • Building of Roads, Pathways and Bridges • Entrepreneurship Development Programme (EDP) • Disaster Management Activities including those related to amelioration/mitigation • Activities related to the preservation of the Environment/Ecology and to
sustainable Development
9.7.4 Funding During primary data collection in the study area it has been noticed that there are good number of unemployed local youth in the surrounding villages, an action plan will be proposed to train the local employable youth, so that after relevant training they will be

Draft EIA Report for Proposed IMSWMF, Kinduwal (V), Baddi (T), Solan (D) Himachal Pradesh
M/s. Baddi Barotiwala Nalagarh Development Authority EPIP Phase I, Jharmajri, Baddi, Solan (D)
Himachal Pradesh
Ramky Enviro Engineers Ltd, Hyderabad
Chapter 9.14
employed in the proposed project based on the requirement of different stages of the project. Financial help will be provided to local youth (tuition fees, hostel charges, books, examination fees, etc) of the study area in getting them trained in Industrial training institutes / centers, Polytechnics in various trades like Electricians, Plumbers, Fitters, boiler operators, driving, etc. The details of the funds proposed initially for CEP are given in Table 9.3 and later on need based allotment of funds will be done for taking up CEP activities by keeping a separate fund using minimum of 2% of profit share.
Table 9.3
Funds for implementing Corporate Social Responsibilities under CEP S. No Item Amount
(Rs Lakhs) 1 Upliftment of poor to acquire traditional/ basic skill for BPL
families 3
2 To acquire skills through ITI & skill development organizations in getting employments in industries
3
3 Development of PHC, Conducting Health camps and Providing medicines
2
4 Infrastructure Development, drinking water (OHT, Pipe laying etc.), Electricity, sanitation facilities
1
5 Infrastructure for Electricity 1 Total 10
9.8 Occupational Health Management There will be routine observation of health as certain sufferings are likely to appear as result of exposure by the workers during operations of various facilities. All the employees shall be required to undergo a medical checkup before joining the facility. Medical checkup will be conducted on regular basis and the health conditions will be monitored. First aid facilities required to attend immediately for meeting emergency situations shall be made available at the facility. 9.9 Fire Protection System The fire protection system will protect the entire site area from fire hazards happening accidentally. This fire protection system comprises of a ground level water storage tank to store the anticipated requirement of water. One electric motor driven pump and one diesel high pressure pumps will be provided to pump the water to a high pressure header from where

Draft EIA Report for Proposed IMSWMF, Kinduwal (V), Baddi (T), Solan (D) Himachal Pradesh
M/s. Baddi Barotiwala Nalagarh Development Authority EPIP Phase I, Jharmajri, Baddi, Solan (D)
Himachal Pradesh
Ramky Enviro Engineers Ltd, Hyderabad
Chapter 9.15
the water is distributed to various high pressure hydrants provided at selected locations. Necessary fire hoses terminated with spouts will be kept ready at each hydrant location to facilitate fire fighting. The header also caters to a multi fire system to automatically sprinkle water through sprinklers provided. 9.10 Environmental Management Cell The Environmental Cell will be headed by the Project Manager followed by other officers and technicians. The department is the nodal agency to co-ordinate and provides necessary services on environmental issues during operation of the project. This environmental group is responsible for implementation of environmental management plan, interaction with the environmental regulatory agencies, reviewing draft policy and planning. This department interacts with State Pollution Control Board and other environment regulatory agencies. The department also interacts with local people to understand their problems and to formulate appropriate community development plan.
Organizational Environmental Cell
General Mar -
-
-
-
General Manager -Env
Chief General Manager-Env.
Dy. General Manager -Env
Chemist
Environmental Engineer
Supporting Staff Supporting Staff

Draft EIA Report for Proposed IMSWMF, Kinduwal (V), Baddi (T), Solan (D), Himachal Pradesh
M/s.Baddi Barotiwala Nalagarh Development Authority EPIP Phase I, Jharmajri, Baddi, Solan (D),
Himachal Pradesh
Ramky Enviro Engineers Ltd, Hyderabad
Chapter 10.1
CHAPTER-10 SUMMARY 10.0 Introduction Baddi Barotiwala Nalagarh Development Authority (BBNDA) is a Special Area Development Authority created by the state government of Himachal Pradesh in 2006 for comprehensive and regulated development of the Baddi, Barotiwala, Nalagarh area (BBNA), which is one of the important growth centre’s of Himachal Pradesh having two major urban settlements,. Baddi Municipal Council and Nalagarh Municipal Council and 41 gram panchyats. To overcome the deficient solid waste management (SWM) system in the area, BBNDA intends to facilitate an integrated Municipal Solid Waste Management facility by creating an efficient waste, collection, segregation transportation, processing and disposal mechanism in conformity with the Municipal Solid Waste (Management and Handling) Rules, 2000. As per EIA Notification S.O.No 1533 dated 14th
Components
Sep 2006 and its subsequent amendments the proposed project is falling under Project / Activity 7 (i) Common Municipal Solid Waste Management Facility (CMSWMF), Category “A” [even though the project is Category ‘B’ it is treated as Category ‘A’ as the project is located within 10km from interstate boundary (Punjab and Haryana)] and requires environmental clearance from Expert Appraisal Committee, MOEF, New Delhi. 10.1 Project Capacities Details The details of the proposed project activities at present and its time of operation is given in Table 10.1.
Table 10.1 Project Details
Capacity Remarks Receiving Facility 40 TPD Project Capacity Compost Plant 30 TPD Compost/manure 6 TPD Recycling complex 6 TPD Plastic, Paper, Metal, Rubber, Glass, etc Secured Land fill 9 TPD Inert’s Lechate collection 15.5 TPD Reuse for windrow sprinkling Project Cost Rs. 970.00 Lakhs Development will be in Phased manner MSW expected to increase @5% per annum To cater the increased capacity, individual treatment facilities components will be augmented proportionately
10
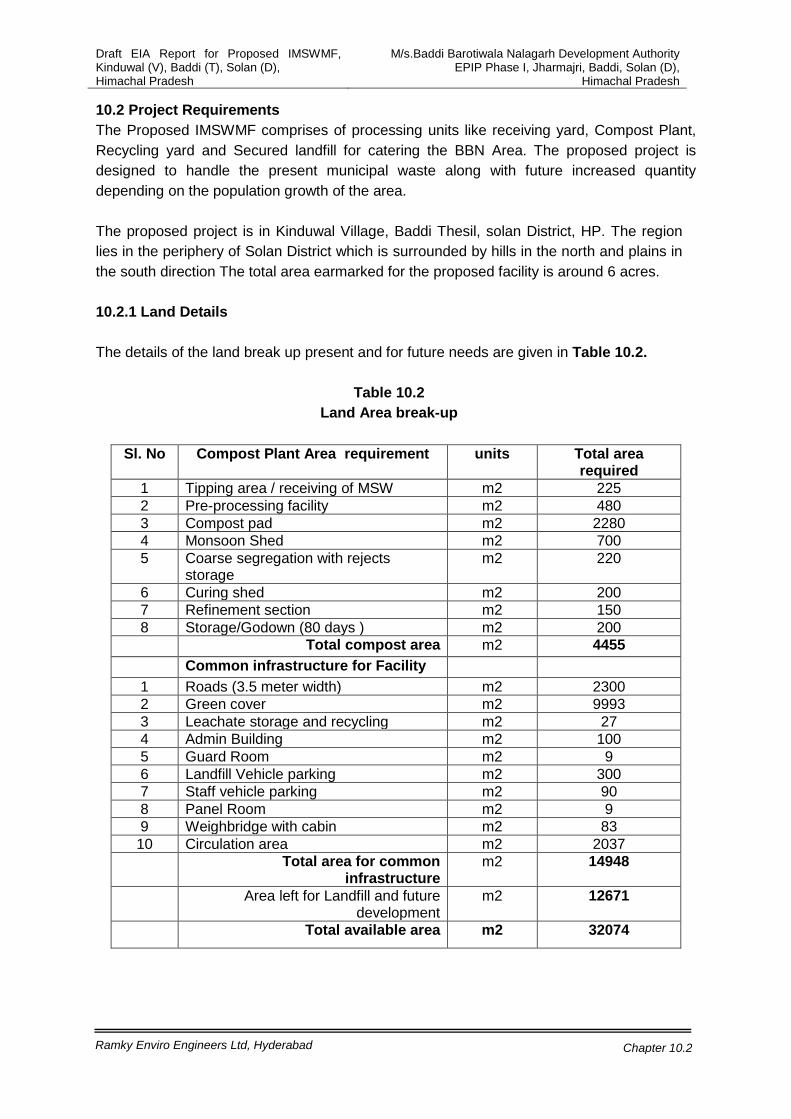
Draft EIA Report for Proposed IMSWMF, Kinduwal (V), Baddi (T), Solan (D), Himachal Pradesh
M/s.Baddi Barotiwala Nalagarh Development Authority EPIP Phase I, Jharmajri, Baddi, Solan (D),
Himachal Pradesh
Ramky Enviro Engineers Ltd, Hyderabad
Chapter 10.2
10.2 Project Requirements The Proposed IMSWMF comprises of processing units like receiving yard, Compost Plant, Recycling yard and Secured landfill for catering the BBN Area. The proposed project is designed to handle the present municipal waste along with future increased quantity depending on the population growth of the area. The proposed project is in Kinduwal Village, Baddi Thesil, solan District, HP. The region lies in the periphery of Solan District which is surrounded by hills in the north and plains in the south direction The total area earmarked for the proposed facility is around 6 acres. 10.2.1 Land Details The details of the land break up present and for future needs are given in Table 10.2.
Table 10.2
Land Area break-up
Sl. No Compost Plant Area requirement units Total area required
1 Tipping area / receiving of MSW m2 225 2 Pre-processing facility m2 480 3 Compost pad m2 2280 4 Monsoon Shed m2 700 5 Coarse segregation with rejects
storage m2 220
6 Curing shed m2 200 7 Refinement section m2 150 8 Storage/Godown (80 days ) m2 200 Total compost area m2 4455 Common infrastructure for Facility
1 Roads (3.5 meter width) m2 2300 2 Green cover m2 9993 3 Leachate storage and recycling m2 27 4 Admin Building m2 100 5 Guard Room m2 9 6 Landfill Vehicle parking m2 300 7 Staff vehicle parking m2 90 8 Panel Room m2 9 9 Weighbridge with cabin m2 83 10 Circulation area m2 2037 Total area for common
infrastructure m2 14948
Area left for Landfill and future development
m2 12671
Total available area m2 32074
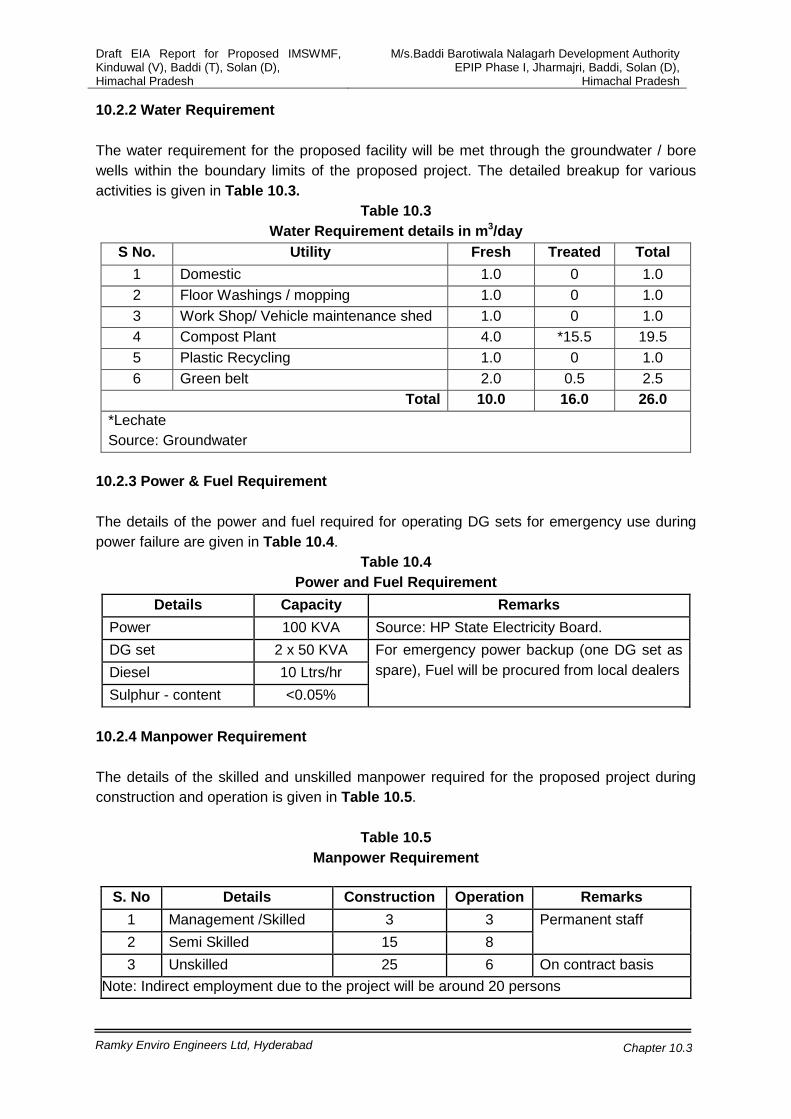
Draft EIA Report for Proposed IMSWMF, Kinduwal (V), Baddi (T), Solan (D), Himachal Pradesh
M/s.Baddi Barotiwala Nalagarh Development Authority EPIP Phase I, Jharmajri, Baddi, Solan (D),
Himachal Pradesh
Ramky Enviro Engineers Ltd, Hyderabad
Chapter 10.3
10.2.2 Water Requirement The water requirement for the proposed facility will be met through the groundwater / bore wells within the boundary limits of the proposed project. The detailed breakup for various activities is given in Table 10.3.
Table 10.3 Water Requirement details in m3
S No. /day
Utility Fresh Treated Total 1 Domestic 1.0 0 1.0 2 Floor Washings / mopping 1.0 0 1.0 3 Work Shop/ Vehicle maintenance shed 1.0 0 1.0 4 Compost Plant 4.0 *15.5 19.5 5 Plastic Recycling 1.0 0 1.0 6 Green belt 2.0 0.5 2.5
Total 10.0 16.0 26.0 *Lechate Source: Groundwater
10.2.3 Power & Fuel Requirement The details of the power and fuel required for operating DG sets for emergency use during power failure are given in Table 10.4.
Table 10.4 Power and Fuel Requirement
Details Capacity Remarks Power 100 KVA Source: HP State Electricity Board. DG set 2 x 50 KVA For emergency power backup (one DG set as
spare), Fuel will be procured from local dealers Diesel 10 Ltrs/hr Sulphur - content <0.05%
10.2.4 Manpower Requirement
The details of the skilled and unskilled manpower required for the proposed project during construction and operation is given in Table 10.5.
Table 10.5
Manpower Requirement
S. No Details Construction Operation Remarks 1 Management /Skilled 3 3 Permanent staff 2 Semi Skilled 15 8 3 Unskilled 25 6 On contract basis
Note: Indirect employment due to the project will be around 20 persons

Draft EIA Report for Proposed IMSWMF, Kinduwal (V), Baddi (T), Solan (D), Himachal Pradesh
M/s.Baddi Barotiwala Nalagarh Development Authority EPIP Phase I, Jharmajri, Baddi, Solan (D),
Himachal Pradesh
Ramky Enviro Engineers Ltd, Hyderabad
Chapter 10.4
10.3 Baseline Environmental Status The baseline data generation has been carried out during summer season in 2012. The predominant wind direction during summer season was NW followed by W. The ambient air quality was monitored at 10 locations and the results obtained are given in Table 10.6.
Table 10.6 Ambient Air Quality Results (µg/m3
Details )
PM<2.5µ PM<10µ SO NOx 2 Minimum 35.6 43.2 5.6 13.5 Maximum 49.7 76.5 13.1 25.9 As per MoEF Standard – Indus, Resd, Rural
60 100 80 80
Water samples in the study area were collected from ground water sources and analyzed for physical and chemical characteristics. The summary of important parameters are given in Table 10.7.
Table 10.7 Summary of Water Quality analysis
Parameters Units Minimum Maximum Standards IS 10500 Drinking water
Desirable Permissible pH 7.48 8.03 6.5 to 8.5 6.5 to 8.5 Dissolved solids mg/l 283 876 500 2000 Chlorides mg/l 14.78 374.5 250 1000 Hardness mg/l 150 550 300 600 Fluorides mg/l 0.17 0.38 1.0 1.5
Baseline noise levels have been monitored at 10 locations within the study zone, using a spot noise measurement device. The results are presented in Table 10.8.
Table 10.8
Noise Levels – dB(A) Parameters Minimum Maximum Standard
Industrial Commercial Residential Day Equivalent
50.2 54.6 75 65 55
Night Equivalent
40.0 42.7 70 55 45
To determine the impact on agricultural productivity of soil due to the proposed activity soil samples were collected at 10 locations. The summary of the results obtained are presented in Table 10.9 and compared with Indian Council of Agricultural Research standards.

Draft EIA Report for Proposed IMSWMF, Kinduwal (V), Baddi (T), Solan (D), Himachal Pradesh
M/s.Baddi Barotiwala Nalagarh Development Authority EPIP Phase I, Jharmajri, Baddi, Solan (D),
Himachal Pradesh
Ramky Enviro Engineers Ltd, Hyderabad
Chapter 10.5
Based on the analytical request of all the, air, water and noise samples collected from various locations within the 10km radius of the proposed. Project site, the baseline environmental status is fairly good and the pollutant parameters were all within the regulatory standards.
Table 10.9 Soil Quality in study area
Parameters Minimum Maximum Standard Normal Tending
to become alkaline
Alkaline
pH 6.67 8.23 6.0 to 8.5
8.5 to 9.0 Above 9.0
EC (μs) 69 292 1.0 1.01 to 2.00
2.01 to 4.00
Low Medium High Organic Carbon % 0.26 1.73 <0.5 0.5 to 0.75 >0.75 Nitrogen (kg/Ha) 257 467 <280 280 to 560 >560 Phosphorous (kg/Ha)
1.8 4.8 <10 10 to 25 >25
Potassium (kg/Ha) 6.3 107 <110 110 to 280 >280 A detailed flora and fauna studies were carried out in and around the study area, and the study indicated that there are no rare or endangered or endemic or threatened species either in the project site or in the study area. 10.4 Anticipated Environmental Impacts All the potential significant environmental impacts associated with the project were studied. The effective utilisation of Municipal Solid Waste will help in improvement of aesthetic look of the Baddi town. The proposed Integrated Municipal Solid Waste Management Facility Project has insignificant impacts on the environment with reference to process operations and odour control etc. These minor impacts will be mitigated with proper control measures that can be adopted at the time of design and operations. 10.5 Analysis of Alternatives There are number of technological options for treatment and disposal of municipal solid waste, but every option has its distinct merits and limitations, which guide us to choose appropriate technology for a given local condition. Among the various treatment and disposal options, MoEF has notified composting (windrow composting, vermi composting), anaerobic digestion, incineration, pelletization and landfill technologies and has given relevant standards for compost quality, leachate disposal, incineration operations and emissions and landfill specifications.

Draft EIA Report for Proposed IMSWMF, Kinduwal (V), Baddi (T), Solan (D), Himachal Pradesh
M/s.Baddi Barotiwala Nalagarh Development Authority EPIP Phase I, Jharmajri, Baddi, Solan (D),
Himachal Pradesh
Ramky Enviro Engineers Ltd, Hyderabad
Chapter 10.6
The proposed project is planned in accordance to the MSW rules 2000 and it consists of Compost plant, Recyclable segregation facility, Secured Landfill, Leachate treatment and reuse facility. 10.6 Environmental Monitoring Plan The main concept of environmental monitoring programme is aimed such that there is not much of time lack between commencements of damage to environment mitigation measures to various environmental parameters that are being affected.
Environmental monitoring programme has been prepared for assessing the efficiency of implementation of Environment Management Plan the details of the same are given in Table 10.10. In order to comply with the environmental protection measures as suggested in the above sections, a budgetary provision for Environmental Protection is given in Table 10.11
Table 10.10 Environmental Monitoring Plan
Environmental Component
Locations Frequency Parameters
Ambient Air Quality Nearby habitations, upwind, downwind, crosswind
Monthly basis
PM10, PM2.5 SO2, NOx, CH4, CO, Ammonia, Odour
Stack Emissions DG Set Monthly SPM, SO2 and NOx Noise Within site ( DG set,
Compost yard, land fill area) and nearest habitation
Monthly Noise Levels
Ground water / surface waters
Piezometers around the landfill, groundwater & surface water from nearby villages
Monthly IS 10500:1991 drinking water parameters
Leachate Windrow, compost plant, Secured landfill,
Monthly SS, TDS, pH, BOD, COD, As, CN, Cl
Wastewater Septic tank/STP Monthly
Landfill gas Landfill area Monthly Methane & CO2
Plantation Greenbelt Half yearly Survival of plants and replacement of immature plants
Compost Final product Monthly As, Cd, Cr, Cu, Pb, Hg, Ni, Zn, C/N ratio, pH, N, P, K.

Draft EIA Report for Proposed IMSWMF, Kinduwal (V), Baddi (T), Solan (D), Himachal Pradesh
M/s.Baddi Barotiwala Nalagarh Development Authority EPIP Phase I, Jharmajri, Baddi, Solan (D),
Himachal Pradesh
Ramky Enviro Engineers Ltd, Hyderabad
Chapter 10.7
Table 10.11 Budget details for Environmental Management Plan
S. No Particulars Capital Cost (Rs)
Lakhs
Recurring Cost (Rs)
Lakhs/annum 1 Air Pollution Control Systems
Water sprinklers, Water tanker, etc 5.0 0.50
2 LT collection system, holding tank, STP, etc 5.0 0.60 3 Gas collection, management, etc 2.5 0.20 4 Noise Control measures – Acoustic enclosures
for DG set, Noise barriers for pumps, boiler, PPE, etc
1.5 0.20
5 Greenbelt development 2.0 0.50 6 Rainwater harvesting, storm water drains, 2.0 0.20 8 Ambient Air quality monitoring, Laboratory
equipments, etc 4.0 0.20
9 Third party monitoring, energy audit, environmental audit, training programs, etc
0 0.60
10 Construction of Embankment along Sirsa River 100m length
100 1.00
Total 122 4.00 Capital Cost of the project is Rs.970.00 Lakhs
10.7 Risk Analysis The principal objective of the risk assessment study is to identify and quantify the major hazards and the risk associated with various operations of the proposed project, which may lead to emergency consequences (disasters) affecting the public safety and health. As the proposed project does not handle any hazardous substances except diesel for meeting the fuel requirements of DG sets and vehicles carrying municipal solid waste. The Risk associated with MSW management facility are the life of vehicles, maintenance of transport vehicles, operations of land fill activities, slopes, leachate generation and collection, bund stabilities etc. The regular preventive maintenance of all these activities, will reduce the expected risks at site operations. 10.8 Project Benefits From the proposed project the major benefits, include existing is improving the degraded environment by establishing a scientific Integrated Municipal Solid Waste Management Facility. Due to the proposed project there will be several benefits.
• •
Reduction in Greenhouse Gas Emissions
• Can increase the life of landfill sites
• Energy Conservation
• Usable compost product Plastic Recycled Supply and Demand etc

Draft EIA Report for Proposed IMSWMF, Kinduwal (V), Baddi (T), Solan (D), Himachal Pradesh
M/s.Baddi Barotiwala Nalagarh Development Authority EPIP Phase I, Jharmajri, Baddi, Solan (D),
Himachal Pradesh
Ramky Enviro Engineers Ltd, Hyderabad
Chapter 10.8
10.9 Environmental Management Plan The Environmental Management Plan (EMP) is required to ensure sustainable development in the area of the proposed project site. Hence, it needs proper Environmental Management Plan (EMP) to meet these objectives. The purpose of the Environmental Management Plan (EMP) is to minimize the potential environmental impacts from the project and to mitigate the adverse impacts. EMP reflects the commitment of the project management to protect the environment as well as the neighbouring populations. The potential environmental impacts envisaged from the project are studied on the following environmental components:
• Air pollution from power plant, D.G set, movement of vehicles • Noise pollution during operation of machinery • Odour from compost plant, secured landfill operations • Water pollution due to the leachate generation • Soil and ground water pollution
Construction activity involves site levelling and construction of admin building, windrows platform, Municipal Solid Waste storing Sheds, Leachate Treatment Plant etc., are envisaged. However during construction activities if any dust is generated, it will be controlled by using water spraying on roads and other dust generating sources. 10. 9.1 Air Quality Management The main activities from the proposed project which cause air pollution are as follows:
• Sulphur dioxide and Nitrogen oxide from DG sets • Dust particulates due to movement of vehicles and road sweepings • Temperature & Odour from Compost plant on unpaved roads • Gas generation from secured landfill
The following methods of abatement will be employed for the air pollution control.
• DG set will be provided with a stack height meeting MOEF Guidelines or 1 m above the tallest structure in the project area for proper dispersion of sulfur dioxide and oxides of nitrogen.
• Internal roads will be asphalted to reduce dust emissions • Speed restriction will be followed within the project and speed breakers will be
provided at entry and exit points • Proper moisture, oxygen and C:N ratio will be maintained to minimize the odour
and to maintain adequate temperature in compost plant • Gas management system in secured landfill will be provided • Green belt will be provided
along the internal roads and plant boundary.

Draft EIA Report for Proposed IMSWMF, Kinduwal (V), Baddi (T), Solan (D), Himachal Pradesh
M/s.Baddi Barotiwala Nalagarh Development Authority EPIP Phase I, Jharmajri, Baddi, Solan (D),
Himachal Pradesh
Ramky Enviro Engineers Ltd, Hyderabad
Chapter 10.9
10.9.2 Odour Control The odour management is one the issue in landfills. The main aim is to minimize the number of sources of odour generation which exist in site. To undertake direct management of odour generating sources that give rise to odour problems. The mitigation measures proposed to minimize and control odour are as follows.
• •
Maintaining proper air and moisture in the compost plant and windrow area
•
Odour reduction or neutralize by spraying Ecosorb (organic and biodegradable chemical) around the odour generating areas at regular intervals.
•
Covering the landfill area under operation daily with layer of earth, clay or a similar material Covering by
10.9.3 Water Quality Mitigation Measures The main wastewater generation sources in the proposed project are domestic wastewater, leachate generation from compost plant and secured land fill area. The domestic waste water will be treated in septic tank followed soak pit or in portable STP, the treated water will be used for flushing, greenbelt development. 10.9.4 Noise Mitigation Measures The noise pollution management measures proposed are given below.
using heavy duty hessian, plastics and foams considerable odour can be minimized.
• Acoustic Enclosure for all the high noise level equipments • All the design/installation precautions as specified by the manufacturers with respect
to noise control are strictly adhered to • Noise generating sources are insulated adequately by providing suitable enclosures • Other than the regular maintenance of the various equipment, ear plugs are provided
to the personnel close to the noise generating units; • All the openings like covers, partitions are designed properly.
10.9.5 Greenbelt The green belt developed helps to capture the emissions, attenuate the noise generated and improve the aesthetics. Attempts will be made to ensure that all open spaces, where tree plantation may not possible, will be covered with shrubs and grass to prevent erosion of topsoil. An area of 33.3% will be earmarked for development of greenbelt along the boundary, roads, and in open places etc.
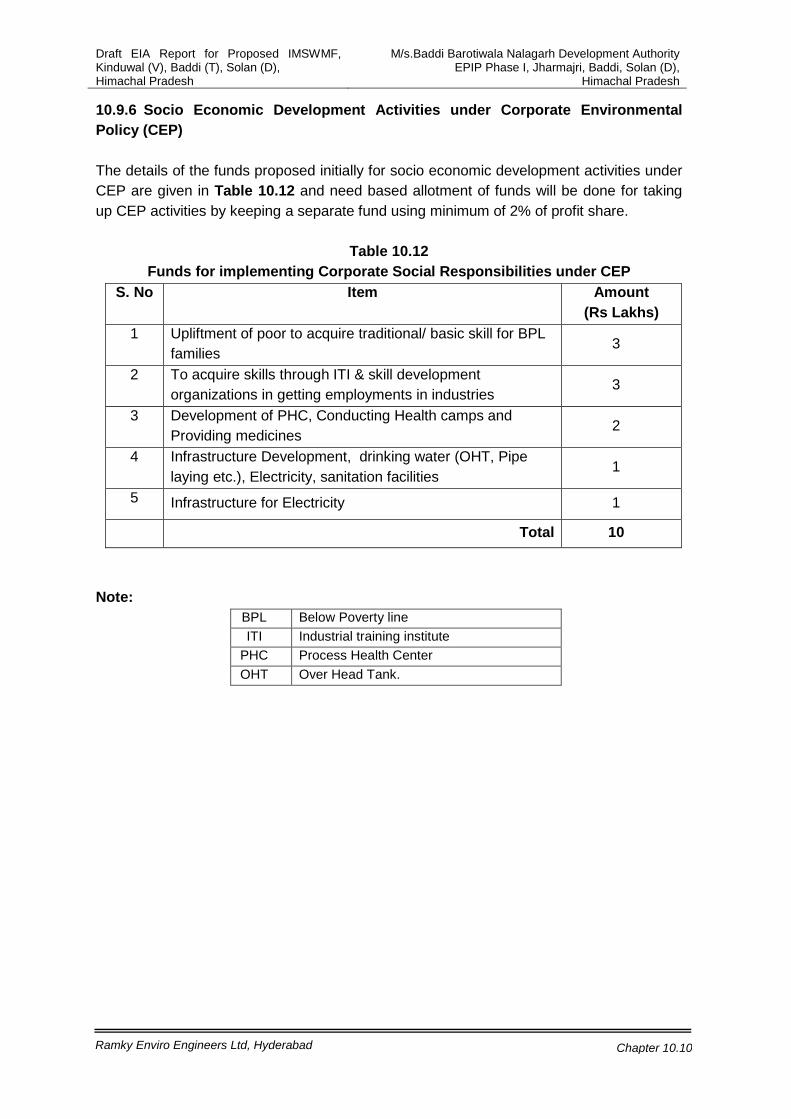
Draft EIA Report for Proposed IMSWMF, Kinduwal (V), Baddi (T), Solan (D), Himachal Pradesh
M/s.Baddi Barotiwala Nalagarh Development Authority EPIP Phase I, Jharmajri, Baddi, Solan (D),
Himachal Pradesh
Ramky Enviro Engineers Ltd, Hyderabad
Chapter 10.10
10.9.6 Socio Economic Development Activities under Corporate Environmental Policy (CEP) The details of the funds proposed initially for socio economic development activities under CEP are given in Table 10.12 and need based allotment of funds will be done for taking up CEP activities by keeping a separate fund using minimum of 2% of profit share.
Table 10.12
Funds for implementing Corporate Social Responsibilities under CEP S. No Item Amount
(Rs Lakhs) 1 Upliftment of poor to acquire traditional/ basic skill for BPL
families 3
2 To acquire skills through ITI & skill development organizations in getting employments in industries
3
3 Development of PHC, Conducting Health camps and Providing medicines
2
4 Infrastructure Development, drinking water (OHT, Pipe laying etc.), Electricity, sanitation facilities
1
5 Infrastructure for Electricity 1
Total 10
Note: BPL Below Poverty line ITI Industrial training institute
PHC Process Health Center OHT Over Head Tank.

Draft EIA Report for Proposed IMSWMF, Kinduwal (V), Baddi (T), Solan (D), Himachal Pradesh
M/s. BaddiBarotiwalaNalagarh Development Authority EPIP Phase I, Jharmajri, Baddi, Solan (D),
Himachal Pradesh
Ramky Enviro Engineers Ltd, Hyderabad
Chapter 11.1
CHAPTER -11 DISCLOSURE OF CONSULTANTS 11.1 Ramky Group Ramky, founded in the year 1984, today spans into a specialist multi-disciplinary organization focused in areas of Civil, Environment & Waste Management Infrastructure with specific emphasis on ‘Public Private Partnership’ Projects. The corporate office of the group is located at Hyderabad and the regional offices are located at Delhi, Mumbai, Ahmedabad, Bangalore, Chennai, Bhopal and Kolkata. The major companies of the group are 1) RAMKY Infrastructure Ltd, 2) RAMKY Enviro Engineers Ltd, 3) Ramky Estates & Farms Pvt. Ltd. and 4) Smilax Laboratories Ltd.
11.2 RAMKY Enviro Engineers Limited Ramky Enviro Engineers Limited (REEL) is the consulting arm of the group provides vital function of effectively providing the backward linkage to the project implementation function in the form of concepts, strategies, structuring, planning and designing infrastructure projects. A multi and cross disciplinary team of professionals, offering solution at each stage of the life cycle of a project.Consultancy Division is one of the departments of REEL. The services offered by the consultancy division are given below. 11.2.1 Consultancy Services
• Facilitating in obtaining Environmental Clearances from MOEF, New Delhi and
SEAC’s from various states • Obtaining Consent for Establishment & Consent for Operation from state
pollution Control Boards Preparing of Environmental Impact Assessment Reports.
• Environmental Audits to help industries to recycle and reuse resources and plan for low polluting technologies.
• Risk Assessment Studies for hazardous chemical storage & Process in order to devise viable onsite and offsite emergency plans.
• Identification and evaluation of hazardous Waste disposal sites. • Preparation of Detailed Project Reports of MSW, HWMP, BMW • Environmental management systems, training, documentation and
implementation as per ISO: 14001:1996 Standards. • Characterization and quantification of biomedical waste, municipal solid waste
and design of disposal facilities.
11

Draft EIA Report for Proposed IMSWMF, Kinduwal (V), Baddi (T), Solan (D), Himachal Pradesh
M/s. BaddiBarotiwalaNalagarh Development Authority EPIP Phase I, Jharmajri, Baddi, Solan (D),
Himachal Pradesh
Ramky Enviro Engineers Ltd, Hyderabad
Chapter 11.2
• Environmental management strategies to mitigate adverse impacts arising out of developmental activities.
• Effluent treatment plant design after thorough review of process, reaction mass balance and treatability studies of effluents
• Post project Monitoring network design • Consultancy Services for setting up environmental laboratories • Design of Sewage treatment plants • Design of Waste treatment plants • Health and socio- economic surveys • Resettlement and rehabilitation plans • Systemsdevelopment for ISO:9000,OSHAS:18000,NABL,ISO:17025 Standards
11.2.2 Laboratory services
• Analysis of air samples for ambient air quality and those collected from industrial
sources for both routine and industry specific pollutants • Water and wastewater analysis for important parameters as for standard
methods, including pesticides and poly hydro carbons • Solid and hazardous waste analysis including TCPL tests • Monitoring of noise levels at source and in ambient air • Development of new methods and quality assurances of results obtained • Design and settings of laboratories
11.2.3 Training services
• Monitoring of environmental parameters –air, water, noise, soil etc… • Environmental impact assessments • Effluent treatment plant operations and maintenance • Sewage treatment plant operations and maintenance • ISO 9000&14000, OHSAS 18000 Awareness, documentations, internal auditors • Establishment environmental laboratories • Pollution control in industries • Biomedical waste management
11.2.4 Field Services
• Site selection and suitability studies for settling up of Industries • Ambient Air Quality monitoring for all pollutants • Noise Level Monitoring • Meteorological data collection as per CPCB norms • Stack Emission monitoring for all pollutants and assessment of efficiency of
control equipment • Water, Wastewater and Soil Sample Collection

Draft EIA Report for Proposed IMSWMF, Kinduwal (V), Baddi (T), Solan (D), Himachal Pradesh
M/s. BaddiBarotiwalaNalagarh Development Authority EPIP Phase I, Jharmajri, Baddi, Solan (D),
Himachal Pradesh
Ramky Enviro Engineers Ltd, Hyderabad
Chapter 11.3
• Assessment of efficiency of ETP and analyzing critical parameters of field. • Flora and Fauna assessment through sectorial studies and damage assessment
due to development projects • Damage Assessment studies in case of oil well blowouts, major industrial
accidents, etc., 11.2.5 Treatment Plant Services
• Water Treatment Plants-design, construction, operation and maintenance • Efficiency studies of Effluent Treatment plants • Design, construction, operation and maintenance of ETP • Up gradation/modification of ETP • Sewage Treatment Plants-design, construction, operation and maintenance
along with mechanical equipment erection • Supply of mechanical equipment
11.2.6 Solid Waste Management Services • Industrial Waste Management • Hazardous Waste Management • Municipal Solid Waste Management • Biomedical Solid Waste Management
The Company has over 2000 employees in various sectors of which over 600 employees are post graduates and about 15 employees are having Ph.D’s. 11.3EIA Coordinator and FAEs involved in Report Ramky Enviro Engineers Ltd is listed in Office Memorandum issued by MOEF dated 30th
The List of Experts
Sep 2011, List ‘A’ Accredited / Conditionally accredited consultants serial no 76. The list of EIA Coordinators and Functional area experts involved in report are given in Table 11.1.
Table 11.1
EIA Co-ordinator Name of EIA Co-ordinator Signature
Mrs.B.Padmaja10.5
Functional Area Experts Name of Expert FAE Code Signature

Draft EIA Report for Proposed IMSWMF, Kinduwal (V), Baddi (T), Solan (D), Himachal Pradesh
M/s. BaddiBarotiwalaNalagarh Development Authority EPIP Phase I, Jharmajri, Baddi, Solan (D),
Himachal Pradesh
Ramky Enviro Engineers Ltd, Hyderabad
Chapter 11.4
Dr.B.Chakradhar RH
Mr.V.Vijay Kumar AQ
Dr.B.Chakradhar NV
Ms.Beebi Asia Shaik
SW
Mr.B.Mallikarjuna Rao HG
GS
Mr.Minhajuddin Ahmed Faruqi EB
Mr.N.Vamsee Krishna AP
Mr.V.Vijay Kumar WP
Mr.Dushyant Mishra LU
SE The Analysis was carried out in Laboratory of Hyderabad Waste Management Project a subsidiary company under REEL which is recognized by MOEF vide notification dated 9th
Jan, 2008 as Environmental Laboratory under the EP-Act 1986 (29 of 1986). The recognition is valid till 8-1-2013.
RAMKY Enviro Engineers Ltd

Finalisation of TOR for Integrated Municipal Solid Waste Management project at Kinduwal Village, Solan District, by M/s Addl Chief Executive Officer, BBNDA, Baddi, Himachal Pradesh, (HP) As presented by the project proponent, the proposal is for development of Integrated Municipal Solid Waste Management project at Kinduwal (V), Solan District, Baddi, Himachal Pradesh. The project is proposed for 2 major urban settlements, Baddi Municipal Council, Nalagarh Council and 41 Gram Panchayats. The Population as per 2001 census, is Baddi -22601. Nalagarh-9443 and Gram Panchayat-1, 12,520 the population growth is very high. The project is category ‘B’ however; it is treated as category ‘A’ since it is located within 10 km from interstate boundary (Punjab and Haryana). The proposed capacity is 40 TPD. Total area of land is 2.42 ha at Kinduwal Village. Nearest water bodies is Sirsa River 0.10 km on Western side and Balad Nadi -3km at SE. Nearest forest area is Kolhai Dun Reserve forest -0.5km at Western side. Nearest airport is Chandigarh airport at 40 km. The proposed site has been earmarked for CETP/MSW. The proposed facility involves segregation certification of MSW, composting and Sanitary landfill. Water requirement is estimated at 10KLD and will be met from ground water. The waste water expected will be 16.13KLD including 0.8 from domestic, 15 from composting leachate and 0.5 from sanitary landfill leachate. The leachate generated is proposed to be reused for maintaining moisture and temperature in composting AM and the cost of the proposed project is Rs. 953.62 lakhs.
During the discussions, the Committee finalized the following TOR for further study Sl. No
TOR Point Replies
(i) Submit the details of Site selection criteria adopted vis-a vis the guidelines and the justification for selection of the proposed site out of 8 sites.
BBNDA has examined about 4 alternative sites namely,
1. Bhatolikalan at the existing dumping site in Baddi Municipal Council,
2. Nalagarh near the dump site of Nalagarh Municipal Council,
3. Dabotta located at 30km away from Baddi, and 10km from Nalagarh
4. Kenduwal located near the Kenduwal village
The sites were selected based on the site selection criteria of CPCB/MOEF, New Delhi. The justification of the site selection Criteria explained in detail in Chapter-5 of EIA report under section 5.1.1.
(ii) The project should be designed based on the population
The project is designed based on the population projections and the waste generation growth of

projections as per Master Plan of the city.
the BBNDA area. A detailed project report was prepared for BBNDA area by the reputed private organization. The total population of BBNDA is around 132,194 for the year 2011 and the total waste generation amounts to about 32.68 TPD. The proposed project is designed for 40 TPD. However the population projections and the waste generation trends are mentioned in Chapter-2.
(iii) Submit a 10km. radius map (on survey of India topo sheet) showing co-ordinates of project site, national highway, state highway, district road/approach road, river, canal, natural drainage; protected areas, under Wild Life (Protection) Act, archaeological site, natural lake, flood area, human settlements (with population), industries, high tension electric line, prominent wind direction (summer and winter), effluent drain, if any and ponds etc. should be presented and impacts assessed on the same.
10km radius map (on survey of India topo sheet) showing co-ordinates of project site, National Highway, State highway, district road/approach road, river, canal, natural drainage; protected areas, under Wild Life (Protection) Act, archaeological site, Natural lake, flood area, human settlements (with population), industries, high tension electric line, prominent wind direction (summer and winter), effluent drain, if any and ponds etc is enclosed as Annexure-1 and is also shown in Chapter- 3, Page No:3.4.
(iv) Examine and submit details of storm water/ leachate collection from the composted area.
Based on the rainfall intensity of the plant area, storm water drainage system will be designed. The total Quantity of Runoff calculated is about 17640 m3 out of which Rainwater available for harvesting is about 5292 m3
.
It will be ensured that the wastewater will be reused / discharged after it meets all the regulatory standards.
Strom water drainage system consists of well-designed network of open surface drains with check dams at appropriate distances to improve the infiltration efficiency of the rain water into ground so that all the storm water is efficiently drained off without any water logging.

The total Leachate generation from the facility is around 15.5 cum/day from compost plant and landfill. The leachate generated will be collected and sprayed on windrow to maintain suitable temperature and moisture. Details enclosed in Chapter-9 in section 9.3.4, 9.3.5 and 9.3.6.
(v) Examine and submit details of monitoring of water quality around the landfill site. Water analysis shall also include for nitrate and phosphate.
Details of monitoring of water quality around the landfill site and water analysis which includes nitrate and phosphate are enclosed in Chapter-3- Details enclosed as Annexure-2.
(vii) Examine and submit details of the odour control measures.
The mitigation measures proposed to minimize and control odour are as follows.
•
•
Maintaining proper air and moisture in the compost plant and windrow area.
•
Dilution of odourant by odour counteraction or neutralize by spraying Ecosorb (organic and biodegradable chemical) around odour generation areas at regular intervals.
•
Covering the landfill area under operation daily with layer of earth, clay or a similar material. Covering by
Details covered in Chapter-9 in section 9.3.2.
using heavy duty hessian, plastics and foams odour can be minimized.
(viii) Examine and submit details of impact on water bodies/rivers/ ponds and mitigative measures during rainy season.
The impact on water bodies/rivers/ponds will be minimal in nature. The domestic wastewater generated from the facility will be treated in septic tank followed soak pit and the treated water will be used for flushing, greenbelt development. Leachate treatment plant will be provided for treating leachate and the treated leachate will be used for wetting of windrow. As the area is barren and devoid of top soil in most locations, trenches will be dug out across the slope and filled with the compost obtained from the nearby old dump yards. Rain water will be diverted to the trenches. Tall and evergreen plants will be closely planted in the trenches.

Watering and application of manure will be made as and when required. Details are covered in Chapter- 9 Section 9.3.4 and 9.5.
(ix) Submit the criteria for assessing waste generation.
The Detailed Project Report is prepared In accordance to the Central Public Health and Environmental Engineering Organization (CPHEEO) manual and MSW rules 2000 to improve the Municipal Solid Waste Management services within the Municipal limits of BBNDA Area. The population projections were calculated based on the decadal growth method and the waste generation projections were estimated based on the per capita waste generation rate of BBNDA. The total population of BBNDA is around 132,194 for the year 2011 and the total waste generation amounts to about 32.68 TPD. The proposed project is designed for 40 TPD.
(x) Submit a copy of the layout plan of project site showing solid waste storage, green belt (width & length, 33% of the project area), all roads, prominent wind direction, processing plant & buildings etc. should be provided.
The detailed layout showing solid waste storage, green belt (width & length, 33% of the project area), all roads, processing plant & buildings etc are shown in layout enclosed as Annexure-3 and also covered in Chapter-2,Figure -2.4 and 2.5.
(xi) Submit a copy of the land use certificate from the competent authority.
Land use certificate from the competent authority enclosed as Annexure-4.
(xii) Submit a copy of the status of ambient air quality and surface and ground water quality, soil type, cropping pattern, land use pattern, population, socio-economic status, anticipated air and water pollution.
Status of ambient air quality and surface and ground water quality, soil type, cropping pattern, land use pattern, population, socio-economic status enclosed as Annexure-5 and are also explained in Chapter- 3 from Section- 3.4, 3.5, 3.8, 3.10 and 3.11. Anticipated air and water pollution is enclosed as Annexure-6 and explained in detail in Chapter-4

in section no: 4.1.1 to 4.1.4. (xiii) Submit a copy of the
topography of the area indicating whether the site requires any filling, if so, the details of filling, quantity of fill material required, its source and transportation, etc.
Topographically the project site area is gently sloping towards Northwestern corner of the site. The minimum and maximum elevations are 355.878m and 360.207m respectively with an elevation difference of 4.329m. Since all the units of the proposed facility are falling in elevated grounds requirement of site filling is almost negligible. The contour levels at the site are shown in Annexure-7.
(xiv) Examine and submit the details of impact on the drainage and nearby habitats/settlements (surroundings).
The impact on the drainage and nearby habitats/settlements (surroundings) is minimal in nature. All the units proposed in the facility are technically proven, economically available and environmentally sound with many MSW operations under progress in the country. The total waste received from BBNDA area will be processed immediately and no stagnation of waste will be allowed in the facility. The wastewater generated from the compost plant and the landfill will be treated and reused back into the process. The wastewater will not be allowed to enter into the nearby ponds/river.
(xv) Examine and submit the details of surface hydrology and water regime and impact on the same.
The impact on the surface hydrology of the surrounding areas due to the development of the proposed area is insignificant. All the mitigation measures during the project development and after project implementation were considered and a suitable environmental plan will be implemented in the project area.
(xvi) Examine and submit the details of one complete season AAQ data (except monsoon) with the dates of monitoring, impact of the project on the AAQ of the area (including H2S, CH4
Details of one complete season AAQ data (except monsoon) during March 2012 to May 2012, is provided in the report and the impact of the project on AAQ of the area is assessed.
). H2S in the study area is recorded below detectable limits. CH4 values recorded in the study area are in the range of 0.1 to 0.9 ppm.

The details of the monitoring parameters is given in detail in Chapter-3, Section No.3.6-3.8
(xvii) Submit a copy of detailed plan of waste management.
The detailed plan of waste management consists of
• Compost plant (30 TPD) • Recycling unit (6 TPD) • Landfill area (9 TPD) • Admin/security building etc is proposed in
the proposed facility. All the above treatment facilities are incorporated with proper environment management plans. The detailed material balance is given in Annexure-8 and also covered in Figure 2.8 of Chapter 2.
(xviii) Submit the details of sanitary land fill site impermeability and whether it would be lined, if so details thereof.
The proposed sanitary landfill facility will be designed based on the Central Public Health and Environmental Engineering Organization (CPHEEO) manual and MSW rules 2000 guidelines. The liner specifications followed are • Bottom Liner / Composite Liner: 90cm thick
compacted clay or amended soil • Final Cover : Vegetative layer of 450mm thick
with good vegetation supporting soil • Drainage layer of 150mm thick granular
material with permeability 1 X 10⁻²
• Barrier layer of 600mm thick clay/amended soil with permeability 1 X 10
cm/sec
-7
• Gas venting layer of 200mm thick granular material with permeability 1 X 10
cm/sec
-2
• Base Slope : 2% cm/sec.
• Cover Slope : Not steeper than 1:4 (xix) Submit the details of
assessment of the site in view of impact on smooth movement in religious/pilgrimage areas.
While selecting the site, the CPCB/MoEF site selection Criteria is followed. The areas like smooth movement in religious/pilgrimage were avoided while considering the proposed site. The religious/pilgrimage areas are very minimal in the project area.
(xx) Examine and submit the details of impact on environmental sensitive areas.
The impact on the surrounding environment due to the development of the proposed area is insignificant. All the mitigation measures during the project development and after project

implementation were considered and a suitable environmental plan will be implemented in the project area.
(xxi) Submit Environmental Management Plan and Environmental Monitoring Plan with costs and parameters.
The cost of the Environmental Management plan proposed is Rs.122 lakhs with a recurring cost of Rs. 4.0 lakhs per annum. The detailed breakup of Environmental Management Plan with costs and parameters are enclosed in Table 6.2 of Chapter-6.
(xxii) A high level advisory and monitoring committee which should include to plan executes and maintains the environmental issues/ recommendations mentioned above. The monitoring shall be done at various stages (planning, construction, operation) of project for compliance of conditions. Budgetary provisions shall be made to the satisfaction of this Committee.
An Environmental Cell will be headed by the Project Manager followed by other officers and technicians. The department is the nodal agency to co-ordinate and provides necessary services on environmental issues during operation of the project.This environmental group is responsible for implementation of environmental management plan, interaction with the environmental regulatory agencies, reviewing draft policy and planning. This department interacts with State Pollution Control Board and other environment regulatory agencies. The department also interacts with local people to understand their problems and to formulate appropriate community development plan. The detailed scheme is given in section 9.10 of Chapter- 9.
(xxiii) Any further clarification on carrying out the above studies including anticipated impacts due to the project and mitigative measure, project proponent can refer to the model ToR available on Ministry website “http://moef.nic.in/Manual/”.
To assess the mitigative measures from the project area the model TOR available on Ministry website http://moef.nic.in/Manual/ is considered and the following mitigation measures are addressed in chapter-9 of the EIA report.
• Air Quality Mitigation Measures • Water Quality Mitigation Measures • Noise Mitigation Measures • Solid Waste Mitigation Measures etc.
Public hearing to be conducted for the project as per provisions of Environmental Impact Assessment Notification, 2006 and the issues raised by the public should be addressed in the Environmental Management Plan. A detailed draft EIA/EMP report should be prepared as per the above additional TOR and should be submitted to the Ministry as per the Notification.

Annexure-1 Base map of the study area (10km radius)

Annexure-2 Details of Water quality Monitoring Sampling Locations
S. No Name of the location Direction Distance (km) Remarks W1 Plant Site - Kundiwala Core zone 0.0 Ground water W2 Thana NE 4.5 Ground water W3 Mirzapur SW 3.0 Ground water W4 Baddi SE 2.5 Ground water W5 Kunjahal ESE 6.0 Ground water W6 Routanwala N 7.0 Ground water W7 Kishanpura NW 4.0 Ground water W8 Betawali W 6.5 Ground water W9 Nawanagar SE 4.5 Ground water W10 Kona SE 7.5 Ground water W11 Siwan SW 8.0 Surface water W12 Nawanagar River SE 4.0 Surface water W13 Industrial Domestic (Down) N 0.8 Waste Water W14 Industrial Domestic NE 0.5 Waste Water
Note: Samples collected during March - May-2012.
Water Quality Results of Surface water
S.No Parameter Unit Result
W11 W12 1 TSS mg/L 10 29 2 pH --- 7.71 7.46 3 Chloride as Cl mg/l - 9.86 78.8 4 COD mg/l 8.0 24 5 BOD mg/l <4 <4 6 DO mg/l 4.90 3.90 7 Arsenic as As mg/l <0.05 <0.05 8 Calcium as Ca mg/l 50 80 9 Sulphate as SO4 mg/l -2 10.77 36.00 10 Alkalinity as CaCO mg/l 3 11.5 23.0 11 Turbidity NTU 7.20 17.0 12 Nitrate as NO mg/l 3 1.88 2.59 13 Total Hardness mg/l 70 110

Water Quality characteristics (Ground Water)
S.No
Parameter Unit Result Limit as per IS:10500-1993
W1 W2 W3 W4 W5 W6 W7 W8 W9 W10 Desirable Limit
Permissible Limit
1 Color PtCo 0.40 0.60 0.35 0.60 0.32 0.39 0.43 0.52 0.28 0.67 5.0 25, Max 2 Turbidity NTU 2.90 3.60 4.90 5.50 6.50 12.0 5.90 6.80 12.0 7.80 5.0 10 3 pH --- 7.78 8.03 7.48 7.86 7.63 7.65 7.95 7.60 7.53 7.59 6.5-8.5 - 4 Res Chlorine mg/l <0.2 <0.2 <0.2 <0.2 <0.2 <0.2 <0.2 <0.2 <0.2 <0.2 - - 5 TDS mg/l 283 352 357 868 412 390 304 876 504 351 2000 - 6 Chloride as Cl mg/l - 14.78 44.3 147.8 54.2 162 49.28 14.7 374.5 88.7 24.6 250 1000 7 Sulpates SO4 mg/l -2 11.91 23.97 38.12 23.29 25.08 29.02 7.95 40.49 37.5 17.18 200 400 8 Nitrate as NO mg/l 3 8.89 17.37 27.33 13.25 18.08 23.82 7.12 27.60 27.97 23.35 45.0 -
9 Phosphates mg/l 0.2 0.25 0.38 0.21 0.31 0.36 0.1 0.41 0.43 0.37 - -
10 Alkalinity as CaCO
mg/l 3
23 23 34.5 23 11.5 11.5 23 23 23 11.5 200 600
11 Hexavalent Chromium
mg/l <0.2 <0.2 <0.2 <0.2 <0.2 <0.2 <0.2 <0.2 <0.2 <0.2 0.05 -
12 Total Hardness mg/l 150 230 550 260 350 250 180 630 250 190 300 600 13 Calcium as Ca mg/l 80 130 280 140 190 130 90 320 120 100 75.0 200 14 Iron as Fe mg/l 0.23 0.18 0.34 0.42 0.51 0.41 0.38 0.27 0.55 0.74 0.30 1.0 15 Fluorides as F mg/l - 0.17 0.20 0.32 0.29 0.10 0.16 0.12 0.38 0.16 0.21 1.00 1.5
16 Phenolic Compounds
mg/l <0.2 <0.2 <0.2 <0.2 <0.2 <0.2 <0.2 <0.2 <0.2 <0.2 0.001 0.002
17 Mercury as Hg mg/l <0.1 <0.1 <0.1 <0.1 <0.1 <0.1 <0.1 <0.1 <0.1 <0.1 0.001 - 18 Cadmium as Cd mg/l <0.1 <0.1 <0.1 <0.1 <0.1 <0.1 <0.1 <0.1 <0.1 <0.1 0.01 - 19 Arsenic as As mg/l <0.05 <0.05 <0.05 <0.05 <0.05 <0.05 <0.05 <0.05 <0.05 <0.05 0.01 - 20 Lead as Pb mg/l <0.1 <0.1 <0.1 <0.1 <0.1 <0.1 <0.1 <0.1 <0.1 <0.1 0.05 - 21 Zinc as Zn mg/l <1.0 <1.0 <1.0 <1.0 <1.0 <1.0 <1.0 <1.0 <1.0 <1.0 5.0 15.0 22 Aluminium as Al mg/l <0.1 <0.1 <0.1 <0.1 <0.1 <0.1 <0.1 <0.1 <0.1 <0.1 0.03 0.2 23 Boron as B mg/l <1.0 <1.0 <1.0 <1.0 <1.0 <1.0 <1.0 <1.0 <1.0 <1 1.0 5.0 24 Manganese mg/l <0.5 <0.5 <0.5 <0.5 <0.5 <0.5 <0.5 <0.5 <0.5 <0.5 0.1 0.3 25 Copper as Cu mg/l <0.5 <0.5 <0.5 <0.5 <0.5 <0.5 <0.5 <0.5 <0.5 <0.5 0.05 1.5

Annexure-3
Project Layout showing CETP and MSW

MSW Management Facility - Layout

Layout map showing green belt

Annexure-4 Approved Land Use Plan
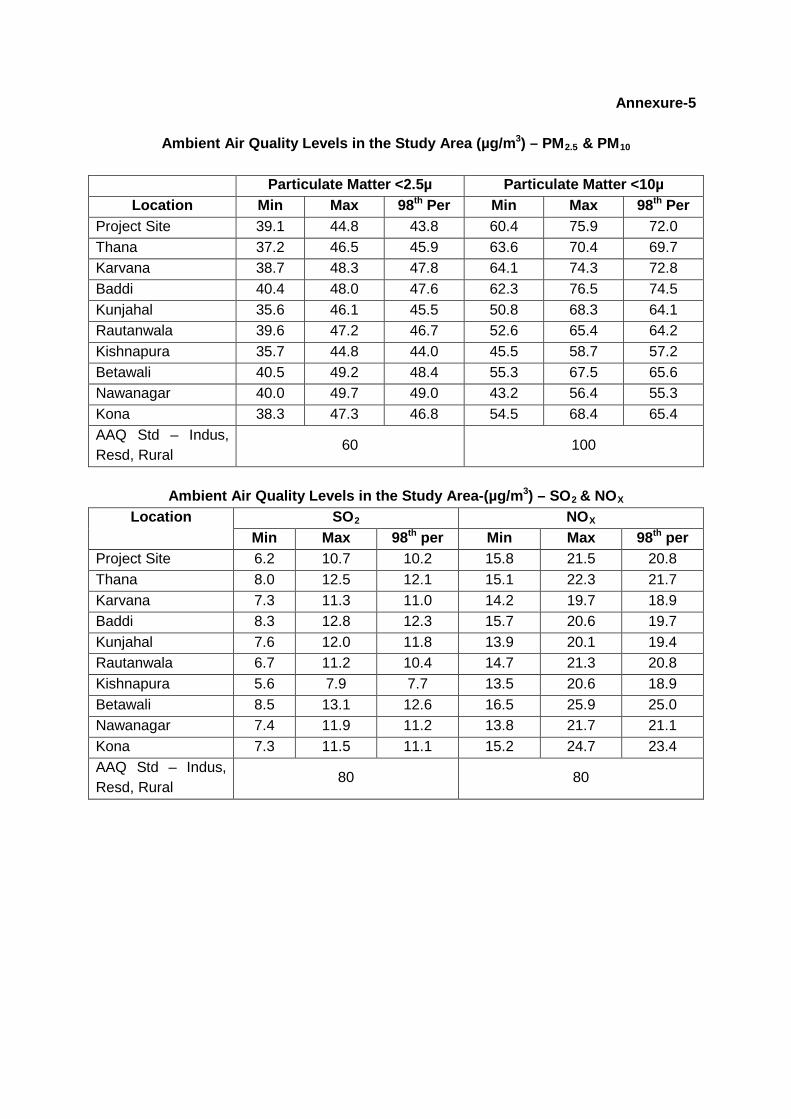
Annexure-5
Ambient Air Quality Levels in the Study Area (µg/m3) – PM2.5 & PM
10
Particulate Matter <2.5µ Particulate Matter <10µ Location Min Max 98th Min Per Max 98th Per
Project Site 39.1 44.8 43.8 60.4 75.9 72.0 Thana 37.2 46.5 45.9 63.6 70.4 69.7 Karvana 38.7 48.3 47.8 64.1 74.3 72.8 Baddi 40.4 48.0 47.6 62.3 76.5 74.5 Kunjahal 35.6 46.1 45.5 50.8 68.3 64.1 Rautanwala 39.6 47.2 46.7 52.6 65.4 64.2 Kishnapura 35.7 44.8 44.0 45.5 58.7 57.2 Betawali 40.5 49.2 48.4 55.3 67.5 65.6 Nawanagar 40.0 49.7 49.0 43.2 56.4 55.3 Kona 38.3 47.3 46.8 54.5 68.4 65.4 AAQ Std – Indus, Resd, Rural
60 100
Ambient Air Quality Levels in the Study Area-(µg/m3) – SO2 & NO
Location X
SO NO2 X Min Max 98th Min per Max 98th per
Project Site 6.2 10.7 10.2 15.8 21.5 20.8 Thana 8.0 12.5 12.1 15.1 22.3 21.7 Karvana 7.3 11.3 11.0 14.2 19.7 18.9 Baddi 8.3 12.8 12.3 15.7 20.6 19.7 Kunjahal 7.6 12.0 11.8 13.9 20.1 19.4 Rautanwala 6.7 11.2 10.4 14.7 21.3 20.8 Kishnapura 5.6 7.9 7.7 13.5 20.6 18.9 Betawali 8.5 13.1 12.6 16.5 25.9 25.0 Nawanagar 7.4 11.9 11.2 13.8 21.7 21.1 Kona 7.3 11.5 11.1 15.2 24.7 23.4 AAQ Std – Indus, Resd, Rural
80 80

Ambient Air Quality Levels in the Study Area – CO & CH
4
Location CO (mg/m3 CH) 4 (ppm) Min Max 98th Min per Max 98thper
Project Site 0.027 0.052 0.050 0.2 0.5 0.4 Thana 0.052 0.072 0.069 0.4 0.8 0.7 Karvana 0.043 0.064 0.059 0.2 0.6 0.5 Baddi 0.092 0.124 0.120 0.5 0.9 0.8 Kunjahal 0.089 0.098 0.095 0.3 0.7 0.6 Rautanwala 0.075 0.096 0.092 0.2 0.6 0.5 Kishnapura 0.066 0.089 0.087 0.3 0.7 0.6 Betawali 0.058 0.074 0.070 0.4 0.8 0.7 Nawanagar 0.047 0.067 0.620 0.2 0.6 0.5 Kona 0.056 0.072 0.690 0.1 0.4 0.3 AAQ Std – Indus, Resd, Rural 2.0 Note: H2S were below detectable limits
Water Sampling Locations
S. No Name of the location Direction Distance (km) Remarks
W1 Plant Site - Kundiwala Core zone 0.0 Ground water W2 Thana NE 4.5 Ground water W3 Mirzapur SW 3.0 Ground water W4 Baddi SE 2.5 Ground water W5 Kunjahal ESE 6.0 Ground water W6 Routanwala N 7.0 Ground water W7 Kishanpura NW 4.0 Ground water W8 Betawali W 6.5 Ground water W9 Nawanagar SE 4.5 Ground water W10 Kona SE 7.5 Ground water W11 Siwan SW 8.0 Surface water W12 Nawanagar River SE 4.0 Surface water W13 Industrial Domestic (Down) N 0.8 Waste Water W14 Industrial Domestic NE 0.5 Waste Water
Note: Samples collected in summer 2012.

Water Quality Results of Surface water
S.No Parameter Unit Result W11 W12
1 TSS mg/L 10 29 2 pH --- 7.71 7.46 3 Chloride as Cl mg/l - 9.86 78.8 4 COD mg/l 8.0 24 5 BOD mg/l <4 <4 6 DO mg/l 4.90 3.90 7 Arsenic as As mg/l <0.05 <0.05 8 Calcium as Ca mg/l 50 80 9 Sulphate as SO4 mg/l -2 10.77 36.00 10 Alkalinity as CaCO mg/l 3 11.5 23.0 11 Turbidity NTU 7.20 17.0 12 Nitrate as NO mg/l 3 1.88 2.59 13 Total Hardness mg/l 70 110
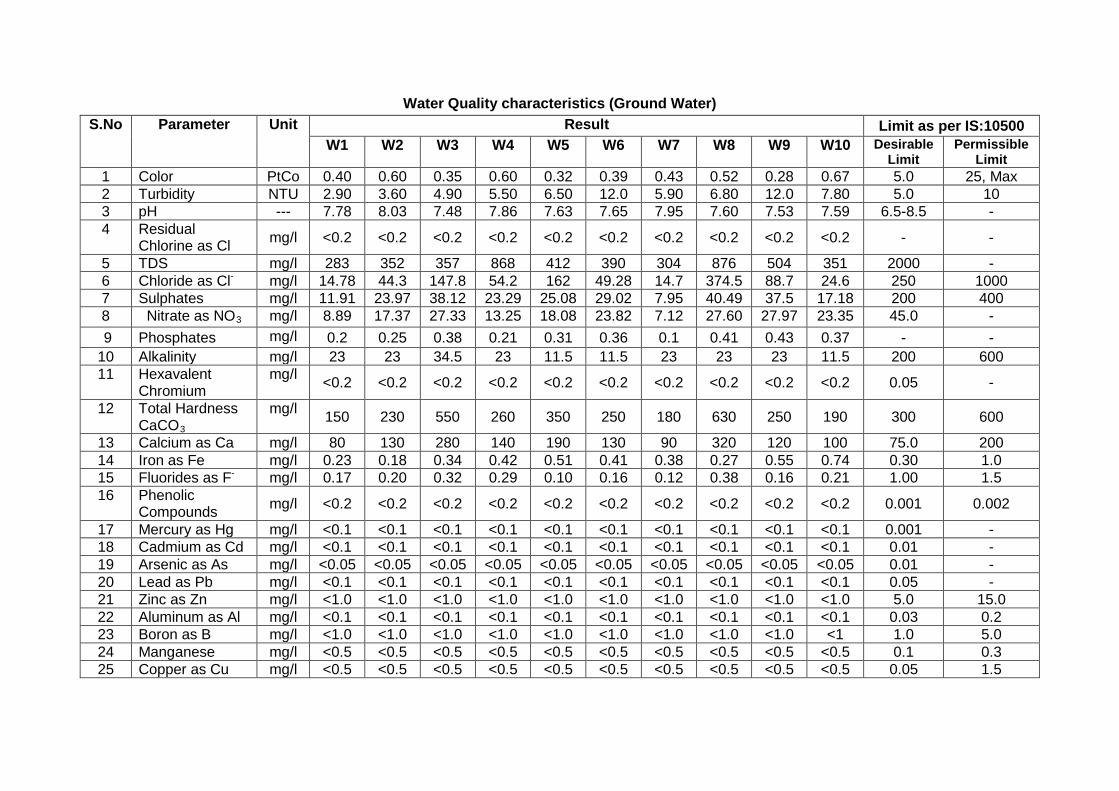
Water Quality characteristics (Ground Water) S.No Parameter Unit Result Limit as per IS:10500
W1 W2 W3 W4 W5 W6 W7 W8 W9 W10 Desirable Limit
Permissible Limit
1 Color PtCo 0.40 0.60 0.35 0.60 0.32 0.39 0.43 0.52 0.28 0.67 5.0 25, Max 2 Turbidity NTU 2.90 3.60 4.90 5.50 6.50 12.0 5.90 6.80 12.0 7.80 5.0 10 3 pH --- 7.78 8.03 7.48 7.86 7.63 7.65 7.95 7.60 7.53 7.59 6.5-8.5 - 4 Residual
Chlorine as Cl mg/l <0.2 <0.2 <0.2 <0.2 <0.2 <0.2 <0.2 <0.2 <0.2 <0.2 - -
5 TDS mg/l 283 352 357 868 412 390 304 876 504 351 2000 - 6 Chloride as Cl mg/l - 14.78 44.3 147.8 54.2 162 49.28 14.7 374.5 88.7 24.6 250 1000 7 Sulphates mg/l 11.91 23.97 38.12 23.29 25.08 29.02 7.95 40.49 37.5 17.18 200 400 8 Nitrate as NO mg/l 3 8.89 17.37 27.33 13.25 18.08 23.82 7.12 27.60 27.97 23.35 45.0 -
9 Phosphates mg/l 0.2 0.25 0.38 0.21 0.31 0.36 0.1 0.41 0.43 0.37 - - 10 Alkalinity mg/l 23 23 34.5 23 11.5 11.5 23 23 23 11.5 200 600 11 Hexavalent
Chromium mg/l <0.2 <0.2 <0.2 <0.2 <0.2 <0.2 <0.2 <0.2 <0.2 <0.2 0.05 -
12 Total Hardness CaCO
mg/l 3
150 230 550 260 350 250 180 630 250 190 300 600
13 Calcium as Ca mg/l 80 130 280 140 190 130 90 320 120 100 75.0 200 14 Iron as Fe mg/l 0.23 0.18 0.34 0.42 0.51 0.41 0.38 0.27 0.55 0.74 0.30 1.0 15 Fluorides as F mg/l - 0.17 0.20 0.32 0.29 0.10 0.16 0.12 0.38 0.16 0.21 1.00 1.5 16 Phenolic
Compounds mg/l <0.2 <0.2 <0.2 <0.2 <0.2 <0.2 <0.2 <0.2 <0.2 <0.2 0.001 0.002
17 Mercury as Hg mg/l <0.1 <0.1 <0.1 <0.1 <0.1 <0.1 <0.1 <0.1 <0.1 <0.1 0.001 - 18 Cadmium as Cd mg/l <0.1 <0.1 <0.1 <0.1 <0.1 <0.1 <0.1 <0.1 <0.1 <0.1 0.01 - 19 Arsenic as As mg/l <0.05 <0.05 <0.05 <0.05 <0.05 <0.05 <0.05 <0.05 <0.05 <0.05 0.01 - 20 Lead as Pb mg/l <0.1 <0.1 <0.1 <0.1 <0.1 <0.1 <0.1 <0.1 <0.1 <0.1 0.05 - 21 Zinc as Zn mg/l <1.0 <1.0 <1.0 <1.0 <1.0 <1.0 <1.0 <1.0 <1.0 <1.0 5.0 15.0 22 Aluminum as Al mg/l <0.1 <0.1 <0.1 <0.1 <0.1 <0.1 <0.1 <0.1 <0.1 <0.1 0.03 0.2 23 Boron as B mg/l <1.0 <1.0 <1.0 <1.0 <1.0 <1.0 <1.0 <1.0 <1.0 <1 1.0 5.0 24 Manganese mg/l <0.5 <0.5 <0.5 <0.5 <0.5 <0.5 <0.5 <0.5 <0.5 <0.5 0.1 0.3 25 Copper as Cu mg/l <0.5 <0.5 <0.5 <0.5 <0.5 <0.5 <0.5 <0.5 <0.5 <0.5 0.05 1.5

Soil Sampling Locations S.No Name of the location Direction Distance (km) S1 Project Site Core zone 0.0
S2 Thana NE 4.5
S3 Mizapur SW 3.0
S4 Baddi SE 2.5
S5 Kunjahal ESE 6.0
S6 Rautanwala N 7.0
S7 Kishnapura NW 4.0
S8 Betawali W 6.5
S9 Nawanagar SE 4.5
S10 Kona SE 7.5 Note: Samples collected in summer, 2012
Soil Quality in the Study Area Parameter Units S1 S2 S3 S4 S5 S6 S7 S8 S9 S10
pH --- 8.23 8.20 7.45 8.01 6.67 8.18 8.02 8.23 8.13 7.01 EC μs 144 88 170 175 69 158 292 116 122 128 Organic Matter
% 0.33 0.26 0.97 0.30 0.52 0.68 1.02 0.94 0.48 1.73
CEC meq/100gr 0.54 1.03 1.06 1.43 1.49 1.80 0.85 1.54 1.25 1.54 SAR meq/100gr 0.13 0.33 0.28 0.51 0.81 0.47 0.34 0.38 0.28 0.64 Lead as Pb mg/Kg 10.12 9.84 5.67 12.45 8.56 10.84 7.56 11.20 5.62 4.85 Cadmium as Cd
mg/Kg <0.5 <0.5 <0.5 <0.5 <0.5 <0.5 <0.5 <0.5 <0.5 <0.5
Chromium mg/Kg 4.25 2.13 2.57 3.47 3.12 1.25 2.42 1.54 2.02 1.98 Nickel as Ni mg/Kg 0.12 0.35 0.45 0.24 0.24 0.28 0.31 0.34 0.34 0.26 Zinc as Zn mg/Kg 146 157 125 137 186 159 212 214 174 188 Copper mg/Kg 14.50 51.20 31.70 22.80 11.40 9.84 7.45 6.58 9.85 7.44 Nitrogen Kg/Ha 449 285 467 330 282 385 323 428 257 404 Phosphates as P Kg/Ha 2.1 1.8 4.6 4.5 3.2 4.8 3.6 1.9 2.1 4.8 Potassium as K Kg/Ha 63 104 79 100 73 80 65 65 107 82

Socio Economic Details of the Study Area – Census 2001
S.No Name 1 2 3 4 5 6 7 8 9 1 Majra 113 590 309 281 84 53 31 131 73 2 Kainduwal 13 80 46 34 12 9 3 3 2 3 Majru 19 124 60 64 22 12 10 0 0 4 Lodi 128 675 349 326 126 70 56 258 133 5 Majra 202 1280 660 620 220 135 85 492 255 6 Bilanwalian 164 670 434 236 109 57 52 64 36 7 Kunjahal 349 1553 894 659 204 110 94 300 160 8 Bather 481 2038 1253 785 315 157 158 197 125 9 Mandhala 260 1425 752 673 237 125 112 198 102 10 Diwar 13 68 36 32 6 2 4 16 8 11 Kundi 35 174 90 84 27 13 14 74 37 12 Manpura 270 1549 797 752 289 150 139 397 212 13 Beli 96 626 330 296 104 55 49 50 29 14 Kishan Pura 326 1896 1049 847 287 161 126 401 221 15 Shahipur 22 114 58 56 19 12 7 0 0 16 Rautan Wala 83 463 247 216 70 34 36 38 21 17 Marzrawari 3 22 12 10 3 2 1 0 0 18 Karvena 158 797 457 340 118 64 54 4 4 19 Malri 9 58 30 28 4 1 3 19 11 20 Bhunri 24 145 71 74 29 17 12 10 6 21 Kona 205 1422 765 657 275 147 128 494 250 22 Siswan 60 320 180 140 31 21 10 117 70 23 Mirzapur 79 479 267 212 76 38 38 108 59 24 Bardar 163 981 594 387 99 52 47 38 23 25 Majri 30 252 133 119 33 19 14 13 7 26 Chak 84 473 272 201 60 33 27 19 8 27 Bardar 163 981 594 387 99 52 47 38 23 28 Dharampur 78 327 171 156 35 16 19 161 81 29 Beli Khol 96 626 330 296 104 55 49 50 29 30 Goera 63 410 212 198 90 52 38 70 39 31 Kuhwala 11 59 31 28 12 5 7 34 18 32 Nawan Nagar 28 144 75 69 19 13 6 38 21 33 Rogi 60 314 148 166 49 21 28 0 0 34 Maira 66 344 177 167 50 26 24 57 26 35 Taihar 7 37 21 16 2 2 0 35 19 36 Abnami 21 135 73 62 17 11 6 0 0 37 Alanwali 47 284 151 133 59 28 31 24 13 38 Lazapur 177 917 453 464 114 67 47 612 303 39 Marhanwala 58 384 203 181 66 39 27 295 161 40 Meriwala 118 729 384 345 86 49 37 200 105

Conti.. S.No Name 10 11 12 13 14 15 16 17 18
1 Majra 58 0 0 0 372 222 150 218 87 2 Kainduwal 1 0 0 0 36 23 13 44 23 3 Majru 0 0 0 0 85 44 41 39 16 4 Lodi 125 0 0 0 388 229 159 287 120 5 Majra 237 0 0 0 693 375 318 587 285 6 Bilanwalian 28 0 0 0 357 272 85 313 162 7 Kunjahal 140 0 0 0 1051 681 370 502 213 8 Bather 72 156 83 73 1327 915 412 711 338 9 Mandhala 96 0 0 0 796 467 329 629 285
10 Diwar 8 0 0 0 46 26 20 22 10 11 Kundi 37 0 0 0 92 62 30 82 28 12 Manpura 185 0 0 0 925 532 393 624 265 13 Beli 21 0 0 0 369 207 162 257 123 14 Kishan Pura 180 0 0 0 1044 657 387 852 392 15 Shahipur 0 0 0 0 82 44 38 32 14 16 Rautan Wala 17 0 0 0 266 172 94 197 75 17 Marzrawari 0 0 0 0 17 10 7 5 2 18 Karvena 0 0 0 0 406 278 128 391 179 19 Malri 8 0 0 0 42 28 14 16 2 20 Bhunri 4 0 0 0 62 29 33 83 42 21 Kona 244 0 0 0 398 261 137 1024 504 22 Siswan 47 0 0 0 231 139 92 89 41 23 Mirzapur 49 0 0 0 158 117 41 321 150 24 Bardar 15 0 0 0 468 319 149 513 275 25 Majri 6 0 0 0 132 80 52 120 53 26 Chak 11 0 0 0 210 136 74 263 136 27 Bardar 15 0 0 0 468 319 149 513 275 28 Dharampur 80 0 0 0 269 147 122 58 24 29 Beli Khol 21 0 0 0 369 207 162 257 123 30 Goera 31 0 0 0 171 114 57 239 98 31 Kuhwala 16 0 0 0 23 18 5 36 13 32 Nawan Nagar 17 0 0 0 80 47 33 64 28 33 Rogi 0 295 135 160 173 95 78 141 53 34 Maira 31 0 0 0 202 129 73 142 48 35 Taihar 16 0 0 0 30 18 12 7 3 36 Abnami 0 0 0 0 76 51 25 59 22 37 Alanwali 11 0 0 0 88 59 29 196 92 38 Lazapur 309 0 0 0 602 301 301 315 152 39 Marhanwala 134 0 0 0 226 133 93 158 70 40 Meriwala 95 0 0 0 434 239 195 295 145

Conti.. S.No Name 19 20 21 22 23 24 25 26 27
1 Majra 131 291 158 133 173 148 25 97 79 2 Kainduwal 21 43 25 18 27 21 6 10 10 3 Majru 23 71 37 34 35 34 1 22 22 4 Lodi 167 220 163 57 161 153 8 43 42 5 Majra 302 481 344 137 446 333 113 285 183 6 Bilanwalian 151 330 295 35 330 295 35 21 21 7 Kunjahal 289 558 498 60 531 491 40 69 60 8 Bather 373 1055 818 237 816 736 80 121 71 9 Mandhala 344 713 392 321 391 330 61 77 72 10 Diwar 12 38 20 18 18 14 4 10 7 11 Kundi 54 44 40 4 29 29 0 9 9 12 Manpura 359 436 397 39 390 376 14 93 92 13 Beli 134 185 156 29 148 142 6 94 93 14 Kishan Pura 460 884 584 300 523 457 66 262 215 15 Shahipur 18 62 32 30 37 32 5 23 19 16 Rautan Wala 122 254 130 124 122 118 4 80 79 17 Marzrawari 3 17 9 8 4 4 0 1 1 18 Karvena 212 303 273 30 258 250 8 70 70 19 Malri 14 44 24 20 29 16 13 27 14 20 Bhunri 41 97 46 51 71 37 34 68 34 21 Kona 520 816 441 375 737 403 334 721 388 22 Siswan 48 220 122 98 125 120 5 0 0 23 Mirzapur 171 209 137 72 96 87 9 82 75 24 Bardar 238 572 384 188 464 363 101 218 215 25 Majri 67 69 67 2 62 60 2 1 1 26 Chak 127 115 94 21 114 93 21 12 11 27 Bardar 238 572 384 188 464 363 101 218 215 28 Dharampur 34 195 105 90 195 105 90 160 73 29 Beli Khol 134 185 156 29 148 142 6 94 93 30 Goera 141 156 82 74 74 74 0 64 64 31 Kuhwala 23 34 18 16 24 16 8 14 7 32 Nawan Nagar 36 73 39 34 52 39 13 42 29 33 Rogi 88 214 99 115 89 69 20 55 42 34 Maira 94 192 102 90 93 84 9 78 70 35 Taihar 4 21 11 10 10 10 0 6 6 36 Abnami 37 84 40 44 34 33 1 16 16 37 Alanwali 104 78 77 1 77 77 0 63 63 38 Lazapur 163 436 240 196 425 239 186 59 39 39 Marhanwala 88 213 110 103 180 98 82 15 14 40 Meriwala 150 384 205 179 378 200 178 95 94
Conti..

S.No Name 28 29 30 31 32 33 34 35 36
1 Majra 18 3 3 0 2 2 0 71 64 2 Kainduwal 0 0 0 0 0 0 0 17 11 3 Majru 0 0 0 0 0 0 0 13 12 4 Lodi 1 2 2 0 5 4 1 111 105 5 Majra 102 0 0 0 1 1 0 160 149 6 Bilanwalian 0 6 6 0 34 33 1 269 235 7 Kunjahal 9 3 3 0 34 15 19 425 413 8 Bather 50 4 4 0 21 19 2 670 642 9 Mandhala 5 22 22 0 0 0 0 292 236
10 Diwar 3 0 0 0 0 0 0 8 7 11 Kundi 0 0 0 0 1 1 0 19 19 12 Manpura 1 2 2 0 2 2 0 293 280 13 Beli 1 0 0 0 0 0 0 54 49 14 Kishan Pura 47 2 2 0 1 1 0 258 239 15 Shahipur 4 0 0 0 0 0 0 14 13 16 Rautan Wala 1 2 2 0 0 0 0 40 37 17 Marzrawari 0 0 0 0 0 0 0 3 3 18 Karvena 0 7 7 0 0 0 0 181 173 19 Malri 13 0 0 0 0 0 0 2 2 20 Bhunri 34 0 0 0 0 0 0 3 3 21 Kona 333 3 2 1 0 0 0 13 13 22 Siswan 0 9 7 2 6 6 0 110 107 23 Mirzapur 7 0 0 0 2 2 0 12 10 24 Bardar 3 1 0 1 0 0 0 245 148 25 Majri 0 42 41 1 4 4 0 15 14 26 Chak 1 23 23 0 15 15 0 64 44 27 Bardar 3 1 0 1 0 0 0 245 148 28 Dharampur 87 2 1 1 0 0 0 33 31 29 Beli Khol 1 0 0 0 0 0 0 54 49 30 Goera 0 0 0 0 0 0 0 10 10 31 Kuhwala 7 0 0 0 0 0 0 10 9 32 Nawan Nagar 13 0 0 0 1 1 0 9 9 33 Rogi 13 1 1 0 6 4 2 27 22 34 Maira 8 0 0 0 1 1 0 14 13 35 Taihar 0 1 1 0 0 0 0 3 3 36 Abnami 0 0 0 0 0 0 0 18 17 37 Alanwali 0 0 0 0 0 0 0 14 14 38 Lazapur 20 26 23 3 5 4 1 335 173 39 Marhanwala 1 0 0 0 0 0 0 165 84 40 Meriwala 1 62 57 5 3 1 2 218 48
Conti.

S.No Name 37 38 39 40 41 42 43 44 45 1 Majra 7 118 10 108 112 7 105 3 1 2 Kainduwal 6 16 4 12 15 3 12 0 0 3 Majru 1 36 3 33 36 3 33 0 0 4 Lodi 6 59 10 49 54 5 49 0 0 5 Majra 11 35 11 24 13 7 6 19 3 6 Bilanwalian 34 0 0 0 0 0 0 0 0 7 Kunjahal 12 27 7 20 25 6 19 1 0 8 Bather 28 239 82 157 195 51 144 3 2 9 Mandhala 56 322 62 260 315 56 259 4 3
10 Diwar 1 20 6 14 14 3 11 4 2 11 Kundi 0 15 11 4 15 11 4 0 0 12 Manpura 13 46 21 25 35 13 22 0 0 13 Beli 5 37 14 23 25 2 23 0 0 14 Kishan Pura 19 361 127 234 252 54 198 3 2 15 Shahipur 1 25 0 25 25 0 25 0 0 16 Rautan Wala 3 132 12 120 118 4 114 13 8 17 Marzrawari 0 13 5 8 13 5 8 0 0 18 Karvena 8 45 23 22 30 15 15 4 1 19 Malri 0 15 8 7 15 8 7 0 0 20 Bhunri 0 26 9 17 26 9 17 0 0 21 Kona 0 79 38 41 79 38 41 0 0 22 Siswan 3 95 2 93 1 1 0 0 0 23 Mirzapur 2 113 50 63 23 9 14 0 0 24 Bardar 97 108 21 87 29 2 27 79 19 25 Majri 1 7 7 0 0 0 0 4 4 26 Chak 20 1 1 0 0 0 0 0 0 27 Bardar 97 108 21 87 29 2 27 79 19 28 Dharampur 2 0 0 0 0 0 0 0 0 29 Beli Khol 5 37 14 23 25 2 23 0 0 30 Goera 0 82 8 74 82 8 74 0 0 31 Kuhwala 1 10 2 8 10 2 8 0 0 32 Nawan Nagar 0 21 0 21 21 0 21 0 0 33 Rogi 5 125 30 95 108 26 82 0 0 34 Maira 1 99 18 81 97 16 81 0 0 35 Taihar 0 11 1 10 10 0 10 0 0 36 Abnami 1 50 7 43 50 7 43 0 0 37 Alanwali 0 1 0 1 1 0 1 0 0 38 Lazapur 162 11 1 10 0 0 0 0 0 39 Marhanwala 81 33 12 21 1 0 1 0 0 40 Meriwala 170 6 5 1 1 1 0 0 0
Conti.

S.No Name 46 47 48 49 50 51 52 53 54 55 1 Majra 2 0 0 0 3 2 1 299 151 148 2 Kainduwal 0 0 0 0 1 1 0 37 21 16 3 Majru 0 0 0 0 0 0 0 53 23 30 4 Lodi 0 0 0 0 5 5 0 455 186 269 5 Majra 16 0 0 0 3 1 2 799 316 483 6 Bilanwalian 0 0 0 0 0 0 0 340 139 201 7 Kunjahal 1 0 0 0 1 1 0 995 396 599 8 Bather 1 8 4 4 33 25 8 983 435 548 9 Mandhala 1 0 0 0 3 3 0 712 360 352
10 Diwar 2 0 0 0 2 1 1 30 16 14 11 Kundi 0 0 0 0 0 0 0 130 50 80 12 Manpura 0 0 0 0 11 8 3 1113 400 713 13 Beli 0 1 1 0 11 11 0 441 174 267 14 Kishan Pura 1 0 0 0 106 71 35 1012 465 547 15 Shahipur 0 0 0 0 0 0 0 52 26 26 16 Rautan Wala 5 0 0 0 1 0 1 209 117 92 17 Marzrawari 0 0 0 0 0 0 0 5 3 2 18 Karvena 3 0 0 0 11 7 4 494 184 310 19 Malri 0 0 0 0 0 0 0 14 6 8 20 Bhunri 0 0 0 0 0 0 0 48 25 23 21 Kona 0 0 0 0 0 0 0 606 324 282 22 Siswan 0 4 0 4 90 1 89 100 58 42 23 Mirzapur 0 0 0 0 90 41 49 270 130 140 24 Bardar 60 0 0 0 0 0 0 409 210 199 25 Majri 0 0 0 0 3 3 0 183 66 117 26 Chak 0 0 0 0 1 1 0 358 178 180 27 Bardar 60 0 0 0 0 0 0 409 210 199 28 Dharampur 0 0 0 0 0 0 0 132 66 66 29 Beli Khol 0 1 1 0 11 11 0 441 174 267 30 Goera 0 0 0 0 0 0 0 254 130 124 31 Kuhwala 0 0 0 0 0 0 0 25 13 12 32 NawanNagar 0 0 0 0 0 0 0 71 36 35 33 Rogi 0 8 0 8 9 4 5 100 49 51 34 Maira 0 0 0 0 2 2 0 152 75 77 35 Taihar 0 0 0 0 1 1 0 16 10 6 36 Abnami 0 0 0 0 0 0 0 51 33 18 37 Alanwali 0 0 0 0 0 0 0 206 74 132 38 Lazapur 0 5 0 5 6 1 5 481 213 268 39 Marhanwala 0 0 0 0 32 12 20 171 93 78 40 Meriwala 0 0 0 0 5 4 1 345 179 166

Annexure-6
Impacts during Development Phase
Development phase works include site clearance, site formation, building works, infrastructure provision and any other infrastructure activities.
The impacts due to construction activities are short term and are limited to the construction period only. The impacts will be mainly on air quality, water quality, soil quality and socio-economics.
Impact on Air Quality The principal potential source of air quality impact arising from the construction of the proposed project is fugitive dust generation. The dust, measurable as Suspended Particulate Matter and Respirable Suspended Particulates would be generated as a result of construction activities. The construction program of the projects shall commence immediately after obtaining statutory clearances. The potential dust sources associated with construction activities are loading and unloading of the materials, top soil removal, travel over unpaved roads and wind erosion etc. The construction works associated with the proposed development are broadly given below.
1. Site development and foundation works 2. Dust generation due to vehicles transporting raw materials 3. Un loading of raw materials, removal of un wanted waste material from site 4. Civil constructions and provision of infrastructure required for various activities
proposed
Among all the construction activities, site formation has the highest potential for causing dust nuisance to the nearby sensitive locations. During the construction of the project, existing houses nearby may be subject to the potential dust impacts.
Exhaust emissions from vehicles and equipment deployed during the construction phase is also likely to result in marginal increase in the levels of SO2, NOX
, SPM, CO and un-burnt hydrocarbons. The impact of such activities would be temporary and restricted to the construction phase. The impact is generally confined to the project area and is expected to be negligible outside the plant boundaries.
Mitigation Measures proposed – Air Quality
For the proposed project site levelling and grading will be carried out, where ever possible to maintain the natural elevations they will not be disturbed, only levelling activity will be carried out for providing roads, sewage network, storm water system, and places required for providing buildings for administrative and plant shed erection. According to the engineering assessment; most of the excavated material shall be reused within the project boundary. The movement of cut and fill material will be limited.
Most of the construction dust will be generated from the movement of construction vehicles on unpaved roads. Unloading and removal of soil material shall also act as a potential source for dust nuisance. The control measures proposed to be taken up are given below.
1. The dust suppression measures proposed will be regular water sprinkling on main haul roads in the project area, this activity will be carried out at least twice a day, if need arises frequency will be increased on windy days, by following this around 50% reduction on the dust contribution from the exposed surface will be achieved.
2. The duration of stockpiling will be as short as possible as most of the material will be used as backfill material for the open cut trenches for road development.
3. Temporary tin sheets of sufficient height (3m) will be erected around the site of dust generation or all around the project site as barrier for dust control.
4. Tree plantations around the project boundary will be initiated at the early stages by plantation of 2 to 3 years old saplings, regular watering will be done, so that the area will be moist for most part of the day.
5. To reduce the dust movement from civil construction site to the neighbourhood the external part of the building (administration, canteen, etc) will be covered by plastic sheets
Given the implementation of proper control measures for dust suppression, no adverse impacts are expected and compliance with the Ambient Air Quality is achieved all time.
Impact on Water Quality The proposed project will involve various construction activities. The following section summarizes the activities likely to be undertaken during the proposed development and describes the potential impacts on water quality from each activity.
i) Site formation
Preparation of designated area of land for subsequent development activities involves levelling of the ground surface, removal of vegetation, stockpiling and generation of construction waste. Construction of temporary infrastructure such as drainage culverts may be required. The site formation may produce large quantities of run-off with high suspended solids loading in the absence of appropriate mitigation measures. This potential problem may be aggravated during rainy season.
ii) Construction of buildings
In rainy season during the construction phase due to construction of various civil structures site runoff results significant pollution in the receiving water bodies. And washing of various construction equipments will also result in water pollution.
iii) Site workshop The used engine oil and lubricants mainly used in the workshop & DG sets and their storage as waste materials is the potential to create impacts if spillage occurs. Waste oil may infiltrate into the surface soil layers, or runoff into local watercourses, increasing hydrocarbon levels. Proper precautionary measures should be taken to prevent any spillage of the above materials and their subsequent runoff into the water bodies.

iv) Presence of workers During construction period, number of workders and labour force is at site for various civil activities and the presence of work force generates waste and wastewater from eating areas, and sewage from temporary sanitary facilities. Sewage is characterized by BOD, COD, ammonia and E.Coli. Significant water quality impact will happen only if the sewage is discharged directly into the receiving waters without any prior treatment.
Mitigation Measures - Water Quality
During site development necessary precautions will be taken, so that the runoff water from the site is collected to storage pit and if any over flow is, will be diverted to nearby greenbelt/ plantation area. During construction activity all the equipment washed water will be diverted to working pit to settle the suspended solids if any and the settled water will be reused for construction purposes, and for sprinkling on roads to control the dust emission, etc.

Annexure-7
Contour levels of the study area
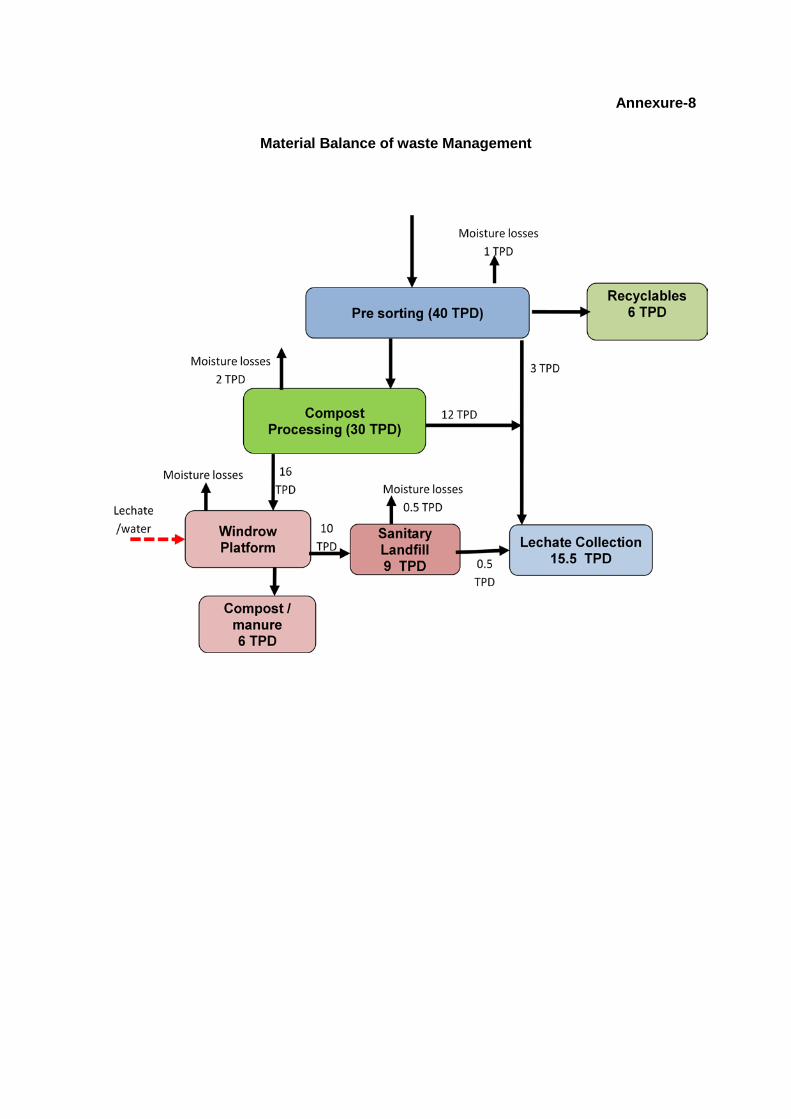
Annexure-8
Material Balance of waste Management

Annexure-9
Environmental advisory and monitoring committee
General Mar -
-
-
-
General Manager -Env
Chief General Manager-Env.
Dy. General Manager -Env
Chemist
Environmental Engineer
Chemist Operators
Supporting Staff