bbva- boa-merril lynch conference 280910
TRANSCRIPT

8/8/2019 BBVA- BOA-Merril Lynch Conference 280910
http://slidepdf.com/reader/full/bbva-boa-merril-lynch-conference-280910 1/37
1
Banking & Insurance CEO Conference
Ángel CanoPresident & COO
London, 28th September 2010
“Leading the New
Financial System”
8/8/2019 BBVA- BOA-Merril Lynch Conference 280910
http://slidepdf.com/reader/full/bbva-boa-merril-lynch-conference-280910 2/37

8/8/2019 BBVA- BOA-Merril Lynch Conference 280910
http://slidepdf.com/reader/full/bbva-boa-merril-lynch-conference-280910 3/37
3
2002-2007 1H102007-2009
Macro(World GDP)
Financialsystem
(Attributable profitpeer group*)
BBVA Group(Attributable profit)
Superior performance of BBVA Group …
(Base 100: 2002) (Base 100: 2007)
314
100
2 0 0 2 2 0 0 7
97100
2 0 0 7 2 0 0 9
• Record gross margin
• Risk indicators stabilize
• Access to liquidity
• Solvency confirmed bystress-tests and S&P
• Sovereign risk
• Fiscal consolidation
• Liquidity crunch
• Credit qualitydeterioration
• Funding constraints
305
100
20 0 2 2 0 0 7
38
100
2 0 0 7 20 0 9
126100
2 0 0 2 2 0 0 7
102100
2 0 0 7 2 0 0 9
* Peer Group: BARCL, BNPP, CASA, CMZ, CS, DB, HSBC, ISP, LBG, RBS , SAN, SG, UBS & UCI.
8/8/2019 BBVA- BOA-Merril Lynch Conference 280910
http://slidepdf.com/reader/full/bbva-boa-merril-lynch-conference-280910 4/37
4
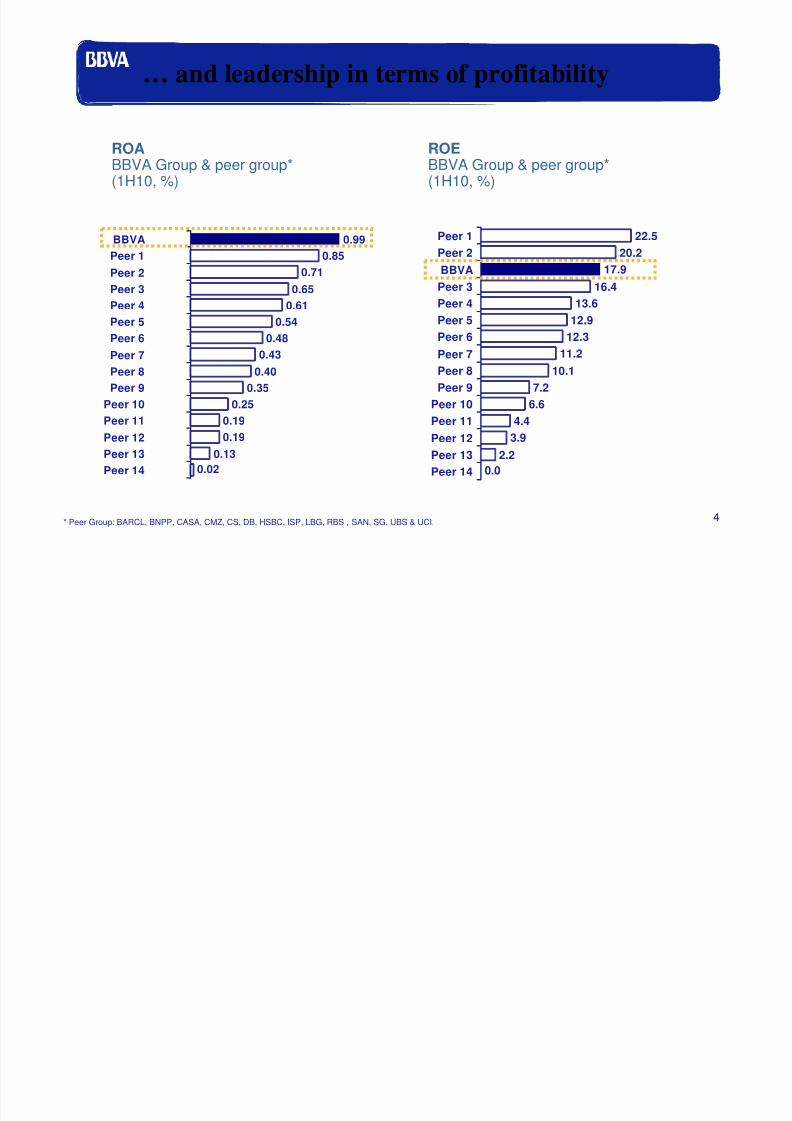
… and leadership in terms of profitability
0.02
0.19
0.35
0.54
0.71
0.650.61
0.99
0.85
0.48
0.43
0.40
0.25
0.19
0.13
BBVA
Peer 1
Peer 2
Peer 3Peer 4
Peer 5
Peer 6
Peer 7
Peer 8
Peer 9Peer 10
Peer 11
Peer 12
Peer 13
Peer 14
ROABBVA Group & peer group*(1H10, %)
0.0
4.4
7.2
12.9
17.9
16.413.6
22.5
20.2
12.3
11.2
10.1
6.6
3.9
2.2
Peer 1
Peer 2
BBVA
Peer 3Peer 4
Peer 5
Peer 6
Peer 7
Peer 8
Peer 9Peer 10
Peer 11
Peer 12
Peer 13
Peer 14
ROEBBVA Group & peer group*(1H10, %)
* Peer Group: BARCL, BNPP, CASA, CMZ, CS, DB, HSBC, ISP, LBG, RBS , SAN, SG, UBS & UCI.

8/8/2019 BBVA- BOA-Merril Lynch Conference 280910
http://slidepdf.com/reader/full/bbva-boa-merril-lynch-conference-280910 5/37
5
Why do we outperform our peers? Why will we
continue to do so?
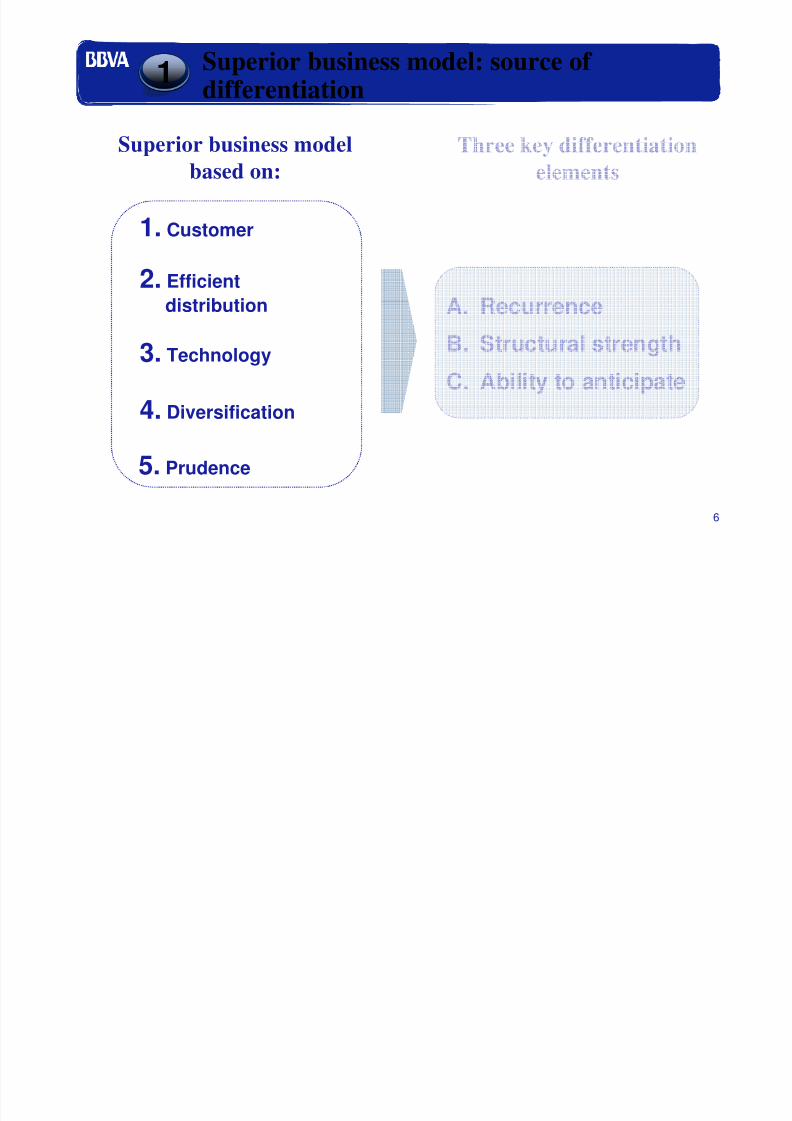
Superior business model:source of differentiation
1
Bank transformationfocused on superior future
growth
2
8/8/2019 BBVA- BOA-Merril Lynch Conference 280910
http://slidepdf.com/reader/full/bbva-boa-merril-lynch-conference-280910 6/37
6
Superior business model: source of
differentiation
1
Superior business model
based on:
Three key differentiation
elements
1. Customer
2. Efficient
distribution
3. Technology
4. Diversification
5. Prudence
A. Recurrence
B. Structural strength
C. Ability to anticipate

8/8/2019 BBVA- BOA-Merril Lynch Conference 280910
http://slidepdf.com/reader/full/bbva-boa-merril-lynch-conference-280910 7/37
7
1. Customer2. Efficient
distribution
3. Technology
4. Diversification
5. Prudence
1. Customer2. Efficient
distribution
3. Technology
4. Diversification
5. Prudence
Customer-based
banking model …
MexicoMexicoMarket Leader
USAUSALeader franchise
in the sunbelt
South AmericaSouth America1st/2nd
Asia / ChinaAsia / ChinaStrategic alliance
SpainSpain1st/2nd
… with a leading position
in our main markets
Customer-based revenues:91%* of total revenues
RetailRetail bankingbanking leader in all our
franchises• 46.9 million customers• 7,407 branches
A global WB&AM franchise• 3,800 employees (1,900 Europe, 1,800
America and 100 in Asia)
• 25 countries
Our customer-focused business model …
* Customer based revenues = BBVA Group gross income – (corporate activities + no clients income from WB&AM)

8/8/2019 BBVA- BOA-Merril Lynch Conference 280910
http://slidepdf.com/reader/full/bbva-boa-merril-lynch-conference-280910 8/37
8
Spain Mexico Latam
*Lending + customer funds
Efficient networks are key factor
given their weight in the cost structure
Branches Business
7.8%10.9%*
Market share(%, June 10)
Branches Business
17.3%
28.5%*
Market share(%, June 10)
Branches Business
7.9%10.0%*
Market share(%, June 10)
+39% +64% +27%
… with a very efficient distribution network …
1. Customer2. Efficient
distribution
3. Technology
4. Diversification
5. Prudence
1. Customer2. Efficient
distribution
3. Technology
4. Diversification
5. Prudence

8/8/2019 BBVA- BOA-Merril Lynch Conference 280910
http://slidepdf.com/reader/full/bbva-boa-merril-lynch-conference-280910 9/37
9
… important leveraging of technology …
Expenditures on technologyBBVA Group*(€m)
Change-the-bank vsRun-the-Bank(Capex vs total costs)
1,243
1,4951,529
2007 2008 2009
39%
27%
BBVA2009
Avg. globalcompetitors
2008
Source: BCG and in-house.* Include investment + incurred expense excluding depreciation.
1. Customer2. Efficient
distribution
3. Technology
4. Diversification
5. Prudence
1. Customer2. Efficient
distribution
3. Technology
4. Diversification
5. Prudence

8/8/2019 BBVA- BOA-Merril Lynch Conference 280910
http://slidepdf.com/reader/full/bbva-boa-merril-lynch-conference-280910 10/37
10
… well diversified …
Gross income*Breakdown by business area(%)
South
America
18%
USA13%
Mexico
26%
WB&AM
9%
Spain &
Portugal
34% Emerging economies
Developed economies
46%
54%
… and finally prudence, the fundamental principle
of our management
1. Customer2. Efficient
distribution
3. Technology
4. Diversification
5. Prudence
1. Customer2. Efficient
distribution
3. Technology
4. Diversification
5. Prudence
* Excl. corporate activities

8/8/2019 BBVA- BOA-Merril Lynch Conference 280910
http://slidepdf.com/reader/full/bbva-boa-merril-lynch-conference-280910 11/37
11
Superior business model: source of
differentiation
1
1. Customer
2. Efficient
distribution
3. Technology
4. Diversification
Superior business model
based on …
Three key differentiation
elements …
5. Prudence
A. Recurrence
B. Structural strength
C. Ability to anticipate
8/8/2019 BBVA- BOA-Merril Lynch Conference 280910
http://slidepdf.com/reader/full/bbva-boa-merril-lynch-conference-280910 12/37
12
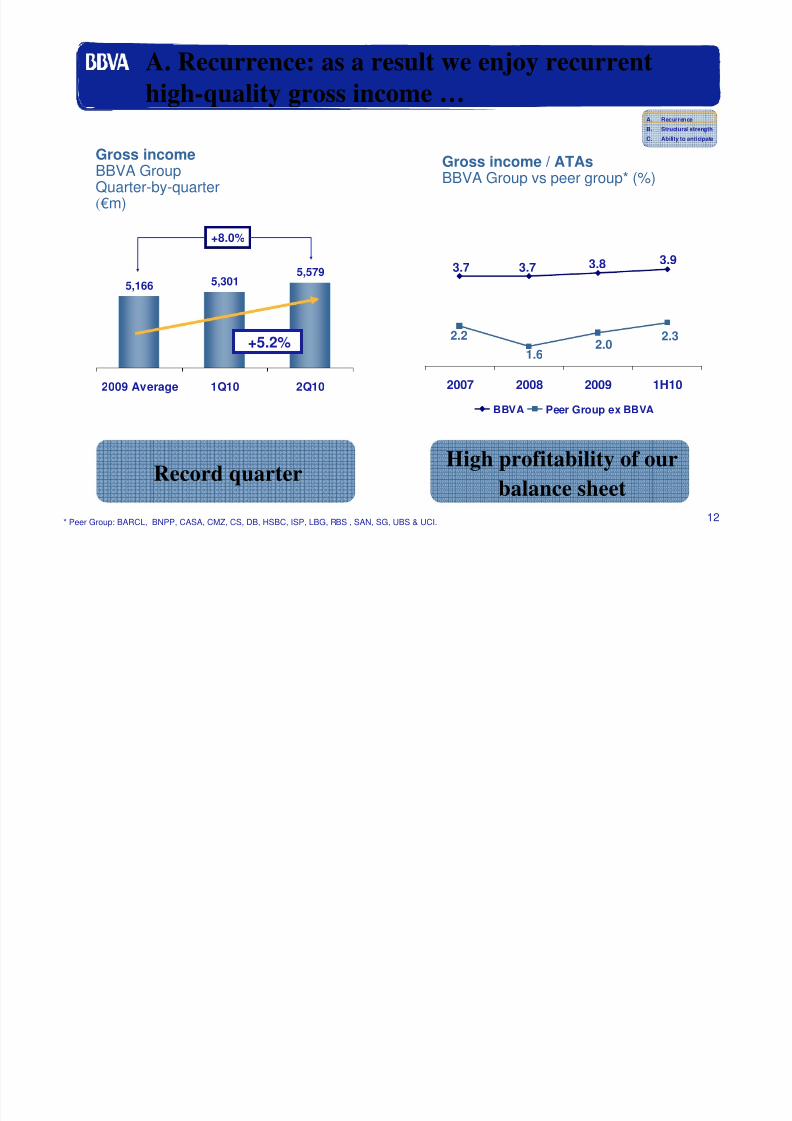
A. Recurrence: as a result we enjoy recurrent
high-quality gross income …
+8.0%
5,166 5,3015,579
2009 Average 1Q10 2Q10
Gross incomeBBVA GroupQuarter-by-quarter(€m)
Record quarter
3.93.83.73.7
2.2
1.62.0
2.3
2007 2008 2009 1H10
BBVA Peer Group ex BBVA
Gross income / ATAsBBVA Group vs peer group* (%)
High profitability of our
balance sheet* Peer Group: BARCL, BNPP, CASA, CMZ, CS, DB, HSBC, ISP, LBG, RBS , SAN, SG, UBS & UCI.
+5.2%
A. Recurrence
B. Structural strength
C. Ability to anticipate

8/8/2019 BBVA- BOA-Merril Lynch Conference 280910
http://slidepdf.com/reader/full/bbva-boa-merril-lynch-conference-280910 13/37
13
… that along with continuous progress in efficiencyleads to strong operating income …
Operating incomeBBVA Group(1H10, €m)
+15.0% +3.3%
5,472 6,5006,293
1H08 1H09 1H10
Leadership in efficiency
Cost to incomeBBVA Group & peer group(1H10,%)
40.3%
45.0%
55.7%
56.3%57.1%
58.6%
58.9%
59.7%
60.6%
65.9%
70.1%
72.4%
70.9%
49.3%
42.2%
BBVA
Peer 1
Peer 2
Peer 3
Peer 4
Peer 5Peer 6
Peer 7
Peer 8
Peer 9
Peer 10
Peer 11
Peer 12
Peer 13
Peer 14
* Peer Group: BARCL, BNPP, CASA, CMZ, CS, DB, HSBC, ISP, LBG, RBS , SAN, SG, UBS & UCI.
A. Recurrence
B. Structural strength
C. Ability to anticipate
8/8/2019 BBVA- BOA-Merril Lynch Conference 280910
http://slidepdf.com/reader/full/bbva-boa-merril-lynch-conference-280910 14/37
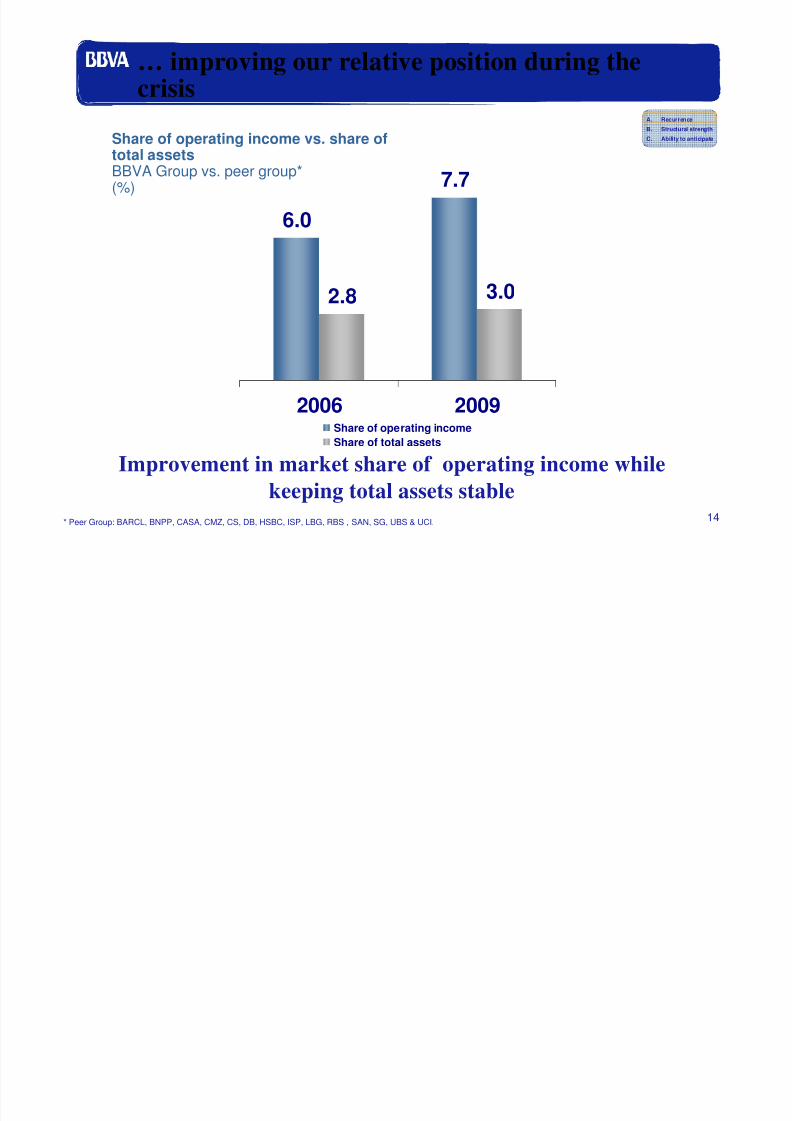
14
Improvement in market share of operating income while
keeping total assets stable
Share of operating income vs. share oftotal assetsBBVA Group vs. peer group*(%)
6.0
7.7
2.8 3.0
2006 2009Share of operating income
Share of total assets
… improving our relative position during the
crisis
* Peer Group: BARCL, BNPP, CASA, CMZ, CS, DB, HSBC, ISP, LBG, RBS , SAN, SG, UBS & UCI.
A. Recurrence
B. Structural strength
C. Ability to anticipate
8/8/2019 BBVA- BOA-Merril Lynch Conference 280910
http://slidepdf.com/reader/full/bbva-boa-merril-lynch-conference-280910 15/37
15
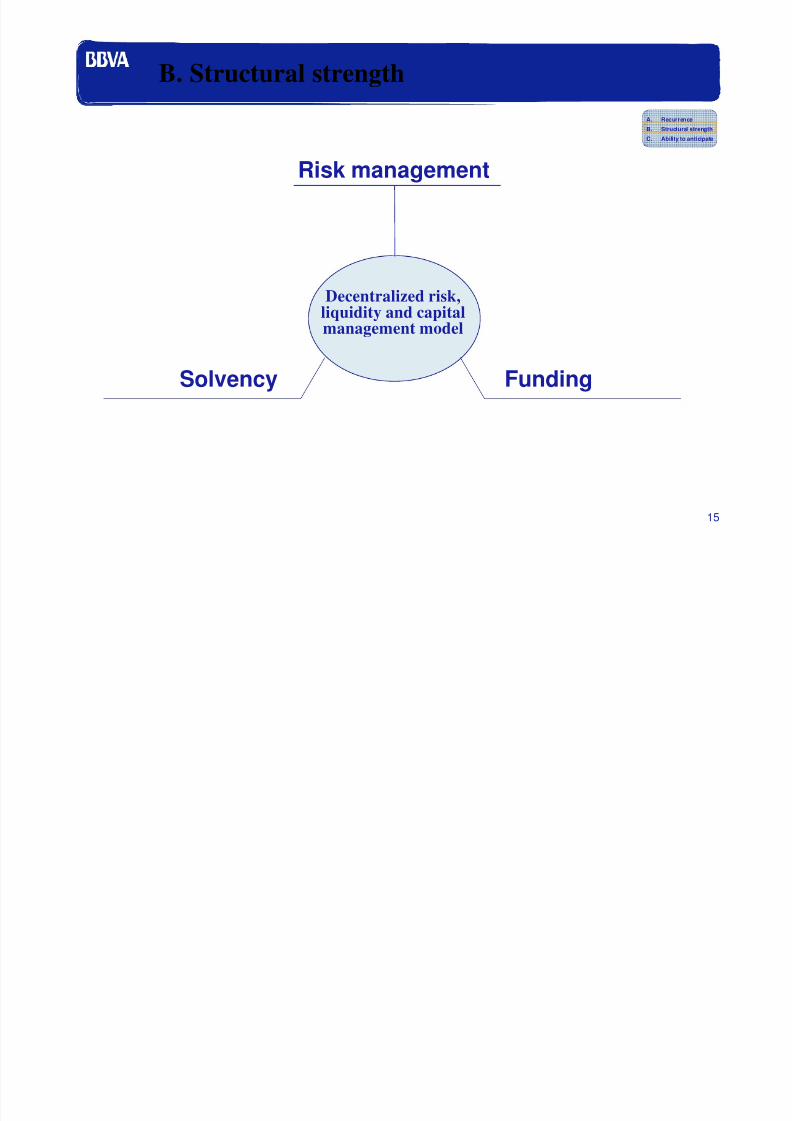
B. Structural strength
Risk management
Solvency Funding
Decentralized risk,liquidity and capitalmanagement model
A. Recurrence
B. Structural strength
C. Ability to anticipate
8/8/2019 BBVA- BOA-Merril Lynch Conference 280910
http://slidepdf.com/reader/full/bbva-boa-merril-lynch-conference-280910 16/37
16
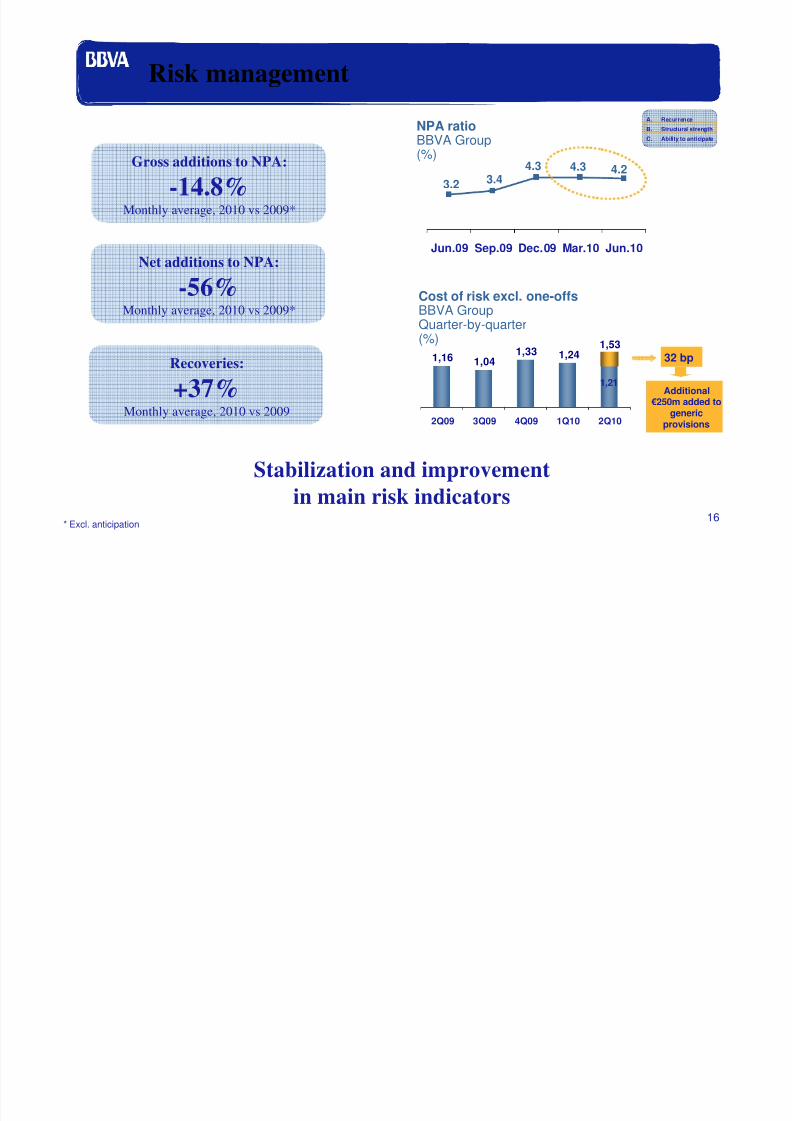
Risk management
Stabilization and improvement
in main risk indicators
4.24.34.33.43.2
Jun.09 Sep.09 Dec.09 Mar.10 Jun.10
NPA ratioBBVA Group(%)
1,16 1,041,33
1,531,24
2Q09 3Q09 4Q09 1Q10 2Q10
Cost of risk excl. one-offsBBVA GroupQuarter-by-quarter(%)
Additional€250m added togeneric
provisions
32 bp
Net additions to NPA:
-56%Monthly average, 2010 vs 2009*
Recoveries:
+37%Monthly average, 2010 vs 2009
Gross additions to NPA:
-14.8%Monthly average, 2010 vs 2009*
* Excl. anticipation
1,21
A. Recurrence
B. Structural strength
C. Ability to anticipate
8/8/2019 BBVA- BOA-Merril Lynch Conference 280910
http://slidepdf.com/reader/full/bbva-boa-merril-lynch-conference-280910 17/37
17
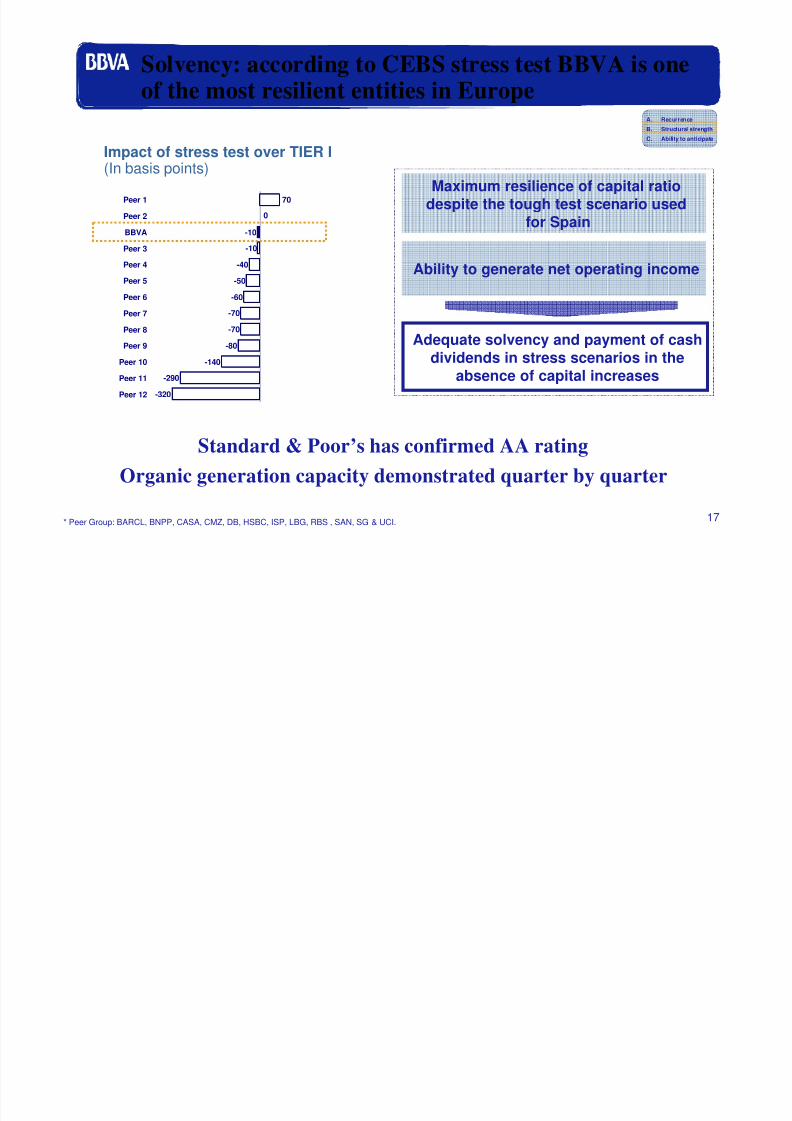
Solvency: according to CEBS stress test BBVA is one
of the most resilient entities in Europe
Standard & Poor’s has confirmed AA rating
Impact of stress test over TIER I(In basis points)
Maximum resilience of capital ratio
despite the tough test scenario usedfor Spain
Ability to generate net operating income
Adequate solvency and payment of cashdividends in stress scenarios in the
absence of capital increases
70
-10
-40
-50
-60
-70
-70
-80
-140
-290
-320
-10
0
Peer 1
Peer 2
BBVA
Peer 3
Peer 4
Peer 5
Peer 6
Peer 7
Peer 8
Peer 9
Peer 10
Peer 11
Peer 12
Organic generation capacity demonstrated quarter by quarter
* Peer Group: BARCL, BNPP, CASA, CMZ, DB, HSBC, ISP, LBG, RBS , SAN, SG & UCI.
A. Recurrence
B. Structural strength
C. Ability to anticipate

8/8/2019 BBVA- BOA-Merril Lynch Conference 280910
http://slidepdf.com/reader/full/bbva-boa-merril-lynch-conference-280910 18/37
18
Funding: solid liquidity and finance positions
Deposit / Assets(1H2010, %)
45.3
40.9
33.5
31.1
30.8
28.4
28.0
27.9
27.4
25.3
21.4
47.4
22.7
40.9
46.5
Peer 1
Peer 2
BBVA
Peer 3
Peer 4
Peer 5
Peer 6
Peer 7
Peer 8
Peer 9
Peer 10
Peer 11
Peer 12
Peer 13
Peer 14
High deposit base and a smaller
balance sheet than any peer
* Peer Group: BARCL, BNPP, CASA, CMZ, CS, DB, HSBC, ISP, LBG, RBS , SAN, SG, UBS & UCI.
103
10
14
13
19
12
13
15
8
12
7
5
429
334
230
221
200
194
180
172
164
130
131
114
116
107
85
23
17
8
Peer 1
Peer 2
Peer 3
Peer 4
Peer 5
Peer 6
Peer 7
Peer 8
Peer 9
Peer 10
Peer 11
Peer 12
Peer 13
Peer 14
BBVA
2010
>2010
BBVA Group’s wholesale maturities(€bn)
Less dependent on wholesale debt rollover
in the medium term
Source: Bloomberg September, 6, 2010
A. Recurrence
B. Structural strength
C. Ability to anticipate

8/8/2019 BBVA- BOA-Merril Lynch Conference 280910
http://slidepdf.com/reader/full/bbva-boa-merril-lynch-conference-280910 19/37
19
C. A history characterized by anticipation
Tactical
anticipation
Structural
anticipation
Short termperformance
Sustainability& evolution of
the model
Two types of anticipation
A. Recurrence
B. Structural strength
C. Ability to anticipate

8/8/2019 BBVA- BOA-Merril Lynch Conference 280910
http://slidepdf.com/reader/full/bbva-boa-merril-lynch-conference-280910 20/37
20
Tactical anticipation: recent examples
• Superior NPAevolution
Credit quality
• Anticipate futuredeterioration
Funding position
• Comfortable position and access to the markets
• Resilience of net interest income
• Market share gains
• LT wholesale financebudget covered in
advance
• Customized prices vs.massive price
campaigns
• Selective growth
Wholesale funding Retail funding
A. Recurrence
B. Structural strength
C. Ability to anticipate
8/8/2019 BBVA- BOA-Merril Lynch Conference 280910
http://slidepdf.com/reader/full/bbva-boa-merril-lynch-conference-280910 21/37
21
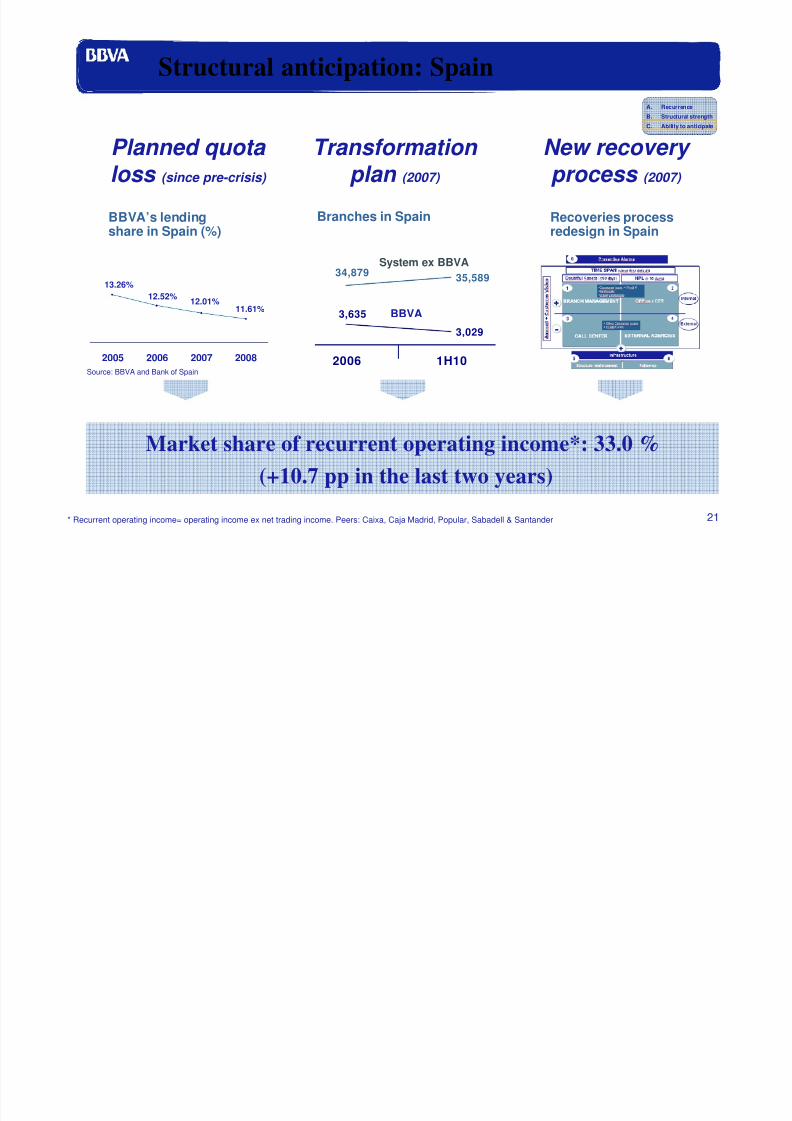
Structural anticipation: Spain
Planned quota loss (since pre-crisis)
BBVA’s lendingshare in Spain (%)
11.61%12.01%12.52%
13.26%
2005 2006 2007 2008
Transformation plan (2007)
Branches in Spain
34,87935,589
3,635
3,029
2006 1H10
System ex BBVA
BBVA
Market share of recurrent operating income*: 33.0 %
(+10.7 pp in the last two years)
New recovery process (2007)
Recoveries processredesign in Spain
* Recurrent operating income= operating income ex net trading income. Peers: Caixa, Caja Madrid, Popular, Sabadell & Santander
Source: BBVA and Bank of Spain
A. Recurrence
B. Structural strength
C. Ability to anticipate
8/8/2019 BBVA- BOA-Merril Lynch Conference 280910
http://slidepdf.com/reader/full/bbva-boa-merril-lynch-conference-280910 22/37
22
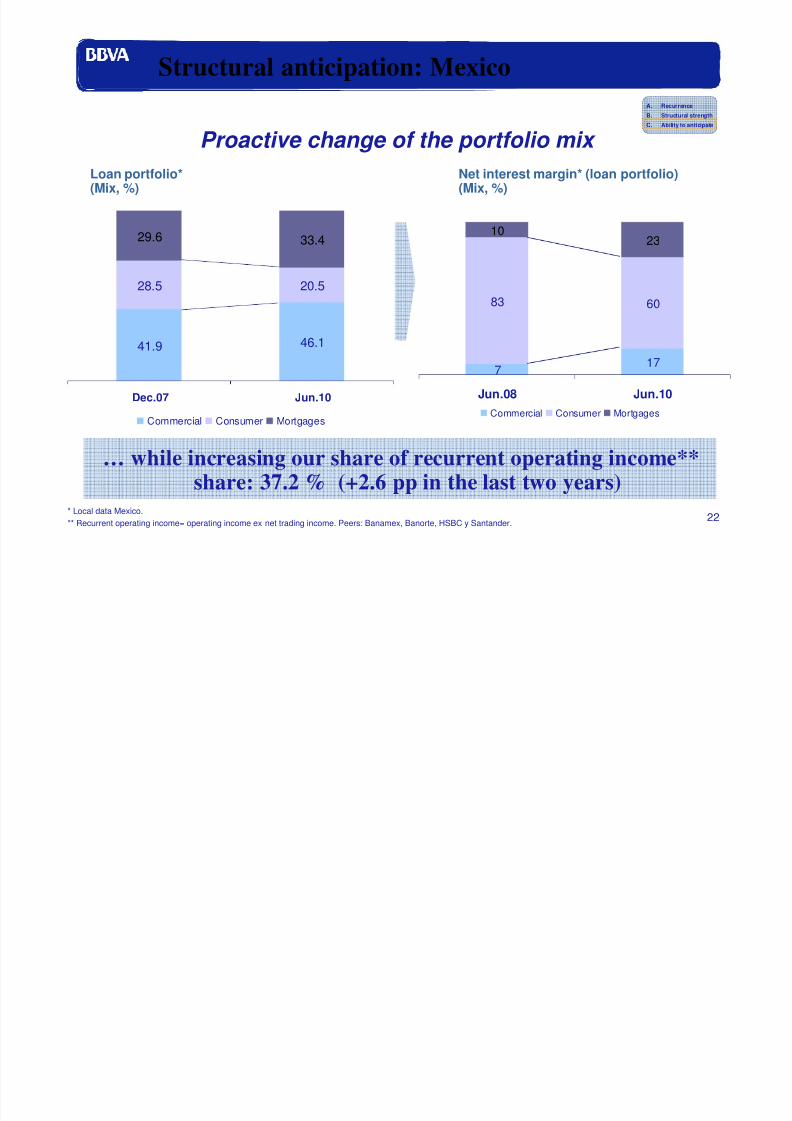
Structural anticipation: Mexico
Proactive change of the portfolio mix
… while increasing our share of recurrent operating income**
share: 37.2 % (+2.6 pp in the last two years)* Local data Mexico.** Recurrent operating income= operating income ex net trading income. Peers: Banamex, Banorte, HSBC y Santander.
Net interest margin* (loan portfolio)(Mix, %)
Loan portfolio*(Mix, %)
41.9 46.1
28.5 20.5
29.6 33.4
Dec.07 Jun.10
Commercial Consumer Mortgages
717
83 60
1023
Jun.08 Jun.10Commercial Consumer Mortgages
A. Recurrence
B. Structural strength
C. Ability to anticipate

8/8/2019 BBVA- BOA-Merril Lynch Conference 280910
http://slidepdf.com/reader/full/bbva-boa-merril-lynch-conference-280910 23/37
23
Why do we outperform our peers? Why will wecontinue to do so?
Superior businessmodel: source ofdifferentiation
1
Bank transformationfocused on superior
future growth
2 Diversification
Growth potential

8/8/2019 BBVA- BOA-Merril Lynch Conference 280910
http://slidepdf.com/reader/full/bbva-boa-merril-lynch-conference-280910 24/37
24
Better diversification: portfolio mix biasedtowards high growth economies
Potential growth of emerging economies and optimization of
franchises in mature markets
FuturePresent
20102010 201?201?

8/8/2019 BBVA- BOA-Merril Lynch Conference 280910
http://slidepdf.com/reader/full/bbva-boa-merril-lynch-conference-280910 25/37
25
Growth plan based on three pillars …
A. Customer B. Distribution C. Processes
Market sharegrowth
Productivityimprovement and
new relationshipmodel with our
customers
• Low costproduction
• Superior customerexperience
… with three clear objectives …
… and with technology as a facilitator

8/8/2019 BBVA- BOA-Merril Lynch Conference 280910
http://slidepdf.com/reader/full/bbva-boa-merril-lynch-conference-280910 26/37
26
And, what can we expect from each businessunit as a result of this plan?
Spain & Portugal
Mexico
South America
USA
WB&AM
• Market share gains
• Growth through bancarization andincreased capillarity
• Key driver of Group growth throughefficiency and high value segments
• Increase contribution and relative
weight within the Group throughimplementation of BBVA model
• Growth based on two pillars: product &geography

8/8/2019 BBVA- BOA-Merril Lynch Conference 280910
http://slidepdf.com/reader/full/bbva-boa-merril-lynch-conference-280910 27/37
27
Spain, ongoing stabilization in macro terms ...
Spain
GDP growth(%)
… and fiscal consolidationin progress
MeasuresReduction of public deficit in
2 years (% of GDP)
Discretionary measures
Increase in revenues
Immediate action plan
Adjustment plan submitted to theEC
Cyclical impact on deficit
+2.7 %
+1.0 %
+0.5 %
+1.5 %
-0.5 %
5.2 %
Deficit will fall from 11.2% to 6.0% of GDP in 2
years (to 3.0% by 2013: -7,2 pp)
Recovery symptoms …
Structural reforms on track
(labour market, pensions …)
3.6
0.9
-3.7
-0.5
2.0
2007 2008 2009 2010 (e) 2011-13
(e)Source: BBVA Research

8/8/2019 BBVA- BOA-Merril Lynch Conference 280910
http://slidepdf.com/reader/full/bbva-boa-merril-lynch-conference-280910 28/37
28
… and many opportunities we are already
exploiting
*Other domestic lending and other domestic deposits
Competitors’weaknesses
1. Consolidation process
2. Funding constraints
Market sharegain*
(Jul.10 vs Dec.09)
Superiorperformance
of Net interestincome
Superiorperformance
of riskindicators
-5.9-9.3
-13.5-22.2
-34.7
0.5
-4.4
0.6
BBVA
Spain &
Portugal
Peer 1 Peer 2 Peer 3 Peer 4 Peer 5 Peer 6 Peer 7
Net interst incomey-o-y growth – 1H10 / 1H09(%)
NPA ratio
Local peer groupVariation Jun10 / Dec09(Basis points)
-24
23
30
54
65
-4
22
Peer 1
BBVA S.A
Peer 2
Peer 3
Peer 4
Peer 5
Peer 6
Peer 7
Domestic deposits: +33 bp
Domestic lending: +103 bpOpportunity

8/8/2019 BBVA- BOA-Merril Lynch Conference 280910
http://slidepdf.com/reader/full/bbva-boa-merril-lynch-conference-280910 29/37
29
Mexico: positive perspectives from the macrostandpoint …
MexicoGDP growth(%)
Growth rates that
will soon lead to
higher earnings
3.3
1.5
-6.6
4.5
3.3
2007 2008 2009 2010 (e) 2011-13 (e)
Source: BBVA Research
8/8/2019 BBVA- BOA-Merril Lynch Conference 280910
http://slidepdf.com/reader/full/bbva-boa-merril-lynch-conference-280910 30/37
30
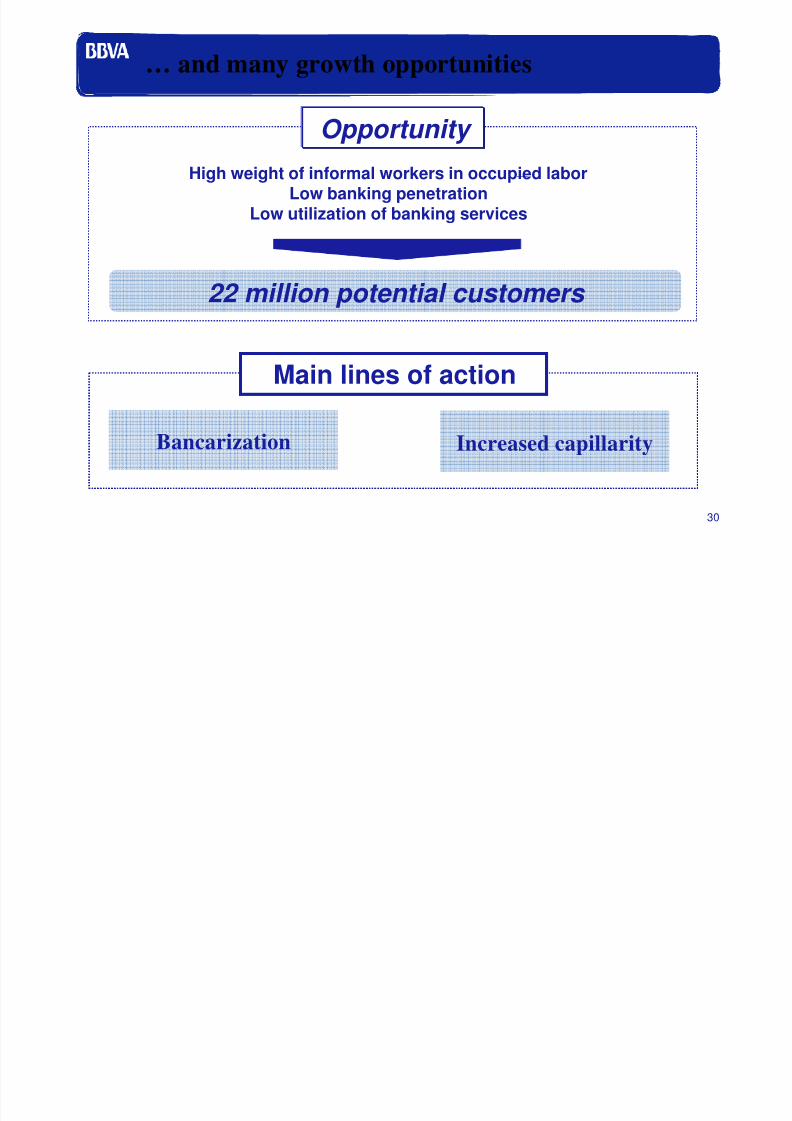
… and many growth opportunities
High weight of informal workers in occupied labor
Low banking penetrationLow utilization of banking services
22 million potential customers
Bancarization Increased capillarity
Opportunity
Main lines of action

8/8/2019 BBVA- BOA-Merril Lynch Conference 280910
http://slidepdf.com/reader/full/bbva-boa-merril-lynch-conference-280910 31/37
31
South America: high potential growth …
South America*GDP growth(%)
*Argentina, Brazil, Chile, Colombia, Peru and VenezuelaSource: BBVA Research
Dynamism of a region
that continues to be
an important source
of Group growth
6.7
5.1
-0.7
5.5
4.6
2007 2008 2009 2010 (e) 2011-13 (e)Source: BBVA Research

8/8/2019 BBVA- BOA-Merril Lynch Conference 280910
http://slidepdf.com/reader/full/bbva-boa-merril-lynch-conference-280910 32/37
32
… and opportunities to upgrade the franchiseand grow at full potential
Mass affluent and affluent
% FTEs devoted to sales
Efficiency
SpainSouth
America
61% 44%
• Profitability of an average affluentcustomer is 7.8 times that of the averagetypical customer
• Unattended affluent and corporatessegment
Opportunity
High value segmentsCrucial process
optimization
Main lines of action

8/8/2019 BBVA- BOA-Merril Lynch Conference 280910
http://slidepdf.com/reader/full/bbva-boa-merril-lynch-conference-280910 33/37
33
USA: several growth niches for our franchise …
USAGDP growth(%)
Despite uncertainty
the USA is leadingglobal recovery
1.9
0.0
-2.6
2.72.4
2007 2008 2009 2010 (e) 2011-13
(e)Source: BBVA Research

8/8/2019 BBVA- BOA-Merril Lynch Conference 280910
http://slidepdf.com/reader/full/bbva-boa-merril-lynch-conference-280910 34/37
34
… with a clear goal: to increase its contribution to15% of BBVA’s net income
Opportunity
Distribution
restructuring
• Sector consolidation: reduced competition
• Re-intermediation of financial services by banks
• Cross-border business
• Corporate banking
• High value customers
New IT
platform
Customer
acquisition and
saturation
Main lines of action
8/8/2019 BBVA- BOA-Merril Lynch Conference 280910
http://slidepdf.com/reader/full/bbva-boa-merril-lynch-conference-280910 35/37
35
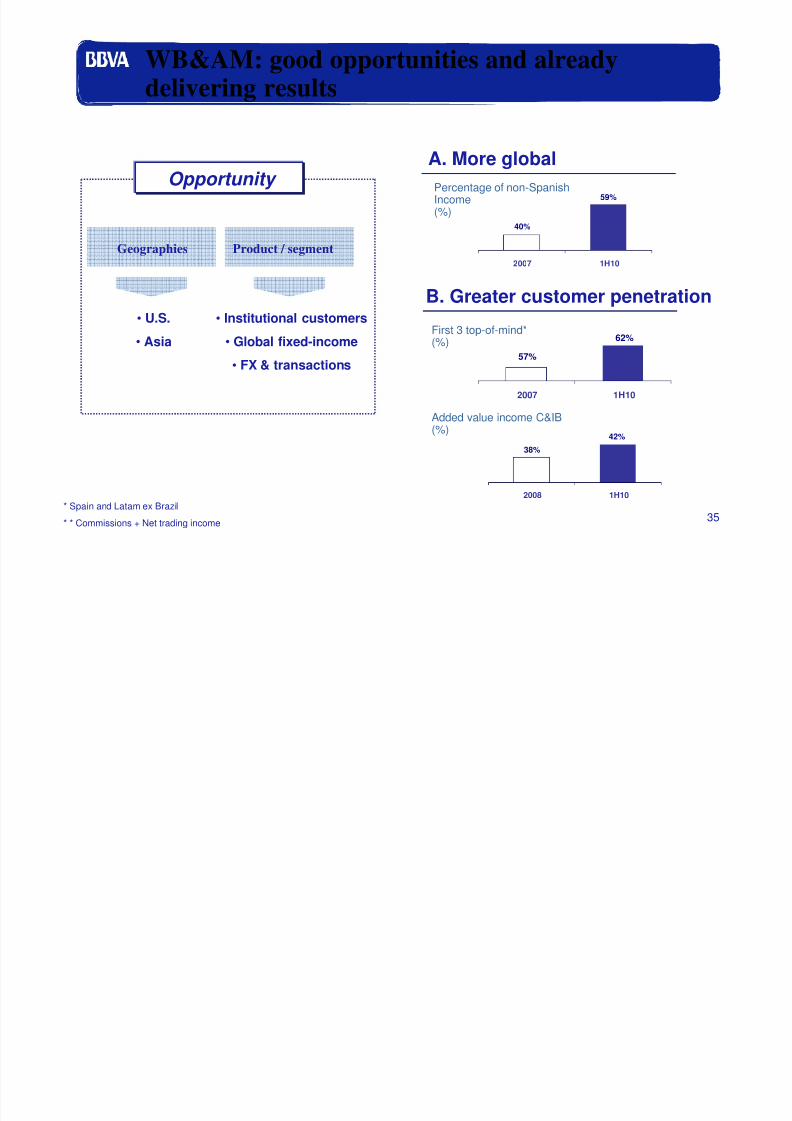
WB&AM: good opportunities and alreadydelivering results
Opportunity
B. Greater customer penetration
57%
62%
2007 1H10
38%
42%
2008 1H10
First 3 top-of-mind*(%)
Added value income C&IB(%)
Product / segmentGeographies
• U.S.
• Asia
• Institutional customers
• Global fixed-income
• FX & transactions
A. More global
40%
59%
2007 1H10
Percentage of non-Spanish
Income(%)
* Spain and Latam ex Brazil
* * Commissions + Net trading income

8/8/2019 BBVA- BOA-Merril Lynch Conference 280910
http://slidepdf.com/reader/full/bbva-boa-merril-lynch-conference-280910 36/37
36
In conclusion: a valuable investment opportunity
Superior business model:source of differentiation1
Bank transformationfocused on superiorfuture growth
2
• Recurrence
• Structural strength• Ability to anticipate
• Diversification
• Growth potential
Capacity and determination to lead
the future financial system
8/8/2019 BBVA- BOA-Merril Lynch Conference 280910
http://slidepdf.com/reader/full/bbva-boa-merril-lynch-conference-280910 37/37
37
Banking & Insurance CEO Conference
Ángel CanoPresident & COO
London, 28th September 2010
“Leading the New
Financial System”