bbva: global risk management - ubs european conference 2015
TRANSCRIPT
BBVAFinance
UBS European Conference 2015
BBVA: Global Risk Management

2
BBVA Global Risk Management
Rafael Salinas, Chief Risk Officer
UBS European Conference 2015 London, November 10th, 2015

3
1. Global Risk Management Model
2. Sound Risk Indicators
3. Conclusions

4
General Model
for Risk Control
& Management
Governance & Organization Roles, Responsibilities and management framework
Risk appetite principles Level of risk willing to be assumed
Decision-making and processes Appetite cascading into daily risk management
Assessment, Monitoring & Reporting Dynamic and anticipatory control of the risk function
Risk Infrastructures Resources for effective management and risk control
1
2
4
3
5
The risk management model provides strength and stability to the
Group, according to its management and strategy
Global Risk Management Model
5
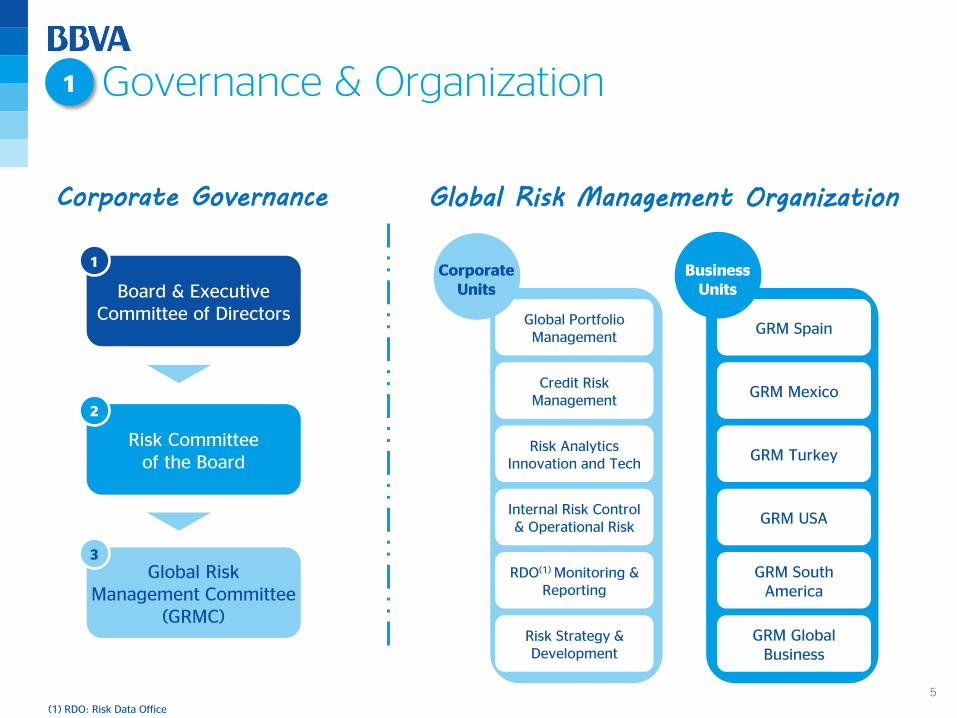
Governance & Organization
Global Risk Management Committee
(GRMC)
Board & Executive Committee of Directors
Risk Committee of the Board
1
2
3
Corporate Governance Global Risk Management Organization
Global Portfolio Management
Credit Risk Management
Risk Analytics Innovation and Tech
Internal Risk Control & Operational Risk
RDO(1) Monitoring & Reporting
Risk Strategy & Development
GRM Spain
GRM Mexico
GRM Turkey
GRM USA
GRM South America
GRM Global Business
Corporate Units
Business Units
1
(1) RDO: Risk Data Office
6
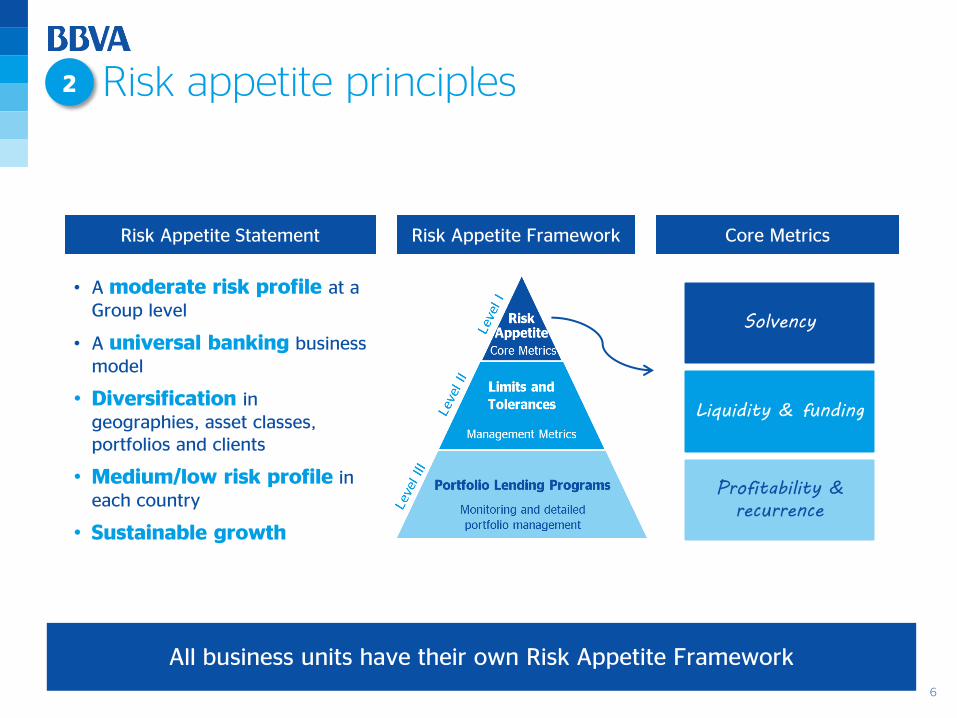
Risk Appetite Statement Risk Appetite Framework
All business units have their own Risk Appetite Framework
Core Metrics
Risk appetite principles
• A moderate risk profile at a Group level
• A universal banking business model
• Diversification in geographies, asset classes, portfolios and clients
• Medium/low risk profile in each country
• Sustainable growth
Solvency
Liquidity & funding
Profitability &
recurrence
2
7
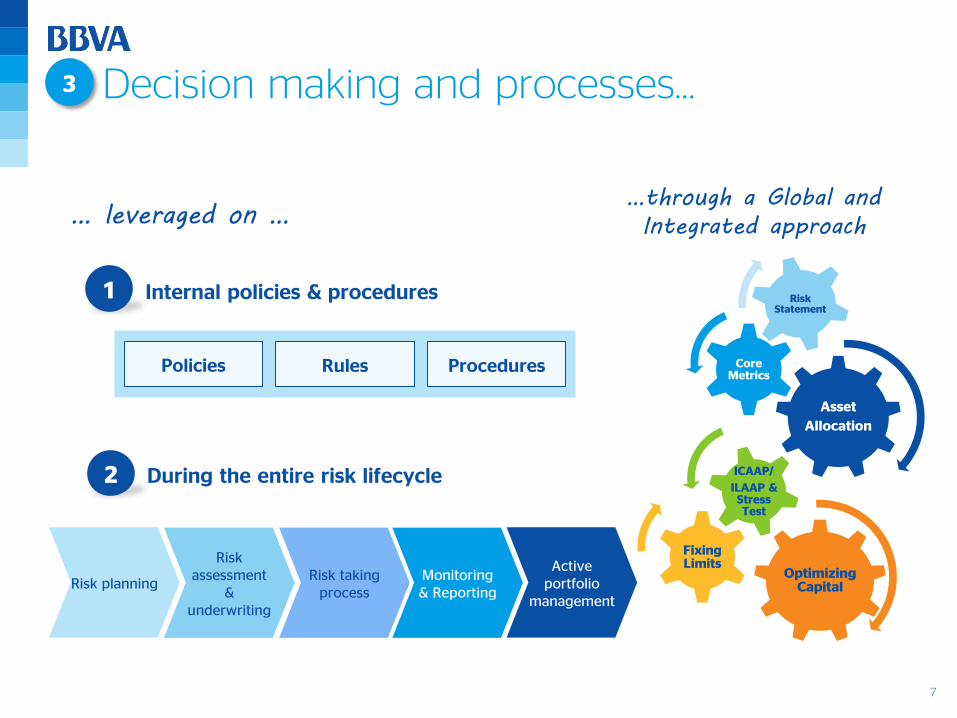
Asset
Allocation
Core Metrics
Risk Statement
Optimizing Capital
Fixing Limits
ICAAP/
ILAAP & Stress Test
… leveraged on …
1
2 During the entire risk lifecycle
Internal policies & procedures
Policies Rules Procedures
…through a Global and
Integrated approach
Decision making and processes…
Risk planning
Risk assessment
& underwriting
Risk taking process
Monitoring & Reporting
Active portfolio
management
3
8
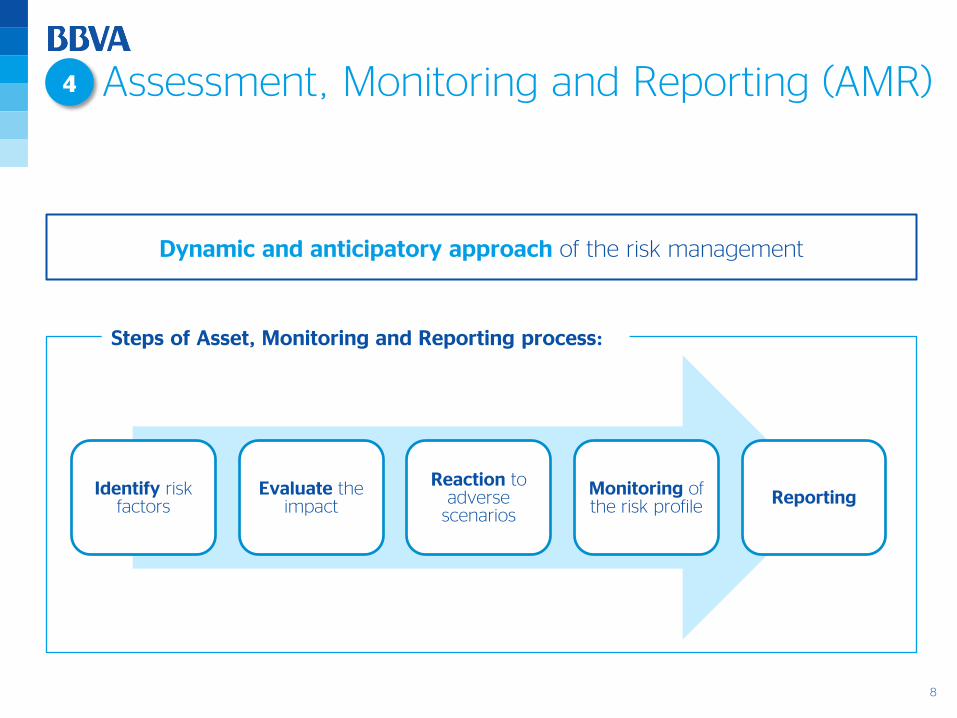
Identify risk factors
Evaluate the impact
Reaction to adverse
scenarios
Monitoring of the risk profile Reporting
Dynamic and anticipatory approach of the risk management
Steps of Asset, Monitoring and Reporting process:
Assessment, Monitoring and Reporting (AMR) 4
9
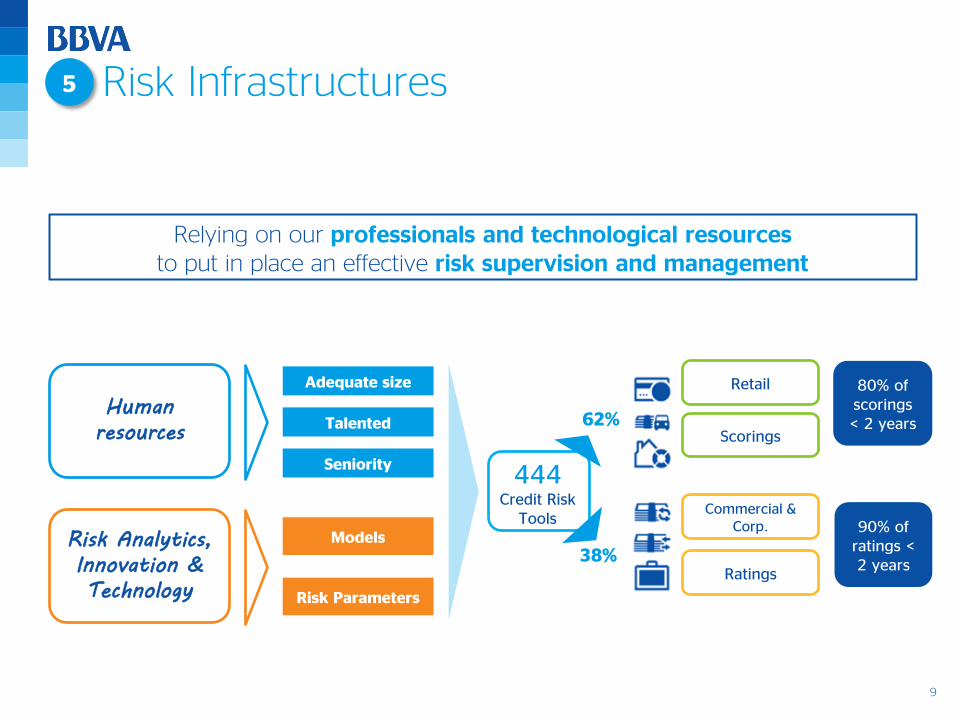
Human
resources
Adequate size
Talented
Seniority
Risk Analytics,
Innovation &
Technology
Models
Risk Parameters
Risk Infrastructures
444 Credit Risk
Tools
62%
38%
Retail
90% of ratings < 2 years
80% of scorings < 2 years
Scorings
Commercial & Corp.
Ratings
Relying on our professionals and technological resources to put in place an effective risk supervision and management
5

10
1. Global Risk Management Model
2. Sound Risk Indicators
3. Conclusions

11
BBVA: a client driven business in a well-diversified footprint
Total gross loans: € 426 Bn
BBVA Group Total Assets structure Sept.15
57%
43% 48%
14%
11%
10%
13%
4%
Rest of Eurasia
Spain + Real Estate
USA
Mexico
S.America
Turkey
Gross loans: breakdown by country (1)
Sept.15
(1) Excluding Corporate Center.
Rest of assets
Gross loans
12
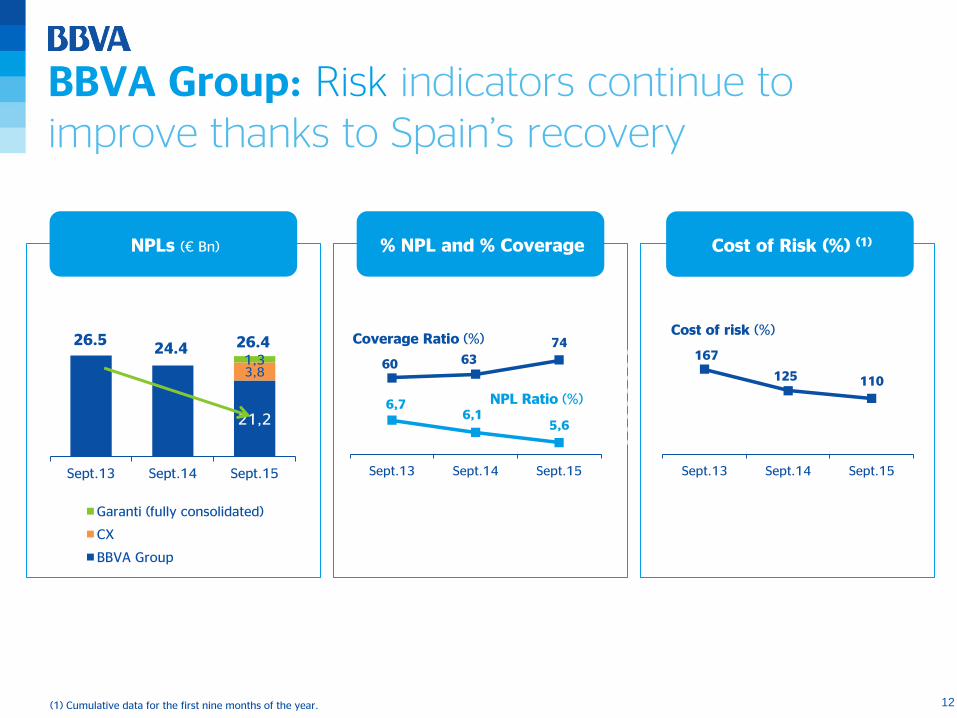
BBVA Group: Risk indicators continue to improve thanks to Spain’s recovery
21,2
3,8 1,3
Sept.13 Sept.14 Sept.15
Garanti (fully consolidated)
CX
BBVA Group
26.4
(1) Cumulative data for the first nine months of the year.
24.4 26.5
NPLs (€ Bn) % NPL and % Coverage Cost of Risk (%) (1)
6,7 6,1
5,6
60 63
74
01020304050607080
5
5,5
6
6,5
7
7,5
8
8,5
9
9,5
10
Sept.13 Sept.14 Sept.15
167
125 110
Sept.13 Sept.14 Sept.15
0
20
40
60
80
100
120
140
160
180
200
Cost of risk (%) Coverage Ratio (%)
NPL Ratio (%)
13
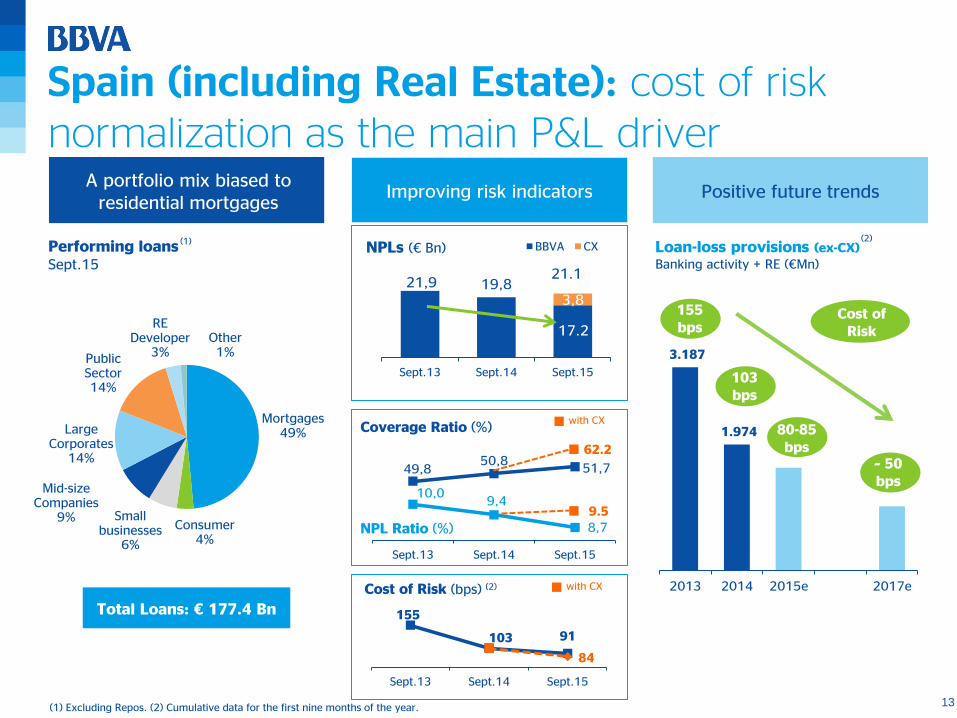
155
103 91
84
Sept.13 Sept.14 Sept.15
10,0 9,4
8,7
49,8 50,8
51,7
42444648505254
8,0
8,5
9,0
9,5
10,0
10,5
11,0
11,5
12,0
12,5
13,0
Sept.13 Sept.14 Sept.15
Mortgages 49%
Consumer 4%
Small businesses
6%
Mid-size Companies
9%
Large Corporates
14%
Public Sector 14%
RE Developer
3% Other 1%
Spain (including Real Estate): cost of risk normalization as the main P&L driver
A portfolio mix biased to residential mortgages
Performing loans Sept.15
(1)
Total Loans: € 177.4 Bn
(1) Excluding Repos. (2) Cumulative data for the first nine months of the year.
Improving risk indicators Positive future trends
3.187
1.974
2013 2014 2015e 2017e
Cost of Risk
Loan-loss provisions (ex-CX) Banking activity + RE (€Mn)
21,9 19,8 3,8
Sept.13 Sept.14 Sept.15
BBVA CX
17.2
103 bps
21.1
~ 50 bps
NPLs (€ Bn)
80-85 bps
155 bps
NPL Ratio (%)
Coverage Ratio (%)
9.5
62.2
with CX
with CX Cost of Risk (bps) (2)
(2)

14
0,9 0,9
164
153
135
140
145
150
155
160
165
170
175
180
0
1
2
3
4
5
6
7
8
Sept.14 Sept.15
Coverage Ratio (%)
NPL Ratio (%)
USA: Risk indicators at historically low levels
Comparing favorably to its peers
Growth biased to the commercial portfolio
Mortgages 22%
Consumer 12%
Small Business
7%
Mid-Size and large corporates
36%
Developers and CRE
16%
Public sector
7%
Performing loans Sept.15
Asset quality indicators
Local criteria data (June 15)
(1)
(1) Excluding Repos. (2) Cumulative data for the first nine months of the year.
Total Loans: € 57.5 Bn
Group’s best risk indicators
452 545
Sept.14 Sept.15
BBVA NPLs (€ Mn)
17 21
Sept.14 Sept.15
Cost of Risk (bps) (2)
NPL Ratio (%)
0,7
0,9
BBVA Compass
Peers Median
Coverage Ratio (%)
173
146
BBVA Compass
Peers Median
Cost of Risk (bps) (2)
30
20
BBVA Compass
Peers Median
15
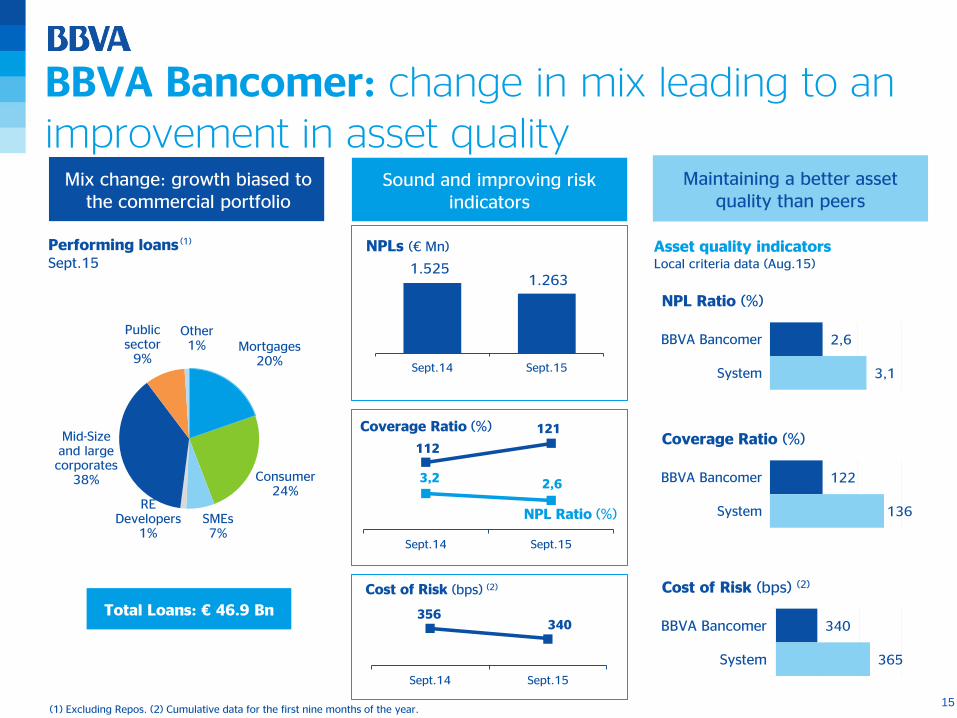
356 340
Sept.14 Sept.15
BBVA Bancomer: change in mix leading to an improvement in asset quality
Maintaining a better asset quality than peers
Asset quality indicators
Local criteria data (Aug.15)
Mortgages 20%
Consumer 24%
SMEs 7%
RE Developers
1%
Mid-Size and large corporates
38%
Public sector
9%
Other 1%
Mix change: growth biased to the commercial portfolio
Performing loans Sept.15
(1)
Total Loans: € 46.9 Bn
Sound and improving risk indicators
3,2 2,6
112
121
80859095100105110115120
012345678
Sept.14 Sept.15
Coverage Ratio (%)
NPL Ratio (%)
1.525 1.263
Sept.14 Sept.15
BBVA NPLs (€ Mn)
Cost of Risk (bps) (2)
(1) Excluding Repos. (2) Cumulative data for the first nine months of the year.
NPL Ratio (%)
2,6
3,1
BBVA Bancomer
System
Coverage Ratio (%)
122
136
BBVA Bancomer
System
Cost of Risk (bps) (2)
340
365
BBVA Bancomer
System
16
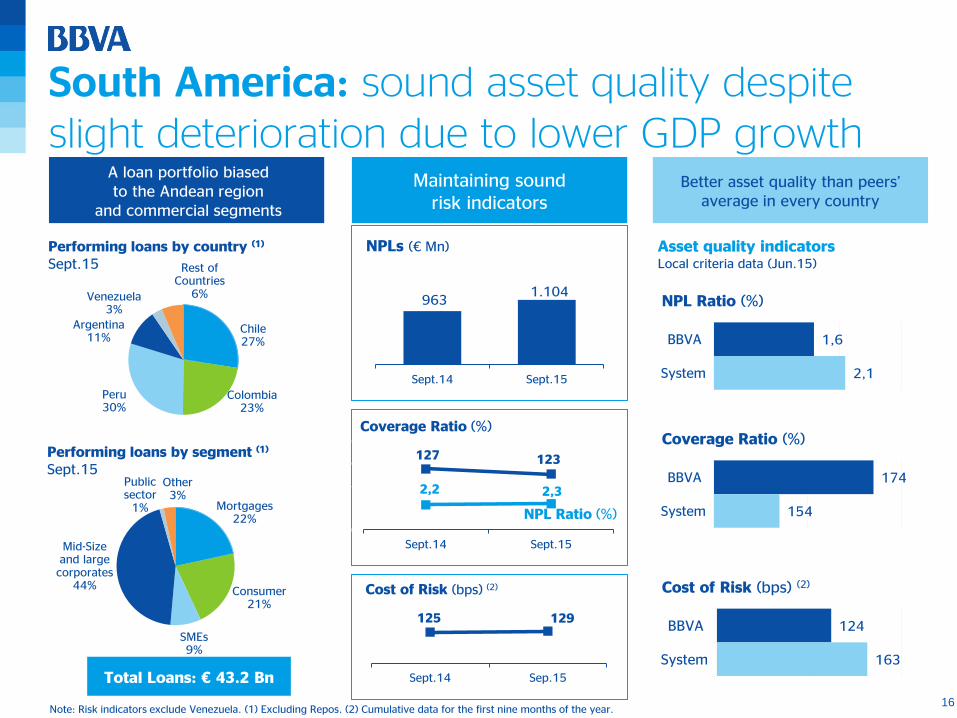
125 129
Sept.14 Sep.15
Chile 27%
Colombia 23%
Peru 30%
Argentina 11%
Venezuela 3%
Rest of Countries
6%
South America: sound asset quality despite slight deterioration due to lower GDP growth
Asset quality indicators
Local criteria data (Jun.15)
A loan portfolio biased to the Andean region
and commercial segments
Maintaining sound risk indicators
Better asset quality than peers’ average in every country
NPLs (€ Mn)
Note: Risk indicators exclude Venezuela. (1) Excluding Repos. (2) Cumulative data for the first nine months of the year.
Total Loans: € 43.2 Bn
Performing loans by country (1) Sept.15
2,2 2,3
127 123
80
90
100
110
120
130
140
150
012345678
Sept.14 Sept.15
Coverage Ratio (%)
NPL Ratio (%)
Cost of Risk (bps) (2)
NPL Ratio (%)
1,6
2,1
BBVA
System
Coverage Ratio (%)
174
154
BBVA
System
Cost of Risk (bps) (2)
124
163
BBVA
System
963 1.104
Sept.14 Sept.15
Mortgages 22%
Consumer 21%
SMEs 9%
Mid-Size and large corporates
44%
Public sector
1%
Other 3%
Performing loans by segment (1) Sept.15

17
2,6 2,6
115 119
5060708090100110120
012345678
Sept.14 Sept.15
Garanti: well-positioned to cope with short-term volatility
Mortgages 11%
Consumer 25% Commercial
58%
Other 6%
Selective lending strategy Asset quality resilient to
volatility Maintaining a better asset
quality than peers
Performing loans Sept.15
(1) Asset quality indicators
Local criteria data (Sept.15)
(1) Excluding Repos. (2) Cumulative data for the first nine months of the year.
Total Loans: € 52.6 Bn
19%
-5%
TL Loans FX Loans
YoY Performing loan growth
Sept.15
429
448
Sept.14 Sept.15
1,793
1,345
25% stake in Garanti
NPLs (€ Mn)
Coverage Ratio (%)
NPL Ratio (%)
110 103
Sept.14 Sept.15
Garanti full consolidation
Cost of Risk (bps) (2)
NPL Ratio (%)
2,3
2,9
Garanti
System
Coverage Ratio (%)
81
75
Garanti
System
Cost of Risk (bps) (2)
135
153
Garanti
System

18
1. Global Risk Management Model
2. Sound Risk Indicators
3. Conclusions
19
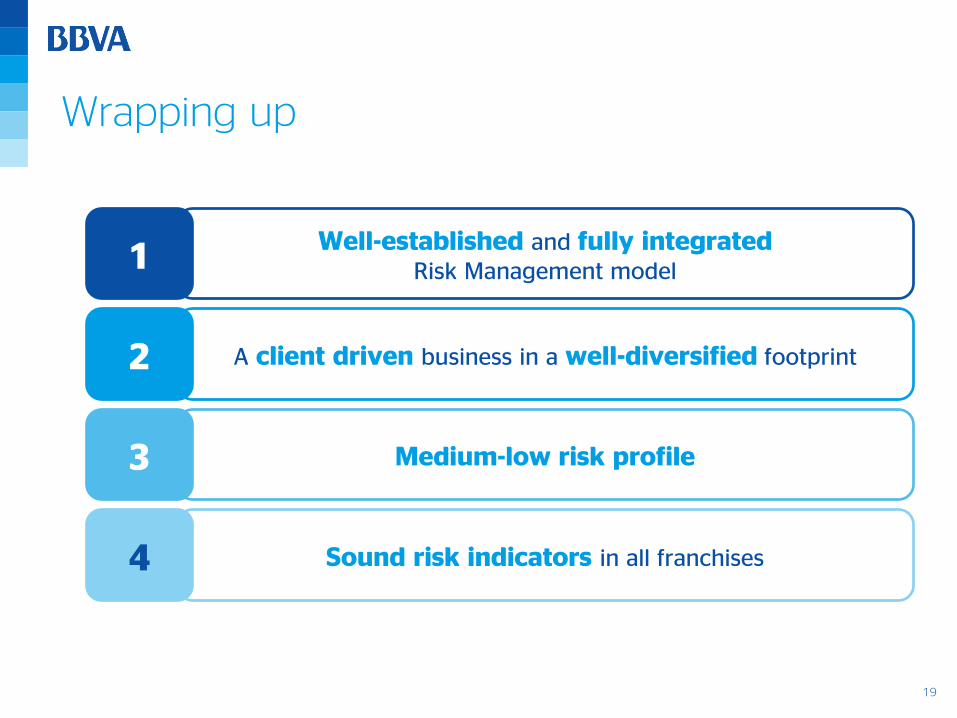
Wrapping up
Well-established and fully integrated Risk Management model
A client driven business in a well-diversified footprint
Medium-low risk profile
Sound risk indicators in all franchises
1
2
3
4
20
Rafael Salinas, Chief Risk Officer
UBS European Conference 2015 London, November 10th, 2015
BBVA Global Risk Management