bc fact book
TRANSCRIPT
EVER TO EXCEL
Fact Book
2016-2017BOSTON C O L L E G E
BOSTON COLLEGE FACT BOOK
2016-2017
Current and past issues of the Boston College Fact Book are available on the Boston College web site at
www.bc.edu/factbook
© Trustees of Boston College 1983-2017
2 Foreword
Foreword
The Office of Institutional Research, Planning & Assessment is pleased to present the Boston College Fact Book, 2016-2017, the 44th edition of this publication. This book is intended as a single, readily accessible, consistent source of information about the Boston College community, its resources, and its operations. It is a summary of institutional data gathered from many areas of the University, compiled to capture the 2015-2016 Fiscal and Academic Year, and the fall semester of the 2016-2017 Academic Year. Where appropriate, multiple years of data are provided for historical perspective. While not all-encompassing, the Fact Book does provide pertinent facts and figures valuable to administrators, faculty, staff, and students. Sincere appreciation is extended to all contributors who offered their time and expertise to maintain the greatest possible accuracy and standardization of the data. Special thanks go to graduate student Monique Ouimette for her extensive contribution. A concerted effort is made to make this publication an increasingly more useful reference, at the same time enhancing your understanding of the scope and progress of the University. We welcome your comments and suggestions toward these goals. This Fact Book, as well as those from previous years, is available in its entirety at www.bc.edu/factbook. Stephanie Chappe Jessica Greene Lead Research Analyst, Institutional Research Director, Institutional Research & Assessment Office of Institutional Research, Planning & Assessment Office of Institutional Research, Planning & Assessment December 2016
The Mission of Boston College Strengthened by more than a century and a half of dedication to academic excellence, Boston College commits itself to the highest standards of teaching and research in undergraduate, graduate and professional programs and to the pursuit of a just society through its own accomplishments, the work of its faculty and staff, and the achievements of its graduates. It seeks both to advance its place among the nation’s finest universities and to bring to the company of its distinguished peers and to contemporary society the richness of the Catholic intellectual ideal of a mutually illuminating relationship between religious faith and free intellectual inquiry. Boston College draws inspiration for its academic and societal mission from its distinctive religious tradition. As a Catholic and Jesuit university, it is rooted in a world view that encounters God in all creation and through all human activity, especially in the search for truth in every discipline, in the desire to learn, and in the call to live justly together. In this spirit, the University regards the contribution of different religious traditions and value systems as essential to the fullness of its intellectual life and to the continuous development of its distinctive intellectual heritage. Boston College pursues this distinctive mission by serving society in three ways:
• by fostering the rigorous intellectual development and the religious, ethical, and personal formation of its undergraduate, graduate, and professional students in order to prepare them for citizenship, service and leadership in a global society;
• by producing nationally and internationally significant research that advances insight and understanding, thereby both enriching culture and addressing important societal needs; and
• by committing itself to advance the dialogue between religious belief and other formative elements of culture through the intellectual inquiry, teaching and learning, and the community life that form the University.
Boston College fulfills this mission with a deep concern for all members of its community, with a recognition of the important contribution a diverse student body, faculty and staff can offer, with a firm commitment to academic freedom, and with a determination to exercise careful stewardship of its resources in pursuit of its academic goals. Approved by the Board of Trustees, May 31, 1996
Contents 3
Table of Contents
Foreword ............................................................................................................................................................................................. 2 The Mission of Boston College ......................................................................................................................................................... 2 A Brief History of Boston College ................................................................................................................................................... 6 A Boston College Chronology ......................................................................................................................................................... 7 Boston College Profile ..................................................................................................................................................................... 11
Administration & Faculty
Board of Trustee Membership ....................................................................................................................................................... 14 Trustee Associate Membership ..................................................................................................................................................... 15 Chairs – Board of Trustees .............................................................................................................................................................. 16 Officers of the University................................................................................................................................................................ 17 Academic Administration .............................................................................................................................................................. 17 Academic Institutes and Centers ................................................................................................................................................... 18 The Jesuit Community at Boston College ..................................................................................................................................... 19 The Saint Peter Faber Jesuit Community at Boston College ...................................................................................................... 19 Chart of Administration ................................................................................................................................................................. 20
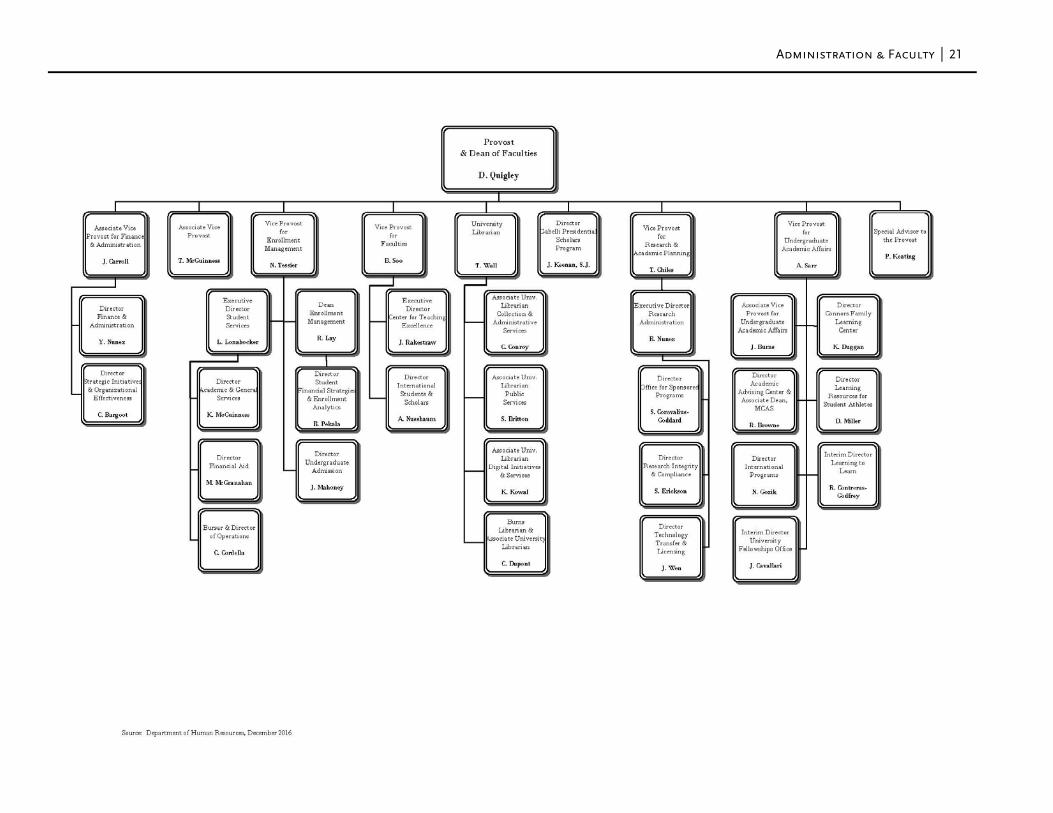
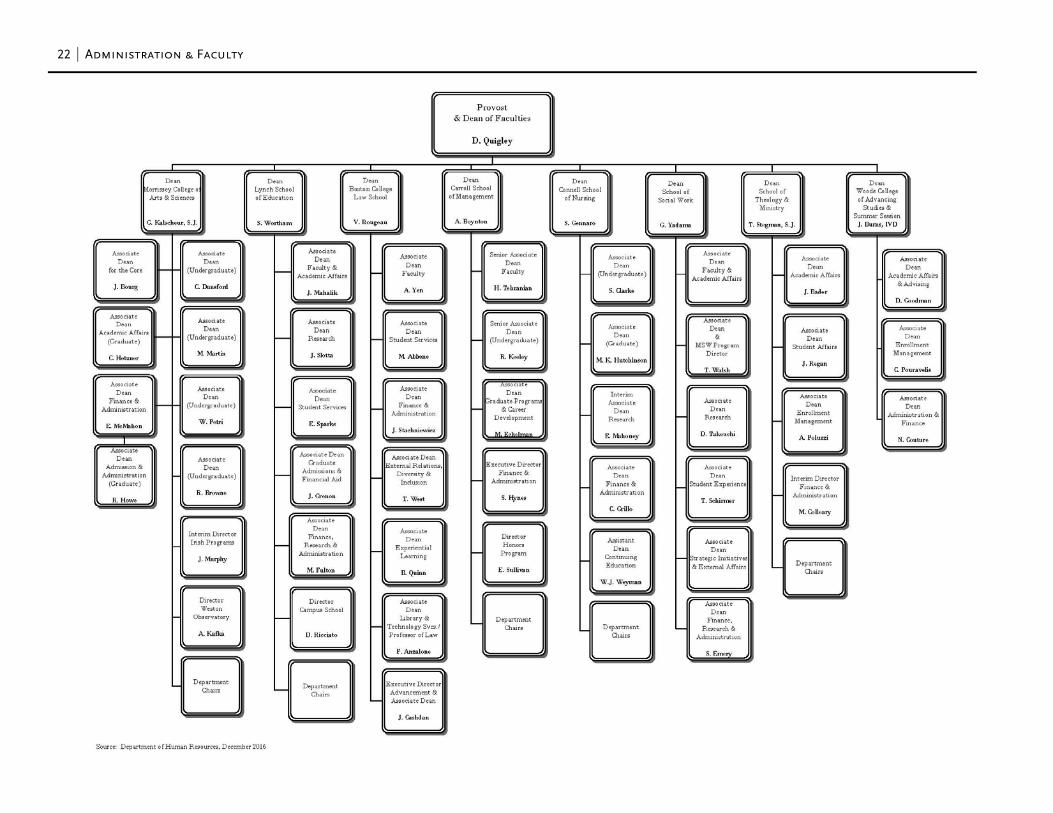
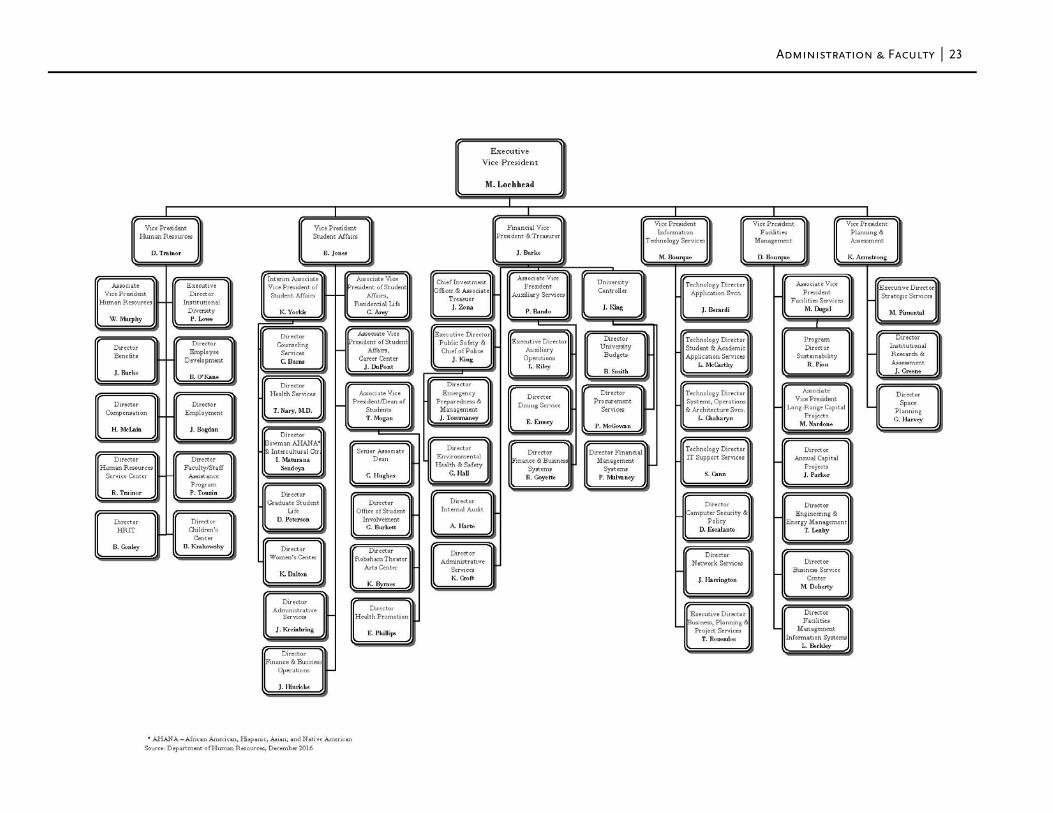
Provost and Dean of Faculties Units ........................................................................................................................................ 21 Executive Vice President Units ................................................................................................................................................. 23
Professional, Administrative, and Support Staff Personnel by Gender ................................................................................... 24 Professional, Administrative, and Support Staff Personnel by VP Area ................................................................................. 25 Restricted Funded Personnel by Gender and FTE ...................................................................................................................... 25 Faculty:
by School and Rank .................................................................................................................................................................... 26 by School and Gender ................................................................................................................................................................ 26 by School and Tenure Status ..................................................................................................................................................... 27 by Highest Degree Earned and Gender ................................................................................................................................... 27 by Rank and Gender .................................................................................................................................................................. 28 by Highest Degree Earned and Rank ....................................................................................................................................... 28 Full-Time Faculty, Teaching Fellows, and Teaching Assistants: Full-Time Equivalent by School ............................................................................................................................................... 29 by School and Department ........................................................................................................................................................ 30
Faculty Compensation: by Rank ........................................................................................................................................................................................ 32 by Rank, Average Compared to AAUP Category I .............................................................................................................. 32
Students
Freshman Enrollment by Year and Gender (Full-Time) ............................................................................................................ 34 Freshman Admission Profile .......................................................................................................................................................... 34 Freshman Applications, Acceptances, and Enrollment (Full-Time) ......................................................................................... 34 Class of 2020 Applications, Acceptances, and Enrollment – Geographic Distribution .......................................................... 35 Top Cross Application Competitor Schools of Admitted Freshmen ........................................................................................ 36 Undergraduate Transfer Students:
Applications, Acceptances, and Enrollment (Full-Time) ...................................................................................................... 36 by Type of Previous Institution and Gender .......................................................................................................................... 36
Geographic Distribution of Undergraduate Students ............................................................................................................... 37 Enrollment:
by School, Gender, and Status .................................................................................................................................................. 38 Student Credit Hours by School ............................................................................................................................................... 38
4 Contents
by School, Gender, and Status (Five Years) ............................................................................................................................ 39 by Race/Ethnicity, Gender, and Citizenship .......................................................................................................................... 40 Full-Time Equivalent Enrollment by School ........................................................................................................................... 41
Summer Session Enrollment .......................................................................................................................................................... 41 Undergraduates Studying Abroad ................................................................................................................................................ 42 Graduate Enrollment by Degree and Program ........................................................................................................................... 43 Undergraduate Majors by School .................................................................................................................................................. 44 Undergraduate Minors by School ................................................................................................................................................. 45 Most Popular Undergraduate Majors ........................................................................................................................................... 46 Disciplines with Largest Percent Increase in Undergraduate Majors ...................................................................................... 46 Most Popular Undergraduate Minors .......................................................................................................................................... 46 International Students and Scholars:
by School ...................................................................................................................................................................................... 47 by Class or Program ................................................................................................................................................................... 47 by Gender and Status ................................................................................................................................................................. 47 by Country .................................................................................................................................................................................. 48
Degrees Conferred: Undergraduate and Graduate by Degree and Gender ......................................................................................................... 49 Undergraduate by Degree and Number of Majors ............................................................................................................... 50 Undergraduate by School and Major ...................................................................................................................................... 51 Undergraduate by Number of Majors ..................................................................................................................................... 52 Graduate by School, Degree, Primary Field, and Gender .................................................................................................... 53
Undergraduate Financial Aid: Dollars Awarded ........................................................................................................................................................................ 54 Average Need-Based Financial Aid ......................................................................................................................................... 54
Undergraduate Student Retention and Graduation Rates ........................................................................................................ 55 Competitive Fellowships and Awards ......................................................................................................................................... 55
Alumni & Advancement
Alumni Association National Board of Directors ....................................................................................................................... 58 Alumni Association Regional Chapters ........................................................................................................................................ 58 Alumni Awards ............................................................................................................................................................................... 58 Alumni Geographic Distribution ................................................................................................................................................... 59 Living Alumni by Primary School and Class ............................................................................................................................... 60 Living Alumni by Gender and Class ............................................................................................................................................ 62 Gifts to the University ..................................................................................................................................................................... 63 Individual Donors by Giving Club ............................................................................................................................................... 63 Alumni Donors by Primary School and Class ............................................................................................................................. 64
Physical Plant
Buildings Related to Boston College Operations ......................................................................................................................... 68 Boston College Jesuit Community Owned Properties ................................................................................................................ 71 Boston College Properties ............................................................................................................................................................... 71 Facility Capacities ............................................................................................................................................................................ 72 Summary of Building Use .............................................................................................................................................................. 72 Classrooms ........................................................................................................................................................................................ 73 Dining Facilities ............................................................................................................................................................................... 73 Residence Hall Statistics by Building ............................................................................................................................................ 74
Contents 5
Finance
Highlights of Financial Operations ............................................................................................................................................... 78 Condensed Statement of Financial Position ................................................................................................................................. 79 Tuition and Fees .............................................................................................................................................................................. 80 Undergraduate Tuition Restated in 1982-84 Dollars ................................................................................................................... 81
Academic Resources & Research Activity Boston College Libraries ................................................................................................................................................................. 84 Boston College Library Holdings .................................................................................................................................................. 84 Expenditures for Library Materials ............................................................................................................................................... 84 Highlights of Sponsored Activities ............................................................................................................................................... 85 Summary of Sponsored Funding Actions .................................................................................................................................... 85 Sponsored Projects:
Source and Application of Funding ........................................................................................................................................ 86 Total Accounted Expense ......................................................................................................................................................... 86 Number of Proposals Submitted and Principal Investigators ............................................................................................. 86
Athletics
Varsity Sports Records .................................................................................................................................................................... 88 Intercollegiate Sports Participation ............................................................................................................................................... 88 Intramural Sports Participation ..................................................................................................................................................... 89 Club Sports Participation ................................................................................................................................................................ 90 Flynn Recreation Complex ............................................................................................................................................................. 90
General Information Founder of Boston College ............................................................................................................................................................. 92 Presidents of Boston College .......................................................................................................................................................... 92 Honorary Degrees and President’s Medals Awarded (Within last decade) ............................................................................ 92 Honorary Degrees Granted ............................................................................................................................................................ 93 Types of Degrees Conferred ........................................................................................................................................................... 93 Primary Accrediting Agencies ....................................................................................................................................................... 93 Association Memberships ............................................................................................................................................................... 94 Academic Calendars ........................................................................................................................................................................ 95 Fact Book Sources ............................................................................................................................................................................ 95 Index .................................................................................................................................................................................................. 96 Campus Maps .................................................................................................................................................................................. 98
6 History & Chronology
A Brief History of Boston College
Founded by the Society of Jesus in 1863 to serve the sons of Boston’s Catholic immigrants, Boston College was the first institution of higher learning chartered in the City of Boston. On September 5, 1864 Boston College opened its doors to 22 students, providing a liberal arts curriculum—with an emphasis on Greek and Latin classics, English, rhetoric, mathematics, philosophy, physics, chemistry and religion —based on the Ratio Studiorum (Plan of Studies) that had guided Jesuit universities in Europe and the Americas. Originally located on Harrison Avenue in the South End of Boston, Boston College outgrew its urban setting early in the 20th century. Then-president Thomas I. Gasson, S.J., selected a new location in Chestnut Hill and in 1907 purchased four parcels of land known as the Lawrence Farm. The firm of Maginnis and Walsh won a design competition for the development of the new campus, and Boston College broke ground on June 19, 1909 for construction of a central Recitation Building, which would later be named Gasson Hall. The Recitation Building opened in March 1913. The three other buildings that still shape the core of the campus—St. Mary's Hall, Devlin Hall, and Bapst Library—opened in 1917, 1924, and 1928, respectively. Though incorporated as a university since its founding, it was not until the 1920s that Boston College began to fill out the dimensions of its charter. It established a Summer Session in 1924; followed by the Graduate School of Arts and Sciences in 1925; the Law School and Evening College in 1929; the Graduate School of Social Work in 1936; and the College of Business Administration in 1938. The latter, along with its Graduate School established in 1957, is now known as the Wallace E. Carroll School of Management. The schools of Nursing and Education, founded in 1947 and 1952, respectively, are now known as the William F. Connell School of Nursing and the Carolyn A. and Peter S. Lynch School of Education. The Graduate School of Arts and Sciences began programs at the doctoral level in 1952. Now, courses leading to the doctorate are offered by 13 Arts and Sciences departments. The schools of Education, Management, Nursing, Social Work, and Theology and Ministry also offer doctoral programs. While Boston College conferred one bachelor’s degree and 15 master’s degrees on women in 1927 through its Extension Division -- the precursor of the Graduate School of Arts and Sciences -- it was not until 1970 that all of Boston College’s undergraduate programs became coeducational. Today, female students comprise more than half of the University’s enrollment. In 1974, Boston College acquired Newton College of the Sacred Heart, a mile-and-a-half from the Main Campus. With 15 buildings standing on 40 acres, it is now the site of the Boston College Law School and undergraduate residence halls housing 800 freshmen. In 1996, the Evening College became the College of Advancing Studies, offering bachelor’s and master’s degrees; in 2002, the College was renamed the Woods College of Advancing Studies in honor of its long-serving Dean, James A. Woods, S.J. In July 1996, the University’s longest presidency came to an end after 24 years when J. Donald Monan, S.J., became chancellor and William P. Leahy, S.J., was named Boston College’s 25th president.
During the decade of the nineties, the University completed several major construction projects, including the expansion and renovation of Higgins Hall, and the updating of residence halls on the Upper and Newton campuses. Between 2004 and 2007, Boston College acquired from the Archdiocese of Boston 65 acres of land across Commonwealth Avenue in what is now called the Brighton Campus. In November 2004, Boston College purchased St. Stephen’s Priory in Dover, encompassing 78.5 acres of land that is now used for conference and retreat space. On December 5, 2007, Boston College unveiled its 10-year, $1.6 billion Strategic Plan, which called for the addition of 100 new faculty, a student center, recreation complex, a fine arts district, playing fields for baseball, softball and intramurals, and 1,200 new beds to meet 100 percent of undergraduate housing demand. In June 2008, the Weston Jesuit School of Theology re-affiliated with Boston College, and joined the Institute of Religious Education and Pastoral Ministry and C21 Online to form the new School of Theology and Ministry. Between 1996 and 2015, freshman applications increased from 16,501 to 29,486 and the average SAT scores of entering freshmen rose by more than 150 points to 2036. During this same period, the dollar amount of sponsored project awards received by the University more than doubled. Since 1996, the University’s endowment has grown from $590 million to $2.3 billion. From 2012 to 2013, Boston College celebrated the 150th anniversary of its founding. The Sesquicentennial celebration opened with a landmark Mass at Boston's Fenway Park, followed by six academic symposia, a student concert at Boston’s Symphony Hall, an on-campus naturalization ceremony, and a seven-city “150 on the Road” alumni volunteer effort, in which 1823 alumni, parents and friends packed 451,077 meals for shipment to needy families in West Africa. Stokes Hall, a 183,000 square-foot building strategically designed to foster interdisciplinary collaboration among BC’s humanities departments and enhance student-faculty interaction, officially opened in 2013. The Institute for Advanced Jesuit Studies was launched in 2014. In 2015, the Morrissey College of Arts and Sciences was dedicated in honor of alumnus, longstanding trustee and benefactor Robert J. Morrissey ’60. In 2016, Boston College was elevated to the Carnegie Classification of ‘R1’, a designation assigned to doctoral universities with the highest levels of research activity. The University initiated its 10-year NEASC accreditation and a new strategic planning effort and closed its Light the World campaign, the most successful capital campaign in BC history.
Source: Office of University Communications
History & Chronology 7
A Boston College Chronology
1857 John McElroy, S.J., purchased property in the South End
of Boston for a new college. 1863 Gov. John A. Andrew signed the charter of Boston
College, April 1. The first meeting of the Boston College Trustees took place on July 6.
1864 Boston College opened on September 5, with John Bapst,
S.J., as president, Robert Fulton, S.J., as dean, and 22 students.
1877 Nine students received A.B. degrees at the first
Commencement on June 28. 1883 Publication began on The Stylus, the Boston College
literary magazine. 1907 Thomas Gasson, S.J., named president; purchased the
Lawrence Farm in Chestnut Hill for a new campus. 1913 The first graduation ceremony took place on the Chestnut
Hill Campus on June 18. Four classes enrolled in the newly opened Gasson Hall in September.
1918 Conscription and voluntary enlistment for World War I
reduced Boston College enrollment to 125 in October, down from 671 two years earlier.
1919 Boston College won its first major football victory, 5-3,
over favored Yale at New Haven. First issue of The Heights, student weekly, printed November 17.
1923 The Baseball team beat Holy Cross 4-1 before 30,000 at
Braves Field, June 18. 1924 Summer School began. 1925 Boston College began to fill out the dimensions of its
charter as a university with the founding of the Graduate School of Arts and Sciences.
1928 Bapst Library opened, the fourth of the early Maginnis
and Walsh buildings. Weston Observatory, the seismological station, was founded.
1929 The Law School opened at 11 Beacon Street, and the
Evening College began as “Boston College Intown” at 126 Newbury Street, Boston.
1935 Greek was no longer required for the A.B. degree. 1936 The Graduate School of Social Work opened at Newbury
Street. 1938 The School of Management opened at Newbury Street as
the “College of Business Administration.”
1940 The Football team traveled to its first bowl game — the
Cotton Bowl — and was defeated by Clemson (6-3). 1941 Cardinal William O’Connell obtained the Liggett estate,
the future site of Upper Campus, and gifted it to the University.
1946 To accommodate post-war enrollment, army surplus
barracks became dormitories on the present site of Campion Hall; a larger office/classroom building was erected on the present location of McGuinn Hall, and a recreation building on the site of Cushing Hall.
1947 Construction began on the first permanent building since
the completion of Bapst in 1928, to house the College of Business Administration (occupied in September, 1948). The School of Nursing opened on Newbury Street in Boston.
1949 Boston College acquired the small reservoir on the Lower
Campus. The Men’s Hockey team won its first national title at Colorado Springs.
1951 Completion of Lyons Hall. 1952 The School of Education opened in September in Gasson
Hall. Doctoral programs began in economics, education, and history, initiating an era of increased emphasis on graduate education.
1954 The Law School moved to St. Thomas More Hall on the
Chestnut Hill Campus. 1955 Claver, Loyola, and Xavier halls opened, the first student
residences. The School of Education moved into Campion Hall.
1957 The Graduate School of Management opened. Alumni
Stadium was dedicated September 21. 1958 Latin was no longer required for the A.B. degree. The
College of Arts and Sciences Honors Program and the Scholar of the College Program began. The original gymnasium, Roberts Center, and the first hockey rink, McHugh Forum, opened.
1959 The Board of Regents, advisors to the Trustees and BC
administration, was established. 1960 The School of Nursing occupied its campus building,
Cushing Hall. Three more student residences, named for the early bishops of Boston, Cheverus, Fenwick, and Fitzpatrick, were completed.
1961 McElroy Commons opened.
8 History & Chronology
1963 President John F. Kennedy addressed the Boston College
Centennial Convocation on April 20. The self-study of the College of Arts and Sciences led to a new core curriculum, a reduction in the course load, the election of department chairmen, the establishment of Educational Policy committees, and sabbaticals.
1964 Carney Hall opened. Students moved into Welch,
Williams, and Roncalli residences. 1966 Dedication of Higgins Hall in November. 1968 The Board of Regents joined the Jesuit Trustees to form
the Board of Directors on October 8. The Black Talent Program, precursor to AHANA Student Programs, began.
1970 Women were admitted for degrees in all undergraduate
colleges. The modular residences were placed on the Lower Campus. PULSE, an academic/social action program, and the Campus School for children with multiple disabilities began.
1971 The offices of President of Boston College and Rector of
the Boston College Jesuit Community were separated on January 1. Installation of Omicron Chapter, Phi Beta Kappa took place on April 6.
1972 J. Donald Monan, S.J., succeeded W. Seavey Joyce, S.J., as
president on September 5. The Trustees voted to eliminate the Board of Directors and to expand the Board of Trustees to include laypeople. The newly structured Board of Trustees, with 35 members (13 Jesuits), elected Cornelius Owens ’36 chairman. The Women’s Center was established.
1973 The Long-Range Fiscal Planning Committee presented to
the Trustees a plan for balanced budgets for the succeeding five years.
1974 Newton College of the Sacred Heart became part of
Boston College (announced March 11). 1975 The Law School moved to the Newton Campus.
Edmond’s Hall was occupied in September. 1976 The New Heights Advancement Campaign to raise $21
million began in April. It would raise more than $25 million over the next five years.
1979 One thousand friends of Speaker of the House Thomas P.
O’Neill, Jr. ’36, gathered in Washington to establish the O’Neill Chair in American Politics, December 9. The Graduate School of Social Work established a doctoral degree program. The Recreation Complex was named for Athletic Director William J. Flynn.
1980 The Jesuit Community endowed the Thomas I. Gasson,
S.J., Chair for distinguished Jesuit scholars. 1982 Walsh Hall residence was named in honor of former
president Michael P. Walsh, S.J., on October 7.
1984 O’Neill Library was dedicated to Speaker Thomas P.
O’Neill, Jr. ’36. Doug Flutie was awarded the Heisman Trophy.
1985 The E. Paul Robsham, Jr. Theater Arts Center was opened
on the Lower Campus. 1986 Bapst Library was rededicated, and Burns Library opened
on April 22. The University planning document “Goals for Nineties” was released. The Alumni Association moved to Alumni House on the Newton Campus. A St. Patrick’s Day dinner took place in Washington honoring House Speaker Thomas P. O’Neill, Jr. ‘36. Speakers included President Ronald Reagan, former President Gerald Ford, and Bob Hope. The event raised $2 million for Boston College scholarships. The five-year $125- million Campaign for Boston College began. McHugh Forum was dismantled to make way for Conte Forum.
1987 The School of Management’s doctoral program in finance
was approved by the Trustees. The Jesuit Institute, funded by a $1.5 million gift from the Jesuit Community, with a matching University commitment, was established to support exploration into the religious and ethical questions that emerge from the intersection of faith and culture.
1988 The first students were enrolled in the new School of
Nursing Ph.D. program. The Music Program became a department in the College of Arts and Sciences. Vouté Hall opened. The Museum of Art opened in Devlin Hall.
1989 Congressman Silvio O. Conte ’49, was present for the
dedication of Conte Forum. The School of Management became the Carroll School of Management in honor of Wallace E. Carroll ’28. Sister Thea Bowman was awarded an honorary degree, and AHANA House was named for her in October. Roberts Center was razed to make room for the Merkert Chemistry Center.
1991 A wing was added to Campion Hall, completing a major
renovation of the original building. 1992 The Eugene F. Merkert Chemistry Center was dedicated.
The Campaign for Boston College was completed, exceeding the $125-million goal by more than $11 million.
1993 The renovated Devlin Hall welcomed its occupants,
including the Department of Geology and Geophysics, the Department of Fine Arts, and the Admission Office. The Football team beat number- one ranked Notre Dame at South Bend, 41–39. Renovation of Fulton Hall began. The Theater Department was established.
1994 Graduate programs in Nursing and Education separated
from the Graduate School of Arts and Sciences. J. Donald Monan, S.J., established a University Academic Planning Council to map University strategies. A garage for 900 cars was completed behind St. Mary’s Hall. The stadium seating capacity was enlarged from 32,000 to 44,500.
History & Chronology 9
1995 On October 6, the Trustees elected William P. Leahy, S.J.,
to succeed J. Donald Monan, S.J., as president. Fulton Hall reopened, enlarged and transformed exteriorly to match the Gothic style of the early buildings.
1996 The Law School’s new library was completed and opened
on the Newton Campus in January. U.S. News & World Report ranked Boston College 16th among the nation’s teaching universities and 37th in the national university category. The student residence at 70 St. Thomas More Road was named Thomas A. and Margaret A. Vanderslice Hall; a nearby residence building was named Gabelli Hall; the museum became the Charles S. and Isabella V. McMullen Museum of Art. On July 31, J. Donald Monan, S.J.’s 24-year presidency ended, and on October 18, William P. Leahy, S.J., was inaugurated as the 25th president of Boston College.
1997 In a rating of graduate schools, U.S. News & World Report
placed Boston College Law School 22nd in its field, while the Graduate School of Social Work was ranked 14th, the School of Nursing 27th, and the School of Education 28th. In March, William P. Leahy, S.J. was homilist at the annual St. Patrick’s Day Mass at the Cathedral of the Holy Cross.
1998 The Irish Institute and the Irish Studies Program
celebrated their new home at Connolly House. Work began on a three-year project to renovate and expand Higgins Hall, which housed the Biology and Physics departments. U.S. News & World Report rated the BC schools of Law, Education, and Nursing among the top 25 in their fields. BC undergraduates won more than 20 prestigious national fellowships, including a dozen Fulbrights and a coveted Marshall Scholarship.
1999 The School of Education was named the Carolyn A. and
Peter S. Lynch School of Education in recognition of the couple’s gift of more than $10 million. For the fifth consecutive year, Boston College was ranked among the top 40 national universities by U.S. News & World Report. The McMullen Museum of Art’s exhibition “Saints and Sinners: Caravaggio and the Baroque Image” attracted more than 65,000 visitors. BC announced its Ever to Excel Capital Campaign.
2000 The annual U.S. News & World Report survey ranked
Boston College 38th among the nation’s 228 national universities. Geoffrey and Rene Boisi committed $5 million to establish the Center for Religion and American Public Life, directed by political scientist Alan Wolfe. The Norma Jean Calderwood Chair in Islamic and Asian Art was established.
2001 A $2 million grant from the Lilly Endowment supported
a Boston College program to encourage students to integrate faith and career. BC established a permanent Dublin home, on St. Stephen’s Green, as a resource for the University’s Irish Studies Program. Men’s Hockey won its second national title, defeating the University of North Dakota.
2002 Boston College received a record number of
undergraduate applications for the 2002-2003 academic year, with more than 21,000 applying for the approximately 2,200 available seats. U.S. News & World Report ranked the Carroll Graduate School 39th in the nation. The former Evening College was renamed the Woods College of Advancing Studies in honor of longtime dean James A. Woods, S.J.; President William P. Leahy, S.J., announced that Boston College would launch an initiative called “The Church in the 21st Century” to help renew and revitalize the Church in the wake of the clergy abuse scandal.
2003 The Boston College “Church in the 21st Century” initiative
attracted national attention with its conferences and seminars. Boston College’s Ever to Excel Capital Campaign surpassed its original $400 million goal by generating more than $440 million in gifts. BC announced that it would withdraw from the Big East and accept an invitation to join the Atlantic Coast Conference. Two Boston College students earned Rhodes Scholarships, the first in the University’s history. The School of Nursing was renamed the William F. Connell School of Nursing in honor of longtime Trustee, William F. Connell, ’59.
2004 In June, Boston College acquired 43 acres of land and five
buildings across Commonwealth Avenue in Brighton from the Archdiocese of Boston. BC also purchased St. Stephen’s Priory in Dover to be used as a retreat and conference center. President William P. Leahy, S.J., took the “Church in the 21st Century” program to Los Angeles, Phoenix, Dallas, Atlanta, Naples, and Chicago, so that alumni could discuss issues confronting the Catholic Church.
2005 Boston College’s “Church in the 21st Century” initiative
was made into a permanent center. The Yawkey Athletics Center, a 72,000 square-foot addition to Alumni Stadium, opened in the spring. BC accepted 130 students from Loyola and Tulane universities until their schools in New Orleans recovered from the effects of Hurricane Katrina. Future President Barack Obama addressed students at First Year Academic Convocation.
2006 A partnership between Boston College, the Archdiocese of
Boston, and St. Columbkille Parish was formed to allow the parish school to continue offering a pre-kindergarten through 8th grade Catholic education for children in the Allston-Brighton community. The Carroll School of Management established the Winston Center for Leadership and Ethics to examine issues of ethical leadership. Boston College launched a minor in Jewish Studies in the College of Arts and Sciences. Boston College set new records for the number of research grants and dollars won by faculty and staff, with a total of 358 awards, amounting to a total of $44.4 million.
10 History & Chronology
2007 A record number of 20 Boston College students were
awarded Fulbright Scholarships, including 18 undergraduates. In August, Boston College signed an agreement with the Archdiocese of Boston for the purchase of an additional 18 acres of land, and several administrative and academic buildings, on the Brighton Campus. The international student body more than doubled during the past 20 years, climbing from 360 in 1986-87 to 767 in 2007. On December 5, Boston College unveiled its 10-year, $1.6 billion Strategic Plan, including the addition of 100 faculty members, a recreation complex, a fine arts district, and athletic playing fields.
2008 The College of Arts and Sciences approved an
interdisciplinary major in Islamic Civilization and Societies. The Lynch School of Education received foundation grants totaling $9.2 million to expand its successful “Boston Connects” in the public elementary schools in Boston. In June, the Weston Jesuit School of Theology re-affiliated with Boston College, and joined the Institute of Religious Education and Pastoral Ministry and C21 Online to form the new School of Theology and Ministry. Boston College launched its $1.5 billion Light the World Capital Campaign.
2009 On June 18, the City of Boston approved Boston College’s
plans for the Lower and Brighton campuses proposing the construction of a student center, a fine arts district, a recreation center, playing fields for intramural sports, and sufficient residence halls to meet 100 percent of demand for undergraduate housing. On November 11, BC dedicated a Veterans Memorial on the Burns Library lawn. The 68-foot-long granite wall is inscribed with the names of the 205 alumni who died in military service to their country.
2010 Planning began for the construction of Stokes Hall, along
the southwest corner of Middle Campus. On April 10, BC defeated Wisconsin to win the NCAA men’s hockey championship. The Geology and Geophysics Department was renamed the Department of Earth and Environmental Sciences to reflect environmental interest at BC. The Times Higher Education rankings placed Boston College at 161 among the top universities in the world. A $20 million commitment from benefactors Patrick and Barbara Roche established the Roche Center for Catholic Education within the Lynch School.
2011 The Graduate School of Social Work commemorated 75
years of social work teaching and research. Construction began on Stokes Hall, the first new academic building to be constructed on Middle Campus in more than two decades.
2012 Boston College won its fifth NCAA Men's Ice Hockey
National Championship, defeating Ferris State. A $15 million commitment from alumnus Patrick Cadigan ’57 created the Cadigan Alumni Center on the Brighton Campus. Boston College commenced its 150th anniversary celebration with a Sesquicentennial Mass at Fenway Park on September 15. Stayer Hall was named and dedicated in honor of University Trustee Ralph Stayer, his wife Shelly, and their family.
2013 Boston College continued its celebration of its 150th
anniversary with academic symposia, a performance of student musical groups at Boston’s Symphony Hall and a seven-city alumni and parent volunteer effort that packed 451,077 meals for shipment to West Africa. Stokes Hall, strategically designed to foster interdisciplinary collaboration among BC’s humanities departments and enhance student-faculty interaction, officially opened. It was made possible by a gift from University Trustee Patrick Stokes ’64 and his wife, Aja. Professor of History Robin Fleming was awarded a prestigious MacArthur Fellowship (“genius grant”), a first for a BC faculty member.
2014 Construction began on a 490-bed residence hall at 2150
Commonwealth Avenue, the site of the former More Hall. New endowed assistant professorships were established, part of an initiative to support junior faculty research and early-career development. The Institute for Advanced Jesuit Studies was launched.
2015 The Morrissey College of Arts and Sciences was dedicated
in honor of alumnus, long-serving trustee and generous benefactor Robert. J. Morrissey ’60.
2016 Boston College was elevated to the Carnegie Classification
of ‘R1’, a designation assigned to doctoral universities with the highest levels of research activity. Athletics announced plans for three projects: a recreational center, playing fields, and an athletics field house. The University initiated its 10-year NEASC accreditation and a new strategic planning effort. The Light the World campaign closed, the most successful capital campaign in BC history. A new residence hall opened at the former site of More Hall; the McMullen Museum of Art reopened at its new location on BC’s Brighton Campus.
Note: References to presidents and Board of Trustee chairs are minimized in this chronology since they are listed elsewhere in this Fact Book. Source: Office of University Communications
Profile 11
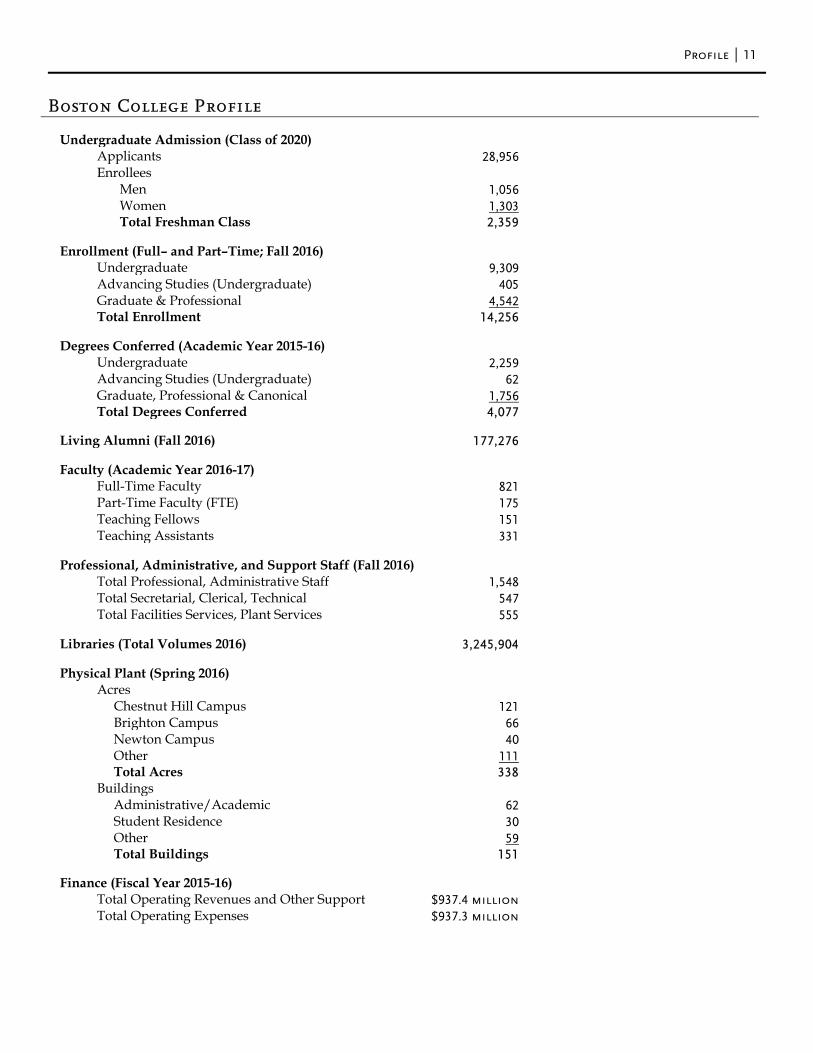
Boston College Profile
Undergraduate Admission (Class of 2020)
Applicants 28,956 Enrollees Men 1,056 Women 1,303 Total Freshman Class 2,359
Enrollment (Full– and Part–Time; Fall 2016) Undergraduate 9,309 Advancing Studies (Undergraduate) 405 Graduate & Professional 4,542 Total Enrollment 14,256
Degrees Conferred (Academic Year 2015-16) Undergraduate 2,259 Advancing Studies (Undergraduate) 62 Graduate, Professional & Canonical 1,756 Total Degrees Conferred 4,077
Living Alumni (Fall 2016) 177,276
Faculty (Academic Year 2016-17) Full-Time Faculty 821 Part-Time Faculty (FTE) 175 Teaching Fellows 151 Teaching Assistants 331
Professional, Administrative, and Support Staff (Fall 2016) Total Professional, Administrative Staff 1,548 Total Secretarial, Clerical, Technical 547 Total Facilities Services, Plant Services 555
Libraries (Total Volumes 2016) 3,245,904
Physical Plant (Spring 2016) Acres Chestnut Hill Campus 121 Brighton Campus 66 Newton Campus 40 Other 111 Total Acres 338 Buildings Administrative/Academic 62 Student Residence 30 Other 59 Total Buildings 151
Finance (Fiscal Year 2015-16) Total Operating Revenues and Other Support $937.4 million Total Operating Expenses $937.3 million


Administration & Faculty
14 Administration & Faculty
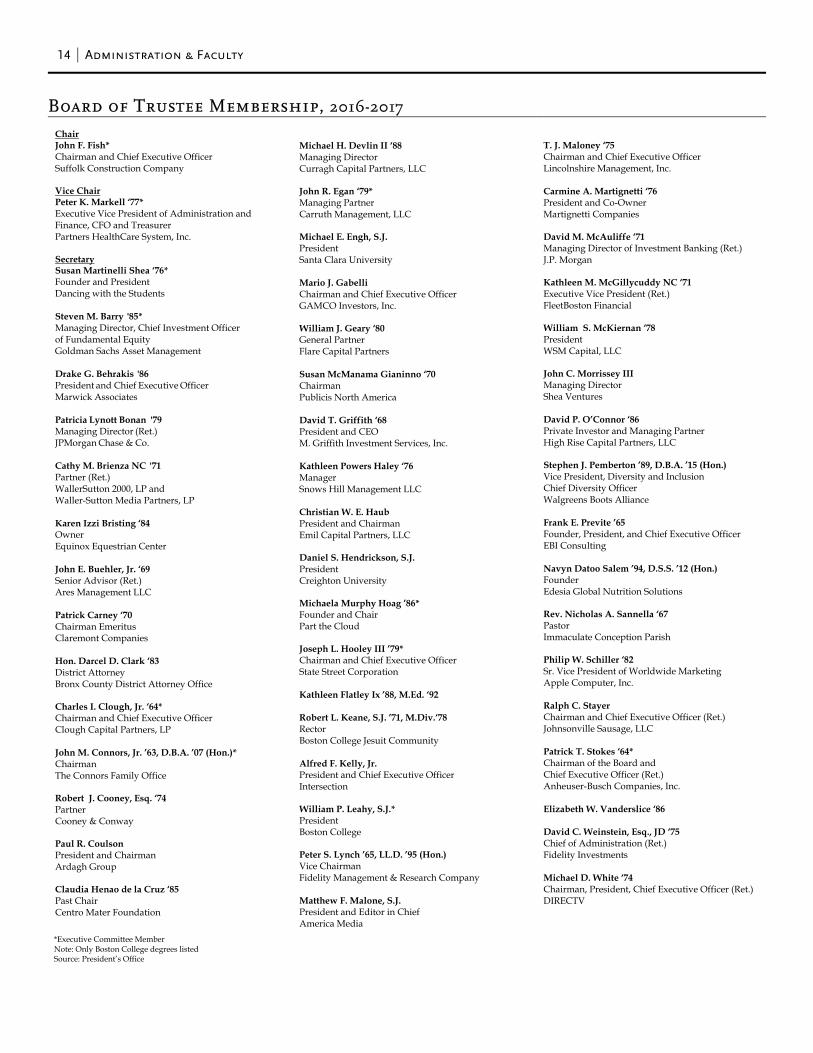
Board of Trustee Membership, 2016-2017
Chair John F. Fish* Chairman and Chief Executive Officer Suffolk Construction Company Vice Chair Peter K. Markell ‘77* Executive Vice President of Administration and Finance, CFO and Treasurer Partners HealthCare System, Inc. Secretary Susan Martinelli Shea ‘76* Founder and President Dancing with the Students Steven M. Barry '85* Managing Director, Chief Investment Officer of Fundamental Equity Goldman Sachs Asset Management Drake G. Behrakis '86 President and Chief Executive Officer Marwick Associates Patricia Lynott Bonan '79 Managing Director (Ret.) JPMorgan Chase & Co. Cathy M. Brienza NC '71 Partner (Ret.) WallerSutton 2000, LP and Waller-Sutton Media Partners, LP Karen Izzi Bristing ‘84 Owner Equinox Equestrian Center John E. Buehler, Jr. ‘69 Senior Advisor (Ret.) Ares Management LLC Patrick Carney ‘70 Chairman Emeritus Claremont Companies Hon. Darcel D. Clark ‘83 District Attorney Bronx County District Attorney Office Charles I. Clough, Jr. ‘64* Chairman and Chief Executive Officer Clough Capital Partners, LP John M. Connors, Jr. ’63, D.B.A. ’07 (Hon.)* Chairman The Connors Family Office Robert J. Cooney, Esq. ‘74 Partner Cooney & Conway Paul R. Coulson President and Chairman Ardagh Group Claudia Henao de la Cruz ‘85 Past Chair Centro Mater Foundation
Michael H. Devlin II ‘88 Managing Director Curragh Capital Partners, LLC John R. Egan ‘79* Managing Partner Carruth Management, LLC Michael E. Engh, S.J. President Santa Clara University Mario J. Gabelli Chairman and Chief Executive Officer GAMCO Investors, Inc. William J. Geary ‘80 General Partner Flare Capital Partners Susan McManama Gianinno ‘70 Chairman Publicis North America David T. Griffith ‘68 President and CEO M. Griffith Investment Services, Inc. Kathleen Powers Haley ‘76 Manager Snows Hill Management LLC Christian W. E. Haub President and Chairman Emil Capital Partners, LLC Daniel S. Hendrickson, S.J. President Creighton University Michaela Murphy Hoag ’86* Founder and Chair Part the Cloud Joseph L. Hooley III ’79* Chairman and Chief Executive Officer State Street Corporation Kathleen Flatley Ix ’88, M.Ed. ‘92 Robert L. Keane, S.J. ’71, M.Div.‘78 Rector Boston College Jesuit Community Alfred F. Kelly, Jr. President and Chief Executive Officer Intersection William P. Leahy, S.J.* President Boston College Peter S. Lynch ’65, LL.D. ’95 (Hon.) Vice Chairman Fidelity Management & Research Company Matthew F. Malone, S.J. President and Editor in Chief America Media
T. J. Maloney ‘75 Chairman and Chief Executive Officer Lincolnshire Management, Inc. Carmine A. Martignetti ‘76 President and Co-Owner Martignetti Companies David M. McAuliffe ‘71 Managing Director of Investment Banking (Ret.) J.P. Morgan Kathleen M. McGillycuddy NC ‘71 Executive Vice President (Ret.) FleetBoston Financial William S. McKiernan ‘78 President WSM Capital, LLC John C. Morrissey III Managing Director Shea Ventures David P. O’Connor ‘86 Private Investor and Managing Partner High Rise Capital Partners, LLC Stephen J. Pemberton ’89, D.B.A. ’15 (Hon.) Vice President, Diversity and Inclusion Chief Diversity Officer Walgreens Boots Alliance Frank E. Previte ’65 Founder, President, and Chief Executive Officer EBI Consulting Navyn Datoo Salem ’94, D.S.S. ’12 (Hon.) Founder Edesia Global Nutrition Solutions Rev. Nicholas A. Sannella ‘67 Pastor Immaculate Conception Parish Philip W. Schiller ‘82 Sr. Vice President of Worldwide Marketing Apple Computer, Inc. Ralph C. Stayer Chairman and Chief Executive Officer (Ret.) Johnsonville Sausage, LLC Patrick T. Stokes ‘64* Chairman of the Board and Chief Executive Officer (Ret.) Anheuser-Busch Companies, Inc. Elizabeth W. Vanderslice ‘86 David C. Weinstein, Esq., JD ‘75 Chief of Administration (Ret.) Fidelity Investments Michael D. White ‘74 Chairman, President, Chief Executive Officer (Ret.) DIRECTV
*Executive Committee Member Note: Only Boston College degrees listed Source: President’s Office
Administration & Faculty 15
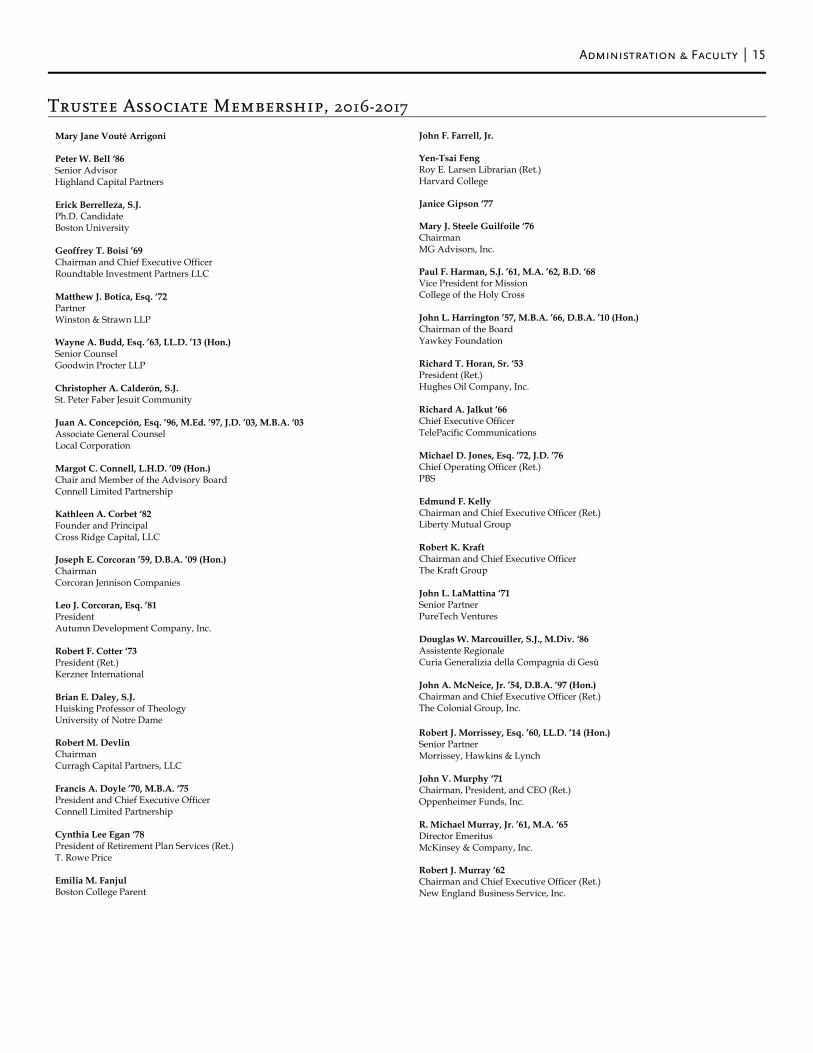
Trustee Associate Membership, 2016-2017
Mary Jane Vouté Arrigoni Peter W. Bell ‘86 Senior Advisor Highland Capital Partners Erick Berrelleza, S.J. Ph.D. Candidate Boston University Geoffrey T. Boisi ’69 Chairman and Chief Executive Officer Roundtable Investment Partners LLC Matthew J. Botica, Esq. ‘72 Partner Winston & Strawn LLP Wayne A. Budd, Esq. ’63, LL.D. ’13 (Hon.) Senior Counsel Goodwin Procter LLP Christopher A. Calderón, S.J. St. Peter Faber Jesuit Community Juan A. Concepción, Esq. ’96, M.Ed. ’97, J.D. ’03, M.B.A. ‘03 Associate General Counsel Local Corporation Margot C. Connell, L.H.D. ’09 (Hon.) Chair and Member of the Advisory Board Connell Limited Partnership Kathleen A. Corbet ‘82 Founder and Principal Cross Ridge Capital, LLC Joseph E. Corcoran ’59, D.B.A. ’09 (Hon.) Chairman Corcoran Jennison Companies Leo J. Corcoran, Esq. ’81 President Autumn Development Company, Inc. Robert F. Cotter ‘73 President (Ret.) Kerzner International Brian E. Daley, S.J. Huisking Professor of Theology University of Notre Dame Robert M. Devlin Chairman Curragh Capital Partners, LLC Francis A. Doyle ’70, M.B.A. ‘75 President and Chief Executive Officer Connell Limited Partnership Cynthia Lee Egan ‘78 President of Retirement Plan Services (Ret.) T. Rowe Price Emilia M. Fanjul Boston College Parent
John F. Farrell, Jr. Yen-Tsai Feng Roy E. Larsen Librarian (Ret.) Harvard College Janice Gipson ‘77 Mary J. Steele Guilfoile ‘76 Chairman MG Advisors, Inc. Paul F. Harman, S.J. ’61, M.A. ’62, B.D. ‘68 Vice President for Mission College of the Holy Cross John L. Harrington ’57, M.B.A. ’66, D.B.A. ’10 (Hon.) Chairman of the Board Yawkey Foundation Richard T. Horan, Sr. ‘53 President (Ret.) Hughes Oil Company, Inc. Richard A. Jalkut ‘66 Chief Executive Officer TelePacific Communications Michael D. Jones, Esq. ’72, J.D. ’76 Chief Operating Officer (Ret.) PBS Edmund F. Kelly Chairman and Chief Executive Officer (Ret.) Liberty Mutual Group Robert K. Kraft Chairman and Chief Executive Officer The Kraft Group John L. LaMattina ‘71 Senior Partner PureTech Ventures Douglas W. Marcouiller, S.J., M.Div. ‘86 Assistente Regionale Curia Generalizia della Compagnia di Gesù John A. McNeice, Jr. ’54, D.B.A. ’97 (Hon.) Chairman and Chief Executive Officer (Ret.) The Colonial Group, Inc. Robert J. Morrissey, Esq. ’60, LL.D. ’14 (Hon.) Senior Partner Morrissey, Hawkins & Lynch John V. Murphy ‘71 Chairman, President, and CEO (Ret.) Oppenheimer Funds, Inc. R. Michael Murray, Jr. ’61, M.A. ‘65 Director Emeritus McKinsey & Company, Inc. Robert J. Murray ‘62 Chairman and Chief Executive Officer (Ret.) New England Business Service, Inc.
16 Administration & Faculty
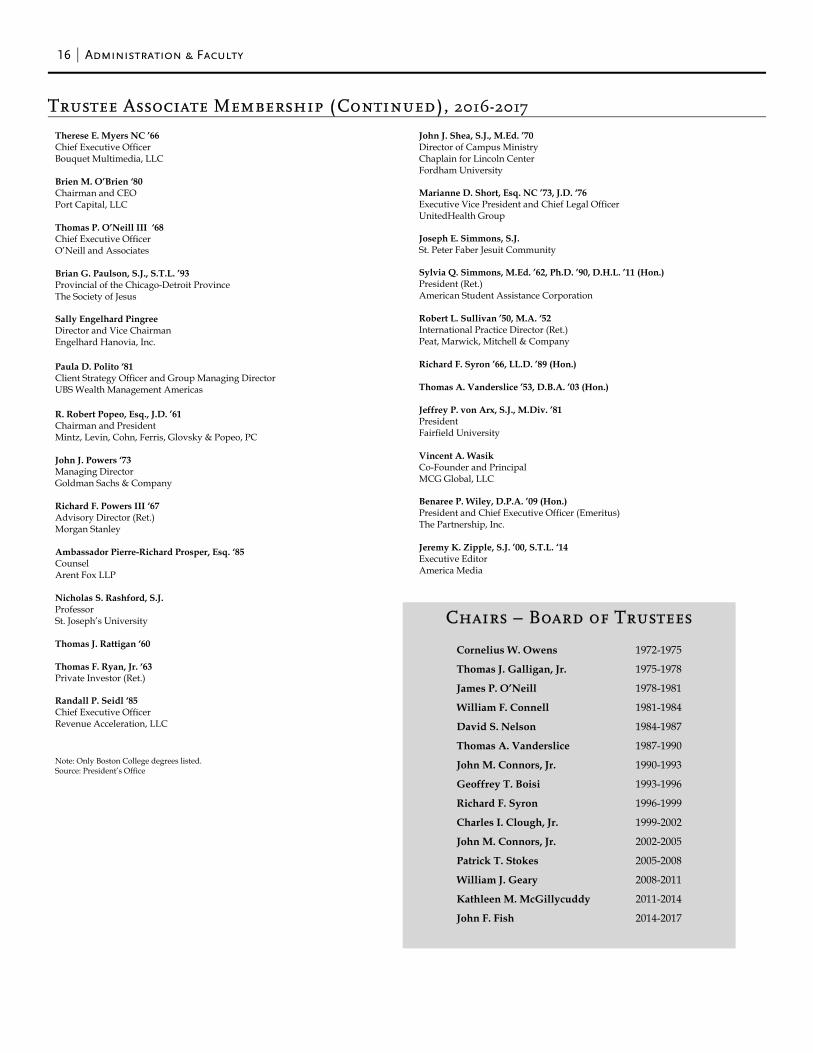
Trustee Associate Membership (Continued), 2016-2017
Therese E. Myers NC ’66 Chief Executive Officer Bouquet Multimedia, LLC Brien M. O’Brien ‘80 Chairman and CEO Port Capital, LLC Thomas P. O’Neill III ‘68 Chief Executive Officer O’Neill and Associates Brian G. Paulson, S.J., S.T.L. ’93 Provincial of the Chicago-Detroit Province The Society of Jesus Sally Engelhard Pingree Director and Vice Chairman Engelhard Hanovia, Inc. Paula D. Polito ‘81 Client Strategy Officer and Group Managing Director UBS Wealth Management Americas R. Robert Popeo, Esq., J.D. ’61 Chairman and President Mintz, Levin, Cohn, Ferris, Glovsky & Popeo, PC John J. Powers ‘73 Managing Director Goldman Sachs & Company Richard F. Powers III ‘67 Advisory Director (Ret.) Morgan Stanley Ambassador Pierre-Richard Prosper, Esq. ‘85 Counsel Arent Fox LLP Nicholas S. Rashford, S.J. Professor St. Joseph’s University Thomas J. Rattigan ‘60 Thomas F. Ryan, Jr. ‘63 Private Investor (Ret.) Randall P. Seidl ‘85 Chief Executive Officer Revenue Acceleration, LLC Note: Only Boston College degrees listed. Source: President’s Office
John J. Shea, S.J., M.Ed. ’70 Director of Campus Ministry Chaplain for Lincoln Center Fordham University Marianne D. Short, Esq. NC ’73, J.D. ‘76 Executive Vice President and Chief Legal Officer UnitedHealth Group Joseph E. Simmons, S.J. St. Peter Faber Jesuit Community Sylvia Q. Simmons, M.Ed. ’62, Ph.D. ’90, D.H.L. ’11 (Hon.) President (Ret.) American Student Assistance Corporation Robert L. Sullivan ’50, M.A. ‘52 International Practice Director (Ret.) Peat, Marwick, Mitchell & Company Richard F. Syron ’66, LL.D. ’89 (Hon.) Thomas A. Vanderslice ’53, D.B.A. ’03 (Hon.) Jeffrey P. von Arx, S.J., M.Div. ’81 President Fairfield University Vincent A. Wasik Co-Founder and Principal MCG Global, LLC Benaree P. Wiley, D.P.A. ’09 (Hon.) President and Chief Executive Officer (Emeritus) The Partnership, Inc. Jeremy K. Zipple, S.J. ’00, S.T.L. ‘14 Executive Editor America Media
Chairs – Board of Trustees
Cornelius W. Owens 1972-1975
Thomas J. Galligan, Jr. 1975-1978
James P. O’Neill 1978-1981
William F. Connell 1981-1984
David S. Nelson 1984-1987
Thomas A. Vanderslice 1987-1990
John M. Connors, Jr. 1990-1993
Geoffrey T. Boisi 1993-1996
Richard F. Syron 1996-1999
Charles I. Clough, Jr. 1999-2002
John M. Connors, Jr. 2002-2005
Patrick T. Stokes 2005-2008
William J. Geary 2008-2011
Kathleen M. McGillycuddy 2011-2014
John F. Fish 2014-2017
Administration & Faculty 17
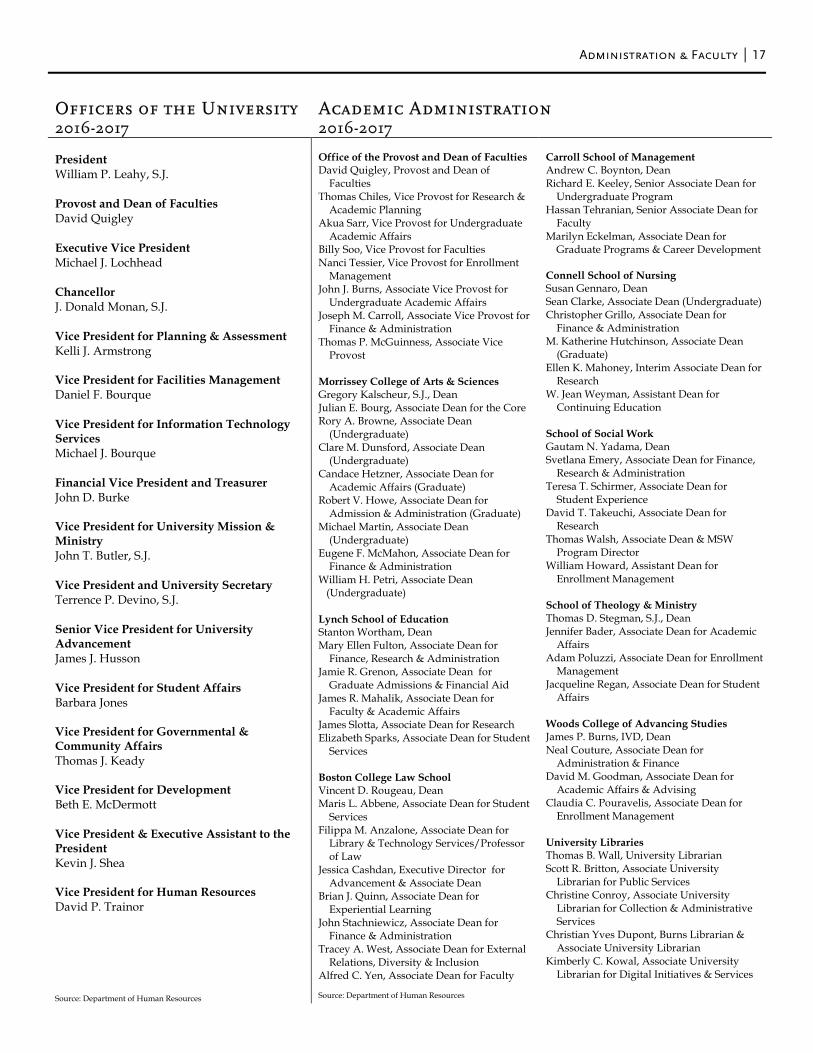
Officers of the University
Academic Administration
2016-2017 2016-2017 President William P. Leahy, S.J. Provost and Dean of Faculties David Quigley Executive Vice President Michael J. Lochhead Chancellor J. Donald Monan, S.J. Vice President for Planning & Assessment Kelli J. Armstrong Vice President for Facilities Management Daniel F. Bourque Vice President for Information Technology Services Michael J. Bourque Financial Vice President and Treasurer John D. Burke Vice President for University Mission & Ministry John T. Butler, S.J. Vice President and University Secretary Terrence P. Devino, S.J. Senior Vice President for University Advancement James J. Husson Vice President for Student Affairs Barbara Jones Vice President for Governmental & Community Affairs Thomas J. Keady Vice President for Development Beth E. McDermott Vice President & Executive Assistant to the President Kevin J. Shea Vice President for Human Resources David P. Trainor Source: Department of Human Resources
Office of the Provost and Dean of Faculties David Quigley, Provost and Dean of
Faculties Thomas Chiles, Vice Provost for Research &
Academic Planning Akua Sarr, Vice Provost for Undergraduate
Academic Affairs Billy Soo, Vice Provost for Faculties Nanci Tessier, Vice Provost for Enrollment
Management John J. Burns, Associate Vice Provost for
Undergraduate Academic Affairs Joseph M. Carroll, Associate Vice Provost for
Finance & Administration Thomas P. McGuinness, Associate Vice
Provost Morrissey College of Arts & Sciences Gregory Kalscheur, S.J., Dean Julian E. Bourg, Associate Dean for the Core Rory A. Browne, Associate Dean
(Undergraduate) Clare M. Dunsford, Associate Dean
(Undergraduate) Candace Hetzner, Associate Dean for
Academic Affairs (Graduate) Robert V. Howe, Associate Dean for
Admission & Administration (Graduate) Michael Martin, Associate Dean
(Undergraduate) Eugene F. McMahon, Associate Dean for
Finance & Administration William H. Petri, Associate Dean (Undergraduate) Lynch School of Education Stanton Wortham, Dean Mary Ellen Fulton, Associate Dean for
Finance, Research & Administration Jamie R. Grenon, Associate Dean for
Graduate Admissions & Financial Aid James R. Mahalik, Associate Dean for
Faculty & Academic Affairs James Slotta, Associate Dean for Research Elizabeth Sparks, Associate Dean for Student
Services Boston College Law School Vincent D. Rougeau, Dean Maris L. Abbene, Associate Dean for Student
Services Filippa M. Anzalone, Associate Dean for
Library & Technology Services/Professor of Law
Jessica Cashdan, Executive Director for Advancement & Associate Dean
Brian J. Quinn, Associate Dean for Experiential Learning
John Stachniewicz, Associate Dean for Finance & Administration
Tracey A. West, Associate Dean for External Relations, Diversity & Inclusion
Alfred C. Yen, Associate Dean for Faculty Source: Department of Human Resources
Carroll School of Management Andrew C. Boynton, Dean Richard E. Keeley, Senior Associate Dean for Undergraduate Program Hassan Tehranian, Senior Associate Dean for
Faculty Marilyn Eckelman, Associate Dean for Graduate Programs & Career Development Connell School of Nursing Susan Gennaro, Dean Sean Clarke, Associate Dean (Undergraduate) Christopher Grillo, Associate Dean for
Finance & Administration M. Katherine Hutchinson, Associate Dean
(Graduate) Ellen K. Mahoney, Interim Associate Dean for
Research W. Jean Weyman, Assistant Dean for
Continuing Education School of Social Work Gautam N. Yadama, Dean Svetlana Emery, Associate Dean for Finance,
Research & Administration Teresa T. Schirmer, Associate Dean for
Student Experience David T. Takeuchi, Associate Dean for
Research Thomas Walsh, Associate Dean & MSW
Program Director William Howard, Assistant Dean for
Enrollment Management School of Theology & Ministry Thomas D. Stegman, S.J., Dean Jennifer Bader, Associate Dean for Academic
Affairs Adam Poluzzi, Associate Dean for Enrollment
Management Jacqueline Regan, Associate Dean for Student
Affairs Woods College of Advancing Studies James P. Burns, IVD, Dean Neal Couture, Associate Dean for
Administration & Finance David M. Goodman, Associate Dean for
Academic Affairs & Advising Claudia C. Pouravelis, Associate Dean for
Enrollment Management University Libraries Thomas B. Wall, University Librarian Scott R. Britton, Associate University
Librarian for Public Services Christine Conroy, Associate University
Librarian for Collection & Administrative Services
Christian Yves Dupont, Burns Librarian & Associate University Librarian
Kimberly C. Kowal, Associate University Librarian for Digital Initiatives & Services
18 Administration & Faculty
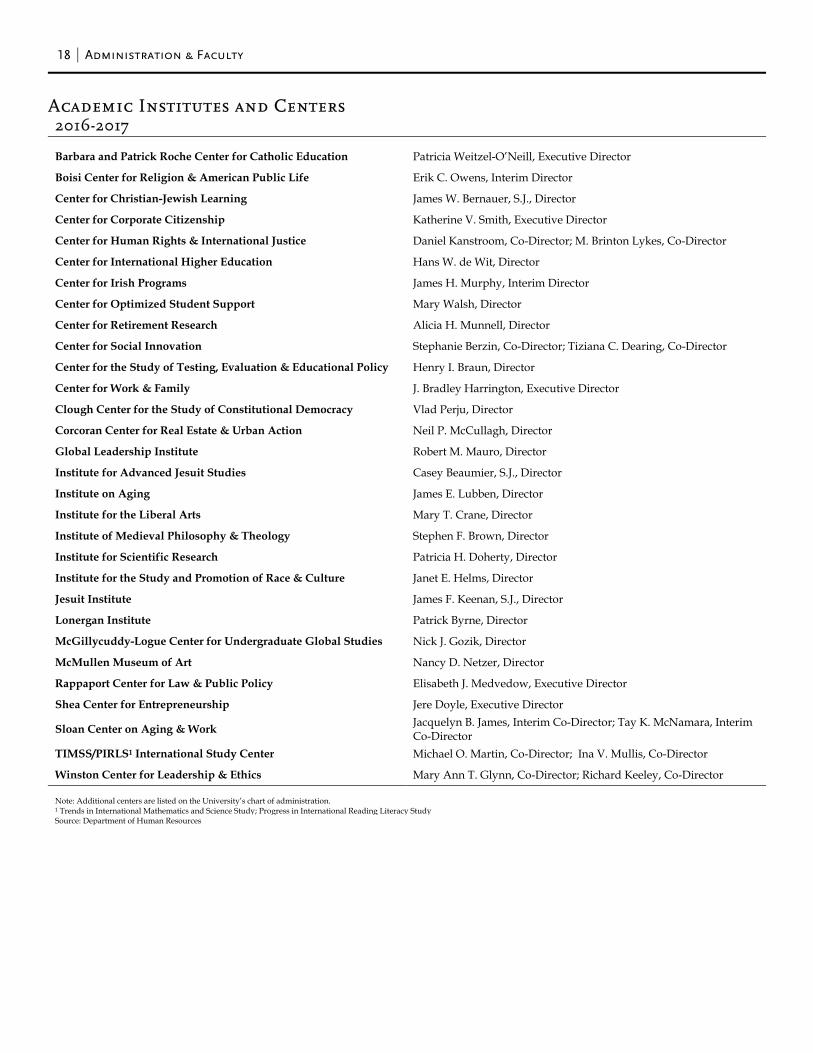
Academic Institutes and Centers 2016-2017
Barbara and Patrick Roche Center for Catholic Education Patricia Weitzel-O’Neill, Executive Director
Boisi Center for Religion & American Public Life Erik C. Owens, Interim Director
Center for Christian-Jewish Learning James W. Bernauer, S.J., Director
Center for Corporate Citizenship Katherine V. Smith, Executive Director
Center for Human Rights & International Justice Daniel Kanstroom, Co-Director; M. Brinton Lykes, Co-Director
Center for International Higher Education Hans W. de Wit, Director
Center for Irish Programs James H. Murphy, Interim Director
Center for Optimized Student Support Mary Walsh, Director
Center for Retirement Research Alicia H. Munnell, Director
Center for Social Innovation Stephanie Berzin, Co-Director; Tiziana C. Dearing, Co-Director
Center for the Study of Testing, Evaluation & Educational Policy Henry I. Braun, Director
Center for Work & Family J. Bradley Harrington, Executive Director
Clough Center for the Study of Constitutional Democracy Vlad Perju, Director
Corcoran Center for Real Estate & Urban Action Neil P. McCullagh, Director
Global Leadership Institute Robert M. Mauro, Director
Institute for Advanced Jesuit Studies Casey Beaumier, S.J., Director
Institute on Aging James E. Lubben, Director
Institute for the Liberal Arts Mary T. Crane, Director
Institute of Medieval Philosophy & Theology Stephen F. Brown, Director
Institute for Scientific Research Patricia H. Doherty, Director
Institute for the Study and Promotion of Race & Culture Janet E. Helms, Director
Jesuit Institute James F. Keenan, S.J., Director
Lonergan Institute Patrick Byrne, Director
McGillycuddy-Logue Center for Undergraduate Global Studies Nick J. Gozik, Director
McMullen Museum of Art Nancy D. Netzer, Director
Rappaport Center for Law & Public Policy Elisabeth J. Medvedow, Executive Director
Shea Center for Entrepreneurship Jere Doyle, Executive Director
Sloan Center on Aging & Work Jacquelyn B. James, Interim Co-Director; Tay K. McNamara, Interim Co-Director
TIMSS/PIRLS1 International Study Center Michael O. Martin, Co-Director; Ina V. Mullis, Co-Director
Winston Center for Leadership & Ethics Mary Ann T. Glynn, Co-Director; Richard Keeley, Co-Director Note: Additional centers are listed on the University’s chart of administration. 1 Trends in International Mathematics and Science Study; Progress in International Reading Literacy Study Source: Department of Human Resources
Administration & Faculty 19
The Jesuit Community at Boston College With 51 members, the Jesuit Community at Boston College is one of the larger apostolic communities of the Society of Jesus throughout the world. Thirty-three Jesuit priests serve in the University as either full-time or part-time members of the administration, faculty, and staff. Many of them also offer Ignatian retreats and spiritual direction to faculty, staff, and students and also provide regular assistance to the diocesan church, both locally and nationally. Other Jesuits in residence include nine from seven countries around the world who are studying for graduate degrees at the University or at other institutions in the Boston area, four who are involved in ministries beyond the University, two who act as the Rector and Administrator of the Jesuit Community itself, two who are retired professors and one on sabbatical.
St. Mary’s Hall is the primary residence of the Jesuit Community, although some Jesuits live in seven smaller residences around the perimeter of the campus. Three Jesuits live in student residence halls. And the Jesuits who staff St. Ignatius Church are members of the Jesuit Community at Boston College. For further details, see the Jesuit Community Web page at http://www.bc.edu/content/bc/sites/jesuit.html.
Source: Rector, Jesuit Community
The Saint Peter Faber Jesuit Community at Boston College With 76 members, the Saint Peter Faber Jesuit Community (FJC) is an international group of Jesuits whose main apostolate is theological reflection, scholarship, and research. FJC includes Priests, Scholastics, and Brothers who come to study and teach Theology, and to prepare for ministry. The Community is located on Foster Street, adjacent to the Boston College Brighton campus.
Together with the ecclesiastical faculty within the Boston College School of Theology and Ministry (BCSTM), FJC forms an Assistancy Apostolate that is accountable to the Jesuit Conference Board. The Major Superior is the President of the Jesuit Conference. Source: Rector, Saint Peter Faber Jesuit Community
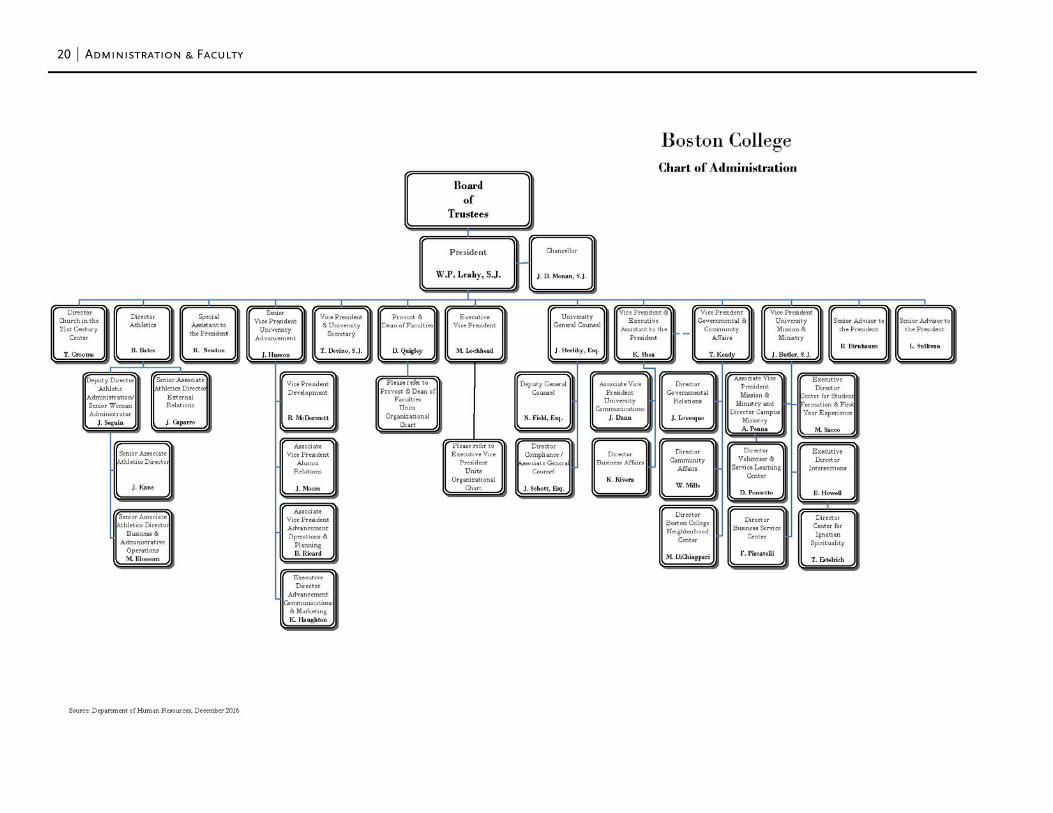
20 Administration & Faculty
Administration & Faculty 21
22 Administration & Faculty
Administration & Faculty 23
24 Administration & Faculty
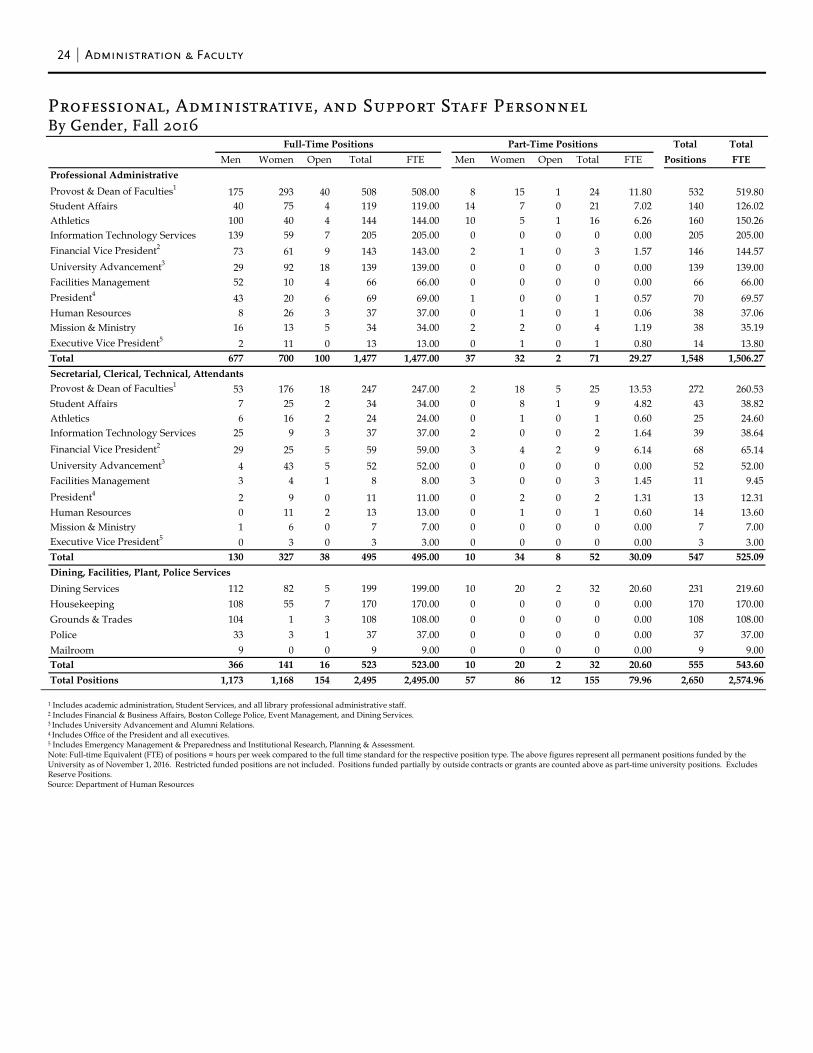
Professional, Administrative, and Support Staff Personnel By Gender, Fall 2016
1 Includes academic administration, Student Services, and all library professional administrative staff. 2 Includes Financial & Business Affairs, Boston College Police, Event Management, and Dining Services. 3 Includes University Advancement and Alumni Relations. 4 Includes Office of the President and all executives. 5 Includes Emergency Management & Preparedness and Institutional Research, Planning & Assessment. Note: Full-time Equivalent (FTE) of positions = hours per week compared to the full time standard for the respective position type. The above figures represent all permanent positions funded by the University as of November 1, 2016. Restricted funded positions are not included. Positions funded partially by outside contracts or grants are counted above as part-time university positions. Excludes Reserve Positions. Source: Department of Human Resources
Total TotalMen Women Open Total FTE Men Women Open Total FTE Positions FTE
Professional AdministrativeProvost & Dean of Faculties1 175 293 40 508 508.00 8 15 1 24 11.80 532 519.80Student Affairs 40 75 4 119 119.00 14 7 0 21 7.02 140 126.02Athletics 100 40 4 144 144.00 10 5 1 16 6.26 160 150.26Information Technology Services 139 59 7 205 205.00 0 0 0 0 0.00 205 205.00Financial Vice President2 73 61 9 143 143.00 2 1 0 3 1.57 146 144.57University Advancement3 29 92 18 139 139.00 0 0 0 0 0.00 139 139.00Facilities Management 52 10 4 66 66.00 0 0 0 0 0.00 66 66.00President4 43 20 6 69 69.00 1 0 0 1 0.57 70 69.57Human Resources 8 26 3 37 37.00 0 1 0 1 0.06 38 37.06Mission & Ministry 16 13 5 34 34.00 2 2 0 4 1.19 38 35.19Executive Vice President5 2 11 0 13 13.00 0 1 0 1 0.80 14 13.80Total 677 700 100 1,477 1,477.00 37 32 2 71 29.27 1,548 1,506.27Secretarial, Clerical, Technical, AttendantsProvost & Dean of Faculties1 53 176 18 247 247.00 2 18 5 25 13.53 272 260.53Student Affairs 7 25 2 34 34.00 0 8 1 9 4.82 43 38.82Athletics 6 16 2 24 24.00 0 1 0 1 0.60 25 24.60Information Technology Services 25 9 3 37 37.00 2 0 0 2 1.64 39 38.64Financial Vice President2 29 25 5 59 59.00 3 4 2 9 6.14 68 65.14University Advancement3 4 43 5 52 52.00 0 0 0 0 0.00 52 52.00Facilities Management 3 4 1 8 8.00 3 0 0 3 1.45 11 9.45President4 2 9 0 11 11.00 0 2 0 2 1.31 13 12.31Human Resources 0 11 2 13 13.00 0 1 0 1 0.60 14 13.60Mission & Ministry 1 6 0 7 7.00 0 0 0 0 0.00 7 7.00Executive Vice President5 0 3 0 3 3.00 0 0 0 0 0.00 3 3.00Total 130 327 38 495 495.00 10 34 8 52 30.09 547 525.09Dining, Facilities, Plant, Police ServicesDining Services 112 82 5 199 199.00 10 20 2 32 20.60 231 219.60Housekeeping 108 55 7 170 170.00 0 0 0 0 0.00 170 170.00Grounds & Trades 104 1 3 108 108.00 0 0 0 0 0.00 108 108.00Police 33 3 1 37 37.00 0 0 0 0 0.00 37 37.00Mailroom 9 0 0 9 9.00 0 0 0 0 0.00 9 9.00Total 366 141 16 523 523.00 10 20 2 32 20.60 555 543.60Total Positions 1,173 1,168 154 2,495 2,495.00 57 86 12 155 79.96 2,650 2,574.96
Full-Time Positions Part-Time Positions
Administration & Faculty 25
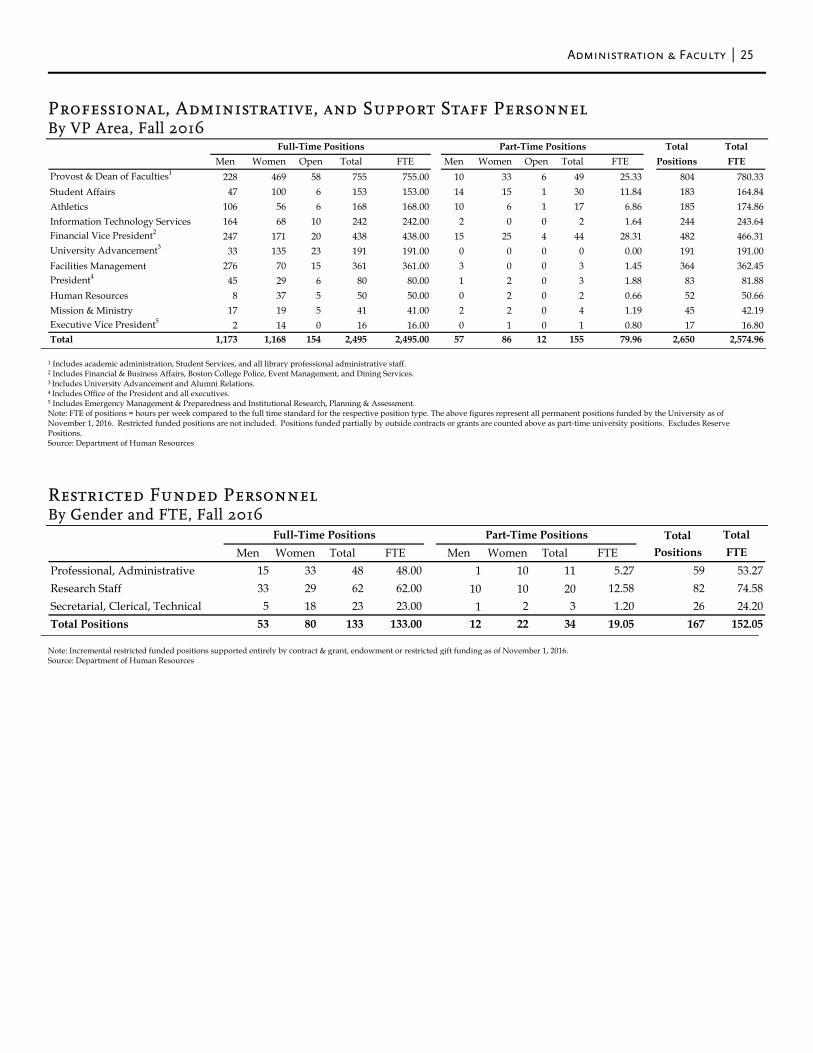
Professional, Administrative, and Support Staff Personnel By VP Area, Fall 2016
Restricted Funded Personnel By Gender and FTE, Fall 2016
Total TotalMen Women Open Total FTE Men Women Open Total FTE Positions FTE
Provost & Dean of Faculties1 228 469 58 755 755.00 10 33 6 49 25.33 804 780.33Student Affairs 47 100 6 153 153.00 14 15 1 30 11.84 183 164.84Athletics 106 56 6 168 168.00 10 6 1 17 6.86 185 174.86Information Technology Services 164 68 10 242 242.00 2 0 0 2 1.64 244 243.64Financial Vice President2 247 171 20 438 438.00 15 25 4 44 28.31 482 466.31University Advancement3 33 135 23 191 191.00 0 0 0 0 0.00 191 191.00Facilities Management 276 70 15 361 361.00 3 0 0 3 1.45 364 362.45President4 45 29 6 80 80.00 1 2 0 3 1.88 83 81.88Human Resources 8 37 5 50 50.00 0 2 0 2 0.66 52 50.66Mission & Ministry 17 19 5 41 41.00 2 2 0 4 1.19 45 42.19Executive Vice President5 2 14 0 16 16.00 0 1 0 1 0.80 17 16.80Total 1,173 1,168 154 2,495 2,495.00 57 86 12 155 79.96 2,650 2,574.96
Full-Time Positions Part-Time Positions
Total TotalMen Women Total FTE Men Women Total FTE Positions FTE
Professional, Administrative 15 33 48 48.00 1 10 11 5.27 59 53.27Research Staff 33 29 62 62.00 10 10 20 12.58 82 74.58Secretarial, Clerical, Technical 5 18 23 23.00 1 2 3 1.20 26 24.20Total Positions 53 80 133 133.00 12 22 34 19.05 167 152.05
Full-Time Positions Part-Time Positions
1 Includes academic administration, Student Services, and all library professional administrative staff. 2 Includes Financial & Business Affairs, Boston College Police, Event Management, and Dining Services. 3 Includes University Advancement and Alumni Relations. 4 Includes Office of the President and all executives. 5 Includes Emergency Management & Preparedness and Institutional Research, Planning & Assessment. Note: FTE of positions = hours per week compared to the full time standard for the respective position type. The above figures represent all permanent positions funded by the University as of November 1, 2016. Restricted funded positions are not included. Positions funded partially by outside contracts or grants are counted above as part-time university positions. Excludes Reserve Positions. Source: Department of Human Resources
Note: Incremental restricted funded positions supported entirely by contract & grant, endowment or restricted gift funding as of November 1, 2016. Source: Department of Human Resources
26 Administration & Faculty
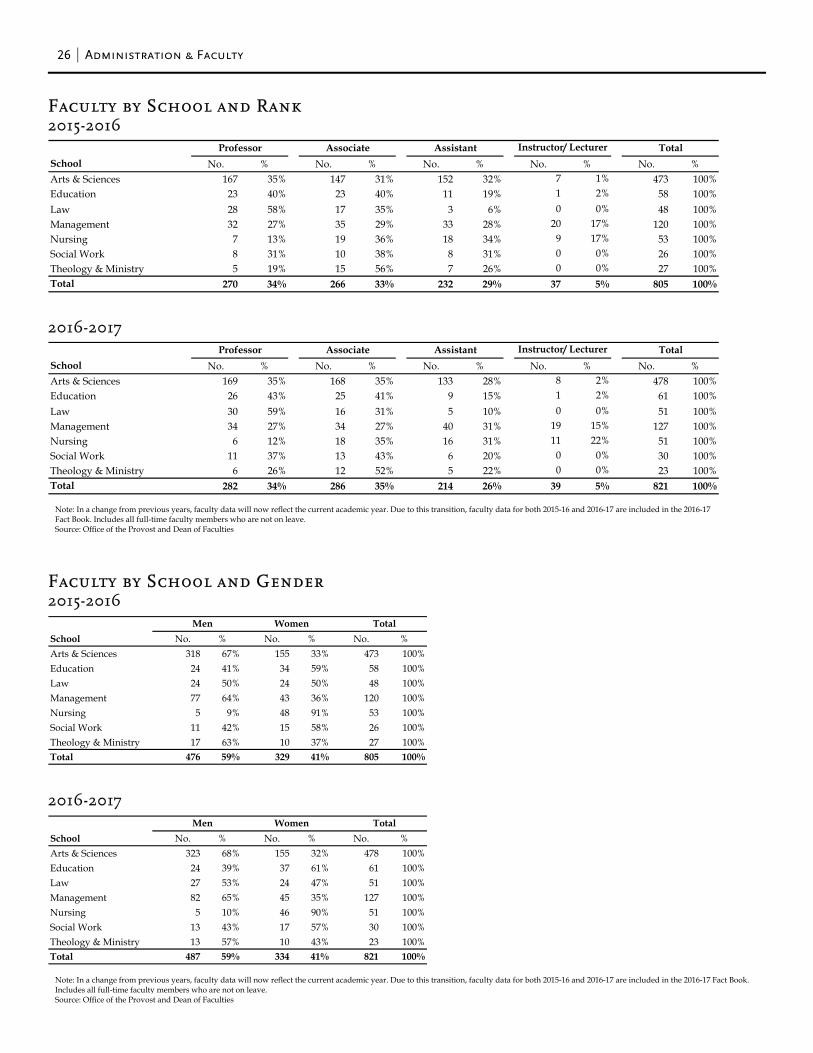
Faculty by School and Rank 2015-2016
2016-2017
Note: In a change from previous years, faculty data will now reflect the current academic year. Due to this transition, faculty data for both 2015-16 and 2016-17 are included in the 2016-17 Fact Book. Includes all full-time faculty members who are not on leave. Source: Office of the Provost and Dean of Faculties
Faculty by School and Gender 2015-2016
2016-2017
Note: In a change from previous years, faculty data will now reflect the current academic year. Due to this transition, faculty data for both 2015-16 and 2016-17 are included in the 2016-17 Fact Book. Includes all full-time faculty members who are not on leave. Source: Office of the Provost and Dean of Faculties
School No. % No. % No. % No. % No. %Arts & Sciences 167 35% 147 31% 152 32% 7 1% 473 100%Education 23 40% 23 40% 11 19% 1 2% 58 100%Law 28 58% 17 35% 3 6% 0 0% 48 100%Management 32 27% 35 29% 33 28% 20 17% 120 100%Nursing 7 13% 19 36% 18 34% 9 17% 53 100%Social Work 8 31% 10 38% 8 31% 0 0% 26 100%Theology & Ministry 5 19% 15 56% 7 26% 0 0% 27 100%Total 270 34% 266 33% 232 29% 37 5% 805 100%
TotalProfessor Associate Assistant Instructor/ Lecturer
School No. % No. % No. % No. % No. %Arts & Sciences 169 35% 168 35% 133 28% 8 2% 478 100%Education 26 43% 25 41% 9 15% 1 2% 61 100%Law 30 59% 16 31% 5 10% 0 0% 51 100%Management 34 27% 34 27% 40 31% 19 15% 127 100%Nursing 6 12% 18 35% 16 31% 11 22% 51 100%Social Work 11 37% 13 43% 6 20% 0 0% 30 100%Theology & Ministry 6 26% 12 52% 5 22% 0 0% 23 100%Total 282 34% 286 35% 214 26% 39 5% 821 100%
TotalProfessor Associate Assistant Instructor/ Lecturer
School No. % No. % No. %Arts & Sciences 318 67% 155 33% 473 100%Education 24 41% 34 59% 58 100%Law 24 50% 24 50% 48 100%Management 77 64% 43 36% 120 100%Nursing 5 9% 48 91% 53 100%Social Work 11 42% 15 58% 26 100%Theology & Ministry 17 63% 10 37% 27 100%Total 476 59% 329 41% 805 100%
TotalMen Women
School No. % No. % No. %Arts & Sciences 323 68% 155 32% 478 100%Education 24 39% 37 61% 61 100%Law 27 53% 24 47% 51 100%Management 82 65% 45 35% 127 100%Nursing 5 10% 46 90% 51 100%Social Work 13 43% 17 57% 30 100%Theology & Ministry 13 57% 10 43% 23 100%Total 487 59% 334 41% 821 100%
TotalMen Women
Administration & Faculty 27
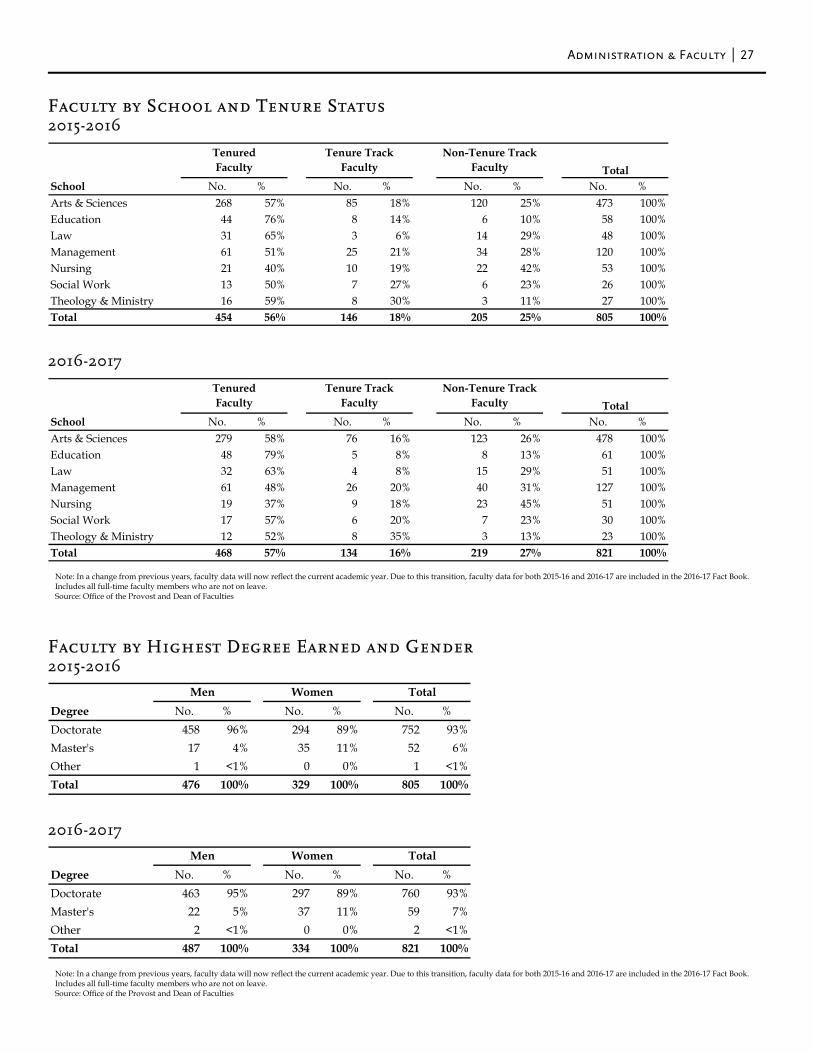
Faculty by School and Tenure Status 2015-2016
2016-2017
Note: In a change from previous years, faculty data will now reflect the current academic year. Due to this transition, faculty data for both 2015-16 and 2016-17 are included in the 2016-17 Fact Book. Includes all full-time faculty members who are not on leave. Source: Office of the Provost and Dean of Faculties
Faculty by Highest Degree Earned and Gender 2015-2016
2016-2017
Note: In a change from previous years, faculty data will now reflect the current academic year. Due to this transition, faculty data for both 2015-16 and 2016-17 are included in the 2016-17 Fact Book. Includes all full-time faculty members who are not on leave. Source: Office of the Provost and Dean of Faculties
School No. % No. % No. % No. %Arts & Sciences 268 57% 85 18% 120 25% 473 100%Education 44 76% 8 14% 6 10% 58 100%Law 31 65% 3 6% 14 29% 48 100%Management 61 51% 25 21% 34 28% 120 100%Nursing 21 40% 10 19% 22 42% 53 100%Social Work 13 50% 7 27% 6 23% 26 100%Theology & Ministry 16 59% 8 30% 3 11% 27 100%Total 454 56% 146 18% 205 25% 805 100%
Tenured Faculty
Tenure Track Faculty
Non-Tenure Track Faculty Total
School No. % No. % No. % No. %Arts & Sciences 279 58% 76 16% 123 26% 478 100%Education 48 79% 5 8% 8 13% 61 100%Law 32 63% 4 8% 15 29% 51 100%Management 61 48% 26 20% 40 31% 127 100%Nursing 19 37% 9 18% 23 45% 51 100%Social Work 17 57% 6 20% 7 23% 30 100%Theology & Ministry 12 52% 8 35% 3 13% 23 100%Total 468 57% 134 16% 219 27% 821 100%
Tenured Faculty
Tenure Track Faculty
Non-Tenure Track Faculty Total
Degree No. % No. % No. %Doctorate 458 96% 294 89% 752 93%Master's 17 4% 35 11% 52 6%Other 1 <1% 0 0% 1 <1%Total 476 100% 329 100% 805 100%
Men Women Total
Degree No. % No. % No. %Doctorate 463 95% 297 89% 760 93%Master's 22 5% 37 11% 59 7%Other 2 <1% 0 0% 2 <1%Total 487 100% 334 100% 821 100%
Men Women Total
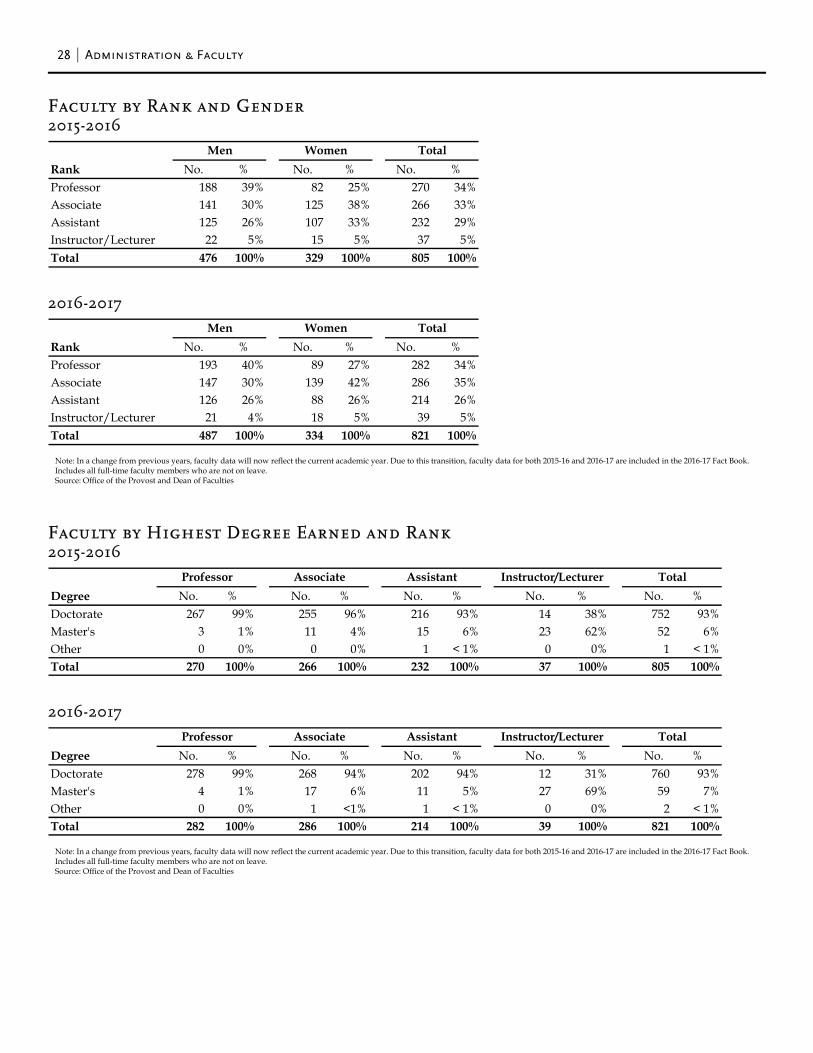
28 Administration & Faculty
Faculty by Rank and Gender 2015-2016
2016-2017
Note: In a change from previous years, faculty data will now reflect the current academic year. Due to this transition, faculty data for both 2015-16 and 2016-17 are included in the 2016-17 Fact Book. Includes all full-time faculty members who are not on leave. Source: Office of the Provost and Dean of Faculties
Faculty by Highest Degree Earned and Rank 2015-2016
2016-2017
Note: In a change from previous years, faculty data will now reflect the current academic year. Due to this transition, faculty data for both 2015-16 and 2016-17 are included in the 2016-17 Fact Book. Includes all full-time faculty members who are not on leave. Source: Office of the Provost and Dean of Faculties
Rank No. % No. % No. %Professor 188 39% 82 25% 270 34%Associate 141 30% 125 38% 266 33%Assistant 125 26% 107 33% 232 29%Instructor/Lecturer 22 5% 15 5% 37 5%Total 476 100% 329 100% 805 100%
Men Women Total
Rank No. % No. % No. %Professor 193 40% 89 27% 282 34%Associate 147 30% 139 42% 286 35%Assistant 126 26% 88 26% 214 26%Instructor/Lecturer 21 4% 18 5% 39 5%Total 487 100% 334 100% 821 100%
Men Women Total
Degree No. % No. % No. % No. % No. %Doctorate 267 99% 255 96% 216 93% 14 38% 752 93%Master's 3 1% 11 4% 15 6% 23 62% 52 6%Other 0 0% 0 0% 1 < 1% 0 0% 1 < 1%Total 270 100% 266 100% 232 100% 37 100% 805 100%
TotalProfessor Associate Assistant Instructor/Lecturer
Degree No. % No. % No. % No. % No. %Doctorate 278 99% 268 94% 202 94% 12 31% 760 93%Master's 4 1% 17 6% 11 5% 27 69% 59 7%Other 0 0% 1 <1% 1 < 1% 0 0% 2 < 1%Total 282 100% 286 100% 214 100% 39 100% 821 100%
TotalProfessor Associate Assistant Instructor/Lecturer
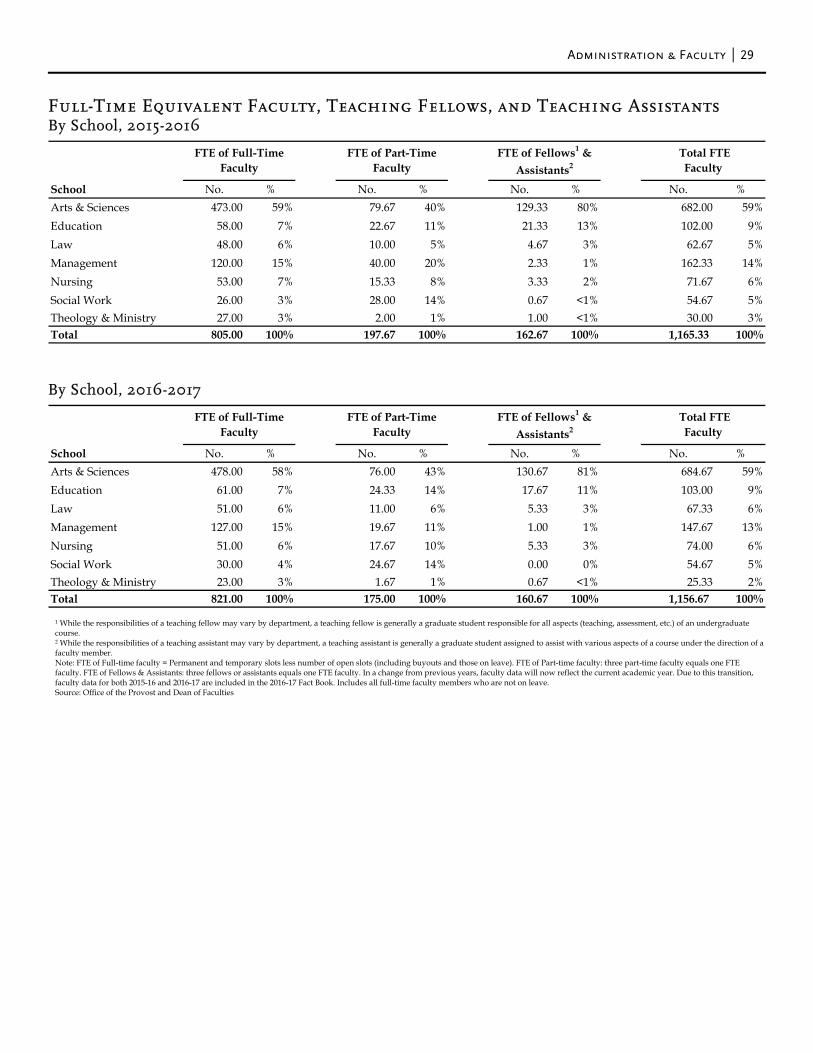
Administration & Faculty 29
Full-Time Equivalent Faculty, Teaching Fellows, and Teaching Assistants By School, 2015-2016
By School, 2016-2017
1 While the responsibilities of a teaching fellow may vary by department, a teaching fellow is generally a graduate student responsible for all aspects (teaching, assessment, etc.) of an undergraduate course. 2 While the responsibilities of a teaching assistant may vary by department, a teaching assistant is generally a graduate student assigned to assist with various aspects of a course under the direction of a faculty member. Note: FTE of Full-time faculty = Permanent and temporary slots less number of open slots (including buyouts and those on leave). FTE of Part-time faculty: three part-time faculty equals one FTE faculty. FTE of Fellows & Assistants: three fellows or assistants equals one FTE faculty. In a change from previous years, faculty data will now reflect the current academic year. Due to this transition, faculty data for both 2015-16 and 2016-17 are included in the 2016-17 Fact Book. Includes all full-time faculty members who are not on leave. Source: Office of the Provost and Dean of Faculties
School No. % No. % No. % No. %Arts & Sciences 473.00 59% 79.67 40% 129.33 80% 682.00 59%Education 58.00 7% 22.67 11% 21.33 13% 102.00 9%Law 48.00 6% 10.00 5% 4.67 3% 62.67 5%Management 120.00 15% 40.00 20% 2.33 1% 162.33 14%Nursing 53.00 7% 15.33 8% 3.33 2% 71.67 6%Social Work 26.00 3% 28.00 14% 0.67 <1% 54.67 5%Theology & Ministry 27.00 3% 2.00 1% 1.00 <1% 30.00 3%Total 805.00 100% 197.67 100% 162.67 100% 1,165.33 100%
Total FTEFaculty
FTE of Full-Time Faculty
FTE of Part-Time Faculty
FTE of Fellows1 & Assistants2
School No. % No. % No. % No. %Arts & Sciences 478.00 58% 76.00 43% 130.67 81% 684.67 59%Education 61.00 7% 24.33 14% 17.67 11% 103.00 9%Law 51.00 6% 11.00 6% 5.33 3% 67.33 6%Management 127.00 15% 19.67 11% 1.00 1% 147.67 13%Nursing 51.00 6% 17.67 10% 5.33 3% 74.00 6%Social Work 30.00 4% 24.67 14% 0.00 0% 54.67 5%Theology & Ministry 23.00 3% 1.67 1% 0.67 <1% 25.33 2%Total 821.00 100% 175.00 100% 160.67 100% 1,156.67 100%
Total FTEFaculty
FTE of Full-Time Faculty
FTE of Part-Time Faculty
FTE of Fellows1 & Assistants2
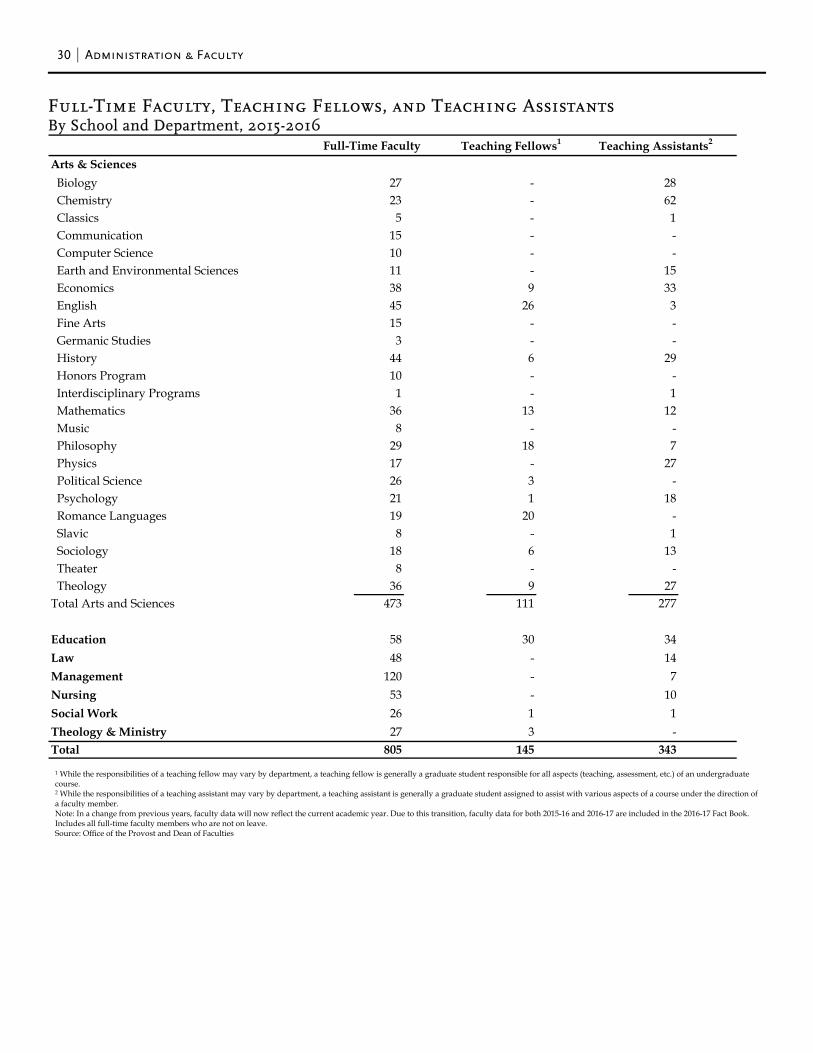
30 Administration & Faculty
Full-Time Faculty, Teaching Fellows, and Teaching Assistants By School and Department, 2015-2016
1 While the responsibilities of a teaching fellow may vary by department, a teaching fellow is generally a graduate student responsible for all aspects (teaching, assessment, etc.) of an undergraduate course. 2 While the responsibilities of a teaching assistant may vary by department, a teaching assistant is generally a graduate student assigned to assist with various aspects of a course under the direction of a faculty member. Note: In a change from previous years, faculty data will now reflect the current academic year. Due to this transition, faculty data for both 2015-16 and 2016-17 are included in the 2016-17 Fact Book. Includes all full-time faculty members who are not on leave. Source: Office of the Provost and Dean of Faculties
Arts & Sciences Biology 27 - 28 Chemistry 23 - 62 Classics 5 - 1 Communication 15 - - Computer Science 10 - - Earth and Environmental Sciences 11 - 15 Economics 38 9 33 English 45 26 3 Fine Arts 15 - - Germanic Studies 3 - - History 44 6 29 Honors Program 10 - - Interdisciplinary Programs 1 - 1 Mathematics 36 13 12 Music 8 - - Philosophy 29 18 7 Physics 17 - 27 Political Science 26 3 - Psychology 21 1 18 Romance Languages 19 20 - Slavic 8 - 1 Sociology 18 6 13 Theater 8 - - Theology 36 9 27Total Arts and Sciences 473 111 277
Education 58 30 34Law 48 - 14Management 120 - 7Nursing 53 - 10Social Work 26 1 1Theology & Ministry 27 3 -Total 805 145 343
Full-Time Faculty Teaching Fellows1 Teaching Assistants2
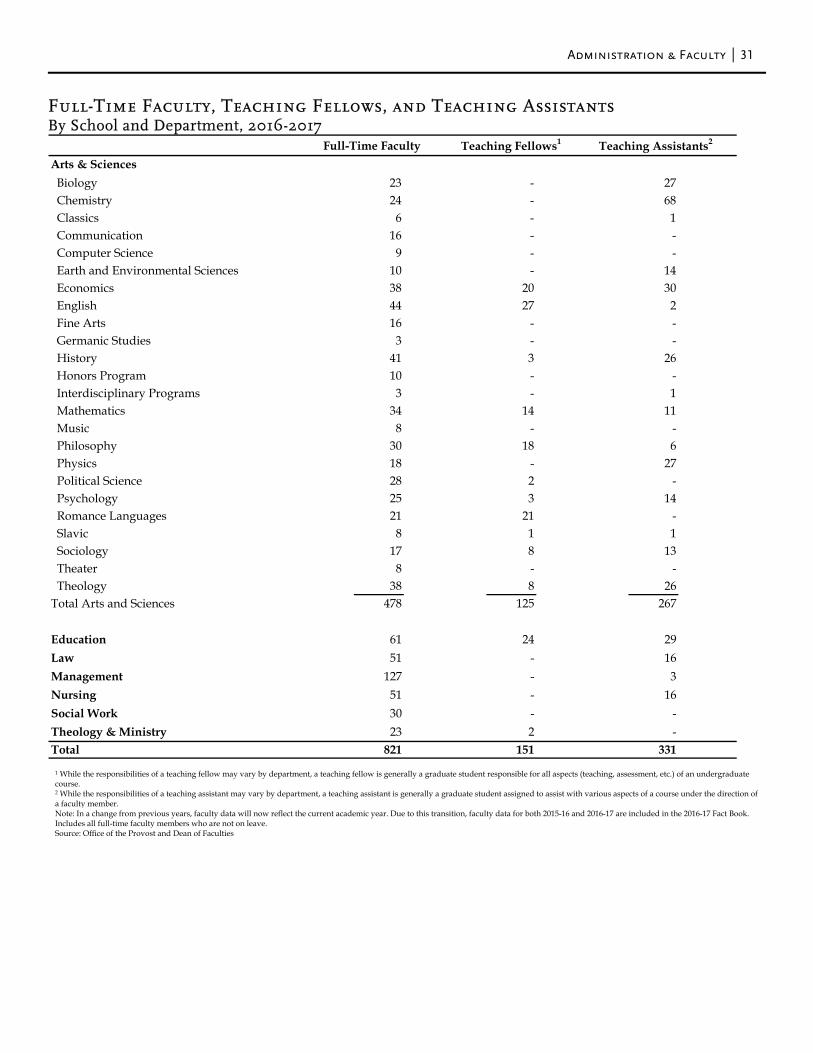
Administration & Faculty 31
Full-Time Faculty, Teaching Fellows, and Teaching Assistants By School and Department, 2016-2017
1 While the responsibilities of a teaching fellow may vary by department, a teaching fellow is generally a graduate student responsible for all aspects (teaching, assessment, etc.) of an undergraduate course. 2 While the responsibilities of a teaching assistant may vary by department, a teaching assistant is generally a graduate student assigned to assist with various aspects of a course under the direction of a faculty member. Note: In a change from previous years, faculty data will now reflect the current academic year. Due to this transition, faculty data for both 2015-16 and 2016-17 are included in the 2016-17 Fact Book. Includes all full-time faculty members who are not on leave. Source: Office of the Provost and Dean of Faculties
Arts & Sciences Biology 23 - 27 Chemistry 24 - 68 Classics 6 - 1 Communication 16 - - Computer Science 9 - - Earth and Environmental Sciences 10 - 14 Economics 38 20 30 English 44 27 2 Fine Arts 16 - - Germanic Studies 3 - - History 41 3 26 Honors Program 10 - - Interdisciplinary Programs 3 - 1 Mathematics 34 14 11 Music 8 - - Philosophy 30 18 6 Physics 18 - 27 Political Science 28 2 - Psychology 25 3 14 Romance Languages 21 21 - Slavic 8 1 1 Sociology 17 8 13 Theater 8 - - Theology 38 8 26Total Arts and Sciences 478 125 267
Education 61 24 29Law 51 - 16Management 127 - 3Nursing 51 - 16Social Work 30 - -Theology & Ministry 23 2 -Total 821 151 331
Full-Time Faculty Teaching Fellows1 Teaching Assistants2
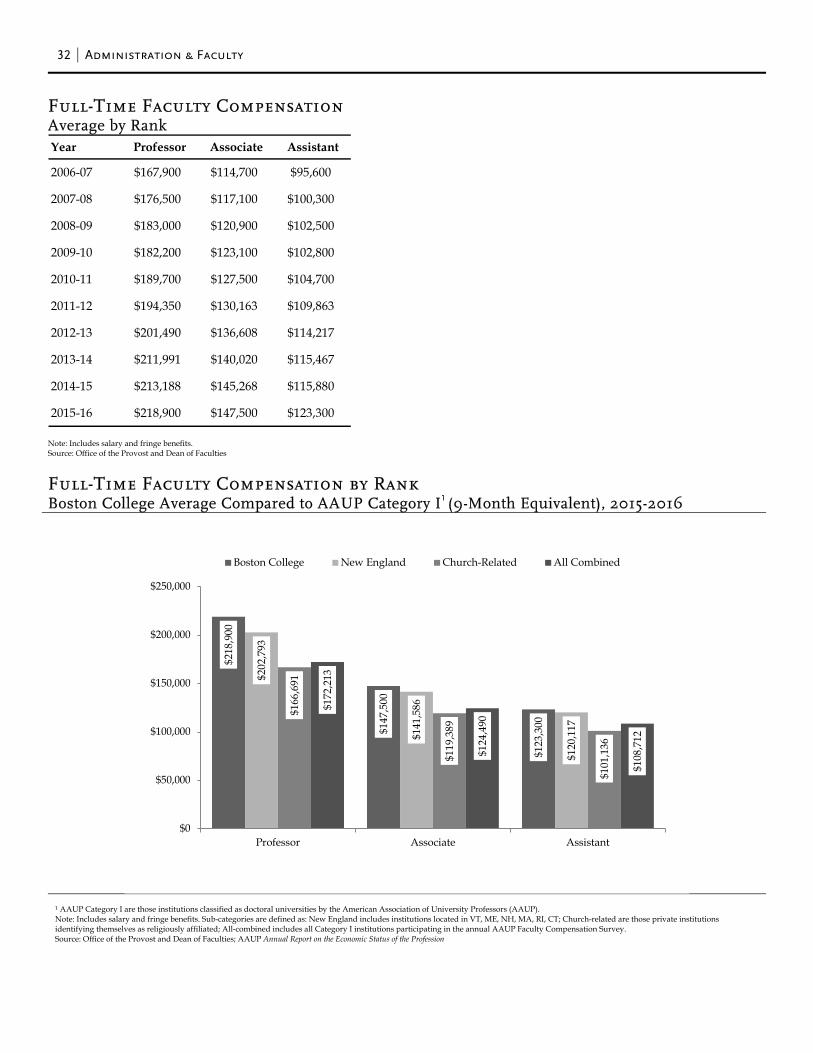
32 Administration & Faculty
Full-Time Faculty Compensation Average by Rank
Note: Includes salary and fringe benefits. Source: Office of the Provost and Dean of Faculties
Full-Time Faculty Compensation by Rank Boston College Average Compared to AAUP Category I1 (9-Month Equivalent), 2015-2016
1 AAUP Category I are those institutions classified as doctoral universities by the American Association of University Professors (AAUP). Note: Includes salary and fringe benefits. Sub-categories are defined as: New England includes institutions located in VT, ME, NH, MA, RI, CT; Church-related are those private institutions identifying themselves as religiously affiliated; All-combined includes all Category I institutions participating in the annual AAUP Faculty Compensation Survey. Source: Office of the Provost and Dean of Faculties; AAUP Annual Report on the Economic Status of the Profession
Year Professor Associate Assistant
2006-07 $167,900 $114,700 $95,600
2007-08 $176,500 $117,100 $100,300
2008-09 $183,000 $120,900 $102,500
2009-10 $182,200 $123,100 $102,800
2010-11 $189,700 $127,500 $104,700
2011-12 $194,350 $130,163 $109,863
2012-13 $201,490 $136,608 $114,217
2013-14 $211,991 $140,020 $115,467
2014-15 $213,188 $145,268 $115,880
2015-16 $218,900 $147,500 $123,300
$218
,900
$147
,500
$123
,300
$202
,793
$141
,586
$120
,117
$166
,691
$119
,389
$101
,136
$172
,213
$124
,490
$108
,712
$0
$50,000
$100,000
$150,000
$200,000
$250,000
Professor Associate Assistant
Boston College New England Church-Related All Combined

Students
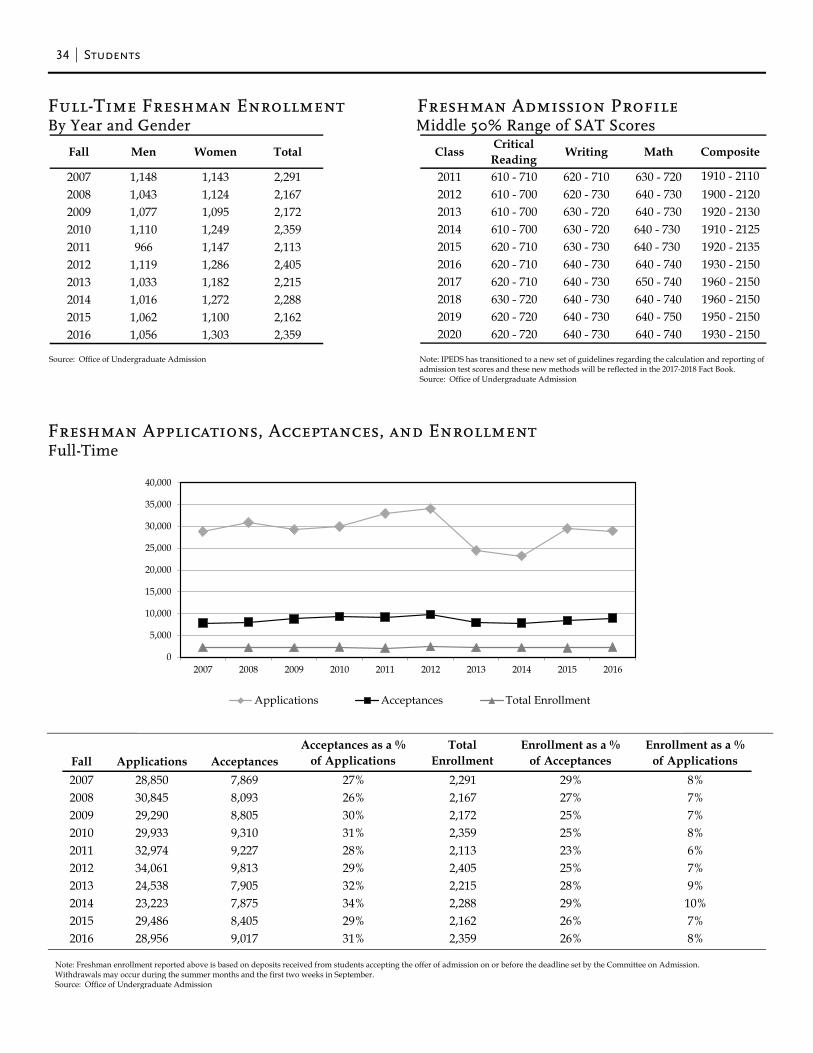
34 Students
Full-Time Freshman Enrollment Freshman Admission Profile By Year and Gender Middle 50% Range of SAT Scores
Source: Office of Undergraduate Admission Note: IPEDS has transitioned to a new set of guidelines regarding the calculation and reporting of
admission test scores and these new methods will be reflected in the 2017-2018 Fact Book. Source: Office of Undergraduate Admission
Freshman Applications, Acceptances, and Enrollment Full-Time
Note: Freshman enrollment reported above is based on deposits received from students accepting the offer of admission on or before the deadline set by the Committee on Admission. Withdrawals may occur during the summer months and the first two weeks in September. Source: Office of Undergraduate Admission
Fall Men Women Total
2007 1,148 1,143 2,2912008 1,043 1,124 2,1672009 1,077 1,095 2,1722010 1,110 1,249 2,3592011 966 1,147 2,1132012 1,119 1,286 2,4052013 1,033 1,182 2,2152014 1,016 1,272 2,2882015 1,062 1,100 2,1622016 1,056 1,303 2,359
Class Critical Reading Writing Math Composite
2011 610 - 710 620 - 710 630 - 720 1910 - 21102012 610 - 700 620 - 730 640 - 730 1900 - 21202013 610 - 700 630 - 720 640 - 730 1920 - 21302014 610 - 700 630 - 720 640 - 730 1910 - 21252015 620 - 710 630 - 730 640 - 730 1920 - 21352016 620 - 710 640 - 730 640 - 740 1930 - 21502017 620 - 710 640 - 730 650 - 740 1960 - 21502018 630 - 720 640 - 730 640 - 740 1960 - 21502019 620 - 720 640 - 730 640 - 750 1950 - 21502020 620 - 720 640 - 730 640 - 740 1930 - 2150
0
5,000
10,000
15,000
20,000
25,000
30,000
35,000
40,000
2007 2008 2009 2010 2011 2012 2013 2014 2015 2016
Applications Acceptances Total Enrollment
Fall Applications Acceptances2007 28,850 7,869 27% 2,291 29% 8%2008 30,845 8,093 26% 2,167 27% 7%2009 29,290 8,805 30% 2,172 25% 7%2010 29,933 9,310 31% 2,359 25% 8%2011 32,974 9,227 28% 2,113 23% 6%2012 34,061 9,813 29% 2,405 25% 7%2013 24,538 7,905 32% 2,215 28% 9%2014 23,223 7,875 34% 2,288 29% 10%2015 29,486 8,405 29% 2,162 26% 7%2016 28,956 9,017 31% 2,359 26% 8%
Acceptances as a % of Applications
Total Enrollment
Enrollment as a % of Acceptances
Enrollment as a % of Applications
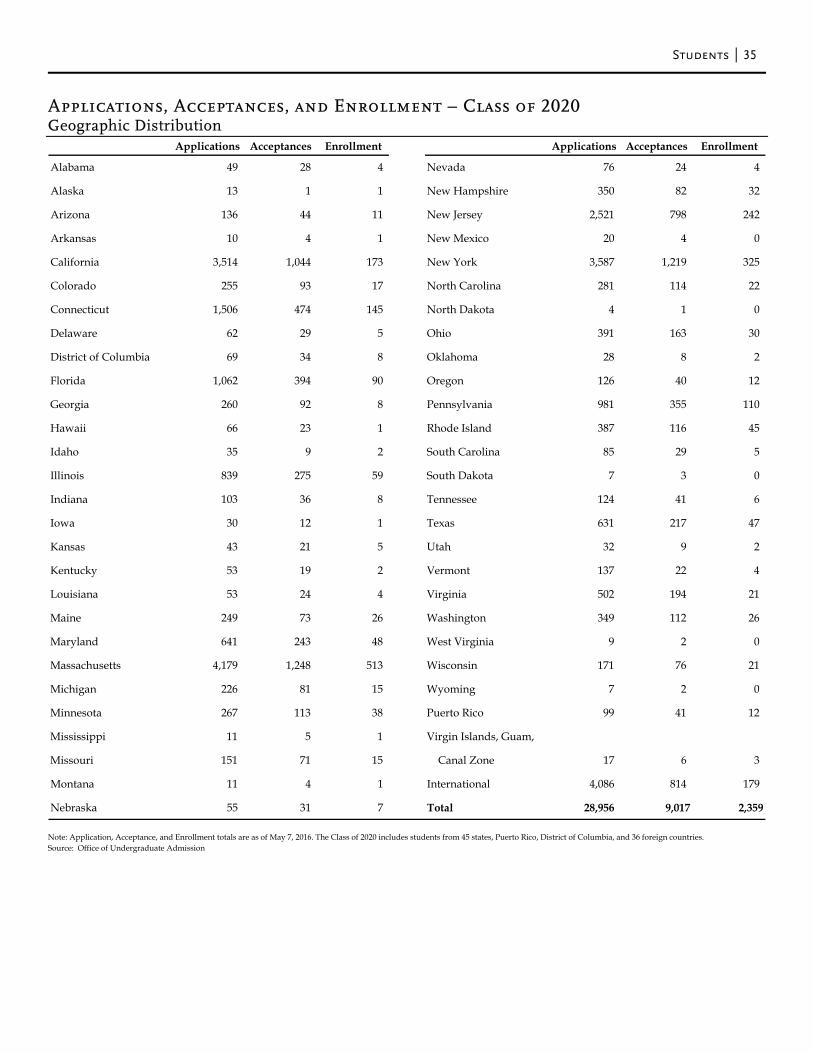
Students 35
Applications, Acceptances, and Enrollment – Class of 2020 Geographic Distribution
Note: Application, Acceptance, and Enrollment totals are as of May 7, 2016. The Class of 2020 includes students from 45 states, Puerto Rico, District of Columbia, and 36 foreign countries. Source: Office of Undergraduate Admission
Applications Acceptances Enrollment Applications Acceptances Enrollment
Alabama 49 28 4 Nevada 76 24 4
Alaska 13 1 1 New Hampshire 350 82 32
Arizona 136 44 11 New Jersey 2,521 798 242
Arkansas 10 4 1 New Mexico 20 4 0
California 3,514 1,044 173 New York 3,587 1,219 325
Colorado 255 93 17 North Carolina 281 114 22
Connecticut 1,506 474 145 North Dakota 4 1 0
Delaware 62 29 5 Ohio 391 163 30
District of Columbia 69 34 8 Oklahoma 28 8 2
Florida 1,062 394 90 Oregon 126 40 12
Georgia 260 92 8 Pennsylvania 981 355 110
Hawaii 66 23 1 Rhode Island 387 116 45
Idaho 35 9 2 South Carolina 85 29 5
Illinois 839 275 59 South Dakota 7 3 0
Indiana 103 36 8 Tennessee 124 41 6
Iowa 30 12 1 Texas 631 217 47
Kansas 43 21 5 Utah 32 9 2
Kentucky 53 19 2 Vermont 137 22 4
Louisiana 53 24 4 Virginia 502 194 21
Maine 249 73 26 Washington 349 112 26
Maryland 641 243 48 West Virginia 9 2 0
Massachusetts 4,179 1,248 513 Wisconsin 171 76 21
Michigan 226 81 15 Wyoming 7 2 0
Minnesota 267 113 38 Puerto Rico 99 41 12
Mississippi 11 5 1 Virgin Islands, Guam,
Missouri 151 71 15 Canal Zone 17 6 3
Montana 11 4 1 International 4,086 814 179
Nebraska 55 31 7 Total 28,956 9,017 2,359
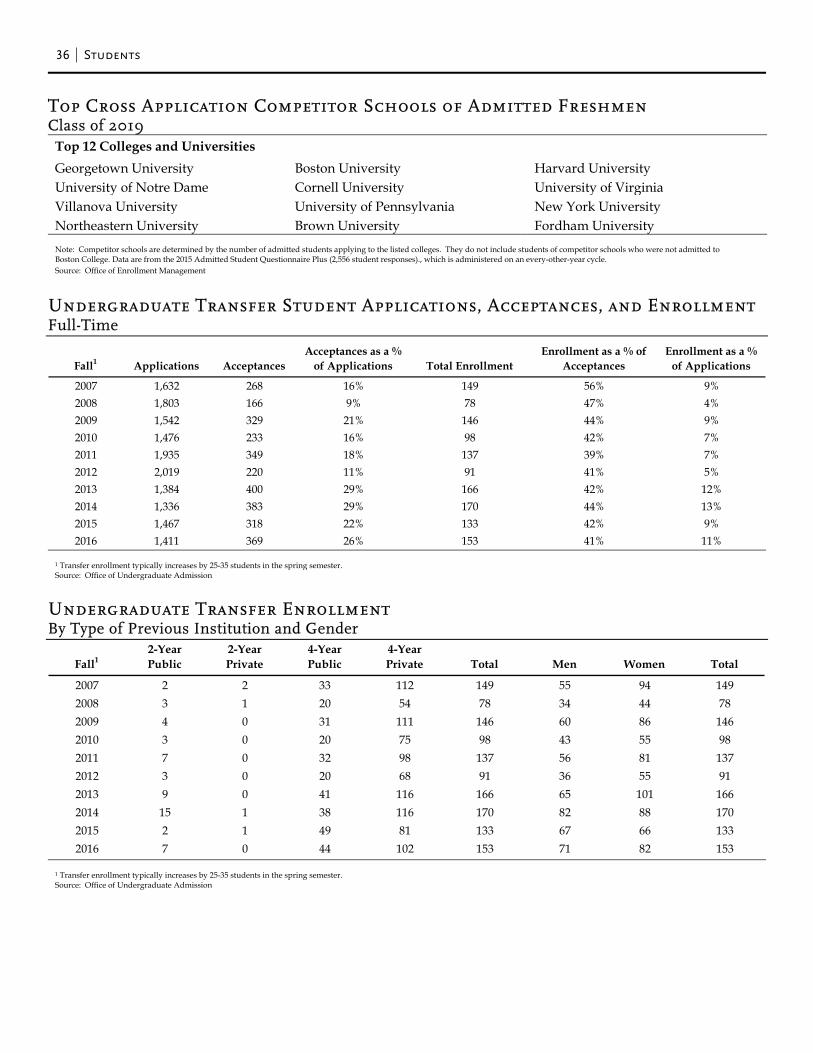
36 Students
Top Cross Application Competitor Schools of Admitted Freshmen Class of 2019
Top 12 Colleges and Universities Georgetown University Boston University Harvard University University of Notre Dame Cornell University University of Virginia Villanova University University of Pennsylvania New York University Northeastern University Brown University Fordham University Note: Competitor schools are determined by the number of admitted students applying to the listed colleges. They do not include students of competitor schools who were not admitted to Boston College. Data are from the 2015 Admitted Student Questionnaire Plus (2,556 student responses)., which is administered on an every-other-year cycle. Source: Office of Enrollment Management
Undergraduate Transfer Student Applications, Acceptances, and Enrollment Full-Time
1 Transfer enrollment typically increases by 25-35 students in the spring semester. Source: Office of Undergraduate Admission
Undergraduate Transfer Enrollment By Type of Previous Institution and Gender
1 Transfer enrollment typically increases by 25-35 students in the spring semester. Source: Office of Undergraduate Admission
Fall1 Applications AcceptancesAcceptances as a %
of Applications Total EnrollmentEnrollment as a % of
AcceptancesEnrollment as a %
of Applications
2007 1,632 268 16% 149 56% 9%2008 1,803 166 9% 78 47% 4%2009 1,542 329 21% 146 44% 9%2010 1,476 233 16% 98 42% 7%2011 1,935 349 18% 137 39% 7%2012 2,019 220 11% 91 41% 5%2013 1,384 400 29% 166 42% 12%2014 1,336 383 29% 170 44% 13%2015 1,467 318 22% 133 42% 9%2016 1,411 369 26% 153 41% 11%
Fall12-Year Public
2-Year Private
4-Year Public
4-Year Private Total Men Women Total
2007 2 2 33 112 149 55 94 1492008 3 1 20 54 78 34 44 782009 4 0 31 111 146 60 86 1462010 3 0 20 75 98 43 55 982011 7 0 32 98 137 56 81 1372012 3 0 20 68 91 36 55 912013 9 0 41 116 166 65 101 1662014 15 1 38 116 170 82 88 1702015 2 1 49 81 133 67 66 1332016 7 0 44 102 153 71 82 153
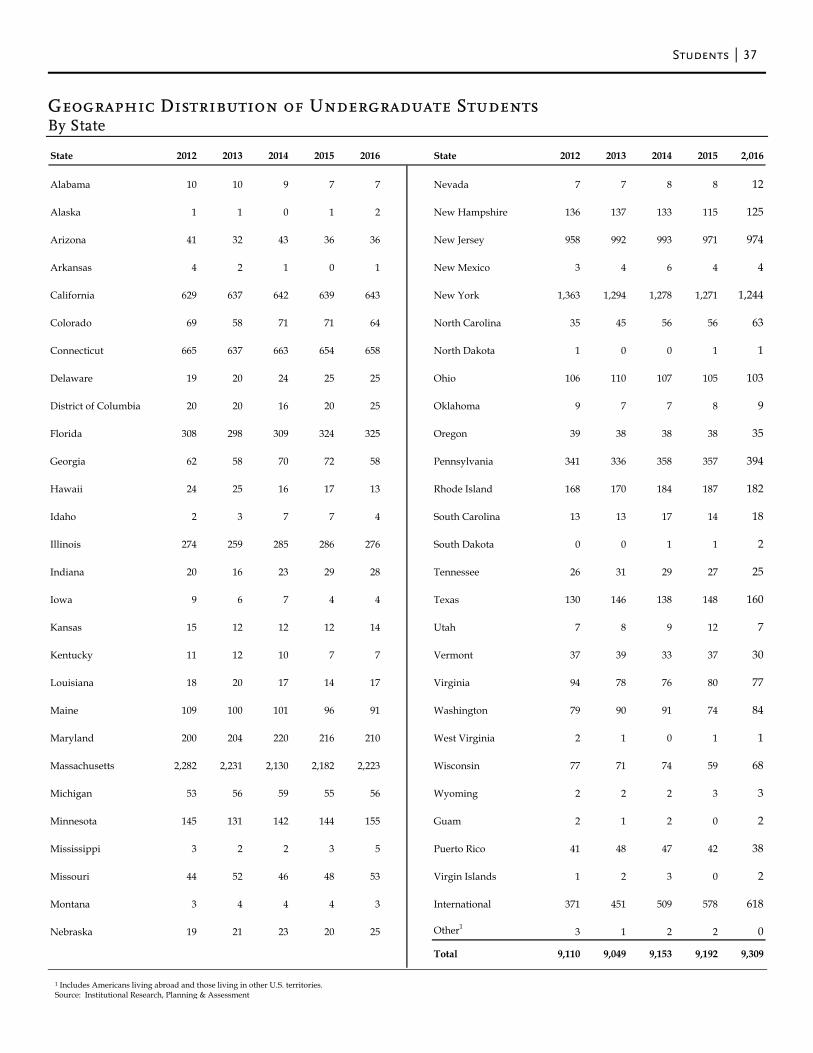
Students 37
Geographic Distribution of Undergraduate Students By State
State 2012 2013 2014 2015 2016 State 2012 2013 2014 2015 2,016
Alabama 10 10 9 7 7 Nevada 7 7 8 8 12
Alaska 1 1 0 1 2 New Hampshire 136 137 133 115 125
Arizona 41 32 43 36 36 New Jersey 958 992 993 971 974
Arkansas 4 2 1 0 1 New Mexico 3 4 6 4 4
California 629 637 642 639 643 New York 1,363 1,294 1,278 1,271 1,244
Colorado 69 58 71 71 64 North Carolina 35 45 56 56 63
Connecticut 665 637 663 654 658 North Dakota 1 0 0 1 1
Delaware 19 20 24 25 25 Ohio 106 110 107 105 103
District of Columbia 20 20 16 20 25 Oklahoma 9 7 7 8 9
Florida 308 298 309 324 325 Oregon 39 38 38 38 35
Georgia 62 58 70 72 58 Pennsylvania 341 336 358 357 394
Hawaii 24 25 16 17 13 Rhode Island 168 170 184 187 182
Idaho 2 3 7 7 4 South Carolina 13 13 17 14 18
Illinois 274 259 285 286 276 South Dakota 0 0 1 1 2
Indiana 20 16 23 29 28 Tennessee 26 31 29 27 25
Iowa 9 6 7 4 4 Texas 130 146 138 148 160
Kansas 15 12 12 12 14 Utah 7 8 9 12 7
Kentucky 11 12 10 7 7 Vermont 37 39 33 37 30
Louisiana 18 20 17 14 17 Virginia 94 78 76 80 77
Maine 109 100 101 96 91 Washington 79 90 91 74 84
Maryland 200 204 220 216 210 West Virginia 2 1 0 1 1
Massachusetts 2,282 2,231 2,130 2,182 2,223 Wisconsin 77 71 74 59 68
Michigan 53 56 59 55 56 Wyoming 2 2 2 3 3
Minnesota 145 131 142 144 155 Guam 2 1 2 0 2
Mississippi 3 2 2 3 5 Puerto Rico 41 48 47 42 38
Missouri 44 52 46 48 53 Virgin Islands 1 2 3 0 2
Montana 3 4 4 4 3 International 371 451 509 578 618
Nebraska 19 21 23 20 25 Other1 3 1 2 2 0
Total 9,110 9,049 9,153 9,192 9,309
1 Includes Americans living abroad and those living in other U.S. territories. Source: Institutional Research, Planning & Assessment
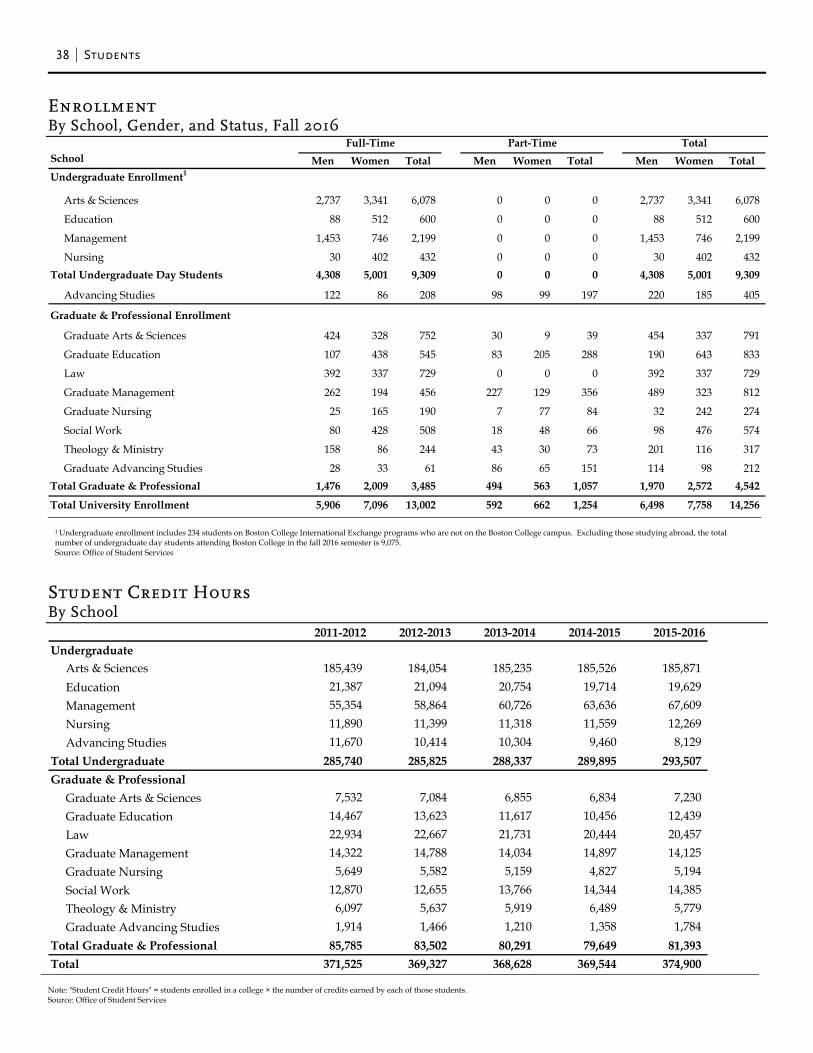
38 Students
Enrollment By School, Gender, and Status, Fall 2016
Student Credit Hours By School
School Men Women Total Men Women Total Men Women TotalUndergraduate Enrollment1
Arts & Sciences 2,737 3,341 6,078 0 0 0 2,737 3,341 6,078
Education 88 512 600 0 0 0 88 512 600
Management 1,453 746 2,199 0 0 0 1,453 746 2,199
Nursing 30 402 432 0 0 0 30 402 432Total Undergraduate Day Students 4,308 5,001 9,309 0 0 0 4,308 5,001 9,309
Advancing Studies 122 86 208 98 99 197 220 185 405
Graduate & Professional Enrollment
Graduate Arts & Sciences 424 328 752 30 9 39 454 337 791
Graduate Education 107 438 545 83 205 288 190 643 833
Law 392 337 729 0 0 0 392 337 729
Graduate Management 262 194 456 227 129 356 489 323 812
Graduate Nursing 25 165 190 7 77 84 32 242 274
Social Work 80 428 508 18 48 66 98 476 574
Theology & Ministry 158 86 244 43 30 73 201 116 317
Graduate Advancing Studies 28 33 61 86 65 151 114 98 212Total Graduate & Professional 1,476 2,009 3,485 494 563 1,057 1,970 2,572 4,542
Total University Enrollment 5,906 7,096 13,002 592 662 1,254 6,498 7,758 14,256
Full-Time Part-Time Total
2011-2012 2012-2013 2013-2014 2014-2015 2015-2016Undergraduate Arts & Sciences 185,439 184,054 185,235 185,526 185,871 Education 21,387 21,094 20,754 19,714 19,629 Management 55,354 58,864 60,726 63,636 67,609 Nursing 11,890 11,399 11,318 11,559 12,269 Advancing Studies 11,670 10,414 10,304 9,460 8,129Total Undergraduate 285,740 285,825 288,337 289,895 293,507Graduate & Professional Graduate Arts & Sciences 7,532 7,084 6,855 6,834 7,230 Graduate Education 14,467 13,623 11,617 10,456 12,439 Law 22,934 22,667 21,731 20,444 20,457 Graduate Management 14,322 14,788 14,034 14,897 14,125 Graduate Nursing 5,649 5,582 5,159 4,827 5,194 Social Work 12,870 12,655 13,766 14,344 14,385 Theology & Ministry 6,097 5,637 5,919 6,489 5,779 Graduate Advancing Studies 1,914 1,466 1,210 1,358 1,784Total Graduate & Professional 85,785 83,502 80,291 79,649 81,393Total 371,525 369,327 368,628 369,544 374,900
1 Undergraduate enrollment includes 234 students on Boston College International Exchange programs who are not on the Boston College campus. Excluding those studying abroad, the total number of undergraduate day students attending Boston College in the fall 2016 semester is 9,075. Source: Office of Student Services
Note: "Student Credit Hours" = students enrolled in a college × the number of credits earned by each of those students. Source: Office of Student Services
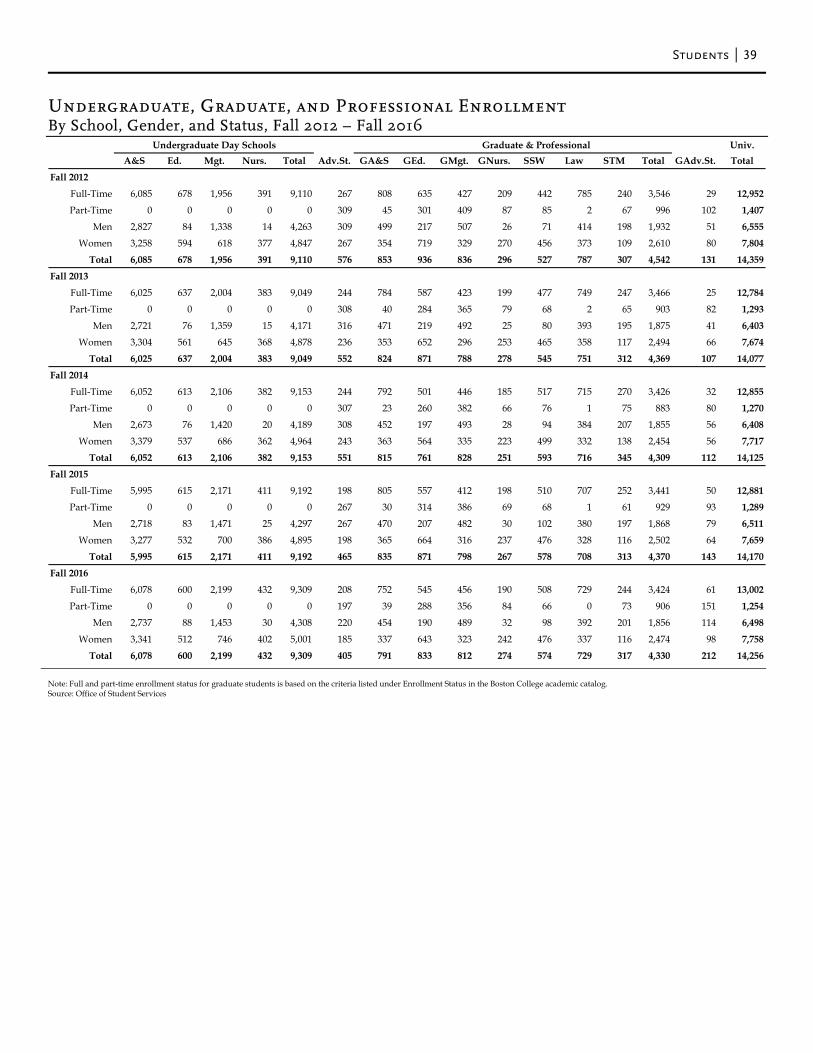
Students 39
Undergraduate, Graduate, and Professional Enrollment By School, Gender, and Status, Fall 2012 – Fall 2016
Univ.A&S Ed. Mgt. Nurs. Total Adv.St. GA&S GEd. GMgt. GNurs. SSW Law STM Total GAdv.St. Total
Fall 2012
Full-Time 6,085 678 1,956 391 9,110 267 808 635 427 209 442 785 240 3,546 29 12,952
Part-Time 0 0 0 0 0 309 45 301 409 87 85 2 67 996 102 1,407
Men 2,827 84 1,338 14 4,263 309 499 217 507 26 71 414 198 1,932 51 6,555
Women 3,258 594 618 377 4,847 267 354 719 329 270 456 373 109 2,610 80 7,804
Total 6,085 678 1,956 391 9,110 576 853 936 836 296 527 787 307 4,542 131 14,359
Fall 2013
Full-Time 6,025 637 2,004 383 9,049 244 784 587 423 199 477 749 247 3,466 25 12,784
Part-Time 0 0 0 0 0 308 40 284 365 79 68 2 65 903 82 1,293
Men 2,721 76 1,359 15 4,171 316 471 219 492 25 80 393 195 1,875 41 6,403
Women 3,304 561 645 368 4,878 236 353 652 296 253 465 358 117 2,494 66 7,674
Total 6,025 637 2,004 383 9,049 552 824 871 788 278 545 751 312 4,369 107 14,077
Fall 2014
Full-Time 6,052 613 2,106 382 9,153 244 792 501 446 185 517 715 270 3,426 32 12,855
Part-Time 0 0 0 0 0 307 23 260 382 66 76 1 75 883 80 1,270
Men 2,673 76 1,420 20 4,189 308 452 197 493 28 94 384 207 1,855 56 6,408
Women 3,379 537 686 362 4,964 243 363 564 335 223 499 332 138 2,454 56 7,717
Total 6,052 613 2,106 382 9,153 551 815 761 828 251 593 716 345 4,309 112 14,125
Fall 2015
Full-Time 5,995 615 2,171 411 9,192 198 805 557 412 198 510 707 252 3,441 50 12,881
Part-Time 0 0 0 0 0 267 30 314 386 69 68 1 61 929 93 1,289
Men 2,718 83 1,471 25 4,297 267 470 207 482 30 102 380 197 1,868 79 6,511
Women 3,277 532 700 386 4,895 198 365 664 316 237 476 328 116 2,502 64 7,659
Total 5,995 615 2,171 411 9,192 465 835 871 798 267 578 708 313 4,370 143 14,170
Fall 2016
Full-Time 6,078 600 2,199 432 9,309 208 752 545 456 190 508 729 244 3,424 61 13,002
Part-Time 0 0 0 0 0 197 39 288 356 84 66 0 73 906 151 1,254
Men 2,737 88 1,453 30 4,308 220 454 190 489 32 98 392 201 1,856 114 6,498
Women 3,341 512 746 402 5,001 185 337 643 323 242 476 337 116 2,474 98 7,758
Total 6,078 600 2,199 432 9,309 405 791 833 812 274 574 729 317 4,330 212 14,256
Graduate & ProfessionalUndergraduate Day Schools
Note: Full and part-time enrollment status for graduate students is based on the criteria listed under Enrollment Status in the Boston College academic catalog. Source: Office of Student Services
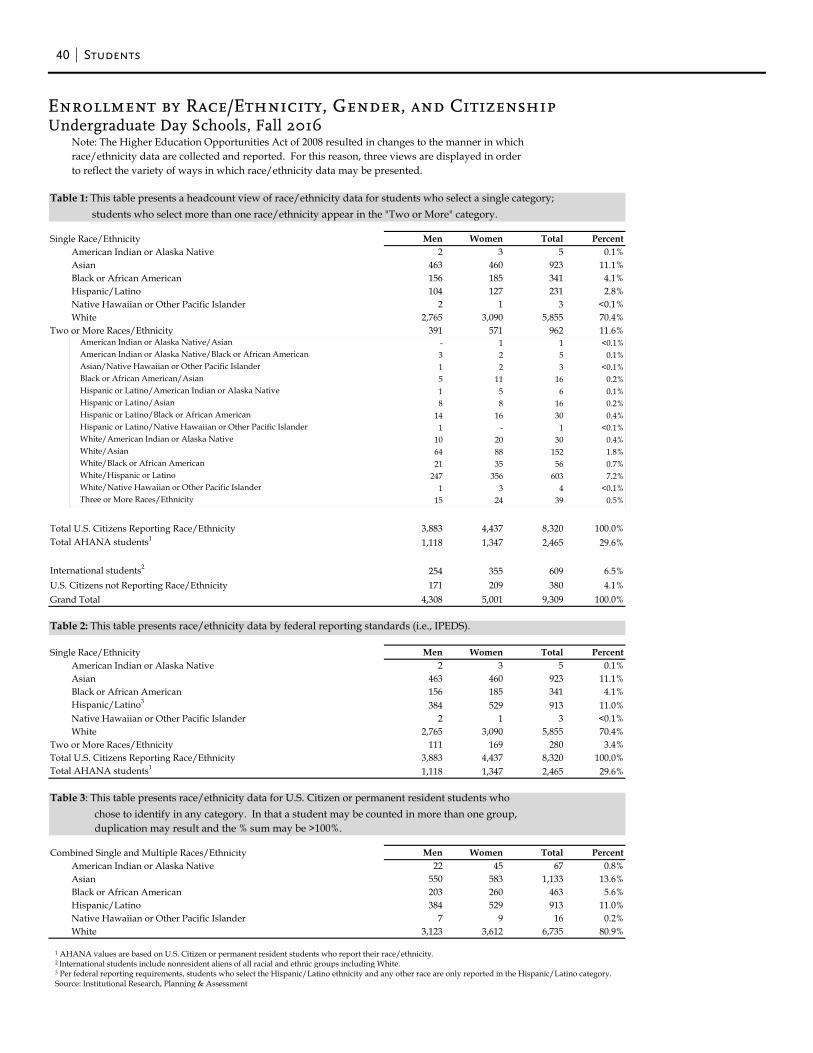
40 Students
Enrollment by Race/Ethnicity, Gender, and Citizenship Undergraduate Day Schools, Fall 2016
1 AHANA values are based on U.S. Citizen or permanent resident students who report their race/ethnicity. 2 International students include nonresident aliens of all racial and ethnic groups including White. 3 Per federal reporting requirements, students who select the Hispanic/Latino ethnicity and any other race are only reported in the Hispanic/Latino category. Source: Institutional Research, Planning & Assessment
Note: The Higher Education Opportunities Act of 2008 resulted in changes to the manner in whichrace/ethnicity data are collected and reported. For this reason, three views are displayed in orderto reflect the variety of ways in which race/ethnicity data may be presented.
Table 1: This table presents a headcount view of race/ethnicity data for students who select a single category; students who select more than one race/ethnicity appear in the "Two or More" category.
Single Race/Ethnicity Men Women Total PercentAmerican Indian or Alaska Native 2 3 5 0.1%Asian 463 460 923 11.1%Black or African American 156 185 341 4.1%Hispanic/Latino 104 127 231 2.8%Native Hawaiian or Other Pacific Islander 2 1 3 <0.1%White 2,765 3,090 5,855 70.4%
Two or More Races/Ethnicity 391 571 962 11.6%American Indian or Alaska Native/Asian - 1 1 <0.1%American Indian or Alaska Native/Black or African American 3 2 5 0.1%Asian/Native Hawaiian or Other Pacific Islander 1 2 3 <0.1%Black or African American/Asian 5 11 16 0.2%Hispanic or Latino/American Indian or Alaska Native 1 5 6 0.1%Hispanic or Latino/Asian 8 8 16 0.2%Hispanic or Latino/Black or African American 14 16 30 0.4%Hispanic or Latino/Native Hawaiian or Other Pacific Islander 1 - 1 <0.1%White/American Indian or Alaska Native 10 20 30 0.4%White/Asian 64 88 152 1.8%White/Black or African American 21 35 56 0.7%White/Hispanic or Latino 247 356 603 7.2%White/Native Hawaiian or Other Pacific Islander 1 3 4 <0.1%Three or More Races/Ethnicity 15 24 39 0.5%
Total U.S. Citizens Reporting Race/Ethnicity 3,883 4,437 8,320 100.0%Total AHANA students1 1,118 1,347 2,465 29.6%
International students2 254 355 609 6.5%U.S. Citizens not Reporting Race/Ethnicity 171 209 380 4.1%Grand Total 4,308 5,001 9,309 100.0%
Table 2: This table presents race/ethnicity data by federal reporting standards (i.e., IPEDS).
Single Race/Ethnicity Men Women Total PercentAmerican Indian or Alaska Native 2 3 5 0.1%Asian 463 460 923 11.1%Black or African American 156 185 341 4.1%Hispanic/Latino3 384 529 913 11.0%Native Hawaiian or Other Pacific Islander 2 1 3 <0.1%White 2,765 3,090 5,855 70.4%
Two or More Races/Ethnicity 111 169 280 3.4%Total U.S. Citizens Reporting Race/Ethnicity 3,883 4,437 8,320 100.0%Total AHANA students1 1,118 1,347 2,465 29.6%
Table 3: This table presents race/ethnicity data for U.S. Citizen or permanent resident students who chose to identify in any category. In that a student may be counted in more than one group, duplication may result and the % sum may be >100%.
Combined Single and Multiple Races/Ethnicity Men Women Total PercentAmerican Indian or Alaska Native 22 45 67 0.8%Asian 550 583 1,133 13.6%Black or African American 203 260 463 5.6%Hispanic/Latino 384 529 913 11.0%Native Hawaiian or Other Pacific Islander 7 9 16 0.2%White 3,123 3,612 6,735 80.9%
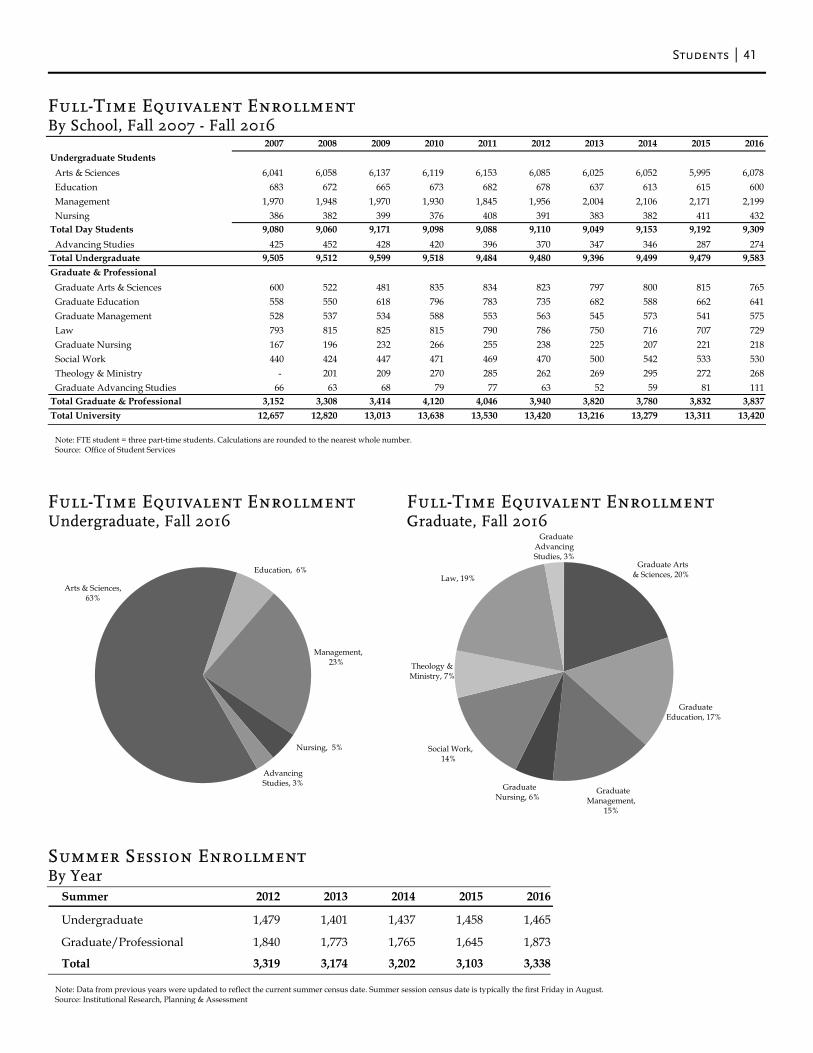
Students 41
Full-Time Equivalent Enrollment By School, Fall 2007 - Fall 2016
Full-Time Equivalent Enrollment Full-Time Equivalent Enrollment Undergraduate, Fall 2016 Graduate, Fall 2016
Summer Session Enrollment By Year
Note: Data from previous years were updated to reflect the current summer census date. Summer session census date is typically the first Friday in August. Source: Institutional Research, Planning & Assessment
2007 2008 2009 2010 2011 2012 2013 2014 2015 2016Undergraduate Students Arts & Sciences 6,041 6,058 6,137 6,119 6,153 6,085 6,025 6,052 5,995 6,078 Education 683 672 665 673 682 678 637 613 615 600 Management 1,970 1,948 1,970 1,930 1,845 1,956 2,004 2,106 2,171 2,199 Nursing 386 382 399 376 408 391 383 382 411 432Total Day Students 9,080 9,060 9,171 9,098 9,088 9,110 9,049 9,153 9,192 9,309 Advancing Studies 425 452 428 420 396 370 347 346 287 274Total Undergraduate 9,505 9,512 9,599 9,518 9,484 9,480 9,396 9,499 9,479 9,583Graduate & Professional Graduate Arts & Sciences 600 522 481 835 834 823 797 800 815 765 Graduate Education 558 550 618 796 783 735 682 588 662 641 Graduate Management 528 537 534 588 553 563 545 573 541 575 Law 793 815 825 815 790 786 750 716 707 729 Graduate Nursing 167 196 232 266 255 238 225 207 221 218 Social Work 440 424 447 471 469 470 500 542 533 530 Theology & Ministry - 201 209 270 285 262 269 295 272 268 Graduate Advancing Studies 66 63 68 79 77 63 52 59 81 111Total Graduate & Professional 3,152 3,308 3,414 4,120 4,046 3,940 3,820 3,780 3,832 3,837Total University 12,657 12,820 13,013 13,638 13,530 13,420 13,216 13,279 13,311 13,420
Arts & Sciences, 63%
Education, 6%
Management, 23%
Nursing, 5%
Advancing Studies, 3%
Graduate Arts & Sciences, 20%
Graduate Education, 17%
Graduate Management,
15%
Graduate Nursing, 6%
Social Work, 14%
Theology & Ministry, 7%
Law, 19%
Graduate Advancing Studies, 3%
Summer 2012 2013 2014 2015 2016
Undergraduate 1,479 1,401 1,437 1,458 1,465
Graduate/Professional 1,840 1,773 1,765 1,645 1,873
Total 3,319 3,174 3,202 3,103 3,338
Note: FTE student = three part-time students. Calculations are rounded to the nearest whole number. Source: Office of Student Services
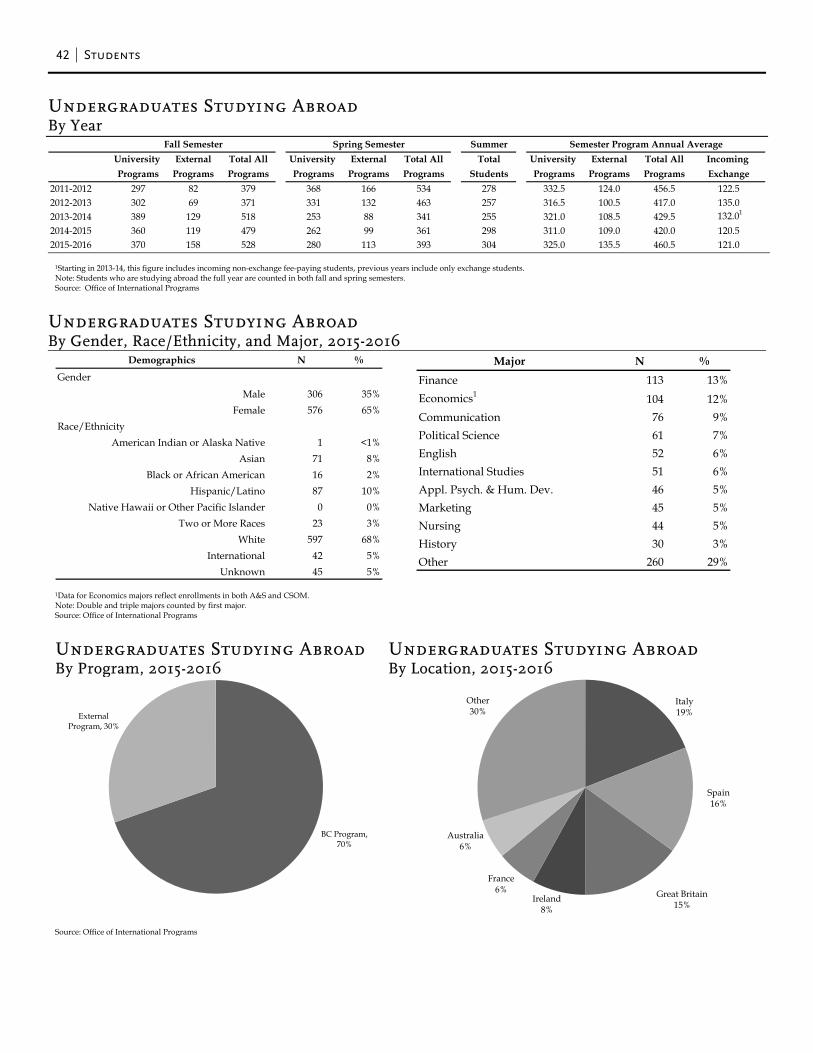
42 Students
Undergraduates Studying Abroad By Year
1Starting in 2013-14, this figure includes incoming non-exchange fee-paying students, previous years include only exchange students. Note: Students who are studying abroad the full year are counted in both fall and spring semesters. Source: Office of International Programs
Undergraduates Studying Abroad By Gender, Race/Ethnicity, and Major, 2015-2016
1Data for Economics majors reflect enrollments in both A&S and CSOM. Note: Double and triple majors counted by first major. Source: Office of International Programs
Undergraduates Studying Abroad By Program, 2015-2016
Undergraduates Studying Abroad By Location, 2015-2016
Source: Office of International Programs
Fall Semester Spring Semester SummerUniversity External Total All University External Total All Total University External Total All Incoming Programs Programs Programs Programs Programs Programs Students Programs Programs Programs Exchange
2011-2012 297 82 379 368 166 534 278 332.5 124.0 456.5 122.52012-2013 302 69 371 331 132 463 257 316.5 100.5 417.0 135.02013-2014 389 129 518 253 88 341 255 321.0 108.5 429.5 132.01
2014-2015 360 119 479 262 99 361 298 311.0 109.0 420.0 120.52015-2016 370 158 528 280 113 393 304 325.0 135.5 460.5 121.0
Semester Program Annual Average
Demographics N %
Gender
Male 306 35%Female 576 65%
Race/EthnicityAmerican Indian or Alaska Native 1 <1%
Asian 71 8%Black or African American 16 2%
Hispanic/Latino 87 10%Native Hawaii or Other Pacific Islander 0 0%
Two or More Races 23 3%White 597 68%
International 42 5%Unknown 45 5%
Major N %Finance 113 13%Economics1 104 12%Communication 76 9%Political Science 61 7%English 52 6%International Studies 51 6%Appl. Psych. & Hum. Dev. 46 5%Marketing 45 5%Nursing 44 5%History 30 3%Other 260 29%
BC Program, 70%
External Program, 30%
Italy19%
Spain16%
Great Britain15%
Ireland8%
France6%
Australia6%
Other30%
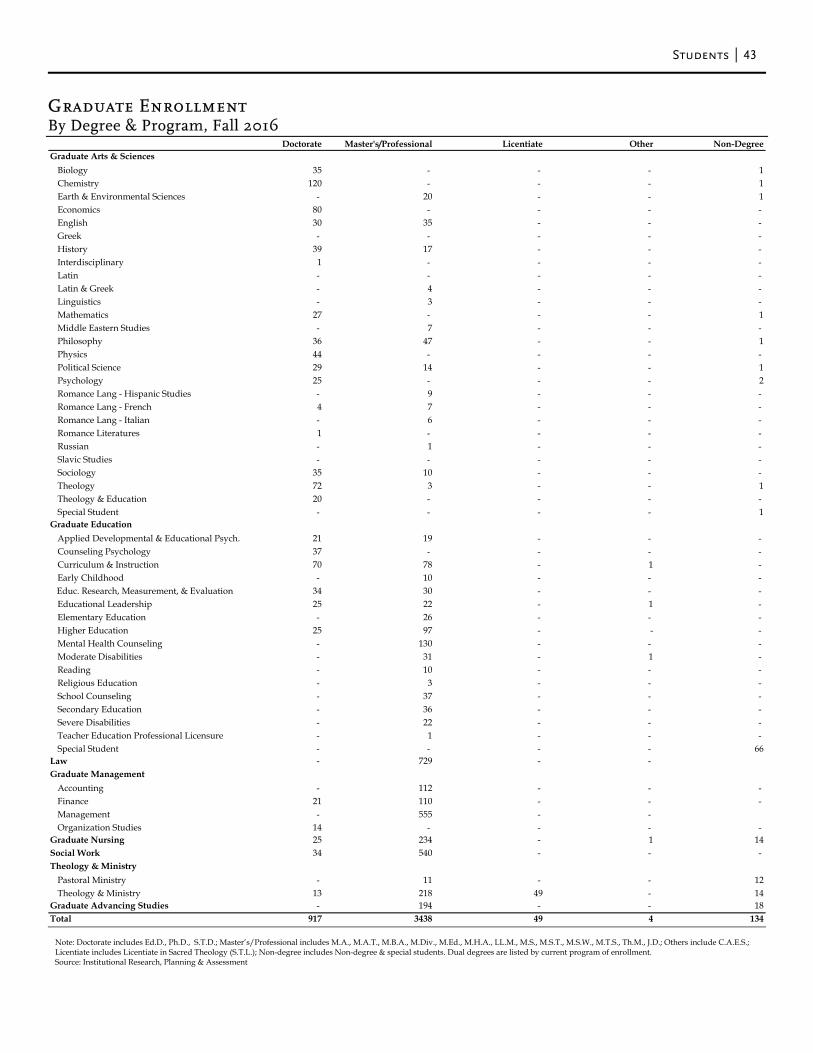
Students 43
Graduate Enrollment By Degree & Program, Fall 2016
Note: Doctorate includes Ed.D., Ph.D., S.T.D.; Master’s/Professional includes M.A., M.A.T., M.B.A., M.Div., M.Ed., M.H.A., LL.M., M.S., M.S.T., M.S.W., M.T.S., Th.M., J.D.; Others include C.A.E.S.; Licentiate includes Licentiate in Sacred Theology (S.T.L.); Non-degree includes Non-degree & special students. Dual degrees are listed by current program of enrollment. Source: Institutional Research, Planning & Assessment
Doctorate Master's/Professional Licentiate Other Non-DegreeGraduate Arts & Sciences
Biology 35 - - - 1Chemistry 120 - - - 1Earth & Environmental Sciences - 20 - - 1Economics 80 - - - - English 30 35 - - - Greek - - - - - History 39 17 - - - Interdisciplinary 1 - - - - Latin - - - - - Latin & Greek - 4 - - - Linguistics - 3 - - - Mathematics 27 - - - 1Middle Eastern Studies - 7 - - - Philosophy 36 47 - - 1Physics 44 - - - - Political Science 29 14 - - 1Psychology 25 - - - 2Romance Lang - Hispanic Studies - 9 - - - Romance Lang - French 4 7 - - - Romance Lang - Italian - 6 - - - Romance Literatures 1 - - - - Russian - 1 - - - Slavic Studies - - - - - Sociology 35 10 - - - Theology 72 3 - - 1Theology & Education 20 - - - - Special Student - - - - 1
Graduate EducationApplied Developmental & Educational Psych. 21 19 - - - Counseling Psychology 37 - - - - Curriculum & Instruction 70 78 - 1 - Early Childhood - 10 - - -
Educ. Research, Measurement, & Evaluation 34 30 - - - Educational Leadership 25 22 - 1 - Elementary Education - 26 - - - Higher Education 25 97 - - - Mental Health Counseling - 130 - - - Moderate Disabilities - 31 - 1 - Reading - 10 - - - Religious Education - 3 - - - School Counseling - 37 - - - Secondary Education - 36 - - - Severe Disabilities - 22 - - - Teacher Education Professional Licensure - 1 - - - Special Student - - - - 66
Law - 729 - - Graduate Management
Accounting - 112 - - - Finance 21 110 - - - Management - 555 - - Organization Studies 14 - - - -
Graduate Nursing 25 234 - 1 14Social Work 34 540 - - - Theology & Ministry
Pastoral Ministry - 11 - - 12Theology & Ministry 13 218 49 - 14
Graduate Advancing Studies - 194 - - 18Total 917 3438 49 4 134
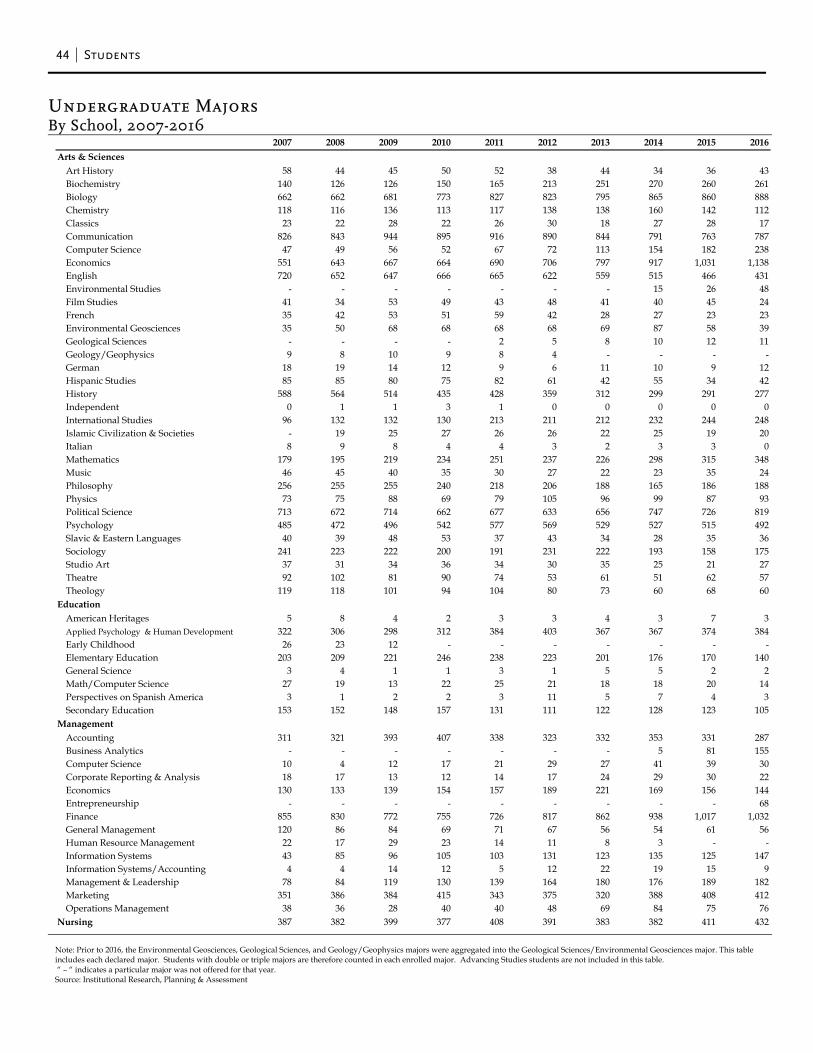
44 Students
Undergraduate Majors By School, 2007-2016
Note: Prior to 2016, the Environmental Geosciences, Geological Sciences, and Geology/Geophysics majors were aggregated into the Geological Sciences/Environmental Geosciences major. This table includes each declared major. Students with double or triple majors are therefore counted in each enrolled major. Advancing Studies students are not included in this table. “ – “ indicates a particular major was not offered for that year. Source: Institutional Research, Planning & Assessment
2007 2008 2009 2010 2011 2012 2013 2014 2015 2016Arts & Sciences
Art History 58 44 45 50 52 38 44 34 36 43Biochemistry 140 126 126 150 165 213 251 270 260 261Biology 662 662 681 773 827 823 795 865 860 888Chemistry 118 116 136 113 117 138 138 160 142 112Classics 23 22 28 22 26 30 18 27 28 17Communication 826 843 944 895 916 890 844 791 763 787Computer Science 47 49 56 52 67 72 113 154 182 238Economics 551 643 667 664 690 706 797 917 1,031 1,138English 720 652 647 666 665 622 559 515 466 431Environmental Studies - - - - - - - 15 26 48Film Studies 41 34 53 49 43 48 41 40 45 24French 35 42 53 51 59 42 28 27 23 23Environmental Geosciences 35 50 68 68 68 68 69 87 58 39Geological Sciences - - - - 2 5 8 10 12 11Geology/Geophysics 9 8 10 9 8 4 - - - -German 18 19 14 12 9 6 11 10 9 12Hispanic Studies 85 85 80 75 82 61 42 55 34 42History 588 564 514 435 428 359 312 299 291 277Independent 0 1 1 3 1 0 0 0 0 0International Studies 96 132 132 130 213 211 212 232 244 248Islamic Civilization & Societies - 19 25 27 26 26 22 25 19 20Italian 8 9 8 4 4 3 2 3 3 0Mathematics 179 195 219 234 251 237 226 298 315 348Music 46 45 40 35 30 27 22 23 35 24Philosophy 256 255 255 240 218 206 188 165 186 188Physics 73 75 88 69 79 105 96 99 87 93Political Science 713 672 714 662 677 633 656 747 726 819Psychology 485 472 496 542 577 569 529 527 515 492Slavic & Eastern Languages 40 39 48 53 37 43 34 28 35 36Sociology 241 223 222 200 191 231 222 193 158 175Studio Art 37 31 34 36 34 30 35 25 21 27Theatre 92 102 81 90 74 53 61 51 62 57Theology 119 118 101 94 104 80 73 60 68 60
EducationAmerican Heritages 5 8 4 2 3 3 4 3 7 3Applied Psychology & Human Development 322 306 298 312 384 403 367 367 374 384Early Childhood 26 23 12 - - - - - - -Elementary Education 203 209 221 246 238 223 201 176 170 140General Science 3 4 1 1 3 1 5 5 2 2Math/Computer Science 27 19 13 22 25 21 18 18 20 14Perspectives on Spanish America 3 1 2 2 3 11 5 7 4 3Secondary Education 153 152 148 157 131 111 122 128 123 105
ManagementAccounting 311 321 393 407 338 323 332 353 331 287Business Analytics - - - - - - - 5 81 155Computer Science 10 4 12 17 21 29 27 41 39 30Corporate Reporting & Analysis 18 17 13 12 14 17 24 29 30 22Economics 130 133 139 154 157 189 221 169 156 144Entrepreneurship - - - - - - - - - 68Finance 855 830 772 755 726 817 862 938 1,017 1,032General Management 120 86 84 69 71 67 56 54 61 56Human Resource Management 22 17 29 23 14 11 8 3 - -Information Systems 43 85 96 105 103 131 123 135 125 147Information Systems/Accounting 4 4 14 12 5 12 22 19 15 9Management & Leadership 78 84 119 130 139 164 180 176 189 182Marketing 351 386 384 415 343 375 320 388 408 412Operations Management 38 36 28 40 40 48 69 84 75 76
Nursing 387 382 399 377 408 391 383 382 411 432
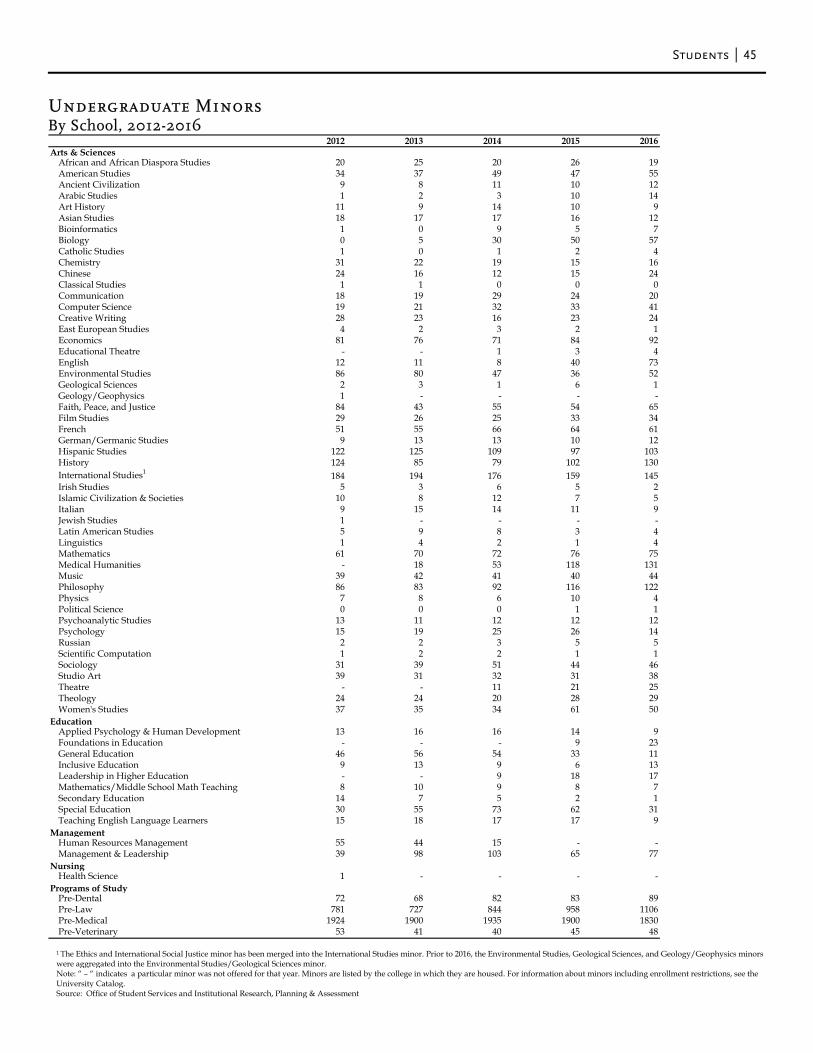
Students 45
Undergraduate Minors By School, 2012-2016
1 The Ethics and International Social Justice minor has been merged into the International Studies minor. Prior to 2016, the Environmental Studies, Geological Sciences, and Geology/Geophysics minors were aggregated into the Environmental Studies/Geological Sciences minor. Note: “ – “ indicates a particular minor was not offered for that year. Minors are listed by the college in which they are housed. For information about minors including enrollment restrictions, see the University Catalog. Source: Office of Student Services and Institutional Research, Planning & Assessment
2012 2013 2014 2015 2016Arts & Sciences
African and African Diaspora Studies 20 25 20 26 19American Studies 34 37 49 47 55Ancient Civilization 9 8 11 10 12Arabic Studies 1 2 3 10 14Art History 11 9 14 10 9Asian Studies 18 17 17 16 12Bioinformatics 1 0 9 5 7Biology 0 5 30 50 57Catholic Studies 1 0 1 2 4Chemistry 31 22 19 15 16Chinese 24 16 12 15 24Classical Studies 1 1 0 0 0Communication 18 19 29 24 20Computer Science 19 21 32 33 41Creative Writing 28 23 16 23 24East European Studies 4 2 3 2 1Economics 81 76 71 84 92Educational Theatre - - 1 3 4English 12 11 8 40 73Environmental Studies 86 80 47 36 52Geological Sciences 2 3 1 6 1Geology/Geophysics 1 - - - -Faith, Peace, and Justice 84 43 55 54 65Film Studies 29 26 25 33 34French 51 55 66 64 61German/Germanic Studies 9 13 13 10 12Hispanic Studies 122 125 109 97 103History 124 85 79 102 130International Studies1 184 194 176 159 145Irish Studies 5 3 6 5 2Islamic Civilization & Societies 10 8 12 7 5Italian 9 15 14 11 9Jewish Studies 1 - - - -Latin American Studies 5 9 8 3 4Linguistics 1 4 2 1 4Mathematics 61 70 72 76 75Medical Humanities - 18 53 118 131Music 39 42 41 40 44Philosophy 86 83 92 116 122Physics 7 8 6 10 4Political Science 0 0 0 1 1Psychoanalytic Studies 13 11 12 12 12Psychology 15 19 25 26 14Russian 2 2 3 5 5Scientific Computation 1 2 2 1 1Sociology 31 39 51 44 46Studio Art 39 31 32 31 38Theatre - - 11 21 25Theology 24 24 20 28 29Women's Studies 37 35 34 61 50
EducationApplied Psychology & Human Development 13 16 16 14 9Foundations in Education - - - 9 23General Education 46 56 54 33 11Inclusive Education 9 13 9 6 13Leadership in Higher Education - - 9 18 17Mathematics/Middle School Math Teaching 8 10 9 8 7Secondary Education 14 7 5 2 1Special Education 30 55 73 62 31Teaching English Language Learners 15 18 17 17 9
ManagementHuman Resources Management 55 44 15 - -Management & Leadership 39 98 103 65 77
NursingHealth Science 1 - - - -
Programs of StudyPre-Dental 72 68 82 83 89Pre-Law 781 727 844 958 1106Pre-Medical 1924 1900 1935 1900 1830Pre-Veterinary 53 41 40 45 48
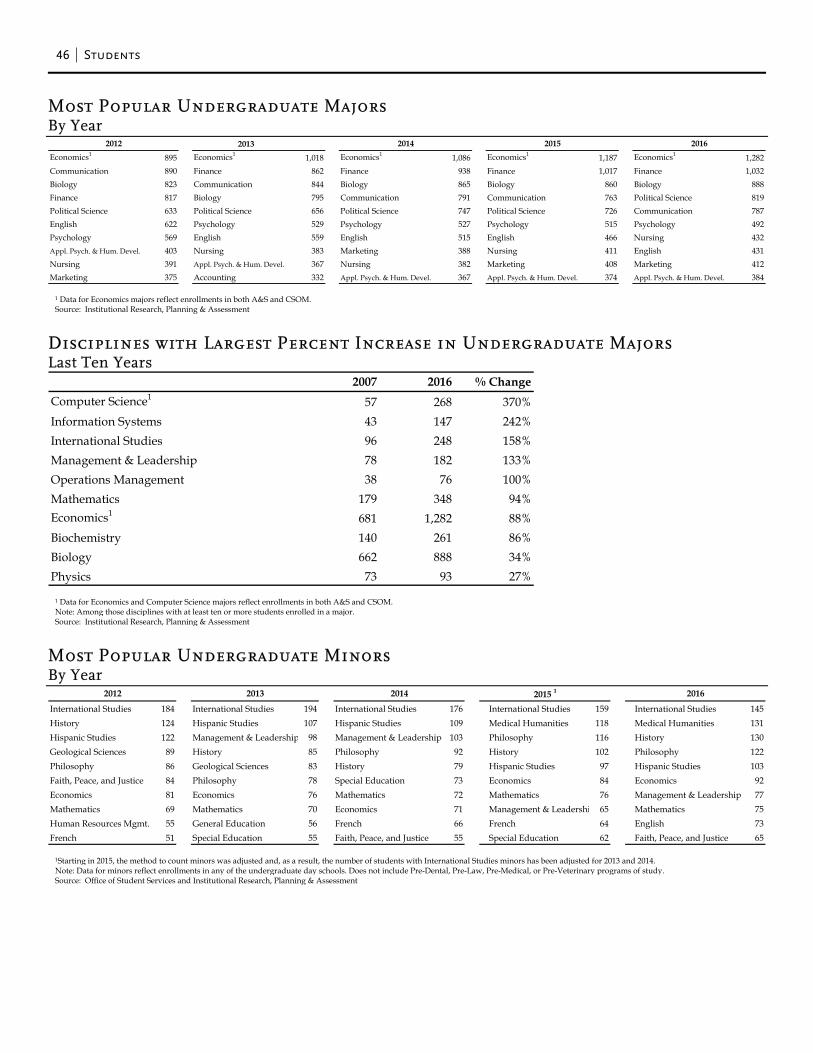
46 Students
Most Popular Undergraduate Majors By Year
1 Data for Economics majors reflect enrollments in both A&S and CSOM. Source: Institutional Research, Planning & Assessment
Disciplines with Largest Percent Increase in Undergraduate Majors Last Ten Years
1 Data for Economics and Computer Science majors reflect enrollments in both A&S and CSOM. Note: Among those disciplines with at least ten or more students enrolled in a major. Source: Institutional Research, Planning & Assessment
Most Popular Undergraduate Minors By Year
1Starting in 2015, the method to count minors was adjusted and, as a result, the number of students with International Studies minors has been adjusted for 2013 and 2014. Note: Data for minors reflect enrollments in any of the undergraduate day schools. Does not include Pre-Dental, Pre-Law, Pre-Medical, or Pre-Veterinary programs of study. Source: Office of Student Services and Institutional Research, Planning & Assessment
2013Economics1 895 Economics1 1,018 Economics1 1,086 Economics1 1,187 Economics1 1,282Communication 890 Finance 862 Finance 938 Finance 1,017 Finance 1,032Biology 823 Communication 844 Biology 865 Biology 860 Biology 888Finance 817 Biology 795 Communication 791 Communication 763 Political Science 819Political Science 633 Political Science 656 Political Science 747 Political Science 726 Communication 787English 622 Psychology 529 Psychology 527 Psychology 515 Psychology 492Psychology 569 English 559 English 515 English 466 Nursing 432Appl. Psych. & Hum. Devel. 403 Nursing 383 Marketing 388 Nursing 411 English 431Nursing 391 Appl. Psych. & Hum. Devel. 367 Nursing 382 Marketing 408 Marketing 412Marketing 375 Accounting 332 Appl. Psych. & Hum. Devel. 367 Appl. Psych. & Hum. Devel. 374 Appl. Psych. & Hum. Devel. 384
20142012 2015 2016
2007 2016 % ChangeComputer Science1 57 268 370%Information Systems 43 147 242%International Studies 96 248 158%Management & Leadership 78 182 133%Operations Management 38 76 100%Mathematics 179 348 94%Economics1 681 1,282 88%Biochemistry 140 261 86%Biology 662 888 34%Physics 73 93 27%
International Studies 184 International Studies 194 International Studies 176 International Studies 159 International Studies 145History 124 Hispanic Studies 107 Hispanic Studies 109 Medical Humanities 118 Medical Humanities 131Hispanic Studies 122 Management & Leadership 98 Management & Leadership 103 Philosophy 116 History 130Geological Sciences 89 History 85 Philosophy 92 History 102 Philosophy 122Philosophy 86 Geological Sciences 83 History 79 Hispanic Studies 97 Hispanic Studies 103Faith, Peace, and Justice 84 Philosophy 78 Special Education 73 Economics 84 Economics 92Economics 81 Economics 76 Mathematics 72 Mathematics 76 Management & Leadership 77Mathematics 69 Mathematics 70 Economics 71 Management & Leadershi 65 Mathematics 75Human Resources Mgmt. 55 General Education 56 French 66 French 64 English 73French 51 Special Education 55 Faith, Peace, and Justice 55 Special Education 62 Faith, Peace, and Justice 65
20162015 120142012 2013
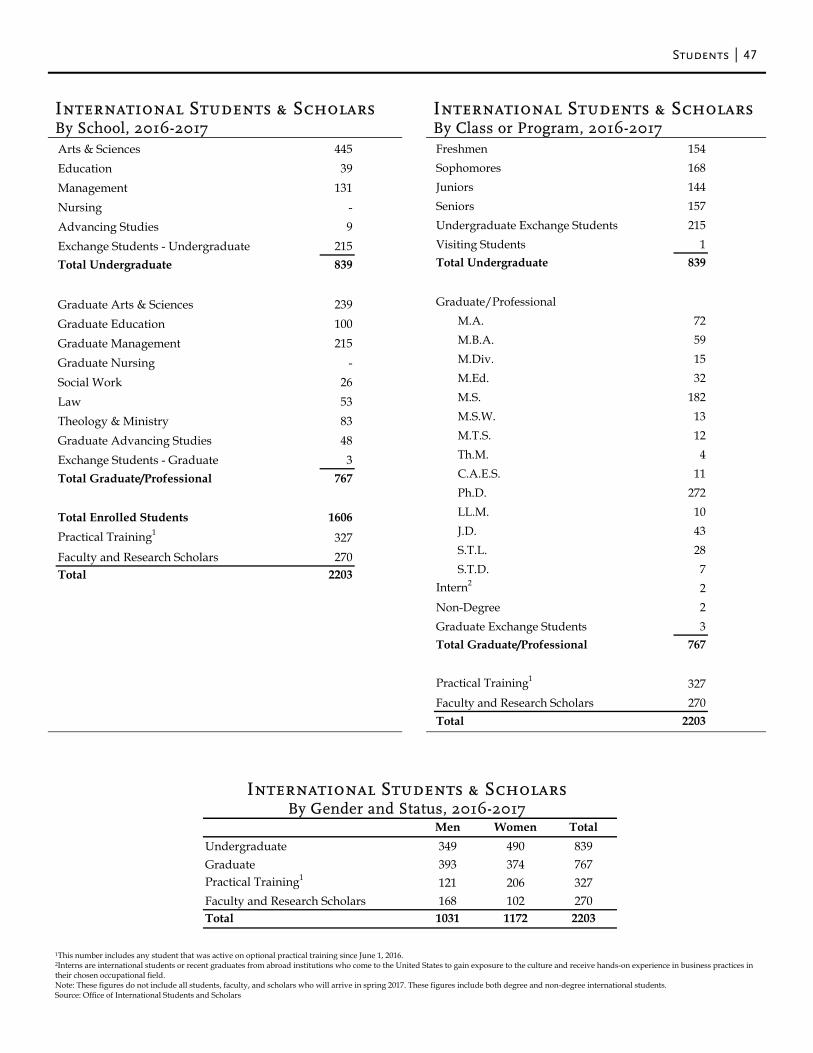
Students 47
International Students & Scholars
International Students & Scholars
By School, 2016-2017 By Class or Program, 2016-2017
International Students & Scholars By Gender and Status, 2016-2017
1This number includes any student that was active on optional practical training since June 1, 2016. 2Interns are international students or recent graduates from abroad institutions who come to the United States to gain exposure to the culture and receive hands-on experience in business practices in their chosen occupational field. Note: These figures do not include all students, faculty, and scholars who will arrive in spring 2017. These figures include both degree and non-degree international students. Source: Office of International Students and Scholars
Arts & Sciences 445Education 39Management 131Nursing -Advancing Studies 9Exchange Students - Undergraduate 215Total Undergraduate 839
Graduate Arts & Sciences 239Graduate Education 100Graduate Management 215Graduate Nursing -Social Work 26Law 53Theology & Ministry 83Graduate Advancing Studies 48Exchange Students - Graduate 3Total Graduate/Professional 767
Total Enrolled Students 1606Practical Training1 327Faculty and Research Scholars 270Total 2203
Freshmen 154Sophomores 168Juniors 144Seniors 157Undergraduate Exchange Students 215Visiting Students 1Total Undergraduate 839
Graduate/ProfessionalM.A. 72M.B.A. 59M.Div. 15M.Ed. 32M.S. 182M.S.W. 13M.T.S. 12Th.M. 4C.A.E.S. 11Ph.D. 272LL.M. 10J.D. 43S.T.L. 28S.T.D. 7
Intern2 2Non-Degree 2Graduate Exchange Students 3Total Graduate/Professional 767
Practical Training1 327Faculty and Research Scholars 270Total 2203
Men Women TotalUndergraduate 349 490 839Graduate 393 374 767Practical Training1 121 206 327Faculty and Research Scholars 168 102 270Total 1031 1172 2203
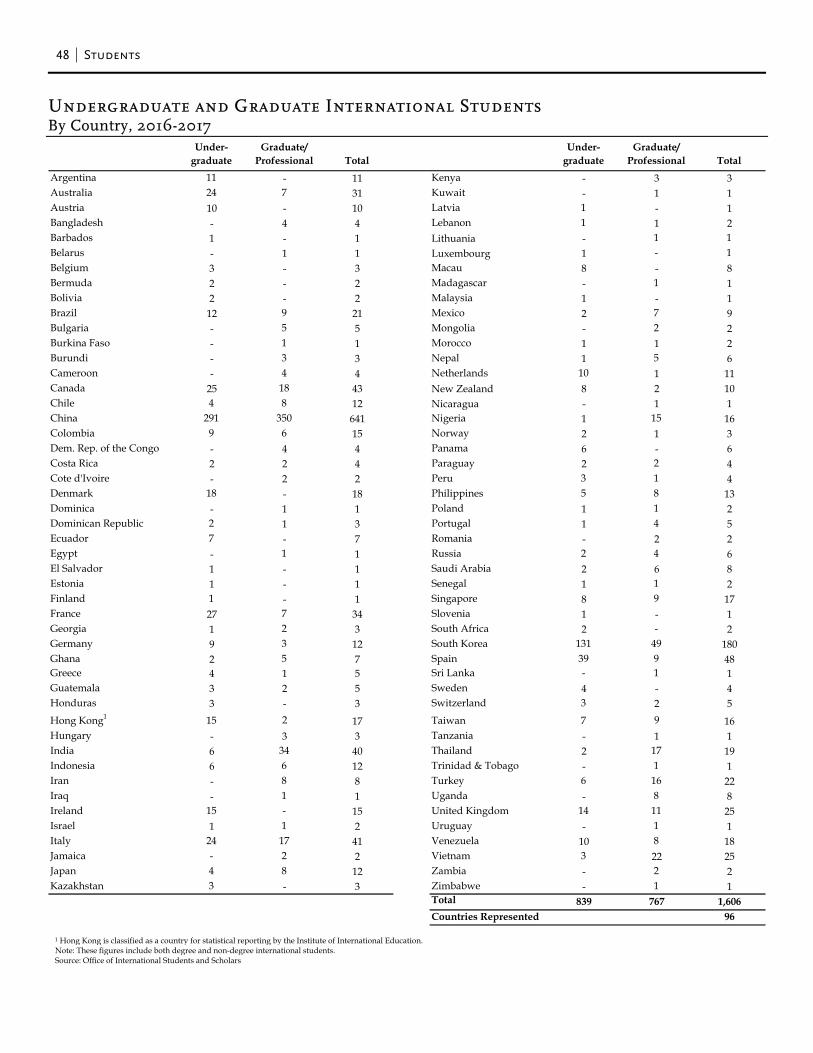
48 Students
Undergraduate and Graduate International Students By Country, 2016-2017
1 Hong Kong is classified as a country for statistical reporting by the Institute of International Education. Note: These figures include both degree and non-degree international students. Source: Office of International Students and Scholars
Under- graduate
Graduate/ Professional Total
Under- graduate
Graduate/ Professional Total
Argentina 11 - 11 Kenya - 3 3Australia 24 7 31 Kuwait - 1 1Austria 10 - 10 Latvia 1 - 1Bangladesh - 4 4 Lebanon 1 1 2Barbados 1 - 1 Lithuania - 1 1Belarus - 1 1 Luxembourg 1 - 1Belgium 3 - 3 Macau 8 - 8Bermuda 2 - 2 Madagascar - 1 1Bolivia 2 - 2 Malaysia 1 - 1Brazil 12 9 21 Mexico 2 7 9Bulgaria - 5 5 Mongolia - 2 2Burkina Faso - 1 1 Morocco 1 1 2Burundi - 3 3 Nepal 1 5 6Cameroon - 4 4 Netherlands 10 1 11Canada 25 18 43 New Zealand 8 2 10Chile 4 8 12 Nicaragua - 1 1China 291 350 641 Nigeria 1 15 16Colombia 9 6 15 Norway 2 1 3Dem. Rep. of the Congo - 4 4 Panama 6 - 6Costa Rica 2 2 4 Paraguay 2 2 4Cote d'Ivoire - 2 2 Peru 3 1 4Denmark 18 - 18 Philippines 5 8 13Dominica - 1 1 Poland 1 1 2Dominican Republic 2 1 3 Portugal 1 4 5Ecuador 7 - 7 Romania - 2 2Egypt - 1 1 Russia 2 4 6El Salvador 1 - 1 Saudi Arabia 2 6 8Estonia 1 - 1 Senegal 1 1 2Finland 1 - 1 Singapore 8 9 17France 27 7 34 Slovenia 1 - 1Georgia 1 2 3 South Africa 2 - 2Germany 9 3 12 South Korea 131 49 180Ghana 2 5 7 Spain 39 9 48Greece 4 1 5 Sri Lanka - 1 1Guatemala 3 2 5 Sweden 4 - 4Honduras 3 - 3 Switzerland 3 2 5Hong Kong1 15 2 17 Taiwan 7 9 16Hungary - 3 3 Tanzania - 1 1India 6 34 40 Thailand 2 17 19Indonesia 6 6 12 Trinidad & Tobago - 1 1Iran - 8 8 Turkey 6 16 22Iraq - 1 1 Uganda - 8 8Ireland 15 - 15 United Kingdom 14 11 25Israel 1 1 2 Uruguay - 1 1Italy 24 17 41 Venezuela 10 8 18Jamaica - 2 2 Vietnam 3 22 25Japan 4 8 12 Zambia - 2 2Kazakhstan 3 - 3 Zimbabwe - 1 1
Total 839 767 1,606Countries Represented 96
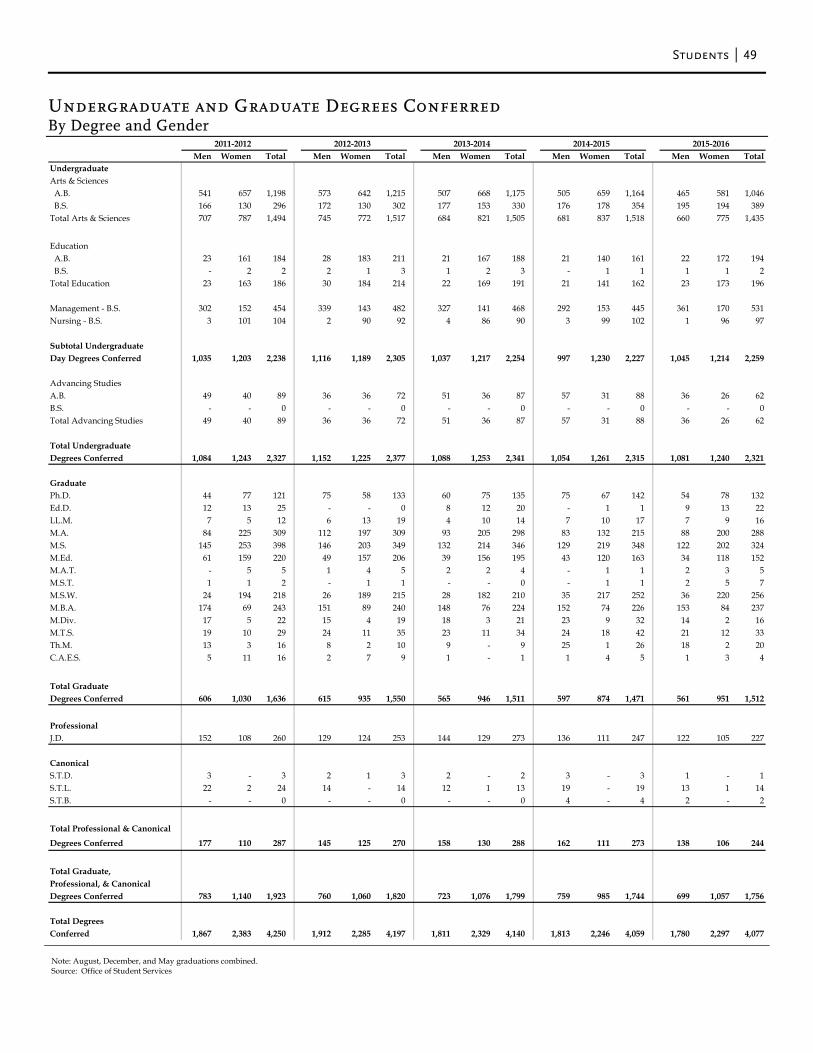
Students 49
Undergraduate and Graduate Degrees Conferred By Degree and Gender
2011-2012 2012-2013 2013-2014 2014-2015 2015-2016Men Women Total Men Women Total Men Women Total Men Women Total Men Women Total
UndergraduateArts & Sciences A.B. 541 657 1,198 573 642 1,215 507 668 1,175 505 659 1,164 465 581 1,046 B.S. 166 130 296 172 130 302 177 153 330 176 178 354 195 194 389Total Arts & Sciences 707 787 1,494 745 772 1,517 684 821 1,505 681 837 1,518 660 775 1,435
Education A.B. 23 161 184 28 183 211 21 167 188 21 140 161 22 172 194 B.S. - 2 2 2 1 3 1 2 3 - 1 1 1 1 2Total Education 23 163 186 30 184 214 22 169 191 21 141 162 23 173 196
Management - B.S. 302 152 454 339 143 482 327 141 468 292 153 445 361 170 531Nursing - B.S. 3 101 104 2 90 92 4 86 90 3 99 102 1 96 97
Subtotal UndergraduateDay Degrees Conferred 1,035 1,203 2,238 1,116 1,189 2,305 1,037 1,217 2,254 997 1,230 2,227 1,045 1,214 2,259 Advancing Studies A.B. 49 40 89 36 36 72 51 36 87 57 31 88 36 26 62B.S. - - 0 - - 0 - - 0 - - 0 - - 0Total Advancing Studies 49 40 89 36 36 72 51 36 87 57 31 88 36 26 62
Total UndergraduateDegrees Conferred 1,084 1,243 2,327 1,152 1,225 2,377 1,088 1,253 2,341 1,054 1,261 2,315 1,081 1,240 2,321
GraduatePh.D. 44 77 121 75 58 133 60 75 135 75 67 142 54 78 132Ed.D. 12 13 25 - - 0 8 12 20 - 1 1 9 13 22LL.M. 7 5 12 6 13 19 4 10 14 7 10 17 7 9 16M.A. 84 225 309 112 197 309 93 205 298 83 132 215 88 200 288M.S. 145 253 398 146 203 349 132 214 346 129 219 348 122 202 324M.Ed. 61 159 220 49 157 206 39 156 195 43 120 163 34 118 152M.A.T. - 5 5 1 4 5 2 2 4 - 1 1 2 3 5M.S.T. 1 1 2 - 1 1 - - 0 - 1 1 2 5 7M.S.W. 24 194 218 26 189 215 28 182 210 35 217 252 36 220 256M.B.A. 174 69 243 151 89 240 148 76 224 152 74 226 153 84 237M.Div. 17 5 22 15 4 19 18 3 21 23 9 32 14 2 16M.T.S. 19 10 29 24 11 35 23 11 34 24 18 42 21 12 33Th.M. 13 3 16 8 2 10 9 - 9 25 1 26 18 2 20C.A.E.S. 5 11 16 2 7 9 1 - 1 1 4 5 1 3 4 Total Graduate Degrees Conferred 606 1,030 1,636 615 935 1,550 565 946 1,511 597 874 1,471 561 951 1,512
Professional J.D. 152 108 260 129 124 253 144 129 273 136 111 247 122 105 227
CanonicalS.T.D. 3 - 3 2 1 3 2 - 2 3 - 3 1 - 1S.T.L. 22 2 24 14 - 14 12 1 13 19 - 19 13 1 14S.T.B. - - 0 - - 0 - - 0 4 - 4 2 - 2
Total Professional & Canonical
Degrees Conferred 177 110 287 145 125 270 158 130 288 162 111 273 138 106 244
Total Graduate,Professional, & CanonicalDegrees Conferred 783 1,140 1,923 760 1,060 1,820 723 1,076 1,799 759 985 1,744 699 1,057 1,756
Total Degrees Conferred 1,867 2,383 4,250 1,912 2,285 4,197 1,811 2,329 4,140 1,813 2,246 4,059 1,780 2,297 4,077
Note: August, December, and May graduations combined. Source: Office of Student Services
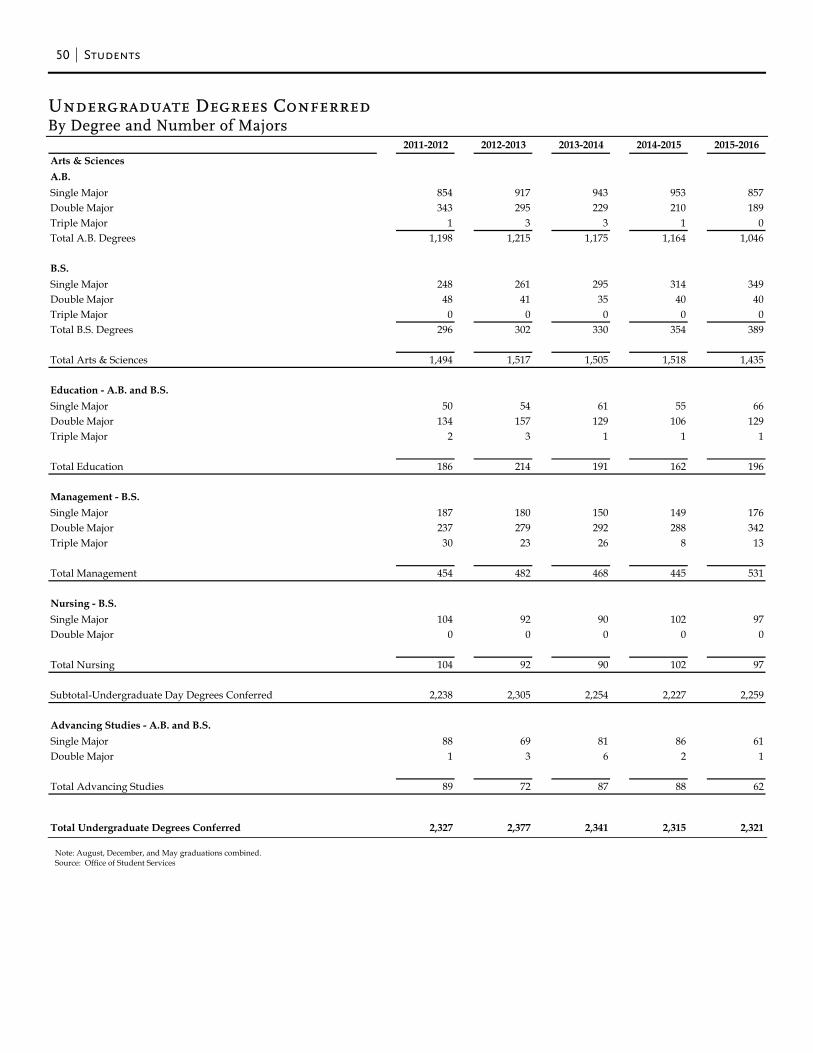
50 Students
Undergraduate Degrees Conferred By Degree and Number of Majors
2011-2012 2012-2013 2013-2014 2014-2015 2015-2016Arts & SciencesA.B.Single Major 854 917 943 953 857Double Major 343 295 229 210 189Triple Major 1 3 3 1 0Total A.B. Degrees 1,198 1,215 1,175 1,164 1,046
B.S.Single Major 248 261 295 314 349Double Major 48 41 35 40 40Triple Major 0 0 0 0 0Total B.S. Degrees 296 302 330 354 389
Total Arts & Sciences 1,494 1,517 1,505 1,518 1,435
Education - A.B. and B.S.Single Major 50 54 61 55 66Double Major 134 157 129 106 129Triple Major 2 3 1 1 1
Total Education 186 214 191 162 196
Management - B.S.Single Major 187 180 150 149 176Double Major 237 279 292 288 342Triple Major 30 23 26 8 13
Total Management 454 482 468 445 531
Nursing - B.S.Single Major 104 92 90 102 97Double Major 0 0 0 0 0
Total Nursing 104 92 90 102 97
Subtotal-Undergraduate Day Degrees Conferred 2,238 2,305 2,254 2,227 2,259
Advancing Studies - A.B. and B.S.Single Major 88 69 81 86 61Double Major 1 3 6 2 1
Total Advancing Studies 89 72 87 88 62
Total Undergraduate Degrees Conferred 2,327 2,377 2,341 2,315 2,321 Note: August, December, and May graduations combined. Source: Office of Student Services
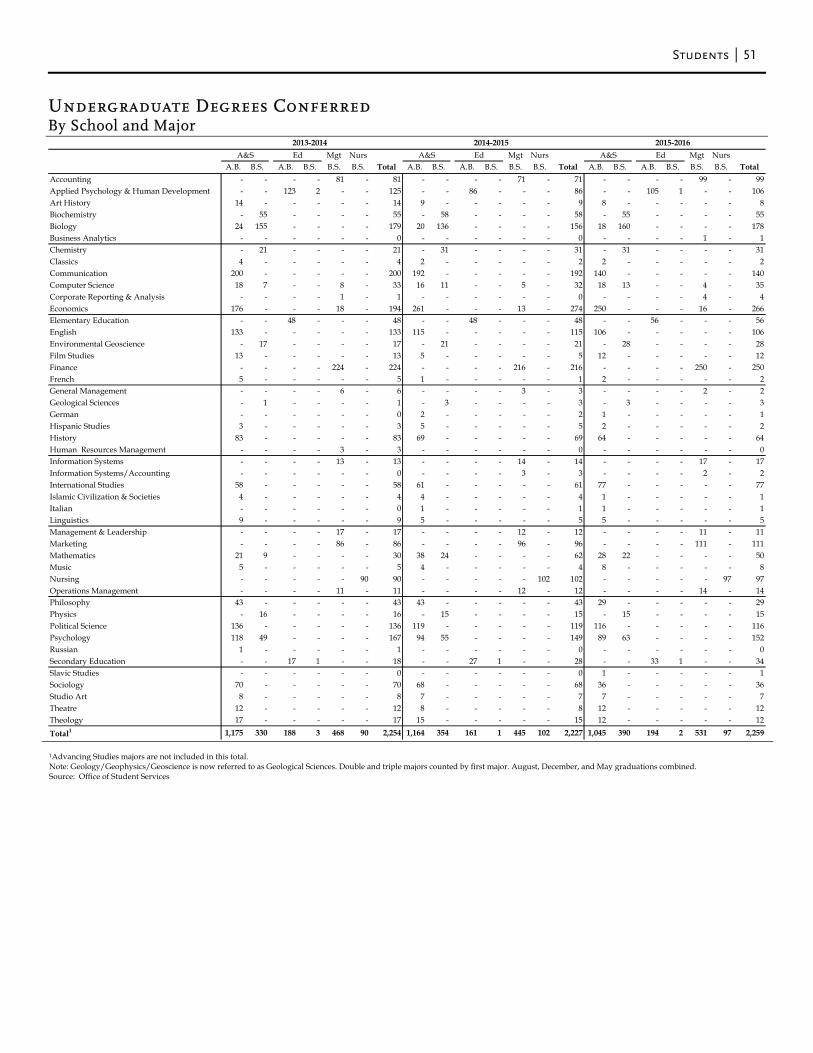
Students 51
Undergraduate Degrees Conferred By School and Major
1Advancing Studies majors are not included in this total. Note: Geology/Geophysics/Geoscience is now referred to as Geological Sciences. Double and triple majors counted by first major. August, December, and May graduations combined. Source: Office of Student Services
Mgt Nurs Mgt Nurs Mgt NursA.B. B.S. A.B. B.S. B.S. B.S. Total A.B. B.S. A.B. B.S. B.S. B.S. Total A.B. B.S. A.B. B.S. B.S. B.S. Total
Accounting - - - - 81 - 81 - - - - 71 - 71 - - - - 99 - 99Applied Psychology & Human Development - - 123 2 - - 125 - - 86 - - - 86 - - 105 1 - - 106Art History 14 - - - - - 14 9 - - - - - 9 8 - - - - - 8Biochemistry - 55 - - - - 55 - 58 - - - - 58 - 55 - - - - 55Biology 24 155 - - - - 179 20 136 - - - - 156 18 160 - - - - 178Business Analytics - - - - - - 0 - - - - - - 0 - - - - 1 - 1Chemistry - 21 - - - - 21 - 31 - - - - 31 - 31 - - - - 31Classics 4 - - - - - 4 2 - - - - - 2 2 - - - - - 2Communication 200 - - - - - 200 192 - - - - - 192 140 - - - - - 140Computer Science 18 7 - - 8 - 33 16 11 - - 5 - 32 18 13 - - 4 - 35Corporate Reporting & Analysis - - - - 1 - 1 - - - - - - 0 - - - - 4 - 4Economics 176 - - - 18 - 194 261 - - - 13 - 274 250 - - - 16 - 266Elementary Education - - 48 - - - 48 - - 48 - - - 48 - - 56 - - - 56English 133 - - - - - 133 115 - - - - - 115 106 - - - - - 106Environmental Geoscience - 17 - - - - 17 - 21 - - - - 21 - 28 - - - - 28Film Studies 13 - - - - - 13 5 - - - - - 5 12 - - - - - 12Finance - - - - 224 - 224 - - - - 216 - 216 - - - - 250 - 250French 5 - - - - - 5 1 - - - - - 1 2 - - - - - 2General Management - - - - 6 - 6 - - - - 3 - 3 - - - - 2 - 2Geological Sciences - 1 - - - - 1 - 3 - - - - 3 - 3 - - - - 3German - - - - - - 0 2 - - - - - 2 1 - - - - - 1Hispanic Studies 3 - - - - - 3 5 - - - - - 5 2 - - - - - 2History 83 - - - - - 83 69 - - - - - 69 64 - - - - - 64Human Resources Management - - - - 3 - 3 - - - - - - 0 - - - - - - 0Information Systems - - - - 13 - 13 - - - - 14 - 14 - - - - 17 - 17Information Systems/Accounting - - - - - - 0 - - - - 3 - 3 - - - - 2 - 2International Studies 58 - - - - - 58 61 - - - - - 61 77 - - - - - 77Islamic Civilization & Societies 4 - - - - - 4 4 - - - - - 4 1 - - - - - 1Italian - - - - - - 0 1 - - - - - 1 1 - - - - - 1Linguistics 9 - - - - - 9 5 - - - - - 5 5 - - - - - 5Management & Leadership - - - - 17 - 17 - - - - 12 - 12 - - - - 11 - 11Marketing - - - - 86 - 86 - - - - 96 - 96 - - - - 111 - 111Mathematics 21 9 - - - - 30 38 24 - - - - 62 28 22 - - - - 50Music 5 - - - - - 5 4 - - - - - 4 8 - - - - - 8Nursing - - - - - 90 90 - - - - - 102 102 - - - - - 97 97Operations Management - - - - 11 - 11 - - - - 12 - 12 - - - - 14 - 14Philosophy 43 - - - - - 43 43 - - - - - 43 29 - - - - - 29Physics - 16 - - - - 16 - 15 - - - - 15 - 15 - - - - 15Political Science 136 - - - - - 136 119 - - - - - 119 116 - - - - - 116Psychology 118 49 - - - - 167 94 55 - - - - 149 89 63 - - - - 152Russian 1 - - - - - 1 - - - - - - 0 - - - - - - 0Secondary Education - - 17 1 - - 18 - - 27 1 - - 28 - - 33 1 - - 34Slavic Studies - - - - - - 0 - - - - - - 0 1 - - - - - 1Sociology 70 - - - - - 70 68 - - - - - 68 36 - - - - - 36Studio Art 8 - - - - - 8 7 - - - - - 7 7 - - - - - 7Theatre 12 - - - - - 12 8 - - - - - 8 12 - - - - - 12Theology 17 - - - - - 17 15 - - - - - 15 12 - - - - - 12
Total1 1,175 330 188 3 468 90 2,254 1,164 354 161 1 445 102 2,227 1,045 390 194 2 531 97 2,259
A&S EdA&S Ed2015-2016
A&S Ed2013-2014 2014-2015
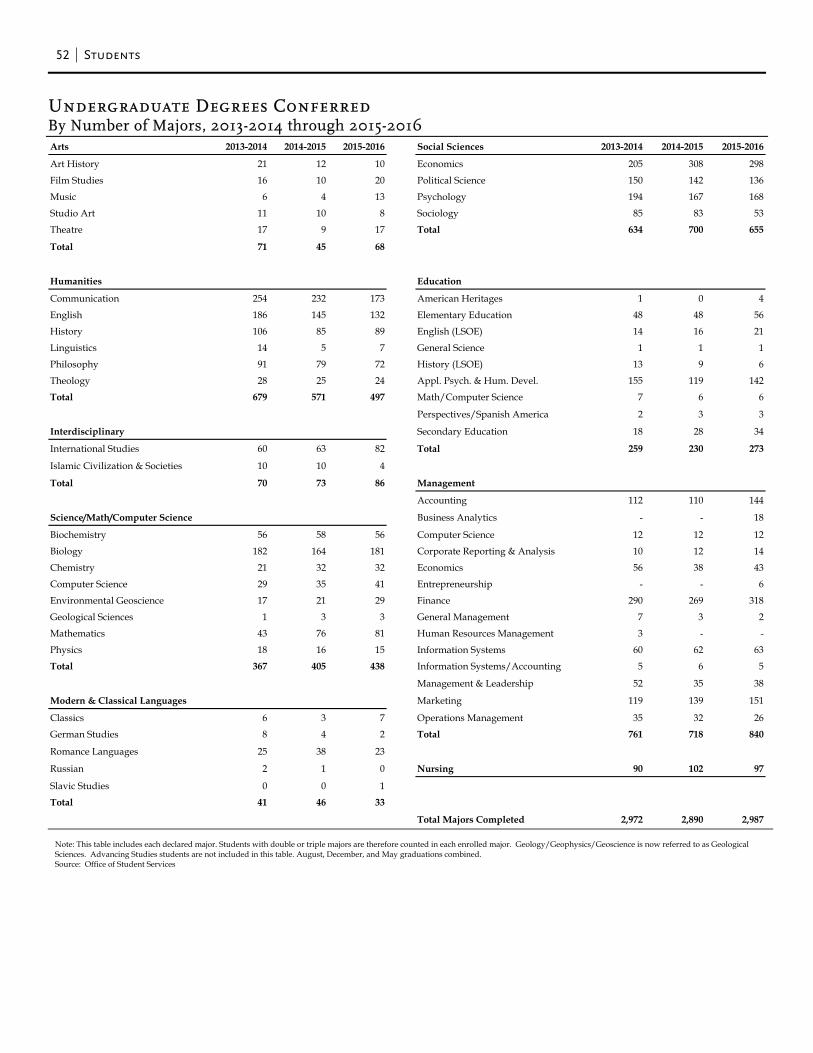
52 Students
Undergraduate Degrees Conferred By Number of Majors, 2013-2014 through 2015-2016
Arts 2013-2014 2014-2015 2015-2016 Social Sciences 2013-2014 2014-2015 2015-2016
Art History 21 12 10 Economics 205 308 298
Film Studies 16 10 20 Political Science 150 142 136
Music 6 4 13 Psychology 194 167 168
Studio Art 11 10 8 Sociology 85 83 53
Theatre 17 9 17 Total 634 700 655
Total 71 45 68
Humanities Education
Communication 254 232 173 American Heritages 1 0 4
English 186 145 132 Elementary Education 48 48 56
History 106 85 89 English (LSOE) 14 16 21
Linguistics 14 5 7 General Science 1 1 1
Philosophy 91 79 72 History (LSOE) 13 9 6
Theology 28 25 24 Appl. Psych. & Hum. Devel. 155 119 142
Total 679 571 497 Math/Computer Science 7 6 6
Perspectives/Spanish America 2 3 3
Interdisciplinary Secondary Education 18 28 34
International Studies 60 63 82 Total 259 230 273
Islamic Civilization & Societies 10 10 4
Total 70 73 86 Management
Accounting 112 110 144
Science/Math/Computer Science Business Analytics - - 18
Biochemistry 56 58 56 Computer Science 12 12 12
Biology 182 164 181 Corporate Reporting & Analysis 10 12 14
Chemistry 21 32 32 Economics 56 38 43
Computer Science 29 35 41 Entrepreneurship - - 6
Environmental Geoscience 17 21 29 Finance 290 269 318
Geological Sciences 1 3 3 General Management 7 3 2
Mathematics 43 76 81 Human Resources Management 3 - -
Physics 18 16 15 Information Systems 60 62 63
Total 367 405 438 Information Systems/Accounting 5 6 5
Management & Leadership 52 35 38
Modern & Classical Languages Marketing 119 139 151
Classics 6 3 7 Operations Management 35 32 26
German Studies 8 4 2 Total 761 718 840
Romance Languages 25 38 23
Russian 2 1 0 Nursing 90 102 97
Slavic Studies 0 0 1
Total 41 46 33
Total Majors Completed 2,972 2,890 2,987 Note: This table includes each declared major. Students with double or triple majors are therefore counted in each enrolled major. Geology/Geophysics/Geoscience is now referred to as Geological Sciences. Advancing Studies students are not included in this table. August, December, and May graduations combined. Source: Office of Student Services
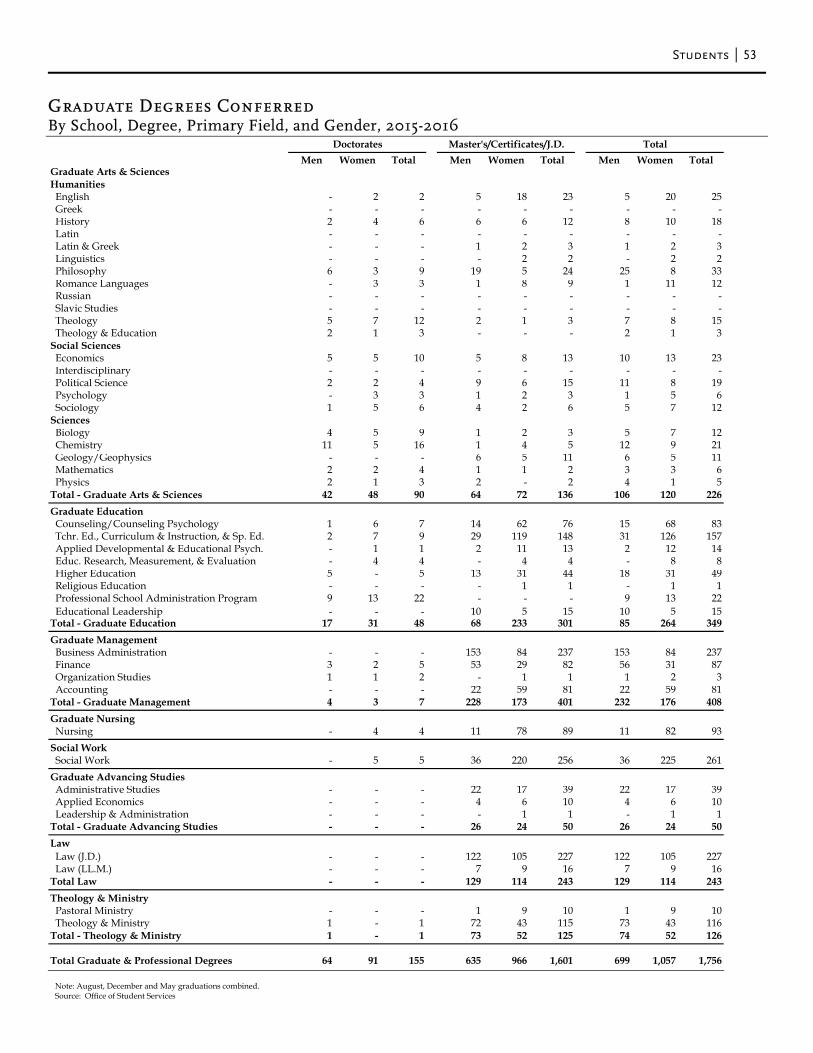
Students 53
Graduate Degrees Conferred By School, Degree, Primary Field, and Gender, 2015-2016
Note: August, December and May graduations combined. Source: Office of Student Services
Men Women Total Men Women Total Men Women TotalGraduate Arts & SciencesHumanities English - 2 2 5 18 23 5 20 25 Greek - - - - - - - - - History 2 4 6 6 6 12 8 10 18 Latin - - - - - - - - - Latin & Greek - - - 1 2 3 1 2 3 Linguistics - - - - 2 2 - 2 2 Philosophy 6 3 9 19 5 24 25 8 33 Romance Languages - 3 3 1 8 9 1 11 12 Russian - - - - - - - - - Slavic Studies - - - - - - - - - Theology 5 7 12 2 1 3 7 8 15 Theology & Education 2 1 3 - - - 2 1 3Social Sciences Economics 5 5 10 5 8 13 10 13 23 Interdisciplinary - - - - - - - - - Political Science 2 2 4 9 6 15 11 8 19 Psychology - 3 3 1 2 3 1 5 6 Sociology 1 5 6 4 2 6 5 7 12Sciences Biology 4 5 9 1 2 3 5 7 12 Chemistry 11 5 16 1 4 5 12 9 21 Geology/Geophysics - - - 6 5 11 6 5 11 Mathematics 2 2 4 1 1 2 3 3 6 Physics 2 1 3 2 - 2 4 1 5Total - Graduate Arts & Sciences 42 48 90 64 72 136 106 120 226 Graduate Education Counseling/Counseling Psychology 1 6 7 14 62 76 15 68 83 Tchr. Ed., Curriculum & Instruction, & Sp. Ed. 2 7 9 29 119 148 31 126 157 Applied Developmental & Educational Psych. - 1 1 2 11 13 2 12 14 Educ. Research, Measurement, & Evaluation - 4 4 - 4 4 - 8 8 Higher Education 5 - 5 13 31 44 18 31 49 Religious Education - - - - 1 1 - 1 1 Professional School Administration Program 9 13 22 - - - 9 13 22 Educational Leadership - - - 10 5 15 10 5 15Total - Graduate Education 17 31 48 68 233 301 85 264 349 Graduate Management Business Administration - - - 153 84 237 153 84 237 Finance 3 2 5 53 29 82 56 31 87 Organization Studies 1 1 2 - 1 1 1 2 3 Accounting - - - 22 59 81 22 59 81Total - Graduate Management 4 3 7 228 173 401 232 176 408 Graduate Nursing Nursing - 4 4 11 78 89 11 82 93 Social Work Social Work - 5 5 36 220 256 36 225 261 Graduate Advancing Studies Administrative Studies - - - 22 17 39 22 17 39 Applied Economics - - - 4 6 10 4 6 10 Leadership & Administration - - - - 1 1 - 1 1Total - Graduate Advancing Studies - - - 26 24 50 26 24 50 Law Law (J.D.) - - - 122 105 227 122 105 227 Law (LL.M.) - - - 7 9 16 7 9 16Total Law - - - 129 114 243 129 114 243 Theology & Ministry Pastoral Ministry - - - 1 9 10 1 9 10 Theology & Ministry 1 - 1 72 43 115 73 43 116Total - Theology & Ministry 1 - 1 73 52 125 74 52 126
Total Graduate & Professional Degrees 64 91 155 635 966 1,601 699 1,057 1,756
Doctorates Master's/Certificates/J.D. Total
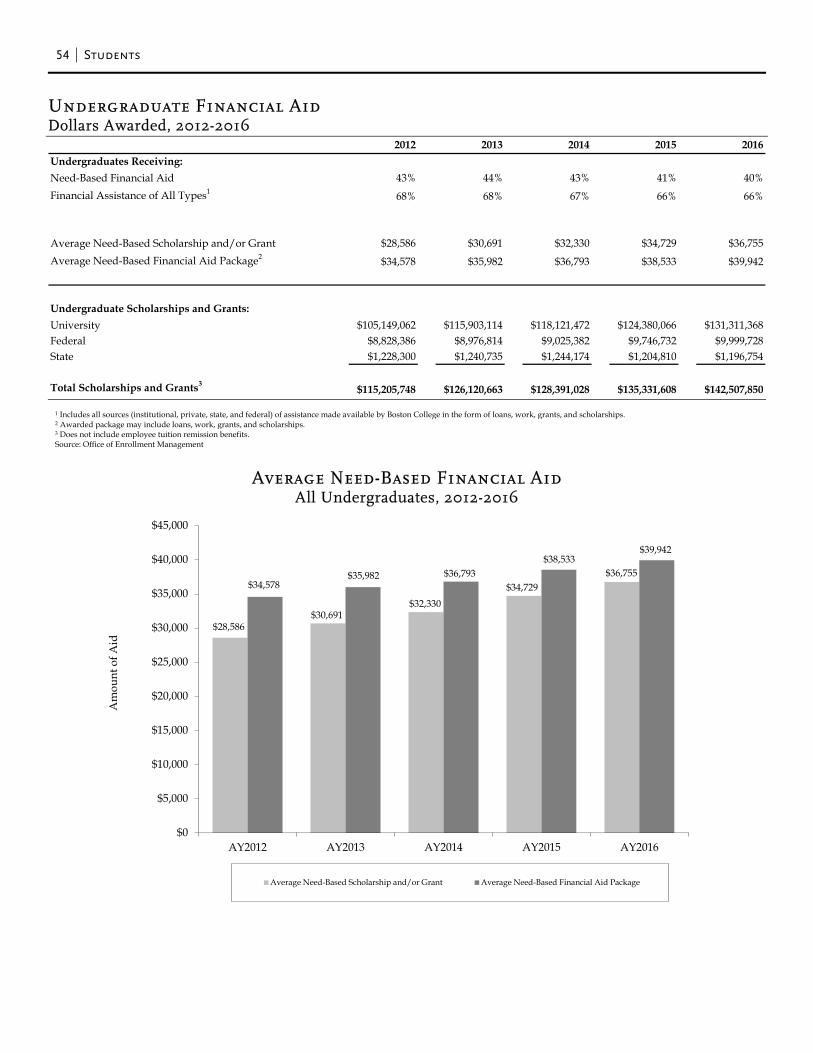
54 Students
Undergraduate Financial Aid Dollars Awarded, 2012-2016
1 Includes all sources (institutional, private, state, and federal) of assistance made available by Boston College in the form of loans, work, grants, and scholarships. 2 Awarded package may include loans, work, grants, and scholarships. 3 Does not include employee tuition remission benefits. Source: Office of Enrollment Management
Average Need-Based Financial Aid
All Undergraduates, 2012-2016
2012 2013 2014 2015 2016Undergraduates Receiving:Need-Based Financial Aid 43% 44% 43% 41% 40%Financial Assistance of All Types1 68% 68% 67% 66% 66%
Average Need-Based Scholarship and/or Grant $28,586 $30,691 $32,330 $34,729 $36,755Average Need-Based Financial Aid Package2 $34,578 $35,982 $36,793 $38,533 $39,942
Undergraduate Scholarships and Grants:University $105,149,062 $115,903,114 $118,121,472 $124,380,066 $131,311,368Federal $8,828,386 $8,976,814 $9,025,382 $9,746,732 $9,999,728State $1,228,300 $1,240,735 $1,244,174 $1,204,810 $1,196,754
Total Scholarships and Grants3 $115,205,748 $126,120,663 $128,391,028 $135,331,608 $142,507,850
$28,586$30,691
$32,330$34,729
$36,755$34,578
$35,982 $36,793$38,533
$39,942
$0
$5,000
$10,000
$15,000
$20,000
$25,000
$30,000
$35,000
$40,000
$45,000
AY2012 AY2013 AY2014 AY2015 AY2016
Am
ount
of A
id
Average Need-Based Scholarship and/or Grant Average Need-Based Financial Aid Package
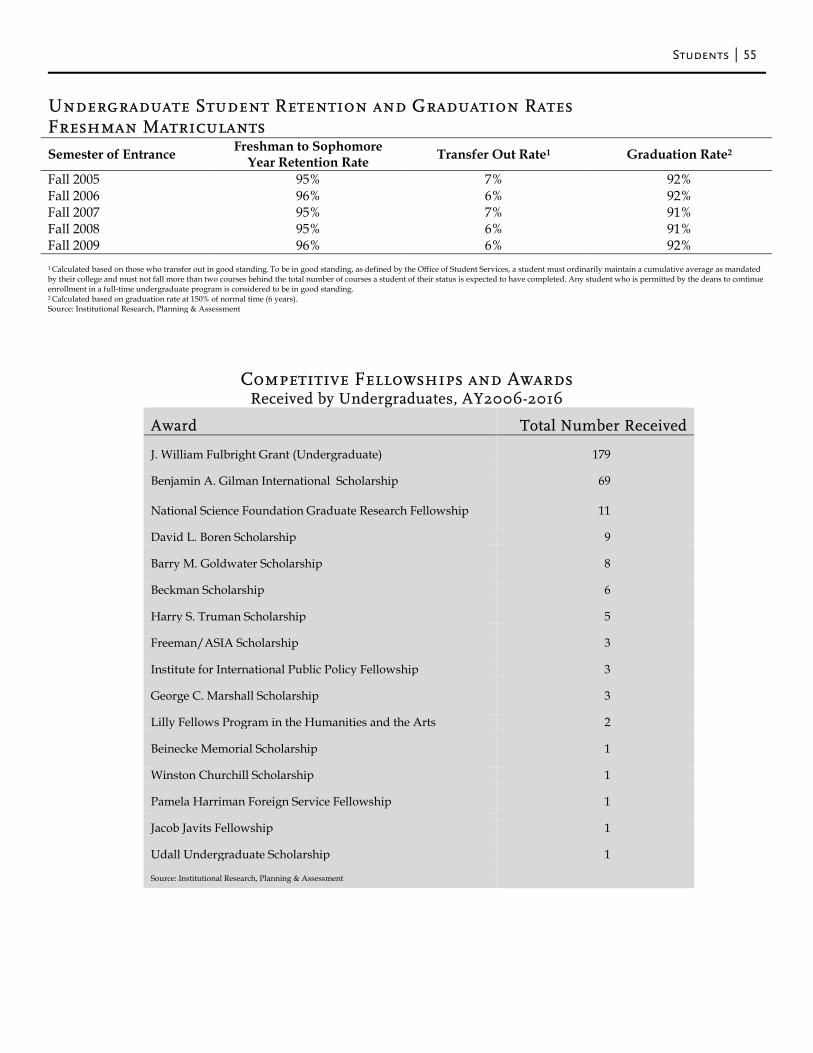
Students 55
Undergraduate Student Retention and Graduation Rates Freshman Matriculants Semester of Entrance Freshman to Sophomore
Year Retention Rate Transfer Out Rate1 Graduation Rate2
Fall 2005 95% 7% 92% Fall 2006 96% 6% 92% Fall 2007 95% 7% 91% Fall 2008 95% 6% 91% Fall 2009 96% 6% 92%
1 Calculated based on those who transfer out in good standing. To be in good standing, as defined by the Office of Student Services, a student must ordinarily maintain a cumulative average as mandated by their college and must not fall more than two courses behind the total number of courses a student of their status is expected to have completed. Any student who is permitted by the deans to continue enrollment in a full-time undergraduate program is considered to be in good standing. 2 Calculated based on graduation rate at 150% of normal time (6 years). Source: Institutional Research, Planning & Assessment
Competitive Fellowships and Awards Received by Undergraduates, AY2006-2016
Award
Total Number Received J. William Fulbright Grant (Undergraduate) 179 Benjamin A. Gilman International Scholarship 69 National Science Foundation Graduate Research Fellowship 11 David L. Boren Scholarship 9 Barry M. Goldwater Scholarship 8 Beckman Scholarship 6 Harry S. Truman Scholarship 5 Freeman/ASIA Scholarship 3 Institute for International Public Policy Fellowship 3 George C. Marshall Scholarship 3 Lilly Fellows Program in the Humanities and the Arts 2 Beinecke Memorial Scholarship 1 Winston Churchill Scholarship 1 Pamela Harriman Foreign Service Fellowship 1 Jacob Javits Fellowship 1 Udall Undergraduate Scholarship 1 Source: Institutional Research, Planning & Assessment


Alumni & Advancement
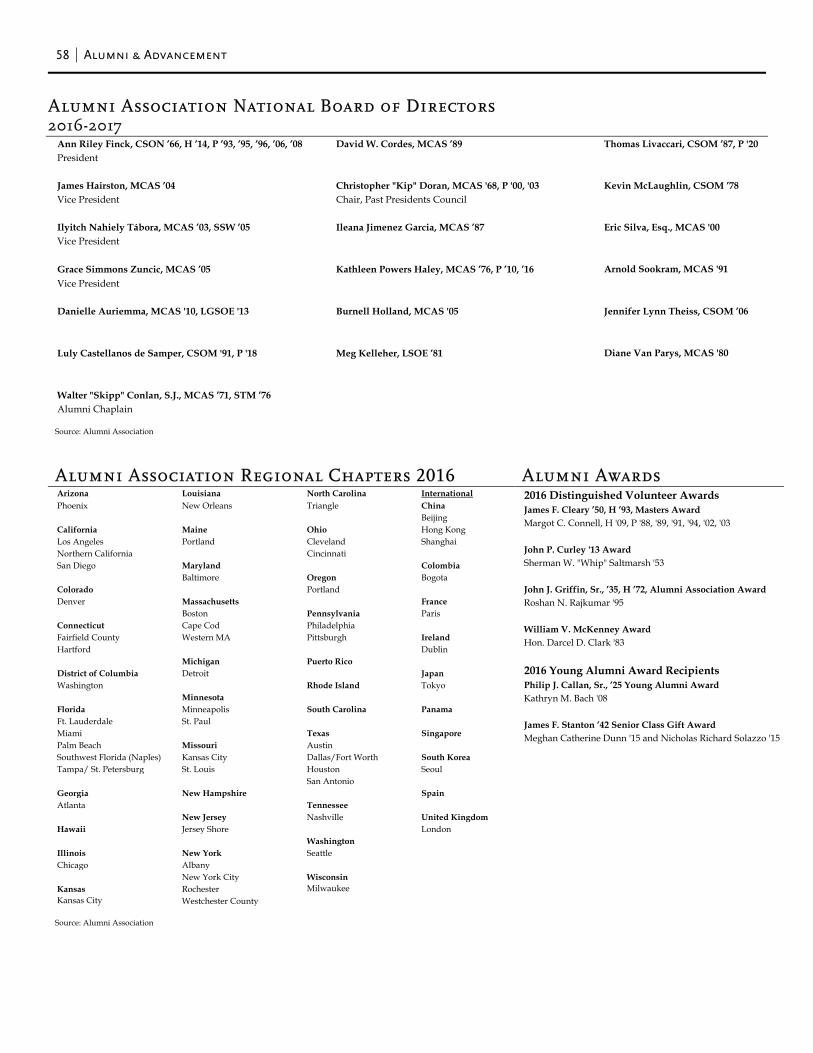
58 Alumni & Advancement
Alumni Association National Board of Directors 2016-2017
Source: Alumni Association
Alumni Association Regional Chapters 2016 Alumni Awards
Source: Alumni Association
Ann Riley Finck, CSON ’66, H ’14, P ’93, ’95, ’96, ’06, ’08 David W. Cordes, MCAS ’89 Thomas Livaccari, CSOM ’87, P '20President
James Hairston, MCAS ’04 Christopher "Kip" Doran, MCAS '68, P '00, '03 Kevin McLaughlin, CSOM ’78Vice President Chair, Past Presidents Council
Ilyitch Nahiely Tábora, MCAS ’03, SSW ’05 Ileana Jimenez Garcia, MCAS ’87 Eric Silva, Esq., MCAS '00Vice President
Grace Simmons Zuncic, MCAS ’05 Kathleen Powers Haley, MCAS ’76, P ’10, ’16 Arnold Sookram, MCAS '91Vice President
Danielle Auriemma, MCAS '10, LGSOE '13 Burnell Holland, MCAS '05 Jennifer Lynn Theiss, CSOM ’06
Luly Castellanos de Samper, CSOM '91, P '18 Meg Kelleher, LSOE ’81 Diane Van Parys, MCAS '80
Walter "Skipp" Conlan, S.J., MCAS ’71, STM ’76Alumni Chaplain
Arizona Louisiana North Carolina InternationalPhoenix New Orleans Triangle China
BeijingCalifornia Maine Ohio Hong KongLos Angeles Portland Cleveland ShanghaiNorthern California CincinnatiSan Diego Maryland Colombia
Baltimore Oregon BogotaColorado PortlandDenver Massachusetts France
Boston Pennsylvania ParisConnecticut Cape Cod PhiladelphiaFairfield County Western MA Pittsburgh IrelandHartford Dublin
Michigan Puerto RicoDistrict of Columbia Detroit JapanWashington Rhode Island Tokyo
MinnesotaFlorida Minneapolis South Carolina PanamaFt. Lauderdale St. PaulMiami Texas SingaporePalm Beach Missouri AustinSouthwest Florida (Naples) Kansas City Dallas/Fort Worth South KoreaTampa/ St. Petersburg St. Louis Houston Seoul
San AntonioGeorgia New Hampshire SpainAtlanta Tennessee
New Jersey Nashville United KingdomHawaii Jersey Shore London
WashingtonIllinois New York SeattleChicago Albany
New York City WisconsinKansas Rochester MilwaukeeKansas City Westchester County
2016 Distinguished Volunteer AwardsJames F. Cleary ’50, H ’93, Masters AwardMargot C. Connell, H '09, P '88, '89, '91, '94, '02, '03
John P. Curley '13 AwardSherman W. "Whip" Saltmarsh '53
John J. Griffin, Sr., ’35, H ’72, Alumni Association AwardRoshan N. Rajkumar '95
William V. McKenney AwardHon. Darcel D. Clark '83
2016 Young Alumni Award RecipientsPhilip J. Callan, Sr., ’25 Young Alumni AwardKathryn M. Bach '08
James F. Stanton ’42 Senior Class Gift AwardMeghan Catherine Dunn '15 and Nicholas Richard Solazzo '15
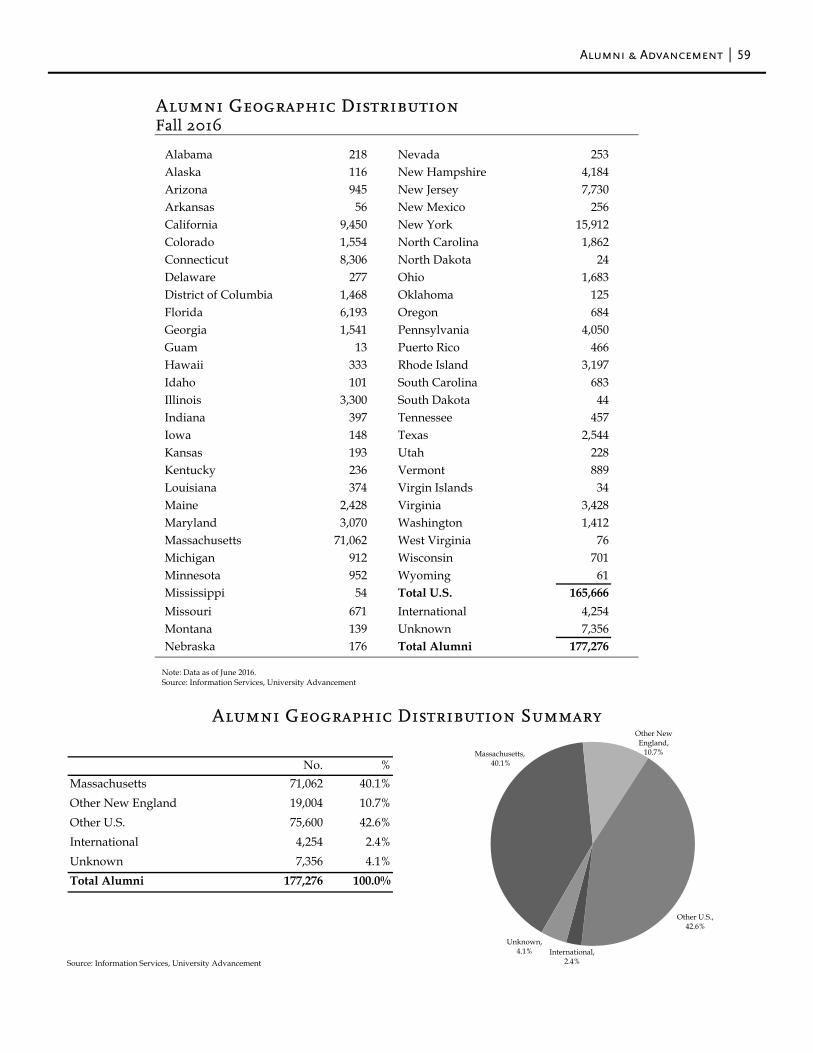
Alumni & Advancement 59
Alumni Geographic Distribution Fall 2016
Note: Data as of June 2016. Source: Information Services, University Advancement
Alumni Geographic Distribution Summary
Source: Information Services, University Advancement
Alabama 218 Nevada 253Alaska 116 New Hampshire 4,184Arizona 945 New Jersey 7,730Arkansas 56 New Mexico 256California 9,450 New York 15,912Colorado 1,554 North Carolina 1,862Connecticut 8,306 North Dakota 24Delaware 277 Ohio 1,683District of Columbia 1,468 Oklahoma 125Florida 6,193 Oregon 684Georgia 1,541 Pennsylvania 4,050Guam 13 Puerto Rico 466Hawaii 333 Rhode Island 3,197Idaho 101 South Carolina 683Illinois 3,300 South Dakota 44Indiana 397 Tennessee 457Iowa 148 Texas 2,544Kansas 193 Utah 228Kentucky 236 Vermont 889Louisiana 374 Virgin Islands 34Maine 2,428 Virginia 3,428Maryland 3,070 Washington 1,412Massachusetts 71,062 West Virginia 76Michigan 912 Wisconsin 701Minnesota 952 Wyoming 61Mississippi 54 Total U.S. 165,666Missouri 671 International 4,254Montana 139 Unknown 7,356Nebraska 176 Total Alumni 177,276
Other New England,
10.7%
Other U.S., 42.6%
International, 2.4%
Unknown, 4.1%
Massachusetts, 40.1%No. %
Massachusetts 71,062 40.1%Other New England 19,004 10.7%Other U.S. 75,600 42.6%International 4,254 2.4%Unknown 7,356 4.1%Total Alumni 177,276 100.0%
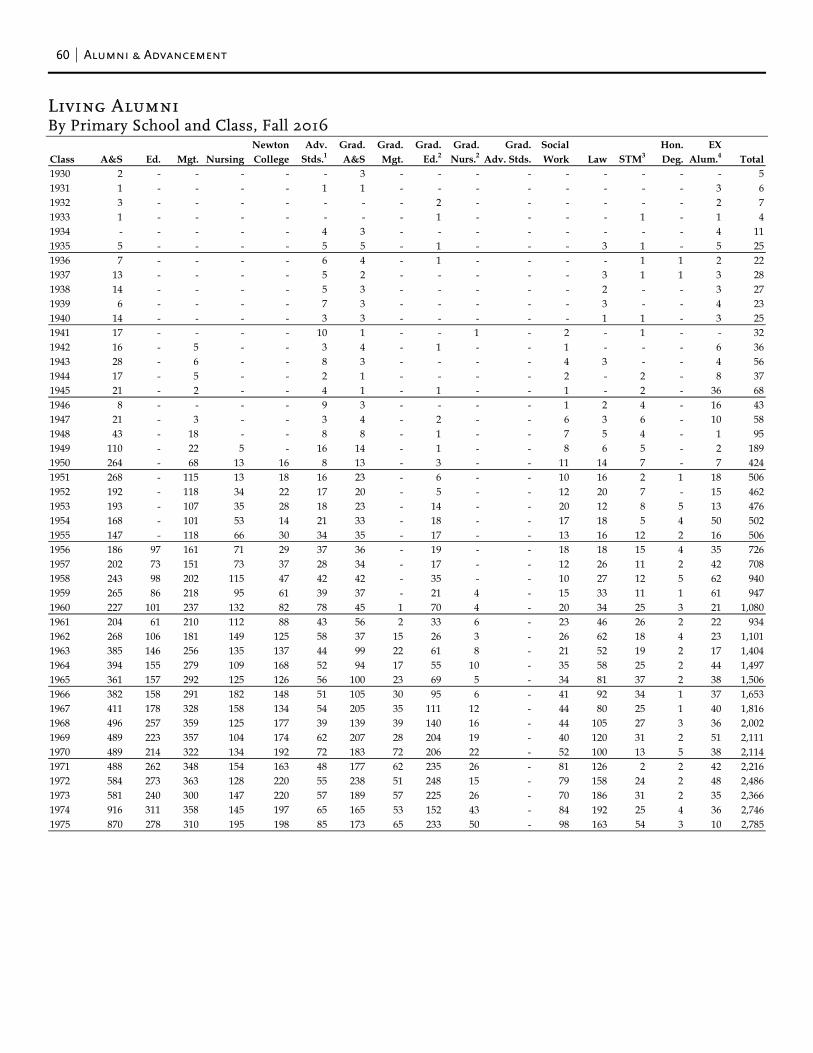
60 Alumni & Advancement
Living Alumni By Primary School and Class, Fall 2016
Newton Adv. Grad. Grad. Grad. Grad. Grad. Social Hon. EXClass A&S Ed. Mgt. Nursing College Stds.1 A&S Mgt. Ed.2 Nurs.2 Adv. Stds. Work Law STM3 Deg. Alum.4 Total1930 2 - - - - - 3 - - - - - - - - - 51931 1 - - - - 1 1 - - - - - - - - 3 61932 3 - - - - - - - 2 - - - - - - 2 71933 1 - - - - - - - 1 - - - - 1 - 1 41934 - - - - - 4 3 - - - - - - - - 4 111935 5 - - - - 5 5 - 1 - - - 3 1 - 5 251936 7 - - - - 6 4 - 1 - - - - 1 1 2 221937 13 - - - - 5 2 - - - - - 3 1 1 3 281938 14 - - - - 5 3 - - - - - 2 - - 3 271939 6 - - - - 7 3 - - - - - 3 - - 4 231940 14 - - - - 3 3 - - - - - 1 1 - 3 251941 17 - - - - 10 1 - - 1 - 2 - 1 - - 321942 16 - 5 - - 3 4 - 1 - - 1 - - - 6 361943 28 - 6 - - 8 3 - - - - 4 3 - - 4 561944 17 - 5 - - 2 1 - - - - 2 - 2 - 8 371945 21 - 2 - - 4 1 - 1 - - 1 - 2 - 36 681946 8 - - - - 9 3 - - - - 1 2 4 - 16 431947 21 - 3 - - 3 4 - 2 - - 6 3 6 - 10 581948 43 - 18 - - 8 8 - 1 - - 7 5 4 - 1 951949 110 - 22 5 - 16 14 - 1 - - 8 6 5 - 2 1891950 264 - 68 13 16 8 13 - 3 - - 11 14 7 - 7 4241951 268 - 115 13 18 16 23 - 6 - - 10 16 2 1 18 5061952 192 - 118 34 22 17 20 - 5 - - 12 20 7 - 15 4621953 193 - 107 35 28 18 23 - 14 - - 20 12 8 5 13 4761954 168 - 101 53 14 21 33 - 18 - - 17 18 5 4 50 5021955 147 - 118 66 30 34 35 - 17 - - 13 16 12 2 16 5061956 186 97 161 71 29 37 36 - 19 - - 18 18 15 4 35 7261957 202 73 151 73 37 28 34 - 17 - - 12 26 11 2 42 7081958 243 98 202 115 47 42 42 - 35 - - 10 27 12 5 62 9401959 265 86 218 95 61 39 37 - 21 4 - 15 33 11 1 61 9471960 227 101 237 132 82 78 45 1 70 4 - 20 34 25 3 21 1,0801961 204 61 210 112 88 43 56 2 33 6 - 23 46 26 2 22 9341962 268 106 181 149 125 58 37 15 26 3 - 26 62 18 4 23 1,1011963 385 146 256 135 137 44 99 22 61 8 - 21 52 19 2 17 1,4041964 394 155 279 109 168 52 94 17 55 10 - 35 58 25 2 44 1,4971965 361 157 292 125 126 56 100 23 69 5 - 34 81 37 2 38 1,5061966 382 158 291 182 148 51 105 30 95 6 - 41 92 34 1 37 1,6531967 411 178 328 158 134 54 205 35 111 12 - 44 80 25 1 40 1,8161968 496 257 359 125 177 39 139 39 140 16 - 44 105 27 3 36 2,0021969 489 223 357 104 174 62 207 28 204 19 - 40 120 31 2 51 2,1111970 489 214 322 134 192 72 183 72 206 22 - 52 100 13 5 38 2,1141971 488 262 348 154 163 48 177 62 235 26 - 81 126 2 2 42 2,2161972 584 273 363 128 220 55 238 51 248 15 - 79 158 24 2 48 2,4861973 581 240 300 147 220 57 189 57 225 26 - 70 186 31 2 35 2,3661974 916 311 358 145 197 65 165 53 152 43 - 84 192 25 4 36 2,7461975 870 278 310 195 198 85 173 65 233 50 - 98 163 54 3 10 2,785
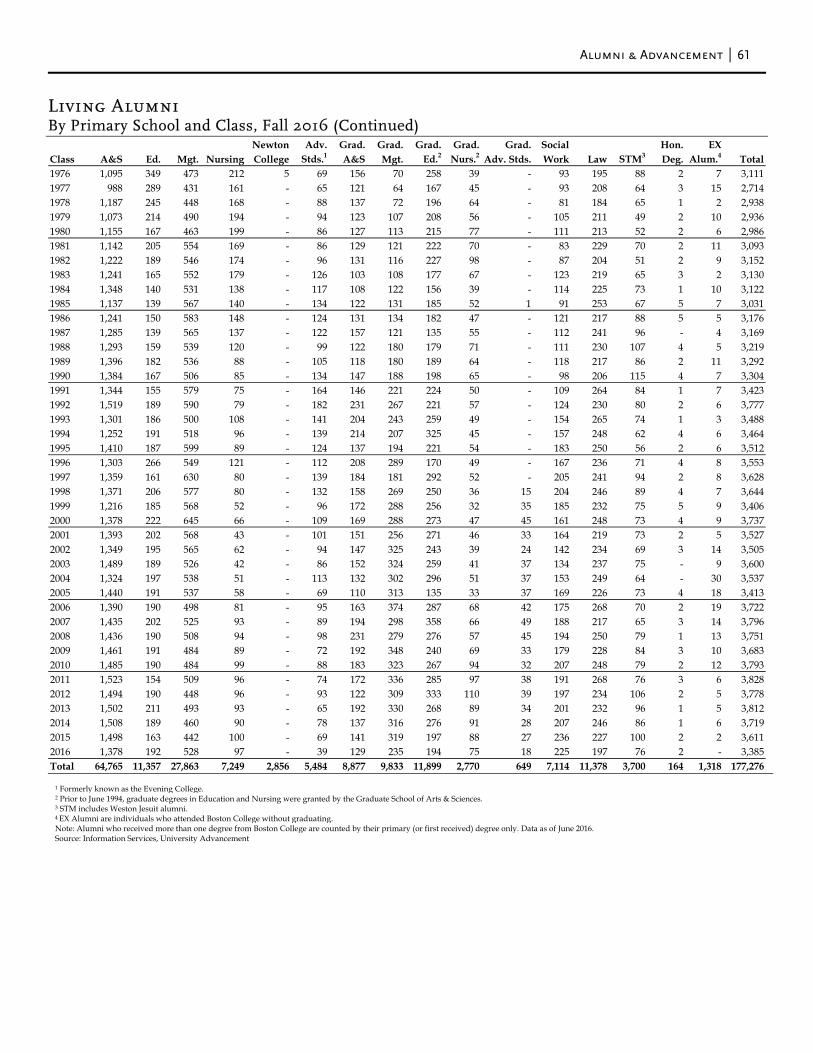
Alumni & Advancement 61
Living Alumni By Primary School and Class, Fall 2016 (Continued)
1 Formerly known as the Evening College. 2 Prior to June 1994, graduate degrees in Education and Nursing were granted by the Graduate School of Arts & Sciences. 3 STM includes Weston Jesuit alumni. 4 EX Alumni are individuals who attended Boston College without graduating. Note: Alumni who received more than one degree from Boston College are counted by their primary (or first received) degree only. Data as of June 2016. Source: Information Services, University Advancement
Newton Adv. Grad. Grad. Grad. Grad. Grad. Social Hon. EXClass A&S Ed. Mgt. Nursing College Stds.1 A&S Mgt. Ed.2 Nurs.2 Adv. Stds. Work Law STM3 Deg. Alum.4 Total1976 1,095 349 473 212 5 69 156 70 258 39 - 93 195 88 2 7 3,1111977 988 289 431 161 - 65 121 64 167 45 - 93 208 64 3 15 2,7141978 1,187 245 448 168 - 88 137 72 196 64 - 81 184 65 1 2 2,9381979 1,073 214 490 194 - 94 123 107 208 56 - 105 211 49 2 10 2,9361980 1,155 167 463 199 - 86 127 113 215 77 - 111 213 52 2 6 2,9861981 1,142 205 554 169 - 86 129 121 222 70 - 83 229 70 2 11 3,0931982 1,222 189 546 174 - 96 131 116 227 98 - 87 204 51 2 9 3,1521983 1,241 165 552 179 - 126 103 108 177 67 - 123 219 65 3 2 3,1301984 1,348 140 531 138 - 117 108 122 156 39 - 114 225 73 1 10 3,1221985 1,137 139 567 140 - 134 122 131 185 52 1 91 253 67 5 7 3,0311986 1,241 150 583 148 - 124 131 134 182 47 - 121 217 88 5 5 3,1761987 1,285 139 565 137 - 122 157 121 135 55 - 112 241 96 - 4 3,1691988 1,293 159 539 120 - 99 122 180 179 71 - 111 230 107 4 5 3,2191989 1,396 182 536 88 - 105 118 180 189 64 - 118 217 86 2 11 3,2921990 1,384 167 506 85 - 134 147 188 198 65 - 98 206 115 4 7 3,3041991 1,344 155 579 75 - 164 146 221 224 50 - 109 264 84 1 7 3,4231992 1,519 189 590 79 - 182 231 267 221 57 - 124 230 80 2 6 3,7771993 1,301 186 500 108 - 141 204 243 259 49 - 154 265 74 1 3 3,4881994 1,252 191 518 96 - 139 214 207 325 45 - 157 248 62 4 6 3,4641995 1,410 187 599 89 - 124 137 194 221 54 - 183 250 56 2 6 3,5121996 1,303 266 549 121 - 112 208 289 170 49 - 167 236 71 4 8 3,5531997 1,359 161 630 80 - 139 184 181 292 52 - 205 241 94 2 8 3,6281998 1,371 206 577 80 - 132 158 269 250 36 15 204 246 89 4 7 3,6441999 1,216 185 568 52 - 96 172 288 256 32 35 185 232 75 5 9 3,4062000 1,378 222 645 66 - 109 169 288 273 47 45 161 248 73 4 9 3,7372001 1,393 202 568 43 - 101 151 256 271 46 33 164 219 73 2 5 3,5272002 1,349 195 565 62 - 94 147 325 243 39 24 142 234 69 3 14 3,5052003 1,489 189 526 42 - 86 152 324 259 41 37 134 237 75 - 9 3,6002004 1,324 197 538 51 - 113 132 302 296 51 37 153 249 64 - 30 3,5372005 1,440 191 537 58 - 69 110 313 135 33 37 169 226 73 4 18 3,4132006 1,390 190 498 81 - 95 163 374 287 68 42 175 268 70 2 19 3,7222007 1,435 202 525 93 - 89 194 298 358 66 49 188 217 65 3 14 3,7962008 1,436 190 508 94 - 98 231 279 276 57 45 194 250 79 1 13 3,7512009 1,461 191 484 89 - 72 192 348 240 69 33 179 228 84 3 10 3,6832010 1,485 190 484 99 - 88 183 323 267 94 32 207 248 79 2 12 3,7932011 1,523 154 509 96 - 74 172 336 285 97 38 191 268 76 3 6 3,8282012 1,494 190 448 96 - 93 122 309 333 110 39 197 234 106 2 5 3,7782013 1,502 211 493 93 - 65 192 330 268 89 34 201 232 96 1 5 3,8122014 1,508 189 460 90 - 78 137 316 276 91 28 207 246 86 1 6 3,7192015 1,498 163 442 100 - 69 141 319 197 88 27 236 227 100 2 2 3,6112016 1,378 192 528 97 - 39 129 235 194 75 18 225 197 76 2 - 3,385Total 64,765 11,357 27,863 7,249 2,856 5,484 8,877 9,833 11,899 2,770 649 7,114 11,378 3,700 164 1,318 177,276
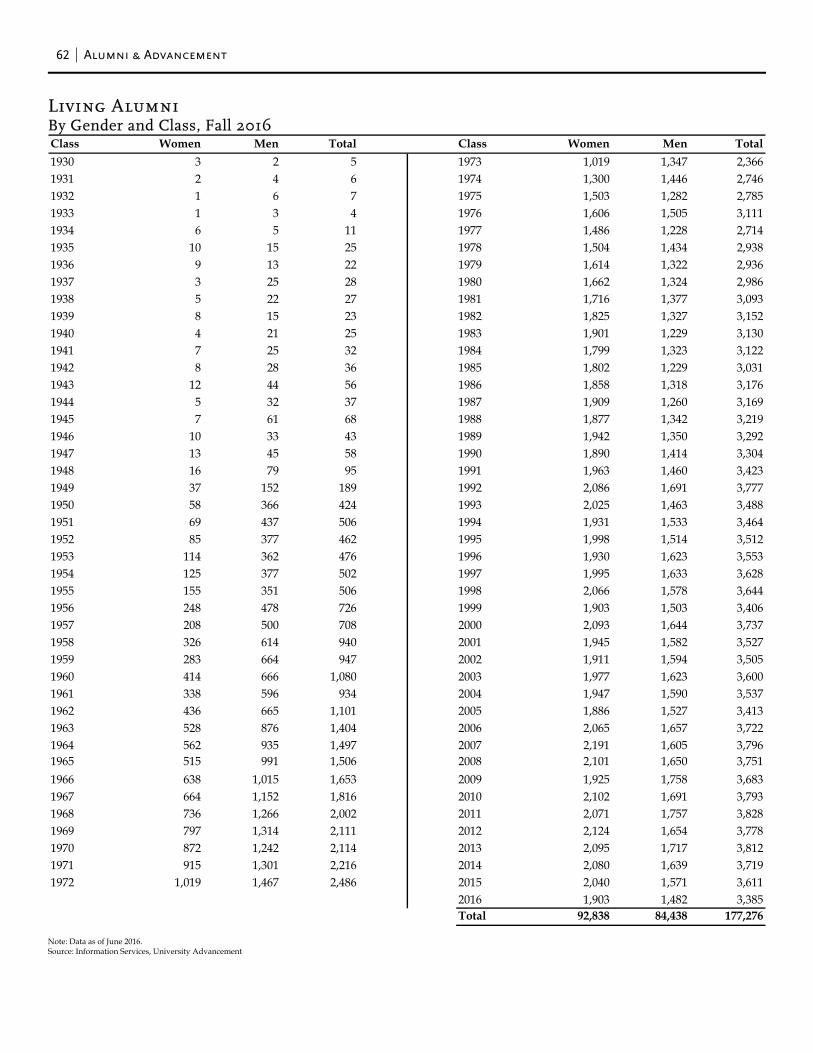
62 Alumni & Advancement
Living Alumni By Gender and Class, Fall 2016
Note: Data as of June 2016. Source: Information Services, University Advancement
Class Women Men Total Class Women Men Total1930 3 2 5 1973 1,019 1,347 2,3661931 2 4 6 1974 1,300 1,446 2,7461932 1 6 7 1975 1,503 1,282 2,7851933 1 3 4 1976 1,606 1,505 3,1111934 6 5 11 1977 1,486 1,228 2,7141935 10 15 25 1978 1,504 1,434 2,9381936 9 13 22 1979 1,614 1,322 2,9361937 3 25 28 1980 1,662 1,324 2,9861938 5 22 27 1981 1,716 1,377 3,0931939 8 15 23 1982 1,825 1,327 3,1521940 4 21 25 1983 1,901 1,229 3,1301941 7 25 32 1984 1,799 1,323 3,1221942 8 28 36 1985 1,802 1,229 3,0311943 12 44 56 1986 1,858 1,318 3,1761944 5 32 37 1987 1,909 1,260 3,1691945 7 61 68 1988 1,877 1,342 3,2191946 10 33 43 1989 1,942 1,350 3,2921947 13 45 58 1990 1,890 1,414 3,3041948 16 79 95 1991 1,963 1,460 3,4231949 37 152 189 1992 2,086 1,691 3,7771950 58 366 424 1993 2,025 1,463 3,4881951 69 437 506 1994 1,931 1,533 3,4641952 85 377 462 1995 1,998 1,514 3,5121953 114 362 476 1996 1,930 1,623 3,5531954 125 377 502 1997 1,995 1,633 3,6281955 155 351 506 1998 2,066 1,578 3,6441956 248 478 726 1999 1,903 1,503 3,4061957 208 500 708 2000 2,093 1,644 3,7371958 326 614 940 2001 1,945 1,582 3,5271959 283 664 947 2002 1,911 1,594 3,5051960 414 666 1,080 2003 1,977 1,623 3,6001961 338 596 934 2004 1,947 1,590 3,5371962 436 665 1,101 2005 1,886 1,527 3,4131963 528 876 1,404 2006 2,065 1,657 3,7221964 562 935 1,497 2007 2,191 1,605 3,7961965 515 991 1,506 2008 2,101 1,650 3,7511966 638 1,015 1,653 2009 1,925 1,758 3,6831967 664 1,152 1,816 2010 2,102 1,691 3,7931968 736 1,266 2,002 2011 2,071 1,757 3,8281969 797 1,314 2,111 2012 2,124 1,654 3,7781970 872 1,242 2,114 2013 2,095 1,717 3,8121971 915 1,301 2,216 2014 2,080 1,639 3,7191972 1,019 1,467 2,486 2015 2,040 1,571 3,611
2016 1,903 1,482 3,385Total 92,838 84,438 177,276
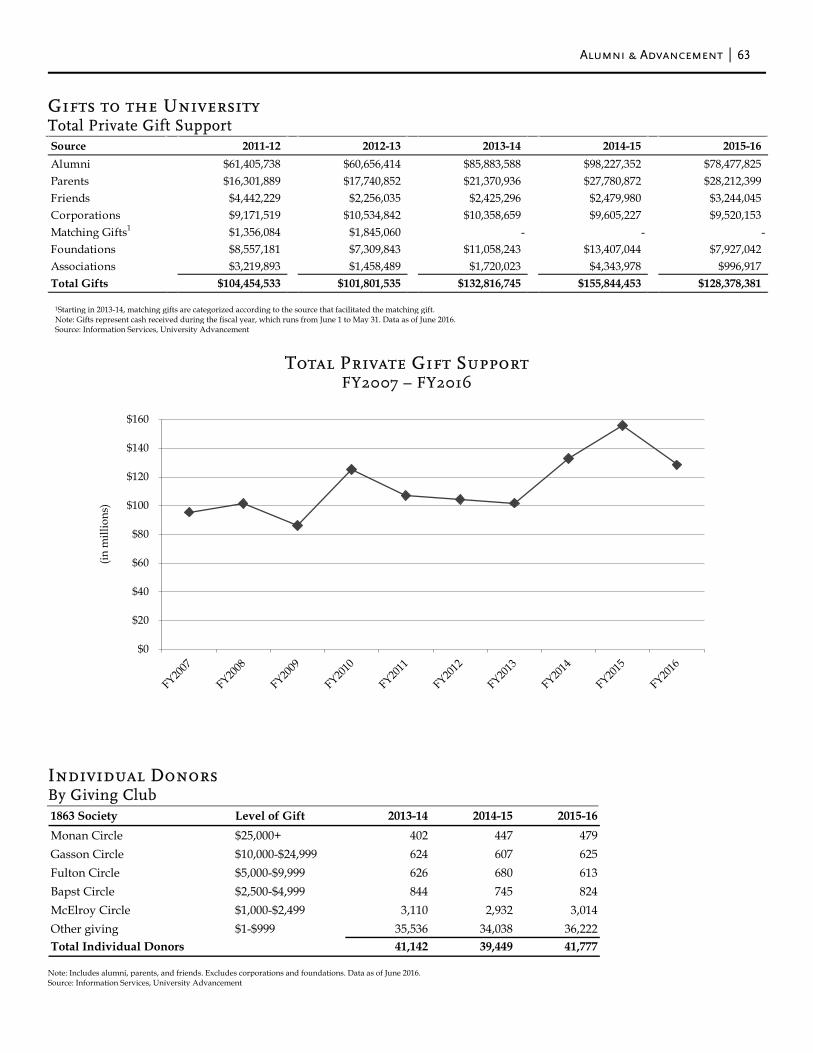
Alumni & Advancement 63
Gifts to the University Total Private Gift Support
1Starting in 2013-14, matching gifts are categorized according to the source that facilitated the matching gift. Note: Gifts represent cash received during the fiscal year, which runs from June 1 to May 31. Data as of June 2016. Source: Information Services, University Advancement
Total Private Gift Support
FY2007 – FY2016
Individual Donors By Giving Club
Note: Includes alumni, parents, and friends. Excludes corporations and foundations. Data as of June 2016. Source: Information Services, University Advancement
Source 2011-12 2012-13 2013-14 2014-15 2015-16Alumni $61,405,738 $60,656,414 $85,883,588 $98,227,352 $78,477,825Parents $16,301,889 $17,740,852 $21,370,936 $27,780,872 $28,212,399Friends $4,442,229 $2,256,035 $2,425,296 $2,479,980 $3,244,045Corporations $9,171,519 $10,534,842 $10,358,659 $9,605,227 $9,520,153Matching Gifts1 $1,356,084 $1,845,060 - - -Foundations $8,557,181 $7,309,843 $11,058,243 $13,407,044 $7,927,042Associations $3,219,893 $1,458,489 $1,720,023 $4,343,978 $996,917Total Gifts $104,454,533 $101,801,535 $132,816,745 $155,844,453 $128,378,381
$0
$20
$40
$60
$80
$100
$120
$140
$160
(in m
illio
ns)
1863 Society Level of Gift 2013-14 2014-15 2015-16Monan Circle $25,000+ 402 447 479Gasson Circle $10,000-$24,999 624 607 625Fulton Circle $5,000-$9,999 626 680 613Bapst Circle $2,500-$4,999 844 745 824McElroy Circle $1,000-$2,499 3,110 2,932 3,014Other giving $1-$999 35,536 34,038 36,222Total Individual Donors 41,142 39,449 41,777
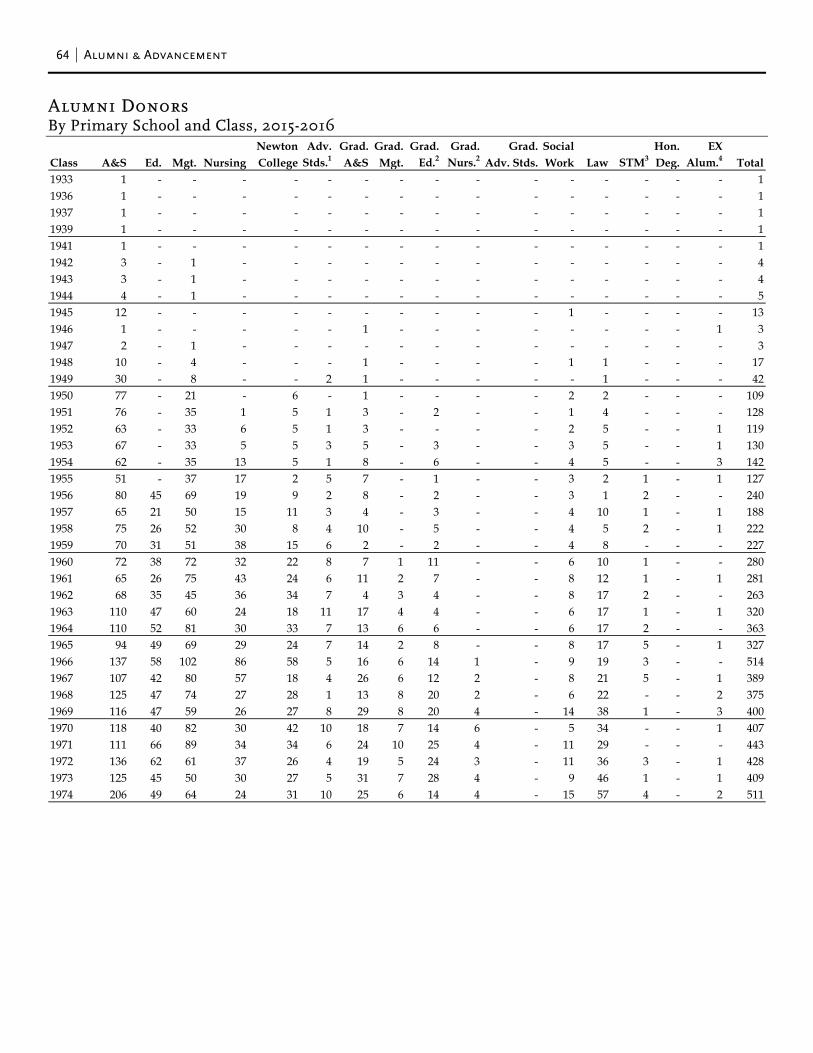
64 Alumni & Advancement
Alumni Donors By Primary School and Class, 2015-2016
Newton Adv. Grad. Grad. Grad. Grad. Grad. Social Hon. EXClass A&S Ed. Mgt. Nursing College Stds.1 A&S Mgt. Ed.2 Nurs.2 Adv. Stds. Work Law STM3 Deg. Alum.4 Total1933 1 - - - - - - - - - - - - - - - 11936 1 - - - - - - - - - - - - - - - 11937 1 - - - - - - - - - - - - - - - 11939 1 - - - - - - - - - - - - - - - 11941 1 - - - - - - - - - - - - - - - 11942 3 - 1 - - - - - - - - - - - - - 41943 3 - 1 - - - - - - - - - - - - - 41944 4 - 1 - - - - - - - - - - - - - 51945 12 - - - - - - - - - - 1 - - - - 131946 1 - - - - - 1 - - - - - - - - 1 31947 2 - 1 - - - - - - - - - - - - - 31948 10 - 4 - - - 1 - - - - 1 1 - - - 171949 30 - 8 - - 2 1 - - - - - 1 - - - 421950 77 - 21 - 6 - 1 - - - - 2 2 - - - 1091951 76 - 35 1 5 1 3 - 2 - - 1 4 - - - 1281952 63 - 33 6 5 1 3 - - - - 2 5 - - 1 1191953 67 - 33 5 5 3 5 - 3 - - 3 5 - - 1 1301954 62 - 35 13 5 1 8 - 6 - - 4 5 - - 3 1421955 51 - 37 17 2 5 7 - 1 - - 3 2 1 - 1 1271956 80 45 69 19 9 2 8 - 2 - - 3 1 2 - - 2401957 65 21 50 15 11 3 4 - 3 - - 4 10 1 - 1 1881958 75 26 52 30 8 4 10 - 5 - - 4 5 2 - 1 2221959 70 31 51 38 15 6 2 - 2 - - 4 8 - - - 2271960 72 38 72 32 22 8 7 1 11 - - 6 10 1 - - 2801961 65 26 75 43 24 6 11 2 7 - - 8 12 1 - 1 2811962 68 35 45 36 34 7 4 3 4 - - 8 17 2 - - 2631963 110 47 60 24 18 11 17 4 4 - - 6 17 1 - 1 3201964 110 52 81 30 33 7 13 6 6 - - 6 17 2 - - 3631965 94 49 69 29 24 7 14 2 8 - - 8 17 5 - 1 3271966 137 58 102 86 58 5 16 6 14 1 - 9 19 3 - - 5141967 107 42 80 57 18 4 26 6 12 2 - 8 21 5 - 1 3891968 125 47 74 27 28 1 13 8 20 2 - 6 22 - - 2 3751969 116 47 59 26 27 8 29 8 20 4 - 14 38 1 - 3 4001970 118 40 82 30 42 10 18 7 14 6 - 5 34 - - 1 4071971 111 66 89 34 34 6 24 10 25 4 - 11 29 - - - 4431972 136 62 61 37 26 4 19 5 24 3 - 11 36 3 - 1 4281973 125 45 50 30 27 5 31 7 28 4 - 9 46 1 - 1 4091974 206 49 64 24 31 10 25 6 14 4 - 15 57 4 - 2 511
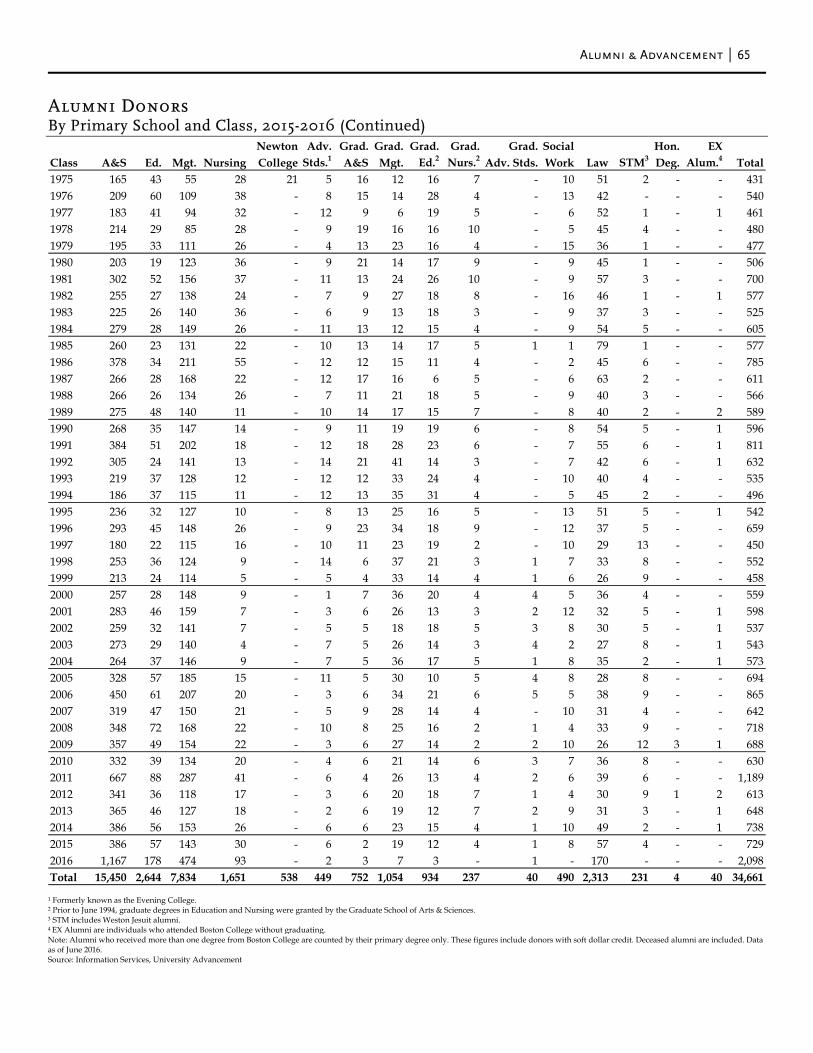
Alumni & Advancement 65
Alumni Donors By Primary School and Class, 2015-2016 (Continued)
1 Formerly known as the Evening College. 2 Prior to June 1994, graduate degrees in Education and Nursing were granted by the Graduate School of Arts & Sciences. 3 STM includes Weston Jesuit alumni. 4 EX Alumni are individuals who attended Boston College without graduating. Note: Alumni who received more than one degree from Boston College are counted by their primary degree only. These figures include donors with soft dollar credit. Deceased alumni are included. Data as of June 2016. Source: Information Services, University Advancement
Newton Adv. Grad. Grad. Grad. Grad. Grad. Social Hon. EXClass A&S Ed. Mgt. Nursing College Stds.1 A&S Mgt. Ed.2 Nurs.2 Adv. Stds. Work Law STM3 Deg. Alum.4 Total1975 165 43 55 28 21 5 16 12 16 7 - 10 51 2 - - 4311976 209 60 109 38 - 8 15 14 28 4 - 13 42 - - - 5401977 183 41 94 32 - 12 9 6 19 5 - 6 52 1 - 1 4611978 214 29 85 28 - 9 19 16 16 10 - 5 45 4 - - 4801979 195 33 111 26 - 4 13 23 16 4 - 15 36 1 - - 4771980 203 19 123 36 - 9 21 14 17 9 - 9 45 1 - - 5061981 302 52 156 37 - 11 13 24 26 10 - 9 57 3 - - 7001982 255 27 138 24 - 7 9 27 18 8 - 16 46 1 - 1 5771983 225 26 140 36 - 6 9 13 18 3 - 9 37 3 - - 5251984 279 28 149 26 - 11 13 12 15 4 - 9 54 5 - - 6051985 260 23 131 22 - 10 13 14 17 5 1 1 79 1 - - 5771986 378 34 211 55 - 12 12 15 11 4 - 2 45 6 - - 7851987 266 28 168 22 - 12 17 16 6 5 - 6 63 2 - - 6111988 266 26 134 26 - 7 11 21 18 5 - 9 40 3 - - 5661989 275 48 140 11 - 10 14 17 15 7 - 8 40 2 - 2 5891990 268 35 147 14 - 9 11 19 19 6 - 8 54 5 - 1 5961991 384 51 202 18 - 12 18 28 23 6 - 7 55 6 - 1 8111992 305 24 141 13 - 14 21 41 14 3 - 7 42 6 - 1 6321993 219 37 128 12 - 12 12 33 24 4 - 10 40 4 - - 5351994 186 37 115 11 - 12 13 35 31 4 - 5 45 2 - - 4961995 236 32 127 10 - 8 13 25 16 5 - 13 51 5 - 1 5421996 293 45 148 26 - 9 23 34 18 9 - 12 37 5 - - 6591997 180 22 115 16 - 10 11 23 19 2 - 10 29 13 - - 4501998 253 36 124 9 - 14 6 37 21 3 1 7 33 8 - - 5521999 213 24 114 5 - 5 4 33 14 4 1 6 26 9 - - 4582000 257 28 148 9 - 1 7 36 20 4 4 5 36 4 - - 5592001 283 46 159 7 - 3 6 26 13 3 2 12 32 5 - 1 5982002 259 32 141 7 - 5 5 18 18 5 3 8 30 5 - 1 5372003 273 29 140 4 - 7 5 26 14 3 4 2 27 8 - 1 5432004 264 37 146 9 - 7 5 36 17 5 1 8 35 2 - 1 5732005 328 57 185 15 - 11 5 30 10 5 4 8 28 8 - - 6942006 450 61 207 20 - 3 6 34 21 6 5 5 38 9 - - 8652007 319 47 150 21 - 5 9 28 14 4 - 10 31 4 - - 6422008 348 72 168 22 - 10 8 25 16 2 1 4 33 9 - - 7182009 357 49 154 22 - 3 6 27 14 2 2 10 26 12 3 1 6882010 332 39 134 20 - 4 6 21 14 6 3 7 36 8 - - 6302011 667 88 287 41 - 6 4 26 13 4 2 6 39 6 - - 1,1892012 341 36 118 17 - 3 6 20 18 7 1 4 30 9 1 2 6132013 365 46 127 18 - 2 6 19 12 7 2 9 31 3 - 1 6482014 386 56 153 26 - 6 6 23 15 4 1 10 49 2 - 1 7382015 386 57 143 30 - 6 2 19 12 4 1 8 57 4 - - 7292016 1,167 178 474 93 - 2 3 7 3 - 1 - 170 - - - 2,098Total 15,450 2,644 7,834 1,651 538 449 752 1,054 934 237 40 490 2,313 231 4 40 34,661


Physical Plant
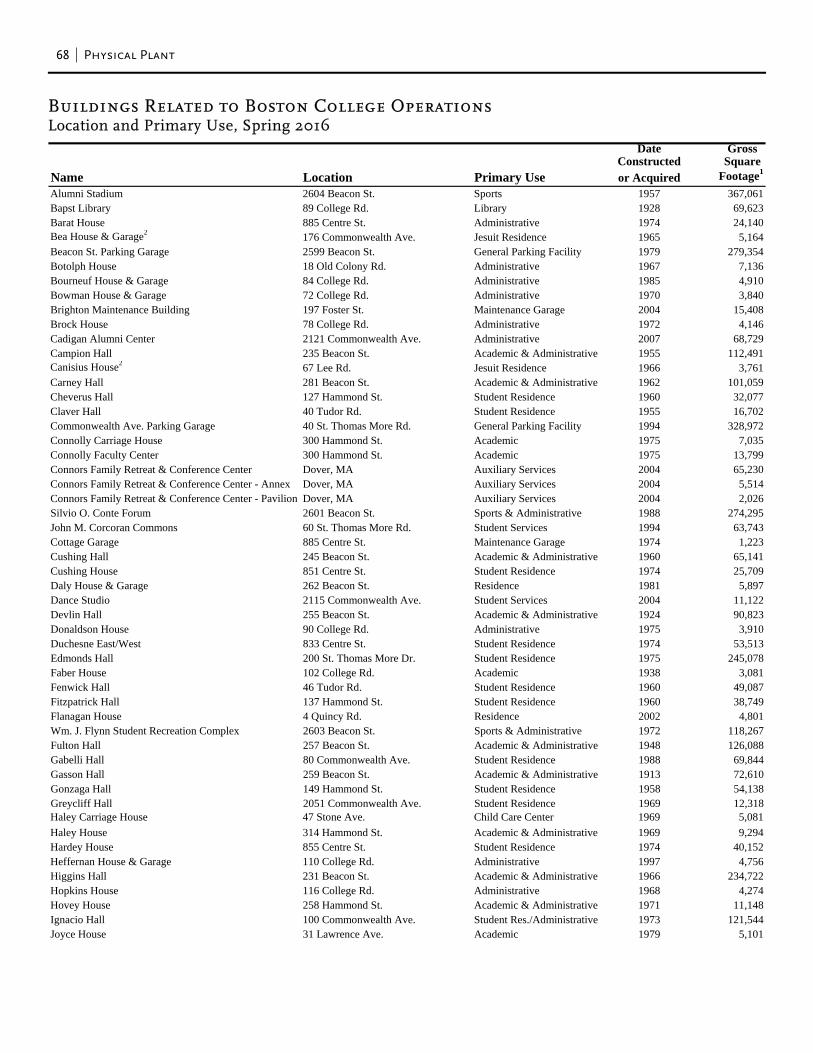
68 Physical Plant
Buildings Related to Boston College Operations Location and Primary Use, Spring 2016
Date GrossConstructed Square
Name Location Primary Use or Acquired Footage1
Alumni Stadium 2604 Beacon St. Sports 1957 367,061Bapst Library 89 College Rd. Library 1928 69,623Barat House 885 Centre St. Administrative 1974 24,140Bea House & Garage2 176 Commonwealth Ave. Jesuit Residence 1965 5,164Beacon St. Parking Garage 2599 Beacon St. General Parking Facility 1979 279,354Botolph House 18 Old Colony Rd. Administrative 1967 7,136Bourneuf House & Garage 84 College Rd. Administrative 1985 4,910Bowman House & Garage 72 College Rd. Administrative 1970 3,840Brighton Maintenance Building 197 Foster St. Maintenance Garage 2004 15,408Brock House 78 College Rd. Administrative 1972 4,146Cadigan Alumni Center 2121 Commonwealth Ave. Administrative 2007 68,729Campion Hall 235 Beacon St. Academic & Administrative 1955 112,491Canisius House2 67 Lee Rd. Jesuit Residence 1966 3,761Carney Hall 281 Beacon St. Academic & Administrative 1962 101,059Cheverus Hall 127 Hammond St. Student Residence 1960 32,077Claver Hall 40 Tudor Rd. Student Residence 1955 16,702Commonwealth Ave. Parking Garage 40 St. Thomas More Rd. General Parking Facility 1994 328,972Connolly Carriage House 300 Hammond St. Academic 1975 7,035Connolly Faculty Center 300 Hammond St. Academic 1975 13,799Connors Family Retreat & Conference Center Dover, MA Auxiliary Services 2004 65,230Connors Family Retreat & Conference Center - Annex Dover, MA Auxiliary Services 2004 5,514Connors Family Retreat & Conference Center - Pavilion Dover, MA Auxiliary Services 2004 2,026Silvio O. Conte Forum 2601 Beacon St. Sports & Administrative 1988 274,295John M. Corcoran Commons 60 St. Thomas More Rd. Student Services 1994 63,743Cottage Garage 885 Centre St. Maintenance Garage 1974 1,223Cushing Hall 245 Beacon St. Academic & Administrative 1960 65,141Cushing House 851 Centre St. Student Residence 1974 25,709Daly House & Garage 262 Beacon St. Residence 1981 5,897Dance Studio 2115 Commonwealth Ave. Student Services 2004 11,122Devlin Hall 255 Beacon St. Academic & Administrative 1924 90,823Donaldson House 90 College Rd. Administrative 1975 3,910Duchesne East/West 833 Centre St. Student Residence 1974 53,513Edmonds Hall 200 St. Thomas More Dr. Student Residence 1975 245,078Faber House 102 College Rd. Academic 1938 3,081Fenwick Hall 46 Tudor Rd. Student Residence 1960 49,087Fitzpatrick Hall 137 Hammond St. Student Residence 1960 38,749Flanagan House 4 Quincy Rd. Residence 2002 4,801Wm. J. Flynn Student Recreation Complex 2603 Beacon St. Sports & Administrative 1972 118,267Fulton Hall 257 Beacon St. Academic & Administrative 1948 126,088Gabelli Hall 80 Commonwealth Ave. Student Residence 1988 69,844Gasson Hall 259 Beacon St. Academic & Administrative 1913 72,610Gonzaga Hall 149 Hammond St. Student Residence 1958 54,138Greycliff Hall 2051 Commonwealth Ave. Student Residence 1969 12,318Haley Carriage House 47 Stone Ave. Child Care Center 1969 5,081Haley House 314 Hammond St. Academic & Administrative 1969 9,294Hardey House 855 Centre St. Student Residence 1974 40,152Heffernan House & Garage 110 College Rd. Administrative 1997 4,756Higgins Hall 231 Beacon St. Academic & Administrative 1966 234,722Hopkins House 116 College Rd. Administrative 1968 4,274Hovey House 258 Hammond St. Academic & Administrative 1971 11,148Ignacio Hall 100 Commonwealth Ave. Student Res./Administrative 1973 121,544Joyce House 31 Lawrence Ave. Academic 1979 5,101
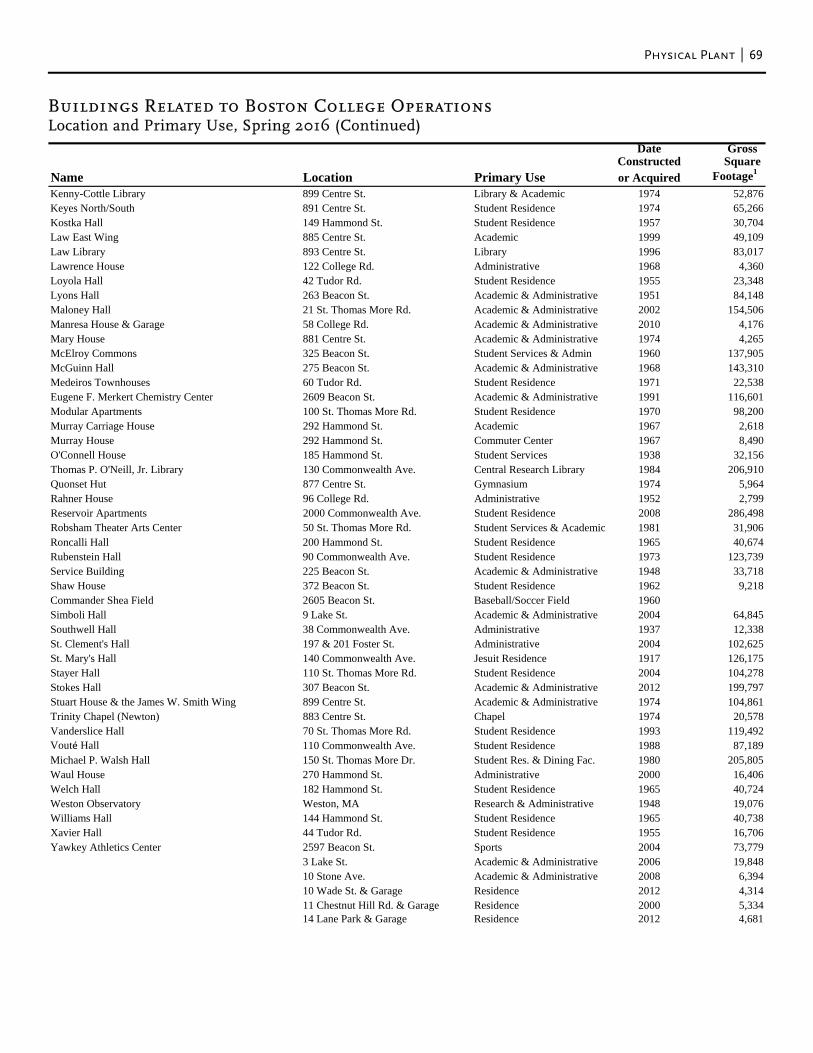
Physical Plant 69
Buildings Related to Boston College Operations Location and Primary Use, Spring 2016 (Continued)
Date GrossConstructed Square
Name Location Primary Use or Acquired Footage1
Kenny-Cottle Library 899 Centre St. Library & Academic 1974 52,876Keyes North/South 891 Centre St. Student Residence 1974 65,266Kostka Hall 149 Hammond St. Student Residence 1957 30,704Law East Wing 885 Centre St. Academic 1999 49,109Law Library 893 Centre St. Library 1996 83,017Lawrence House 122 College Rd. Administrative 1968 4,360Loyola Hall 42 Tudor Rd. Student Residence 1955 23,348Lyons Hall 263 Beacon St. Academic & Administrative 1951 84,148Maloney Hall 21 St. Thomas More Rd. Academic & Administrative 2002 154,506Manresa House & Garage 58 College Rd. Academic & Administrative 2010 4,176Mary House 881 Centre St. Academic & Administrative 1974 4,265McElroy Commons 325 Beacon St. Student Services & Admin 1960 137,905McGuinn Hall 275 Beacon St. Academic & Administrative 1968 143,310Medeiros Townhouses 60 Tudor Rd. Student Residence 1971 22,538Eugene F. Merkert Chemistry Center 2609 Beacon St. Academic & Administrative 1991 116,601Modular Apartments 100 St. Thomas More Rd. Student Residence 1970 98,200Murray Carriage House 292 Hammond St. Academic 1967 2,618Murray House 292 Hammond St. Commuter Center 1967 8,490O'Connell House 185 Hammond St. Student Services 1938 32,156Thomas P. O'Neill, Jr. Library 130 Commonwealth Ave. Central Research Library 1984 206,910Quonset Hut 877 Centre St. Gymnasium 1974 5,964Rahner House 96 College Rd. Administrative 1952 2,799Reservoir Apartments 2000 Commonwealth Ave. Student Residence 2008 286,498Robsham Theater Arts Center 50 St. Thomas More Rd. Student Services & Academic 1981 31,906Roncalli Hall 200 Hammond St. Student Residence 1965 40,674Rubenstein Hall 90 Commonwealth Ave. Student Residence 1973 123,739Service Building 225 Beacon St. Academic & Administrative 1948 33,718Shaw House 372 Beacon St. Student Residence 1962 9,218Commander Shea Field 2605 Beacon St. Baseball/Soccer Field 1960Simboli Hall 9 Lake St. Academic & Administrative 2004 64,845Southwell Hall 38 Commonwealth Ave. Administrative 1937 12,338St. Clement's Hall 197 & 201 Foster St. Administrative 2004 102,625St. Mary's Hall 140 Commonwealth Ave. Jesuit Residence 1917 126,175Stayer Hall 110 St. Thomas More Rd. Student Residence 2004 104,278Stokes Hall 307 Beacon St. Academic & Administrative 2012 199,797Stuart House & the James W. Smith Wing 899 Centre St. Academic & Administrative 1974 104,861Trinity Chapel (Newton) 883 Centre St. Chapel 1974 20,578Vanderslice Hall 70 St. Thomas More Rd. Student Residence 1993 119,492Vouté Hall 110 Commonwealth Ave. Student Residence 1988 87,189Michael P. Walsh Hall 150 St. Thomas More Dr. Student Res. & Dining Fac. 1980 205,805Waul House 270 Hammond St. Administrative 2000 16,406Welch Hall 182 Hammond St. Student Residence 1965 40,724Weston Observatory Weston, MA Research & Administrative 1948 19,076Williams Hall 144 Hammond St. Student Residence 1965 40,738Xavier Hall 44 Tudor Rd. Student Residence 1955 16,706Yawkey Athletics Center 2597 Beacon St. Sports 2004 73,779
3 Lake St. Academic & Administrative 2006 19,84810 Stone Ave. Academic & Administrative 2008 6,39410 Wade St. & Garage Residence 2012 4,31411 Chestnut Hill Rd. & Garage Residence 2000 5,33414 Lane Park & Garage Residence 2012 4,681
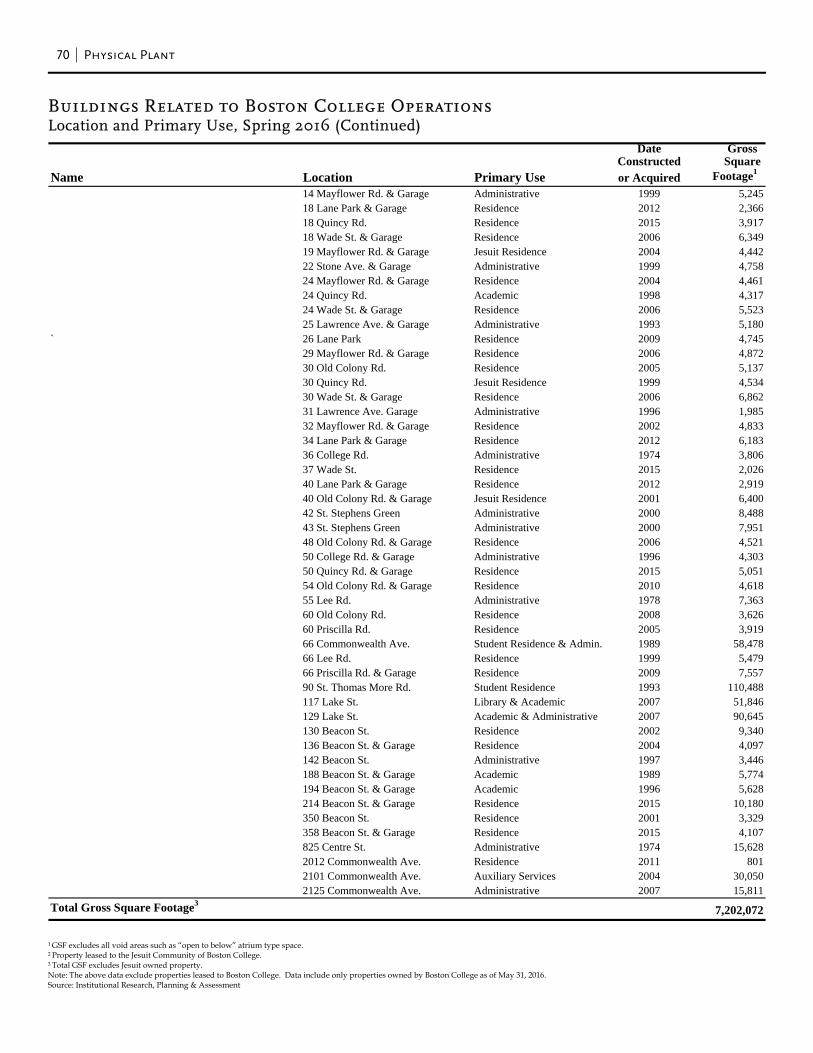
70 Physical Plant
Buildings Related to Boston College Operations Location and Primary Use, Spring 2016 (Continued)
1 GSF excludes all void areas such as “open to below” atrium type space. 2 Property leased to the Jesuit Community of Boston College. 3 Total GSF excludes Jesuit owned property. Note: The above data exclude properties leased to Boston College. Data include only properties owned by Boston College as of May 31, 2016. Source: Institutional Research, Planning & Assessment
Date GrossConstructed Square
Name Location Primary Use or Acquired Footage1
14 Mayflower Rd. & Garage Administrative 1999 5,24518 Lane Park & Garage Residence 2012 2,36618 Quincy Rd. Residence 2015 3,91718 Wade St. & Garage Residence 2006 6,34919 Mayflower Rd. & Garage Jesuit Residence 2004 4,44222 Stone Ave. & Garage Administrative 1999 4,75824 Mayflower Rd. & Garage Residence 2004 4,46124 Quincy Rd. Academic 1998 4,31724 Wade St. & Garage Residence 2006 5,52325 Lawrence Ave. & Garage Administrative 1993 5,180
` 26 Lane Park Residence 2009 4,74529 Mayflower Rd. & Garage Residence 2006 4,87230 Old Colony Rd. Residence 2005 5,13730 Quincy Rd. Jesuit Residence 1999 4,53430 Wade St. & Garage Residence 2006 6,86231 Lawrence Ave. Garage Administrative 1996 1,98532 Mayflower Rd. & Garage Residence 2002 4,83334 Lane Park & Garage Residence 2012 6,18336 College Rd. Administrative 1974 3,80637 Wade St. Residence 2015 2,02640 Lane Park & Garage Residence 2012 2,91940 Old Colony Rd. & Garage Jesuit Residence 2001 6,40042 St. Stephens Green Administrative 2000 8,48843 St. Stephens Green Administrative 2000 7,95148 Old Colony Rd. & Garage Residence 2006 4,52150 College Rd. & Garage Administrative 1996 4,30350 Quincy Rd. & Garage Residence 2015 5,05154 Old Colony Rd. & Garage Residence 2010 4,61855 Lee Rd. Administrative 1978 7,36360 Old Colony Rd. Residence 2008 3,62660 Priscilla Rd. Residence 2005 3,91966 Commonwealth Ave. Student Residence & Admin. 1989 58,47866 Lee Rd. Residence 1999 5,47966 Priscilla Rd. & Garage Residence 2009 7,55790 St. Thomas More Rd. Student Residence 1993 110,488117 Lake St. Library & Academic 2007 51,846129 Lake St. Academic & Administrative 2007 90,645130 Beacon St. Residence 2002 9,340136 Beacon St. & Garage Residence 2004 4,097142 Beacon St. Administrative 1997 3,446188 Beacon St. & Garage Academic 1989 5,774194 Beacon St. & Garage Academic 1996 5,628214 Beacon St. & Garage Residence 2015 10,180350 Beacon St. Residence 2001 3,329358 Beacon St. & Garage Residence 2015 4,107825 Centre St. Administrative 1974 15,6282012 Commonwealth Ave. Residence 2011 8012101 Commonwealth Ave. Auxiliary Services 2004 30,0502125 Commonwealth Ave. Administrative 2007 15,811
Total Gross Square Footage3 7,202,072
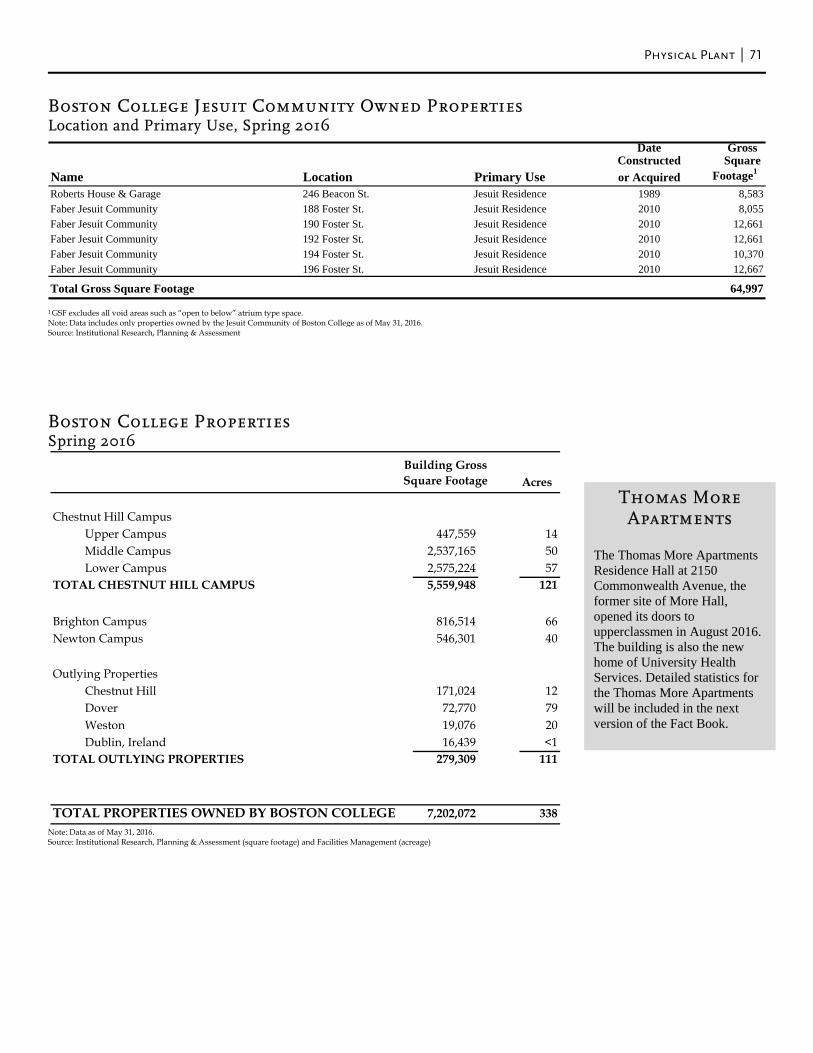
Physical Plant 71
Boston College Jesuit Community Owned Properties Location and Primary Use, Spring 2016
1 GSF excludes all void areas such as “open to below” atrium type space. Note: Data includes only properties owned by the Jesuit Community of Boston College as of May 31, 2016. Source: Institutional Research, Planning & Assessment
Boston College Properties Spring 2016
Note: Data as of May 31, 2016. Source: Institutional Research, Planning & Assessment (square footage) and Facilities Management (acreage)
Date GrossConstructed Square
Name Location Primary Use or Acquired Footage1
Roberts House & Garage 246 Beacon St. Jesuit Residence 1989 8,583Faber Jesuit Community 188 Foster St. Jesuit Residence 2010 8,055Faber Jesuit Community 190 Foster St. Jesuit Residence 2010 12,661Faber Jesuit Community 192 Foster St. Jesuit Residence 2010 12,661Faber Jesuit Community 194 Foster St. Jesuit Residence 2010 10,370Faber Jesuit Community 196 Foster St. Jesuit Residence 2010 12,667
Total Gross Square Footage 64,997
Acres
Chestnut Hill CampusUpper Campus 447,559 14Middle Campus 2,537,165 50Lower Campus 2,575,224 57
TOTAL CHESTNUT HILL CAMPUS 5,559,948 121
Brighton Campus 816,514 66Newton Campus 546,301 40
Outlying Properties Chestnut Hill 171,024 12Dover 72,770 79Weston 19,076 20Dublin, Ireland 16,439 <1
TOTAL OUTLYING PROPERTIES 279,309 111
TOTAL PROPERTIES OWNED BY BOSTON COLLEGE 7,202,072 338
Building GrossSquare Footage
Thomas More Apartments
The Thomas More Apartments Residence Hall at 2150 Commonwealth Avenue, the former site of More Hall, opened its doors to upperclassmen in August 2016. The building is also the new home of University Health Services. Detailed statistics for the Thomas More Apartments will be included in the next version of the Fact Book.
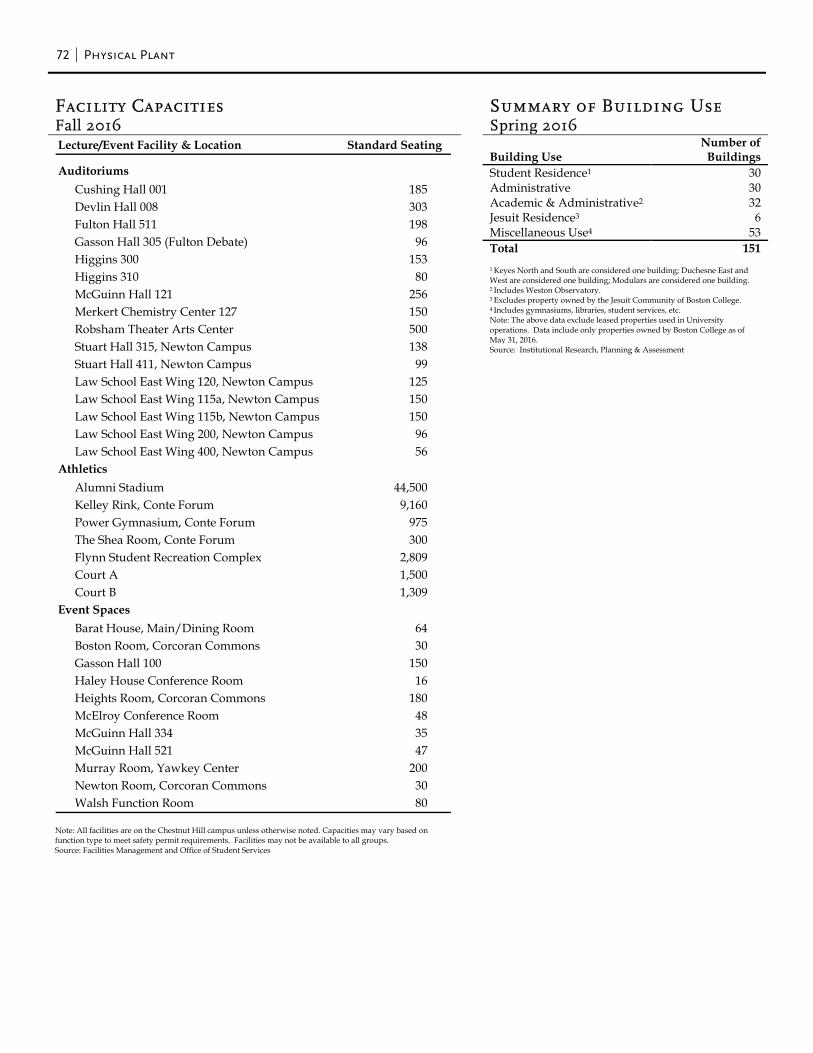
72 Physical Plant
Facility Capacities
Summary of Building Use
Fall 2016 Spring 2016
Building Use Number of
Buildings Student Residence1 30 Administrative 30 Academic & Administrative2 32 Jesuit Residence3 6 Miscellaneous Use4 53 Total 151 1 Keyes North and South are considered one building; Duchesne East and
West are considered one building; Modulars are considered one building. 2 Includes Weston Observatory. 3 Excludes property owned by the Jesuit Community of Boston College. 4 Includes gymnasiums, libraries, student services, etc. Note: The above data exclude leased properties used in University
operations. Data include only properties owned by Boston College as of May 31, 2016.
Source: Institutional Research, Planning & Assessment
Note: All facilities are on the Chestnut Hill campus unless otherwise noted. Capacities may vary based on function type to meet safety permit requirements. Facilities may not be available to all groups.
Source: Facilities Management and Office of Student Services
Lecture/Event Facility & Location Standard Seating
AuditoriumsCushing Hall 001 185Devlin Hall 008 303Fulton Hall 511 198Gasson Hall 305 (Fulton Debate) 96Higgins 300 153Higgins 310 80McGuinn Hall 121 256Merkert Chemistry Center 127 150Robsham Theater Arts Center 500Stuart Hall 315, Newton Campus 138Stuart Hall 411, Newton Campus 99Law School East Wing 120, Newton Campus 125Law School East Wing 115a, Newton Campus 150Law School East Wing 115b, Newton Campus 150Law School East Wing 200, Newton Campus 96Law School East Wing 400, Newton Campus 56
AthleticsAlumni Stadium 44,500Kelley Rink, Conte Forum 9,160Power Gymnasium, Conte Forum 975The Shea Room, Conte Forum 300Flynn Student Recreation Complex 2,809Court A 1,500Court B 1,309
Event SpacesBarat House, Main/Dining Room 64Boston Room, Corcoran Commons 30Gasson Hall 100 150Haley House Conference Room 16Heights Room, Corcoran Commons 180McElroy Conference Room 48McGuinn Hall 334 35McGuinn Hall 521 47Murray Room, Yawkey Center 200Newton Room, Corcoran Commons 30Walsh Function Room 80
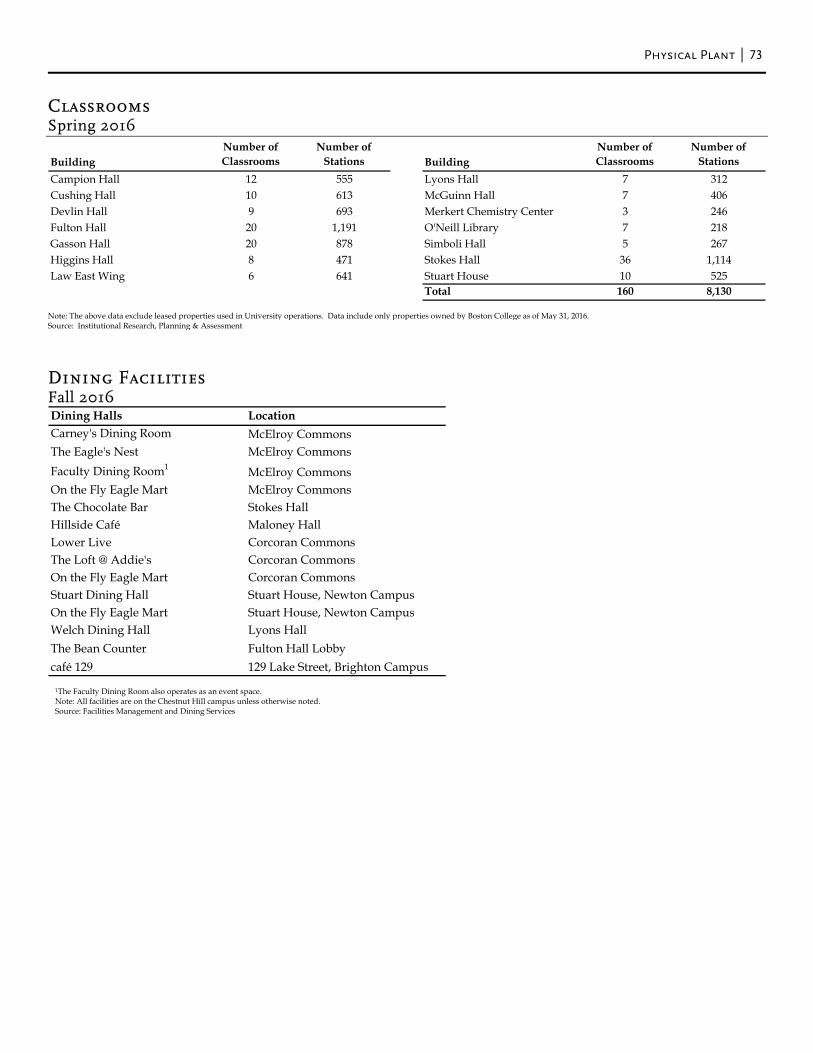
Physical Plant 73
Classrooms Spring 2016
Note: The above data exclude leased properties used in University operations. Data include only properties owned by Boston College as of May 31, 2016. Source: Institutional Research, Planning & Assessment Dining Facilities Fall 2016
1The Faculty Dining Room also operates as an event space. Note: All facilities are on the Chestnut Hill campus unless otherwise noted. Source: Facilities Management and Dining Services
Building BuildingCampion Hall 12 555 Lyons Hall 7 312Cushing Hall 10 613 McGuinn Hall 7 406Devlin Hall 9 693 Merkert Chemistry Center 3 246Fulton Hall 20 1,191 O'Neill Library 7 218Gasson Hall 20 878 Simboli Hall 5 267Higgins Hall 8 471 Stokes Hall 36 1,114Law East Wing 6 641 Stuart House 10 525
Total 160 8,130
Number of Classrooms
Number of Stations
Number of Classrooms
Number of Stations
Dining Halls LocationCarney's Dining Room McElroy CommonsThe Eagle's Nest McElroy CommonsFaculty Dining Room1 McElroy CommonsOn the Fly Eagle Mart McElroy CommonsThe Chocolate Bar Stokes HallHillside Café Maloney HallLower Live Corcoran CommonsThe Loft @ Addie's Corcoran CommonsOn the Fly Eagle Mart Corcoran CommonsStuart Dining Hall Stuart House, Newton CampusOn the Fly Eagle Mart Stuart House, Newton CampusWelch Dining Hall Lyons HallThe Bean Counter Fulton Hall Lobbycafé 129 129 Lake Street, Brighton Campus
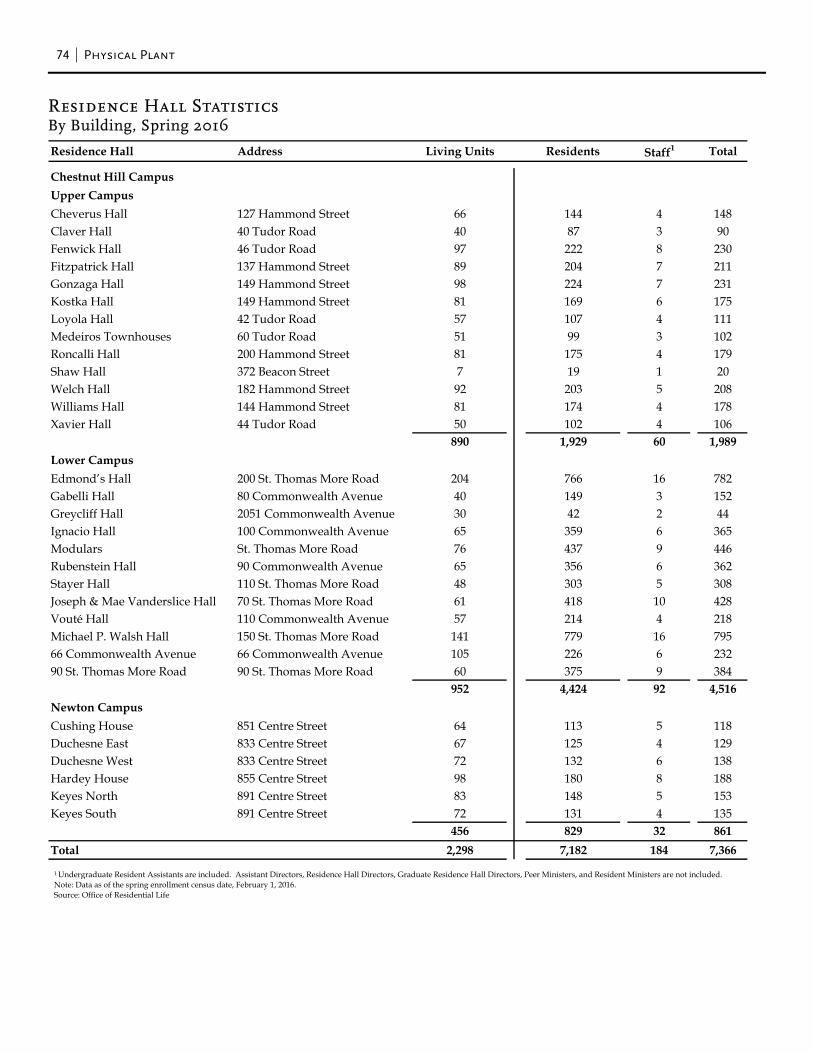
74 Physical Plant
Residence Hall Statistics By Building, Spring 2016
1 Undergraduate Resident Assistants are included. Assistant Directors, Residence Hall Directors, Graduate Residence Hall Directors, Peer Ministers, and Resident Ministers are not included. Note: Data as of the spring enrollment census date, February 1, 2016. Source: Office of Residential Life
Residence Hall Address Living Units Residents Staff1 Total
Chestnut Hill CampusUpper CampusCheverus Hall 127 Hammond Street 66 144 4 148Claver Hall 40 Tudor Road 40 87 3 90Fenwick Hall 46 Tudor Road 97 222 8 230Fitzpatrick Hall 137 Hammond Street 89 204 7 211Gonzaga Hall 149 Hammond Street 98 224 7 231Kostka Hall 149 Hammond Street 81 169 6 175Loyola Hall 42 Tudor Road 57 107 4 111Medeiros Townhouses 60 Tudor Road 51 99 3 102Roncalli Hall 200 Hammond Street 81 175 4 179Shaw Hall 372 Beacon Street 7 19 1 20Welch Hall 182 Hammond Street 92 203 5 208Williams Hall 144 Hammond Street 81 174 4 178Xavier Hall 44 Tudor Road 50 102 4 106
890 1,929 60 1,989Lower CampusEdmond’s Hall 200 St. Thomas More Road 204 766 16 782Gabelli Hall 80 Commonwealth Avenue 40 149 3 152Greycliff Hall 2051 Commonwealth Avenue 30 42 2 44Ignacio Hall 100 Commonwealth Avenue 65 359 6 365Modulars St. Thomas More Road 76 437 9 446Rubenstein Hall 90 Commonwealth Avenue 65 356 6 362Stayer Hall 110 St. Thomas More Road 48 303 5 308Joseph & Mae Vanderslice Hall 70 St. Thomas More Road 61 418 10 428Vouté Hall 110 Commonwealth Avenue 57 214 4 218Michael P. Walsh Hall 150 St. Thomas More Road 141 779 16 79566 Commonwealth Avenue 66 Commonwealth Avenue 105 226 6 23290 St. Thomas More Road 90 St. Thomas More Road 60 375 9 384
952 4,424 92 4,516Newton CampusCushing House 851 Centre Street 64 113 5 118Duchesne East 833 Centre Street 67 125 4 129Duchesne West 833 Centre Street 72 132 6 138Hardey House 855 Centre Street 98 180 8 188Keyes North 891 Centre Street 83 148 5 153Keyes South 891 Centre Street 72 131 4 135
456 829 32 861Total 2,298 7,182 184 7,366
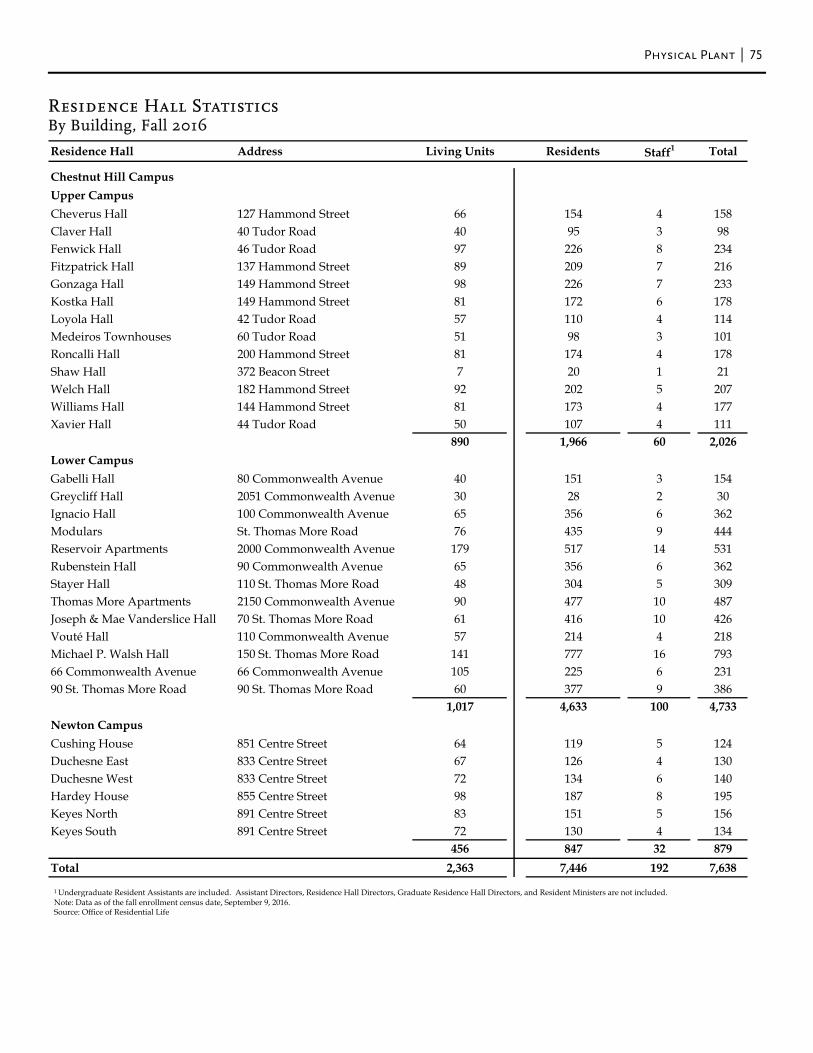
Physical Plant 75
Residence Hall Statistics By Building, Fall 2016
1 Undergraduate Resident Assistants are included. Assistant Directors, Residence Hall Directors, Graduate Residence Hall Directors, and Resident Ministers are not included. Note: Data as of the fall enrollment census date, September 9, 2016. Source: Office of Residential Life
Residence Hall Address Living Units Residents Staff1 Total
Chestnut Hill CampusUpper CampusCheverus Hall 127 Hammond Street 66 154 4 158Claver Hall 40 Tudor Road 40 95 3 98Fenwick Hall 46 Tudor Road 97 226 8 234Fitzpatrick Hall 137 Hammond Street 89 209 7 216Gonzaga Hall 149 Hammond Street 98 226 7 233Kostka Hall 149 Hammond Street 81 172 6 178Loyola Hall 42 Tudor Road 57 110 4 114Medeiros Townhouses 60 Tudor Road 51 98 3 101Roncalli Hall 200 Hammond Street 81 174 4 178Shaw Hall 372 Beacon Street 7 20 1 21Welch Hall 182 Hammond Street 92 202 5 207Williams Hall 144 Hammond Street 81 173 4 177Xavier Hall 44 Tudor Road 50 107 4 111
890 1,966 60 2,026Lower CampusGabelli Hall 80 Commonwealth Avenue 40 151 3 154Greycliff Hall 2051 Commonwealth Avenue 30 28 2 30Ignacio Hall 100 Commonwealth Avenue 65 356 6 362Modulars St. Thomas More Road 76 435 9 444Reservoir Apartments 2000 Commonwealth Avenue 179 517 14 531Rubenstein Hall 90 Commonwealth Avenue 65 356 6 362Stayer Hall 110 St. Thomas More Road 48 304 5 309Thomas More Apartments 2150 Commonwealth Avenue 90 477 10 487Joseph & Mae Vanderslice Hall 70 St. Thomas More Road 61 416 10 426Vouté Hall 110 Commonwealth Avenue 57 214 4 218Michael P. Walsh Hall 150 St. Thomas More Road 141 777 16 79366 Commonwealth Avenue 66 Commonwealth Avenue 105 225 6 23190 St. Thomas More Road 90 St. Thomas More Road 60 377 9 386
1,017 4,633 100 4,733Newton CampusCushing House 851 Centre Street 64 119 5 124Duchesne East 833 Centre Street 67 126 4 130Duchesne West 833 Centre Street 72 134 6 140Hardey House 855 Centre Street 98 187 8 195Keyes North 891 Centre Street 83 151 5 156Keyes South 891 Centre Street 72 130 4 134
456 847 32 879Total 2,363 7,446 192 7,638


Finance
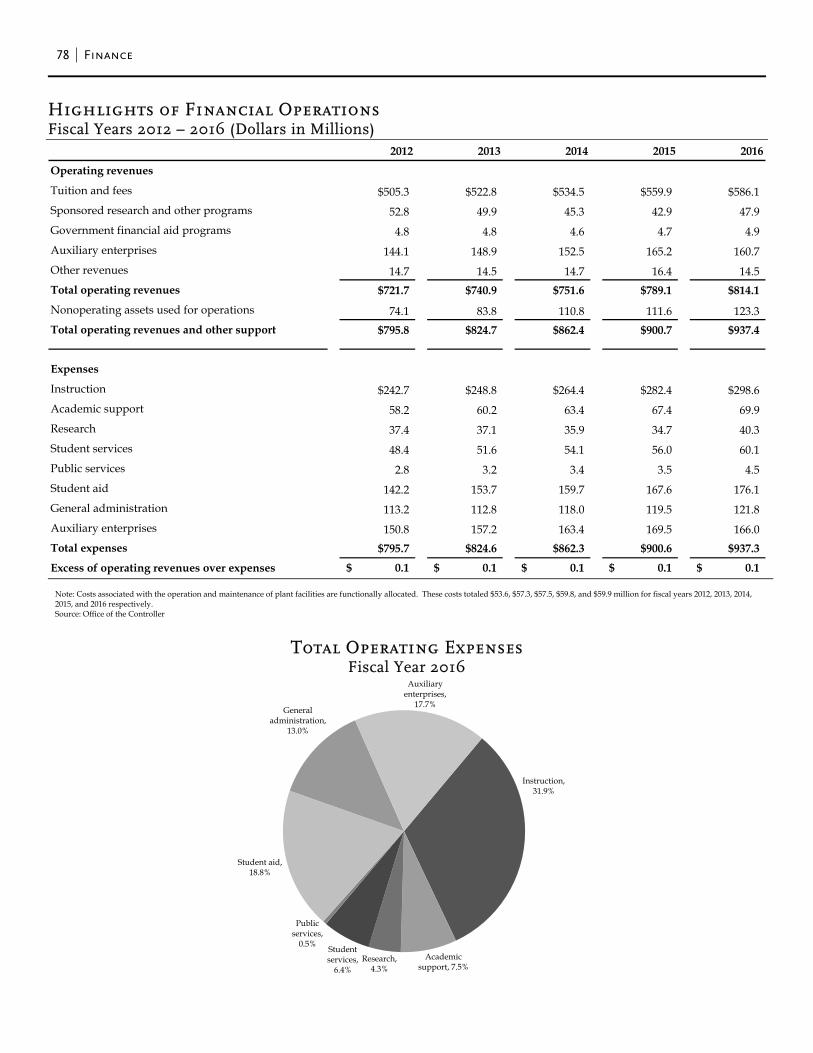
78 Finance
Highlights of Financial Operations Fiscal Years 2012 – 2016 (Dollars in Millions)
Note: Costs associated with the operation and maintenance of plant facilities are functionally allocated. These costs totaled $53.6, $57.3, $57.5, $59.8, and $59.9 million for fiscal years 2012, 2013, 2014, 2015, and 2016 respectively. Source: Office of the Controller
Total Operating Expenses
Fiscal Year 2016
2012 2013 2014 2015 2016
Operating revenues
Tuition and fees $505.3 $522.8 $534.5 $559.9 $586.1Sponsored research and other programs 52.8 49.9 45.3 42.9 47.9Government financial aid programs 4.8 4.8 4.6 4.7 4.9Auxiliary enterprises 144.1 148.9 152.5 165.2 160.7Other revenues 14.7 14.5 14.7 16.4 14.5Total operating revenues $721.7 $740.9 $751.6 $789.1 $814.1
Nonoperating assets used for operations 74.1 83.8 110.8 111.6 123.3Total operating revenues and other support $795.8 $824.7 $862.4 $900.7 $937.4
Expenses
Instruction $242.7 $248.8 $264.4 $282.4 $298.6Academic support 58.2 60.2 63.4 67.4 69.9 Research 37.4 37.1 35.9 34.7 40.3Student services 48.4 51.6 54.1 56.0 60.1Public services 2.8 3.2 3.4 3.5 4.5Student aid 142.2 153.7 159.7 167.6 176.1General administration 113.2 112.8 118.0 119.5 121.8Auxiliary enterprises 150.8 157.2 163.4 169.5 166.0Total expenses $795.7 $824.6 $862.3 $900.6 $937.3
Excess of operating revenues over expenses 0.1$ 0.1$ 0.1$ 0.1$ 0.1$
Instruction, 31.9%
Academic support, 7.5%
Research, 4.3%
Student services,
6.4%
Public services,
0.5%
Student aid, 18.8%
General administration,
13.0%
Auxiliary enterprises,
17.7%
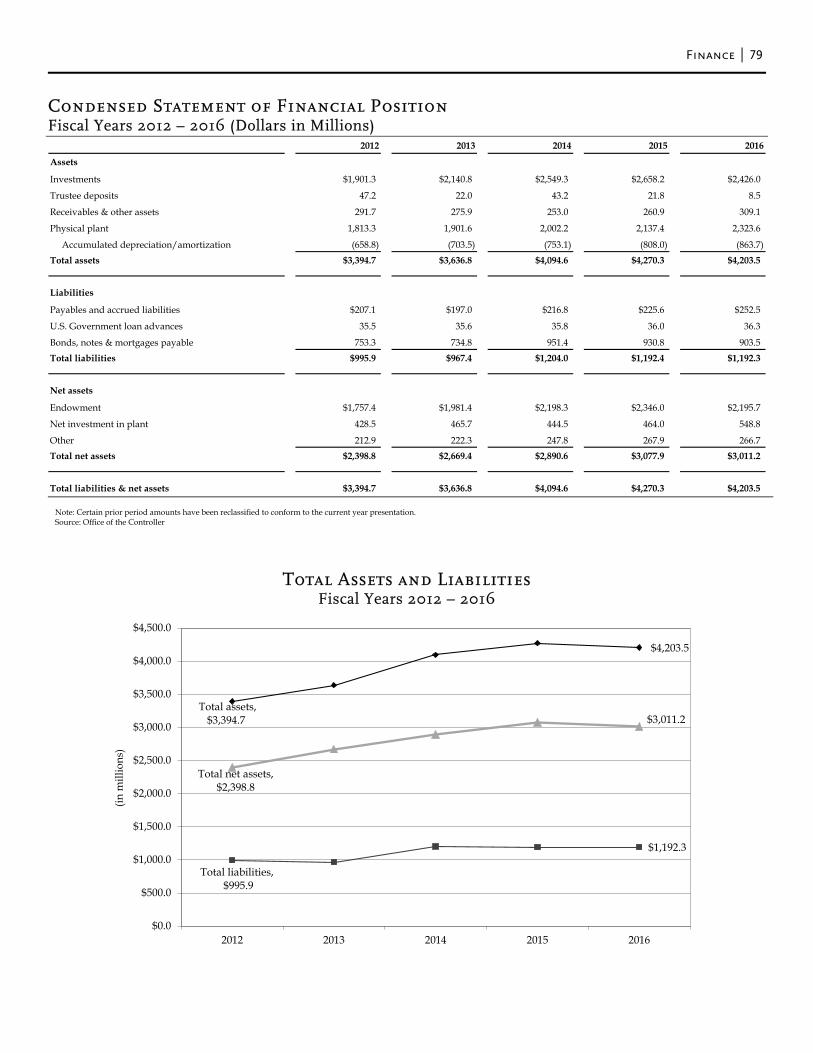
Finance 79
Condensed Statement of Financial Position Fiscal Years 2012 – 2016 (Dollars in Millions)
Note: Certain prior period amounts have been reclassified to conform to the current year presentation. Source: Office of the Controller
Total Assets and Liabilities Fiscal Years 2012 – 2016
2012 2013 2014 2015 2016
Assets
Investments $1,901.3 $2,140.8 $2,549.3 $2,658.2 $2,426.0
Trustee deposits 47.2 22.0 43.2 21.8 8.5
Receivables & other assets 291.7 275.9 253.0 260.9 309.1
Physical plant 1,813.3 1,901.6 2,002.2 2,137.4 2,323.6
Accumulated depreciation/amortization (658.8) (703.5) (753.1) (808.0) (863.7)Total assets $3,394.7 $3,636.8 $4,094.6 $4,270.3 $4,203.5
Liabilities
Payables and accrued liabilities $207.1 $197.0 $216.8 $225.6 $252.5
U.S. Government loan advances 35.5 35.6 35.8 36.0 36.3
Bonds, notes & mortgages payable 753.3 734.8 951.4 930.8 903.5Total liabilities $995.9 $967.4 $1,204.0 $1,192.4 $1,192.3
Net assets
Endowment $1,757.4 $1,981.4 $2,198.3 $2,346.0 $2,195.7
Net investment in plant 428.5 465.7 444.5 464.0 548.8
Other 212.9 222.3 247.8 267.9 266.7Total net assets $2,398.8 $2,669.4 $2,890.6 $3,077.9 $3,011.2
Total liabilities & net assets $3,394.7 $3,636.8 $4,094.6 $4,270.3 $4,203.5
Total assets,$3,394.7
$4,203.5
Total liabilities,$995.9
$1,192.3
Total net assets,$2,398.8
$3,011.2
$0.0
$500.0
$1,000.0
$1,500.0
$2,000.0
$2,500.0
$3,000.0
$3,500.0
$4,000.0
$4,500.0
2012 2013 2014 2015 2016
(in m
illio
ns)
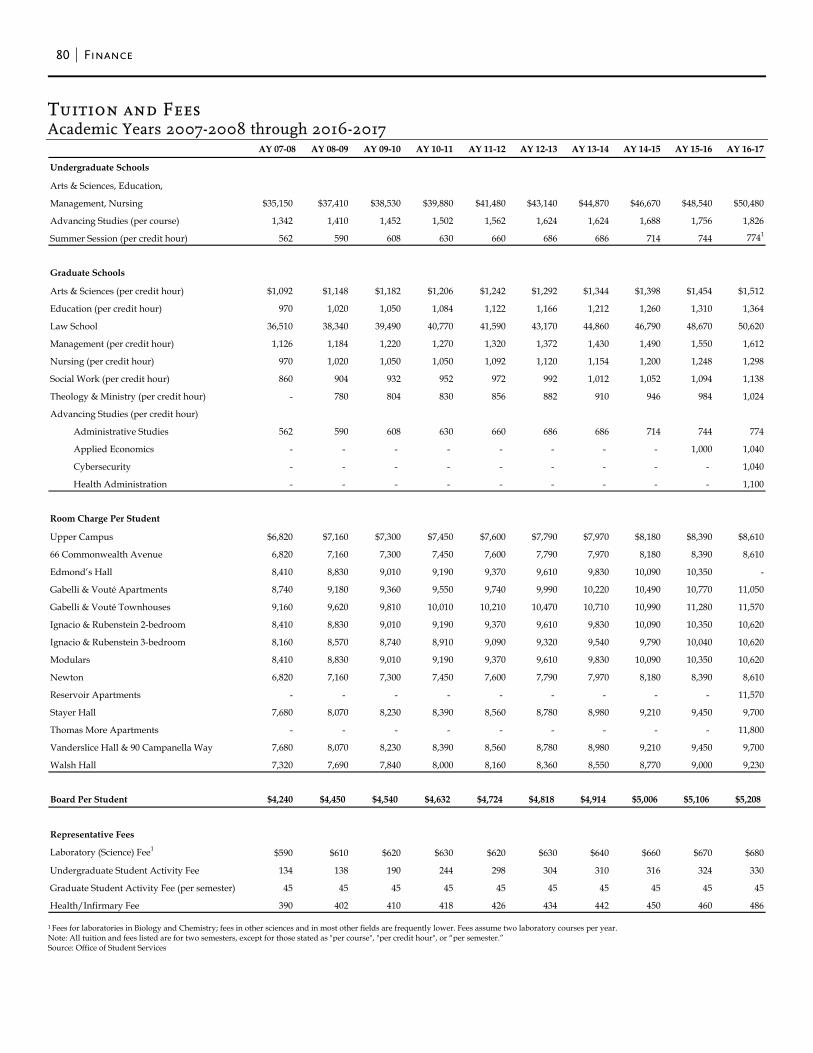
80 Finance
Tuition and Fees Academic Years 2007-2008 through 2016-2017
1 Fees for laboratories in Biology and Chemistry; fees in other sciences and in most other fields are frequently lower. Fees assume two laboratory courses per year. Note: All tuition and fees listed are for two semesters, except for those stated as "per course", "per credit hour", or “per semester.” Source: Office of Student Services
AY 07-08 AY 08-09 AY 09-10 AY 10-11 AY 11-12 AY 12-13 AY 13-14 AY 14-15 AY 15-16 AY 16-17
Undergraduate Schools
Arts & Sciences, Education,
Management, Nursing $35,150 $37,410 $38,530 $39,880 $41,480 $43,140 $44,870 $46,670 $48,540 $50,480
Advancing Studies (per course) 1,342 1,410 1,452 1,502 1,562 1,624 1,624 1,688 1,756 1,826
Summer Session (per credit hour) 562 590 608 630 660 686 686 714 744 7741
Graduate Schools
Arts & Sciences (per credit hour) $1,092 $1,148 $1,182 $1,206 $1,242 $1,292 $1,344 $1,398 $1,454 $1,512
Education (per credit hour) 970 1,020 1,050 1,084 1,122 1,166 1,212 1,260 1,310 1,364
Law School 36,510 38,340 39,490 40,770 41,590 43,170 44,860 46,790 48,670 50,620
Management (per credit hour) 1,126 1,184 1,220 1,270 1,320 1,372 1,430 1,490 1,550 1,612
Nursing (per credit hour) 970 1,020 1,050 1,050 1,092 1,120 1,154 1,200 1,248 1,298
Social Work (per credit hour) 860 904 932 952 972 992 1,012 1,052 1,094 1,138
Theology & Ministry (per credit hour) - 780 804 830 856 882 910 946 984 1,024
Advancing Studies (per credit hour)
Administrative Studies 562 590 608 630 660 686 686 714 744 774
Applied Economics - - - - - - - - 1,000 1,040
Cybersecurity - - - - - - - - - 1,040
Health Administration - - - - - - - - - 1,100
Room Charge Per Student
Upper Campus $6,820 $7,160 $7,300 $7,450 $7,600 $7,790 $7,970 $8,180 $8,390 $8,610
66 Commonwealth Avenue 6,820 7,160 7,300 7,450 7,600 7,790 7,970 8,180 8,390 8,610
Edmond’s Hall 8,410 8,830 9,010 9,190 9,370 9,610 9,830 10,090 10,350 -
Gabelli & Vouté Apartments 8,740 9,180 9,360 9,550 9,740 9,990 10,220 10,490 10,770 11,050
Gabelli & Vouté Townhouses 9,160 9,620 9,810 10,010 10,210 10,470 10,710 10,990 11,280 11,570
Ignacio & Rubenstein 2-bedroom 8,410 8,830 9,010 9,190 9,370 9,610 9,830 10,090 10,350 10,620
Ignacio & Rubenstein 3-bedroom 8,160 8,570 8,740 8,910 9,090 9,320 9,540 9,790 10,040 10,620
Modulars 8,410 8,830 9,010 9,190 9,370 9,610 9,830 10,090 10,350 10,620
Newton 6,820 7,160 7,300 7,450 7,600 7,790 7,970 8,180 8,390 8,610
Reservoir Apartments - - - - - - - - - 11,570
Stayer Hall 7,680 8,070 8,230 8,390 8,560 8,780 8,980 9,210 9,450 9,700
Thomas More Apartments - - - - - - - - - 11,800
Vanderslice Hall & 90 Campanella Way 7,680 8,070 8,230 8,390 8,560 8,780 8,980 9,210 9,450 9,700
Walsh Hall 7,320 7,690 7,840 8,000 8,160 8,360 8,550 8,770 9,000 9,230
Board Per Student $4,240 $4,450 $4,540 $4,632 $4,724 $4,818 $4,914 $5,006 $5,106 $5,208
Representative Fees
Laboratory (Science) Fee1 $590 $610 $620 $630 $620 $630 $640 $660 $670 $680
Undergraduate Student Activity Fee 134 138 190 244 298 304 310 316 324 330
Graduate Student Activity Fee (per semester) 45 45 45 45 45 45 45 45 45 45
Health/Infirmary Fee 390 402 410 418 426 434 442 450 460 486
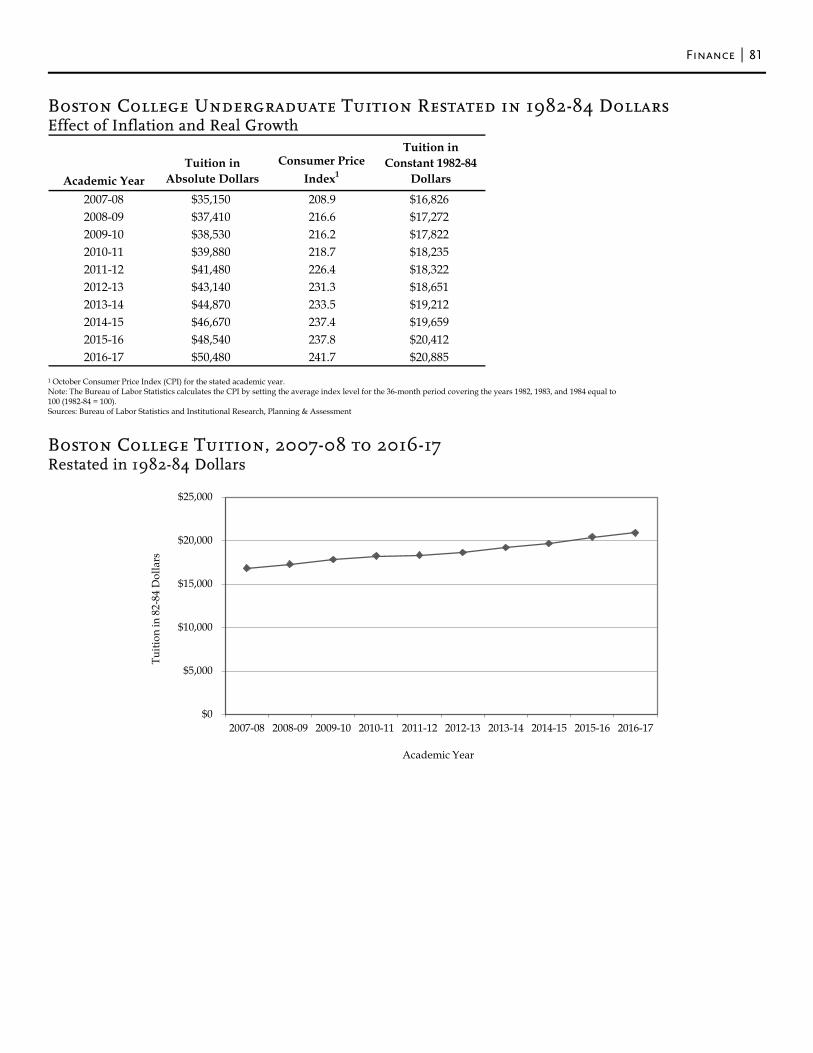
Finance 81
Boston College Undergraduate Tuition Restated in 1982-84 Dollars Effect of Inflation and Real Growth
1 October Consumer Price Index (CPI) for the stated academic year. Note: The Bureau of Labor Statistics calculates the CPI by setting the average index level for the 36-month period covering the years 1982, 1983, and 1984 equal to 100 (1982-84 = 100). Sources: Bureau of Labor Statistics and Institutional Research, Planning & Assessment
Boston College Tuition, 2007-08 to 2016-17 Restated in 1982-84 Dollars
Academic YearTuition in
Absolute DollarsConsumer Price
Index1
Tuition in Constant 1982-84
Dollars
2007-08 $35,150 208.9 $16,8262008-09 $37,410 216.6 $17,2722009-10 $38,530 216.2 $17,8222010-11 $39,880 218.7 $18,2352011-12 $41,480 226.4 $18,3222012-13 $43,140 231.3 $18,6512013-14 $44,870 233.5 $19,2122014-15 $46,670 237.4 $19,6592015-16 $48,540 237.8 $20,4122016-17 $50,480 241.7 $20,885
$0
$5,000
$10,000
$15,000
$20,000
$25,000
2007-08 2008-09 2009-10 2010-11 2011-12 2012-13 2013-14 2014-15 2015-16 2016-17
Tuiti
on in
82-
84 D
olla
rs
Academic Year


Academic Resources & Research Activity
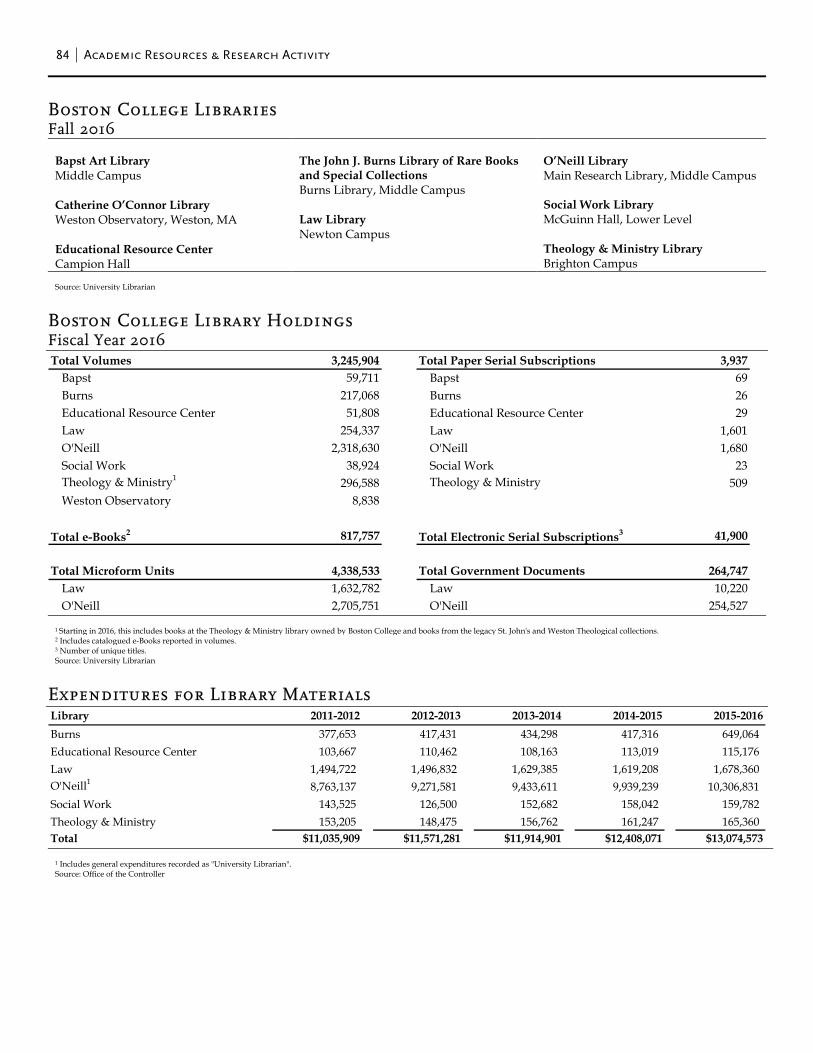
84 Academic Resources & Research Activity
Boston College Libraries Fall 2016
Bapst Art Library Middle Campus Catherine O’Connor Library Weston Observatory, Weston, MA Educational Resource Center Campion Hall
The John J. Burns Library of Rare Books and Special Collections Burns Library, Middle Campus Law Library Newton Campus
O’Neill Library Main Research Library, Middle Campus Social Work Library McGuinn Hall, Lower Level Theology & Ministry Library Brighton Campus
Source: University Librarian
Boston College Library Holdings Fiscal Year 2016
1 Starting in 2016, this includes books at the Theology & Ministry library owned by Boston College and books from the legacy St. John's and Weston Theological collections. 2 Includes catalogued e-Books reported in volumes. 3 Number of unique titles. Source: University Librarian
Expenditures for Library Materials
1 Includes general expenditures recorded as "University Librarian". Source: Office of the Controller
Total Volumes 3,245,904 Total Paper Serial Subscriptions 3,937Bapst 59,711 Bapst 69Burns 217,068 Burns 26Educational Resource Center 51,808 Educational Resource Center 29Law 254,337 Law 1,601O'Neill 2,318,630 O'Neill 1,680Social Work 38,924 Social Work 23Theology & Ministry1 296,588 Theology & Ministry 509Weston Observatory 8,838
Total e-Books2 817,757 Total Electronic Serial Subscriptions3 41,900
Total Microform Units 4,338,533 Total Government Documents 264,747Law 1,632,782 Law 10,220O'Neill 2,705,751 O'Neill 254,527
Library 2011-2012 2012-2013 2013-2014 2014-2015 2015-2016Burns 377,653 417,431 434,298 417,316 649,064Educational Resource Center 103,667 110,462 108,163 113,019 115,176Law 1,494,722 1,496,832 1,629,385 1,619,208 1,678,360O'Neill1 8,763,137 9,271,581 9,433,611 9,939,239 10,306,831Social Work 143,525 126,500 152,682 158,042 159,782Theology & Ministry 153,205 148,475 156,762 161,247 165,360Total $11,035,909 $11,571,281 $11,914,901 $12,408,071 $13,074,573
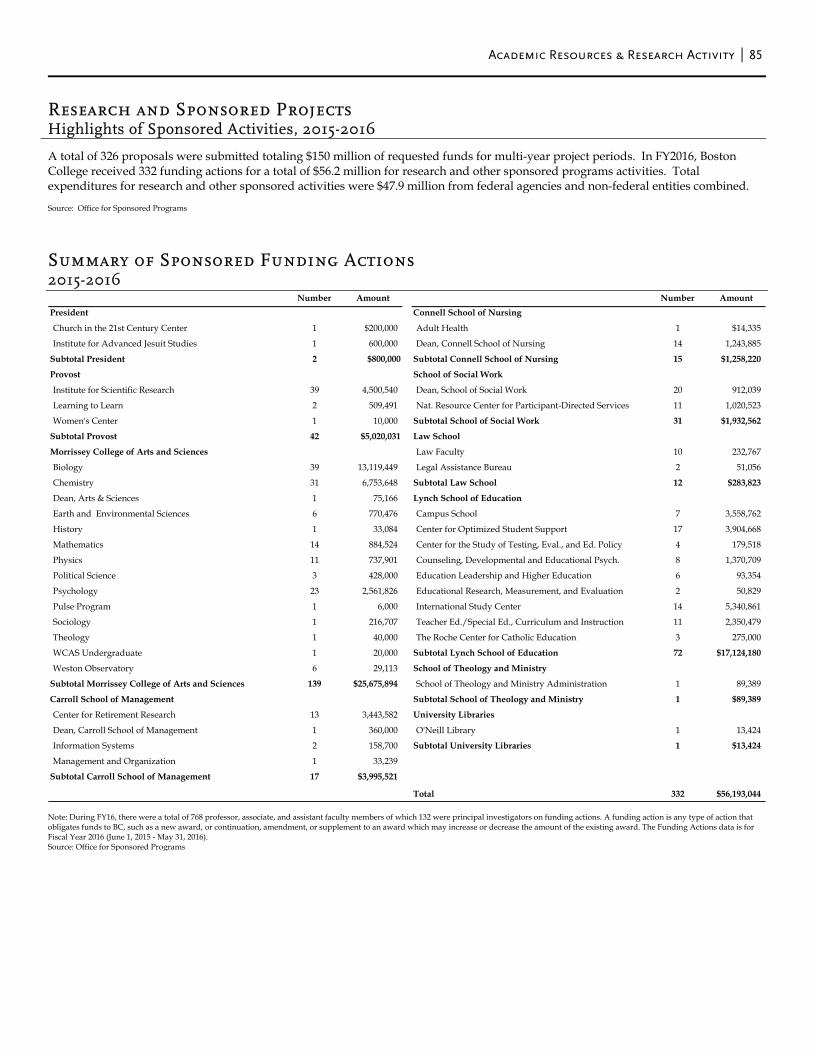
Academic Resources & Research Activity 85
Research and Sponsored Projects Highlights of Sponsored Activities, 2015-2016
A total of 326 proposals were submitted totaling $150 million of requested funds for multi-year project periods. In FY2016, Boston College received 332 funding actions for a total of $56.2 million for research and other sponsored programs activities. Total expenditures for research and other sponsored activities were $47.9 million from federal agencies and non-federal entities combined. Source: Office for Sponsored Programs
Summary of Sponsored Funding Actions 2015-2016
Note: During FY16, there were a total of 768 professor, associate, and assistant faculty members of which 132 were principal investigators on funding actions. A funding action is any type of action that obligates funds to BC, such as a new award, or continuation, amendment, or supplement to an award which may increase or decrease the amount of the existing award. The Funding Actions data is for Fiscal Year 2016 (June 1, 2015 - May 31, 2016). Source: Office for Sponsored Programs
Number Amount Number AmountPresident Connell School of Nursing
Church in the 21st Century Center 1 $200,000 Adult Health 1 $14,335
Institute for Advanced Jesuit Studies 1 600,000 Dean, Connell School of Nursing 14 1,243,885
Subtotal President 2 $800,000 Subtotal Connell School of Nursing 15 $1,258,220
Provost School of Social Work
Institute for Scientific Research 39 4,500,540 Dean, School of Social Work 20 912,039
Learning to Learn 2 509,491 Nat. Resource Center for Participant-Directed Services 11 1,020,523
Women's Center 1 10,000 Subtotal School of Social Work 31 $1,932,562
Subtotal Provost 42 $5,020,031 Law School
Morrissey College of Arts and Sciences Law Faculty 10 232,767
Biology 39 13,119,449 Legal Assistance Bureau 2 51,056
Chemistry 31 6,753,648 Subtotal Law School 12 $283,823
Dean, Arts & Sciences 1 75,166 Lynch School of Education
Earth and Environmental Sciences 6 770,476 Campus School 7 3,558,762
History 1 33,084 Center for Optimized Student Support 17 3,904,668
Mathematics 14 884,524 Center for the Study of Testing, Eval., and Ed. Policy 4 179,518
Physics 11 737,901 Counseling, Developmental and Educational Psych. 8 1,370,709
Political Science 3 428,000 Education Leadership and Higher Education 6 93,354
Psychology 23 2,561,826 Educational Research, Measurement, and Evaluation 2 50,829
Pulse Program 1 6,000 International Study Center 14 5,340,861
Sociology 1 216,707 Teacher Ed./Special Ed., Curriculum and Instruction 11 2,350,479
Theology 1 40,000 The Roche Center for Catholic Education 3 275,000
WCAS Undergraduate 1 20,000 Subtotal Lynch School of Education 72 $17,124,180
Weston Observatory 6 29,113 School of Theology and Ministry
Subtotal Morrissey College of Arts and Sciences 139 $25,675,894 School of Theology and Ministry Administration 1 89,389
Carroll School of Management Subtotal School of Theology and Ministry 1 $89,389
Center for Retirement Research 13 3,443,582 University Libraries
Dean, Carroll School of Management 1 360,000 O'Neill Library 1 13,424
Information Systems 2 158,700 Subtotal University Libraries 1 $13,424
Management and Organization 1 33,239
Subtotal Carroll School of Management 17 $3,995,521
Total 332 $56,193,044
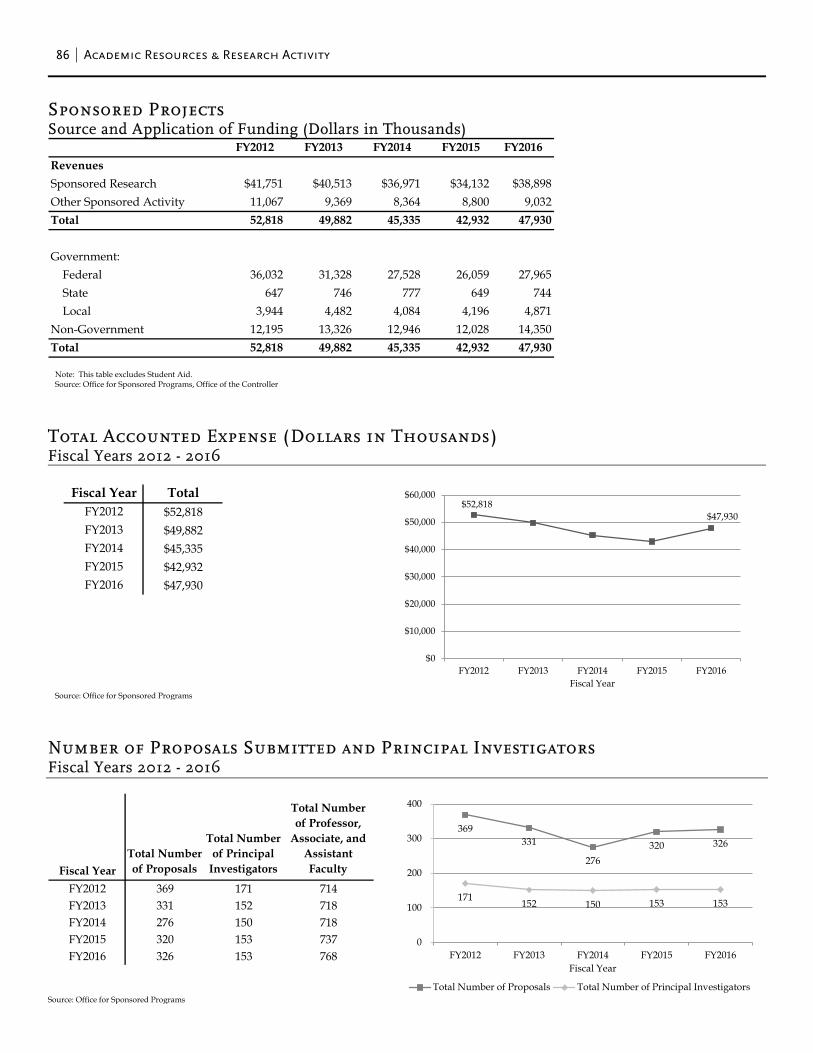
86 Academic Resources & Research Activity
Sponsored Projects Source and Application of Funding (Dollars in Thousands)
Note: This table excludes Student Aid. Source: Office for Sponsored Programs, Office of the Controller
Total Accounted Expense (Dollars in Thousands) Fiscal Years 2012 - 2016
Source: Office for Sponsored Programs
Number of Proposals Submitted and Principal Investigators Fiscal Years 2012 - 2016
Source: Office for Sponsored Programs
FY2012 FY2013 FY2014 FY2015 FY2016RevenuesSponsored Research $41,751 $40,513 $36,971 $34,132 $38,898Other Sponsored Activity 11,067 9,369 8,364 8,800 9,032Total 52,818 49,882 45,335 42,932 47,930
Government: Federal 36,032 31,328 27,528 26,059 27,965 State 647 746 777 649 744 Local 3,944 4,482 4,084 4,196 4,871Non-Government 12,195 13,326 12,946 12,028 14,350Total 52,818 49,882 45,335 42,932 47,930
Fiscal Year TotalFY2012 $52,818FY2013 $49,882FY2014 $45,335FY2015 $42,932FY2016 $47,930
$52,818$47,930
$0
$10,000
$20,000
$30,000
$40,000
$50,000
$60,000
FY2012 FY2013 FY2014 FY2015 FY2016Fiscal Year
Fiscal YearTotal Number of Proposals
Total Number of Principal
Investigators
Total Number of Professor,
Associate, and Assistant Faculty
FY2012 369 171 714FY2013 331 152 718FY2014 276 150 718FY2015 320 153 737FY2016 326 153 768
369 331
276 320 326
171 152 150 153 153
0
100
200
300
400
FY2012 FY2013 FY2014 FY2015 FY2016Fiscal Year
Total Number of Proposals Total Number of Principal Investigators

Athletics
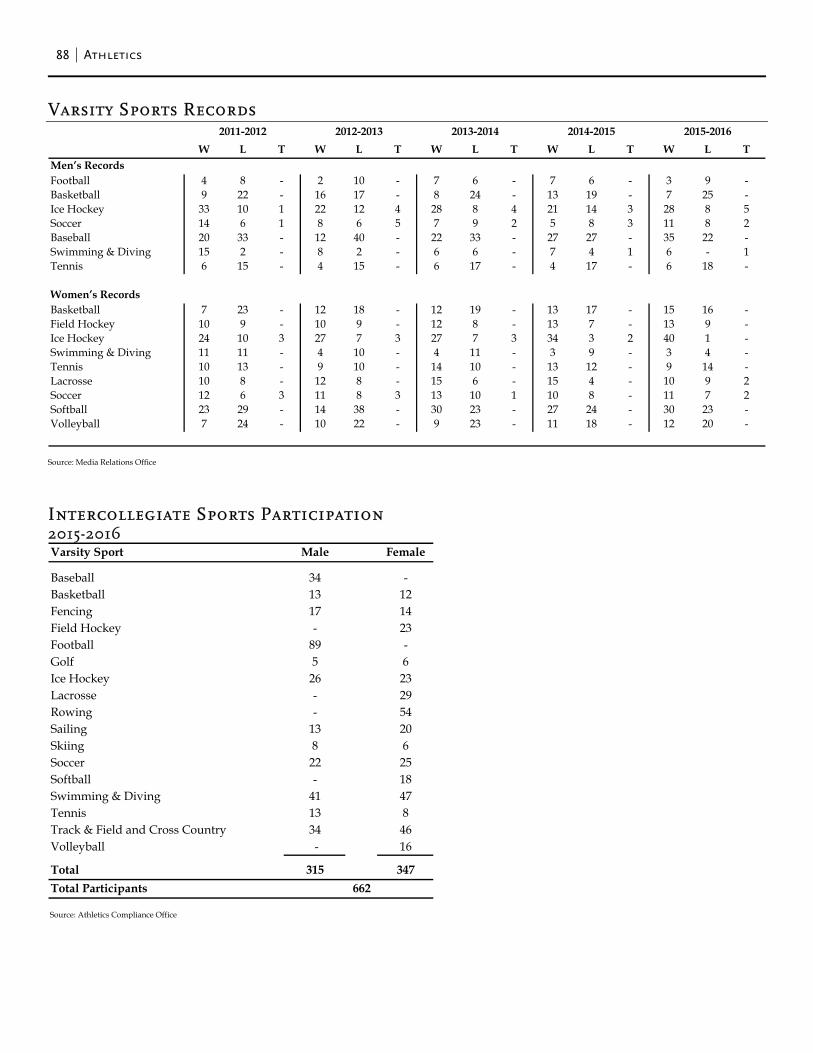
88 Athletics
Varsity Sports Records
Source: Media Relations Office Intercollegiate Sports Participation 2015-2016
Source: Athletics Compliance Office
W L T W L T W L T W L T W L TMen’s RecordsFootball 4 8 - 2 10 - 7 6 - 7 6 - 3 9 -Basketball 9 22 - 16 17 - 8 24 - 13 19 - 7 25 -Ice Hockey 33 10 1 22 12 4 28 8 4 21 14 3 28 8 5Soccer 14 6 1 8 6 5 7 9 2 5 8 3 11 8 2Baseball 20 33 - 12 40 - 22 33 - 27 27 - 35 22 -Swimming & Diving 15 2 - 8 2 - 6 6 - 7 4 1 6 - 1Tennis 6 15 - 4 15 - 6 17 - 4 17 - 6 18 -
Women’s RecordsBasketball 7 23 - 12 18 - 12 19 - 13 17 - 15 16 -Field Hockey 10 9 - 10 9 - 12 8 - 13 7 - 13 9 -Ice Hockey 24 10 3 27 7 3 27 7 3 34 3 2 40 1 -Swimming & Diving 11 11 - 4 10 - 4 11 - 3 9 - 3 4 -Tennis 10 13 - 9 10 - 14 10 - 13 12 - 9 14 -Lacrosse 10 8 - 12 8 - 15 6 - 15 4 - 10 9 2Soccer 12 6 3 11 8 3 13 10 1 10 8 - 11 7 2Softball 23 29 - 14 38 - 30 23 - 27 24 - 30 23 -Volleyball 7 24 - 10 22 - 9 23 - 11 18 - 12 20 -
2015-20162011-2012 2012-2013 2013-2014 2014-2015
Varsity Sport Male Female
Baseball 34 -Basketball 13 12Fencing 17 14Field Hockey - 23Football 89 -Golf 5 6Ice Hockey 26 23Lacrosse - 29Rowing - 54Sailing 13 20Skiing 8 6Soccer 22 25Softball - 18Swimming & Diving 41 47Tennis 13 8Track & Field and Cross Country 34 46Volleyball - 16
Total 315 347Total Participants 662
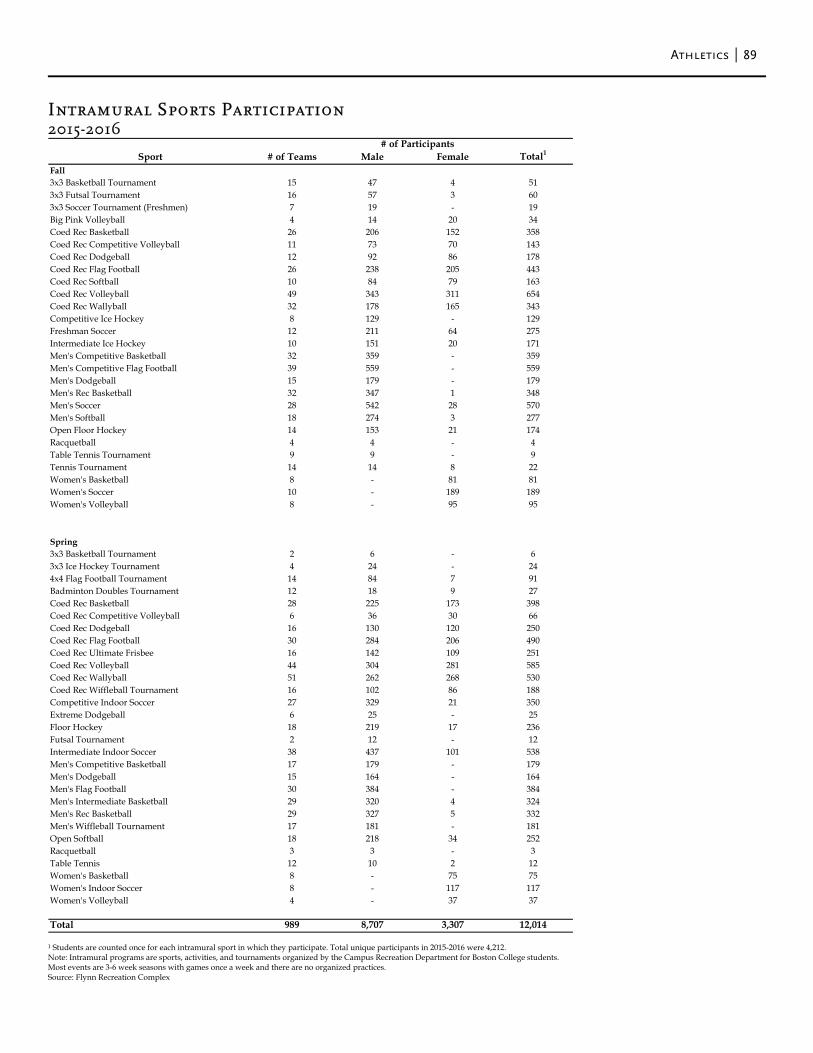
Athletics 89
Intramural Sports Participation 2015-2016
1 Students are counted once for each intramural sport in which they participate. Total unique participants in 2015-2016 were 4,212. Note: Intramural programs are sports, activities, and tournaments organized by the Campus Recreation Department for Boston College students. Most events are 3-6 week seasons with games once a week and there are no organized practices. Source: Flynn Recreation Complex
# of Teams Male FemaleFall3x3 Basketball Tournament 15 47 4 513x3 Futsal Tournament 16 57 3 603x3 Soccer Tournament (Freshmen) 7 19 - 19Big Pink Volleyball 4 14 20 34Coed Rec Basketball 26 206 152 358Coed Rec Competitive Volleyball 11 73 70 143Coed Rec Dodgeball 12 92 86 178Coed Rec Flag Football 26 238 205 443Coed Rec Softball 10 84 79 163Coed Rec Volleyball 49 343 311 654Coed Rec Wallyball 32 178 165 343Competitive Ice Hockey 8 129 - 129Freshman Soccer 12 211 64 275Intermediate Ice Hockey 10 151 20 171Men's Competitive Basketball 32 359 - 359Men's Competitive Flag Football 39 559 - 559Men's Dodgeball 15 179 - 179Men's Rec Basketball 32 347 1 348Men's Soccer 28 542 28 570Men's Softball 18 274 3 277Open Floor Hockey 14 153 21 174Racquetball 4 4 - 4Table Tennis Tournament 9 9 - 9Tennis Tournament 14 14 8 22Women's Basketball 8 - 81 81Women's Soccer 10 - 189 189Women's Volleyball 8 - 95 95
Spring3x3 Basketball Tournament 2 6 - 63x3 Ice Hockey Tournament 4 24 - 244x4 Flag Football Tournament 14 84 7 91Badminton Doubles Tournament 12 18 9 27Coed Rec Basketball 28 225 173 398Coed Rec Competitive Volleyball 6 36 30 66Coed Rec Dodgeball 16 130 120 250Coed Rec Flag Football 30 284 206 490Coed Rec Ultimate Frisbee 16 142 109 251Coed Rec Volleyball 44 304 281 585Coed Rec Wallyball 51 262 268 530Coed Rec Wiffleball Tournament 16 102 86 188Competitive Indoor Soccer 27 329 21 350Extreme Dodgeball 6 25 - 25Floor Hockey 18 219 17 236Futsal Tournament 2 12 - 12Intermediate Indoor Soccer 38 437 101 538Men's Competitive Basketball 17 179 - 179Men's Dodgeball 15 164 - 164Men's Flag Football 30 384 - 384Men's Intermediate Basketball 29 320 4 324Men's Rec Basketball 29 327 5 332Men's Wiffleball Tournament 17 181 - 181Open Softball 18 218 34 252Racquetball 3 3 - 3Table Tennis 12 10 2 12Women's Basketball 8 - 75 75Women's Indoor Soccer 8 - 117 117Women's Volleyball 4 - 37 37
Total 989 8,707 3,307 12,014
# of ParticipantsTotal1Sport
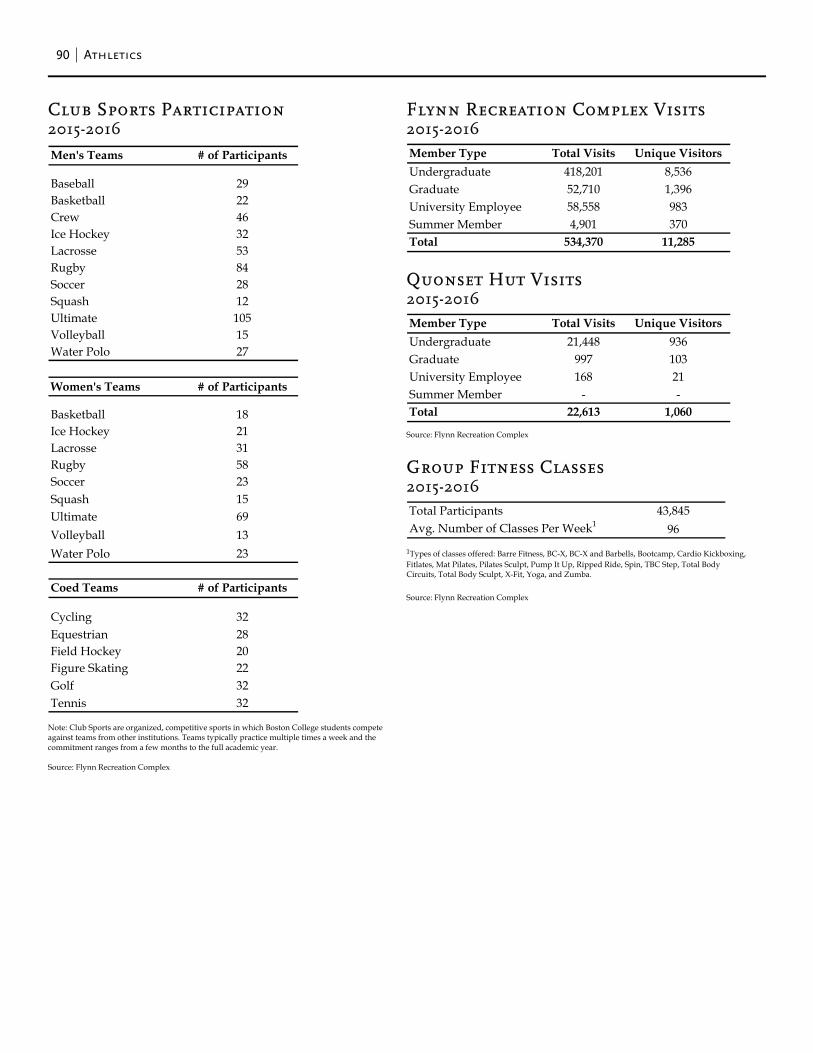
90 Athletics
Club Sports Participation 2015-2016
Flynn Recreation Complex Visits 2015-2016
Quonset Hut Visits 2015-2016
Source: Flynn Recreation Complex
Group Fitness Classes 2015-2016
1Types of classes offered: Barre Fitness, BC-X, BC-X and Barbells, Bootcamp, Cardio Kickboxing, Fitlates, Mat Pilates, Pilates Sculpt, Pump It Up, Ripped Ride, Spin, TBC Step, Total Body Circuits, Total Body Sculpt, X-Fit, Yoga, and Zumba. Source: Flynn Recreation Complex
Note: Club Sports are organized, competitive sports in which Boston College students compete against teams from other institutions. Teams typically practice multiple times a week and the commitment ranges from a few months to the full academic year.
Source: Flynn Recreation Complex
Men's Teams # of Participants
Baseball 29Basketball 22Crew 46Ice Hockey 32Lacrosse 53Rugby 84Soccer 28Squash 12Ultimate 105Volleyball 15Water Polo 27
Women's Teams # of Participants
Basketball 18Ice Hockey 21Lacrosse 31Rugby 58Soccer 23Squash 15Ultimate 69Volleyball 13Water Polo 23
Coed Teams # of Participants
Cycling 32Equestrian 28Field Hockey 20Figure Skating 22Golf 32Tennis 32
Member Type Total Visits Unique VisitorsUndergraduate 418,201 8,536Graduate 52,710 1,396University Employee 58,558 983Summer Member 4,901 370Total 534,370 11,285
Member Type Total Visits Unique VisitorsUndergraduate 21,448 936Graduate 997 103University Employee 168 21Summer Member - -Total 22,613 1,060
Total Participants 43,845Avg. Number of Classes Per Week1 96

General Information
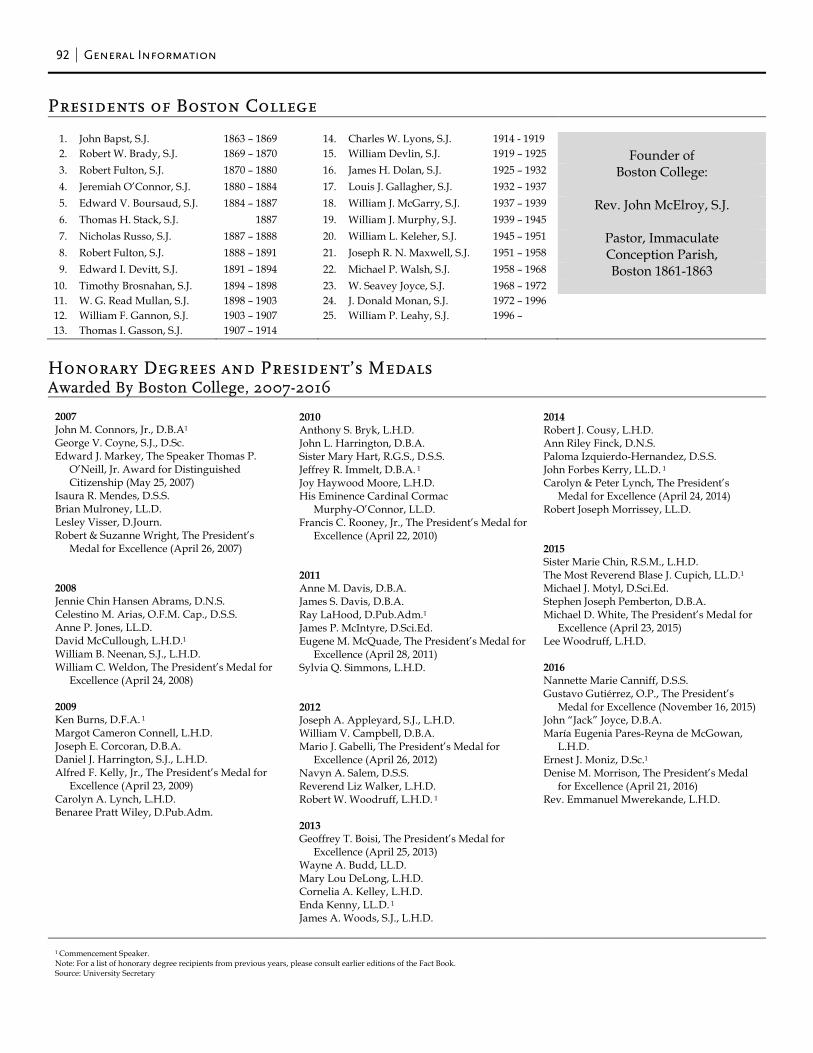
92 General Information
Presidents of Boston College
1. John Bapst, S.J. 1863 – 1869 14. Charles W. Lyons, S.J. 1914 - 1919 2. Robert W. Brady, S.J. 1869 – 1870 15. William Devlin, S.J. 1919 – 1925 Founder of 3. Robert Fulton, S.J. 1870 – 1880 16. James H. Dolan, S.J. 1925 – 1932 Boston College: 4. Jeremiah O’Connor, S.J. 1880 – 1884 17. Louis J. Gallagher, S.J. 1932 – 1937 5. Edward V. Boursaud, S.J. 1884 – 1887 18. William J. McGarry, S.J. 1937 – 1939 Rev. John McElroy, S.J. 6. Thomas H. Stack, S.J. 1887 19. William J. Murphy, S.J. 1939 – 1945 7. Nicholas Russo, S.J. 1887 – 1888 20. William L. Keleher, S.J. 1945 – 1951 Pastor, Immaculate 8. Robert Fulton, S.J. 1888 – 1891 21. Joseph R. N. Maxwell, S.J. 1951 – 1958 Conception Parish, 9. Edward I. Devitt, S.J. 1891 – 1894 22. Michael P. Walsh, S.J. 1958 – 1968 Boston 1861-1863
10. Timothy Brosnahan, S.J. 1894 – 1898 23. W. Seavey Joyce, S.J. 1968 – 1972 11. W. G. Read Mullan, S.J. 1898 – 1903 24. J. Donald Monan, S.J. 1972 – 1996 12. William F. Gannon, S.J. 1903 – 1907 25. William P. Leahy, S.J. 1996 – 13. Thomas I. Gasson, S.J. 1907 – 1914
Honorary Degrees and President’s Medals Awarded By Boston College, 2007-2016
2007 John M. Connors, Jr., D.B.A1 George V. Coyne, S.J., D.Sc. Edward J. Markey, The Speaker Thomas P.
O’Neill, Jr. Award for Distinguished Citizenship (May 25, 2007)
Isaura R. Mendes, D.S.S. Brian Mulroney, LL.D. Lesley Visser, D.Journ. Robert & Suzanne Wright, The President’s
Medal for Excellence (April 26, 2007) 2008 Jennie Chin Hansen Abrams, D.N.S. Celestino M. Arias, O.F.M. Cap., D.S.S. Anne P. Jones, LL.D. David McCullough, L.H.D.1 William B. Neenan, S.J., L.H.D. William C. Weldon, The President’s Medal for
Excellence (April 24, 2008) 2009 Ken Burns, D.F.A. 1
Margot Cameron Connell, L.H.D. Joseph E. Corcoran, D.B.A. Daniel J. Harrington, S.J., L.H.D. Alfred F. Kelly, Jr., The President’s Medal for
Excellence (April 23, 2009) Carolyn A. Lynch, L.H.D. Benaree Pratt Wiley, D.Pub.Adm.
2010 Anthony S. Bryk, L.H.D. John L. Harrington, D.B.A. Sister Mary Hart, R.G.S., D.S.S. Jeffrey R. Immelt, D.B.A. 1 Joy Haywood Moore, L.H.D. His Eminence Cardinal Cormac
Murphy-O’Connor, LL.D. Francis C. Rooney, Jr., The President’s Medal for
Excellence (April 22, 2010) 2011 Anne M. Davis, D.B.A. James S. Davis, D.B.A. Ray LaHood, D.Pub.Adm.1 James P. McIntyre, D.Sci.Ed. Eugene M. McQuade, The President’s Medal for
Excellence (April 28, 2011) Sylvia Q. Simmons, L.H.D. 2012 Joseph A. Appleyard, S.J., L.H.D. William V. Campbell, D.B.A. Mario J. Gabelli, The President’s Medal for
Excellence (April 26, 2012) Navyn A. Salem, D.S.S. Reverend Liz Walker, L.H.D. Robert W. Woodruff, L.H.D. 1 2013 Geoffrey T. Boisi, The President’s Medal for
Excellence (April 25, 2013) Wayne A. Budd, LL.D. Mary Lou DeLong, L.H.D. Cornelia A. Kelley, L.H.D. Enda Kenny, LL.D. 1 James A. Woods, S.J., L.H.D.
2014 Robert J. Cousy, L.H.D. Ann Riley Finck, D.N.S. Paloma Izquierdo-Hernandez, D.S.S. John Forbes Kerry, LL.D. 1 Carolyn & Peter Lynch, The President’s
Medal for Excellence (April 24, 2014) Robert Joseph Morrissey, LL.D. 2015 Sister Marie Chin, R.S.M., L.H.D. The Most Reverend Blase J. Cupich, LL.D.1 Michael J. Motyl, D.Sci.Ed. Stephen Joseph Pemberton, D.B.A. Michael D. White, The President’s Medal for
Excellence (April 23, 2015) Lee Woodruff, L.H.D. 2016 Nannette Marie Canniff, D.S.S. Gustavo Gutiérrez, O.P., The President’s
Medal for Excellence (November 16, 2015) John “Jack” Joyce, D.B.A. María Eugenia Pares-Reyna de McGowan,
L.H.D. Ernest J. Moniz, D.Sc.1
Denise M. Morrison, The President’s Medal for Excellence (April 21, 2016)
Rev. Emmanuel Mwerekande, L.H.D.
1 Commencement Speaker. Note: For a list of honorary degree recipients from previous years, please consult earlier editions of the Fact Book. Source: University Secretary
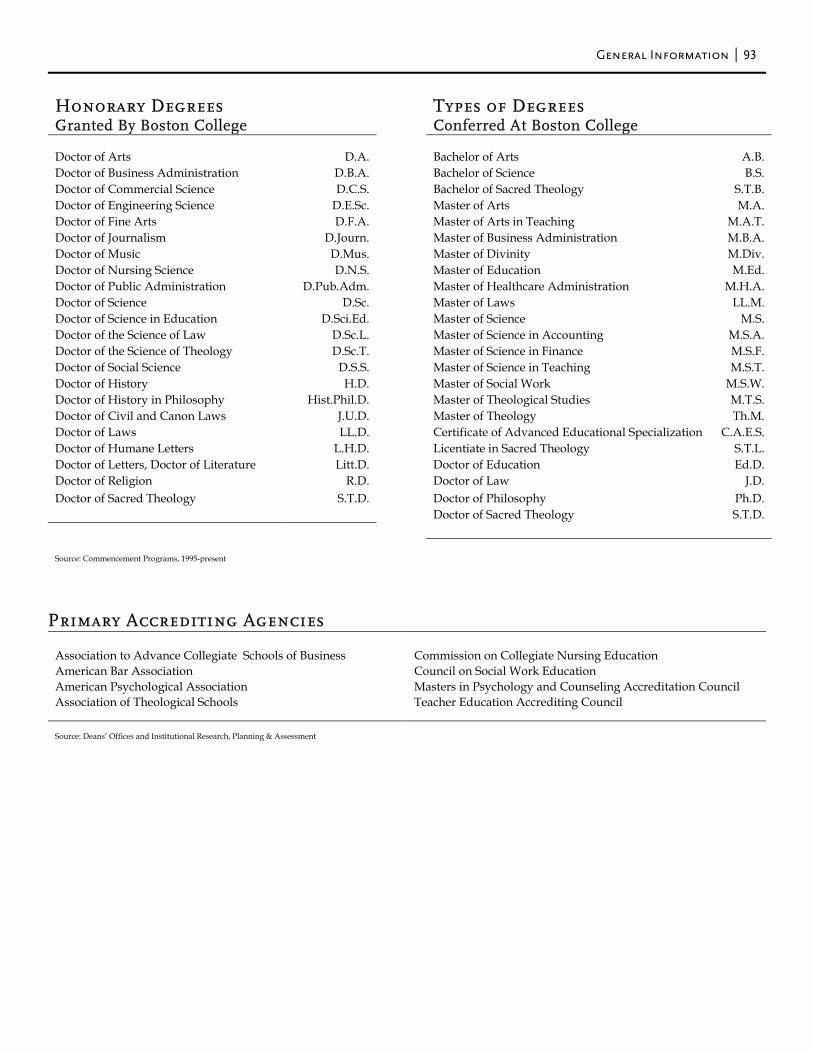
General Information 93
Honorary Degrees Types of Degrees Granted By Boston College Conferred At Boston College Doctor of Arts D.A. Bachelor of Arts A.B. Doctor of Business Administration D.B.A. Bachelor of Science B.S. Doctor of Commercial Science D.C.S. Bachelor of Sacred Theology S.T.B. Doctor of Engineering Science D.E.Sc. Master of Arts M.A. Doctor of Fine Arts D.F.A. Master of Arts in Teaching M.A.T. Doctor of Journalism D.Journ. Master of Business Administration M.B.A. Doctor of Music D.Mus. Master of Divinity M.Div. Doctor of Nursing Science D.N.S. Master of Education M.Ed. Doctor of Public Administration D.Pub.Adm. Master of Healthcare Administration M.H.A. Doctor of Science D.Sc. Master of Laws LL.M. Doctor of Science in Education D.Sci.Ed. Master of Science M.S. Doctor of the Science of Law D.Sc.L. Master of Science in Accounting M.S.A. Doctor of the Science of Theology D.Sc.T. Master of Science in Finance M.S.F. Doctor of Social Science D.S.S. Master of Science in Teaching M.S.T. Doctor of History H.D. Master of Social Work M.S.W. Doctor of History in Philosophy Hist.Phil.D. Master of Theological Studies M.T.S. Doctor of Civil and Canon Laws J.U.D. Master of Theology Th.M. Doctor of Laws LL.D. Certificate of Advanced Educational Specialization C.A.E.S. Doctor of Humane Letters L.H.D. Licentiate in Sacred Theology S.T.L. Doctor of Letters, Doctor of Literature Litt.D. Doctor of Education Ed.D. Doctor of Religion R.D. Doctor of Law J.D. Doctor of Sacred Theology S.T.D. Doctor of Philosophy Ph.D. Doctor of Sacred Theology S.T.D. Source: Commencement Programs, 1995-present
Primary Accrediting Agencies
Association to Advance Collegiate Schools of Business American Bar Association American Psychological Association Association of Theological Schools
Commission on Collegiate Nursing Education Council on Social Work Education Masters in Psychology and Counseling Accreditation Council Teacher Education Accrediting Council
Source: Deans’ Offices and Institutional Research, Planning & Assessment
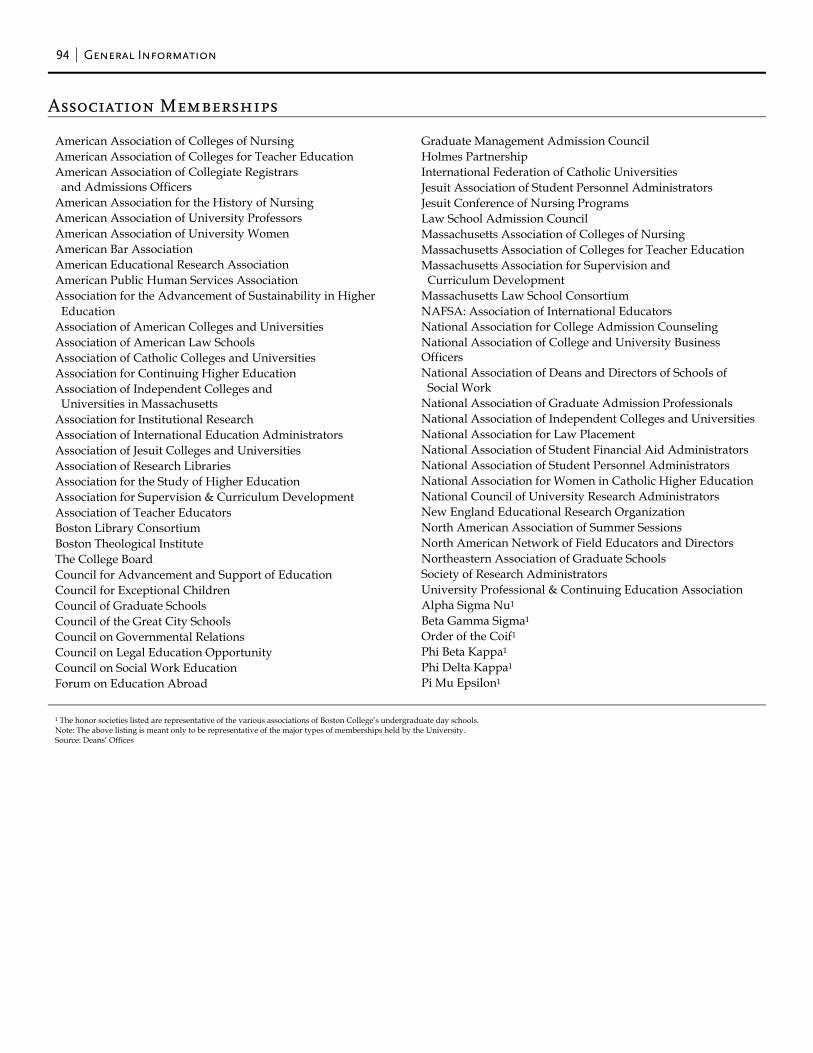
94 General Information
Association Memberships
American Association of Colleges of Nursing American Association of Colleges for Teacher Education American Association of Collegiate Registrars and Admissions Officers American Association for the History of Nursing American Association of University Professors American Association of University Women American Bar Association American Educational Research Association American Public Human Services Association Association for the Advancement of Sustainability in Higher Education Association of American Colleges and Universities Association of American Law Schools Association of Catholic Colleges and Universities Association for Continuing Higher Education Association of Independent Colleges and Universities in Massachusetts Association for Institutional Research Association of International Education Administrators Association of Jesuit Colleges and Universities Association of Research Libraries Association for the Study of Higher Education Association for Supervision & Curriculum Development Association of Teacher Educators Boston Library Consortium Boston Theological Institute The College Board Council for Advancement and Support of Education Council for Exceptional Children Council of Graduate Schools Council of the Great City Schools Council on Governmental Relations Council on Legal Education Opportunity Council on Social Work Education Forum on Education Abroad
Graduate Management Admission Council Holmes Partnership International Federation of Catholic Universities Jesuit Association of Student Personnel Administrators Jesuit Conference of Nursing Programs Law School Admission Council Massachusetts Association of Colleges of Nursing Massachusetts Association of Colleges for Teacher Education Massachusetts Association for Supervision and Curriculum Development Massachusetts Law School Consortium NAFSA: Association of International Educators National Association for College Admission Counseling National Association of College and University Business Officers National Association of Deans and Directors of Schools of Social Work National Association of Graduate Admission Professionals National Association of Independent Colleges and Universities National Association for Law Placement National Association of Student Financial Aid Administrators National Association of Student Personnel Administrators National Association for Women in Catholic Higher Education National Council of University Research Administrators New England Educational Research Organization North American Association of Summer Sessions North American Network of Field Educators and Directors Northeastern Association of Graduate Schools Society of Research Administrators University Professional & Continuing Education Association Alpha Sigma Nu1 Beta Gamma Sigma1 Order of the Coif1 Phi Beta Kappa1 Phi Delta Kappa1
Pi Mu Epsilon1
1 The honor societies listed are representative of the various associations of Boston College’s undergraduate day schools. Note: The above listing is meant only to be representative of the major types of memberships held by the University. Source: Deans’ Offices
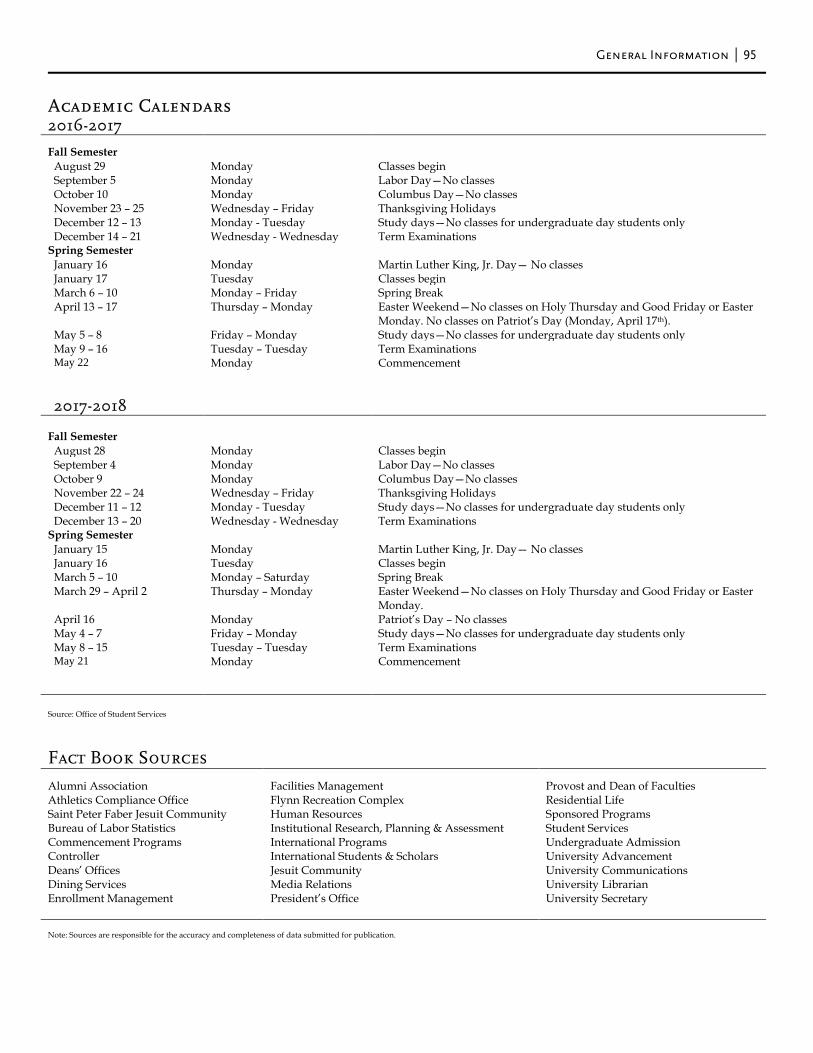
General Information 95
Academic Calendars 2016-2017 Fall Semester
August 29 Monday Classes begin September 5 Monday Labor Day—No classes October 10 Monday Columbus Day—No classes November 23 – 25 Wednesday – Friday Thanksgiving Holidays December 12 – 13 Monday - Tuesday Study days—No classes for undergraduate day students only December 14 – 21 Wednesday - Wednesday Term Examinations
Spring Semester January 16 Monday Martin Luther King, Jr. Day— No classes January 17 Tuesday Classes begin March 6 – 10 Monday – Friday Spring Break April 13 – 17 Thursday – Monday Easter Weekend—No classes on Holy Thursday and Good Friday or Easter
Monday. No classes on Patriot’s Day (Monday, April 17th). May 5 – 8 Friday – Monday Study days—No classes for undergraduate day students only May 9 – 16 Tuesday – Tuesday Term Examinations May 22 Monday Commencement
2017-2018
Fall Semester
August 28 Monday Classes begin September 4 Monday Labor Day—No classes October 9 Monday Columbus Day—No classes November 22 – 24 Wednesday – Friday Thanksgiving Holidays December 11 – 12 Monday - Tuesday Study days—No classes for undergraduate day students only December 13 – 20 Wednesday - Wednesday Term Examinations
Spring Semester January 15 Monday Martin Luther King, Jr. Day— No classes January 16 Tuesday Classes begin March 5 – 10 Monday – Saturday Spring Break March 29 – April 2 Thursday – Monday Easter Weekend—No classes on Holy Thursday and Good Friday or Easter
Monday. April 16 Monday Patriot’s Day – No classes May 4 – 7 Friday – Monday Study days—No classes for undergraduate day students only May 8 – 15 Tuesday – Tuesday Term Examinations May 21 Monday Commencement
Source: Office of Student Services
Fact Book Sources Alumni Association Athletics Compliance Office Saint Peter Faber Jesuit Community Bureau of Labor Statistics Commencement Programs Controller Deans’ Offices Dining Services Enrollment Management
Facilities Management Flynn Recreation Complex Human Resources Institutional Research, Planning & Assessment International Programs International Students & Scholars Jesuit Community Media Relations President’s Office
Provost and Dean of Faculties Residential Life Sponsored Programs Student Services Undergraduate Admission University Advancement University Communications University Librarian University Secretary
Note: Sources are responsible for the accuracy and completeness of data submitted for publication.
96 General Information
Fact Book Index Academic Administration, 17 Academic Calendars, 95 Academic Institutes and Centers, 18 Academic Resources and Research Activity, 84-86 Accrediting Agencies, 93 Administration and Faculty, 14-32 Alumni and Advancement, 58-65 Alumni Association National Board of Directors, 58 Alumni Association Regional Chapters, 58 Alumni Awards, 58 Alumni by Gender and Class, 62 Alumni by Primary School and Class, 60-61 Alumni Donors by Primary School and Class, 64-65 Alumni Geographic Distribution, 59 Applications, Acceptances, and Enrollment, Freshman, 34 Applications, Acceptances, and Enrollment, Transfer Students, 36 Association Memberships, 94 Athletics, 88-90 Board of Trustee Associate Membership, 15-16 Board of Trustee Chairs, 16 Board of Trustee Membership, 14 Boston College, A Brief History, 6 Boston College, A Chronology, 7-10 Boston College Profile, 11 Boston College Properties, 71 Building Use, Summary, 72 Buildings and Grounds, See Physical Plant Buildings, Boston College, 68-71 Campus Maps, 98-102 Chairs, Board of Trustees, 16 Charts of Administration, 20-23 Chronology, Boston College, 7-10 Classrooms, 73 Club Sports Participation, 90 Compensation, Faculty, 32 Contracts and Grants, See Academic Resources and Research
Activity Credit Hours by School, 38 Cross Application Competitor Schools, 36 Deans, Academic, See Academic Administration Degrees Conferred at Boston College, Types, 93 Degrees Conferred, 49-53 Development Statistics, 58-65 Dining Facilities, 73 Donors by Giving Club, 63 Dormitories, See Residence Halls
Enrollment, Full-Time Equivalent, 41 Enrollment, Full-Time Freshman by Year and Gender, 34 Enrollment, Graduate, 38-39, 41, 43 Enrollment, International Students, 47-48 Enrollment, by Race/Ethnicity, Gender, and Citizenship, 40 Enrollment, Summer Session, 41 Enrollment, Undergraduate by School, Gender, and Status, 38-39 Enrollment, Undergraduate Majors by School, 44 Enrollment, Undergraduate Minors by School, 45 Enrollment, Undergraduate Transfer Students, 36 Executive Vice President Units, 23 Facilities, See Physical Plant Facility Capacities, 72 Faculty, Administration and, 14-32 Faculty, Compensation by Rank, 32 Faculty, by Highest Degree Earned and Gender, 27 Faculty, by Highest Degree Earned and Rank, 28 Faculty, by Rank and Gender, 28 Faculty, by School and Gender, 26 Faculty, by School and Rank, 26 Faculty, by School and Tenure Status, 27 Faculty, Full-Time Equivalent by School, 29 Faculty, Full-Time, Teaching Fellows, Teaching Assistants by
School and Department, 30-31 Fellowships, 55 Finance, 78-81 Financial Aid, Undergraduate, 54 Financial Operations, Highlights, 78 Financial Position, Condensed Statement, 79 Flynn Recreation Complex, 90 Founder of Boston College, 92 Freshman Admission Profile, 34 Freshman Applications, Acceptances, and Enrollment, 34 Freshman, Full-Time, Enrollment by Year and Gender, 34 Freshman, Geographic Distribution, 35 Full-Time Equivalent Enrollment, 41 Fundraising, See Alumni and Advancement General Information, 92-102 Geographic Distribution, Alumni, 59 Geographic Distribution, Freshman Class, 35 Geographic Distribution, Undergraduates, 37 Geographic Distribution, Undergraduate and Graduate
International Students, 48 Gifts to the University, 63 Graduate Degrees Conferred, 49, 53 Graduate Enrollment, 38-39, 41, 43 Graduation, Retention Rates, 55 Grant Statistics, See Academic Resources and Research Activity
General Information 97
Fact Book Index (Continued) History, Boston College, 6 Honorary Degrees Awarded, 92 Honorary Degrees, Types Granted, 93 Intercollegiate Sports Participation, 88 International Students and Scholars Statistics, 47-48 Intramural Sports Participation, 89 Institutes and Centers, Academic, 18 Jesuit Community Owned Properties, Boston College, 71 Jesuit Community at Boston College, 19 Jesuit Community at Boston College, Saint Peter Faber, 19 Libraries, 84 Library Expenditures, 84 Library Holdings, 84 Majors, Undergraduate, 44, 46 Maps, Campus, 98-102 Minors, Undergraduate, 45, 46 Mission Statement, 2 Officers of the University, 17 Organization Chart, Administration, 20 Organization Chart, Provost and Dean of Faculties Units, 21-22 Organization Chart, Executive Vice President Units, 23 Personnel, Professional, Administrative, and Support Staff, 24-25 Personnel, Restricted Funded, 25 Physical Plant, 68-75 Presidents of Boston College, 92 Profile, Boston College, 11 Properties, Boston College, 71 Provost and Dean of Faculties Units, 21-22 Quonset Hut, 90 Research and Sponsored Projects, 85-86 Residence Hall Statistics by Building, 74-75 Restricted Funded Personnel, 25 Retention and Graduation Rates, 55
SAT, Middle Range, Freshman, 34 Sources of Fact Book Information, 95 Sponsored Activities, Highlights, 85 Sponsored Funding Actions Summary, 85 Sponsored Projects, Proposals Submitted and Principal
Investigators, 86 Sponsored Projects, Source and Application, 86 Sponsored Projects, Total Accounted Expense, 86 Sports Participation, Club, 90 Sports Participation, Intercollegiate Statistics, 88 Sports Participation, Intramural, 89 Sports Records, Varsity, 88 Student Credit Hours by School, 38 Students, 34-55 Students Studying Abroad, 42 Summer Session Enrollment, 41 Teaching Fellows, Teaching Assistants, and Full-Time Faculty,
29-31 Transfer Students, Applications, Acceptances, and Enrollment, 36 Transfer Students, Enrollment by Previous Institution and
Gender, 36 Trustee Associate Membership, 15-16 Trustee Membership, Board of, 14 Tuition and Fees, 80-81 Undergraduate Financial Aid, 54 Undergraduate Degrees Conferred, 49-52 Undergraduate Enrollment, 38-41 Undergraduate Enrollment by Gender, 38-39 Undergraduate Enrollment by School, 38-39, 41 Undergraduate Enrollment, Full- and Part-Time, 38-39 Undergraduate Enrollment, Full-Time Equivalent, 41 Undergraduate Geographic Distribution, 37 Undergraduate Majors, 44, 46 Undergraduate Minors, 45-46 Undergraduate Retention and Graduation Rates, 55 Varsity Sports Records, 88
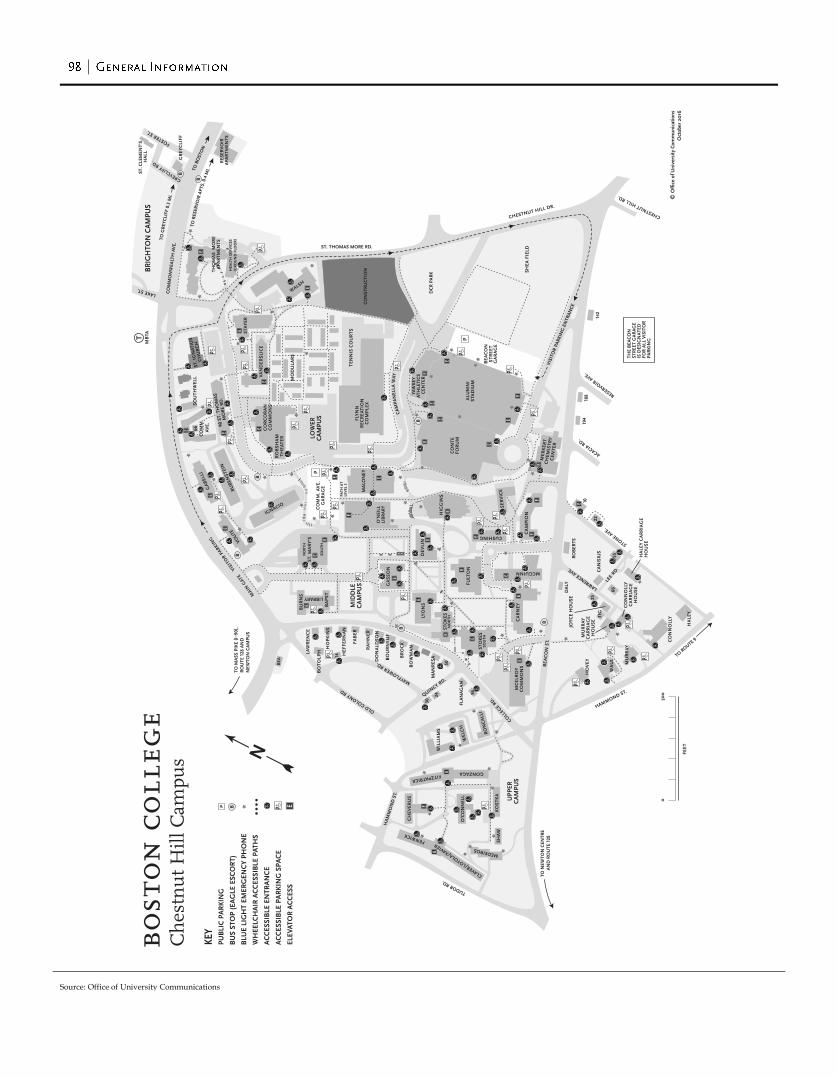
Source: Office of University Communications
LOW
ERC
AM
PUS
MID
DLE
CA
MPU
S
UPP
ERC
AM
PUS
STA
YER
ST. C
LEM
ENT’
S H
ALL
FLA
NA
GA
N
66 90
ST.
TH
OM
AS
MO
RE R
D.
TO M
ASS
PIK
E (I
–90)
, R
OU
TE 1
28 A
ND
N
EWTO
N C
AM
PUS
14
30
24 36
50
STO
KES
22
194
TO N
EWTO
N C
ENTR
E A
ND
RO
UTE
128
O’C
ON
NEL
L
ST. THOMAS MORE RD.
188
142
TO ROUTE 9
25
31G
5566
10
RO
BER
TS
DA
LY
CO
MM
. AV
E.
SOU
TH
STO
KES
NO
RTH
PATH
AT
LEV
EL 5
O’N
EILL
LIB
RA
RY
LAWRENCE AVE.
THO
MA
S M
OR
EA
PAR
TMEN
TSR
ESER
VO
IR
APA
RTM
ENTS
YAW
KEY
ATH
LETI
CS
CEN
TER
CO
MM
ON
WEA
LTH
AV
E.
DC
R P
AR
K
NO
RTH
HEA
LTH
SER
VIC
ES(G
RO
UN
D F
LOO
R)
SOU
TH
CO
NST
RU
CTI
ON
TO R
ESER
VOIR
APT
S. 0
.4 M
I.TO B
OST
ON
TO
GRE
YCLI
FF 0
.3 M
I.
WH
EELC
HA
IR A
CC
ESSI
BLE
PAT
HS
AC
CES
SIB
LE E
NTR
AN
CE
AC
CES
SIB
LE P
AR
KIN
G S
PAC
E
ELEV
ATO
R A
CC
ESS
KEY
PPU
BLI
C P
AR
KIN
G
BU
S ST
OP
(EA
GLE
ESC
OR
T)
BLU
E LI
GH
T EM
ERG
ENC
Y PH
ON
E
© O
ffice
of U
nive
rsity
Com
mun
icat
ions
Oct
ober
201
6
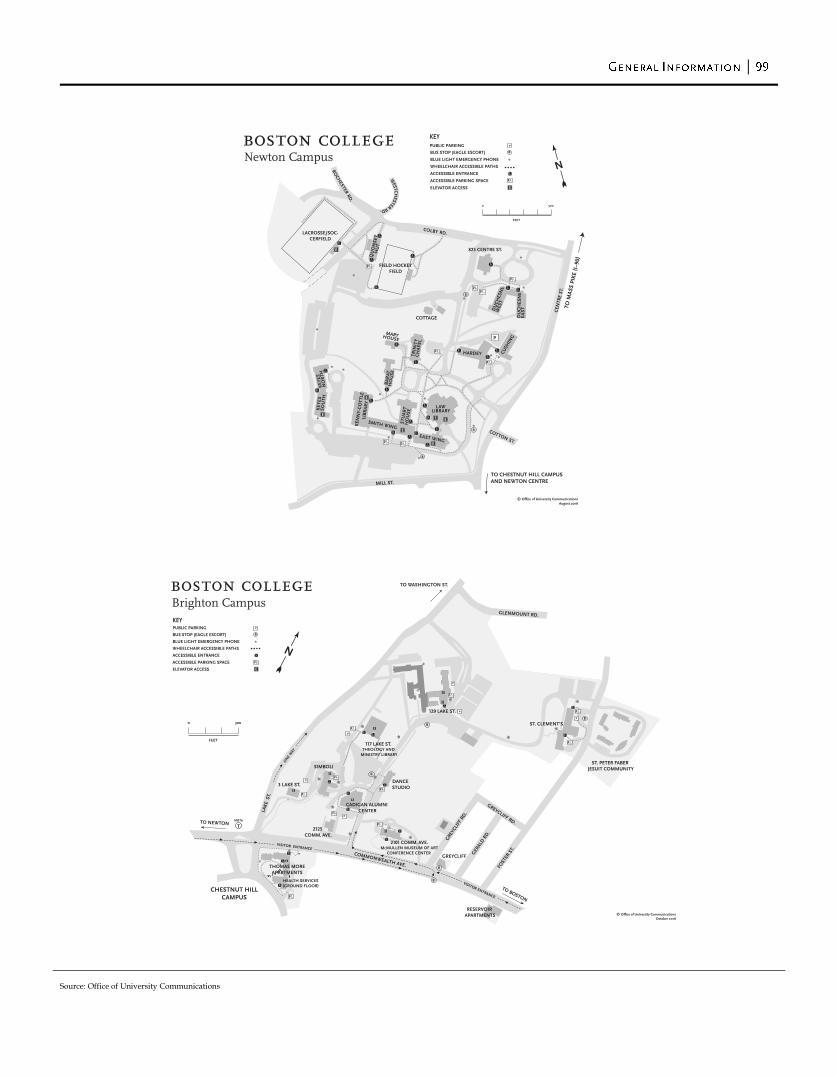
Source: Office of University Communications
825 CENTRE ST.
COTTAGE
LACROSSE/SOC-CERFIELD
FIELD HOCKEYFIELD
TO M
ASS
PIK
E ( I–
90)
MILL ST.
© Office of University CommunicationsAugust 2016
KEYPPUBLIC PARKING
WHEELCHAIR ACCESSIBLE PATHS
ACCESSIBLE ENTRANCE
ACCESSIBLE PARKING SPACE
ELEVATOR ACCESS
BUS STOP (EAGLE ESCORT)
BLUE LIGHT EMERGENCY PHONE
© Office of University CommunicationsOctober 2016
ST. PETER FABER JESUIT COMMUNITY
P
P
P
P
P
P
ON
E W
AY
DANCE STUDIO
129 LAKE ST.
GER
ALD
RD
.
SIMBOLI
117 LAKE ST. THEOLOGY AND
MINISTRY LIBRARY
2125 COMM. AVE.
3 LAKE ST.
TO WASHINGTON ST.
ST. CLEMENT’S
GLENMOUNT RD.
GRE
YCLI
FF R
D.
COMMONWEALTH AVE.
GREYCLIFF
GREYCLIFF RD.
FOST
ER S
T.
LAKE
ST.
TO NEWTON
CHESTNUT HILLCAMPUS
TO BOSTON
CADIGAN ALUMNI CENTER
2101 COMM. AVE.MCMULLEN MUSEUM OF ART
CONFERENCE CENTER
THOMAS MOREAPARTMENTS
HEALTH SERVICES(GROUND FLOOR)
VISITOR ENTRANCE
VISITOR ENTRANCE
300
RESERVOIR APARTMENTS
WHEELCHAIR ACCESSIBLE PATHS
ACCESSIBLE ENTRANCE
ACCESSIBLE PARKING SPACE
ELEVATOR ACCESS
KEYPPUBLIC PARKING
BUS STOP (EAGLE ESCORT)
BLUE LIGHT EMERGENCY PHONE
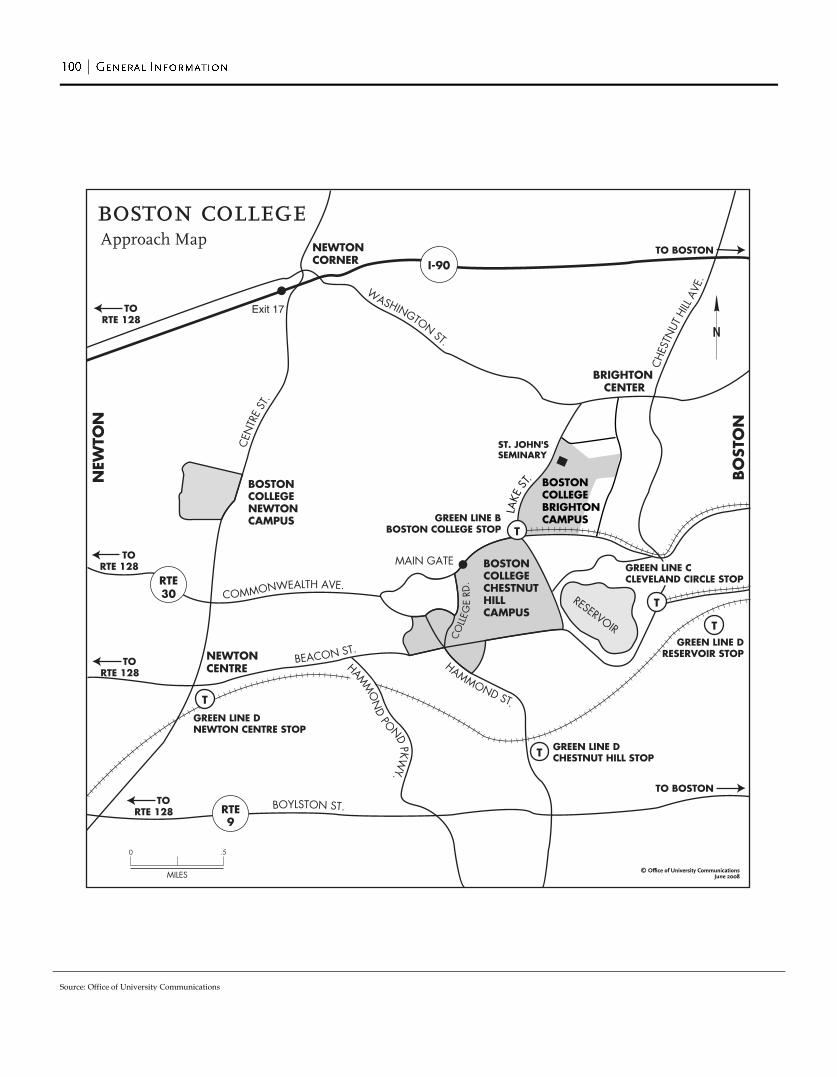
Source: Office of University Communications
© Office of University CommunicationsJune 2008
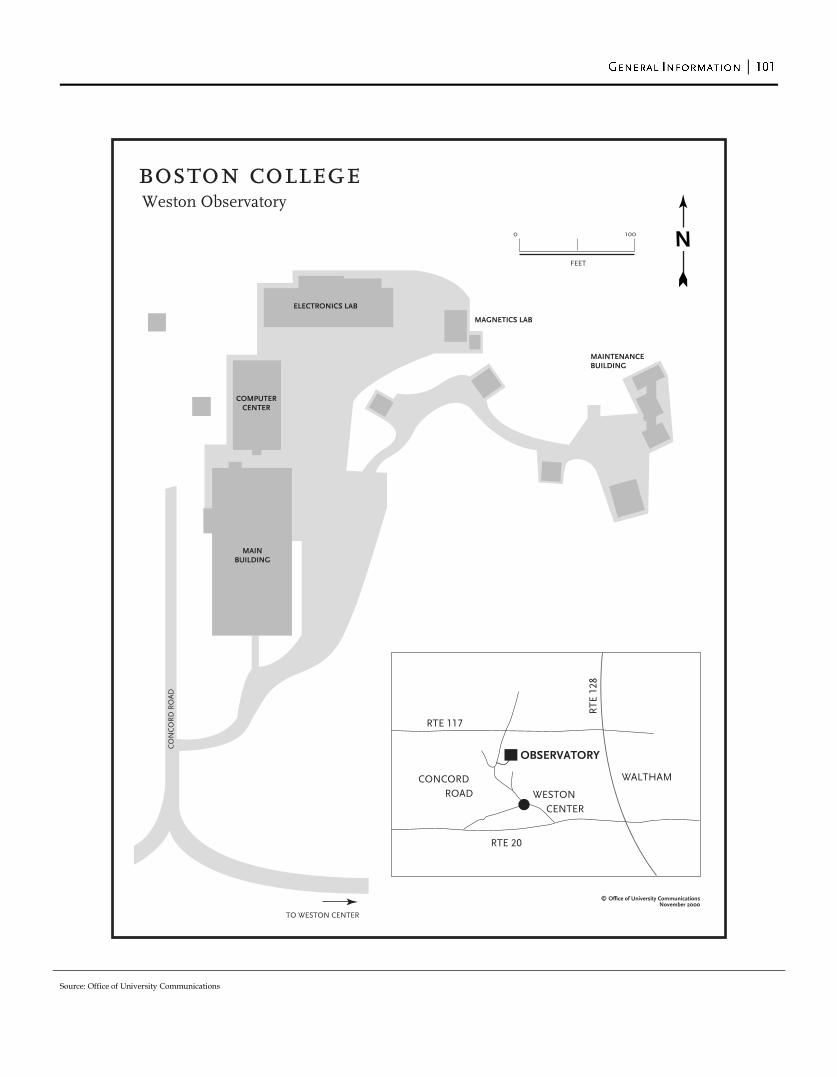
Source: Office of University Communications
© Office of University CommunicationsNovember 2000
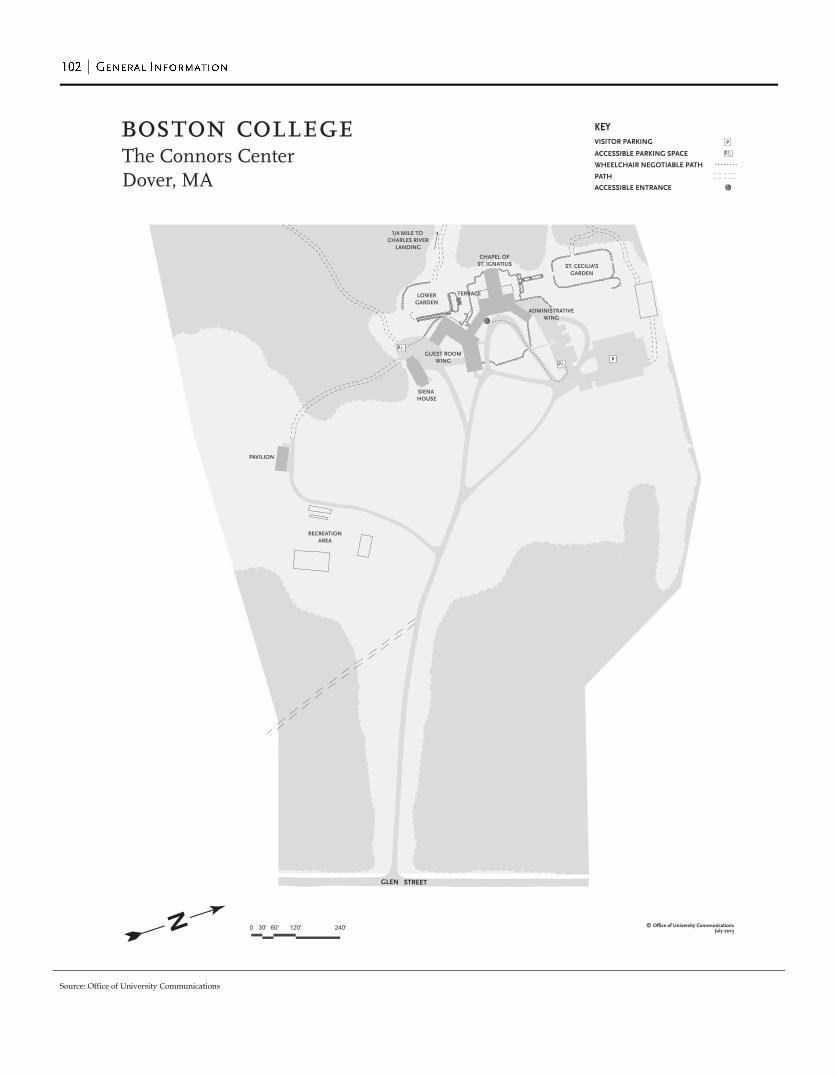
Source: Office of University Communications
The Connors CenterDover, MA
P
GLEN STREET
1/4 MILE TO CHARLES RIVER
LANDING
SIENA HOUSE
PAVILION
ST. CECILIA’SGARDEN
CHAPEL OFST. IGNATIUS
RECREATIONAREA
TERRACELOWERGARDEN
ADMINISTRATIVEWING
GUEST ROOMWING
ACCESSIBLE PARKING SPACE
KEYPVISITOR PARKING
WHEELCHAIR NEGOTIABLE PATH
PATH
ACCESSIBLE ENTRANCE
60'0 30' 120' 240' © Office of University CommunicationsJuly 2013