b.com (h) – core 10 - semester iv management accounting
TRANSCRIPT

B.COM (H) – Core 10 - Semester IV
MANAGEMENTACCOUNTING
Author:
Dr.Biswo Ranjan Mishra
Edited By:
Dr.Sujit Kumar Acharya
Dr.Rashmi Ranjeeta Das
UTKAL UNIVERSITYDirectorate of Distance & Continuing Education
Bhubaneswar

SYLLABUS
(Core-10)
MANAGEMENT ACCOUNTING
Objective: To acquaint the students with basic concepts of management accounting,and basic understanding of tools and techniques used for managerial decision making.
CONTENTS: `
Unit – I:
Management Accounting: Meaning, nature, scope, and importance of managementaccounting; Role of management accounting; management accounting vs. financialaccounting; Role of management accounting in modern business; Tools and techniquesof management accounting.
Unit – II: Ratio Analysis & Cash flow statement
Ratio Analysis:Meaning and utility of ratios; significance of Ratio analysis; Classification of Ratios –Profitability ratios, Efficiency Ratios, Liquidity Ratios, Solvency Ratios; Advantages andlimitations of Ratio Analysis.
Cash flow Statements:Cash Flow Statements: Meaning and utility of Cash flow statements; Preparation ofCash flow statements – Indirect method; Limitations of Cash flow statements; Cash flowstatements vs. Funds flow statements. (Reference to Revised AS-3 and Ind AS-7)
Unit – III:Absorption & Marginal Costing: P/V Ratio, Break-even analysis, Margin of safety,angle of incidence; Marginal and differential costing as a tool for decision making –make or buy, change of product mix, exploring new markets, shut down decisions.
Unit – IV:
Budgeting & Standard Costing: Concept of budget and budgetary control; objectives,merits and limitations of budgetary system; Master budget, Functional budget, Fixedand Flexible budgets; Zero based budgeting. Standard Costing & Variance Analysis:Meaning of standard cost and standard costing, Advantages and disadvantages ofstandard costing and variance analysis: Material, Labour, & Overhead.
Learning Outcome: After the completion of this paper, the students will be able to have

Confidence in managing cost issues and also to keep a check on cost control andtaking managerial decisions.
Text Books Recommended1. Management Accounting, S swain/ S.P. Gupta/ A Sharma, V.K. Global Pub. Pvt. Ltd.,2. Horngreen, Charles T., Gary L. Sundem. Introduction to Management Accounting.3. Prentice Hall.
Suggested Reading:1. Jain & Narang, Management Accounting, Kalyani Publications2. Management Accounting-M Wilson- Cost Accounting-Jena B,Bal S and DasAHimalayaPublishing House3. Narasimhan M.S. , Management Accounting, Cengage Learning4. Cost & Management Accouning, Taxmann Publications5. Arora, M.N. Cost Accounting – Principles and Practice. Vikas Publishing House,New Delhi.6. Maheshwari, S.N. and S.N. Mittal. Cost Accounting: Theory and Problems. ShriMahabir Book Depot, New Delhi.7. Lal, Jawahar. Advanced Management Accounting Text and Cases. S. Chand & Co.,New Delhi.8. Khan, M.Y. and P.K. Jain. Management Accounting. Tata McGraw Hill, Publishing

UNIT-1
CONCEPTS OF MANAEMENT ACCOUNTING
LEARNING OBJECTIVES:
To understand different branches of Accounting with their limitations
To conceptualize the meaning, definition, nature, scope and objectives of ManagementAccounting
To analyze the importance/role of Management Accounting
To differentiate between Management Accounting, Financial Accounting and CostAccounting
To know the role of Management Accounting in modern business
To acquaint with the tools and techniques of Management Accounting
CHAPTER PLAN:
1.1 Introduction
1.2 Definition of Management Accounting
1.3 Nature/Characteristics of Management Accounting
1.4 Scope of Management Accounting
1.5 Objectives of Management Accounting
1.6 Importance/Functions of Management Accounting
1.7 Role of Management Accounting
1.8 Role of Management Accountant
1.9 Distinction between Management Accounting, Financial Accounting & Cost Accounting
1.10 Role of Management Accounting in Modern Business
1.11 Tools and Techniques of Management Accounting
1.12 Limitations of Management Accounting
1.13 Glossary
1.14 Review Questions
1.1 INTRODUCTION:
Accounting is the process of recording, classifying, summarizing, analyzing and interpreting thefinancial transactions of the business for the benefit of management and those parties who areinterested in business such as shareholders, creditors, bankers, customers, employees andgovernment. Thus, it is concerned with financial reporting and decision making aspects of thebusiness.
Branches of Accounting
Accounting can be groupedinto three categories:
1. Financial Accounting
2. Cost Accounting, and
3. Management Accounting
1.1.1 Financial Accounting
The term ‘Accounting’ unless otherwise specifically stated always refers to ‘FinancialAccounting’. Financial Accounting is commonly carried on in the general offices of a business.It is concerned with revenues, expenses, assets and liabilities of a business house.
Financial Accounting has two-fold objectives, viz.
1. To ascertain the result of the business in terms of earning of profits or suffering of losses, and
2. To know the financial position of the concern.
The following are the functional aspects of financial accounting:
1.Dealing with Financial Transactions
2. Recording of information
3. Classification of Data
4. Summarizing Group of Information
5. Analyzing
6. Interpreting the Financial Information
7. Communicating the Results

Financial Accounting is like a post-mortem report. At the most it can reveal what has happenedso far, but it does not have any control over the past happenings.
The limitations of financial accounting are as follows:
1. It records only quantitative information.
2. It records only the historical cost. The impact of future uncertainties has no place in financialaccounting.
3. It does not take into account price level changes.
4. It provides information about the whole concern. Product-wise, process-wise, department-wise or information of any other line of activity cannot be obtained separately from the financialaccounting.
5. Cost figures are not known in advance. Therefore, it is not possible to fix the price in advance.It does not provide information to increase or reduce the selling price.
6. As there is no technique for comparing the actual performance with that of the budgetedtargets, it is not possible to evaluate performance of the business.
7. It does not tell about the optimum or otherwise of the quantum of profit made and does notprovide the ways and means to increase the profits.
8. In case of loss, whether loss can be reduced or converted into profit by means of cost controland cost reduction? Financial Accounting does not answer such question.
9. It does not reveal which departments are performing well? Which ones are incurring lossesand how much is the loss in each case?
10. It does not provide the cost of products manufactured
11. There is no means provided by financial accounting to reduce the material losses, i.e.wastage, scrap, spoilage and defectives.
12. Can the expenses be reduced which results in the reduction of product cost and if so, to whatextent and how? There is no answer to these questions in financial accounting.
13. It is not helpful to the management in taking strategic decisions like replacement of assets,introduction of new products, discontinuation of an existing line, expansion of capacity, etc.
14. It provides ample scope for manipulation like overvaluation or undervaluation. Thispossibility of manipulation reduces the reliability.

15. It is technical in nature. A person not conversant with accounting has little utility of thefinancial accounts.
1.1.2 Cost Accounting
The Institute of Cost and Works Accountants, India defines cost accounting as, “the techniqueand process of ascertainment of costs. Cost Accounting is the process of accounting for costs,which begins with recording of expenses or the bases on which they are calculated and ends withpreparation of statistical data”.
To put it simply, when the accounting process is applied for the elements of costs (i.e.,Materials, Labour and Other expenses), it becomes Cost Accounting.
The main objectives of cost accounting are as follows:
1. Cost Ascertainment
2. Cost Control
3. Cost Reduction
4. Fixation of Selling Price
5. Providing information for framing Business policy.
Limitations of Cost Accounting
i)GroundedonEstimation: As cost accounting relies heavily on predetermined data, it is notreliable.
ii)No StandardizedProcedure:As there is no uniform procedure, with the same informationdifferent results may be arrived by different cost accountants.
iii)Conventions and Estimates: There are number of conventions and estimates in preparingcost records such as materials are issued on an average (or) standard price, overheads are chargedon percentage basis, Therefore, the profits arrived from the cost records are not true.
iv) Formalities: Many formalities are to be observed to obtain the benefit of cost accounting.Therefore, it is not applicable to small and medium firms.
v) Expensive: Cost accounting is expensive and requires reconciliation with financial records.
vi) AdditionalTool: Cost Accounting is an additional tool not an essential tool and an enterprisecan survive even without cost accounting.
vii) Secondary Data: Cost Accounting depends on financial statements for a lot of information.The errors or short comings in that information creep into cost accounts also.
1.1.3 Management Accounting
Management Accounting is comprised of two words ‘Management’ and ‘Accounting’. It meansthe study of managerial aspect of accounting. The emphasis of management accounting is toredesign accounting in such a way that it is helpful to the management in formation of policy,control of execution and appreciation of effectiveness.
Management Accounting can be viewed as Management-oriented Accounting. Basically it isthe study of managerial aspect of financial accounting,i.e.“accounting in relation to managementfunction". It is developed mainly to help the management in the discharge of its functions and fortaking various decisions. The primary task of management accounting is, therefore, to redesignthe entire accounting system so that it may serve the operational needs of the firm. It furnishesdefinite accounting information-past, present or future, which may be used as a basis formanagement action. The financial data are so devised and systematically developed that theybecome a unique tool for management decision.Hence, Management Accounting involves thestudy of accounting information and techniques that managers use in analyzing information.
Management Accounting is not a specific system of accounts, but could be any form ofaccounting which enables a business to be conducted more effectively and efficiently.Management Accounting, therefore, appears as the extension of the horizon of cost accountingtowards emerging areas of management. Management Accounting is largely concerned withproviding economic information to managers for achieving organizational goals.Managers usemanagement accounting information to choose strategy to communicate it and to determine howbest to implement it. They use management accounting information to coordinate their decisionsabout designing, producing and marketing a product or service.
1.2 DEFINITION OF MANAGEMENT ACCOUNTING:
Anglo-American Council of Productivity: “ManagementAccounting is the presentation ofaccounting information in such a way as to assist the management in creation of policy and theday to day operation of an undertaking".
Institute of Chartered Accountants of England and Wales: “Any form of accounting whichenables a business to be conducted more efficiently can be regarded as ManagementAccounting”.
American Accounting Association: “It includes the methods and concepts necessary foreffective planning for choosing among alternative business actions and for control through theevaluation and interpretation of performances.”

Institute of Cost and Management Accountants, London: “Management Accounting is theapplication of professional knowledge and skill in the preparation of accounting information insuch a way as to assist management in the formulation of policies and in the planning and controlof the operation of the undertakings”.
Institute of Management Accountants (IMA): "Management Accounting is a profession thatinvolves partnering in management decision making, devising planning and performancemanagement systems, and providing expertise in financial reporting and control to assistmanagement in the formulation and implementation of an organization's strategy"
J. Batty: “Management Accountancy is the term used to describe the accounting methods,systems and techniques which, with special knowledge and ability, assist management in its taskof maximizing profit or minimizing losses.”
Brown and Howard: “Management Accounting is that aspect of accounting which is concernedwith the efficient management of a business through the presentation of management of suchinformation as will facilitate efficient and opportune planning and control.”
Robert Anthony: “Management Accounting is concerned with accounting information which isuseful to management”
CIMA, London: “Management Accounting is an integral part of management concerned withidentifying, presenting and interpreting information used for: (a) formulating strategy; (b)planning and controlling activities; (c) decision taking; (d) optimizing the use of resources; (e)disclosure to shareholders and others external to the entity; (f) disclosure to employees; (g)safeguarding assets”.
1.3 NATURE /CHARACTERISTICS OF MANAGEMENT ACCOUNTING:
1. Grounded onAccounting Information
Management Accounting is based on accounting information. Management Accounting is aservice function and it provides necessary information to different levels of management.Management Accounting involves the presentation of information in a way that suits themanagerial needs. The accounting data collected by accounting department is used for reviewingvarious policy decisions.
2. Cause and Effect Analysis
The role of financial accounting is limited to find out the ultimate result, i.e., profit and loss,whereas management accounting goes a step further. Management Accounting discusses thecause and effect relationship. The reasons for the loss are probed and the factors directlyinfluencing the profitability are also analyzed. Profits are compared to sales, different

expenditures, current assets, interest payables, share capital, etc. to give meaningfulinterpretation.
3. Use of Special Techniques and Concepts
Management Accounting uses special techniques and concepts according to necessity, to makeaccounting data more useful. The techniques usually used include financial planning andanalyses, standard costing, budgetary control, marginal costing, project appraisal etc.
4. Aids in Taking Important Decisions
It supplies necessary information to the management which may be useful for its decisions. Thehistorical data is studied to see its possible impact on future decisions. The implications ofvarious decisions are also taken into account.
5. Aims at Achieving Objectives
Management Accounting uses the accounting information in such a way that it helps informatting plans and setting up objectives. Comparing actual performance with targeted figureswill give an idea to the management about the performance of various departments. When thereare deviations, corrective measures can be taken immediately with the help of budgetary controland standard costing.
6. No Fixed Norms
No specific rules are followed in management accounting as that of financial accounting. Thoughthe tools are the same, their use differs from concern to concern. The deriving of conclusionsalso depends upon the intelligence of the management accountant. The presentation will be in theway which suits the concern most.
7. ImprovesEfficiency
The purpose of using accounting information is to increase efficiency of the concern. Theperformance appraisal will enable the management to pin-point efficient and inefficient spots.Efforts are made to take corrective measures so that efficiency can be improved. The constantreview will make the staff cost conscious.
8. DeliversInformation and not Decision
Management accountant is only to guide to take decisions. The data is to be used by themanagement for taking various decisions. ‘How is the data to be utilized’ will depend upon thecaliber and efficiency of the management.

9. Involvedin Forecasting
The management accounting is concerned with the future. It helps the management in planningand forecasting. The historical information is used to plan future course of action. Theinformation is supplied with the object to guide management for taking future decisions.
1.4 SCOPE OF MANAGEMENT ACCOUNTING
The advancement in information technology and the ever growing appetite of informationconsumers in this information age has broadened the scope of management accounting to includethings that were not included in the discipline some ten years ago.Management Accounting hasmoved from a mere information gathering and processing system to an all-encompassingbusiness solution box.
Management Accounting is concerned with presentation of accounting information in the mostuseful way for the management. Its scope is, therefore, quite vast and includes within its foldalmost all aspects of business operations. However, the following areas can rightly be identifiedto be within the ambit of management accounting:
(i) Financial Accounting: Management Accounting is mainly concerned with therearrangement of the information provided by financial accounting. Hence, management cannotobtain full control and coordination of operations without a properly designed financialaccounting system.
(ii) Cost Accounting: Standard costing, marginal costing, opportunity cost analysis, differentialcosting and other cost techniques play a useful role in operation and control of the businessundertaking.
(iii) Revaluation Accounting: This is concerned with ensuring that capital is maintained intactin real terms and profit is calculated with this fact in mind.
(iv) Budgetary Control: This includes framing of budgets, comparison of actual performancewith the budgeted performance, computation of variances, finding their causes, etc.
(v) Inventory Control: It includes control over inventory from the time it is acquired till itsfinal disposal.
(vi) Statistical Methods: Graphs, charts, pictorial presentation, index numbers and otherstatistical methods make the information more impressive and intelligible.
(vii) Interim Reporting: This includes preparation of monthly, quarterly, half yearly incomestatements and the related reports, cash flow and funds flow statements, scrap reports, etc.
(viii) Taxation: This includes computation of income in accordance with the tax laws, filing ofreturns and making tax payments.

(ix) Office Services: This includes maintenance of proper data processing and other officemanagement services, reporting on best use of mechanical and electronic devices.
(x) Internal Audit: Development of a suitable internal audit system for internal control.
(xi)Management Information System [MIS]: Management Accounting serves as a centre forcollection and dissemination of information.MIS is an essential part of Management Accounting.
1.5 OBJECTIVES OF MANAGEMENT ACCOUNTING
The fundamental objective of management accounting is to enable the management to maximizeprofits or minimize losses. The evolution of management accounting has given a new approachto the function of accounting. The main objectives of management accounting are as follows:
1. Planning and Policy Formulation
Planning involves forecasting on the basis of available information, setting goals, framingpolices, determining the alternative courses of action and deciding on the programme ofactivities. Management accounting can help greatly in this direction. It facilitates the preparationof statements in the light of past results and gives estimation for the future.
2. Interpretation Process
Management Accounting is to present financial information to the management. Financialinformation is technical in nature.
Therefore, it must be presented in such a way that it is easily understood. It presents accountinginformation with the help of statistical devices like charts, diagrams, graphs, etc.
3. Assists in Decision-Making Process
With the help of various modern techniques, management accounting makes decision-makingprocess more scientific. Data relating to cost, price, profit and savings for each of the availablealternatives are collected and analyzed and thus it provides a base for taking sound decisions.
4. Controlling
Management Accounting is a useful tool for managerial control. Management Accounting toolslike standard costing and budgetary control are helpful in controlling performance. Cost controlis affected through the use of standard costing and departmental control is made possible throughthe use of budgets. Performance of each and every individual operation is controlled with thehelp of management accounting.

5. Reporting
Management Accounting keeps the management fully informed about the latest position of theconcern through reporting. It helps management to take proper and quick decisions. Theperformances of various departments are regularly monitored and reported to the topmanagement.
6. Facilitates Organizing
Since management accounting stresses more on Responsibility Centres with a view to controlcosts and fixation of responsibilities, so it also facilitates decentralization to a greaterextent.Thus, it is helpful in setting up effective and efficient organization framework.
7. Facilitates Coordination of Operations
Management Accounting provides tools for overall control and coordination of businessoperations. Budgets are important means of coordination.
1.6 IMPORTANCE/FUNCTIONS OF MANAGEMENT ACCOUNTING
The basic function of management accounting is to assist the management in performing itsfunctions effectively. The functions of the management are planning, organizing, directing andcontrolling. Management Accounting helps in the performance of each of these functions in thefollowing ways:
(i) Provides Data: Management Accounting serves as a vital source of data for managementplanning. The accounts and documents are a repository of a vast quantity of data about the pastprogress of the enterprise which are a must for making forecasts for the future.
(ii) Modifies Data: The accounting data required for managerial decisions is properly compiledand classified. For example, purchase figures for different months may be classified to knowtotal purchases made during each period product-wise, supplier-wise and territory-wise etc.
(iii) Analyses and Interprets Data: The accounting data is analyzed meaningfully for effectiveplanning and decision-making. For this purpose the data is presented in a comparative form.Ratios are calculated and likely trends are projected.
(iv) Serves as a Means of Communicating: Management Accounting provides a means ofcommunicating management plans upward, downward and outward through the organization.Initially, it is a means of identifying the feasibility and consistency of the various segments of theplan. At later stages it keeps all parties informed about the plans that have been agreed upon andtheir roles in these plans.
(v) Facilitates Control: Management Accounting helps in translatinggiven objectives andstrategy into specified goals for attainment by a specified time and secures effective

accomplishment of these goals in an efficient manner. All this is made possible throughbudgetary control and standard costing which is an integral part of management accounting.
(vi) Uses also Qualitative Information: Management Accounting does not restrict itself tofinancial data for helping the management in decision making but also uses such informationwhich may not be capable of being measured in monetary terms. Such information may becollected form special surveys, statistical compilations, engineering records, etc.
1.7 ROLE OF MANAGEMENT ACCOUNTING
The role of management accounting can be summarized in following points:
1. Helping Forecast the Future:
Forecasting aids decision-making and answering questions, such as: Should the company investin more equipment? Should it diversify into different markets? Should it buy another company?Management Accounting helps in answering these critical questions and forecasting the futuretrends in business.
2. Helping in Make-or-Buy Decisions:
Is it cheaper to procure materials or a product from a third party or manufacture them in-house?Cost and production availability are the deciding factors in this choice. Through managementaccounting, insights will be developed which will enable decision-making at both operationaland strategic levels.
3. Forecasting Cash Flows:
Predicting cash flows and the impact of cash flow on the business is essential. How much costwill the company incur in the future? Where will its revenues come from and will the revenuesincrease or decrease in the future? Management Accounting involves designing of budgets andtrend charts, and managers use this information to decide how to allocate money and resources togenerate the projected revenue growth.
4. Helping Understand Performance Variances:
Business performance discrepancies are variances between what was predicted and what isactually achieved. Management Accounting uses analytical techniques to help the managementbuild on positive variances and manage the negative ones.
5. Analysing the Rate of Return:
Before embarking on a project that requires heavy investments, the company would need toanalyse the expected rate of return (ROR). If given two or more investment opportunities, howshould the company choose the most profitable one? In how many years would the company

break-even on a project? What are the cash flows likely to be? These are all vital questions thatcan be answered through management accounting.
1.8 ROLE OF MANAGEMENT ACCOUNTANT
The management accountant, often referred to as controller, is the managers of accountinginformation used in planning, control and decision making areas. He is responsible for collecting,processing and reporting information that well help managers in their planning, controlling anddecision making activities. He participates in all accounting activities within the organization.
The following are the Roles of Management Accountant:
1. Participating in Management Process: The management accountant occupies a pivotalposition in the organization. He performs a staff function and also has line authority over theaccountant and other employees in his office. He educates executives on the best use ofaccounting information.
2. Maintaining optimum Capital Structure: Management accountant has a major role to playin raising of funds and their application. He has to decide about maintaining a proper mix of debtand equity. The raising of funds through debt is cheaper because of tax benefits and a properleverage leads to trading on equity.
3. InvestmentOpportunities: A management accountant can assist either person or a firmregarding the investment in different ways. He can suggest how, when and where the investmentshould be made so that an investor or the firm canearn maximum return.
4. Financial Investigations: A management accountant can assist the management about thefinancial investigations which is extremely desired to determine the financial position for theinterested parties. Relating to issue of shares, amalgamation or mergers, or reconstructions etc toascertain the reason of decreasing profit or increasing costs, it so happened.
5. Long-term and Short –term Planning: Management accountant plays an important role inforecasting future business and economic events for making future plans i.e., short term andlong-term plans, formulating corporate strategy, market study etc.
6. Participating in Management Process: The management accountant occupies a pivotalposition in the organization. He performs a staff function and also has line over the accountantand other employees in his office. He educates executives on the need for collecting informationand on the ways of using it. He shifts relevant information from the irrelevant and reports thesame in a clear form to the management and sometimes to interested external parties.
7. Decision Making; Management accountant provides necessary information to management intaking short-term decision e.g. optimum product mix, make or buy, lease or buy, pricing ofproduct, discontinuing a product etc. and long-term decisions e.g., capital budgeting,investment

appraisal, project financing. However, the job of management accountant is limited to theadequacy of required information, both in a comprehensive as well as reliable form for decisionmaking purposes.
8. Control: The management accountant analyses accounts and prepares reports e.g., standardcosts, budgets, variance analysis and interpretation, cash and funds flow analysis, management ofliquidity, performance evaluation and responsibility accounting etc. for control.
9.Developing Management Information System: The routine reports as well as reports for longterm decision making are forwarded to managerial personnel at all levels to take correctiveaction at the right time and also uses these reports for taking important decisions.
10. Stewardship Accounting: Management accountant designs the framework of cost andfinancial accounts and prepares reports for routine financial and operational decision making.
11. CorporatePlanning: He can assist management for long-term planning and advisemanagement regarding amalgamation or mergers or reconstructions including financial planningto see whether effective utilization of resources is made or not. Thus, the role of managementaccountant cannot be ignored. As such, his services are primarily desired for the efficientmanagement of an undertaking.
1.9 DISTINCTION BETWEEN MANAGEMENT ACCOUNTING, FINANCIALACCOUNTING, COST ACCOUNTING
1.9.1 DIFFERENCE BETWEEN COST ACCOUNTING AND FINANCIAL ACCOUNTING
Sl No Basis Cost Accounting Financial Accounting1 Purpose: The main purpose of Cost
Accounting is to analyze,ascertain and control costs
The main purpose of FinancialAccounting is to record financialtransactions and prepare financialstatements.
2 DecisionMaking:
The Cost Accounts are basicallydesigned to facilitate decisionmaking in the areas ofproduction, purchase, sales etc.
Financial accounts are of limiteduse in decision making.
3 Analysis ofCost andProfit:
The Cost Accounting shows thedetailed cost and profits for eachproduct, process, job, contractetc.
Financial Accounting shows theoverall profit/loss of the entireorganization.
4 TransactionsRecorded:
Cost Accounting keeps recordsof both external and internaltransactions.
Financial Accounts keep recordsof only external transactions withoutsiders.
5 Access: In Cost Accounting the outsiders In Financial Accounting anybody

generally have no access to costrecords.
can have access to FinancialStatements of Companies.
6 Control: Cost Accounting Control allelements of Costs.
Financial Accounting does notexercise adequate control overmaterial, labour and overheadcosts.
7 Profit or Loss Cost Accounting determines theprofit or loss of each product,process, job and department.
Financial Accounting determinesthe profit or loss of the entirebusiness.
8 Units Cost Accounting records bothmonetary and physical unitssuch as labour hour, machinehour etc.
Financial Accounting records onlymonetary units in the books ofaccounts.
9 Valuation ofClosingStock
Closing Stock is valued at costprice only in Cost Accounting.
In Financial Accounting ClosingStock is valued at cost or marketprice {Net Realizable value}whichever is lower.
10 Audit Cost Accounting need not befollowed by a system of externalaudit.
Financial Accounting needs asystem of independent audit of thefinancial records by an externalauditor.
11 TaxAssessment
Cost Accounting does not form abasis for tax assessment.
Financial Accounting forms abasis for determination taxliability of the business.
12 Parties Cost Accounting serves theinformation needs of themanagement.
Financial Accounting serves theinformation needs of owners,creditors, employees and thesociety at large.
13 Mandatory Installing a costing system ispurely optional.
Maintaining Financial Accountingis mandatory.
14 Lack ofUniformity:
There are no fixed rules andregulations in CostAccounting.Therefore differentcost accounting system may befollowed by different firms inthe same industry which makescomparison difficult.
There are fixed rules andregulations in FinancialAccounting.

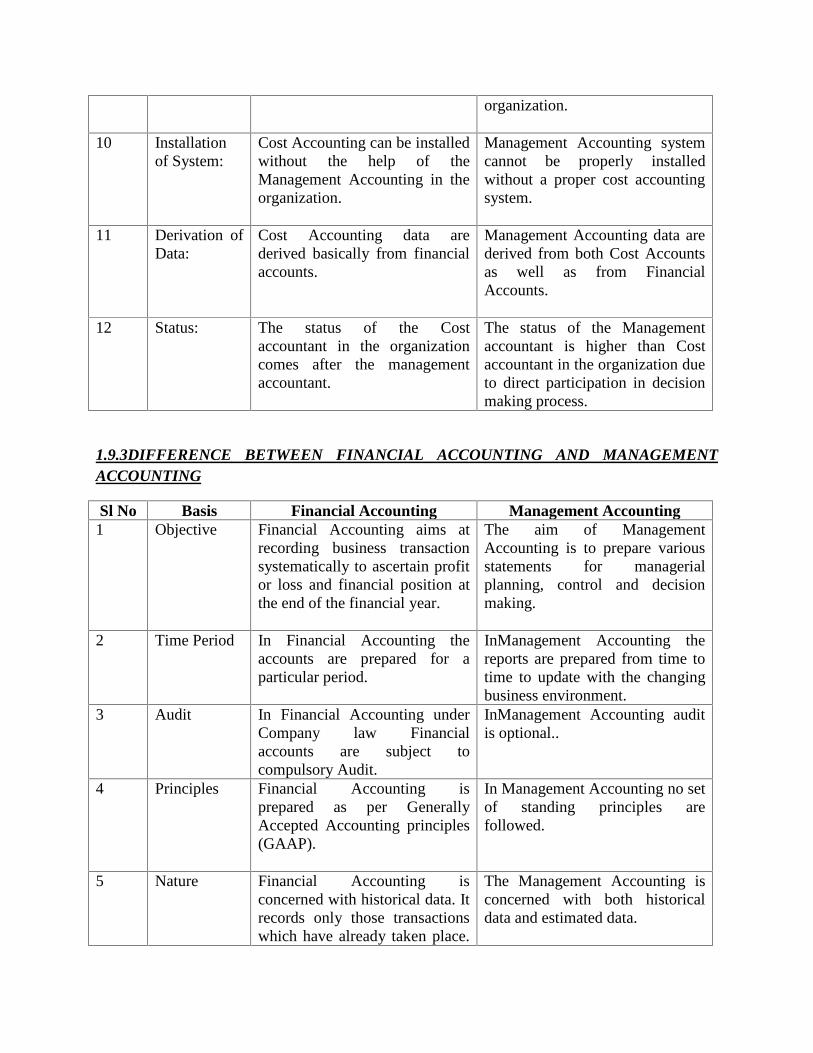
1.9.2DIFFERENCE BETWEEN COST ACCOUNTING AND MANAGEMENTACCOUNTING
The important differences between Cost Accounting and Management Accounting are asfollows:
Sl No Basis Cost Accounting Management Accounting1 Purpose: The purpose of Cost Accounting
is the ascertainment of cost ateach stage of production.
The purpose of ManagementAccounting is to provideinformation to the managementfor decision making.
2 Basis: Cost Accounting is preparedmainly on the basis of past andless emphasis is given for thefuture.
Management Accounting purelyaims at the future based on thepast information.
3 Preparation: Cost Accounting is prepared onthe basis of some rules andregulations prescribed by theICAI (Institute of CostAccountants of India).
Management Accounting isprepared without adopting anyspecific and rigid rules. It may beprepared according to the will ofthe managerial personnel.
4 Reports: The Reports of the CostAccounting are subject tostatutory audit.
The reports of the ManagementAccounting are not subject tostatutory audit.
5 Useful: The reports of the CostAccounting are useful both tothe internal and external parties.
The reports of the ManagementAccounting are useful only for theinternal parties.
6 Scope: Cost Accounting does notinclude tax planning and taxaccounting.
Management Accounting includestax planning and tax accounting.
7 Evolution: Cost Accounting evolves due tothe limitation of financialaccounting,
Management Accounting evolvesdue to the limitations of costaccounting. It is the managerialaspects of financial accountingand cost accounting.
8 Maintenanceof Records:
The maintenance of records iscompulsory for complying thestatutory requirements inselected industries as notified byGovt. from time to time.
The maintenance of records ispurely voluntary and for internaluse of management of theCompany.
9 PlanningAspect:
Cost Accounting is mainlyconcerned with short-termplanning.
Management Accounting isconcerned with short term as wellas long term planning of the
organization.
10 Installationof System:
Cost Accounting can be installedwithout the help of theManagement Accounting in theorganization.
Management Accounting systemcannot be properly installedwithout a proper cost accountingsystem.
11 Derivation ofData:
Cost Accounting data arederived basically from financialaccounts.
Management Accounting data arederived from both Cost Accountsas well as from FinancialAccounts.
12 Status: The status of the Costaccountant in the organizationcomes after the managementaccountant.
The status of the Managementaccountant is higher than Costaccountant in the organization dueto direct participation in decisionmaking process.
1.9.3DIFFERENCE BETWEEN FINANCIAL ACCOUNTING AND MANAGEMENTACCOUNTING
Sl No Basis Financial Accounting Management Accounting1 Objective Financial Accounting aims at
recording business transactionsystematically to ascertain profitor loss and financial position atthe end of the financial year.
The aim of ManagementAccounting is to prepare variousstatements for managerialplanning, control and decisionmaking.
2 Time Period In Financial Accounting theaccounts are prepared for aparticular period.
InManagement Accounting thereports are prepared from time totime to update with the changingbusiness environment.
3 Audit In Financial Accounting underCompany law Financialaccounts are subject tocompulsory Audit.
InManagement Accounting auditis optional..
4 Principles Financial Accounting isprepared as per GenerallyAccepted Accounting principles(GAAP).
In Management Accounting no setof standing principles arefollowed.
5 Nature Financial Accounting isconcerned with historical data. Itrecords only those transactionswhich have already taken place.
The Management Accounting isconcerned with both historicaldata and estimated data.

Thus, the accounts prepared hereare like post-mortem report.
6 Publication In Financial Accounting,Financial Statements arepublished annually for externalparties interested in theaccounting information.
In Management Accounting thestatements and reports are notpublished. They are meant forinternal use of the management.
7 Quickness In Financial Accounting,reporting is slow and timeconsuming. Hence, one has towait till the end of theaccounting year to get thefinancial statements.
In Management Accounting,reporting is very quick as it ismeant for decision making.
8 Nature ofInformation
Financial Accounting isconcerned with quantitativeinformation expressed in termsof money.
Management Accounting isconcerned with both qualitativeand quantitative information.
9 Reporting In Financial Accounting,Financial reports are preparednot only for the organization butfor others interested in theaccounting information of thebusiness.
InManagement Accounting, thereports are prepared for internaluse only.
10 LegalCompulsion
Preparation of financial accountsis mandatory to comply withstatutory requirements.
Management Accounting is notcompulsory.
1.10 ROLE OF MANAGEMENT ACCOUNTING IN MODERN BUSINESS:
Management Accounting is required to satisfy the demands of the current economicenvironment. There is a need for more innovative and useful management accounting techniquesto improve productivity, to reduce costs, to improve quality, to determine accurate product coststo satisfy managerial needs of planning, decision making and control.
1. Activity-Based Costing (ABC) and Management:
The demand for more accurate and relevant management accounting information has led to thedevelopment of activity-based costing and activity-based management. Activity-based costingimproves the accuracy of assigning costs by first tracing costs to activities and then to productsor customers that consume these activities. Process value analysis, on the other hand, emphasizesactivity analysis— trying to determine why activities are performed and how well they areperformed.

The objective is to find ways to perform necessary activities more efficiently and to eliminatethose that do not create customer value. Activity-based management is a system- wide,integrated approach that focuses management’s attention on activities with the objective ofimproving customer value and the resulting profit. Activity-based management emphasizesActivity- Based Costing (ABC) and process value analysis.
2. Increasing Customer Value:
Globalisation has brought a wave of change in the way business operates and creates value forthe customer. Now the market is not firm-centric but customer-centric. Customer value is a keyfocus of every firm. Firms can establish a competitive advantage by creating better customervalue for the same by reducing cost than that of competitors with value addition to the product.
Customer value is the difference between what a customer receives (customer realization) andwhat the customer gives up (customer sacrifice). Increasing customer value means increasingcustomer realization or decreasing customer sacrifice, or both.
Increasing customer value to create a sustainable competitive advantage is achieved throughselection of strategies. Cost information plays a critical role in this process and does through aprocess called as strategic cost management. Strategic cost management is the use of cost data todevelop and identify superior strategies that can produce a sustainable competitive advantage. Afocus on customer value ensures that the management accounting system should produceinformation about both realization and sacrifice.
3. Cross-Functional Perspective:
Management Accounting has a cross-functional perspective and management accountant mustunderstand all functions of the business, from manufacturing to marketing and customer service.When customer value is attempted to be increased, all the functions of a business becomeinterrelated; a decision affecting one, affects others as well.
A cross-functional perspective helps us to see the forest, not just one or two of the trees. Thisbroader vision allows managers to increase quality, reduce the time required to serve customersand improve efficiency. In this perspective, management accounting helps other businessfunctions through providing useful information and analysis.
4. Total Quality Management (TQM):
Continuous improvement is fundamental for establishing a state of manufacturing excellence.Manufacturing excellence is the key to survival in today’s world-class competitive environment.A philosophy of total quality management, in which manufacturers strive to create anenvironment that will enable workers to manufacture perfect (zero-defect) products, has replacedthe “acceptable quality” attitudes of the past.

Quality cost measurement and reporting are key features of a management accounting system forboth manufacturing and service industries. In both cases, the management accounting systemshould be able to provide both operational and financial information about quality, includinginformation such as the number of defects, quality cost reports, quality cost trend reports andquality cost performance reports.
5. Enhancing Efficiency and Reducing Time:
Improving efficiency in business activities is of vital concern in all business enterprises. Bothfinancial and non-financial measures of efficiency are needed. Cost is a critical measure ofefficiency. Trends in costs over time and measure of productivity changes can provide importantmeasures of the efficiency of continuous improvement decisions. (Output measured in relation tothe inputs).
Reducing time in all phases of production cycles, selling and distribution should be an importanttarget for all business houses. Firms should deliver products or services quickly by eliminatingnon-value-added time and time of no-value to the customer. Decrease in non-value added timehas correspondence with increase in quality.
Now-a-days, the technological innovation has increased for many industries and the life of aparticular product can be quite short. Managers must be able to respond quickly and decisively tochanging market conditions. Information to allow them to accomplishthis must be available froma management accounting information system.
6. Electronic Business (E-Business):
E-business is doing business transaction through information and communication technology. E-commerce is buying and selling products using information and communication technology.Business firms can expand sales and lower costs through e-business compared to paper-basedtransactions. Management accounting plays significant role in e-business through providingrelevant cost information about its benefits, risks and opportunities. For example, businessmanagers need to know the cost per electronic transaction versus cost per paper transaction.
1.11TOOLS AND TECHNIQUES USED IN MANAGEMENT ACCOUNTING
Some of the important tools and techniques used in management accounting are brieflyexplained below.
1. Financial Planning
The main objective of any business organization is maximization of profits. This objective isachieved by making proper or sound financial planning. Hence, financial planning is consideredas best tool for achieving business objectives.

2. Financial Statement Analysis
Profit and Loss account and Balance Sheet are important financial statements. These statementsare analysed for different period. This type of analysis helps the management to know the rate ofgrowth of business concern. This analysis is done through comparative financial statements,common size statements, ratio analysis and trend analysis.
3. Cost Accounting
Cost Accounting presents cost data in product wise, process wise, department wise, branch wiseand the like. These cost data are compared with predetermined one. This comparison of twocosts enables the management to decide the reasons responsible for the difference between thesecosts.
4. Funds Flow Analysis
This analysis finds out the movement of fund from one period to another. Moreover, this analysisis very useful to know whether the fund is properly used or not in a year when compared to theprevious year. The net working capital changes and funds lost from operation are also found outthrough this analysis.
5. Cash Flow Analysis
The movement of cash from one period to another can be found out through this analysis.Besides, the reasons for cash balance and changes between two periods are also found out. Itstudies the cash from operation and the movement of cash in a period under the distinct headingof operating activities, financing activities and investing activities.
6. Standard Costing
Standard cost is predetermined cost. It provides a yard stick for measuring actual performance. Itis used to find the reasons for the variances if any.
7. Marginal Costing
Marginal costing technique is used to fix the selling price, selection of best sales mix, best use ofscarce raw materials or resources, to take make or buy decision, acceptance or rejection of bulkorder and foreign order and the like. This is based on the fixed cost, variable cost andcontribution.
8. Budgetary Control
Under Budgetary control techniques, future financial needs are estimated and arranged accordingto an orderly basis. It is used to control the financial performances of business concern. Businessoperations are directed in a desired direction.

9. Revaluation Accounting
The fixed assets are revalued as per the revaluation accounting method so that the capital isproperly represented with the assets value. It helps to find out the fair return on capital employed.
10. Decision-Making Accounting
A business problem can be solved by choosing any one of the best and most profitablealternatives. To select such alternative, the relevant costs are compared. Thus, accountinginformationare used to solve the business problem which are arising out of increasing complexityof nature of business.
11. Management Information System (MIS)
Free flow of communication within the organization is essential for effective functioning ofbusiness. Hence, the management can design the system through which every employee of anorganization can assess the information and used for discharging their duties and taking qualitydecisions.
12. Statistical Techniques
There are a lot of statistical techniques used in removing management problems. Methods ofleast square, Regression analysis, Correlation analysis, Time series analysis and Statisticalquality control etc. are some examples of statistical techniques.
13. Management Reporting
The management accountant is preparing the report on the basis of the contents of profit and lossaccount and balance sheet and submit the same before the top management. Thus, managementreports disclose the strength and weakness indifferent areas of operating activities and financialactivities. These identifications are highly useful to management in exercising control and takingappropriate decision.
14. Ratio Analysis
It is used by management in the discharge of its basic functions of forecasting, planning,coordination, communication and control. It paves the way for effective control of businessoperations by undertaking an appraisal of both the physical and monetary targets.
Summary of Tools and Techniques of Management Accounting:
1. Based on Financial Accounting Information Analysis of Financial Statements through Ratio Analysis. Analysis of Financial Statements through Comparative statements,Common size
statements, Trend, Graph and Diagram. Funds flow and Cash flow analysis.

Return on Capital Employed Techniques.
2. Based on Cost Accounting Information Marginal costing (including cost-volume-profit analysis). Differential costing. Standard Costing. Analysis of Cost Variances.
3. Based on Mathematics Operation Research. Linear Programming. Network Analysis. Queuing theory and Game Theory. Simulation Theory.
4. Based on Future Information Budgetary Control. Business Forecasting. Project Appraisal or Evaluation.
5. Miscellaneous Tools Managerial Reporting. Integrated Auditing. Financial Planning. Revaluation Accounting. Decision Making Accounting. Management Information System.
1.12 LIMITATIONS OF MANAGEMENT ACCOUNTING
Management Accounting, being comparatively a new discipline, suffers from certain limitationswhich limits its effectiveness. These limitations are as follows:
1. Limitations of Basic Records: Management Accounting derives its information fromfinancial accounting, cost accounting and other records. The strength and weakness of themanagement accounting, therefore, depends upon the strength and weakness of these basicrecords. In other words, their limitations are also the limitations of management accounting.
2. Persistent Efforts: The conclusions drawn by the management accountant are not executedautomatically. He has to convince people at all levels because people by nature are resistant tochange. In other words, he must be an efficient salesman in selling his ideas.
3. Management Accounting is only a Tool: Management Accounting cannot replace themanagement. Management accountant is only an adviser to the management. The decision

regarding implementing his advice is to be taken by the management. There is always atemptation to take an easy course of arriving at decision by intuition rather than going by theadvice of the management accountant.
4. Wide Scope: Management Accounting has a very wide scope incorporating many disciplines.It considers both monetary as well as non-monetary factors. These factors bring inexactness andsubjectivity in the conclusions obtained through it.
5. Top-Heavy Structure: The installation of Management Accounting system requires heavycosts on account of an elaborate organization and numerous rules and regulations. It can,therefore, be adopted only by big concerns.
6. Opposition to Change: Management Accounting demands a break away from traditionalaccounting practices. It calls for a rearrangement of the personnel and their activities which isgenerally not liked by the people involved.
7. Evolutionary Stage: Management Accounting is in its evolution stage. It has, therefore, thesame impediments as a new discipline will have, e.g., fluidity of concepts, raw techniques andimperfect analytical tools. This all creates doubt about the very utility of managementaccounting. The rapid changes in the business scenario are big challenge before managementaccounting.
1.13 REVIEW QUESTIONS:
1. Discuss in detail the functions of management accounting. Explain the nature and scope ofmanagement accounting.
2. Explain the term ‘management accounting’ and state the objectives of managementaccounting.
3. ‘Management Accounting is the presentation of accounting information in such a way as toassist management in the creation of policy and in the day to day operations of the undertaking’.Elucidate this statement.
4. ‘Management Accounting is nothing more than the use of financial information formanagement purpose’. Explain this statement and clearly distinguish between financialaccounting & management accounting.
5. What do you understand by ‘Management Accounting’? How does it differ from CostAccounting?
6. How does management accounting differ from Financial Accounting? What are the limitationsof Management Accounting?
7. ‘Management Accounting aims at providing financial result of the business to the managementfor taking decisions.’ Explain by bringing out advantages of Management Accounting.
8. Describe fully the limitations of Financial Accounting and point out how ManagementAccounting helps in overcoming them.
10. “Management Accounting is Financial Accounting bend at its elastic point.” How far do-youagree with this statement? Explain.
10. Explain the features of Management Accounting.
11. “There is an intimate relationship between Management Accounting and finance function.”Elucidate.
12. “Management Accounting is concerned with information which is useful to management.”Explain.
13. “A management accountant is both an information provider and a part of management”Explain.
14. “Management Accounting is the best tool for management to achieve its objectives”.Elucidate.
15. How does management accounting help planning and controlling the functions of anorganization?
16. Define “Management Accounting” and state its important tools and techniques.

UNIT-2
CASH FLOW STATEMENT
LEARNING OBJECTIVES:
-To understand the meaning, nature, objective of Cash Flow Statement
-To learn the classification of activities under Cash Flow Statement
-To acquaint with the provisions of Indian Accounting Standard on Cash Flow Statement
-To know different steps of preparation of Cash Flow Statement
-To analyze the merits and demerits of Cash Flow Statement
-To differentiate between Cash Flow Statement, Income Statement and Funds Flow Statement
CHAPTER OUTLINE:
1.1: Introduction
1.2: Meaning of Cash Flow Statement
1.3 Objectives of Preparing Cash Flow Statement
1.4 Classification of Cash Flow Activities
1.5 Main Heads of Cash Flow Statement
1.6 Methods of Preparing Cash Flow Statement
1.7 Indian Accounting Standard (Ind AS-7) on Cash Flow Statement
1.8 Basic information for Preparation of Cash Flow Statement
1.9Stepby Step Procedure to Prepare Cash Flow Statement
1.10 Utility/Uses/Importance/Significance of Cash Flow Statement
1.11 Limitations/Disadvantages of Cash Flow Statement
1.12 Difference between Cash Flow Statement & Income Statement
1.13 Difference between Cash Flow Statement & Funds Flow Statement
1.14 Miscellaneous Examples
1.15 Glossary

1.16 Theoretical Questions
1.17 Practical Questions
1.1 INTRODUCTION
“Cash is King”; is a known fact, that it is the basis of any business. No bills, employee payment,expenses payment would be made without cash. Expansions or addition to businesses can happenonly through cash. In financial terms, Cash FlowStatement is a statement (report) of flows (bothin and out of the business) of cash. Monitoring the cash situation of any business is the key. Theincome statement would reflect the profits but does not give any indication of the cashcomponents. The important information of what the business has been doing with the cash isprovided mainly by the Cash FlowStatement. Like the other financial statements, the CashFlowStatement is also usually drawn up annually, but can be drawn up more often. It isnoteworthy that Cash FlowStatement covers the flows of cash over a period of time (unlike thebalance sheet that provides a snapshot of the business at a particular date). Also, the CashFlowStatement can be drawn up in a budget form and later compared to actual figures.
1.2 MEANING OF CASH FLOW STATEMENT
1. It is a summary of the actual or anticipated incomings and outgoings of cash in a firm overan accounting period (month, quarter, and year). It answers the questions: Where the cash came(will come) from? Where it went (will go)?
2. Cash Flow Statements assess the amount, timing, and predictability of cash-inflows andcash-outflows, and are used as the basis for budgeting and business-planning.
3. A Cash FlowStatement provides information about the changes in cash and cashequivalents of a business by classifying cash flows into operating, investing and financingactivities. It is a key report to be prepared for each accounting period for which financialstatements are presented by an enterprise.
NOTE: Cash and Cash Equivalents generally consist of the following: Cash in hand, Cash atbank& Short term investments that are highly liquid.
1.3 OBJECTIVES OF PREPARING CASH FLOW STATEMENT
1. Cash Flow Statement shows inflow and outflow of cash and cash equivalents from variousactivities of a company during a specific period under the main heads i.e., operating activities,investing activities and financing activities.
2. Information through the Cash Flow Statement is useful in assessing the ability of anyenterprise to generate cash and cash equivalents and the needs of the enterprise to utilize thosecash flows.
3. Taking economic decisions requires an evaluation of the ability of an enterprise to generatecash and cash equivalents, which is provided by the Cash Flow Statement
4. Statement of cash flows provides important insights about the liquidity and solvency of acompany which are vital for survival and growth of any organization.
5. It enables analysts to use the information about historic cash flows for projections of futurecash flows of an entity on which to base their economic decisions.
6. By summarizing key changes in financial position during a period, Cash Flow Statementserves to highlight priorities of management.
7. Comparison of cash flows of different entities helps to reveal the relative quality of theirearnings since cash flow information is more objective as opposed to the financial performancereflected in income statement.
1.4 CLASSIFICATION OF CASH FLOW ACTIVITIES:
Cash flow activities are to be classified into three categories:
Operating Activities Investing Activities Financing Activities
This is done to show separately the cash flows generated / used by these activities, therebyhelping to assess the impact of these activities on the financial position and cash and cashequivalents of an enterprise.
1.4.1 Cash Flows from Operating Activities:
Operating activities are the activities that comprise of the primary / main activities of anenterprise during an accounting period. For example, for a garment manufacturing company,operating activities include procurement of raw material, sale of garments, incurrence ofmanufacturing expenses, etc. These are the principal revenue generating activities of theenterprise. Hence, Operating activities are the principal revenue-producing activities of theenterprise. Operating activities include cash effects of those transactions and events that enterinto the determination of net profit or loss. Cash flows from operating activitiesinclude thefollowings:
Cash receipts from sale of goods and the rendering services;
Cash receipts from royalties, fees, commissions and other revenue;
Cash payments to suppliers for goods and services;
Cash payments to and on behalf of employees;
Cash receipts and payments of an insurance enterprise for premiums and claims annuitiesand other policy benefits;
Cash payments or refunds of income taxes unless they can be specifically identified withfinancing and investing activities; and
Cash receipts and payments relating to future contracts, forward contracts, optioncontracts, and swap contracts when the contracts are held for dealing or trading purpose.
1.4.2 Cash Flows from Investing Activities:
Cash flow from investing activities includes the movement of cash flows owing to the purchaseand sale of assets. Investing activities are the acquisition and disposal of long term assets andother investments not included in cash equivalent. In other words, investing activities includetransactions and events that involve the purchase and sale of long-term productive assets (e.g.,land, building, plant and machinery, etc.) not held for resale and other investments. Thefollowing are the examples of cash flows arising from investing activities:
(a) Cash payments to acquire fixed assets (including intangibles). These payments include thoserelating to capitalized research and development costs and self-constructed fixed assets.
(b) Cash receipts from disposalof fixed assets (including intangibles).
(c) Cash payments to acquire shares, warrants, or debt instruments of other enterprises andinterests in joint ventures (other than payments for those instruments considered to be cashequivalent and those held for dealing or trading purposes).
(d) Cash receipt from disposal of shares, warrants, or debt instruments of other enterprises andinterest in joint ventures (other than receipts from those instruments considered to be cashequivalents and those held for dealing or trading purposes).
(e) Cash advances and loans made to third parties (other than advances and loans made by afinancial enterprise).
(f) Cash receipts from repayment of advances and loans made to third parties (Other thanadvances and loan of a financial enterprise).
(g) Cash receipts and payments relating to futurecontract, option contract, and swap contractsexcept when the contracts are held for dealing or trading purposes.
1.4.3 Cash Flows from Financing Activities
It includes financing activities related to long-term funds or capital of an enterprise. Financingactivities are activities that result in changes in the size and composition of the owners’ capitaland borrowings of the enterprisee.g., cash proceeds from issue of equity shares, debentures,raising long-term loans, repayment of bank loans, etc.

Financing activities are activities that result in changes in the size and composition of the‘owners’ capital (including preference share capital in the case of a company) and borrowings ofthe enterprise. The following are the examples of cash flows arising from financing activities:
(a) Cash proceeds from issuing shares or other similar instruments;
(b) Cash proceeds from issuing debentures, loans notes, bonds and other short term borrowing;
(c) Cash payments of amount borrowed;
(d) Payment of dividend.
Special Items: In addition to the general classification of three types cash flow, Ind AS-7provides for the treatment of the cash flows of certain special items as under:
(a)Foreign Currency Cash Flows: Cash flow arising from transactions in a foreign currencyshould be recorded in an enterprise’s reporting currency by applying to the foreign currencyamount the exchange rate between the reporting currency and foreign currency at the date ofcash flow. A rate that approximates actual rate may be used if the result is substantially the sameas would arise if the rates at the date of cash flows were used. Unrealised gains and losses arisingfrom changes in foreign exchange rate changes on cash and cash equivalent held or due inforeign currency is reported in the Cash FlowStatement in order to reconcile cash and cashequivalents at the beginning and end of the period.
(b) Extraordinary Items: The cash flows associated with extraordinary items such as bad debtsrecovered, claims from insurance companies, winning of a law suit or lottery etc., are disclosedseparately as arising from operating, investing or financing activities in the Cash FlowStatement.
(c)Interest and Dividends: The treatment of interest and dividends, received and paid, dependsupon the nature of enterprise, that is, financial enterprises or other enterprises, as follows:
(i) In the case of financial enterprises, cash flows arising from interest paid and interest anddividend received, should be classified as cash flows from operating activities.
(ii) In the case of other enterprises-(a) cash flows arising from interest paid should be classifiedas cash flows from financing activities while interest and dividend received should be classifiedas cash flows from investing activities; (b) dividends paid should be classified as cash flowsfrom financing activities.
(d)Taxes on Income: Cash flows arising from taxes on income should be separately disclosedand should be classified as cash flows from operating activities unless they can be specificallyidentified with financing and investing activities.

(e) Acquisition and Disposal of Subsidiaries and Other Business Units: The aggregate cashflows arising from acquisitions and from disposals of subsidiaries or other business units shouldbe presented separately and classified as investing activities.
(f) Non-Cash Transaction: Investing and financing transactions that do not require the use ofcash or cash equivalents should be excluded from a Cash FlowStatement. Such transactionsshould be disclosed elsewhere in the financial statements in a way that provides all the relevantinformation about these investing and financing activities. The exclusion of non-cashtransactions from the Cash FlowStatement is consistent with the objective of a CashFlowStatement as these do not involve cash flows in the current period. Following are examplesof non-cash transactions:
(i) The acquisition of assets by assuming directly related liabilities;
(ii) The acquisition of an enterprise by means of issue of shares;
(iii) Conversion of debt into equity.
1.5 MAIN HEADS OF CASH FLOW STATEMENT:
Cash Flows from Operating Activities (A) xxxCash Flows from Investing Activities (B) xxxCash Flows from Financing Activities (C) xxxNet Increase (Decrease) in Cash and Cash Equivalents (A + B + C) xxxxxAdd: Cashand Cash Equivalents at the Beginning xxxCash and Cash Equivalents at the End xxxxx
1.6 METHODS OF PREPARING THE CASH FLOW STATEMENTS
Operating activities are the main source of revenues and expenditures, thereby cash flow fromthe same needs to be ascertained. The cash flow can be reported through two ways:
(a)Direct method that discloses the major classes of gross cash receipts and cash payments
(b)Indirect method that has the net profit or loss adjusted for effects of (1) transactions of a non-cash nature, (2) any deferrals or accruals of past/future operating cash receipts and (3) items ofincome or expenses associated with investing or financing cash flows.
DIRECT METHOD:
In the direct method, the major heads of cash inflows and outflows (such as cash received fromtrade receivables, employee benefits, expenses paid, etc.) are to be considered.
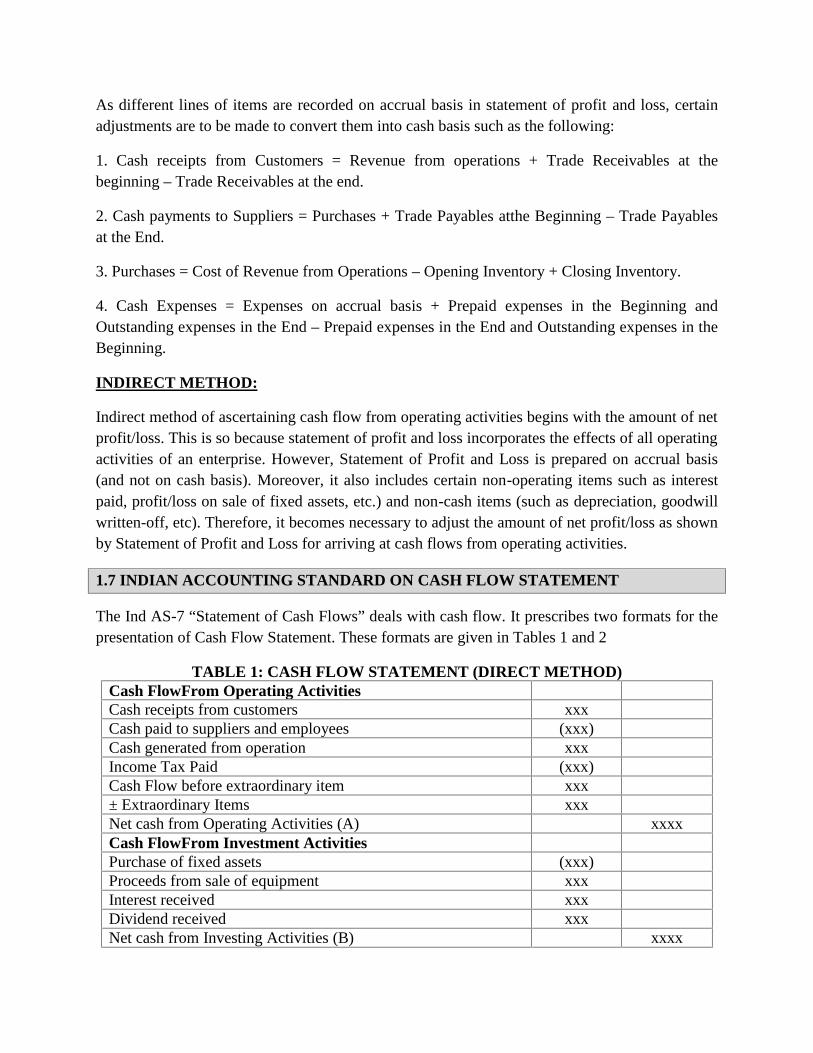
As different lines of items are recorded on accrual basis in statement of profit and loss, certainadjustments are to be made to convert them into cash basis such as the following:
1. Cash receipts from Customers = Revenue from operations + Trade Receivables at thebeginning – Trade Receivables at the end.
2. Cash payments to Suppliers = Purchases + Trade Payables atthe Beginning – Trade Payablesat the End.
3. Purchases = Cost of Revenue from Operations – Opening Inventory + Closing Inventory.
4. Cash Expenses = Expenses on accrual basis + Prepaid expenses in the Beginning andOutstanding expenses in the End – Prepaid expenses in the End and Outstanding expenses in theBeginning.
INDIRECT METHOD:
Indirect method of ascertaining cash flow from operating activities begins with the amount of netprofit/loss. This is so because statement of profit and loss incorporates the effects of all operatingactivities of an enterprise. However, Statement of Profit and Loss is prepared on accrual basis(and not on cash basis). Moreover, it also includes certain non-operating items such as interestpaid, profit/loss on sale of fixed assets, etc.) and non-cash items (such as depreciation, goodwillwritten-off, etc). Therefore, it becomes necessary to adjust the amount of net profit/loss as shownby Statement of Profit and Loss for arriving at cash flows from operating activities.
1.7 INDIAN ACCOUNTING STANDARD ON CASH FLOW STATEMENT
The Ind AS-7 “Statement of Cash Flows” deals with cash flow. It prescribes two formats for thepresentation of Cash Flow Statement. These formats are given in Tables 1 and 2
TABLE 1: CASH FLOW STATEMENT (DIRECT METHOD)Cash FlowFrom Operating ActivitiesCash receipts from customers xxxCash paid to suppliers and employees (xxx)Cash generated from operation xxxIncome Tax Paid (xxx)Cash Flow before extraordinary item xxx± Extraordinary Items xxxNet cash from Operating Activities (A) xxxxCash FlowFrom Investment ActivitiesPurchase of fixed assets (xxx)Proceeds from sale of equipment xxxInterest received xxxDividend received xxxNet cash from Investing Activities (B) xxxx
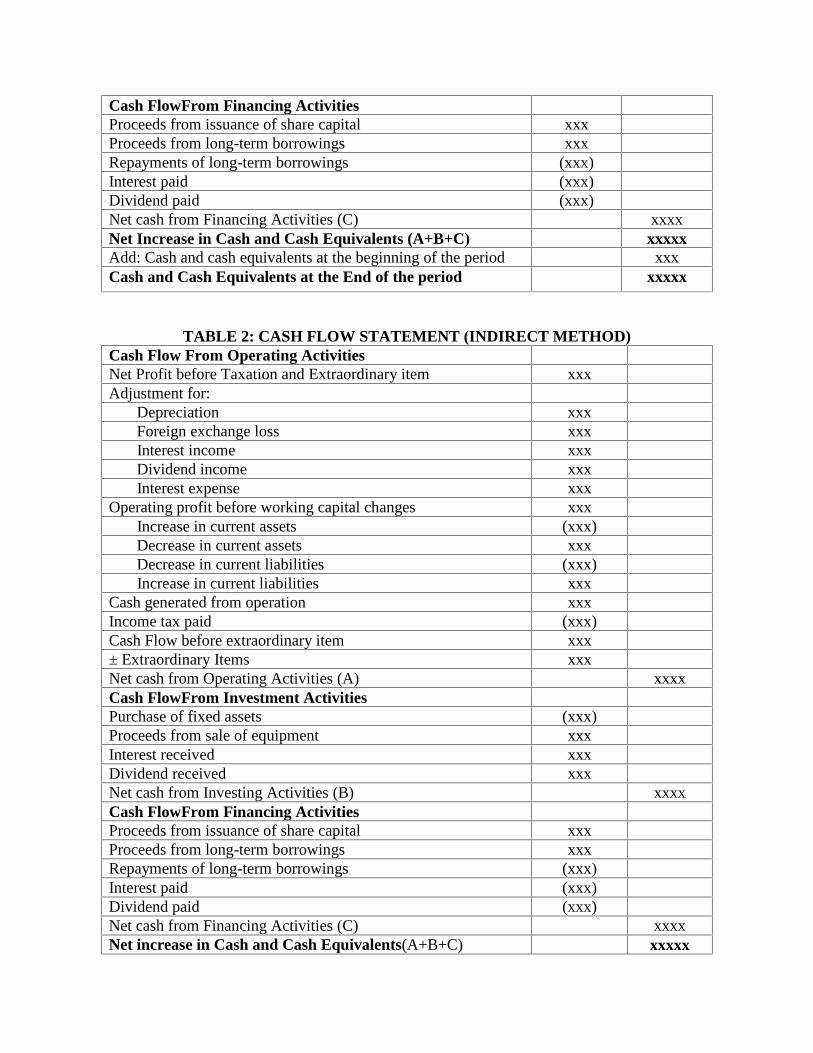
Cash FlowFrom Financing ActivitiesProceeds from issuance of share capital xxxProceeds from long-term borrowings xxxRepayments of long-term borrowings (xxx)Interest paid (xxx)Dividend paid (xxx)Net cash from Financing Activities (C) xxxxNet Increase in Cash and Cash Equivalents (A+B+C) xxxxxAdd: Cash and cash equivalents at the beginning of the period xxxCash and Cash Equivalents at the End of the period xxxxx
TABLE 2: CASH FLOW STATEMENT (INDIRECT METHOD)Cash Flow From Operating ActivitiesNet Profit before Taxation and Extraordinary item xxxAdjustment for:
Depreciation xxxForeign exchange loss xxxInterest income xxxDividend income xxxInterest expense xxx
Operating profit before working capital changes xxxIncrease in current assets (xxx)Decrease in current assets xxxDecrease in current liabilities (xxx)Increase in current liabilities xxx
Cash generated from operation xxxIncome tax paid (xxx)Cash Flow before extraordinary item xxx± Extraordinary Items xxxNet cash from Operating Activities (A) xxxxCash FlowFrom Investment ActivitiesPurchase of fixed assets (xxx)Proceeds from sale of equipment xxxInterest received xxxDividend received xxxNet cash from Investing Activities (B) xxxxCash FlowFrom Financing ActivitiesProceeds from issuance of share capital xxxProceeds from long-term borrowings xxxRepayments of long-term borrowings (xxx)Interest paid (xxx)Dividend paid (xxx)Net cash from Financing Activities (C) xxxxNet increase in Cash and Cash Equivalents(A+B+C) xxxxx

Add: Cash and cash equivalents at the beginning of the period xxxCash and Cash Equivalents at the End of period xxxxx
1.8 BASIC INFORMATION FOR PREPARATION OF CASH FLOW STATEMENT
The following basic informationis required to prepare a Cash Flow Statement:
1. Comparative Balance Sheet: The first and the foremost requirement is the comparativeBalance Sheet in the beginning and end of the period to find out the changes taking place indifferent items of the Balance Sheet.
2. Income Statement for the period under consideration: The Income Statement of the periodis also required to find out the cash generated or used in the operation of the firm.
3. Additional Information: Together with Balance Sheet and Income Statement other relevantinformation is also required to identify the hidden information, if any.
1.9 STEP BY STEP PROCEDURE TO PREPARE CASH FLOW STATEMENT
1. Calculate the Net Increase or Decrease in Cash and Cash Equivalent. For this purpose theopening balance of total cash and equivalents is compared with the closing balance of cash andequivalents. The net increase/decrease as shown here is the figure to be explained by Cash FlowStatement. Table 1.4 explains the procedure for this.
TABLE 1.4: INCREASE/DECREASE IN CASH AND CASH EQUIVALENTOpening Bal. Closing Bal.
Cash in Hand xxx xxxCash at Bank xxx xxxShort-term Investment xxx xxxTotal xxxxx xxxxx
The difference between the totals of opening and closing balances will be the increase ordecrease in cash and equivalents during the period. It may be noted that if there are only one ortwo items of cash etc., then the table as above need not be prepared and the net increase ordecrease may be ascertained by simple observation only.
2. Net Cash Flow from Operating Activities: The term operating activities refers to the normalbusiness transactions relating to goods and services being traded by the firm e.g. sale andpurchase of goods and services. On the basis of the information contained in the ComparativeBalance Sheet and the Income Statement and the additional information, the net cash flowgenerated or used by operating activities may be ascertained. The Income Statement prepared by

the firm gives the net profit figure earned by the firm, on an accrual basis i.e. all items in theIncome Statement are incorporated on the basis of earned/ accrued even if not resulting cashmovements. So, profit or loss as shown by the Income Statement may not result inincrease/decrease in cash balance by the same amount. In order to prepare the Cash FlowStatement, what is required is the amount of cash generated or used by operating activities. Forthis purpose, the non-cash and non-operating items are adjusted to the net profit figures asreported in the Income Statement. In the Cash Flow from Operating Activities, the purpose is toconvert the net profit (accounting) which is based on accrual concept to the cash flow fromoperations. Ind AS-7 has given two procedures to find out the net cash from operating activitiesas follows:
(a) Direct Method: In Direct method, an attempt is made to convert the given Income Statementinto a cash basis Income Statement. All the sales, purchases, expenses etc. are analyzed to findout the cash effect of all these items as follows:
(i) The Cash Realized from Sales may be ascertained as follows:Cash Sales xxxCredit Sales (as given in Income Statement) xxxLess: Closing Balance of Debtors xxxClosing Balance of Bills xxxAdd: Opening Balance of Debtors xxxOpening Balance of Bills xxxCash generated from Credit sales xxx xxxTotal Cash Generated xxxxx(ii) The Cash Paid for Purchases may be ascertained as follows:Cost of goods sold (As given in IncomeStatement)
xxx
Less: Opening Stock xxxAdd: Closing Stock xxxTotal Purchases xxxAdd: Opening balance of Creditors xxxLess: Closing balance of Creditors xxxCash paid for Purchases xxxxxSimilarly, Cash Paid for any Expense item may be ascertained as follows:Expense (as given in Income Statement) xxxAdd: Outstanding in the beginning xxxLess: Outstanding at the end xxxCash paid for Expenses xxxxx
Under Direct method, all non-cash expense items such as depreciation, writing off the fictitiousassets, amortization of intangible asset, etc. are ignored. Similarly, profit or loss on sale ofassets/investments is also not considered.

(b) Indirect Method: In the indirect method, the net profit (before tax and extraordinary items)figure is the starting point. This profit figure is adjusted for non-cash and non-operating items tofind out the cash from operating activities. Generally, the adjustment is required for thefollowing items:
(i) Non-cash expenses such as depreciation, intangible and fictitious assets written off, loss onsale of assets/investment, etc. are added back.
(ii) Non-cash and Non-operating incomes such as profit on sale of assets/investments, interestincome, dividend income, interest accrued but not received are deducted from the net profit toarrive at the cash from operating activities.
(iii) Changes in current accounts and current liabilities during the year are also adjusted to findout the cash from operating activities.
Under the Indirect method the cash from operating activities may be finally ascertained as shownin Table 3.
TABLE 3: CASH FLOW FROM OPERATING ACTIVITIESAmount
Net Profit Before Tax and Extraordinary Items xxx+ Depreciation xxx+ Provision for contingencies xxx+ Provision for retirement benefits xxx+ Loss on sale of fixed assets xxx+ Loss/(Profit) on disposal of investments xxx+ Interest paid xxx- Dividend received (xxx)- Interest received (xxx)Operating Profit Before Working Capital ChangesAdjustment for:+ Decrease/ (increase) in trade and other receivables xxx+ Decrease/ (increase) in inventories xxx+ Decrease/ (increase) in trade payables xxxCash Generated From Operations xxx- Direct taxes paid (xxx)Cash FlowBefore Extraordinary Items xxx± Extraordinary item xxxNet Cash Inflow/ (Outflow) From Operations xxxxx
3. Calculation of Cash provided by Financing and Investment Activities: All other items(except current accounts already considered in step 2 above) are analysed in the light ofadditional information to find out the resultant cash flow, if any. For this purpose, different itemsand information are classified into financing activities and investing activities.

4. Preparation of Cash Flow Statement (CFS): On the basis of information collected andcalculations made in the above steps, now the Cash Flow Statement can be prepared as per anyof the formats given earlier (Table 1 and 2). The net cash flow provided by operating activitiesplus financing activities plus investing activities is equal to the net change in cash andequivalents (as calculated in step 1).
5.Other Items: If there is any other investment or financing transaction (not already covered instep 3 above) that should be disclosed in the Cash Flow Statement e.g., there may be a purchaseof an asset by issue of capital or debenture. This transaction will not find place in the usual CashFlow Statement but must be disclosed to make the Cash Flow Statement a useful and ameaningful document.
1.10UTILITY / USES, IMPORTANCE OR SIGNIFICANCE OF CASH FLOWSTATEMENT
The main uses and importance of Cash FlowStatement can be summarized as follows:
1.Evaluation of Liquidity Position : This statement helps to analyse whether short periodliabilities like creditors, bank overdrafts, bills payable, outstanding expenses can be paid easilywith the regular receipts (Inflow) of cash or not. There should be balance in inflow and outflowto keep liquidity and smooth working conditions in business.
2. Comparison in Intra-firm and Inter-firm: With the help of Cash FlowStatement, intra firm(within the firm) and inter firm (with other firms) can be carried out to know whether theliquidity position is improving or deteriorating over the period of time.
3. Arrangement of Future Needs: The requirement of cash and availability of cash can becalculated easily after a specified period regularly to know deficit or surplus of cash to maketimely arrangement.
4. Cash Generated by Various Activities Separately: Cash flow Statement is divided intothree separate activities. . These activities are (a) Operating (b) Investing (c) Financing. It showscash generated by each activity separately.There may be positive or negative generation of cashby any of the activity but in the end total of all these three activities shows the ultimate cashposition.
5. Calculation of the Position of Repayments of Liabilities on Time: Cash FlowStatementhelps to find out whether the business has sufficient cash to pay or plan to pay its liabilities andfulfil its other needs like (a) Repayment of loans (b) funds for replacement of plant, machinery,vehicles or other fixed assets or not on time.
6.Useful to Outsiders : Cash Flow statement is very useful to outsiders like Bankers, Investors,Lenders, Debenture- holders, Creditors to judge and analyse the long-term as well as short-termliquidity and cash position of the business and taking decisions regarding financial position.

7. It Provides Test for Managerial Decision: For the long-term success of the business andgenerating higher profits, the most important rule for the management should be "MaximumFixed Assets should be purchased from funds generated from long-term sources of funds like (a)Shares (b) Debenture (c) Mortgages (d) Ploughing back of profits etc. and these liabilities shouldbe repaid out of cash generated from operating activities of the business.
8. Explains Causes of Change in Cash: Cash FlowStatement explains the reasons for change ordeviation in cash or cash equivalent between the two Balance Sheets which provides useful tipsand reasons for change in cash over the period.
9. Explanation Regarding Net Profit and Cash Balance: Sometimes a very funny positionarises in the organisation like profits are very high while cash balance is very low even there maybe situation that cash is not sufficient to pay salary bill, or power bill or for purchase of rawmaterial. On the other hand, sometimes profits are very low but large amount of cash balanceeither in hand or in bank. The reason for this situation may be issuing shares, raising loans orselling fixed assets etc.
10. Working Capital and Operating Activities Relation: The success of the business lies inthe fact that maximum needs of the working capital should be fulfilled through the cash flowfrom operating activities. Funds from long period sources should be used for fixed assets andother profit generating activities to provide strength/ stability, soundness and liquidity tobusiness.
11. Dividend Payment and Cash Resources: Regular payment of dividend is a positive sign ofgrowing and progressive business year by year. Payment of dividend increases Goodwill,Credibility among investors and better public image of organisation as well as of management.But these dividends should be paid out of the profits and reserves and not from borrowed fundsor funds raised on sale of fixed assets
12. Other Uses:
(i)Cash Flow Statements help in knowing the liquidity / actual cash position of the companywhich funds flow and P&L are unable to specify.
(ii)As the liquidity position is known, any shortfalls can be arranged for or excess can be used forthe growth of the business
(iii)Any discrepancy in the financial reporting can be gauged through the Cash FlowStatementby comparing the cash position of both.
(iv)Cash is the basis of all financial operations. Therefore, a projected Cash FlowStatement willenable the management to plan and control the financial operations properly.

(v)Cash Flow analysis together with the ratio analysis helps measure the profitability andfinancial position of business.
(vi)Cash FlowStatement helps in internal financial management as it is useful in formulation offinancial plans.
1.11LIMITATIONS/DIS-ADVANTAGES OF CASH FLOW STATEMENT
These can be summarized as follows:
1. It ignores Non-cash Transactions: While preparing Cash FlowStatement, non-cashtransactions are not included or are not considered. These transactions may be:
(a) Issue of Bonus Shares
(b) Conversion of Debentures into shares.
(c) Purchase of Fixed assets by issuing shares or consideration other than cash.
2. Closing Cash Balance can be manipulated or window dressed by Management: Ifmanagement wants, cash balance can be easily manipulated by:
(d) Postponing payments
(e) Postponing cash purchases
(f) Fast collection from debtors around closing dates of final accounts.
3. It is not a Substitute to an Income Statement (Profit and Loss Account/Statement of Profitand Loss): In Profit and Loss Account, non-cash items like depreciation, writing off goodwill,preliminary expenses etc. are included which reduces the profits while in Cash Flowstatementthese are ignored which results into difference in Net Income (profits) and cash flow during thesame period.
4. It ignores the Accrual Concept of Accounting: In the accounting system the accounts areprepared on accrual basis. It means income earned whether received or not and expenditureincurred whether paid or not are to be considered for true and fair calculation of the results ofbusiness at the end of accounting year.But Cash FlowStatement is prepared on cash basis ofaccounting. It is prepared on the basis of actual inflow and outflow of cash.
5. No True Judgment of Liquidity: Liquidity of a business cannot be judged solely upon cashor bank balance but other current assets like debtors, stock, bills receivable etc. which can beconverted into cash easily in a short period. Thus, ability to pay current liabilities cannot bejudged by cash and bank balance alone.

6. It is a Historical Document: Cash FlowStatement is prepared on the basis of two consecutiveBalance Sheets taking into account the various information provided in those documents. So thisis related to past period and thus, a historical document. For expansion and growth futureplanning is needed.
7. It is based on Secondary Data: This document is based on already prepared IncomeStatement and Balance Sheet thus, for preparing Cash FlowStatement secondary data are used.
8. Other Limitations:
(i)Through the Cash FlowStatement alone, it is not possible to arrive at actual P&L of thecompany as it shows only the cash position. It has limited usage and in isolation, it is of no useand requires Balance sheet, Profit & Loss A/C for its projections. Cash FlowStatement does notdisclose net income from operations. Therefore, it cannot be a substitute for income statement
(ii) The cash balance as shown by the Cash FlowStatement may not represent the real liquidityposition of the business because it can be easily influenced by postponing the purchases andother payments
(iii) Cash flow Statement cannot replace the funds flow statement. Each of the two has aseparate function to perform.
1.12DIFFERENCE BETWEEN CASH FLOW STATEMENT AND INCOMESTATEMENT
Sl No Basis Cash Flow Statement Income Statement1 Disclosure It is a statement of inflows and
outflows of cash fromoperating, investing andfinancing activities during aperiod.
It shows the net profit/net lossduring the period.
2 Scope Cash Flow Statement providesinformation about cash flows ofan entity and its scope is limitedonly to the extent of cash flowsfrom operating, investing andfinancing activities.
Income Statement focuses onthe ascertainment of results ofthe operations of the entity. Itrequires the measurement ofperiod’s income by revenuerecognition and matchingexpenses.
3 ActivitiesCovered
Cash Flow Statement providesinformation not only aboutoperating activities but alsoabout investing and financingactivities.
It focuses on the results of theoperations of the business anddoes not provide informationabout investing and financingactivities.
4 Earning PerShare
Cash Flow Statement does notprovide information about
Schedule III of CompaniesAct, 2013, requires the

earning per share. statement of Profit and Loss tostate the basic and dilutedearnings per share also.
5 Revenue &Expenses
Cash Flow Statement does notshow revenues recognized, orexpenses incurred during theperiod.
Income Statement shows therevenue recognized andexpenses incurred as perrelevant Accounting Standards.
6 Nature Items shown in Cash FlowStatement are objective andfactual.
Several items in IncomeStatement are based onjudgement and subjectivity.
7 Preparation Cash Flow Statement can beprepared only after BalanceSheet and Income Statement areprepared.
Income Statement is to beprepared before Balance Sheetand Cash Flow Statement.
1.13DIFFERENCE BETWEEN CASH FLOW STATEMENT AND FUNDS FLOWSTATEMENT
Sl No Basis Cash Flow Statement Funds Flow Statement1 Disclosure It discloses the
inflowandoutflow ofcash andcashequivalentsundertheheading ofoperating.InvestingandFinancing activities.
It discloses the changes of networking capital.
2 BasisofAccounting
It is preparedundercashbasis.
It is prepared underaccrualbasis.
3 Usefulness It is usedfor shorttermfinancialplanning.
It is used for long termfinancialplanning.
4 DistinctHeading
It shows inflows andoutflowsof cashunder threedistinctheadings-Operating,Investing andFinancingactivities.
It shows sources andapplicationsof funds withoutany heading.
5 Prescribedformat
It is preparedasperprescribedformat ofIndAS-7.
There is nosuchprescribedformat.
6 Scope It's scope is narrowasonlycash andcashequivalentsareconsidered.
It's scope is wide as theconcept of fund is net workingcapital i.e. total current assetsminustotal current liabilities.
7 Changes ofWorkingCapital
It shows the changes inworking capital moreclearly.
It shows the changes inworking capital at a glance.

1.14 DIFFERENCE BETWEEN CASH FLOW STATEMENT AND BALANCE SHEET
Sl No Basis Cash Flow Statement Balance Sheet1 Meaning A statement that shows the
cash inflow and outflow ofthe company.
A statement that shows theassets owned and the liabilitiesowed by the company.
2 Classified into Three parts Two parts3 Importance Helpful in budgeting and
forecasting.Discloses financial position ofthe company.
4 InformationDisclosed
Movement of cash and cashequivalent.
Assets, Equity and Liabilities.
5 Basis It is prepared taking profit &loss account and balancesheet into consideration.
It is prepared taking profit &loss account into consideration.
1.15 ILLUSTRATIONS:
Illustration 1:
The following are the list of Transactions for Ram Software Limited (RSL) for 2019
On March 1 Ram & others invest ₹50,000 in cash in RSL.On March 2 Ram took a loan of ₹20,000 from Venugopal for RSL. Being a nice friend,
Venugopal does not demand any interest on the loan amount and asks it to berepaid in six months’ time.
On March 3 RSL purchased for cash two computers, each costing ₹29,000On March 4 RSL purchased supplies especially stationary for ₹6,000 on credit.On March 19 RSL completes its maiden sale of software to a retail store and receives a
price of ₹12,000.On March 21 RSL pays ₹2000 to its creditors for supplies.On March 29 RSL pays salaries to its employees, amounting to ₹4,000 and office rent ₹
1,200.On March 30 RSL delivers a software package for a shoe shop. The customer agrees to pay
the price of ₹8,000 a week later.On March 31 Ram withdraws ₹3,500 for his personal use.
At the end of the month, you are required to prepare its statement of cash flow following
Direct Method.

Solution:
The first and second transactions of raising owner’s equity and taking a loan would be part of itsfinancing activities as cash inflows.
The third transaction involving RSL purchasing two computers would be a part of its investingactivities cash outflow.
The fourth transaction would not lead to any change in its cash position and hence would not bepart of its Cash FlowStatement.
The next transaction on March 19, wherein RSL completes its maiden sale of software to a retailstore and receives a price of ₹12,000 would be a part of its operating cash inflow. On March 21,RSL pays ₹ 2,000 cash (Part of its payables) to its supplier resulting in an operating cashoutflow.
RSL pays salaries to its employees, amounting to ₹4,000 and office rent ₹1,200 resulting in anoperating cash outflow.
RSL delivers Software package for a shoe shop worth ₹8,000 and the customer agrees to paythe price week later. This transaction would result in neither a cash inflow nor a cash outflow andhence there would be no change in our statement of cash flow. On the other hand, accrualprinciple would have taken this transaction as an increase in the revenue of the company by asimilar amount as part of its profit and loss account.
On March 31, the owner withdraws ₹3,500 from the profits of the company. We may considerthis outflow of the company’s profit as the dividend resulting in a cash outflow due to the firmsfinancing activities.
A summary of all the above transactions would be:
CASH FLOW STATEMENT OF RAM SOFTWARE LIMITED
(For the period 1 stMarch 2019 to 31st March 2019)
Particulars Details(₹)
Amount(₹)
Cash Flow From Operating ActivitiesCash received from customers 12,000Cash paid to suppliers, rent, and employees (7,200)Net Cash Provided By Operating Activities (A) 4,800Cash Flow from Investing ActivitiesPurchase of office equipment (58,000)Net Cash Provided By Investing Activities (B) (58,000)Cash Flow from Financing Activities
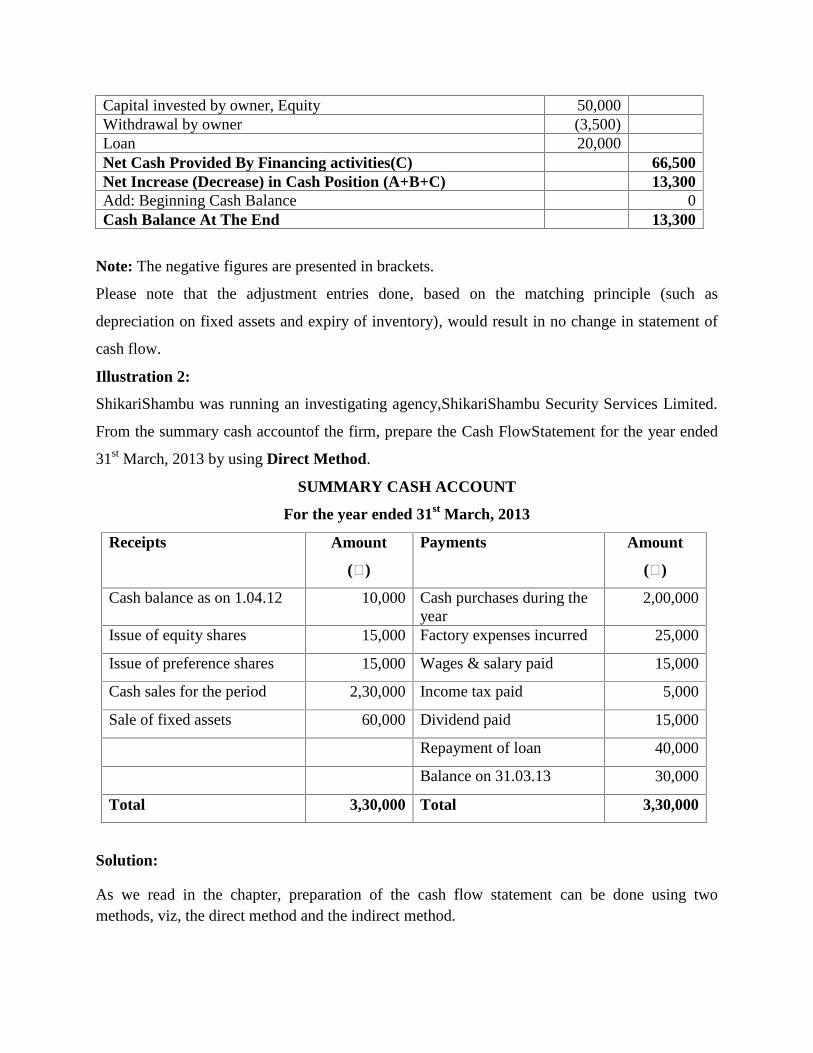
Capital invested by owner, Equity 50,000Withdrawal by owner (3,500)Loan 20,000Net Cash Provided By Financing activities(C) 66,500Net Increase (Decrease) in Cash Position (A+B+C) 13,300Add: Beginning Cash Balance 0Cash Balance At The End 13,300
Note: The negative figures are presented in brackets.
Please note that the adjustment entries done, based on the matching principle (such as
depreciation on fixed assets and expiry of inventory), would result in no change in statement of
cash flow.
Illustration 2:
ShikariShambu was running an investigating agency,ShikariShambu Security Services Limited.
From the summary cash accountof the firm, prepare the Cash FlowStatement for the year ended
31st March, 2013 by using Direct Method.
SUMMARY CASH ACCOUNT
For the year ended 31st March, 2013
Receipts Amount
(₹)
Payments Amount
(₹)
Cash balance as on 1.04.12 10,000 Cash purchases during theyear
2,00,000
Issue of equity shares 15,000 Factory expenses incurred 25,000
Issue of preference shares 15,000 Wages & salary paid 15,000
Cash sales for the period 2,30,000 Income tax paid 5,000
Sale of fixed assets 60,000 Dividend paid 15,000
Repayment of loan 40,000
Balance on 31.03.13 30,000
Total 3,30,000 Total 3,30,000
Solution:
As we read in the chapter, preparation of the cash flow statement can be done using twomethods, viz, the direct method and the indirect method.
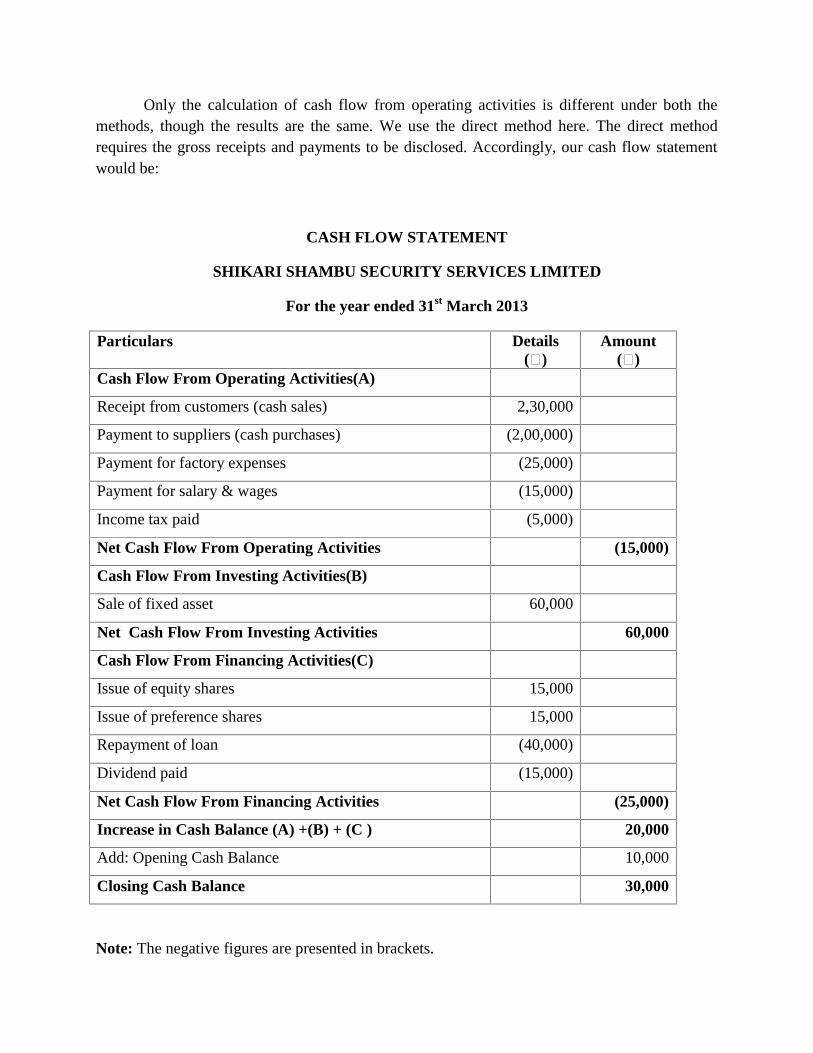
Only the calculation of cash flow from operating activities is different under both themethods, though the results are the same. We use the direct method here. The direct methodrequires the gross receipts and payments to be disclosed. Accordingly, our cash flow statementwould be:
CASH FLOW STATEMENT
SHIKARI SHAMBU SECURITY SERVICES LIMITED
For the year ended 31st March 2013
Particulars Details(₹)
Amount(₹)
Cash Flow From Operating Activities(A)
Receipt from customers (cash sales) 2,30,000
Payment to suppliers (cash purchases) (2,00,000)
Payment for factory expenses (25,000)
Payment for salary & wages (15,000)
Income tax paid (5,000)
Net Cash Flow From Operating Activities (15,000)
Cash Flow From Investing Activities(B)
Sale of fixed asset 60,000
Net Cash Flow From Investing Activities 60,000
Cash Flow From Financing Activities(C)
Issue of equity shares 15,000
Issue of preference shares 15,000
Repayment of loan (40,000)
Dividend paid (15,000)
Net Cash Flow From Financing Activities (25,000)
Increase in Cash Balance (A) +(B) + (C ) 20,000
Add: Opening Cash Balance 10,000
Closing Cash Balance 30,000
Note: The negative figures are presented in brackets.

Interpretation:The Company has shown a very weak performance wherein the cash has beengenerated through the sale of fixed assets and through issue of shares other than throughoperations. The cash was basically utilized for repayment of loan and for paying the dividends.
Illustration 3:
From the following summary cash account of Bismaya Limited, Prepare Cash Flow Statementfor the year ending 31st March 2019 in accordance with Ind AS- 7 using Direct method.
SUMMARY OF CASH ACCOUNTOF BISMAYA LIMITED
FOR THE YEAR ENDING 31ST MARCH 2019
(Figures in Thousands)
Particulars Amount(₹)Balance on 01.04.2018 50Issue of equity share 300Received from customers 2,800Sale of fixed assets 100Total 3,250Payment to suppliers 2,000Purchase of fixed assets 200Overhead expenses 200Wages and salaries 100Taxation 250Dividend 50Repayment of bank loan 300Balance on 31.03.2019 150Total 3,250
Solution:
CASH FLOW STATEMENT OF BISMAYALIMITEDFor the year ending 31.12.2019
(Figures in Thousands)
Particulars Details(₹)
Amount(₹)
Cash Flow from Operating Activities(A)Cash received from customers 2,800Cash paid to suppliers and employees (2,000+200+100) (2,300)Cash Generated From Operation 500Income tax paid (250)Net Cash Flow From Operating Activities 250

Cash Flow from Investing activities(B)Purchase of fixed assets (200)Proceed from sale of fixed assets 100Net Cash Flow From Investing Activities (100)Cash Flow from Financing Activities(C)Issue of equity share 300Repayment of bank loan (300)Dividend paid (50)Net Cash Outflow in Financing Activities (50)Net Increase in Cash and Cash Equivalent During ThePeriod(A+B+C)
100
Add: Cash and Cash Equivalent at the Beginning 50Cash and Cash Equivalent At The End 150
1.16 SELF ASSESMENT QUESTIONS
1. What is meant by Cash Flow Statement? State its main objectives.
2. State the uses of Cash Flow Statement. What are the objectives of preparing it?
3. How are the various activities classified (as per Ind AS-7) while preparing the Cash FlowStatement?
4. Describe ‘direct’ and ‘indirect’ methods of ascertaining cash flow from operating activities.
5. Enumerate the various steps involved in the preparation of Cash Flow Statement.
6. Prepare a format of cash flow from operating activities under direct and indirect methods.
7. What is a Cash Flow Statement? Write the differences between a funds flow statement andcash flow statement.
8. What is meant by Cash Flow Statement? Explain briefly how the statement is prepared as perInd-AS 7.
9. Elaborate the importance and limitations of Cash Flow Statement?
10. What is the purpose of preparing Cash Flow Statement? How is it prepared? Explain andillustrate.

RATIO ANALYSIS
(Financial Ratios compare the results in different line items of the financial statements. Theanalysis of these ratios is designed to draw conclusions regarding the financialperformance, liquidity, leverage and asset usage of a business.): Anonymous
Learning Objective:
To understand the meaning of Ratio and Ratio analysis
To know the uses/significance/importance/utility of Ratio Analysis
To identify various limitations of Ratio Analysis
To acquaint with different classification of Ratios
To comprehend the use of Ratio Analysis for studyingliquidity, solvency and profitability of abusiness firm
To conceptualize the construction of financial statements from given ratios
Chapter Outline:
1.1 Meaning of Ratio
1.2 Meaning of Ratio Analysis
1.3 Uses/Significance/Importance/Utility of Ratio Analysis
1.4 Limitation of Ratio Analysis
1.5 Classification of Ratios
1.6 Liquidity Ratios
1.7 Efficiency/Activity/Turnover Ratios
1.8 Solvency Ratios
1.9 Capital Structure/Leverage Ratios
1.10 Profitability Ratios
1.11 Market Based Ratios/Ratio for prospective Investors
1.12 DuPont Analysis

1.13 Construction of Financial Statements from Ratios
1.14 Ratios at a Glance
1.15 Miscellaneous Illustrations
1.16 Glossary
1.17Review Questions

UNIT-2
RATIO ANALYSIS
1.1 MEANING OF RATIO
A ratio is a simple arithmetical expression of the relationship of onenumber to another. It may bedefined as the indicated quotient of twomathematical expressions. In general words, a ratio is anexpression of relationship of one figure with another. It may be defined as the relationship orproportion that one amount bears to another. It is found by dividing a figure with another. A ratiomay be expressed in percentage.
Accounting ratios express relationships worked out among various accounting data which aremutually interdependent and which influence each other in significant manner. Financial ratiosexpress arithmetical relationship between two figures or two groups of figures of the financialstatements which are related to each other.
Expression of Ratios:
A ratio is an expression of the quantitative relationship between two numbers. In simplelanguage, ratio is one number expressed in terms of another and can be worked out by dividingone number by the other. A ratio can be expressed in the form of a fraction, number of times,percentage or in proportion. Hence, there are three ways of expressing ratios:
(a)Pure Ratio or Simple Ratio: In this form, the item of financial statements is expressed bysimple division of one number by another e.g., if current assets of a company are ₹20,000 andcurrent liabilities are ₹10,000, the ratio of current assets to current liabilities is shown as:
= = ,, = :(b) Rate or So many Times: In this form, it is calculated how many times an item is, incomparison to other item. For example, Cost of goods sold of a company is ₹ 10,000 andAverage Inventory is ₹ 2,000, then stock turnover is:
Cost of goods sold÷ Average Inventory = 5times
(c) Percentage: Percentage is one kind of ratio in which the base is taken as equal to hundred(100) and the quotient is expressed as per hundred of the base. For example, if an institutionearns a gross profit of ₹10,000 and sales is ₹50,000, the ratio of gross profit to sales, in termsof percentageis :
= . ,. , × = %

1.2 MEANING OF RATIO ANALYSIS
Ratio Analysis is a very important tool of financial analysis. It is the process of establishing asignificant relationship between the items of financial statements to provide a meaningfulunderstanding of the performance and financial position of a firm. So,ratio analysis is atechnique of analysis and interpretation of financial statements. It is the process of establishingand interpreting various ratios for helping in making certain decisions. It is not an end in itselfand is only a means of better understanding of financial strengths and weaknesses of a firm. Aratio will be meaningful only when it is analyzed and interpreted.
Steps in Ratio Analysis:
The Ratio Analysis requires four steps as follows:
1. Selection of relevant data from the financial statements depending upon the objective of theanalysis.
2. Computation of appropriate ratios from the above data.
3. Comparison of the calculated ratios with the ratios of the same firm in the past, or the ratiosdeveloped from projected financial statements or the ratios of some other firms or thecomparison with ratios of the industry to which the firm belongs.
4. Interpretation of the ratios.
Approaches to Ratio Analysis:
There are three approaches or ways of comparing ratios:
(a) Cross-Section Analysis:
One way of comparing the ratio or ratios of a firmis to compare them with the ratio or ratios ofsome other selected firm in thesame industry at the same point of time. So, it involves thecomparison of twoor more firm's financial ratios at the same point of time. The Cross-SectionAnalysis helps the analyst to find out as to how a particular firm hasperformed in relationto its competitors. The firm’s performance may becompared with the performance of the leaderin the industry in order touncover the major operational inefficiencies. In this type of an analysis,thecomparison with a standard helps to find out the quantum as well as directionof deviationfrom the standard. It is necessary to look for the large deviationson either side of the standardcould mean a major concern for attention. TheCross-Section Analysis is easy to be undertaken asmost of the data requiredfor this may be available in financial statements of the firm.

(b)Time-Series Analysis
The analysis is called Time-Series Analysis when the performance of a firm isevaluated over aperiod of time. By comparing the present performance of afirm with the performance of the samefirm over last few years, anassessment can be made about the trend in progress of the firm, aboutthedirection of progress of the fir. The information generated by the Time-SeriesAnalysis canalso help the firm to assess whether the firm is approaching longterm goals or not. The Time-Series Analysis can be extended to coverprojected financial statements. In particular, the TimeSeries Analysis looksfor (i) Important trends in financial performance, (ii) Shift in trend overtheyears, and (iii) Significant deviations if any, from other set of data. So in this case,ratio of 5 to10 years is compared at a time to find out the trend.
(c)Combined Analysis:
If both the Cross-Section and Time Series Analyses are combined together to study the behaviorand pattern of ratios, then meaningful and comprehensive evaluation of the performance of thefirm can definitely be made. A trend of ratios of a firm compared with the trends of the ratios ofthe standard firm can give good results. For example, the ratio of Operating Expenses to NetSales for a firm, may be higher than the industry average, however, over the years it has beendeclining for the firm, whereas the industry average has not shown any significant changes.
Interpretation of Ratios:
Ratios are not in themselves an end. They are the means of financial analysis. To make themuseful, they have to be interpreted. Interpretation of ratio needs skill, intelligence andforesightedness. The inherent limitations of ratio analysis should also be kept in mind whileinterpreting ratios. The interpretation of ratios can be made in the following ways:
(a) Interpretation on the Basis of Single Ratio:Broadly, no meaningful conclusion can bedrawn by one single ratio. However, there are few ratios which can be considered in isolation.For example, 2:1 is a well proven convention for current ratio. Hence, continuous fall in the ratiois considered as a sign of weak liquidity position of the concern. Such ratios are very few whererules of thumb may be applied and which alone are capable of some meaningful interpretation.
(b) Interpretation on the Basis of group of Related Ratios: There is large number of ratioswhich are well interpreted when supported by certain other related ratios. For example, currentratios may be supported by liquidity ratios to draw more dependable conclusions. Similarly,ratios of profit of sales can be well interpreted when it is considered with reference to net worthturnover ratio.
(c) Interpretation on the Basis of Historical Trends:In this method, a firm’s performance iscompared with its own past over a period of time and trend is noted on the basis of figures of the

same ratio of past few years. This is a most popular method of appraising the performance of thefirm. When financial ratios are compared over a period of time, it gives an indication of thedirection of change. But while interpreting ratios from comparison over time, the analyst mustpay attention to the changes in the firm’s policies, accounting procedures and also price levelchanges. Sometimes, current performance is evaluated by comparing the ratios with its pastaverage.
(d) Interpretation on the Basis of Inter-Firm Comparison: Ratios of one firm can also becompared with the ratios of other firms in the same industry or with the average of all firms inthe industry. But while making such comparison, the analyst has to be very careful regarding thedifference of accounting methods, policies and procedures adopted by different firms.
(e) Interpretation on the Basis of Projected Ratios (or Future Expectations): Ratios for thefuture can be projected and these may be taken as standard for comparison with ratios calculatedon the basis of actual performance. This method is not used usually in practice.
(f) Interpretation on the Basis of Similar Firms:If we compare the firm with similar firms inother industries, we often gain a better insight into the financial condition. For example, if we areexamining a growth of firm in a non-growth industry, it makes sense to compare it with othergrowth firms in other industries.
(g) Interpretation on the Basis of Common Sense: The analyst may also use his subjectivejudgment and reasons for the purpose. For example, a 20% return on investment may beconsidered reasonable as a norm.
1.3USE/SIGNIFICANCE/IMPORTANCE /UTILITY OF RATIO ANALYSIS:-
Mainly the persons interested in the analysis of the financial statements can be grouped underthree heads (i) Owners or investors (ii) Creditors and (iii) Financial executives. The importanceof analysis varies materially with the purpose for which it is calculated. The primary informationwhich seeks to be obtained from these statements differs considerably reflecting the purpose thatthe statement is to serve.
The significance of these ratios varies for these three groups as their purpose differs widely.These investors are mainly concerned with the earning capacity of the company whereas thecreditors including bankers and financial institutions are interested in knowing the ability ofenterprise to meet its financial obligations timely. The financial executives are concerned withevolving analytical tools that will measure and compare costs, efficiency, liquidity andprofitability with a view to make intelligent decisions. Hence, the use, significance, importanceof ratio analysis can be highlighted as below:
1.Helpful to Management: The ratio analysis proves to be of significant value to themanagement in the process of the discharge of its elementary functions such as planning, co-

ordination, communication and control. In short, it paves the way for effective control of theenterprise in the matter of achieving physical and monetary targets.
2. Helpful in Trend Analysis: The ratio analysis facilitates a firm to consider the timedimension into account, i.e. whether the financial position of a firm is showing any improvementor deterioration over years. This is affected through the use of trend analysis. With the help ofthe financial analysis one can ascertain whether the trend is favourable or unfavourable.
3. Use in Comparative Study:Ratioanalysis also helps in comparative study. It helps to make aninter-firm comparison either between different departments of a firm or between two firmsemployed in the identical types of business or between the same firms on two different dates.
4.Helpful for Communication:With the help of ratio analysis, it is possible to know the changesthat had taken place in the business between two periods. In this way the weakness of businessconcern can easily be found out. In brief, ratios are helpful in communication of information.
5.Helpful in Determining the Standards: Keeping in mind the old ratios and present operatingefficiency, the standard can be fixed. In this way ratio analysis is considered to be essential partof budgetary control and standard costing.
6.Helpful in Effective Control: On the basis of ratios, by establishing standards the effectivecontrol can be exercised upon the activities of the firm. On the comparison of standard ratioswith actual ratios, adverse financial position can be found out and accordingly correctivemeasures can be taken.
7.Helpful in the Evaluation of Efficiency: With the help of ratio analysis, comparison ofcurrent year figures can be made with those of previous years. Similarly, comparison ofprofitability, effectiveness and financial soundness can be made between business concerns. Inthis way, the use of ratio analysis can be made for measuring the effectiveness of businessconcern.
8. Helpful in Evaluation of Financial Soundness: With the help of liquidity, solvency,profitability and capital gearing ratios, detailed information can be gathered which are related tofinancial soundness of any organization.
9.Helpful for Interested Parties in the Firm: Through ratio analysis the internal and externalparties interested in the firm also get benefited. The workers of the firm may use the informationpresented in the financial statements as basis for requesting increase in wages and salaries. Bystudying profitability ratios, investors can take decision for investment or not.
1.4 LIMITATION OF RATIO ANALYSIS
The ratio analysis is one of the most powerful tools of financial management. Though, ratios aresimple to calculate and easy to understand, they suffer from some serious limitationswhich aresummarized as below:
1. Limited use of Single Ratio: A single ratio in itself is meaningless; it does not furnish acomplete picture. In other words, one single ratio, used without reference to other ratios, mayproduce misleading results. Hence, a number of related ratios are to be calculated for properanalysis and interpretation of financial statements. For example, to test the liquidity wemake useof all the liquidity ratios.
2. IgnoresQualitative Factors: The ratio facilitates quantitative analysis only. The qualitativefactors which are so important for the successful functioning of the organization are completelyignored and hence, whatever conclusions drawn may be distorted.
3.Only a part of the information needed in the process of Decision Making: It should also beremembered that ratio analysis helps in providing only a part of the information needed in theprocess of decision making. Any information drawn from the ratios must be used with thatobtained from other sources so as to ensure a balanced approach in solving the ticklish issues.
4.Possibility of Window Dressing: Ratio depends on figures of the financial statements. But inmost cases, the figures are window dressed. As a result, the correct picture cannot be drawn upby the ratio analysis.
5.Different meaning to Accounting Terms: Comparisons are also made difficult due todifference in definitions of various terms used in computing ratios. For example, terms likeshareholders’ funds, capital employed, working capital etc. are used in different sense bydifferent people. Hence, unless the meanings of relevant terms are properly defined, the use ofratios may lead to wrong comparisons and conclusions.
6. Variation in Accounting Policies: Comparison between two variables proves worth providedtheir basis of evaluation is identical. But in reality, it is not possible, such as methods ofvaluation of stock in trade or charging different methods of depreciation on fixed assets etc. Thatis different methods are followed by different firms for their valuation, in that case, comparisonwill practically be of no use.
7. Difficulty in evolving Standard Ratios:It is very difficult to ascertain the normal or standardratio in order to make a proper comparison.
8. Historical Analysis: Ratios are developed in the past as they are obtained from the financialstatements which are considered to be historical documents. A financial analyst is moreconcerned with the probable happenings in the future rather than those in the past. These ratioscannot be completely relied upon as reflecting current conditions.

9. Effect of Price Level Changes is not taken into account:A change in price level canseriously affect the validity of comparisons of ratios computed for different time periods.
10. Personal Bias: Ratios are only means of financial analysis and not an end itself. They can beaffected with the personal ability and bias of the analyst. Generally, different analyst mayinterpret the same ratio in different ways.
1.5 CLASSIFICATION OF RATIOS
Financial ratios are classified in to various groups. Their actual classification depends upon theobjects of analysis, nature of party interested in analysis and the source and quantity of dataavailable. The following four forms of ratio classification are more common in actual use.
Statement wiseClassification
Classification byUsers
Classificationaccording toImportance
FunctionalClassification
1.Balance sheetRatios2.Profit and Lossaccount Ratio3.Composite or MixedRatios
1.Ratio forManagement2.Ratio forShareholders3.Ratio for Creditors
1.Primary Ratio2.Secondary Ratio
1.Liquidity Ratio2.EfficiencyRatios/Activity Ratios3.Solvency Ratios4.Leverage/CapitalStructure Ratios5.Profitability Ratios(Based on Sales &Based on Capital)6.Market BasedRatios/Ratios forProspective Investors
1.Statement-wise Classification:
It is most traditional classification of financial ratios. This classification is based on accountingstatement providing information necessary for the calculation of various ratios. There are threetypes of ratios on the basis of financial statements:-
(a)Balance sheet Ratios:When both figures for ratio computation are extracted from the balancesheet of the business, the ratio is called balance sheet ratio. Such ratios are often called asfinancial ratios also. e.g.,Current ratio, Liquidity ratio, Proprietary ratio, Fixed asset ratio, Capitalgearing ratio, Book value per share.
(b)Profit and Loss Account Ratio:When both figures for ratio computation are extracted fromthe profit and loss account, the ratioiscalledprofit and loss account ratio.e.g. Operating ratio,Expenses ratio, Net profit ratio, Gross profit ratio, Stock turnover ratio.
(c) Composite or Mixed Ratios:In such ratio, one items or a group of items is taken frombalance sheet and the other from profit and loss account.e.g, Return on capital employed, Returnon share holder’s fund, Current assets turnover ratio, Ratio of net sales to fixed assets.

2.Classification by Users:
(a) Ratio for Management: These ratios are used by managers for measuring the effectivenessof management of the businesse.g,Operating Ratio, Return on capital employed, Stock turnoverRatio, Debtors turnover Ratio, Solvency Ratio.
(b) Ratio forCreditors:These ratios are used by creditors for assessing the creditworthiness ofthe businesse.g,Current Ratio, Solvency Ratio, Creditors turnover Ratio, Fixed asset Ratio, Assetcover Ratio, Debt service Ratio.
(c) Ratio forShareholders: These ratios are used by the shareholders for assessing the return orsolvency of the businesse.g,Return on shareholders’ fund, Capital gearing Ratio, DividendcoverRatio, Yield rate, Proprietary Ratio.
3.Classification According to Importance:
This classification is being adopted by the British Institute of Management for inter-firmcomparisons. In this classification, all the ratios are classified into two groups:
(a) Primary Ratio: This is one which is of prime importance to a concern e.g, return on capitalemployed, asset turnover etc.
(b) Secondary Ratio:The ratios which support or explain the primary ratio is called secondaryratio.
4.Functional Classification:
1 2 3 4 5 6
LiquidityRatios
EfficiencyRatios
SolvencyRatios LeverageRatios
ProfitabilityRatio
MarketBasedRatios
1.CurrentRatio,2.LiquidityRatio,3.AbsoluteliquidRatio
1.Stock/Inventoryturnover Ratio
2. Debtors/
Receivablesturnover Ratio
3.Creditors/Payables turnoverRatio
4. CurrentAssetsTurnover Ratio
5. Working
1. Debt-EquityRatio /Debt-Networth Ratio
2. ProprietaryRatio/EquityRatio
3. SolvencyRatio
4. Fixed Assetsto Net worthRatio
5. Funded Debtto CapitalizationRatio
1. Capitalgearing Ratioor Gear Ratio
2.Debt –TotalFund Ratio
3. Ratio oftotalinvestments toLong-termliabilities
4. Ratio offixed asset tofunded debt
5. Ratio ofreserve to
a)GeneralProfitabilityRatios(Profitin relation toSales)
1.Gross ProfitRatio
2.OperatingRatio
3.OperatingProfit Ratio
4.ExpensesRatio
5.Net Profit
1. Earningsper Share(EPS)
2. DividendPayoutRatio (D/PRatio)
3. DividendYield Ratio
4. PriceEarningsRatio (P/ERatio)
5. Price toBook
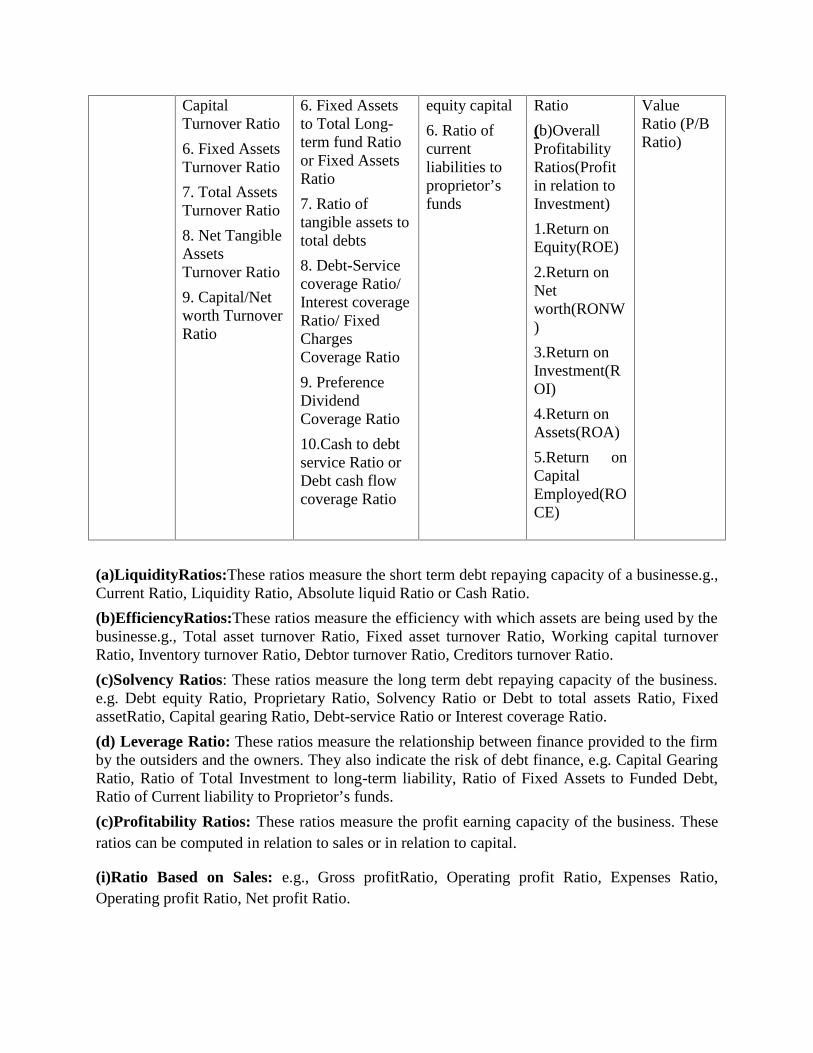
CapitalTurnover Ratio
6. Fixed AssetsTurnover Ratio
7. Total AssetsTurnover Ratio
8. Net TangibleAssetsTurnover Ratio
9. Capital/Networth TurnoverRatio
6. Fixed Assetsto Total Long-term fund Ratioor Fixed AssetsRatio
7. Ratio oftangible assets tototal debts
8. Debt-Servicecoverage Ratio/Interest coverageRatio/ FixedChargesCoverage Ratio
9. PreferenceDividendCoverage Ratio
10.Cash to debtservice Ratio orDebt cash flowcoverage Ratio
equity capital
6. Ratio ofcurrentliabilities toproprietor’sfunds
Ratio
(b)OverallProfitabilityRatios(Profitin relation toInvestment)
1.Return onEquity(ROE)
2.Return onNetworth(RONW)
3.Return onInvestment(ROI)
4.Return onAssets(ROA)
5.Return onCapitalEmployed(ROCE)
ValueRatio (P/BRatio)
(a)LiquidityRatios:These ratios measure the short term debt repaying capacity of a businesse.g.,Current Ratio, Liquidity Ratio, Absolute liquid Ratio or Cash Ratio.
(b)EfficiencyRatios:These ratios measure the efficiency with which assets are being used by thebusinesse.g., Total asset turnover Ratio, Fixed asset turnover Ratio, Working capital turnoverRatio, Inventory turnover Ratio, Debtor turnover Ratio, Creditors turnover Ratio.
(c)Solvency Ratios: These ratios measure the long term debt repaying capacity of the business.e.g. Debt equity Ratio, Proprietary Ratio, Solvency Ratio or Debt to total assets Ratio, FixedassetRatio, Capital gearing Ratio, Debt-service Ratio or Interest coverage Ratio.
(d) Leverage Ratio: These ratios measure the relationship between finance provided to the firmby the outsiders and the owners. They also indicate the risk of debt finance, e.g. Capital GearingRatio, Ratio of Total Investment to long-term liability, Ratio of Fixed Assets to Funded Debt,Ratio of Current liability to Proprietor’s funds.(c)Profitability Ratios: These ratios measure the profit earning capacity of the business. Theseratios can be computed in relation to sales or in relation to capital.
(i)Ratio Based on Sales: e.g., Gross profitRatio, Operating profit Ratio, Expenses Ratio,Operating profit Ratio, Net profit Ratio.

(ii)Ratio Based on Capital:e.g.,Return on shareholders’ fund, Return on capital employed,Return on equity capital.
(f)Market Based Ratios:These ratios are used by prospective investor before investing in astock,.e.g. Earnings per share, Book value per share, Capitalization Ratio, Dividend Yield Ratio,Dividend Payout Ratio, Dividend cover Ratio.
1.6 LIQUIDITY RATIOS
The short term creditors of a company, like suppliers of goods on credit andcommercial banksproviding short-term loans, are primarily interested in knowingthe company’s ability to meet itscurrent or short term obligations as and whenthese become due. The short term obligations of afirm can be met only whenthere are sufficient liquid assets. Therefore, a firm must ensure that itdoes notsuffer from lack of liquidity or the capacity to pay its current obligations. Even averyhigh degree of liquidity is not good for the firm because such a situationrepresents unnecessarilyexcessive funds of the firm being tied up in currentassets.
The importance of adequate liquidity is the sense of the ability of a firm to meet its current/short-term obligation when they become due for payment. It reflects the short-term financialstrength of the firm. Liquidity is basic to continuous operations of the firm. In fact, it is pre-requisite for the very survival of a firm.
The object of liquidity analysis is to examine the firm’s ability to meet its current obligation outof short-term resources. However, a very high degree of liquidity is not desirable because itimplies that funds are idle as they earn very little. It is not good from profitability point of view.Hence, a proper balance between the two contradictory requirements i.e. liquidity andprofitability is required for efficient financial management. It becomes, therefore, necessary todetermine the degree of liquidity of the firm.
The ratios which indicate the liquidity of a firm are known as Liquidity Ratio. The following areratios calculated to measure the liquidity of a firm:
1. Current Ratio
2. Quick Ratio
3. Absolute Liquid Ratio
1. CurrentRatio:
Current Ratio is the most common and widely used ratio for measuring liquidity. Being related toworking capital analysis, it is also called the Working Capital Ratio. This ratio indicates therelationship between total current assets and total current liabilities of a firm. This is calculatedby dividing current assets by current liabilities.
= Current assets(Will be converted in to cash Current liabilities (Payable within one year)

within one year)
Ex: Cash in hand, Cash at bank, Debtors,Prepaid expenses, Short term deposits, Shortterm investments, Bills receivable, Money atcall and short notice, Stock of finished goods,Stock of work in progress, Stock of rawmaterials
Ex: Bills payable, Income tax payable,Creditors, Outstanding expenses, Bankoverdraft, Provision for taxation, Interest dueon fixed liabilities, Reserve for unbilledexpenses, Installment payable on long-termloans.
Illustration 1:On December 31, 2010 Company B had total asset of ₹150,000,equity of₹75,000, non-current assets of ₹50,000 and non-current liabilities of₹ 50,000. Calculate theCurrent Ratio.
Solution
To calculate current ratio, we need to calculate current assets and currentliabilities first:
Current Assets = Total Asset − Non-Current Assets =₹150,000 −₹50,000 = ₹100,000
Total Liabilities = Total Assets − Total Equity = ₹150,000 − ₹75,000 =₹75,000
Current Liabilities = ₹75,000 − ₹50,000 =₹25,000
Current Ratio = ₹100,000 ÷ ₹25,000 = 4
Interpretation:
1. CurrentRatio is a good measure of liquidity. It indicates the rupees of current assets availablefor each rupee of current liability.
2. Higher the current ratio, the larger the amount of rupees available per rupee of currentliability, the more the firm’s ability to meet current obligation and greater the safety of funds ofshort-term creditors.
3. But too high current ratio may be good from creditors point of view, but it can never be goodfrom view of the owners. Too high current ratio shows weak investment policy, excessive stocketc. Such a situation cannot be good for the profitability of the business.
4. On the other hand, low current ratio shows shortage of working capital in the business and itmay endanger the survival of the firm. Hence, the current ratio in business should be appropriate.5.A ratio of 2:1 (two times current assets to current liabilities) is considered satisfactory as arule of thumb.
6. In inter-firm comparison, the firm with the higher current ratio has better liquidity or shortterm solvency.
7. It is important to note that the norm of 2:1 should not be followed blindly. We should payattention to the quality and nature of current assets. If major portion of current assets consists ofdebtors, prepaid expenses and slow moving obsolete stock, then even twice the current assetsmay prove insufficient to pay the short-term liabilities when due for payment.
8.On the other hand, if the firm is capable of making immediate arrangement of cash easily incase of emergency, then a lower than 2:1 ratio may be treated satisfactory.
9. Hence, it would be necessary to consider the following factors while deciding the standard ofcurrent ratio:

Nature of business: If the business is of speculative nature, then a higher current ratio isnecessary. Similarly, if the business is of seasonal nature, then it would be appropriate tochange current ratio according to fluctuation is output and sales.
Plans to introduce by the firm in the near future and amount required for them. Credit period allowed and received. Nature of stock, if the major portion of inventory is of raw materials or it consists of slow
moving and obsolete stock, then a higher current ratio would be essential. On the otherhand, if inventory consists of fast moving finished goods, then possibility of theirconversion into cash would be higher and so even a lower current ratio may be good.
In case of heavy fixed charges of long-term loans, a higher current ratio would beappropriate and essential.
Limitations:
1. It is a crude measure of financial liquidity as it does not take into account the liquidity of theindividual component of current assets. Cash and bills receivable are more liquid in comparisonto inventories, prepaid expenses and sundry debtors. But in computing this ratio they all aretreated at par.
2. The greatest weakness of current ratio is the possibility of window dressing and manipulation.The current ratio can be improved by making payment of current liability at the year-end or byover valuing current assets and under valuing current liabilities.
3. The current ratio is largely affected by seasonal fluctuations.
4. Conclusions drawn on the basis of current ratio only may be misleading because in spite ofhigh current ratio, the firm may unable to pay its current liabilities,if major portion of currentasset consists of raw materials slow moving or obsolete finished goods or unrecoverable debtors.Hence, it is not proper to rely upon this ratio only for analyzing liquidity of the firm.
2. Quick or Acid Test Ratio or LiquidRatio:
Quick Ratio, also known as Acid Test Ratio or Liquid Ratio, is a morerigorous test of liquiditythan the current ratio. The term liquidity refers to theability of a firm to pay its short termobligations as and when they become due. Quick Ratio may be defined as the relationshipbetween quick/liquid assets andcurrent or liquid liabilities. An asset is said to be liquid if it canbe converted intocash within a short period without loss of value. In that sense cash in handandcash at bank are the most liquid assets. The other liquid assets include billsreceivable, sundrydebtors, marketable securities and short term or temporaryinvestments. Prepaid expenses andInventories cannot be termed as liquid assetbecause they cannot be converted into cash withoutloss of value. A ratio of 1:1 is considered as satisfactory Quick Ratio.
The ratio is used as a compliment of current ratio. This ratio is calculated for assessing thecapacity of the firm to make immediate payment of its liabilities. This ratio discloses therelationship between liquid assets and current liabilities. = Quick Assets/Liquid assets= Current assets-Stock-Prepaid expenses

Illustration 2
Calculate Quick Ratio from the information:
Stock₹60,000 ; Cash₹40,000; Debtors₹40,000; Creditors ₹50,000,Bills Receivable ₹20,000;Bills Payable ₹30,000; Advance Tax₹4,000,Bank Overdraft₹4,000; Debentures ₹2,00,000;Accrued interest ₹4,000.
Solution
Quick Assets = Current Assets – Stock – Advance Tax
Quick Assets = ₹1,68,000 – (₹60,000 + ₹4,000) = ₹1,04,000
Current Liabilities = ₹84,000
Quick Ratio = Quick Assets / Current Liabilities
= ₹1,04,000/₹84,000= 1.23:1
Illustration 3
X Ltd. has a current ratio of 3.5:1 and quick ratio of 2:1. If excess of current assets over quickassets represented by stock is ₹1, 50,000, calculate current assets and current liabilities.
Solution
Let Current Liabilities = X
Current Assets = 3.5X
And Quick Assets = 2X
Stock = Current Assets – Quick Assets
1,50,000 = 3.5X – 2X
1,50,000 = 1.5X
X = ₹1,00,000
Current Assets = 3.5X = 3.5 × 1,00,000 = ₹3,50,000.
Illustration 4
Calculate the current ratio and quick ratio from the following information:
Working capital ₹9,60,000; Total debts ₹20,80,000; Long-term Liabilities₹16,00,000; Stock ₹4,00,000; Prepaid expenses ₹80,000.

Solution
Current Liabilities = Total debt- Long term debt
= 20,80,000 – 16,00,000= 4,80,000
Working capital = Current Assets – Current liability
9,60,000 = Current Assets – 4,80,000
Current Assets = 14,40,000
Quick Assets = Current Assets – (stock + prepaid expenses)
= 14,40,000 – (4,00,000 + 80,000)= 9,60,000
Current Ratio = Current Assets / Current liabilities
= 14,40,000/4,80,000= 3:1
Quick Ratio = Quick Assets / Current liabilities
= 9,60,000/4,80,000= 2:1
3. AbsoluteLiquidity Ratio:
It is more rigorous test of liquidity of a firm. It is calculated by dividing cash and marketablesecurities (termed as super-quick current assets) by quick or liquid liabilities. It is calculated asfollows: = Absolute liquid assets= Cash in hand, cash at bank and short term highly liquid marketablesecurities.The acceptable norm for thisratio is 50% or 0.5:1.
Illustration 5
Calculate Absolute Liquid Ratio from the following information
Goodwill ₹50,000 ,Cash at Bank ₹30,000,Plant and machinery₹4,00,000 Inventories₹75,000,Trade investments ₹2,00,000, Bank overdraft ₹70,000,Marketable securities₹1,50,000, Sundry creditors ₹60,000,Bills receivable ₹40,000, Bills payable ₹90,000,Cash inhand ₹45,000, Outstanding expenses ₹30,000.
Solution
Absolute Liquid Ratio = Absolute Liquid Assets/Current Liabilities
Absolute Liquid assets = Mark. Securities+ Cash in hand and at Bank
= ₹1,50,000+₹45,000+₹30,000 = ₹2,25,000

Current Liabilities = Bank overdraft + Creditors + Bills Payable+ Outstanding Expenses
= ₹70,000+₹60,000+₹90,000+₹30,000 = ₹2,50,000
Absolute Liquid Ratio = Absolute Liquid Assets/Current Liabilities
= ₹2,25,000/₹2,50,000= 0.9
Illustration6
From the following information regarding current assets and current liabilities of Sun Ltd,Comment upon the liquidity of the concern:
Current Liabilities Amount (₹) Current Assets Amount (₹)CreditorsBills PayableOutstanding expensesProvision for taxBank overdraft
27,00012,000
5,00018,00010,000
CashDebtorsBills receivableStockInvestment in Government securitiesPrepaid expensesInterest receivable
42,00020,00015,00035,00024,00010,000
1,000Total 72,000 Total 1,47,000
Solution:
Current Ratio =Current Assets
=1,47,000
= 2.04:1Current Liabilities 72,000
Quick Ratio =Quick Assets
=1,02,000
= 1.4:1Current Liabilities 72,000
Absolute Liquid Ratio =Absolute Liquid Assets
=66,000
= 0.92:1Current Liabilities 72,000
Working Note:
Quick Assets=Current Assets-Stock-Prepaid Expenses=1,47,000-35,000-10,000=1,02,000
Absolute Liquid Assets=Cash+Government Securities=42,000+24,000=66,000
Comment: All the three ratios show good liquidity position as all the three ratios are more thanrule of thumb. The rule of thumb for current ratio is 2:1, quick ratio is 1:1and absolute liquidratio is 0.5:1.

1.7 EFFICIENCY/ACTIVITY/TURNOVER RATIOSActivity Ratios, sometimes referred to as Operating Ratios or Management Ratios, measure theefficiency with which a business uses its assets, such asinventories, accounts receivable andfixed (or capital) assets. The morecommonly used operating ratios are the average collectionperiod, the inventoryturnover, the fixed assets turnover, and the total assets turnover. Theseratios indicate the efficiency of management in the use of resources,both short term and longterm. The overall performance of a company isevaluated on the basis of its ability to make salesusing minimum resources.Turnover Ratios reflect the speed at which assets are utilized ineffecting sales. Ahigher turnover ratio means efficient use of funds by management ingeneratingmore sales. The important turnover ratios are:
1. Stock/Inventory turnover Ratio2. Debtors/Receivables turnover Ratio3. Creditors/Payables turnover Ratio4. Current Assets Turnover Ratio5. Working Capital Turnover Ratio6. Fixed Assets Turnover Ratio7. Total Assets Turnover Ratio8. Net Tangible Assets Turnover Ratio9. Capital/Net worth Turnover Ratio
1. Stock Turnover Ratio/Inventory Turnover Ratio/Stock VelocityThis ratio is calculated to consider the justification of amount of capital employed in stock.Under it, rate of conversion of stock into sales (i.e. stock velocity) is known by establishingrelationship between cost of goods sold and inventory. This ratio indicates the amount of salesper rupee of investment in inventory. This is calculated by dividing cost of goods sold of a periodby the average stock of that period. = ( )Note:1. Cost of goods sold = Opening stock +Net Purchases + Direct expenses – Closingstock
OrCost of goods sold = Net sales – Gross Profit2. Average inventory = (Opening inventory +Closing inventory)/23.Inventory here will mean inventory of finished goods only.Because it only is capable of beingsold.4.This ratio may be calculated on the basis of Net sales but in such situation average inventorywill be taken at sale price. In departmental stores, where inventory is usually valued at sale price,this ratio is calculated on this basis (i.e. Net sales/ Average inventory at selling price).

5. If average stock cannot be known then this ratio may be calculated with the figure of closinginventory (i.e. Net sales/ Closing stock).6. In case of manufacturing concern inventory turnover ratio may be known separately for rawmaterial and finished goods both applying the following formulae: =
= 7. Anotherapproach of this ratio is computation of stock velocity.Stock velocity can be measuredin months also by applying following formula.
= × This ratio indicates the period during which supply of goods may be maintained out of currentstock without its replenishment.
8. Some people calculate average age of inventory also together with inventory turnover.
Average age of Inventory: This represents the number of working days, on an average, an itemremains in the firm’s inventory. It is also called inventory conversion period. It is calculated asfollows:
= ( )Note: The number of working days in a year differs from organisation to organization.It may betaken as 365/360/300. The shorter the average age of firm’s inventory, the more liquid or activeit may be considered.
Interpretation:
1.Inventory Turnover Ratio (ITR) is an indicator of velocity of flow of inventory in business.This shows the rate of conversion of stock into sales. In fact, inventory policy of managementand liquidity of firm both may be tested by this ratio. This is also a measure of marketingcapacity of the firm.
2. No standard rate or norm can be determined for this ratio.Because it based more on nature ofindustry and sales policy of the firm. Hence, this ratio should be compared with the firm’s ownpast ratios and ratios of other similar firms or with industry average.

3. Comparatively higher inventory turnover ratio is an indicator of expansion of business(efficiency in sales increases) and efficient management of inventory because it shows highersales with lesser investments in inventory. Such firms may earn high profits even at low marginof profit. On the contrary, a fall in this ratio is an indicator of dull business and over-investmentin inventories.
4. A too high inventory turnover ratio may not necessarily always imply a favourable situation. Itmay be the result of very low level of inventory which results in shortage of goods or a positionof stock-out whenever demand increases. It may also be the result of firm’s policy to buyfrequently in small lots at some higher prices.
5. Similarly, low inventory turnover may not necessarily always imply an unfavourable situation.It may be result of management policy of keeping high inventory when price rise is anticipatedor stock shortage in near future is anticipated, or when some sizeable order is anticipated, forwhich immediate supply is required. Hence, for drawing correct conclusion, causes of changes inthis ratio should be examined precisely.
Illustration 7
Calculate Stock turnover Ratio from the following information of Sanjit Limited:
Opening Stock ₹20,000,Purchases ₹1,09,000, Direct Expenses ₹1,000,Closing Stock₹40,000,Administration Expenses ₹5,275,Selling & Distribution Expenses ₹10,000,Sales₹2,50,000.
Solution:
Cost of goods sold=Opening stock +Net Purchases + Direct expenses – Closing stock =₹20,000+₹1.09,000+₹1,000-₹40,000=₹90,000
Average Stock= (Opening inventory +Closing inventory)/2 =₹(20,000+40,000)/2 =₹30,000
Stock Turn Over Ratio = (Cost of Goods Sold/Average Inventory) =₹90,000/₹30,000=3 times
Illustration 8
Calculate Stock Turnover Ratio from the following information related to Swapna Limited:
Opening Stock₹46,400,Purchases₹3,87,200,Sales₹5,12,000,Gross Profit:25% on Sales.
Solution:
Cost of goods sold=Sales-Gross Profit=₹5,12,000-(25%on ₹5,12,000)=₹5,12,000-₹1,28,000=₹3,84,000
Cost of goods sold=Opening stock +Net Purchases + Direct expenses – Closing stock

Or ₹3,84,000=₹46,400+₹3,87,200+0-Closing Stock
Or Closing Stock=₹46,400+₹387,200-₹3,84,000=₹49,600
Average Stock= (Opening inventory +Closing inventory)/2 =₹(46400+49600)/2=₹48,000
Stock Turn Over Ratio = (Cost of Goods Sold/Average Inventory) =₹3,84,000/₹48,000=8Times
Illustration 9Compute the merchandise turnover of Paswan Ltd for each of the following three years shownbelow and give your interpretation of the result.Particulars 2018 (In₹) 2017 (In₹) 2016 (In₹)Cost of goods soldAverage inventory
5,16,3782,36,420
4,53,7403,01,231
6,41,4255,39,850
Solution:
Stock Turnover Ratio (STR) =Cost of goods soldAverage inventory
Interpretation: As it is clear from the above calculations,stock turnover has shown anincreasing trend during the years under review. It implies that the sales level per rupee investedin stock has been increasing continuously. An analysis of absolute amounts of stock shows thatthe company is following the policy of reducing investments in stock each year. All this is anindication of company’s efficient inventory control policy and sales capability.
2. Debtors Turnover Ratio or Receivable Turnover Ratio (DTR)
A concern may sell goods on cash as well as on credit. Credit is one of theimportant elements ofsales promotion. The volume of sales can be increased byfollowing a liberal credit policy. Theeffect of a liberal credit policy may result in tying up substantial fundsof a firm in the form oftrade debtors (or receivables). Trade debtors are expectedto be converted into cash within a shortperiod of time and are included incurrent assets. Hence, the liquidity position of concern to payits short termobligations in time depends upon the quality of its trade debtors.
2018 =₹5,16,378
= 2.19 times₹2,36,420
2017 =₹4,53,740
= 1.51 times₹3,01,231
2016 =₹6,48,425
= 1.20 times₹5,39,850

Debtors Turnover Ratio or Accounts Receivable Turnover Ratio indicates thevelocity of debtcollection of a firm. In simple words, it indicates the number oftimes average debtors(receivable) are turned over during a year.This ratio is a qualitative analysis of a firm’smarketing and credit policy and debtors realizations. It is calculated to know the uncollectedportion of credit sales in the form of debtors by establishing relationship between trade debtorsand net credit sales of the business. The following formula is applied for this purpose. = Note:
1. Trade Debtors means Debtors plus Bills Receivables.
2. Average Trade Debtors =(Opening Trade Debtors + Closing Trade Debtors)/2
3.It should be noted thatprovision for bad and doubtful debts should not be deducted since thismay givean impression that some amount of receivables has been collected.
4. Net credit sales consist of gross credit sales minus sales returns.
5. Debtors and bills receivable arising from irregular or non-trading activities (such as billsreceivables received on sale of a fixed assets) are not included in this calculation.
6. If cash sales are negligible, then calculation may be made from net total sales figure in placeof net credit sales.
7.When theinformation about opening and closing balances of trade debtors and credit salesis notavailable, then the debtors turnover ratio can be calculated by dividing thetotal sales by the
balance of debtors (inclusive of bills receivables) given. Andformula can be written as follows:
Debtors Turnover Ratio = Total Sales / Debtors
Interpretation:
1.Accounts receivable turnover ratio or Debtors’ turnover Ratio indicates thenumber of times thedebtors are turned over a year.
2. The higher the value ofdebtors’ turnover the more efficient is the management of debtors ormore liquidthe debtors are. Aincrease in this ratio each year is an indicator of efficiency ofmarketing and credit policy of the firm.
3. Similarly, low debtors turnover ratio implies inefficientmanagement of debtors or less liquiddebtors.
4. It is the reliable measure of thetime of cash flow from credit sales.
5. There is no rule of thumb which may be usedas a norm to interpret the ratio as it may bedifferent from firm to firm.Hence, this ratio should be compared with the firm’s own past ratiosand ratios of other similar firms or with industry average.

Average Collection Period:
In analyzing the debtors, usually average collection period is also calculated with debtors’turnover ratio. The period indicates the period taken in the realization or collection of debtors. Inother words, it represents the average number of days for which a firm has to wait before itsreceivables are converted into cash. The purpose of calculating this period is to find out the ratioof cash flow from collection of debtors. There are three formula for computation of averagecollection period: =
= × = ( )Notes:
1. Credit Sales Per Day = (Net Credit Sales/Number of working Days in a year)
2. Number of working days in a year differs from organization to organization. It may be takenas 365/360/300.
Interpretation:
1.This ratio measures the quality of debtors. A short collection period impliesprompt payment bydebtors. It reduces the chances of bad debts. Similarly, alonger collection period implies tooliberal and inefficient credit collectionperformance. It is difficult to provide a standard collectionperiod of debtors.
2. The average collection period is compared with actual trade terms (i.e. credit period allowed insales terms) to examine the managerial efficiency in debt collection. In this respect, the generalrule is that average collection period should not exceed the stated credit period on trade termsplus 1/3rd of such period. If average collection period exceeds 4/3 of stated credit period, it willindicate either liberal credit policy or slackness of management in realizing debts. A higheraverage collection period also implies that chances of bad debts are more.
3. The average collection period is affected by change in sales terms, change in policy in respectof including or excluding cash and installment sales in the sales, special sales campaign at theclose of the accounting year, direct sales to consumers, price changes, effectiveness of creditcollection and sales department, strikes and luck-outs and nature of trade cycle.
Illustration 10From the following information of Ezra Limited calculate Debtors Turnover Ratio(DTR)and Average Collection Period(ACP)

Particulars Amount(₹)Total Sales for the Year 2,62,000Cash Sales 20%of Total SalesSales Return out of credit sales 15,000Opening Balance of Sundry Debtors 10,000Opening Balance of Bills Receivable 2,000Closing Balance of Sundry Debtors 15,000Closing Balance of Bills Receivable 3,000
Solution:Net Credit Sales = Total Sales-Cash Sales-Sales Return out of Credit Sales = ₹2,62,000-(20%of₹2,62,000)-₹15,000 =₹(2,62,000-52,500-15,000) = ₹1,95,000Opening Trade Debtors =Opening Debtors+ Opening Bills Receivable =₹10,000+₹2,000=₹12,000Closing Trade Debtors =Closing Debtors+ Closing Bills Receivable =₹15,000+₹3,000=₹18,000Average Trade Debtors =(Opening Trade Debtors + Closing Trade Debtors)/2=₹(12,000+18,000)/2=₹30,000/2 =₹15,000Debtor Turnover Ratio = Net Credit Sales/Average Trade Debtors = ₹1,95,000/₹15,000 =13Tmes.Average Collection Period=(Number of working Days in a Year/Debtor Turnover Ratio)=365Days/13=28.07 days or 28 Days(Approximately)
Illustration 11A manufacture sells to retailer on terms 2.5% discount in 30 days, 60 days net. The debtors andreceivable at the end of March on past three years and net sales for all these three years as under:Particulars 2018 (In₹) 2017 (In₹) 2016 (In₹)DebtorBills receivableNet sales
85,5829,242
4,43,126
33,9323,686
3,37,392
54,8454,212
2,68,466Determine the average collection period for each of these three years and comment.Solution:
Average collection period or average age of receivables =Trade receivables
× 365Net credit sales
2016 =₹59,054
× 365 = 80 days₹2,68,466
2017 =₹37,618
× 365 = 41 days₹3,37,392

2018 =₹94,824
× 365 = 78 days₹4,43,126
Comments:As stated, credit period is 60 days.Hence collection period should not exceed60+1/3rd of 60= 80 days. It is a matter of satisfaction that all the three years, firm’s averagecollection period has never crossed this limit. It may be taken as an indication of alertness ofsales manager towards credit collection.Illustration 12Jagannath Ltd sells goods on cash as well as on credit. The following particulars are taken fromtheir books of accounts for the year ending 31st March 2019:Particulars Amount (₹)Total salesCash salesSales returnTotal debtors (31/3/2019)Bills receivable (31/3/2019)Provision for bad debts (31/3/2019)
10,00,0002,00,000
70,00090,00020,00010,000
Calculate the average collection period.
Solution:
Average collectionperiod
=Trade
receivables × 365 = 1,10,000 × 365 = 55 daysNet credit sales 7,30,000
Whereas trade receivables= ₹.90,000 +₹. 20,000= ₹. 1,10,000
Net credit sales= ₹.10,00,000 – ₹.2,00,000 – ₹.70 000= ₹ 7,30 000
3. Creditors Turnover Ratio(CTR)/Payables Turnover Ratio:
LikeDebtorsturnoverRatio, Creditor’s turnover Ratio may also be calculated. The short-termcreditors (i.e. suppliers of goods) are very much interested in this ratio, as it shows the firm’strend of payment to its short-term creditors. This ratio shows the relationship of net creditpurchases and averagetrade creditors.
= Note:
1. Trade Creditors means Creditors plus Bills Payables.
2. Average Trade Creditors = (Opening Trade Creditors + Closing Trade Creditors)/2

3. Net credit Purchaseconsist of gross credit purchases minus purchase returns.
4. Creditors and Bills Payable arising from irregular or non-trading activities (such as billspayable on purchase of a fixed assets) are not included in this calculation.
5. If cash purchases are negligible, then calculation may be made from net total purchases figurein place of net credit purchases.
6. When the information about opening and closing balances of trade creditors and creditpurchases is not available, then the creditors turnover ratio can be calculated by dividing thetotal purchases by the balance of creditors (inclusive of bills Payables) given. And formula canbe written as follows: Creditors Turnover Ratio = Total Purchases / Creditors
Interpretation:
This ratio indicates the velocity with which the creditors are turned over in relation to purchases.Higher the creditors velocity, better it is. A fall in the ratio shows delay in payment to creditors.
Average Payment Period
While analyzing creditors, usually average payment period is also calculated. This perioddiscloses the time taken by the firm in making payment to its trade creditors.Average paymentperiod ratio gives the average credit period enjoyed from the creditors. It can be calculated usingany one the following three formulae:
= = ×
= ( )
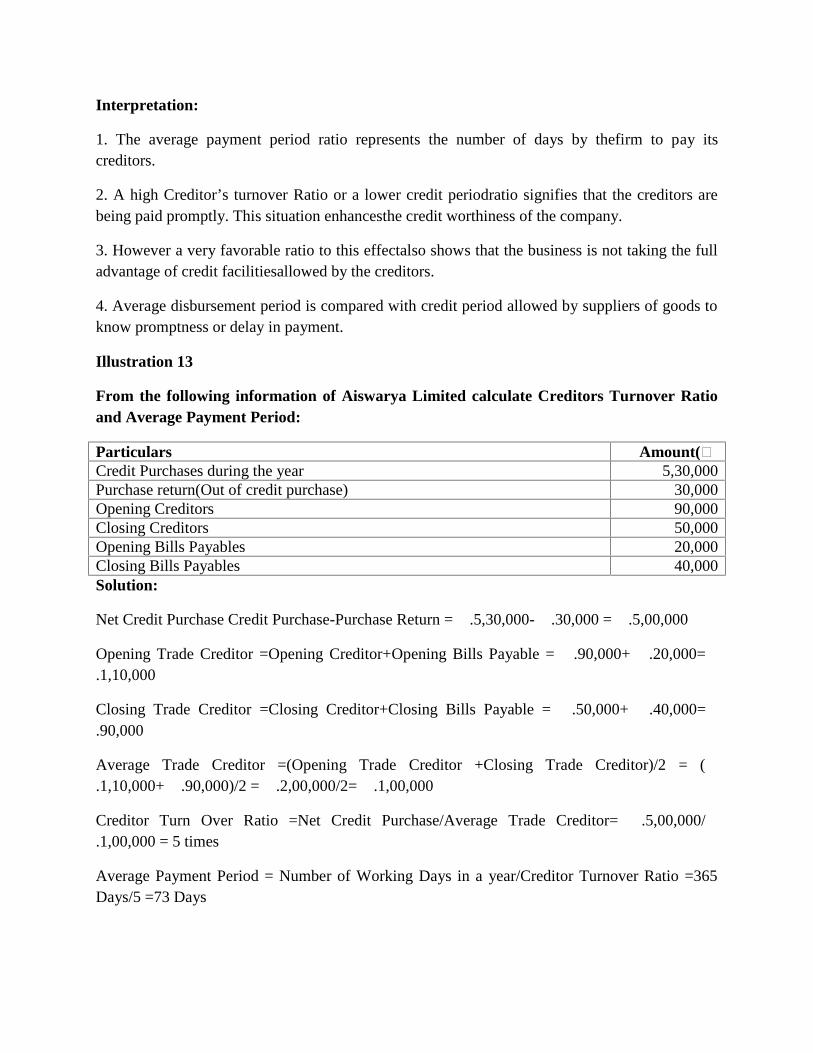
Interpretation:
1. The average payment period ratio represents the number of days by thefirm to pay itscreditors.
2. A high Creditor’s turnover Ratio or a lower credit periodratio signifies that the creditors arebeing paid promptly. This situation enhancesthe credit worthiness of the company.
3. However a very favorable ratio to this effectalso shows that the business is not taking the fulladvantage of credit facilitiesallowed by the creditors.
4. Average disbursement period is compared with credit period allowed by suppliers of goods toknow promptness or delay in payment.
Illustration 13
From the following information of Aiswarya Limited calculate Creditors Turnover Ratioand Average Payment Period:
Particulars Amount(₹)Credit Purchases during the year 5,30,000Purchase return(Out of credit purchase) 30,000Opening Creditors 90,000Closing Creditors 50,000Opening Bills Payables 20,000Closing Bills Payables 40,000Solution:
Net Credit Purchase Credit Purchase-Purchase Return =₹.5,30,000-₹.30,000 =₹.5,00,000
Opening Trade Creditor =Opening Creditor+Opening Bills Payable =₹ .90,000+₹ .20,000=₹.1,10,000
Closing Trade Creditor =Closing Creditor+Closing Bills Payable =₹ .50,000+₹ .40,000=₹.90,000
Average Trade Creditor =(Opening Trade Creditor +Closing Trade Creditor)/2 = (₹.1,10,000+₹.90,000)/2 =₹.2,00,000/2=₹.1,00,000
Creditor Turn Over Ratio =Net Credit Purchase/Average Trade Creditor=₹ .5,00,000/₹.1,00,000 = 5 times
Average Payment Period = Number of Working Days in a year/Creditor Turnover Ratio =365Days/5 =73 Days
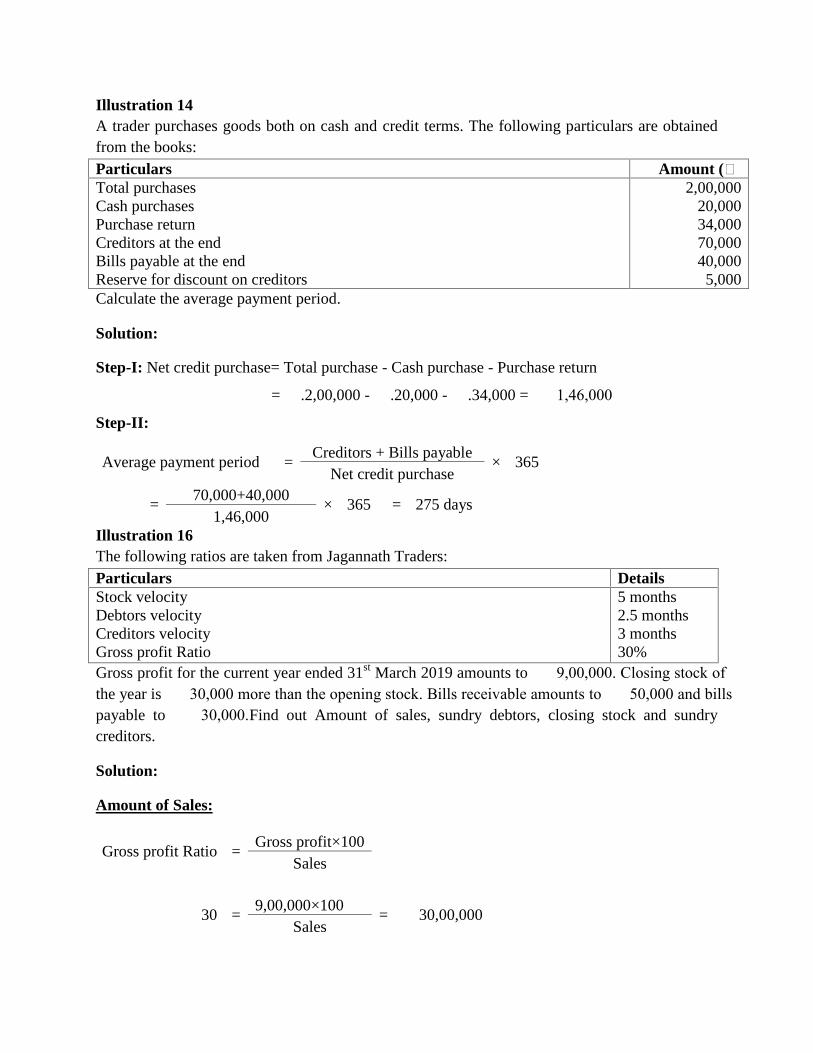
Illustration 14A trader purchases goods both on cash and credit terms. The following particulars are obtainedfrom the books:Particulars Amount (₹)Total purchasesCash purchasesPurchase returnCreditors at the endBills payable at the endReserve for discount on creditors
2,00,00020,00034,00070,00040,000
5,000Calculate the average payment period.
Solution:
Step-I: Net credit purchase= Total purchase - Cash purchase - Purchase return
= ₹.2,00,000 - ₹.20,000 - ₹.34,000 = ₹ 1,46,000
Step-II:
Average payment period =Creditors + Bills payable
× 365Net credit purchase
=70,000+40,000
× 365 = 275 days1,46,000
Illustration 16The following ratios are taken from Jagannath Traders:Particulars DetailsStock velocityDebtors velocityCreditors velocityGross profit Ratio
5 months2.5 months3 months30%
Gross profit for the current year ended 31st March 2019 amounts to ₹ 9,00,000. Closing stock ofthe year is ₹ 30,000 more than the opening stock. Bills receivable amounts to ₹ 50,000 and billspayable to ₹ 30,000. Find out Amount of sales, sundry debtors, closing stock and sundrycreditors.
Solution:
Amount of Sales:
Gross profit Ratio =Gross profit×100
Sales
30 =9,00,000×100
= ₹30,00,000Sales

Sundry Debtors:
Debtors velocity =Debtors + BR
× 12 monthsNet credit sales
2.5 =Debtors + 50,000
× 1230,00,000
Therefore debtors = ₹.6,25,000- ₹.50,000 = ₹ 5,75,000
Closing Stock:
Cost of goods sold= Sales-gross profit= ₹.30,00,000 – (30% of ₹. 30,00,000) = ₹ 21,00,000
Stock velocity (in months) =Average stock
× 12 monthsCost of goods sold
5 =Average stock
× 1221,00,000
Therefore average stock = ₹ 8,75,000
Average stock =Opening stock + Closing stock
2
= 8,75,000 =Opening stock + (30,000 + Opening stock)
2
Therefore average stock = ₹ 8,60,000
Closing stock = ₹ 8,60,000 +₹.30,000 = ₹ 8,90,000
Sundry Creditors:
Net credit purchases= Cost of goods sold + closing stock – opening stock=₹.( 21,00,000 +8,90,000 – 8,60,000 ) = ₹ 21,30,000
Creditors velocity =Creditors + B/P
× 12 monthsNet credit purchases

3 =Creditors + 30,000
× 1221,30,000
Therefore Creditors =₹. 5,32,500 –₹. 30,000 = ₹.5,02,500
4. CurrentAsset Turnover Ratio:
In order to examine truly the liquidity of a firm, it is essential to measure the effectiveness and
efficiency with which the firm is managing its current assets, specially debtors and stock.This
ratio measures the utilization and effectiveness of current assets by establishing relationship of
current assets with net sales. It is calculated as below. = ( ) This ratio is useful for those concerns where use of fixed assets is negligible. Higher the ratio,
better it is.
5. Working Capital Turnover Ratio or Ratio of Sales to Working Capital:
Working capital turnover Ratio indicates the velocity of the utilization of networking capital.
This ratio is a measure of efficiency of working capital utilization.This ratio represents the
number of times the working capital is turned over inthe course of yearIt is calculated as follows: = ( ) Note:Net Working Capital = Current Assets- Current Liabilities
Interpretation:
1. A high working capital turnover ratio shows the efficient utilization of working capital.
2. But too high or too low ratio indicates over-trading and under-trading respectively. Both these
situations are harmful for the smooth conduct of the business.
3. However, the ratio should be interpreted along with inventory turnover and debtor turnover
ratios.
Illustration 17
From the following particulars of Abhijit Limited, compute Current Assets Turnover Ratio and
Working capital Turnover Ratio:

Particulars Amount(₹)
Cash 10,000
Bills Receivable 5,000
Sundry Debtor 25,000
Stock 20,000
Sundry creditors 30,000
Cost of Sales 1,40,000
Solution:
Current Assets = Cash + Bills Receivable + Sundry Debtors +Stock =₹ .( 10,000+5,000
+25,000+30,000) =₹.70,000
Current Liabilities = Sundry Creditors =₹.30,000
Net Working Capital = Current Assets- Current Liabilities =₹.(70,000-30,000) = ₹.40,000
Current Asset Turnover Ratio = Cost of sales/Current Assets =₹.1,40,000/₹.70,000 =2 times.
Working Capital Turnover Ratio = Cost of Sales/Net Working Capital =₹.1,40,000/₹.40,000 =
3.5 times
6. FixedAsset Turnover Ratio or Ratio of Sales to Fixed AssetsRatio
This ratio measures management’s ability of efficient and profitable use of fixed assets. It
indicates the firm’s ability to generate sales per rupee of investments in net fixed assets. It is
calculated as follows:
= ( ) Interpretation:
1. This ratio assumes more significance in manufacturing concerns because of comparatively
higher investment in fixed assets in these concerns.
2. Higher the ratio, better it is. But this ratio varies from one industry to other. In labour intensive
industries, it is expected to be high and in capital intensive industries (where investment in fixed
assets is high), it is bound to be low.
3.Inmanufacturing industry5: 1 is considered to be satisfactory.

4.A high fixed asset turnover ratio indicates efficiency of management in utilizing the fixed
assets
5. But a very high fixed assets turnover is an indication of over trading on fixed assets.
6. On the other hand, a low fixed assets turnover ratio indicates under or inefficient utilization of
fixed assets or over-investment in fixed assets.
7.If a business shows a weakness in this ratio, its plant may be operating belowcapacity and the
management should be looking at the possibility of selling the lessproductive assets.
8. As there is no direct relationship between the sales and fixed assets, this ratio is of use only in
manufacturing concerns.
7. TotalAssets Turnover Ratio:
This ratio shows relationship between total assets of the company and its total sales or cost of
sales. This ratio takes into account both net fixed asset; and current assets. This ratio is a measure
of effectiveness of the use of total assets in the working of the concern. It is calculated as
follows: = ( )Interpretation:
1. It also gives an indication of the efficiency with which assets are used.
2.A low ratio means that excessive assets are employed to generate sales.
3. A ratio of 2:1 asset turnover is considered satisfactory.
4. If the ratio is very high, it may be considered that the concern is over trading on fixed assets
and if it is very low it indicates over-investments in assets and underutilization of total capacity.
8. Net Tangible Assets Turnover Ratio or Ratio of Sales to Net Tangible Assets:
It is calculated as follows: = ( ) Note: Net tangible asset are calculated by taking sum of all assets excluding intangible assets
and deducting total liabilities from this sum.

Interpretation:
Higher the ratio, better it is but if this is too high, it implies over-utilization of firm’s goodwill.
This is called as over trading.
9. Capital or Net WorthTurnover Ratio or Ratio of Sales to Capital or Net Worth:
This ratio is a measure of efficiency of utilization of shareholders capital. Efficient use of capital
is an indicator of profitability of business and managerial efficiency. It is calculated as follows: = Some authors suggest that total capital employed should match with net sales and they can
calculate the ratio as follows: = Total capital implies shareholders fund plus long-term debt. Higher the ratio, better it is. A
higher ratio indicates more profits while low ratio would result low profits. A very high capital
turnover ratio would indicate over-trading and a very low capital turnover ratio leads to under-
trading.
1.8 Solvency Ratio:
The term solvency refers to the ability of the concern to meet its long-term commitments.Solvency is examined with reference to the firm’s capacity to pay interest regularly andeventually repay on maturity the sum borrowed. Long-term creditors as well as present andprospective shareholders are interested in the analysis of solvency of a company. The followingratios are calculated for examining long-term solvency of a concern:1. Debt-Equity Ratio /Debt-Net worth Ratio2. Proprietary Ratio/Equity Ratio3. Solvency Ratio4. Fixed Assets to Net worthRatio5. Funded Debt to Capitalization Ratio6.Fixed Assets to Total Long-term fund Ratio or Fixed Assets Ratio7.Ratio of tangible assets to total debts8. Debt-Service coverage Ratio/ Interest coverage Ratio/ Fixed Charges Coverage Ratio9. Preference Dividend Coverage Ratio10.Cash to debt service Ratio or Debt cash flow coverage Ratio

1. Debt-Equity Ratio or Debt-Net worthRatio:
A firm uses both equity and debt for financing its assets. The ratio of thesetwo sources of funds
is terned as Debt Equity Ratio. This ratio indicates the relationship between external equities and
internal equities. This is also known as External-Internal Equity Ratio. It is calculated as follows:− = − ( ) ( )Outsider's Long term Fund(Debt) Shareholder's Fund/Net-worth (Equity)
Debenture or Bond+ Long- Term loan fromFinancial Institutions + Other long-termBorrowings
Preference share capital +Equity share capital,+Capital reserve, Retained earnings and anyother reserves representing the accumulatedprofit – Accumulated Losses (if any)
Note: Some authors consider the meaning of debt as Total Borrowed Funds. Hence they
calculate Debt equity ratio as (Total Borrowed funds/Shareholder’s Fund).Total Borrowed funds
include both long term and short term borrowings orcurrent liabilities. It is the aggregate of
bonds, debentures, bank loans and all thecurrent liabilities.
Interpretation
1. A low ratio signifies a smaller claim of debt- holders. More precisely, the greater the debt-equity ratio, greater the risk to debt- holders.
2. This ratio indicates the extent of cushion available to the debt- holders on liquidation of theborrower concern. Lower the ratio, greater security for the debt- holders. A high debt equity ratiois a danger signal for the debt- holders because in case of fall in profits of the concern, it may notbe able to bear the heavy burden of interest and also not able to repay its debts on time.
3. But shareholders stand to gain from the high debt equity ratio because
They can retain the control of the company with less contribution and thus bearing lesserrisks.
In case of increase in the profitability of the company, their earning per share willincrease very fast. This is called trading on equity.
4. Low debt equity ratio provides sufficient safety margin to debt- holders but it indicatescompany’s failure to use low-cost outsiders fund to magnify shareholders earnings.
5. The standard norm of Debt-Equity ratio is 2:1. It indicates that total borrowedfund can be twotimes of equity or owned funds. The intention is to maximize thereturn of equity shareholders bytaking, advantage of cheap borrowed funds. However lending institutions prefer a debt equityratio of 1:1.

2. Proprietary Ratio/ Equity Ratio:
This ratio is also known as Equity Ratio orShareholders Equity to Total Equity Ratio or NetWorth to Total Assets Ratio. It indicates the relationship of owner’s funds (shareholders equity)to total assets or total equities. = ′ Note: This ratio can be represented in percentage also which will indicate the percentage ofowner’s fund to total assets.
Interpretation:
1. The purpose of this ratio is to know the proportion of total assets financed by the owners.
2. There are no generally accepted norms for this ratio.
3.Higher the ratio lesser the dependence for capital on outside sources, better the long-termsolvency and greater the protection to the debt- holders of the firm.
4.In case of stability in earnings of the firm, comparatively a lower ratio can also be accepted.
3. Solvency Ratio or Debt to total asset Ratio:
It is also known as Debt Ratio.It is the ratio of total borrowed funds to total assets (also equal tototalliabilities). It indicates the relative contribution of outsiders in financing theassets of thefirm. This ratio indicates the relationship of total liabilities of the firm to its total assets. This iswhy it is also known as the ratio of total liabilities to total assets. It measures the proportion oftotal assets financed by outside creditors. It is calculated by using any of the following two ratios
= Solvency Ratio =100-Equity Ratio
Interpretation:
1. The higher this ratio, the greater is the dependence of the firm on outsiders for its financing.The position of debt holder in this case is not safe in the event of winding up.

4. Proprietor’s Liability Ratio:
This ratio indicates the relationship between two main sources of financing i.e. proprietor’s fund/shareholder’s fund and outsider’s loans (or liabilities). It is calculated as follows:
’ = ’ Interpretation:
Higher the ratio better is the security of debt holders.
5.Fixed Assets to Net worth Ratio or Ratio of Fixed Assets to Proprietor’s Fund
The ratio shows the relationship between net fixed assets and Net worth. An important aspect offinancial soundness is that all fixed assets of the business are financed out of shareholder’s funds.If fixed assets are more than owner’s funds then it implies that fixed assets have been financedwith outside sources (i.e. borrowed money) also. In such a case, if the debt holders demand forrepayment of their loans, the firm may have to face serious financial problems because amountinvested in fixed assets cannot be taken back. Hence, if owner’s funds exceed the fixed assets, itis treated as a good proof of firm’s long-term solvency.This ratio is calculated by dividing the value of fixed assets after depreciation by proprietor’sfund.
= ( − )Interpretation:1. This ratio should not exceed 1:1.2.On the contrary, lesser the ratio, better the position because in such a case proprietor’s fundswill be available for working capital needs because in such case proprietor’s funds will beavailable for working capital needs also.3.Usually, a ratio of 0.67:1 (i.e. fixed assets are about two-third of the proprietor’s funds) isconsidered satisfactory.
6. Fixed Assets to Total Long-term fund Ratio or Fixed Assets Ratio
This is an improvement over fixed assets to net worth ratio. The modern view of financialexperts is that fixed assets could be financed by long-term loans also together with proprietor’sfunds. Hence for long-term solvency analysis the relationship of fixed assets should beestablished with total long term funds (proprietor’s funds plus long-term loans). Fixed assetsratio is calculated for this purpose. It is calculated as follows:

= ( − ) Interpretation:1. This ratio should not exceed 1:1. If it exceeds 1:1, it implies that short-term funds of the firmhave also been applied for acquiring fixed assets which in no way be considered appropriate.2. The general rule is that fixed assets should not exceed 2/3rd of total long-term funds so thatrest of the long-term funds could be utilized for meeting working capital requirement.
7. Ratio of tangible assets to total debtsThis ratio indicates the relationship of tangible assets to total debts.
= Interpretation:This ratio measures the ability of the firm to pay its debt, as it shows the extent to which totalliabilities of the firm can be repaid its tangible assets. Higher the ratio greater is the security ofthe creditors.
8. Debt Service Ratio (DSR) or Interest Coverage RatioThis ratio relates the fixed interest charge to the income earned by the business. It indicateswhether the business has earned sufficient profits to pay periodicallythe interest charges. Thisratio is calculated to evaluate the debt-servicing capacity of the firm. It is calculated by dividingthe net profit before interest and taxes by fixed interest charges.
= & ( )Interpretation:1. This ratio is very meaningful for the long-term creditors of the firm because it measures thefirm’s capacity to pay interest on its loans on due dates.2. It also measures the margin of safety for the lenders. Higher the ratio, better is the position oflong-term creditors.3.But a too high interest coverage ratio may mean that firm is not taking adequate advantage oftrading on equity to increase the earning per share.4. Eight to nine times interest cover is considered as satisfactory for an industrial concern.5. A sharp decline in this ratio may endanger payment of interest and the firm will find itdifficult to raise additional funds.6. The interest coverage ratio does not take into account other fixed obligations like payment ofpreference dividend and repayment of loan instilments.

Illustration 18If the net profit (after taxes) of a firm is 75,000 and its fixed interest charges on Interest onLong-term borrowings are 10,000. The rate of income tax is 50%.Calculate Debt service Ratio /Interest coverage RatioSolution:Particulars Amount(₹)Net profit (after taxes) of a firm 75,000Add: Taxes (50% of Profit Before Tax) 75,000Net profit (before taxes) 1,50,000Add: Interest on Long-term Borrowing 10,000Earnings Before Interest & Taxes(EBIT) 1,60,000
Interest Coverage Ratio = EBIT/Interest Charges =₹.1,60,000 / ₹.10,000= 16 times
9. Preference Dividend Coverage Ratio:It is calculated as follows:
= ( )Interpretation:1. This ratio is an index of the risk accruing to preference shareholders.2. Coverage of at least 2 is considered standard.
10. Cash to Debt Service Ratio or Debt Cash Flow Coverage Ratio:Some authors find Cash to debt service Ratio as a better measure to judge firm’s ability to meet
its long-term obligations. As the firm has to pay debt service charges in cash, so in order toanalyze firm’s long term liquidity, it is better to calculate this ratio on the basis of total cashinflows instead of net income. If the firm has created sinking fund to repay the long-term loans,then, annual contribution to sinking fund shall also be added to interest charges and the followingformulae shall be applied. = + [( )/( − )]Interpretation:1. If it is not possible to calculate precisely the amount of annual cash inflows, then the amountarrived at by adding depreciation and other non-cash expenses to the amount of net profit beforeinterest and tax may be used in place of annual cash inflows.

2. High coverage ratio would be required in firms whose incomes are very instable.The firmswhose incomes are stable; comparatively a low coverage ratio will be sufficient.Illustration 19From the following information calculate1. Interest Coverage Ratio2. Debt cash flow coverage RatioParticulars AmountNet income after taxDepreciation chargedTax rate5% mortgage BondsFixed interest ChargesSinking fund appropriation
₹1,56,370₹20,000
50% of net income₹2,50,000
₹14,7505% of outstanding debentures
Solution:
Particulars Amount(₹)Net income after tax 1,56,370Add: Taxes(50% Tax on Profit before tax) 1,56,370Net Income before tax 3,12,740Add: Fixed Interest Charges 14,750Net Profit Before Interest & Taxes(EBIT) 3,27,490Add: Depreciation Charged 20,000Annual Cash flow before interest and tax 3,47,490
Interest Coverage Ratio =Net profit before interest and income tax
Fixed interest charges
=3,27,490
= 22 times approximately14,750
Debt cash flow coverageRatio
=Annual cash flow before interest and tax
Interest + [( Sinking fund appropriation on debt)/ (1-Tax rate )]
=3,47,490
= 8.7 times14,750+[ (12,500)/(1-0.50)]
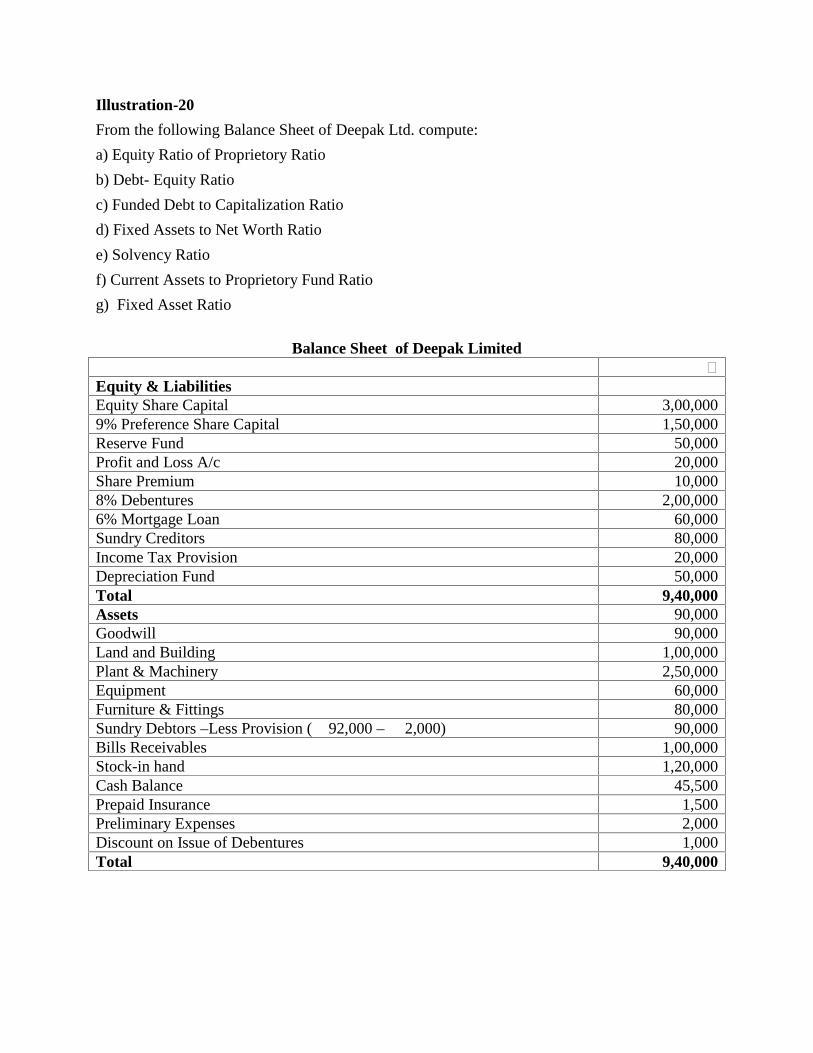
Illustration-20
From the following Balance Sheet of Deepak Ltd. compute:
a) Equity Ratio of Proprietory Ratio
b) Debt- Equity Ratio
c) Funded Debt to Capitalization Ratio
d) Fixed Assets to Net Worth Ratio
e) Solvency Ratio
f) Current Assets to Proprietory Fund Ratio
g) Fixed Asset Ratio
Balance Sheet of Deepak Limited₹
Equity & LiabilitiesEquity Share Capital 3,00,0009% Preference Share Capital 1,50,000Reserve Fund 50,000Profit and Loss A/c 20,000Share Premium 10,0008% Debentures 2,00,0006% Mortgage Loan 60,000Sundry Creditors 80,000Income Tax Provision 20,000Depreciation Fund 50,000Total 9,40,000Assets 90,000Goodwill 90,000Land and Building 1,00,000Plant & Machinery 2,50,000Equipment 60,000Furniture & Fittings 80,000Sundry Debtors –Less Provision (₹92,000 – ₹2,000) 90,000Bills Receivables 1,00,000Stock-in hand 1,20,000Cash Balance 45,500Prepaid Insurance 1,500Preliminary Expenses 2,000Discount on Issue of Debentures 1,000Total 9,40,000

Solution:
a) Equity Ratio =Shareholder’s Funds
Total AssetsShareholder’s Funds
= Equity Share Capital + Preference Share Capital + Reserve Funds + Profit and Loss A/c +Share Premium – Preliminary Expenses – Discount on Issue of Debentures
= ₹3,00,000 + ₹1,50,000 + ₹50,000 + ₹20,000 + ₹10,000 – RS. 2,000 – ₹1,0000
= ₹5,27,000
Total Assets
= Total Assets – Preliminary Expenses – Discount on Issue of Debentures – Depreciation Fund
= ₹9,40,000 – ₹2,000 – ₹1,000 – ₹50,000
₹8,87,000
Note: Preliminary Expenses and Discount on Issue of Debentures are deferred expenses are notassets.
Equity Ratio =₹5,27,000
= 0.59₹8,87,000
b) Debt-Equity Ratio =Outsider’s Funds
Shareholder’s Funds
Outsider’s Funds
= 8% Debentures + 6% Mortgage Loan + Sundry Creditors + Income Tax Provision
= ₹2,00,000 + ₹60,000 + ₹80,000+ ₹20,000
= ₹3,60,000
Debt Equity Ratio =₹3,60,000
= 0.68₹5,27,000
c) Funded Debt to Capitalization Ratio =Funded Debt
Total Capitalization

Funded Debt = Long-term loans
= 8% Debentures + 6% Mortgage Loan
= ₹2,00,000 + ₹60,000
= ₹2,60,000
Total Capitalization = Shareholders Funds + Long-term loans
= ₹5,27,000 + ₹2,60,000
= ₹7,87,000
Funded Debt to Total Capitalization Ratio =₹2,60,000
= 0.33₹7,87,000
d) Fixed assets to Net Worth Ratio =Net Fixed Assets
Net Worth
Net Fixed Assets
= Goodwill + Land and Building + Plant and Machinery + Equipments + Furniture & Fittings –Depreciation Fund
=RS. 90,000 + ₹1,00,000 + ₹2,50,000 + ₹60,000 + ₹80,000 – ₹50,000
= ₹5,30,000
Net Worth = Net Worth is the same as Shareholders Funds
Fixed assets to Net Worth Ratio =₹5,30,000
= 1.01₹5,27,000
e) Solvency Ratio =Total Liabilities to Outsiders
Total assets
Total Liabilities to Outsiders
= 8% Debentures + 6% Mortgage Loan + Sundry Creditors + Income Tax Provision
= ₹2,00,000 + ₹60,000 + ₹80,000 + ₹20,000
= ₹3,60,000

Solvency Ratio =₹3,60,000
= 0.41₹8,87,000
f) Current Assets to Proprietors’ Funds Ratio =Current Assets
Proprietors’ Funds
Current Assets
= Sundry Debtors + B/R + Stock –in-trade + Cash Balance + Prepaid Insurance
= ₹90,000 + ₹1,00,000 + ₹1,20,000 + ₹45,500 + ₹1,500
₹3,57,000
Proprietors’ Funds = Shareholders Funds
Current Assets to Proprietors’ Funds Ratio =₹3,57,000
= 0.68₹5,27,000
g) Fixed Assets Ratio =Net Fixed Assets
Total Long-term Funds
Total Long-term Funds = Shareholders Funds + Long-term borrowings (Funded debt)
= ₹5,27,000 + ₹2,60,000
=₹7,87,000
Fixed Assets Ratio =₹5,30,000
= 0.67₹7,87,000
Illustration:21
From the following Balance Sheet of Deepa Ltd. compute:
i) Funded Debts to Capitalization Ratio
ii) Total Liabilities to Total Assets Ratio
iii) Fixed Assets Ratio
iv) Total Fixed Assets to Proprietors’ Equityv) Total Current Assets to Proprietory Equity Ratio
vi) Interest Coverage Ratio

Balance Sheet of Deepa Ltd as at 31st Dec. 2017₹
Equity & Liabilities20,000 Equity Shares of ₹10 each fully paid 2,00,0008% 10,000 Preference Share of ₹100 each, fully paid 1,00,000General Reserve 50,000Securities Premium 25,000Profit and Loss A/c 1,00,00010% Debentures 1,00,00012% Mortgage Loan 50,000Sundry Creditors 50,000Bills Payable 10,000Total 6,85,000AssetsPlant & Machinery (Net) 2,00,000Land and Building (Net) 1,00,000Closing Stock 1,50,000Debtors 80,000Bills Receivables 60,000Cash and Bank 95,000Total 6,85,000Net Profit before Interest and Taxes (EBIT) amounted to ₹40,000.
Solution:
Before calculating the actual ratios, the following components are computed:
Funded Debts
₹10% Debentures 1,00,00012% Mortgage Loan 50,000
1,50,000
Total Capitalization
₹Equity Share Capital 2,00,000Preference Share Capital 1,00,000General Reserve 50,000Securities Premium 25,000Profit and Loss A/c 1,00,00010% Debentures 1,00,00012% Mortgage Loan 50,000
6,25,000

Total Liabilities to Outsiders
Total Assets
Total Long-Term Fund
Total Fixed Interest Charges
(i) Funded Debts to Total Capitalization Ratio =Funded Debts × 100
Total Capitalization
₹10% Debentures 1,00,00012% Mortgage Loan 50,000Sundry Creditors 50,000Bills Payable 10,000
2,10,000
₹Fixed Assets 3,00,000Current Assets 3,85,000
6,85,000
₹Shareholders’ FundEquity Share Capital 2,00,000Preference Share Capital 1,00,000General Reserve 50,000Securities Premium 25,000Profit and Loss A/c 1,00,000
4,75,000Other Long-term Funds10% Debentures 1,00,00012% Mortgage Loan 50,000
6,25,000
₹Debenture Interest 10,000Mortgage Loan 6,000
16,000

=₹1,50,000 × 100 = 24%₹6,25,000
(ii) Total Liabilities to Total Assets Ratio =Total Liabilities to Outsiders × 100
Total Assets
=₹2,10,000 × 100 = 31%₹6,85,000
(iii) Fixed Assets Ratio =Fixed Assets × 100
Total Long-m Funds
=₹3,00,000 × 100 = 200%₹1,50,000
(iv) Total Fixed Assets to Proprietors’ Fund Ratio =Total Fixed Assets × 100Proprietors’ Fund
=₹3,00,000 × 100 = 63%₹4,75,000
(v) Total Current Assets to Proprietors’ Fund Ratio =Total Current Assets × 100Proprietors’ Fund
=₹3,85,000 × 100 = 81%₹4,75,000
(vi) Interest Coverage Ratio =Net Profit before Interest & Tax (EBIT)
Fixed Interest Charges
=₹40,000
= 2.5 times₹16,000

1.9 CAPITAL STRUCTURE RATIOS OR LEVERAGE RATIOSA firm’s capital structure is the relation of debt to equity as sources of a firm’s asset. Ratios usedfor capital structure analysis are known as leverage ratios. These ratios measure the relationshipbetween finance provided to the firm by the outsiders and the owners. They also indicate the riskof debt finance. Hence, both the owners and creditors of the firm are interested in the analysis ofcapital structure. The long-term creditors of the firm are interested mainly evaluating firm’scapacity of repayment the principal and amount on the maturity and timely payment of intereston their loans. A finance manager can increase significantly rate of dividend and worth ofinvestments of equity shareholders by appropriate leverage.Purpose of Leverage Ratios:1. Identifying Sources of Funds: The firm finances all its resources from debt to equity sources.The amount of resources from each source is shown by these ratios.2. Measuring the Finance Risk: One measure of the degree of risk prevailing from debtfinancing is provided by these ratios. If the firm has been increasing the percentage of debt in itscapital structure over a period of time, this may indicate an increase in risk for its shareholders.3. Forecasting Future Borrowing Prospects: If the firm is considering expansion and needs toraise additional money, the capital structure ratios offer an indication of whether debt funds willbe available. If the ratios are too high, the firm may not be able to borrow.Types of Leverage Ratio:Following ratios may be calculated for leverage analysis:
1. Capital gearing Ratio or Gear Ratio2.Debt –Total Fund Ratio3. Ratio of total investments to Long-term liabilities4. Ratio of fixed asset to funded debt5. Ratio of reserve to equity capital6. Ratio of current liabilities to proprietor’s funds
1. CapitalGearing Ratio or Gear Ratio:This is most important ratio for analyzing the capital structure of a concern. The term capital
gearing denotes the extent of reliance of a company on fixed cost bearing securities (preferenceshare capital and debt capital) as against equity funds (i.e. equity share capital and surplus). Insimple words, capital gearing implies financing of a business enterprise through fixed interestand dividend carrying securities. Capital gearing Ratios express relationship between fixed costbearing capital and variable cost bearing capital. = If fixed cost bearing capital is greater proportion than variable cost bearing capital (i.e. the ratiois more than 1) the business enterprise is said to be highly geared. The business enterprise is said

to be low geared when fixed cost capital is less than variable cost bearing capital (i.e. ratio is lessthan 1).Interpretation:1. A company can increase the return on equity shareholders by adopting high gearing policy.But this is possible only when the rate of interest/ dividend payable on fixed cost bearing capitalis less than the rate of earnings on total capital employed in the firm.2. In the case of loan capital, there is also the benefit of tax shield because interest on loan capitalis a permissible deduction from profits for the purpose of ascertaining taxable income.3. Hence, by adopting the policy of high gearing, return on equity shareholders exceed even thereturn on capital employed. This is known as trading on equity. But this policy is profitable onlywhen the cost of capital is less than the additional earning from it. In case of reverse situation,the equity shareholder may have not only to lose their dividend but sometimes their capital alsoto meet out this loss. Hence, the policy of high gearing is very risky and speculative. The equityshare holders dwell upon feast and fast under such circumstances.4. During boom, dividend on these shares and consequently their market value rise sharply andon reverse circumstances (i.e. during depression) they fall sharply.Illustration-22Following is the capital structure of A Ltd and B Ltd. As on 31st March 2017:Particulars A Ltd(₹) B Ltd(₹)Equity share capital10% Preference share capital12% DebenturesGeneral reserve
5,00,0001,00,000
Nil2,50,000
1,00,0002,00,0003,00,0002,50,000
During the year 2018, each company earned profit of RS. 2,00,000 before interest and taxes. Therate of tax is 50%. Comment on the capital gearing of the two companies.
Solution:
CGR =Fixed cost bearing capital
Variable cost bearing capital
A Ltd =1,00,000
= 0.13:17,50,000
B Ltd =5,00,000
= 1.43:137,50,000

2. Debt to Total Funds Ratio:It is a modified version of Debt-Equity Ratio. It represents how much amount of outside long-term liabilities are related to total capital structure of the firm. This ratio is computed by dividingthe long-term debts by the amount of Total funds. This is computed as below:
− = − 3. Ratio of Total Investments to Long-term Liabilities:It expresses relationship of total long-term funds to long-term liabilities: − = ( ′ + − ) Note: As a general rule, proportion of long-term liabilities should be very high.
4. Ratio of Fixed Asset to Funded Debt:This ratio determines the margin of safety to funded debt, such as debentures. The debentures ofa company are usually issued by mortgaging the fixed assets. Hence, higher the ratio of fixedasset to debentures, the greater will be the security of debenture holders. It is calculated asfollows: = 5. Ratio of Reserve to Equity Capital:It is calculated as follows: = ×This ratio throws light on dividend policy of the management. Higher the ratio, moreconservative is dividend policy of the management and better is the growth potentiality of thecompany.
6. Ratio of current liabilities to proprietor’s funds:This ratio is calculated by ’ = ’

This ratio measures short-term borrowings as compared to funds provided by the proprietors.The norm is 35%.
1.10 PROFITABILITY RATIO
A business firm is basically a profit earning organization. The profitability is generally treated asan indicator or efficiency of business activities. It depends upon the amount of sales, nature ofcosts and efficiency of business activities. It depends upon the amount of sales, nature of costsand efficient use of resources. Profitability is analysed by different parties according to theirinterest. To the management, profits are the test of efficiency and a measure of control to owners,
a measure of worth of their investment, To the creditors, the margin of safety, To employees, a source of fringe benefits, To government, a measure of taxpaying capacity and the basis of legislation action, To customers a hint to demand for price cut’ To an enterprise, less cumbersome source of finance for growth and existence and To the country, an index of economic progress.
For reliable and meaningful analysis of profitability, three of four ratios should be calculated. Asingle ratio may lead to misleading conclusions. This analysis is of two kindsi.e. generalprofitability analysis, overall profitability analysis.General Profitability Ratios(Profit inrelation to Sales)
Overall Profitability Ratios(Profit inrelation to Investment)
1.Gross Profit Ratio 1.Return on Equity(ROE)2.Operating Ratio 2.Return on Net worth(RONW)3.Operating Profit Ratio 3.Return on Investment(ROI)4.Expenses Ratio 4.Return on Assets(ROA)5.Net Profit Ratio 5.Return on Capital Employed(ROCE)
General profitability analysisIn this type of analysis profit is related to the volume of operation or sales. The different types ofGeneral Profitability Ratios are as under:1. Gross profit Ratio:This ratio establishes relationship between gross profit and net sales. This indicates gross profit
margin to net sales and usually expressed in percentage. The formula is as follows: = ×Notes:1. The two main components of this ratio are gross profit and net sales.2. Gross profit is the excess of net sales over the cost of goods sold.3.Net sale is found out of deducting sales returns from gross or total sales.

Interpretations:1. Gross profit Ratio is very important ratio of measuring profitability of an enterprise.2. It indicates the management the margin of the profit left to cover indirect expenses.3. In other words, it indicates the extent to which the selling price of goods may decline withoutresulting in losses.4. Higher the ratio, better it is.5. But there is no rule of thumb for gross profit ratio. It may vary from business to business,industry to industry and also for different units within the same industry.6. Hence, a firm’s gross profit ratio should be compared with own past ratio or with ratio of thecompetitive firms.7. However, the gross profit should be adequate to cover administrative, selling and distributionexpenses and to provide for fixed charges, dividends and desired reserves.8. A decrease in Gross profit Ratio may be due to any of the following causes:
Reduction in selling price without corresponding decrease in cost. Increase in raw material prices without corresponding increase in sale price. Theft, damage or misappropriation of stock Under valuation of closing stock Increase in cost of production due to over investment in plant and machinery and their
unfavourable location Rise in wage rate and direct costs. Goods purchased for personal use wrongly included in the purchase of the business.
9.Increase in Gross profit Ratio may be due to Increase in sale price Decrease in raw material and other direct cost Under- valuation of opening stock and over- valuation of closing stock Inflating sales by including goods sent on consignment or goods sent on sale or approval
basis.2. OperatingRatio:This ratio is calculated by dividing the operating cost (i.e. cost of goods sold plus all operating
expenses) by net sales. = ( + ) ×Notes:1. Operating expenses means the sum of administrative, selling and distribution expenses.2.100 minus operating ratio is operating profit ratio.3. Operating profit ratio measures efficiency and general profitability of the business.Interpretations:
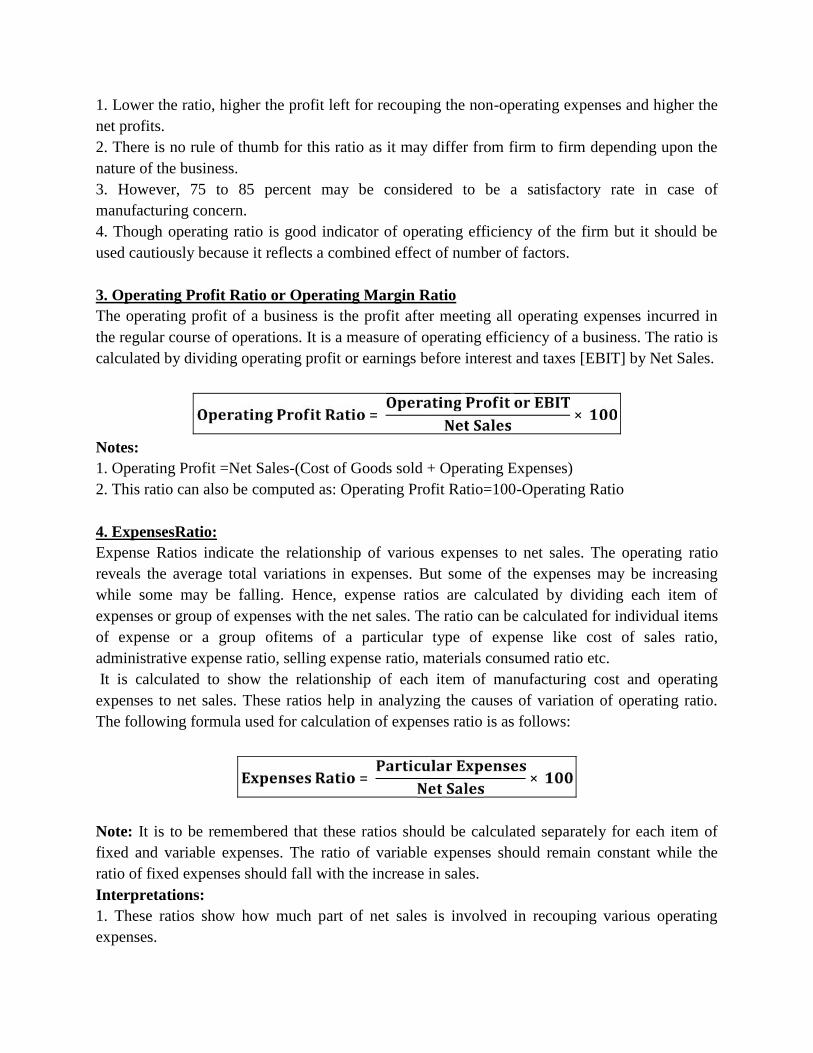
1. Lower the ratio, higher the profit left for recouping the non-operating expenses and higher thenet profits.2. There is no rule of thumb for this ratio as it may differ from firm to firm depending upon thenature of the business.3. However, 75 to 85 percent may be considered to be a satisfactory rate in case ofmanufacturing concern.4. Though operating ratio is good indicator of operating efficiency of the firm but it should beused cautiously because it reflects a combined effect of number of factors.
3. Operating Profit Ratio or Operating Margin RatioThe operating profit of a business is the profit after meeting all operating expenses incurred inthe regular course of operations. It is a measure of operating efficiency of a business. The ratio iscalculated by dividing operating profit or earnings before interest and taxes [EBIT] by Net Sales.
= ×Notes:1. Operating Profit =Net Sales-(Cost of Goods sold + Operating Expenses)2. This ratio can also be computed as: Operating Profit Ratio=100-Operating Ratio
4. ExpensesRatio:Expense Ratios indicate the relationship of various expenses to net sales. The operating ratioreveals the average total variations in expenses. But some of the expenses may be increasingwhile some may be falling. Hence, expense ratios are calculated by dividing each item ofexpenses or group of expenses with the net sales. The ratio can be calculated for individual itemsof expense or a group ofitems of a particular type of expense like cost of sales ratio,administrative expense ratio, selling expense ratio, materials consumed ratio etc.It is calculated to show the relationship of each item of manufacturing cost and operating
expenses to net sales. These ratios help in analyzing the causes of variation of operating ratio.The following formula used for calculation of expenses ratio is as follows:
= ×Note: It is to be remembered that these ratios should be calculated separately for each item offixed and variable expenses. The ratio of variable expenses should remain constant while theratio of fixed expenses should fall with the increase in sales.Interpretations:1. These ratios show how much part of net sales is involved in recouping various operatingexpenses.

2. By comparing these ratios with respective past ratios or with the standards determined bymanagement or with ratios of similar firms in the industry, economy or diseconomy of each itemof expenses can be determined.3. These ratios throw light on managerial efficiency and profitability of the firm.4. The lower the operating ratio, the larger is the profitability and higher the operating ratio,lower is the profitability.
5. Net Profit Ratio:This ratio measures the rate of net profit on sales.Net profit Ratiois the ratio of net profit (aftertaxes) to net sales. It is expressedas percentage. This is calculated as follows:
= ×Note:Some authors calculate this ratio on the basis of net operating profit after tax in place of netprofit after tax. In calculating net operating profit, non operating incomes and expenses areexcluded.Interpretations:1.This ratio is the measure of overall profitability and efficiency of the firm.2. The higher the ratio, the better is the profitability of the firm.Illustration 23:Following is the Income Statement of M/S Raman & Co. for the year ending 31st March 2018.Particulars Amount(₹) Particulars Amount(₹)To opening stockTo purchasesTo carriageTo wagesTo Gross Profit
45,7501,89,150
1,2003,000
1,20,000
By salesBy closing stock
3,00,00059,100
3,59,100 3,59,100To administrative expensesTo finance expensesInterestDiscountBad debtsTo selling expensesTo non-operating expensesTo net profit
60,600
7201,4402,0407,2001,200
50,400
By Gross ProfitBy non-operating incomeInterestDividendBy profit on sale of securities
1,20,000
9002,250
450
1,23,600 1,23,600
You are required to calculate1. ExpensesRatio2. Gross profit Ratio3. Net profit Ratio

4. Operating Ratio5. Operating profit RatioSolution:1. ExpensesRatio
Administrative expenses Ratio =Administrative expenses × 100
Sales
=60,600 × 100 = 20.2%
3,00,000
Finance expenses Ratio =Finance expenses × 100
Sales
=4,200 × 100 = 1.4%
3,00,000
Selling and distribution expenses Ratio =Selling and distribution expenses × 100
Sales
=7,200 × 100 = 2.4%
3,00,000
Non-operating expenses Ratio =Non-operating expenses
* 100Sales
=1,200 × 100 = 0.4%
3,00,000
2. Gross Profit Ratio
Gross profit Ratio =Gross profit × 100
Net sales
=1,20,000 × 100 = 40%3,00,000
3. Net Profit Ratio
Net profit Ratio =Net profit after tax × 100
Net sales
=50,400 × 100 = 16.8%
3,00,000
Alternatively,
Net profit Ratio =Net operating profit × 100
Net sales
=48,000 × 100 = 16%
3,00,000
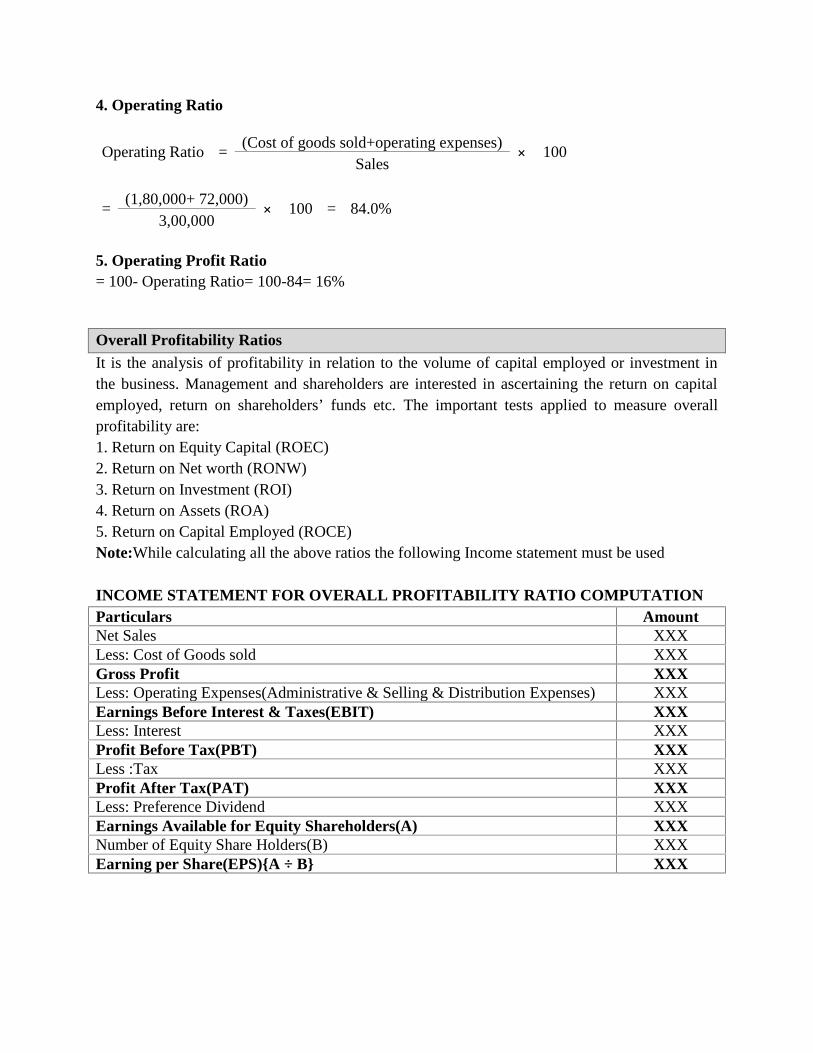
4. Operating Ratio
Operating Ratio =(Cost of goods sold+operating expenses) × 100
Sales
=(1,80,000+ 72,000) × 100 = 84.0%
3,00,000
5. Operating Profit Ratio= 100- Operating Ratio= 100-84= 16%
Overall Profitability RatiosIt is the analysis of profitability in relation to the volume of capital employed or investment inthe business. Management and shareholders are interested in ascertaining the return on capitalemployed, return on shareholders’ funds etc. The important tests applied to measure overallprofitability are:1. Return on Equity Capital (ROEC)2. Return on Net worth (RONW)3. Return on Investment (ROI)4. Return on Assets (ROA)5. Return on Capital Employed (ROCE)Note:While calculating all the above ratios the following Income statement must be used
INCOME STATEMENT FOR OVERALL PROFITABILITY RATIO COMPUTATIONParticulars AmountNet Sales XXXLess: Cost of Goods sold XXXGross Profit XXXLess: Operating Expenses(Administrative & Selling & Distribution Expenses) XXXEarnings Before Interest & Taxes(EBIT) XXXLess: Interest XXXProfit Before Tax(PBT) XXXLess :Tax XXXProfit After Tax(PAT) XXXLess: Preference Dividend XXXEarnings Available for Equity Shareholders(A) XXXNumber of Equity Share Holders(B) XXXEarning per Share(EPS){A ÷ B} XXX

1. Return on Equity Capital (ROEC)
In real sense, ordinary shareholders are the real owners of the company. They assume the highestrisk in the company.Thus ordinary shareholdersare more interested in the profitability of acompany and the performance of acompany should be judged on the basis of return on equitycapital of thecompany. Return on equity capital shows the relationship between profits of acompany available for its equity share holders and its equity capital. This ratio is calculated withthe help of the following formulae: = ( − ) ×Notes:1. A small variation of this ratio is to calculate the return on shareholders total equity in thecompany which is equal to the sum of paid up equity share capital, reserves, surplus and securitypremium account.2. If there is change in equity share capital during the year, then a simple average of opening andclosing capital would be taken to calculate this ratio.Interpretations:1. This ratio is more meaningful to the equity shareholders. It examines the earning capacity ofequity share capital.2. In fact the ratio provides the real test of managerial efficiency in utilizing the equityshareholders money.3. There is no rule of thumb for this ratio. Hence, higher the ratio, better it is.4. However, the ratio may be compared with other similar firms or with the firm’s own past.Illustration : 24Calculate return on equity share capital from the following information of Rajesh Limited:Equity share capital: 10,00,000 ; 9% Preference share capital: 500,000;Taxation rate: 50% of netprofit; Net profit before tax: 400,000.Solution:Particulars Amount(₹)Net Profit Before Tax 4,00,000Less Tax ( 50%) 2,00,000Profit After Tax 2,00,000Less Preference Dividend(9% on ₹5,00,00) 45,000Earning available for Equity Share Holders 1,55,000
ReturnonEquityCapital = EarningAvailableforEquityShareholdersEquityShareCapital(Paid − up) × 100= (1,55,000/10,00,000)× 100 =15.5%

2. Return on Shareholder’s Fund or Proprietor’s Fund or Net worth:This ratio measures the profitability of the concern in relation to total investments made by theshareholders (or proprietors) in the business. It is calculated by dividing net profit after interestand taxes by shareholder’s fund. ’ = Notes:1. The excess of total assets over total outsider’s liability of an enterprise is known asshareholder’s fund or proprietor’s funds or net worth.2. Alternatively, the sum of share capital (whether equity or preference) and accumulated profits(capital reserves plus all revenue reserves plus undistributed profits) minus losses, if any, is alsoknown as shareholder’s investment.3. Experts suggest that in calculating this ratio, average shareholder’s investment should be usedin place of shareholder’s investments.4. Averageshareholder’s funds or average proprietor’s fund is the simple average ofshareholder’s investment (or proprietor’s funds) at the beginning and at the end of the year.5. However, if fresh capital has been introduced in the business at the end of the year, suchcapital should be excluded in this calculation.6. This ratio reveals the efficiency of utilization of shareholder’s fund, higher the ratio better arethe results.Significance:1. This ratio provides a good basis of evaluating overall profitability and managerial ability offinancing the business. In fact, it is one of the most important relationships used in financialstatement analysis.2. This ratio is of great importance to the present and prospective shareholders as well as themanagement of the company. Some main uses of this ratio are as follows:
This return determines the earning power of shareholder’s investments. As the primaryobjective of business is to maximize its earnings, this ratio indicates the extent to whichthis objective is being achieved.
A comparison of this ratio of the firm with that of the other firms or with industryaverage determines the adequacy of return.
This ratio helps in forecasting future earning capacity of the business. For this purpose,trend analysis is most helpful.
3. Return on Total Investment/Return on Investment (ROI):This is measure of managerial efficiency of utilizing funds invested in the firm. This is calculatedas follows.

= & ( ) ×Note: Total investment implies shareholder’s funds plus long-term liabilities.Interpretation: Higher the ratiobetter is the profitability of the company.
4. Return on Total Assets or Total Resources (ROA):Profitability can be measures in terms of the relationship between net profits and total assets ofthe firm. This ratio is also called as profit to asset ratio. This is calculated as follows: = & ( )Interpretation: Higher the ratiobetter is the overall profitability position.
5. Return on Capital Employed (ROCE)The prime objective of making investments in any business is to obtainsatisfactory return oncapital invested. Hence, the return on capital employed isused as a measure of success of abusiness in realizing this objective.Return on capital employed establishes the relationshipbetween the profitand the capital employed. It indicates the percentage of return oncapitalemployed in the business and it can be used to show the overall profitability andefficiencyof the business. Hence, astudy of profit in relation to size of investment is known as return oncapital employed. In other words, return on capital employed implies finding out ratio of netprofit on capital employed in the firm. This is the only satisfactory measure of examining theoverall operating efficiency or profitability of a business entity. In fact, it is an evaluation ofefficiency in using funds entrusted to management.Significance of ROCE:1. Measure of overall efficiency: It is a suitable measure of overall efficiency or profitability ofthe concern because it is calculated keeping in view profit, sales and capital employed. In fact, itis good measure of efficiency in utilizing funds entrusted to the management.2. Disclosure of Borrowing Policy: This clarifies borrowing policy of the firm. A firm shouldnot borrow normally at a rate of interest higher than return on capital employed.3. Basis of inter-company comparisons: It provides a sound basis for inter-companycomparisons. If the magnitude of the profits of two companies is the same, it does not necessarilymean that efficiency level of the two is equal. Its true examination is possible only by calculatingreturn on capital employed. Higher the return, more efficient is the firm.4. Basis of inter-departmental comparison: This return can be used in appraising andcomparing divisional or departmental performances. Similarly, in a multiple product firm,profitability of various products inter-departmentally can be examined by calculating theirreturns separately.5. Helpful in capital budgeting decisions: The technique is also used to examine theprofitability of a capital expenditure proposal or in the project evaluation. Projects providing a

return less than return on capital employed are normally not considered. Thus, return on capitalemployed provides a yardstick for approving or disapproving a capital expenditure project.6. Integral part of budgetary control system: Return on capital employed can become anintegral part of a budgetary control system. It can evaluate the progress of the business.7. Helpful in projecting long-term pricing policy: The technique is also used both for tacticaland strategic decisions particularly in deciding long-term pricing policy. The price of the productshould be fixed in such a way that the price recovers not only the cost of product but ensures areasonable rate of return on capital employed.8. Helpful in designing the capital structure: This ratio can also be usefully employed indesigning the overall capitalization and capital structure. It means that management shouldborrow funds from the market only when the return on capital employed is more than the fixedcharges on such funds.
Computation of ROCE:The term capital employed has been defined by various committees and experts in various firms.The term is mainly used in the following four meanings: Gross Capital Employed, Net CapitalEmployed, Proprietor’s Net Capital Employed and Average Capital Employed. = ×
= × ′ = ′ ×
= ×Meaning of CapitalEmployed: The term capital employed has been defined by variouscommittees and experts in the following forms:
Gross Capital Employed:
It implies the sum of all fixed and current assets of the firm. It is also sometimes called totalresources of the concern. Thus, return on gross capital employed is the same as return on totalresources (or assets) discussed earlier. However, the following concept may also be used for thiscalculation.
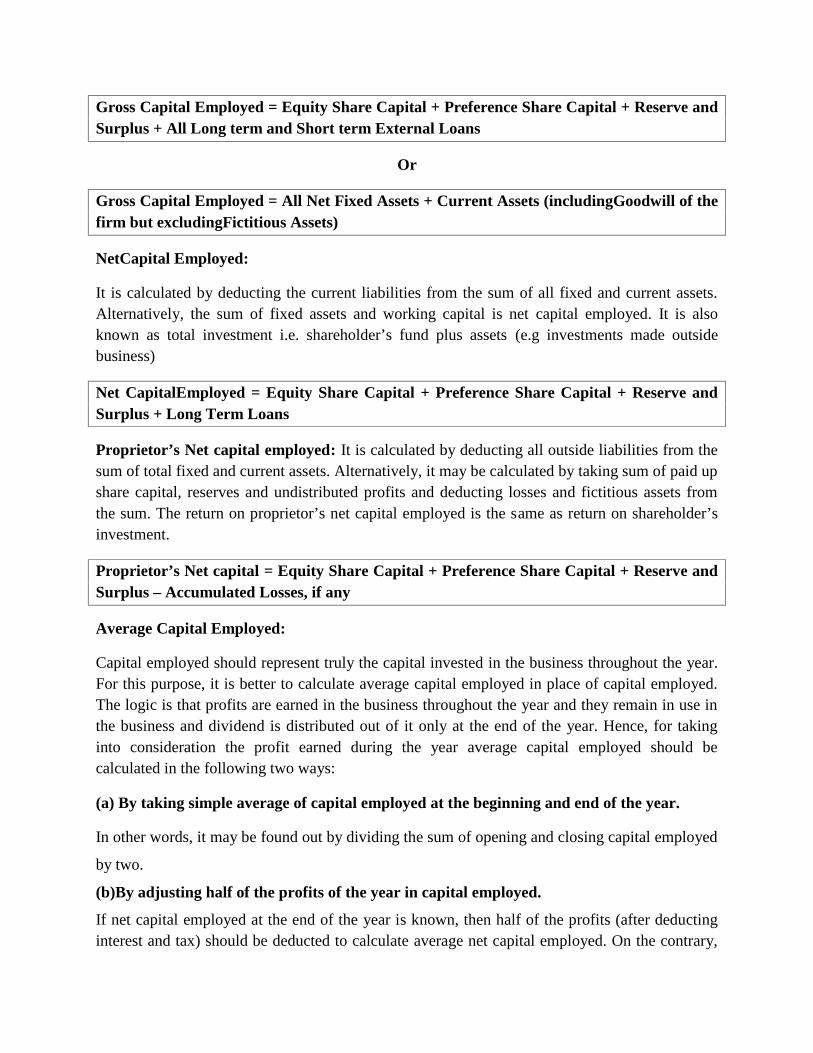
Gross Capital Employed = Equity Share Capital + Preference Share Capital + Reserve andSurplus + All Long term and Short term External Loans
Or
Gross Capital Employed = All Net Fixed Assets + Current Assets (includingGoodwill of thefirm but excludingFictitious Assets)
NetCapital Employed:
It is calculated by deducting the current liabilities from the sum of all fixed and current assets.Alternatively, the sum of fixed assets and working capital is net capital employed. It is alsoknown as total investment i.e. shareholder’s fund plus assets (e.g investments made outsidebusiness)
Net CapitalEmployed = Equity Share Capital + Preference Share Capital + Reserve andSurplus + Long Term Loans
Proprietor’s Net capital employed: It is calculated by deducting all outside liabilities from thesum of total fixed and current assets. Alternatively, it may be calculated by taking sum of paid upshare capital, reserves and undistributed profits and deducting losses and fictitious assets fromthe sum. The return on proprietor’s net capital employed is the same as return on shareholder’sinvestment.
Proprietor’s Net capital = Equity Share Capital + Preference Share Capital + Reserve andSurplus – Accumulated Losses, if any
Average Capital Employed:
Capital employed should represent truly the capital invested in the business throughout the year.For this purpose, it is better to calculate average capital employed in place of capital employed.The logic is that profits are earned in the business throughout the year and they remain in use inthe business and dividend is distributed out of it only at the end of the year. Hence, for takinginto consideration the profit earned during the year average capital employed should becalculated in the following two ways:
(a) By taking simple average of capital employed at the beginning and end of the year.
In other words, it may be found out by dividing the sum of opening and closing capital employed
by two.
(b)By adjusting half of the profits of the year in capital employed.
If net capital employed at the end of the year is known, then half of the profits (after deductinginterest and tax) should be deducted to calculate average net capital employed. On the contrary,

if the net capital employed in the beginning of the year is known then half of the profits earnedduring the year would be added.
Choice of appropriate concept:1. The choice of appropriate concept out of three mentioned above depends upon the purpose ofcomputation of return on capital employed.2. If the purpose is to show proprietor’s (or the shareholders) profit earned, then the concept ofproprietor’s net capital employed should be used.3. But if the purpose is to indicate the effectiveness of the business or to reflect the efficiency ofinternal management, then the use of the concept of gross capital employed is most suitable.4. However, of these two, the concept of net capital employed is preferred.
Adjustment made at the time of computing Capital EmployedThe following adjustments are required in different assets and liabilities which are included incalculation of capital employed.(a) Fixed assets: All fixed assets are included in the calculation of capital employed. There arethree accepted alternatives of valuing fixed assets. Gross value, net value and replacement cost.Out of these, net value basis is generally used but due to inflationary trend in the economy forthe last six decades, the accountants consider replacement cost as an appropriate basis for thevaluation of fixed assets but this would require recomputation of provision for depreciation.
If any fixed asset remains idle due to abnormal or unusual events, such as trade recession, fire orobsolescence or under work, then it should not be included in capital employed. But idlemachines and tools required for normal operation of plant would be included in capitalemployed.
(b)Intangible Assets:These assets such as goodwill, patent, trade mark, copy right etc. are notconsidered in the computation of capital employed but when assets are taken at their historicalcost and payment has been made for acquiring goodwill etc. in that case such intangible assetsshould be included in the computation of capital employed.
(c) Cash in hand and at Bank:Cash, by nature, is an idle asset. Hence, only so much amount ofcash should be included in capital employed which is essential for normal working of thebusiness. If there has been abnormal inflow of cash in to business (such as an issue of fresh issueof shares or sale of fixed assets), then such cash should not be included in the cash computationof capital employed. As cash requirements of a business vary from period to period, it would beappropriate to treat average cash requirement as the normal amount of cash for the purpose ofcomputation of capital employed.
(d) Debtors: Tradedebtors are included in capital employed after deducting the bad debts andprovision to this effect.

(e) Stocks: All type of stocks excluding obsolete and useless stocks are included in capitalemployed. Stock should be valued on proper basis and there must be consistency in respect ofmethod of valuation.
(f)Investments:Considerable difference is found in respect of investment s according to natureand purpose of computation. If the purpose of computing return on capital employed is to assessthe effectiveness of the business and efficiency of the management, then all those investmentsshould be excluded which do not affect managerial efficiency, such as investments outside thebusinessi.e. non-trading investments. In such case income from non-trading investments shouldnot be included in profit. On the contrary, internal investment and trade investments forenhancing of the company should be included in capital employed. If the amount of outsideinvestment is substantial, return on capital employed may be calculated in two ways i.e. One byincluding such investments and the other by excluding such investments.
(g) Fictitious Assets:Fictitiousassets such as preliminary expenses, deferred revenueexpenditures, discount on issue of shares or debentures etc. should always be excluded fromcapital employed.
Meaning of Adjusted Profit
The meaning and definition of profit will differ according to the method of computation andmeaning of capital employed. Profit for this purpose should be determined taking into accountthe following rules:
(a)Profit must match with the capital employed. Hence, if any asset is not included in capitalemployed, income from that asset or loss from its write off should not be included for calculatingprofit for this purpose. For example, if non-trading investments are not included in capitalemployed, income from such investments should not be included in profits. Hence, income fromsuch investments should be deducted from given net profits.Similarly, write off of fictitious assets and intangible assets should be added back to nullify theireffects.
(b)If long-term liabilities are a part of capital employed, interest paid on such loans should beadded back to the profits. Similarly, if return to be calculated on gross capital employed, intereston short term loans should also be added back to the profits because these liabilities also formpart of gross capital employed.
(c)Abnormal and non-recurring losses or gains should not be included in the profits. Hence,appropriate adjustment in net profit should be done to nullify their effect.
(d)If fixed assets are valued at replacement cost, then depreciation charged to profit and lossaccount should be based on their replacement cost.

(e)Profit should match with capital employed with reference to period also. It means that incomeof any previous year or subsequent year should not be included in current year’s profit.
(f)In determining profit, due consideration should be given to all accepted principles andconventions of accounting.
(g)A clear distinction has to be made between revenue expenditure and capital expenditure incalculating profit and a conservative approach should be adopted in the calculation of profit.
(h)Return on capital employed should be calculated on the basis of net profits before tax becauseincome tax is not a business expenses and it has no relationship with profit earning capacity ofthe business and it is paid only after profit is earned.
Illustration 25:
Following are the summarized Profit and Loss Account and Balance Sheet of Lipun Ltd for theyear ended 31st December, 2017.
Profit and Loss Account
Balance Sheet as on 31st Dec. 2018₹
Equity & LiabilitiesEquity Share Capital 4,00,0008% Preference Share Capital 2,00,000
₹ ₹To Opening Stock 1,00,000 By Sales 13,00,000To Purchases 9,00,000 By Closing Stock 2,00,000To Wages 60,000To Freight and Carriage 10,000To Gross Profit 4,30,000
15,00,000 15,00,000To Office and Administrative expenses 1,00,000 By Gross Profit 4,30,000To Selling and Distribution expenses 1,10,000 By Interest on Govt.
Securities12,000
To Interest on debentures 10,000 By Profit on sale ofplant
8,000
To Interest on bank overdraft 5,000To Depreciation 15,000To Loss on sale of machine 10,000To Provision for tax 1,00,000To Net Profit 1,00,000
4,50,000 4,50,000

Reserves 60,000Profit & Loss A/c 40,00010% Debentures 1,00,000Bank Overdraft 50,000Other Current Liabilities 1,50,000Total 10,00,000AssetsLand & Building (Net) 2,50,000Plant & Machinery (Net) 3,00,000Investment in Govt. Securities 1,00,000Stocks 2,00,000Sundry Debtors 1,00,000Cash 40,000Discount on Issue of Shares 10,000Total 10,00,000You are required to calculate:(i) Return on Gross Capital Employed.(ii) Return on Net Capital Employed.Solution:
Calculation of Capital Employed
₹Land and Building 2,50,000Plant and Machinery 3,00,000Stocks 2,00,000Sundry Debtors 1,00,000Cash 40,000
8,90,000
Net Capital Employed = Gross Capital Employed – Current Liabilities
= ₹8,90,000 – ( ₹50,000 + ₹1,50,000)
=₹6,90,000
Calculation of Adjusted Profits
₹Net Profit as per P/L A/C 1,00,000Add: Loss on sale of Machine 10,000Interest on debentures 10,000Provision for tax 1,00,000
2,20,000Less : Interest on Govt. Securities 12,000Less: Profit on sale of plant 8,000Adjusted Profit for Return on Net CapitalEmployed
2,00,000

Note:To find out adjusted profits for return on gross capital employed further ₹5,000 should beadded back to ₹2,00,000 for interest on bank overdraft as current liabilities are included in grosscapital employed.
Return on Gross Capital Employed =Adjusted Net Profits
× 100Gross Capital Employed
=₹2,05,000
× 100 = 23.03%₹8,90,000
Return on Net Capital Employed =Adjusted Net Profits
× 100Net Capital Employed
=₹2,00,000
× 100 = 28.98%₹6,90,000
(Note: Capital employed can also be found as average capital employed by deducting half of theprofits earned for the year.)
1.11 MARKET BASED RATIOS OR RATIOS FOR PROSPECTIVE INVESTORS
Market based Ratios are used by shareholders and investors to evaluate the performance of acompany in the market place. These ratios include:
1. Earnings per Share (EPS)
2. Dividend Payout Ratio (D/P Ratio)
3. Dividend Yield Ratio
4. PriceEarningsRatio (P/E Ratio)
5. Price to Book Value Ratio (P/B Ratio)
1. Earning PerShare (EPS):
The shareholders are interested mainly in capital appreciation of their investment andhigherdividend per share. Both the variables are affected mainly by earnings of the company andthe most suitable way of expressing these earnings is earning per share.It is small variation ofreturn on equity capital. Here, earnings are expressed per share instead of in percentage. Earningper share is calculated by dividing net profits after tax and preference divided by total number ofequity shares.

= Notes:1. Earnings available for Equity Shareholders = Profit after tax-Preference Dividend2. Here, the number of equity shares excludes the shares authorized but not issued, forfeited,cancelled, surrendered or repurchased.Interpretations:1. Earnings per share are a good measure of profitability. Market value of a share is usuallydetermined on the basis of its EPS. Higher the EPS, better it is. EPS of a company may becompared with that of similar companies or companies’ own past.2. The increasing trend of earnings per share increases the possibility of higher cash dividend andcapital bonus and this affects favorably the market value of the share.3. Although earnings per share are the most widely published and used data, it should not bebelieved blindly because of the following reasons.. First, EPS cannot represent the variousfinancial operations of the business. Secondly, comparison of the EPS of different companies canbe distorted by the effect of different accounting procedure relating to stock in trade,depreciation and the like. Therefore, EPS should be examined with other ratios.
2. Dividend Payout Ratio:This is a ratio of dividend per share to earnings per share. It indicates the extent to whichearnings per share have been used for paying dividend and what portion of earnings has beenretained in the business for growth and future uncertainties.
= ×Note: Sometimes we also calculate Retention Ratio =100-Dividend Pay outRatio. It representsthat percentage of earnings which is retained and ploughed back in business.
Interpretations:1. Guidelines for this ratio vary widely. Companies often attempt to pay approximately 50% oftheir earning as dividends.2. If the firm is experiencing a need for funds to support its operation, it might allow thedividends to decline in relation to earnings.3. But if the firm lacks opportunities to use funds generated by retained earnings, it might allowthe dividends to increase in relation to earnings.4. In either case, consistency of dividend payment would be important to investors, so changesshould be gradual

3. Dividend Yield Ratio:Dividend is declared as percentage on paid-up capital. But the return, de facto is more or less,depends upon lower or higher market price of a share respectively. It is this rate which is crucialfrom the point of view of fresh investors in particular who desire dividends as a source ofincome. This is calculated as follows:
= Interpretation: The ratio compares the rate of dividend with the market price of the share. Thisratio is calculated to know the effective return for the owners.
4. Price-Earnings Ratio (P/E Ratio)It is the ratio between market price per equityshare and earning per share. The ratio is calculatedto make an estimate of appreciation in the value of ashare of a company and is widely used byinvestors to decide whether or not tobuy shares in a particular company. It is also called P/Emultiples. Following formula is used to calculate price earnings ratio: = Interpretation:1. This is most widely used ratio in the stock exchange by the investors. This ratio indicates uptohow much the public is ready to pay for future earning prospects of the company.2. A high price-earnings ratio indicates investor’s faith in stability and appreciation of company’searnings.3. This ratio can be used in forecasting market value of the share on a certain future date.Market price per share= PE Ratio × EPS4. The market value of a share is affected by many market factors. Hence, this ratio is used byknowing the position of over- valuation of share.5. Sixteen times earnings multiple is considered appropriate. Hence, if price earning ratio is morethan 16 times, the share may be concluded as overvalued.6. This ratio may also be used to determine capitalization of a share. As this ratio largely dependsupon market factors, it differs from company to company within the same industry and also forthe same company over a period.
5. Price to Book value Ratio (P/B Ratio):The PBV Ratio is the market price per share divided by the book value per share. The marketprice per share is simply the stock price. The book value per share is a firm's assets minus itsliabilities, divided by the total number of shares. =

Notes:The market price per share is simply the stock price. The book value per share is a firm'sassets minus its liabilities, divided by the total number of shares.Interpretation:1. A higher P/B Ratio implies that investors expect management to create more value from agiven set of assets, or else equal (and/or that the market value of the firm's assets is significantlyhigher than their accounting value).2. P/B Ratios do not, however, directly provide any information on the ability of the firm togenerate profits or cash for shareholders.3. This ratio also gives some idea of whether an investor is paying too much for what would beleft if the company went bankrupt immediately.
Illustration- 26The information provided by Jagan Ltd is as follows:Particulars Amount (₹)9% Preference Shares of ₹ 10 eachEquity share ₹ 10 eachProfit after tax 60%DepreciationEquity dividendMarket price per equity share
3,00,0008,00,0002,70,000
60,00020%₹40
You are required to calculate the following.1. The dividend yield on equity shares2. The cover for preference and equity shares3. The earning per share4. The price earnings ratio5. The net cash flow.Solution:
1. Dividend Yield =Dividend per share
Market price per share
Whereas Dividend per share = 20% of₹ 10 = ₹ 2
2.Cover of Preference Dividend =Profit after tax
Preference Dividend
=2
= 0.05 or 5%40

=2,70,000
= 10 times27,000
Cover of Equity Dividend =Earning after Preference Dividend
Equity Dividend
=2,70,000 - 27,000
= 1.52 times1 60,000
3.Earning Per Share (EPS) =Net profit after preference dividend
Number of equity shares
=2,70,000 - 27,000
= ₹3.0480,000
4.Price EarningsRatio =Market price per share
earnings per share
=40
= 13.16 : 13.04
5.Total Cash Flow = N.P after tax + Non cash expenditure
= 2,70,000 + 60, 000 = ₹ 3,30,000
Net cash flow = Total cash flow – Dividend on shares
1.12 DU PONT ANALYSIS
DuPont Analysis is an extended examination of Return on Equity (ROE) of a company. Thisanalysis was developed by the DuPont Corporation in the year 1920. ROE is that it is animportant measure of profitability that only requires two numbers to compute: net income andshareholders' equity. ROE is computed by dividing Net Income with shareholder’s equity(ROE=Net Income/Shareholder’s equity). If this number goes up, it is generally a good sign forthe company as it is showing that the rate of return on the shareholders' equity is rising. The
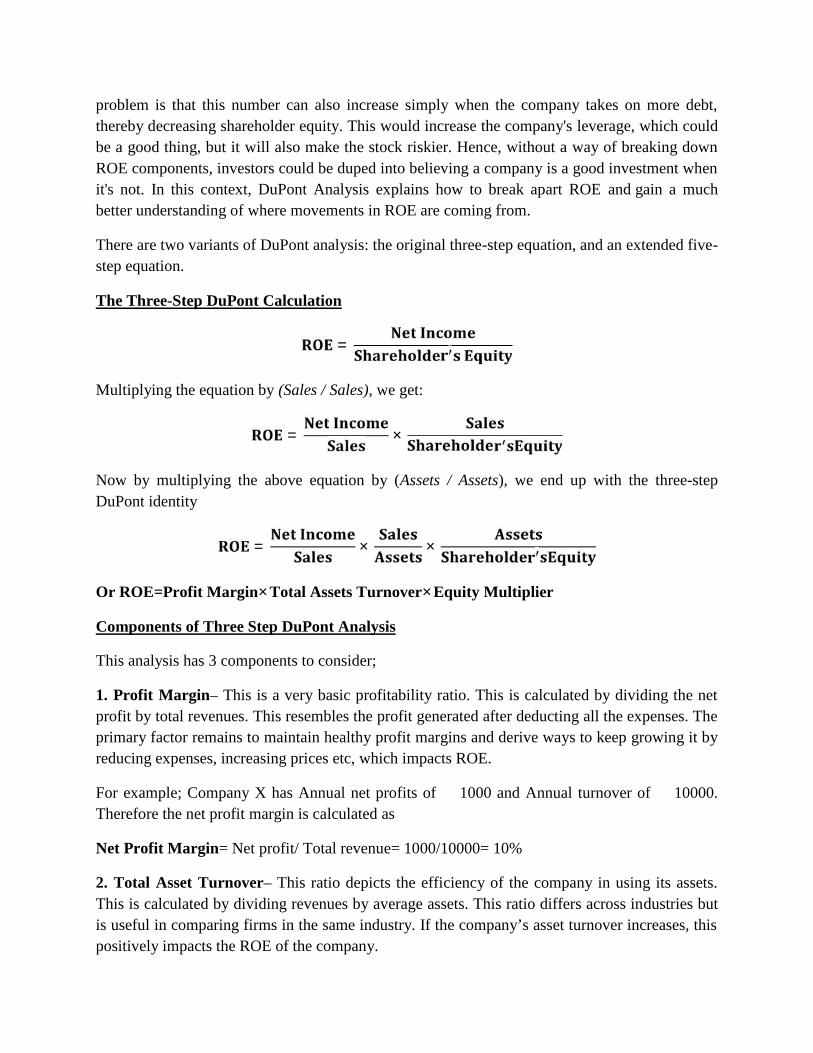
problem is that this number can also increase simply when the company takes on more debt,thereby decreasing shareholder equity. This would increase the company's leverage, which couldbe a good thing, but it will also make the stock riskier. Hence, without a way of breaking downROE components, investors could be duped into believing a company is a good investment whenit's not. In this context, DuPont Analysis explains how to break apart ROE and gain a muchbetter understanding of where movements in ROE are coming from.
There are two variants of DuPont analysis: the original three-step equation, and an extended five-step equation.
The Three-Step DuPont Calculation= Multiplying the equation by (Sales / Sales), we get:
= ×Now by multiplying the above equation by (Assets / Assets), we end up with the three-stepDuPont identity
= × ×Or ROE=Profit Margin× Total Assets Turnover× Equity Multiplier
Components of Three Step DuPont Analysis
This analysis has 3 components to consider;
1. Profit Margin– This is a very basic profitability ratio. This is calculated by dividing the netprofit by total revenues. This resembles the profit generated after deducting all the expenses. Theprimary factor remains to maintain healthy profit margins and derive ways to keep growing it byreducing expenses, increasing prices etc, which impacts ROE.
For example; Company X has Annual net profits of ₹1000 and Annual turnover of ₹10000.Therefore the net profit margin is calculated as
Net Profit Margin= Net profit/ Total revenue= 1000/10000= 10%
2. Total Asset Turnover– This ratio depicts the efficiency of the company in using its assets.This is calculated by dividing revenues by average assets. This ratio differs across industries butis useful in comparing firms in the same industry. If the company’s asset turnover increases, thispositively impacts the ROE of the company.

For example; Company X has revenues of ₹10000 and average assets of ₹200. Hence the assetturnover is as follows
Asset Turnover= Revenues/Average Assets = 1000/200 = 5
3. Equity Multiplier –It is a measure of how much the company is leveraged. This refers to thedebt usage to finance the assets. More the ratio higher is the leverage and vice versa. Thecompanies should strike a balance in the usage of debt. The debt should be used to finance theoperations and growth of the company. However usage of excess leverage to push up the ROEcan turn out to be detrimental for the health of the company.
Interpretation of the DuPont Analysis:
If a company's ROE goes up due to an increase in the net profit margin or asset turnover, this is avery positive sign for the company. However, if the equity multiplier is the source of the rise,and the company was already appropriately leveraged, this is simply making things riskier. If thecompany is getting over-leveraged, the stock might deserve more of a discount despite the rise inROE. The company could be under-leveraged as well. In this case, it could be positive and showthat the company is managing itself better.
Even if a company's ROE has remained unchanged, examination in this way can be very helpful.Suppose a company releases numbers and ROE is unchanged. Examination with DuPont analysiscould show that both net profit margin and asset turnover decreased, two negative signs for thecompany, and the only reason ROE stayed the same was a large increase in leverage. No matterwhat the initial situation of the company, this would be a bad sign.
The Five-Step DuPont Calculation
The five-step, or extended, DuPont equation breaks down net profit margin further. From thethree-step equation we saw that, in general, rises in the net profit margin, asset turnover andleverage will increase ROE. The five-step equation shows that increases in leverage don't alwaysindicate an increase in ROE.
The Five-Step Calculation
Since the numerator of the net profit margin is net income, this can be made into earnings beforetaxes (EBT) by multiplying the three-step equation by 1 minus the company's tax rate:
= × × × ( − )

We can break this down one more time since earnings before taxes is simply earnings beforeinterest and taxes (EBIT) minus the company's interest expense. So, if there is a substitution forthe interest expense, we get:
= ( × − ) × × ( − )ROE= (OPM×AT−IER) × EM × TRR
Where: OPM=Operating profit margin
AT=Asset Turnover Ratio
IER=Interest Expense Rate
EM=Equity Multiplier
TRR=Tax Retention Rate
Interpretation
If the company has a high borrowing cost, its interest expenses on more debt could mute thepositive effects of the leverage. The five-step equation shows that increases in leverage don'talways indicate an increase in ROE.
1.13CONSTRUCTION OF FINANCIAL STATEMENTS FROM RATIOS
Ratios are worked out from financial statements ie, Profit and loss accountand Balance sheet. Ina reverse approach, one can prepare the financialstatements in a concise or summarized formfrom the ratios and additionalinformation. In order to prepare Balance sheet or Profit and Lossaccount, studentsmust have a clear idea regarding the contents of a typical balance sheetandprofit and loss account. Using the given information and ratios students maywork out themissing figures in a logical sequence.
Illustration 27:
From the following data relating to a firm, prepare Balance Sheet of the firm as at 31st Dec,2018:
Particulars ₹Annual Sales 36,00,000Sales to Net Worth 4 timesCurrent Liabilities to Net Worth 50%Total Debts to Net Worth 80%Current Ratio 3:1Sales to Inventory (ITR) 6 times

Average Collection Period 73 daysFixed Assets to Net Worth 30%Solution:
Net Worth:
Sales to Net Worth =Sales
Net Worth
Current Liabilities:
Current Liabilities to Net Worth =Current Liabilities
Net Worth
or,50
=Current Liabilities
100 ₹9,00,000
Long Term Debts:
Total Debts to Net Worth =Total DebtsNet Worth
Long Term Debt = Total Debts – Current Liabilities
= ₹7,20,000 - ₹4,50,000
= ₹2,70,000
or, 4 =₹36,00,000Net Worth
or, Net Worth = ₹9,00,000
or, Current Liabilities = ₹4,50,000
or,80
=Total debts
100 ₹9,00,000
or, Total Debts = ₹7,20,000

Current Assets:
Current Ratio = Current AssetsCurrent Liabilities
Inventory:
Sales to Inventory =Sales
Inventory
Debtors:
Debtors' Turnover Ratio =Debtors
× 365Sales
or, 73 days =Debtors
× 365₹36,00 000
Cash and Bank Balance:
Current Assets= Stock + Debtors + Cash & Bank
Or, ₹13,50,000= ₹6,00,000+₹7,20,000 + Cash & Bank
Or, Cash & Bank= ₹30,000
or, 3 =Current Assets
₹4,50,000
or, Current Assets = ₹13,50,000
or, 6 =₹36,00,000
Inventory
or, Inventory = ₹6,00,000
or, Debtors = ₹7,20,000

Fixed Assets:
Fixed Assets to Net Worth =Fixed AssetsNet Worth
Balance Sheet as on 31st Dec. 2018Particulars ₹Equity & LiabilitiesNet worth 9,00,000Long term Debts 2,70,000Current Liabilities 4,50,000Total 16,20,000AssetsFixed Assets 2,70,000Current Assets:Stock 6,00,000Debtors 7,20,000Cash at Bank 30,000Total 16,20,000
1.14 RATIOS AT A GLANCE
Liquidity and SolvencyAnalysis
Ratio Formulae Comments/Remarks
Current Ratio Current assets/ Current liabilities A ratio of2: 1 (two times current assetsto current liabilities) is consideredsatisfactory as a rule of thumb.
Quick or Acid TestRatio or LiquidityRatio
Quick assets/ Current liabilities 1 : 1 is considered satisfactory
Absolute liquidity (Cash + marketable securities) /(Liquid liabilities or Current
0.5 : 1 is considered standard
or, 30 =Fixed Assets₹9,00,000
or, Fixed Assets = ₹2,70,000

Ratio liabilities)
Stock turnoverRatio
Cost of goods sold/ Averagestock [ cost of goods sold= (sales–GP) or Opening stock+purchases – closing stock) ,Average stock = (Opening stock+ closing stock)/2 ]
No standard rate or norm can bedetermined for this ratio because it isbased more on nature of industry andsale policy of the firm.
Stock velocity (inmonths)
(Average stock/ Cost of goodssold) × 365 days or 12 months or52 weeks
Average age ofinventory
365/ Inventory turnover Ratio(ITR)
The shorter the average age of thefirm’s inventory, more liquid or activeit may be considered.
Debtors TurnoverRatio (DTR)
(Average trade receivables/ netcredit sales ) ×100
Higher the value of debtors turnover,the more efficient is the management ofdebtors.
Average collectionperiod
No of working days / DTR It should not exceed the stated creditperiod on trade terms plus 1/3rd of suchperiod. At high average collectionperiod also implies that chances of baddebts are larger.
Creditors TurnoverRatio
Average accounts payable / Netcredit purchases
Lower the ratio better is the liquidityposition of the firm. Higher creditor’sturnover ratio indicates weakliquidation position.
Creditors Turnoveror velocity
Net credit purchases / Averageaccounts payables
Higher the creditors velocity, better itis. A fall in the ratio shows delay inpayment to creditors.
Debt-Equity Ratioor Debt-worthRatio
External equity / Internal equityor Long-term fund /Shareholder's fund or net worth
1:1 debt equity is consideredsatisfactory. However, in case of a wellestablished concern 2: 1 debt equityratio even more may also be consideredsatisfactory.

Proprietary Ratio Shareholder's fund / Total assetsor Shareholder's fund / Totalequity
Higher the ratio lesser the dependencefor working capital on outside sources,better the long-term solvency, stabilityand greater the protection to thecreditors of the firm.
Solvency Ratio Total borrowed Fund / TotalAssets or 100-Equity Ratio
Higher the ratio, the greater is thedependence of the firm on outsiders.
Fixed assets to networth Ratio orFixed assets toproprietary fund
Fixed assets (after depreciation) /Total long-term fund
This ratio should not exceed 1:1. Onthe contrary, lesser the ratio, better theposition because in such a caseproprietors funds will be available forworking capital need also. Usually, aratio of 0.67: 1 is consideredsatisfactory.
Fixed assets tolong-term fund orFixed assets Ratio
Fixed assets (after depreciation) /Total long-term fund
This ratio should not exceed 1:1. If itexceeds 1:1, it implies that short-termfunds of the firm have also beenapplied for acquiring fixed assets whichis in no way be considered appropriate.
Ratio of currentassets toproprietor’s fund
Current assets/ Proprietor’s fund There is no rule of thumb for this ratio.
Ratio of currentassets to totalliabilities
Current assets/ Total liabilities There is no rule of thumb for this ratio.
Proprietor’sliability Ratio
Proprietor’s fund / Totalliabilities
Higher the ratio better is the security ofthe creditor.
Ratio of tangibleassets to total debts
Tangible assets / Total debt Higher the ratio greater is the securityof the creditor.
Debt service Ratioor InterestCoverage Ratio
Net income (before charginginterest and income tax) / Fixedinterest charges
Higher the ratio better is the position oflong-term creditors. But a too highinterest coverage ratio may mean thatthe firm is not taking adequateadvantage of trading on equity toincrease the earning per share. Eight to

nine times interest cover is consideredas satisfactory for an industrial concern.
Preferencedividend coverageRatio
Net income after interest tax) /Preference dividend
Coverage of 2 is considered asstandard.
Cash to debtservice Ratio orDebt cash flowcoverage Ratio
(Annual cash flow beforeinterest and tax ) / (Interest +SFappropriation / 1 - T
High coverage would be required infirms whose incomes are very instableand the firms whose incomes are stable.
Profitability Analysis
General profitability Ratio
Ratio Formulae Comments/remarks
Gross profit Ratio (Gross profit / Net sales) ×100
Higher the ratio better is. Butthere is no rule of thumb forgross profit ratio.
Operating Ratio (Operating cost / Net sales )×100 [Operating cost = COGS+ operating expenses]
Lower the ratio, higher theprofit left for recouping thenon-operating expenses andhigher the net profit. There isno rule of thumb for this ratioas it may differ from firm tofirm depending upon thenature of its business.However, 75 to 85 percentmay be considered to be asatisfactory rate in case ofmanufacturing concern.
Expenses Ratio (Particular expenses / Netsales) ×100
The lower the ratio, the greaterthe profitability of thebusiness.
Net profit Ratio (Net profit / Net sales) ×100 Higher the ratio better isprofitability of the firm.

Overall profitability analysis
Ratio Formulae Comments/remarks
Return on equity share capital [Net profit (after tax andpreference dividend) / Paid upequity share capital] × 100
There is no rule of thumb forthis ratio. Hence higher theratio better it is. However, thisratio may be compared withthat of similar firms or withthe firm’s own past.
Earnings per share (EPS) [Net profit after tax andpreference dividend / No. ofequity shares
Higher the EPS better it is.
Return on shareholder’sinvestment (or Proprietor’sfund or net worth)
[Net profit (after interest andtax) / Shareholder's fund] ×100
Higher the ratio better are theresults.
Return on total investment (Net profit before interest andtax/ Total asset) × 100
The higher the ratio, thegreater the profitability of thebusiness.
Return on total assets or totalresources
(Profit before interest and tax/Total asset) × 100
Higher the ratio better it is.
Return on capital employed (Profit before tax/ Capitalemployed) × 100
Higher the ratio better it is.
Activity Analysis- Sales Ratios
Ratio Formulae Comments/remarks
Stock turnover Ratio Explained in liquidityanalysis
Debtors Turnover Ratio(DTR) Explained in liquidityanalysis
Creditors Turnover Ratio Explained in liquidity

analysis
Total assets turnover Ratio Net sales (or Cost of sales) /Total assets
2:1 assets turnover ratio isconsidered satisfactory.
Fixed asset turnover Ratio orRatio of sales to fixed asset
Cost of sales (or Net sales) /Fixed assets (net)
Higher the ratio better it is. Inmanufacturing industry 5:1ratio is consideredsatisfactory.
Current asset turnover Ratio Net sales ( or cost of sales) /Current assets
Higher the ratio better it is.
Net tangible asset turnoverRatio
Net sales / Net tangible asset Higher the ratio better it is.But if it is too high it impliesover utilization of firm’sgoodwill. This is called overtrading.
Working capital turnoverRatio
Net sales ( or Cost of sales) /Working capital
A high working capitalturnover ratio shows theefficient utilization of workingcapital. But too high or lowratio indicates over-tradingand under trading respectively.
Capital or Net worth turnoverRatio
Net sales / Share capital or Networth
Higher the ratio better it is. Ahigher ratio indicates moreprofits while low ratio wouldresult low profits. A very highcapital turnover ratio wouldindicate over-trading or undercapitalization.
Capital Structure Analysis or Leverage Ratios
Ratio Formulae Comments/remarks
Capital gearing Ratio or GearRatio
(Fixed cost bearing capital/Variable cost bearing capital)or (Variable cost bearing
Policy of high gearing is veryrisky. In other words, lowerthe gearing, higher the gearing

capital / Fixed cost bearingcapital) or (Fixed cost bearingcapital / equity)
ratio and higher the gearing,lower the gearing ratio.
Debt equity Ratio It is already discussed in long-term solvency.
Ratio of total investments toLong-term liabilities
[Long term fund (Shareholder's fund + Long-termliabilities)] / Long termliabilities
As a general rule theproportion of long-termliabilities should not be veryhigh.
Ratio of fixed asset to fundeddebt
Fixed asset / Fixed debt Higher the ratio of fixed assetsto debentures, the greater willbe the security of debentureholders.
Ratio of reserve to equitycapital
(Revenue reserve / Equitycapital) × 100
Higher the ratio, moreconservative is the dividendpolicy of the management andbetter is the growthpotentiality of the company.
Ratio of current liabilities toproprietor’s funds
Current liabilities /Proprietor’s funds
The norm is 35%.
Ratios for prospective investors
Ratio Formulae Comments/remarks
Earning per share(EPS) Net profit after preferencedividend / Number of equityshares
Higher the ratio, better theperformance and higher thefuture of the company
Book value per share Shareholders fund / Numberof shares
Now this ratio has lost itsimportance
Price EarningsRatio (PER) Market price per share /Earning per share
A high price earnings ratioindicates investor’s faith in thestability and appreciation ofcompany earnings.

Market price per share PER / EPS If price earnings ratio is morethan 16 times, the share maybe concluded as overvalued.
CapitalizationRatio Earning per share/ Marketprice per share
Dividend yield Ratio Dividend per share / Marketprice per share
Dividend payout Ratio (D/PRatio)
(Dividend per share / Earningper share) × 100
Guidelines for this ratio varywidely. Companies oftenattempt to pay approximately50% of their earnings asdividends.
Cover of Preference andEquity Dividends
(Earning after tax / PreferenceDividend ) or (Earning afterPreference Dividend / EquityDividend)
Higher the cover better it is.
1.15 SELF ASSESMENT QUESTIONS:
1. What do you mean by Ratio Analysis? Discuss the advantages and limitations of RatioAnalysis.
2. “Ratio analysis is an important tool for judgment of the health of any organization.” Discuss.
3. What are the factors affecting the efficacy of ratios?
4. Who are the major users of ratio analysis? Explain in detail.
5. “Ratio are indicators-sometimes pointers but not in themselves powerful tools of themanagement.” Explain.
6. What is liquidity ratio? Discuss its significance to a firm.
7. What are the important profitability ratios? How are they calculated?
8. Explain and illustrate any two of the followings:
(a) Debtors turnover Ratio (b) Creditors turnover Ratio (c ) Inventory turnover Ratio
9. Describe any five accounting ratios.

10. Explain which financial ratio will be useful to the following
(a) Potential investor of a company
(b) Company’s own management
11. What are the important Profitability Ratios? How are they worked out? Explain andillustrate?
12. Define Return on capital employed(ROCE)? Discuss different methods of calculating thesame with example?
13. Examine the relationship between Liquidity, Solvency and profitability of a business incontext of ratio analysis?
14.”Ratio analysis is a tool to examine the health of a business with a view to make the financialresults more intelligible.”-Discuss.
15. By applying ratio analysis how would you find out the followings:
(i)Whether the company is able to pay off its maturing obligations?
(ii)Whether the collection system is effective?
(iii)Whether the company is accumulating excess stock?
(iv)Whether the company relies too much on loan?
(v)Whether the profit earning capacity is good?

UNIT-3ABSORPTION COSTING AND MARGINAL COSTING
Chapter Outlines2.0 Learning Objectives2.1 Introduction2.2 Meaning of Marginal Cost2.3 Marginal Costing2.4 Absorption Costing2.5 Special Terms for Marginal Cost
2.5.1 Contribution2.5.2 Cost Volume Profit Analysis2.5.3 Break-Even Point2.5.4 Angle of Incidence2.5.5 Margin of Safety2.5.6 Key or Limiting factor2.5.7 Assumptions underlying CVP Analysis / Break - Even Charts
2.6 Managerial Application of CVP Analysis.2.7 Summary2.8 Key Terms2.9 Questions and Exercises
2.0 LEARNING OBJCTIVESAfter studying this chapter, you should be able to understand: Explain concept of absorption and marginal costing. Distinguish between absorption costing and marginal costing. Explain the managerial application of CVP analysis. Explain the concept of angle of incidence.
2.1 INTRODUCTIONIn cost accounting, cost of production per unit of the goods produced or services provided is
calculated with the help of the various methods such as Unit Costing Method, job costing, Batch Costingcontract Costing or Process Costing. Marginal costing is not a method of calculating the cost ofproduction as the above given methods are but it is a technique applicable to the existing methods to findout the effect on profits if changes are made either in the volume of output or in the type of output. Thusmarginal costing is a technique which helps the management in taking various routine and special orcrucial decisions for running the organisational activities like (i) To continue with a product or not, (ii) Tochange the selling price as per the market conditions, (iii) To change the method of production, (iv) Tomake or buy decision, (v) To decide about sales mix.2.2 MEANING OF MARGINAL COST
(i) According to I.C.M.A. London, marginal cost is defined as “The amount at any given volume ofoutput by which aggregate costs are changed if the volume of output is increased or decreased byone unit. In practice this is measured by the total variable attributable to one unit.” In this context, a‘Unit’ may be single article, a batch of articles, an order, a stage of production capactiy, a man-hour, a process or a department.
(ii) According to Blocker and Weltmore, “Marginal cost is the increase or decrease in the total costwhich result from producing or selling additional unit of a commodity or from a change in themethod of production or distribution.”Marginal cost is the aggregate of variable costs. It is the cost of producing one additional unit. The
marginal cost concept is based on the distinction between fixed and variable costs. Marginal cost is thetotal of variable costs only and fixed costs only and fixed costs are ignored.

So, after analysing the definition we can say that with the increase in one unit of output, the totalcost is increased and this increase in total cost from the existing to the new level is known as ‘MarginalCost’.
For example, for the production of 1,000 units of product, the variable costs per unit is `5 and fixedcosts are `5,000 per annum. If the production is increased by one unit, the marginal cost will be:
Total cost of 1, 000 units:Fixed costs = ` 5,000Variables costs (1, 000 units × 5) = ` 5,0000Total cost = Fixed Costs + Variables Costs
= `5,000 + ` 5,000 = ` 10, 000
Per unit costs =10,000
1,000= `10/-
Total cost of 1,001 units:Fixed costs ` 5,000Variable costs (1, 001 units × 5) `5,005Total costs `10,005Marginal cost = ` 10,005 – ` 10,000 = ` 5Hence, marginal cost is `5. This is the change in total cost due to change in one unit of output.
2.3 MEANING OF MARGINAL COSTINGAccording to the Institute of cost and management accountants, London, Marginal costing is
defined as “The ascertainment of marginal cost and of the effect on profit of changes in volume or type ofoutput by differentiating between fixed costs and variable costs. In this technique of costing only variablecost are charged to operations, processes or products, while the fixed costs are to be written off againstprofits in the period in which they arise.”
Thus, in this context, we can say that marginal costing is a technique which is concerned with thechanges in costs and profits result from changes in volume of output. Marginal costing is also known as‘Variable Costing’.2.4 ABSORPTION COSTING / TOTAL COSTING
Absorption costing is the total cost technique. It is the practice of charging all costs, both variableand fixed, to operations, processes or products. Under absorption costing all costs whether variable orfixed are treated as product cost. Absorption costing is also known as full costing technique.
This method employs highly arbitrary way of apportionment of overheads which reduces thepractical utility of cost data for controlling purposes.Illustration 2.1
The following information relates to a company:Production 40, 000 unitsSales 40, 000 unitsSelling Price ` 30 per unitDirect Material ` 5 per unitDirect Labour `4 per unitOverheads :Variables `3 per unitFixed ` 1,00, 000Calculate net profit under :(a) Absorption Costing Method : (b) Marginal Costing Method.

Solution:Income Statement (Absorption Costing)
Sales Particulars ` `Sale (40,000 units `30) 12,00,000Less : Cost of goods sold :
Direct Material (40,000 × 5) 2,00,000Direct Labour (40,000 × 4) 1,60,000
Overheads :Variable (40,000 × 3) 1,20,000Fixed 1,00,000 5,80,000
Net Profit 6,20,000Income Statement (Marginal Costing)
Particulars ` `Sale (40,000 × `30) 12,00,000Less : Variable Cost :
Direct Material (40,000 × 5) 2,00,000Direct Labour (40,000 × 4) 1,60,000Variable Overheads (40,000 × 3) 1,20,000 4,80,000
Contribution 7,20,000Less : Fixed Cost 1,00,000
Net Profit 6,20,000
Illustration 2.2The following information relates to a company:Production 40,000 unitsSales 30,000 unitsSelling Price `30 per unitDirect Materials ` 5 per unitDirect Labour Rs. 4 per unitFactory Overheads:Variable `3 per unitFixed `1, 00,000Selling and Distribution overheads:Variable `1 per unitFixed ` 45,000
Calculate:(i) Net Profit under Absorption Costing Method.
(ii) Net Profit under Marginal Costing Method.Solution:
Income Statement (Absorption Costing)Sales Particulars ` `
Sale (30,000 × 30) 9,00,000Less : Cost of Sales :
Direct Material (40,000 × 5) 2,00,000Direct Labour (40,000 × 4) 1,60,000
Factory overheads :Fixed 1,00,000Variable (40,000 × 3) 1,20,000
Less : Closing Stock 5,80,00010,000 units
40,000
5,80,000

1,45,0004,35,000
Add : Selling and Distribution Overheads :Fixed 45,000Variable (30,000 × 1) 30,000 5,10,000Net Profit 3,90,000
Note : Closing stock value of Total Cost.Income Statement (Marginal Costing Method)
Particulars ` `Sale (30,000 × 30) 9,00,000Less : Variable Cost :
Direct Material (40,000 × 5) 2,00,000Direct Labour (40,000 × 4) 1,60,000Factory Overheads (40,000 × 3) 1,20,000
Less: Closing Stock4,80,000
10,000 units40,000
4,80,000
1,20,0003,60,000
Add: Selling and Distribution (30,000 × 1) : 30,000 3,90,000Contribution 5,10,000
Less: Fixed Cost:Factory Overheads 1,00,000Selling and Distribution Overheads 45,000 1,45,000
Net Profit 3,65,000Note: Closing stock value of Variable Cost.2.5 SPECIAL TERMS FOR UNDERSTANDING MARGINAL COST
(i) Contribution(ii) Profit Volume Ratio (P/V ratio)(iii) Break Even Analysis(iv) Break Even point (BEP)(v) Break Even Graph(vi) Angle of Incidence(vii) Sales for Desired Profit(viii)Margin of Safety (M/S)
2.5.1 ContributionContribution is the difference between Sales and Variable Cost or marginal cost. In other words,
contribution is defined as the excess of sales over variable cost. Contribution first contributes to fixed costand then to profit. Higher contribution means more profit and lower contribution means less profit. So themanagement of an organisation tries to increase contribution for higher earning.
Contribution can be represented as :
1.Contribution Sales Variable Cost(Marginal Cost)
2. Contribution per unit Selling price per unit Variablecost per unit
3. Contribution Fixed Cost Profit / Loss
or C F P / L
4. Contribution Sales P / V Ratio
For example, if the selling price of a product is R 100 per unit and its variable cost is R 60 per unit,contribution per unit is `40 (`100 – ` 60).

2.5.2 Profit Volume RatioThe profit/volume ratio, also called the ‘contribution ratio’ or ‘marginal ratio’, is defined as the
relationship between contribution and sales. In other words, profit/volume ratio is a ratio of contributionto sales and it can be expressed as under:
Contribution per unitP / V Ratio
Sales per unit
(i)Contribution C
P / V Ratio 100 or 100Sales S
(ii) Sales Variable CostP / V Ratio 100
Sales
(iii)Fixed Cost+Profit F+P
P/V Ratio= ×100 or = ×100Sales S
(iv)Change in profit contribution
P / V Ratio 100Change in sales
(v) P / V Ratio 1 var iable Cost Ratio Example: If selling price of product is ` 100 and the variable cost is `75 per unit, then P/V ratio is :Marginal costing and Break Even Analysis
100 75 25P / V Ratio 100 100 25%
100 100
2.5.3 Cost-Volume-Profit (CVP) Analysis or Break Even AnalysisCVP analysis is the relationship among cost, volume and profit. In CVP analysis, an attempt is
made to measure variations of costs and profit with volume of production. In other words, it is a techniqueof management accounting which determines profit, cost and sale volume at different levels ofproduction. When volume of production increases, cost per unit decreases because fixed cost remainsconstant. Again, with the increase in volume of output there are chances of decrease in cost per unit andincrease in profit per unit. Thus, cost–volume profit analysis helps the management in profit planningbecause we can determine the amount of profits at different levels of activity and the volume of sales toearn desire profit can also be determined. In this regard, Herman C.Heiser rightly said ‘the mostsignificant single factor in profit planning of the average business is the relationship between the volumeof business, costs and profits.”
The study of cost – volume – profit analysis is also known as break-even analysis because break-even analysis refers to the study of relationship between costs, volume and profit at different levels ofproduction or sales.2.5.4 Break-even Point:
Break-even point may be defined as the point of sales volume at which total revenue equals totalcosts. It is the point of no profit, no loss. When the total sales of a business is equal to its total costs, it isknown to break-even point. At this point, contribution is equal to fixed costs. If a business is producingmore than the break-even point there shall be profit to the business organisation otherwise it would suffera loss. The detailed study of Break-even point is known as Break-even Analysis.2.5.5 Break-even Chart: Graphic Method
Break-even chart is a tool of presentation of the information relating to production quantity, salesand profits of a business organisation. With the help of this chart the break-even point can be known aswell as the amount of profit or loss at the various levels of output and margin of safety can be found out.It also provides us the knowledge about the relationship between fixed and variable costs as well as thecontribution and profit-volume(P/V) relationship. Break-even chart shows the relationship between cost,volume and profit. Break-even point is the most important information out of the all above informationand due to this reason, it is known as break-even chart.

Methods of Drawing a Break-even chartFor drawing a break-even chart, one should have information regarding production capacity,
variable costs and fixed costs of a business organisation.Firstly, a table is prepared to know about the fixed cost, total costs and total sales at various levels
of output.First Method (BEP Chart) :(i) Volume of production/output or sales (in units/rupees) is plotted on X-axis (horizontal axis).(ii) Cost and sales revenue are shown in Y-axis (vertically).(iii) On Y-axis, fixed costs are shown first. A parallel line to X-axis
is drawn which means that fixed costs remain constant at eachlevel of input. Total cost line is drawn upward from the startingpoint of fixed cost line. To draw total cost line, the total costspoints are plotted at various levels of output with the help oftable and a line is drawn thereafter joining all these points. Thisline is called total cost line.
(iv) Sales values at various levels of output are plotted and a line isdrawn joining these points. This line is called total revenue line.
(v) The point at which total cost line and total revenue lineintersect each other is called break-even point.
(vi) A perpendicular is drawn, from this point, to X-axis to know the break-even point in units and salesrevenue at break-even point can be known by a perpendicular Y-axis from this point.
(vii) The area on the left of break-even point represent the loss area and on the right of BEP indicates theprofit area.
(viii) The angle between sales or total revenue line and total cost line in profit area is called ‘angle ofincidence’. The wider the angle the greater is the profit and vice-versa.
(ix) Difference between the present sales and Break-even sales on the graph shows the margin of safety.Second Method (BEP Chart) :
In this method, variable costs are shown first and fixed cost lineis drawn parallel and upward to the variable cost line. The fixed costline drawn represents the total cost of various levels of output. Withthe help of this chart, contribution can be known at various levels ofoutput by the differences between total sales (revenue) line andvariable cost line.Third Method (Contribution Chart):
In this method, fixed cost line is drawn parallel to X-axis. Thecontribution line is drawn from the origin point which increases with the increase in the output. Thecontribution line and fixed cost line inter sects each other that points are called break-even point:
2.5.6 Angle of Incidence:The angle formed at the intersection of the total sales curve
and the total cost curve is known as angle of incidence. Bigger theangle of incidence higher will be the profits and smaller the angle ofincidence the lower will be the profits. To improve this anglecontribution should be increased either:
(i) By raising the selling price or(ii) By reducing Variable cost or(iii) By both the way.
Illustration 2.3Plot the following data on a graph and determine break-even point: selling price = ` 20 per unit,
Variable Cost = ` 10 per unit, Fixed Cost ` 20,000.

Output Variable Cost Fixed Expenses Total Cost Total Sales Contribution Pr ofits
in units 10 per unit
0 0 20,000 20,000 0 0 20,000
1,000 10,000 20,000 30,000 20,000 10,000 10,000
2,000 20,000 20,000 40,000 40,000 20,000
3,000 30,000 20,
000 50,000 60,000 30,000 10,000
4,000 40,000 20,000 60,000 80,000 40,000 20,000
5,000 50,000 20,000 70,000 1,00,000 50,000 30,000
First Method
B.E.P. = 2,000 units or `40,000Second Method
B.E.P. = 2,000 units or `40,000Third Method
B.E.P. = 2,000 units or `40,000

Calculation of Break-even point: Algebraic Method1. Break-even Point in units : It can be calculated with the help of following formula:
Fixed CostBreak even po int (in units)
Selling P r ice per unit Variable Cost per unit
Fixed Costor B.E.P.
Contribution per unit
or B.E.P. F C / C
2.Break-even point in terms of money value :Fixed Cost Sales
Break even point (Rupees)Sales Variable Cost
Fixed Cost Salesor B.E.P.
ContributionWith the help of P / V ratio, B.E.P can be calculated as follows :
Fixed CostB.E.P.
P / V Ratio
New Break-even Point :If the selling price of a product changes, contribution will be changed. Asa result, new Break-even point will be as follows:
Fixed Cost(i) New B.E.P. (in units)
New Selling Pr ice Variable Cost
FCor
New Contribution
Fixed Cost(ii) New B.E.P. (Rupees)
New P / V Ratio
Calculation of selling price when Break-even point is shiftedWhen break-even point is shifted, selling price will be calculated in the following manner:
Fixed CostNew Contribution=
New BEP (in units)
Sales=New Contribution+Variable cost
Illustration 2.4From the following information, calculate:(i) BEP (in units)(ii) BEP (in `)Sales of 50,000 units @ `6Variable Costs @ ` 4Total Fixed Costs ` 80,000
Solution:
(i) B.E.P. (in units) =Fixed Costs 80,000
40,000 unitsContribution Per unit 2(6 4)
Contribution = selling price – Variable Costor C = S – V
C = ` 6 – ` 4 = ` 2

(ii) B.E.P. (in Rs) = Fixed Cost Sales
Sales Variable Cost
80,000 (50,000 6) 80,000 3,00,000
(50,000 6) (50,000 4) 3,00,000 2,00,000
80,000 3,00,000
1,00,00
= `2,40,000
or with the help of P/V ratio, BEP is :
BEP (in `) =Fixed Costs
P / V Ratio
Contribution CP / V Ratio 100 100 [C S V]
Sales S
Marginal Costing and Break Even Analysisand C = Selling Price per unit – Variable Cost
= ` 6 – `4 = ` 2
P/V Ratio =2
100 33.33%6
BEP (in `) =Fixed Costs 80,000 100
P / V Ratio 33.33
`2,40,000
2.5.7 Sales for Desired ProfitMarginal Costing technique can be applied for maintaining a desired level of profit. Due to
competition, the price of the products may have to be reduced. The change in sales price affects theprofitability of a concern. Marginal costing helps the management to know how many units have to besold to maintain the desired level of profits. In order to achieve the desired level of profit the requiredsales can be calculated by the following formula:
(a) When total amount of desired profit is given :
Fixed Cost Desired Pr ofit(i) Required sales to earn desired profit (in units)
Contribution per unit
Fixed Cost Desired profit(ii) Required sales to earn desired profit
P / V Ratio
(b) W
hen desired profit per unit is given :
Fixed Cost(i) Sales (in units)
Contribution per unit profit per unit
Fixed Cost(ii) Sales (in Rs) Selling Pr ice Per unit
Contribution per unit Pr ofit per unit
Illustration 2.5Following data are collected from the record of a manufacturing unit of scooter :Selling price of a scooter is ` 32,000Fixed cost of a scooter is ` 2,000Variable cost of a scooter is ` 23,000In the given period 1000 scooters were sold.Calculate break -even point of the company and how many scooters should be sold to earn the same
profit, if company reduces the selling price of scooter by ` 2000 per scooter?Solution:
Total Fixed = ` 2000 × 1000 = ` 20,00,000

Fixed CostBreak even po int
Contribution per unit
20,00,000222.22
9,000 [C= SV=`32,00 `23,000 = `9,000 ] or = 222 Scooters.
The present profit of the company is as follows:Variable cost per scooter `23,000Fixed cost per scooter `2,000Total cost per scooter _________
`25,000Selling price of a scooter is ` 32,000Profit of the company per scooter is `32,000 – ` 25,000 = ` 7,000Total profit is (`7,000 × 1,000) = ` 70,00,000To earn the same profit with a reduced price by ` 2000, the number of scooters can be found out as
follows:New Selling Price = `32,000 – ` 2,000 = ` 30,000Fixed Cost = `20,00,000Described profit = `70,00,000New contribution per unit = `30,000 – ` 23,000
= `7, 000FC Desired profit 20,00,000 70,00,000
SalesCost per unit 7,000
= 1,285.71 or = 1,286 scooters.2.5.8 Margin of Safety:
Margin of safety is the difference between actual sales and sales at break-even point. For example,if actual sales of a company is `10,00,000 and the sales at break-even point is `4,00,000 the differencebetween these two figures `6, 00, 000 (10,00,000 – 4,00,000) is margin of safety. Margin of safety can becalculated by the following formulae:
(i) Margin of safety (in units) Actual sales (in units) sales at B.E.P.(in units)
(ii) Margin of sales(in Rupees) Actual sales(in Rupees) sales at B.E.P.(in Rupees)
Pr ofit(iii) Margin of safety 100
P / V Ratio
(iv) Margin of safety(
Margin of Safety%) 100
Actual Sales
Illustration 2.6The data below relate to a company:
Sales `1,50,000Fixed Cost `45,000Profit `15,000
Calculate:(i) P/V ratio at present(ii) P/V ratio, if selling price is increased by 10%.(iii) P/V ratio, if selling price is decreased by 20%.
Solution:Sales(S) = `1,50,000.Fixed Cost(FC) = ` 45,000Profit(P) = `15,000S – V = FC + P`1,50,000 – V = ` 45,000 + ` 15,000

or V = `1,50,000 – `60,000 = ` 90,000(i) P/V ratio at present is:
Since P/V ratio =C 1,50,000 90,000
100 100S 1,50,000
C S V
= 60,000100 40%
1,50,000
(ii) Calculation of P/V Ratio, if selling price is increased by 10%:
Sales Value = `1,50,000 + ` 1,50,000 × 10
100= ` 1,50,000 + 15,000 = ` 1,65,000
P/V ratio = S V 1,65,000 90,000100 100
S 1,65,000
=75, 000
100 45.45%1, 65, 000
(iii) Calculation of P/V ratio, if selling price is decreased by 20%:In this case, sale value would be ` 1,50,000 – ` 30,000 = ` 1,20,000
P/V Ratio =S V
100S
=1, 20, 000 90, 000 30, 000
100 100 25%1, 20, 000 1, 20, 000
Illustration 2.7Following information is available from the records of a company:
Year Sales (`) Profit/Loss (`)III
5,00,0007,00,000
2,000 (Loss)2,000 (Profit)
Selling price is given ` 100 per unitCalculate:(i) Fixed Cost(ii) Break-even point in units(iii) Sale in units for desired profit of ` 28,000.
Solution:
P/V Ratio =Change in profit / Contribution 4000
100 100 2%Change in Sales 2,00,000
(i) Fixed Cost:S × P/V Ratio = P + FC
I Year: `2
5, 00, 000 FC ( 2, 000)100
` 10,000 = Fc – 2,000FC =` 10,000 + ` 2,000 = ` 12,000
II Year:2
7, 00, 000 FC 2, 000100
` 14,000 = FC + ` 2,000FC = `14,000 – ` 2,000 = `12,000

(ii) B.E.P. =FC 12,000
100P / V Ratio 2
`6,00,000
B.E.P.(in units) =6, 00, 000
6, 000 units100
(iii) Sale of units for a profit of ` 28,000:
Sale =FC DP 12,000 28,000
100P / V Ratio 2
=40, 000
1002
`20,00,000
Sales (in units) =20, 00, 000
20, 000 units100
2.6 MANAGERIAL APPLICATION OF CVP ANALYSIS2.6.1 Fixation of Selling Price:
Fixation of selling price is an important function of management. Under normal circumstances, theprice is fixed to cover the fixed as well as variable cost and to earn the profit. But under othercircumstances, the product may be sold at a price below the total cost. These circumstances may arise dueto stiff competition, trade depression, for accepting additional orders, for exporting, etc. In suchcircumstances, the price should be fixed on the basis of marginal cost in such a manner so as to cover themarginal cost and contribute something towards the fixed costs. In the following circumstancesproduction may be continued even if the selling price is below the marginal cost:
(i) To dispose of surplus stocks.(ii) To eliminate the competitor from the market.(iii) To utilise idle capacity.(iv) To explore new markets.(v) To explore foreign markets in order to earn foreign exchange.(vi) when company deals with perishable products.(vii)when company wants to introduce a new product in the market.(viii) when the labour cannot be retrenched.(ix) when company wants to avoid extra losses by closing down the business.
Illustration 2.8The P/V Ratio of a company is 75%. Marginal cost of the product is `50. Determine the selling
price of the product.Solution:
If selling price is `100Variable cost will be ` 25and contribution is `75Selling price of the product, when the marginal cost is `50, will be:
=100
5025
`200
Assumptions Underlying Break-Even ChartsThere are a number of assumptions which are made while drawing a break-even chart, such as :
(i) All costs can be separated into fixed and variable costs.(ii) Fixed costs remain constant at all levels of activity.
(iii) Variable cost fluctuates directly in proportion to changes in the volume of output.(iv) Selling prices per unit remain constant at all levels of activity.(v) There is no opening or closing stock.
(vi) There will be no change in opening efficiency.

(vii) Product mix remains unchanged or there is only one product.(viii) The volume of output or production is the only factor which influences the cost.Advantages Or Uses of Break-Even Charts
Computation of break-even point or presentation of cost, volume and profit relationship by way ofbreak-even charts has the following advantages:
1. Information provided by the break-even chart is in a simple form and is clearly understandableeven to a layman. The whole idea of the problem is presented at a glance.
2. The break-even chart is very useful to management for taking managerial decisions because thechart studies the relationship of cost, volume and profit at various levels of output. The effects ofchanges in fixed costs and variables costs at various levels of output and that of changes in theselling price on the profits can be depicted very clearly by way of break-even charts.
3. The break-even charts help in knowing and analysing the profitability of different products undervarious circumstances.
4. A break-even chart is very useful for forecasting (the costs and profits), planning and growth.5. The break-even chart is a managerial tool for control of costs as it shows the relative importance of
fixed cost in the total cost of a product.6. Besides determining the break-even point, profits at various levels of output can also be determined
with the help of break-even charts.7. The break-even charts can also be used to study the comparative plant efficiencies of business.
Limitations of Break–Even ChartsDespite many advantages, a break-even chart suffers from the following limitations:
1. A break-even chart is based upon a number of assumptions, discussed above, which may not holdgood under all circumstances. For example, fixed costs do not remain constant after a certain levelof activity; variable costs do not always vary in direct proportion to changes in the volume ofoutput because of the laws of diminishing and increasing returns; selling prices do not remain thesame forever and for all levels of output due to competition and changes in general price level; etc.
2. A break-even chart provides only a limited information. We have to draw a number of charts tostudy the effects of changes in the fixed costs, variable costs and selling prices on the profitability.In such cases, it becomes rather more complicated and difficult to understand.
3. Break-even charts present only cost-volume profit relationships but ignore other importantconsiderations such as the amount of capital investment, marketing problems and governmentpolicies, etc.
4. A break-even chart does not suggest any action or remedies to the management as a tool ofmanagement decisions.
5. More often, a break-even chart presents only a static view of the problem under consideration.2.6.2 Maintaining a Desired Level of Profit
Marginal Costing techniques can be applied for maintaining a desired level of profit. Due tocompetition, the price of the products may have to be reduced. The change in sales price, variable costand product mix affects the profitability of a concern. Marginal costing helps the management to know ofprofit the sales can be ascertained by the following formula;
Sales =Fixed Cost Desired Pr ofit
P / V Ratio
Illustration 2.9The price structure of a cycle made by a company is as follows:
Per Cycle `Materials 600Labour 200Variable overheads 200
1000Fixed overheads 500

Profit 500Selling price 2,000
This is based on the manufacture of one lakh cycles per annum. The company expects that due tocompetition they will have to reduce selling prices, but they want to keep the total profit intact. Howmany cycles will have to be made to get the same amount of profit if:
(a) the selling price is reduced by 10%.(b) the selling price is reduced by 20%.
Solution:Total Fixed Costs = 500 × 1 lakh = 500 lakhsTotal Present Profit = 500 lakhs
Sales =Fixed Cost Desired Pr ofit
Contribution per unit
(a) If selling price is reduced by 10%: UseNew selling price = (2,000 – 10 % of 2,000)
= 2,000 – 200 = ` 1,800
Sales =500 500
1,800 1, 000
=1000
1, 00, 000800
= 1,25,000 Cycles
(b) If selling price is rescued by 20%:New selling price = (2,000 – 20 % of 2,000)
= 2,000 – 400 = `1,600
Sales =500 500
1, 600 1, 000
=1000
1, 00, 000600
= 1,66,667 Cycles
2.6.3 Key or Limiting Factor:A key factor or limiting factor is a factor which limits or puts a restriction on production or sales
and restricts a company from making unlimited profits. Limiting factors may be availability of rawmaterial, labour, sales finance, plant capacity, etc. When contribution and key factors are known, theprofitability of a product can be measured as under:
Profitability =Contribution
Key Factor
For example:(i) When limiting factor is the availability of labour:
Profitability =Contribution
Key Hours
(ii) When limiting factor is raw material:
Profitability =Contribution
Materials in Kg

Illustration 2.10A company is producing two products A and B. The particulars of the company are as follows:
Product A Product B(`per unit) (` per unit)
Sales 75 80Material Cost 15 20Labour Cost 20 15Direct Expense 10 12Variable overheads 10 15Machine Hours used 3 hrs 2 hrsConsumption of material 2 kg 3 kg
Comment on profitability of each product, if both use the same raw material, when:(i) Total sales potential in units is key factor.(ii) Total sales potential in values is key factor.(iii) Raw material is in short supply.(iv) Production Capacity (in terms of machine hrs.) is the key factor.
Solution:Product A Product B(`per unit) (` per unit)
Sales 75 80Marginal CostMaterials 15 20Wages 20 15Direct expense 10 12Variable overheads 10 15Total Marginal Cost 55 62Contribution (Sales – Total marginal cost) 20 18Contribution (per ` of Sales) 20/75 18/80(Contribution/Sales) = ` 0.266 =` 0.225Material consumed contribution per kg of materials 20/2kg 18/3kg
= ` 10 ` 6Contribution per hour 20/3 hrs 18/2 hrs
= `6.6 `9Comments:
(i) When total sales potential in units is limited, product A is more profitable as its contribution perunit is more than that of product B.
(ii) When total sales potential in value is limiting factor, product A is more profitable as it has morecontribution as per sales in rupees than that of product B.
(iii) Product A is more profitable than product B, when raw material is in short supply.(iv) Product B is more profitable that product A, when production capacity in terms of machine hours is
the key factor.2.7 SUMMARY Marginal cost is the aggregate of variable costs. It is the cost of producing one additional unit. Absorption costing is the total cost technique. It is the practice of charging all costs, both variable
and fixed, to operations, processes or products. Contribution is the difference between Sales and Variable Cost or marginal cost. Break-even chart is a tool of presentation of the information relating to production quantity, sales
and profits of a business organisation. The angle formed at the intersection of the total sales curve and the total cost curve is known as
angle of incidence.

Marginal Costing techniques can be applied for maintaining a desired level of profit. Fixation of selling price is an important function of management. Under normal circumstances,
the price is fixed to cover the fixed as well as variable cost and to earn the profit.2.8 KEY TERMS
Marginal cost -Marginal cost is the aggregate of variable costs.Marginal costing- marginal costing is a technique which is concerned with the changes in costs and
profits result from changes in volume of output.Absorption Costing- Absorption costing is the total cost technique. It is the practice of charging all
costs, both variable and fixed, to operations, processes or products.Higher contribution- Higher contribution means more profitBreak-even Analysis- In CVP analysis, an attempt is made to measure variations of costs and profit
with volume of production.Break-even point- Break-even point may be as the point of sales volume at which total revenue
equals total costs.2.9 QUESTIONS AND EXERCISES1. What is ‘cost and profit’? Bring out its importance.2. ‘Profit-Volume analysis’ is a technique of analysing the costs and profits at various ‘level of
volume’. Explain how such analysis helps management.3. (a) Your boss is looking over a Break-even Chart which you have constructed to portray the cost
volume profit relationship of proposed plan of operations. He comments ‘The chart only tellsme more we sell more profits we make’. What is your reply?
(b) What are the limitations of a break even chart.
4. Explain the technique of marginal costing and state its importance in decision-making.
5. (a) State distinction between Marginal Costing and Absorption Costing as regards valuation offinished goods inventories.
(b) State the circumstances in which ‘contribution approach to price is most suitable’. If thisapproach is adopted, what are the special items of cost or revenue that have to be consideredwhen quotation for an export order is made ?
6. (a) What benefits are gained from Marginal Costing ? Are there any pitfalls in the application ofMarginal Costing ? Discuss these matters critically.
(b) Give a brief account of practical application of marginal costing which you consider soundfrom a policy point of view.
7. What is Break-even Analysis ? Discuss its assumptions and uses.
8. State the implications of selling the product of a multiple firm at a price less than the marginal cost.When would you advocate selling below the marginal cost ?
9. ‘Cost-Volume-Profit’ relationship provides the management with a simplified framework for anorganization which is thinking on a number of its problems. Discuss.
10. ‘The proper treatment of fixed costs presents a problem in full cost pricing’. Explain this statement.Give suitable illustrations.
11. Explain with suitable illustrations the following statements:
(a) ‘In the very long run all costs are differential’.(b) ‘In the long run profit calculated under absorption costing will be the same as that under
variable costing’.12. State four different methods of finding out the break-even point graphically.
13. Explain how semi-variable costs could be split into fixed and variable costs.
14. What is meant by differential cost? Explain the practical utility of differential cost analysis.

15. What is meant by break-even analysis? Explain the important assumptions and practicalsignificance of break-even analysis.
16. What are the uses of break-even analysis and direct costing?
17. Mention the types of problems which a Management Accountant can expect to solve with break-even analysis.
18. ‘Marginal Costing is an administrative tool for the management to achieve higher profits andefficient operation’. Discuss.
19. Explain under what circumstances marginal costing plays important role in price fixation ?
20. Explain how marginal costing technique is useful in day-to-day decision making.
21. What are the cheif advantages of break-even analysis ? Outline the assumptions behind thisanalysis.
22. Write briefly about Cost-Volume-Profit Analysis’.23. Examine the concept of ‘Margin of Safety’ and give its uses for decision-making.
24. Explain the concept of BEP and CVP. Explain as to how are they useful for the managers for theirdecision-making.
25. What are the limitations of marginal costing? Explain.
26. Distinguish between Marginal Costing and Total Costing techniques of cost Analysis. How are theProfit Statements under the two techniques Present ?
27. Mention any four important factors to be considered in Marginal Costing Decisions.
28. Discuss the relationship between Angle of Incidence, Break-even and Margin of Safety.
UNIT 4BUDGETARY CONTROL
Chapter Outlines
5.0 Learning Objectives5.1 Introduction5.2 Meaning of Budget
5.2.1 Meaning of Budgetary Control5.2.2 Budgetary Control as a Management Tool5.2.3 Limitations of Budgetary Control5.2.4 Forecasts and Budgets.
5.3. Budgetary Control System5.3.1 Installation of Budgetary Control System.5.3.2 Kinds of Budgets.5.3.3 Functional Budgets.5.3.4 Flexibility Budgets5.3.5 Period Budgets5.3.6 Condition Budgets
5.4 Zero-Base Budgeting Strategy5.5 Balanced Scorecard5.6 Summary5.7 Key Terms5.8 Questions and Exercises
5.0. LEARNING OBJECTIVESAfter studying this chapter, you should be able to understand: Explain Budget, Budgeting. Explain Budgetary control and distinguish between Budget and forecast. Explain precautions in Budgeting. Explain the advantages of Budgetary control. Explain kinds of Budgets. Explain the advantages and disadvantages of zero-Base Budgeting.
5.1 INTRODUCTIONBudgetary Control is an important tool for the management to make optimum use of limited businessresources and to maximize the profits of business. In order to maximize the profits of business effectivecontrol on cost is must. In budgetary control, plans are made in advance for various business activitieslike purchases, sales and productions, etc. These plans are termed as budget and the actual results arecompared with the budgets and the variance are discussed and analyzed.5.2 MEANING OF BUDGET“ Budget is a financial and/or quantitative statement, prepared prior to defined period of time , of thepolicy to be pursued during that period for the propose of attaining a given objective . It may includeincome, expenditure and the employment of capital.” -I.C.M.A London5.2.1 Meaning of Budgetary Control:-
(i) “Budgetary control is the establishment of budgets relating to the responsibilities ofexecutives to the requirement of a policy and continuous comparison of actual with budgetresults, either to secure by individual action of objectives of that policy to provide a solidbasis for its revision.”
(ii) “Budgetary control is the planning in advance of the various functions of a business so thatthe business as a whole can be controlled.” -Wheldon

5.2.2 Budgetary Control as a Management Tool• Advantages of Budgetary Control
(i) Definite Objectives: Under budgetary control, every department is given a target to beachieved. The efforts are made to achieve the specific aims.
(ii) Reduction in Cost of Production: In budgetary control, the various departments prepare thebudgets and this results in reduction in cost of production. Moreover, every businessmen tries toreduce the cost of production and opts for more profitable combinations of products.
(iii) Coordination: The working of different departments is properly coordinated and a 'MasterBudget is prepared for effective coordination and cooperation among various departments of theorganisation.
(iv) Maximum Profits: Under budgetary control, the resources are utilised efficiently in anorganisation as each person is aware of his task and the best way by which it is to beperformed,
(v) Reduces Uncertainty: Under budgetary control, the managers are forced to map out futurecourses of action clearly. Thus, uncertainty is reduced to minimum.
(vi) Determining Weaknesses: The deviations in budgeted and actual performance will enable thedetermination of weak spots. By pin-pointing responsibility for inefficient performance, budgetarycontrol helps managers trace weak spots early and take remedial steps.
(vii) Economy: The planning of expenditure will be systematic and there will be economy inspending. The resources are used to the best advantage. The benefits derived for the enterprise willultimately extend to industry and then to national economy.
(viii) Adoption of Standard Costing: The use of performance standards in financial matters andoperational activities help the adoption of standard costing.
(ix) Optimum use of Resources: The resources of the organisation are used to the bestadvantage as the objectives are clear and each level of management is aware of its task. Itdirects enterprise activity towards maximisation of efficiency, productivity and profitability.
(x) Effective Control: It is a very important tool for effective control because under it the actualperformance is compared with the budgets and remedial steps are taken in case of deviation, if any.
(xi) Successful Planning: Budgets are based on plans and all the departmental managers areinformed about the expectations from them. The extent of expenditure that they can incur is [aiddown in the budget alongwith the expected profits of their department. The departmental managersmake their utmost effort to achieve the target and thus much help is obtained in the success of theplans.
(xii) Inculcates the feeling cost consciousness: Budgetary control inculcates the feeling of costconsciousness among workers. Thus, it increases productivity and operating economy.
(xiii) Introduction of Incentive schemes: Budgetary control system also enables the introduction ofincentives schemes of remuneration. The comparison of budgeted and actual performance willenable the use of such schemes. Thus, efficient workers become more efficient andinefficient workers start becoming efficient.
Thus it can be said that "Budgetary control improves planning, aids in coordination and helps in havingcomprehensive control.5.2.3 Limitations of Budgetary ControlTo maximise the profit of the business and industry budgeting control is an important managerial technique butthe technique of the budgetary control has following limitations:
(i) Based on Estimates: Budgets are based on estimates regarding an event the success ofbudget depends upon experience and estimates. Thus, these estimates cause the failure ofbudgetary control system.
(ii) Co-operation: The success of the budgetary control system depends upon the co-operationand co-ordination among the various levels of the management. The lack of co-ordination andco-operation at the operating level results into failure of budgetary control.

(iii) Time Effect: The world is changing everyday like change in price, change in demand, changein government policies, create problems in achieving the budgetary targets. So, budget needsrevision for their success but this revision is a very costly affair.
(iv) Excessive Cost of Budgetary System: To apply and implement budgetary control systemsuccessfully needs heavy expenditure, which may not be possible for small scale organisations.
(v) Internal Disputes: Each and every departmental head wants more and more financial outlay fortheir respective departments which becomes a cause of contention (dispute) among the variousdepartments of the organisation.
(vi) Opposition of Budgets: Employees and Managerial personnel are of the view that budgetarycontrol will reveal their efficiency and inefficiency at the various levels and hence because offear of inefficiency they oppose the implementation of budgetary control system.
(vii) Pressure Devices: Budgets are perceived by the work force as pressure devices imposed by topmanagement. This can have an adverse effect on labour relations.
(viii) Success Depends Upon the Support of Top Management: If the top management is dynamicand enthusiastic then it will bring success to the budgetary control. On the other hand, if the topmanagement is dull and lethargic then the system will collapse.
5.2.4 Difference between Budget and Forecast
Basis Budget ForecastConcept It relates to planned events and is the
quantitative expression of business plans andpolicies for the future.
It is the estimate or inference aboutthe future probable events whichmay or may not be accurate.
Controldevice
It is an important control device for themanagement.
It represents a probable event overwhich no control can be exercised.
Provisionforcorrection
The difference between actualperformance and budgeted performance can befound out under budgetary control and necessarysteps taken to rectify the deficiencies, if any.
Here, there is no such provision-
Period It is prepared separately for eachaccounting period.
It may covers a long period.
Sequence Budgeting begins where forecasting ends. Forecasting provides a logical basisfor preparing budgets.
Scope Budgets have limited scope. It can be made ofphenomenon capable of being
expressed quantitatively.
Forecasts are wider in scope and itcan be made in those spheres alsowhere budgets cannot interfere
5.3 BUDGETARY CONTROL SYSTEM5.3.1 Precautions in Budgeting/Budget Administration/Essentials/Installation of Budgetary
Control systemFor the successful implementation of the budgetary control system, the following steps should be
considered:(i) Objectives and Policy of Business: The budget is prepared for the achievement of the business
objectives. Therefore, the objectives of the business should be clear. Business policy is made to attainthe business objectives.
(ii) Budget Period: Budget period refers to the period of time for which the budget is prepared. Thebudget period depends on the various factors such as nature of business, timing of availability offinance, period required for manufacturing the products, etc. Generally there are two types of budget -short term and long term budgets, cash budget, sales budget, income and expenditure budget are shortterm budgets whereas capital expenditure budget, research and development budget are long termbudget.
(iii) Budget Committee: Budget committee will have the managers of various departments likeproduction, marketing, sales, finance, etc. The managers of each department prepare budgets for theirown department and submit it to the committee. The main functions of this committee are as follows:
(a) To provide previous years data to departmental managers for making budgets,
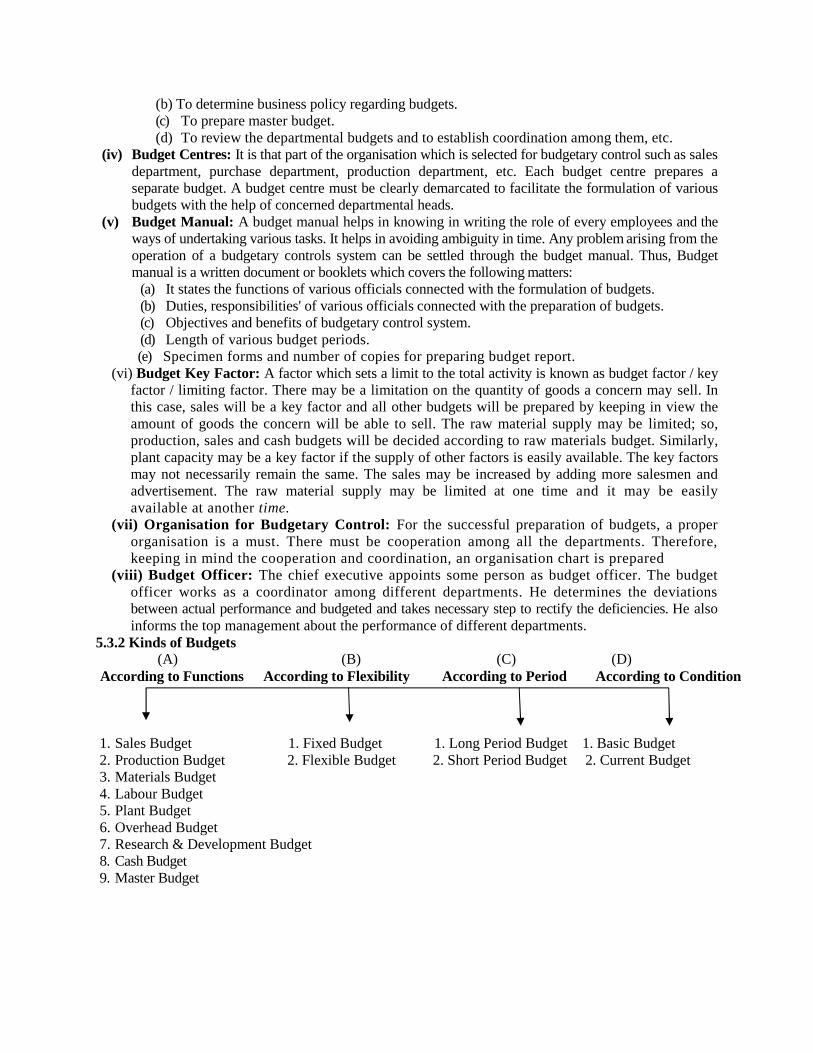
(b) To determine business policy regarding budgets.(c) To prepare master budget.(d) To review the departmental budgets and to establish coordination among them, etc.
(iv) Budget Centres: It is that part of the organisation which is selected for budgetary control such as salesdepartment, purchase department, production department, etc. Each budget centre prepares aseparate budget. A budget centre must be clearly demarcated to facilitate the formulation of variousbudgets with the help of concerned departmental heads.
(v) Budget Manual: A budget manual helps in knowing in writing the role of every employees and theways of undertaking various tasks. It helps in avoiding ambiguity in time. Any problem arising from theoperation of a budgetary controls system can be settled through the budget manual. Thus, Budgetmanual is a written document or booklets which covers the following matters:
(a) It states the functions of various officials connected with the formulation of budgets.(b) Duties, responsibilities' of various officials connected with the preparation of budgets.(c) Objectives and benefits of budgetary control system.(d) Length of various budget periods.(e) Specimen forms and number of copies for preparing budget report.
(vi) Budget Key Factor: A factor which sets a limit to the total activity is known as budget factor / keyfactor / limiting factor. There may be a limitation on the quantity of goods a concern may sell. Inthis case, sales will be a key factor and all other budgets will be prepared by keeping in view theamount of goods the concern will be able to sell. The raw material supply may be limited; so,production, sales and cash budgets will be decided according to raw materials budget. Similarly,plant capacity may be a key factor if the supply of other factors is easily available. The key factorsmay not necessarily remain the same. The sales may be increased by adding more salesmen andadvertisement. The raw material supply may be limited at one time and it may be easilyavailable at another time.
(vii) Organisation for Budgetary Control: For the successful preparation of budgets, a properorganisation is a must. There must be cooperation among all the departments. Therefore,keeping in mind the cooperation and coordination, an organisation chart is prepared
(viii) Budget Officer: The chief executive appoints some person as budget officer. The budgetofficer works as a coordinator among different departments. He determines the deviationsbetween actual performance and budgeted and takes necessary step to rectify the deficiencies. He alsoinforms the top management about the performance of different departments.
5.3.2 Kinds of Budgets(A) (B) (C) (D)
According to Functions According to Flexibility According to Period According to Condition
1. Sales Budget 1. Fixed Budget 1. Long Period Budget 1. Basic Budget2. Production Budget 2. Flexible Budget 2. Short Period Budget 2. Current Budget3. Materials Budget4. Labour Budget5. Plant Budget6. Overhead Budget7. Research & Development Budget8. Cash Budget9. Master Budget

5.3.3 Functional BudgetsAccording to Functions(1) Sales Budget: A sales budget is an estimate of expected sales during a budget period. It is
the most important budget and it is called the backbone of the enterprise. A sales budgetis the starting point on which other budgets are based.In sales, budget expected sales are expressed in quantity as well as in value. A salesmanger is made responsible for preparing sales budget. The following factors should betaken into account while preparing a sales budget:(i) Past sales figures and facts; (ii) Availability of raw materials; (iii) Seasonalfluctuations; (iv) Plant capacity; (v) State of competition in the market; (vi) Availability offinance; (vii) Government policy; (viii) Selling price and quality of the products ofcompetitors; (ix) Development of market.
The following informations can be obtained with the help of sales budget:(i) Sales target; (ii)Possibility of sales in different areas; (iii) What efforts should be made for
increasing sales in new areas? (iv) How much amount is required to increase the sales?Illustration 5.1
A company manufactures two types of products A and B and sells them in the markets of Ambala andPanchkula. The following information is made available for the current year:
Market Budgeted Sales Actual SalesAmbala : A 400 units at ` 9 each 500 units at ` 9 each
: B 300 units at`21 each 200 units at ` 21 eachPanchkula : A 600 units at ` 9 each 700 units at ` 9 each
: B 500 units at `21 each 400 units at ` 21 eachMarket studies reveal that product A is popular as it is under priced. It is observed that if its price
is increased by 11 it will get a ready market. On the other hand, product B is overpriced and market couldabsorb more sales if its selling price is reduced to `20. The management has agreed to give effect to theabove price changes.
On the above basis, the following estimates have been prepared by sales manager:Percentage increase in Sales over Current Budget
Product Ambala PanchkulaA + 10% + 5%B + 20% + 10%
With the help of an intensive advertisement campaign, the following additional sales above theestimated sales:
Product Ambala PanchkulaA 60 units 70 unitsB 40 units 50 units
You are required to prepare a budget for sales incorporating the above estimates.Solution:
Sales BudgetMarket Product Budget for Current Period Actual Sales Budget for Future
Qn. Price(`) Value (`) Qn. Price(`) Value(`) Qn. Price(`) Value(`)Ambala A
BTotal
400300
921
3.6006,300
500200
921
4,5004,200
500
400
1020
5,0008,000
700 — 9,900 700 — 8,700 900 — 13.000Panchkula A B 600
5009
215,40010,500
700400
921
6,3008,400
700600
1020
7,00012,000
Total 1,100 15,900 — 14,700 1,300 19,000

Budgeted Sales for the future has been calculated as under:Ambala Panchkula
Product A Product B Product A Product B400 600 500
(10% of 400) 40440
60500
(20% of 300) 6036040
400
(5% of 600) 30630
70700
(10% of 500) 50550
50600
(2) Production Budget: Production budget is a forecast of production and cost of production for abudget period. A production manager is made responsible for preparing production budget. Aproduction budget is prepared on the basis of sales budget. The sales budget presents demandwhile the production budget makes adequate arrangements for the fulfilment of this demand.The object of this budget is to manufacture the product at the minimum cost. A proper productionplanning is essential for preparing the production budget.
The following factors should be taken into account while preparing production budget:(i) The optimum plant capacity utilization(ii) Avoidance of bottlenecks due to shortage of materials and labour(iii) Key factors(iv) Quantity of different products(v) Opening stock, closing stock and estimated sales(vi) Availability of physical resources
Example of Production Budget is as follows:Production Budget
Stock on 31st Dec. 2014
Add: Budgeted Sales
Estimated Stock on 1st Jan.,2014 Production requirement
Products
AUnits
BUnits
CUnits
5,00050,000
10,00060,000
15,00070,000
55,0004,000
70,0006,000
85,0008,000
51,000 64,000 77,000Illustration 5.2
From the following data, prepare a Production Budget for a company: Stocks for the budget period:Product as on 1st January 2014 as on 30th June 2014A 8000 10,000B 9000 8,000C 10,000 14,000
Requirement to fulfill sales programme:A 60,000 unitsB 50,000 unitsC 80,000 units

Solution:Production Budget
ProductsA
UnitsB
UnitsC
Units
SalesAdd: Stock on 30th June, 2014
60,00010,000
50,0008,000
80,00014,000
Less: Stock on 1st January, 201470,000
8,00058,0009,000
94,00010,000
Production requirement 62,000 49,000 84,000
(3) Materials Budget: Material budget is prepared for determining the requirement of raw materialfor production. This budget depends upon sales and production budget. The materials arepurchased as per the requirements of production department. The number of units to be producedmultiplied by the rate of consumption of raw materials will give the figure of materials required.The units of materials required multiplied by the rate per unit of raw material will give a figure ofmaterial cost.
Total material required = (Quantity of material required per unit)(Budgeted output)Material cost = (Units of material required) (Rate per unit of Raw material)The raw materials budget will enable the fixation of minimum stock level, maximum level and re-
ordering level.(4) Labour Budget: The labour required for manufacturing the product is known as direct labour and
the labour which cannot be specified with production is called indirect labour. Labour budget isprepared for making possible the continuous availability of labour for attaining the productiontargets. This budget is useful for anticipating labour time required for production.Labour Cost is determined as under:Labour Cost = Labour hours Rate of pay per hourLabour budget provides the following information:(i) Number and types of workers required,(ii) Rate of remuneration payable to the workers of different categories and availability of them.
(iii) Time and cost of training to be provided to the labourers.(iv) The number of workers to be required more in the year.
(5) Plant Budget: In big enterprises where plants are valuable and most of the production is carriedout with the help of machinery, preparation of plant budget becomes essential. Plant budgetprovides the following informations:
(i) Department wise the number of machines.(ii) Original cost, depreciation and current value of machineries.(iii) Work for which each machine is to be used.(iv) Need to purchase new machines and amount required thereof.(v) Production capacity of machines.(vi) Remaining life of machines, etc.
(6) Overheads Budget: Overheads budget is prepared for the estimation of indirectexpenses related to production, i.e., indirect material, indirect labour and other indirect expenses.This budget is classified into following parts:
(i) Factory overheads Budget(ii) Financial overheads Budget(iii) Sales overheads Budget(iv) Administrative Overheads Budget
(7) Research and Development Budget: It is a long term budget. It is prepared for theexpansion of business and to adopt new techniques of production. In this budget, the

estimates are made for expenses on current research programmes. Development starts whereresearch ends and development ends where actual production commences. Thus, developmentis the stage between research and actual production.
(8) Cash Budget: Cash budget is a statement of estimates of cash position for the budget period.It is a plan of estimated receipts and payments of cash for the budget period. It can beprepared for any time period. Normal time period of cash budget is half year which isfurther sub-divided into the months. It helps in planning and control of the financialrequirements of the organisation. Cash budget ensures that cash is available in time for carryingout business activities and meeting financial obligations. If there is any shortage of cash, thentime by arrangements can be profitability used in temporary investments. In cash budget,estimate regarding each item of cash receipt and payment is made at the time of its preparation.Cash-receipts items: Cash sales, credit sales having regard to credit collection policy, interest,dividend, the amount received on shares and debentures, bank loan, the amount of taxrefund, rent receivable, etc.Cash-payments items: Cash purchase of raw materials, payment made to suppliers of creditpurchases of raw materials, wages, salaries, manufacturing expenses, administrativeexpenses, selling and distribution expenses, research and development expenses, repaymentof bank loans and public deposits, redemption of preference shares and debentures, paymentof taxes, interest and dividends.
•Importance of Cash BudgetThe importance of preparing a cash-budget are as follows:
1. It serves as a device for planning and controlling of receipts and payments of cash to ensureavailability of cash in an adequate amount.
2. It enables the management to prepare borrowing and repayment schedule will in advance.3. It enables the management to take advantages of cash discount.4. It enables the management to plan for financing a new project and expansion modernization of
an existing project.5. It enables the management to plan for dividend payment.
•Methods of Preparation of Cash Budget(I) Receipt and Payment Method(II) Adjusted Profit and Loss Account Method(III) Projected Balance Sheet Method
(I) Receipt and Payment Method: In this method, estimated cash receipts and payments are taken intoconsideration. Cash receipts and cash-payment items we have discussed earlier.
Illustration 5.3Prepare a cash budget for the month of May, June and July 2014 on the basis of the following
information:(1) Income and Expenditure Forecasts:
Months CreditSales(`)
CreditPurchases
(`)
Wages(`)
Manufac-turing
Expenses(`)
OfficeExpenses
(`)
SellingExpenses
(`)
March 60,000 36,000 9,000 4,000 2,000 4,000April 62,000 38,000 8,000 3,000 1,500 5,000
May 64,000 33,000 10,000 4,500 2,500 4,500June 58,000 35,000 8,500 3,500 2,000 3,500July 56,000 39,000 9,500 4,000 1,000 4,500August 60,000 34,000 8,000 3,000 1,500 4,500
(2) Cash balance on 1st May, 2014 `8,000.(3) Plant costing `16,000 is due for delivery in July and payable 10% on delivery and the
balance after 3 months.

(4) Advance tax `8,000 each is payable in March and June.(5) Period of credit allowed (i) by supplier - two months and (ii) to customers-one month.(6) Lag in payment of manufacturing expenses – ½ month.(7) Lag in payment of office and selling expenses - one month.
Solution:
Cash BudgetParticulars May 2014
(`)June 2014
(`)July 2014
(`)Opening Balance 8,000 13,750 12,250Add: Receipts
Credit Sales 62,000 64,000 58,000
70,000 77,750 70,250
Less: PaymentCredit Purchase 36,000 38,000 33,000Wages 10,000 8,500 9,500Manufacturing Expenses 3,750 4,000 3,750Office Expenses 1,500 2,500 2,000Selling Expenses 5,000 4,500 3,500Plant - Payment on delivery — — 1,600Advance Tax — 8,000
Total 56,250 65,500 53,350Closing Balance 13,750 12,250 16,900
Working Notes:
(i) Since the period of credit allowed by suppliers is two months, the payment for creditpurchases in March will be made in May and so on.
(ii) Since the period of credit allowed to customers is one month, the receipt for credit sales in Aprilwill be in May and so on.
(iii) One half of the manufacturing expenses of April and one half of May will be paid in May, i.e.,(1/2 of ` 3,000) + (1/2 of `4,500) = `3,750 and so on.
(iv) Office and selling expenses of April shall be paid in May and so on.(v) Opening balance of cash for the month of June has been ascertained after finding out closing
balance of May and for July after closing balance of June.(ii) Adjusted Profit and Loss Method: In this method, the cash balance and net profit
disclosed by Profit and Loss Account and Balance Sheet does not represent the fair amount ofcash, since some such items take place in Profit and Loss Account which do not affect the outflowand inflow of the cash. Therefore, all such non-cash items are to be adjusted just to get the correctestimate of real cash. The formula for calculating closing cash balance is given below:Opening Cash Balance + Net Profit + Non - Cash expenses + Decrease in Current Assets+Increase in Current Liabilities + Sales of Fixed Assets of Issue of Shares and Debentures -Increase in Current Assets - Decrease in Current Liabilities - Payment of Tax and Dividend-Purchase of Fixed assets – Redemption of Shares and debentures etc. = Closing Cash Balance.
(iii) Balance Sheet Method: Under this method, a forecasted or budgeted balance sheet is preparedat the end of the budget period. In this method, all assets and liabilities (except Cash and BankBalance) are shown. If the amount of budgeted liabilities exceeds the budgeted assets, thedifference will be cash or bank balance at the end of budget period. If the amount of budgetedassets are in excess of liabilities, the difference will be bank overdraft .
Illustration 5.4
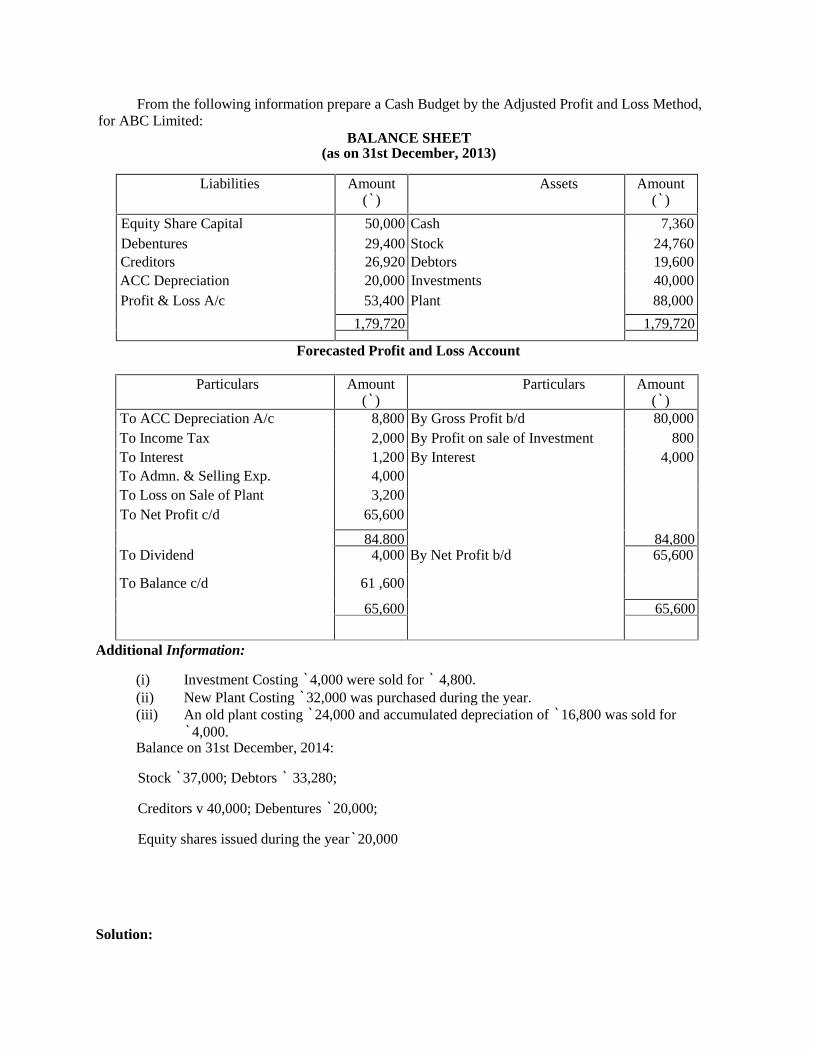
From the following information prepare a Cash Budget by the Adjusted Profit and Loss Method,for ABC Limited:
BALANCE SHEET(as on 31st December, 2013)
Liabilities Amount(`)
Assets Amount(`)
Equity Share Capital 50,000 Cash 7,360Debentures 29,400 Stock 24,760Creditors 26,920 Debtors 19,600ACC Depreciation 20,000 Investments 40,000Profit & Loss A/c 53,400 Plant 88,000
1,79,720 1,79,720
Forecasted Profit and Loss Account
Particulars Amount(`)
Particulars Amount(`)
To ACC Depreciation A/c 8,800 By Gross Profit b/d 80,000To Income Tax 2,000 By Profit on sale of Investment 800To Interest 1,200 By Interest 4,000To Admn. & Selling Exp. 4,000To Loss on Sale of Plant 3,200To Net Profit c/d 65,600
84.800 84,800To Dividend 4,000 By Net Profit b/d 65,600
To Balance c/d 61 ,600
65,600 65,600
Additional Information:
(i) Investment Costing `4,000 were sold for ` 4,800.(ii) New Plant Costing `32,000 was purchased during the year.(iii) An old plant costing `24,000 and accumulated depreciation of `16,800 was sold for
`4,000.Balance on 31st December, 2014:
Stock `37,000; Debtors ` 33,280;
Creditors v 40,000; Debentures `20,000;
Equity shares issued during the year`20,000
Solution:

CASH BUDGET
(Adjusted Profit and Loss Method)
Particulars Amount(`) Amount (`)Opening Cash Balance 7,360Add: Budgeted Net Profit 65,600
Depreciation written off 8,800Increase in Creditors 13,080Loss on sale of Plant 3,200Sale of Investment 4,800Issue of Shares 20,000Sale of old Plant 4,000 1,19,480
1,26,840Less: Purchase of Plant 32,000
Redemption of Debentures 9,400Payment of Dividend 4,000Profit on sale of Investment 800Increase in Debtors 13,680Increase in Stock 12,240 72,120Closing Balance of Cash 54 720
Illustration 5.5
By using the data of Illustration 5.4, prepare a Cash Budget showing Cash at Bank on 31stDecember, 2014, under 'Balance Sheet Method'.Solution:
Budgeted Balance Sheet(On 31st December, 2014)
Liabilities Amount(`)
Assets Amount(`)
Equity Share CapitalProfit and Loss A/c (53,400 + 61,600) Debentures Ace.Depreciation (20,000 + 8,800 - 16,800)Creditors
70,0001,15,000
20,00012,00040,000
Plant Investment StockDebtors Cash at Bank (Bal.Figure)
96,00036,00037,00033,28054,720
2,57,000 2,57,000
9. Master Budget: A master budget is prepared for the business as a whole, combining all the budgetsfor a period into this budget. It is the summary of all subsidiary functional budgets, prepared by theconcern. Before preparing a master budget, it is necessary to prepare sales budget, purchase budget,cash budget, production budget, overheads budget, etc. Thus, the master budget is a summarybudget which incorporates all functional budgets in a capsule form. It shows budgeted incomestatement for the budget period and budgeted balance sheet at the end of the budget period. Themaster budget requires the approval of the budget committee before it is put into action. The masterbudget co-ordinates the budgets of all the departments.
5.3.4 Flexibility BudgetsOn the basis of flexibility, budgets can be classified as follows:

(1) Fixed Budget: According to I.C.M.A., London, "Fixed budget is a budget which isdesigned to remain unchanged irrespective of the level of activity attained."It does not change with the change in level of activity actually attained. It is prepared for a given levelof activity and does not take note of changes in the circumstances. Therefore, it becomes uselessfor comparison with actual performance when level of activity changes.
(2) Flexible Budget; According to I.C.M.A., London, "A flexible budget is a budgetdesigned to change in accordance with the level of activity actually attained."
A flexible budget provides budgeted costs at different levels of activity. It varies with the level ofactivity attained. Flexible budget is desirable in the following cases:-(i) Where the business is new or estimation of demand is not possible.(ii) Where the business is subject to the vagaries of nature such as soft drinks, etc.(iii) Where sales are unpredictable.(iv) Where the demands for the product keep changing due to change in fashion and tastes of
customers.(v) Where production cannot be estimated due to irregular supply of necessary material and
labour.Illustration 5.6
Prepare a Flexible Budget for the production at 80% and 100% activity on the basis of followinginformation:
Production at 50% capacity 5,000 unitsRaw Material ` 80 per unitDirect labour ` 50 per unitDirect Expenses `15 per unitFactory Overhead `50,000 (50% fixed)Administration Overhead ` 60,000(60% variable)
Solution:Flexible Budget
Particulars 50%Capacity
5,000 units(`)
80%Capacity
8,000 units(`)
100%Capacity
10,000 units(`)
Per unit Total Per unit Total Per unit Total
Raw Material 80 4,00,000 80 6.40.000 80 8,00,000Direct Labour 50 2,50,000 50 4,00,000 50 5,00,000DirectExpensesPrime Cost
15 75,000 15 1,20,000 15 1,50,000
145 7,25,000 145 11,60,000 145 14.50,000
FactoryExpenses:(Fixed 50%)(Variable 50%)Works Cost
55
25,00025,000
3.1255
25.00040.000
2.505
25,00050,000
155 7,75,000 153.125 12,25,000 152.50 15,25,000Administration Exps.Fixed (40%)Variable (60%)Total Cost
4.807.20
24,00036,000
3.007.20
24,00057,600
2.407.20
24,00072,000
167 8,35,000 163.325 13,06,600 162.10 16,21,000
Note: 1. Variable cost per unit and total fixed costs remain constant irrespective of changes on activitylevels.
2. Total variable cost and fixed cost per unit vary with the changes in the activity levels.5.3.5 Period Budgets

(i) Long Period Budgets: Long period budgets are those budgets which incorporate planning forfive to ten years and even more. Research and development budget is an example of long periodbudget.
(ii) Short Period Budgets: Short period budgets are prepared for the period less than one year.Material budget, Cash budget, etc. are the examples of short period budgets.
5.3.6Condition Budgets(i) Basic Budget: A basic budget is one which is established for use unaltered over a long period of
time. Current circumstances are not considered while preparing this budget.(ii) Current Budget: A current budget is one which is established for use over a short period of
time and it is related to current conditions. This budget is more useful than basic budget.Illustration 5.7
ABC Ltd. prepared the budget for the production of one lakh unit of the one type of commoditymanufactured by them for a costing period as under:-
Raw Material Z 2.52 per unitDirect Labour ? 0.75 per unitDirect Expenses ? 0.10 per unitWorks overheads (60% Fixed) ? 2.50 per unitAdmn. overheads (80% Fixed) ? 0.40 per unitSelling overheads (50% Fixed) ? 0.20 per unit
Actual production during the period was only 60,000 units. Calculate the budget cost per unit.Solution:
Flexible Budget1,00,000 Units 60,000 Units
Particulars Per unit Amount (`) Per unit Amount (`)Raw Material 2.52 2,52.000 2.52 1,51,200Direct Labour 0.75 75,000 0.75 45,000Direct expenses 0.10 10,000 0,10 6,000Prime Cost 3.37 3,37,000 3.37 2,02,200Works Cost: (60% Fixed) 1.50 1,50,000 2.50 1,50,000
(40% Variable) 1.00 1 ,00,000 1.00 60,000Admn. Overheads: (80% Fixed) 0.32 32,000 0.53 32,000
(20% Variable) 0.08 8,000 0.08 4,800
Cost of Production 6.27 6,27,000 7.48 4,49,000Selling Overheads:50% Fixed 0.10 10,000 0.17 10,00050% Variable 0.10 10,000 0.10 6,000
Total Cost/
6.47 6,47,000 7.75 4,65,000• Programme Budgeting
Programme budgeting was firstly used by Department of Defence in U.S.A. in 1961. It focuses onprocess of allocating funds.5.4 ZERO-BASE BUDGETING STRATEGY (ZBB)Zero-base budgeting is also known as "De nova budgeting", i.e., budgeting from beginning. In otherwords, it is beginning from zero base, assuming that nothing is happened in the past. The concept of zerobase budgeting can be applied from a home budget to the national budget. In a home budget, a housewifeprepares the budget of next month after ignoring the current and past budget (expenditures) altogether.
1. According to Certified Institute of Management Accountants, London, "Zerobase budgeting is a method of budgeting whereby all activities are re-evaluated each timea budget is set. Discrete levels of each activity are valued and a combination chosen tomatch funds available."
2. According to Peter A Pyher, "A planning and budgeting process which requires eachmanager to justify his entire budget request in detail from scratch (hence zero base) and

shifts the burden of proof to each manager to justify why he should spend money at all. Theapproach requires that all activities be analysed in decision packages which are evaluated bysystematic analysis and ranked in order of importance." Peter Pyher is known as the father ofZero Base Budgeting as he introduced ZBB at Texas Instruments in USA in 1969.
Thus we can say that in zero base budgeting, every year is taken as a new year and previous year is nottaken as a base. It starts from a “Zero base” and every function within an organization is analysed for itsneeds and costs. Budgets are then built around what is needed for the upcoming period, regardless ofwhether the budget is higher or lower than the previous one.Steps Involved in the Process of Zero Base BudgetingFor implementing zero base budgeting, following necessary steps are taken
1. Determining the objectives of zero base budgeting.2. Developing decision unit i.e., a department of an organization where decisions are taken.
Decision units are developed for cost benefit analysis.3. Development decision packages: Decision package summaries the scope of work requirement,
anticipated benefits, time schedule etc.4. Ranking of decision packages on the basis of benefits to the organization.5. Allocation of resources on the basis of ranking of decision packages.
Advantages of Zero-Base Budgeting1. Efficient allocation of resources, as it is based on needs and benefits rather than history.2. It helps in identifying and eliminating wasteful and obsolete operations.3. It helps in detecting inflated budgets.4. It increases communication and coordination within the organization.5. It enables the management to find cost effective ways to improve operations.6. Responsibility and accountability are more specifically fixed under zero based budgeting as
compared to traditional budgeting.7. It increases staff motivation by providing greater initiative and responsibility in decision making.8. It is useful in Government department where all expenditure are incurred on the basis of budgets.9. It focuses on cost benefit analysis to reach on maximization of profit of the company.10. It can be used for implementation of “Management by objective’ (MBO). Thus it can be used not
only for fulfillment of the objective, but also for variety of the purpose.11. It identifies activities involving wasteful expenditure.12. It involves rational decision making.13. It promotes operating efficiency.
Limitations of zero-Base Budgeting1. It is more time consuming than traditional budgeting as every single item is paid attention to
afresh.2. It requires specific training due to increased complexity as compared to traditional budgeting.3. It increases paper work.4. Cost of preparing the decision package may be very high.5. There is a problem in defining decision units and decision packages.6. Wrong cost-benefit analysis may hamper the future growth of the organization. For example,
cutting present advertisement cost may effect future sales. Similarly, cutting research anddevelopment cost may effect the future growth and cost effectiveness of the organization.
7. The concept ZBB needs clarity at top management level otherwise conflict among departmentsmay affect the overall profitability of the organizations.ZBB is highly relevant in ‘continuous improvement’ environment because of its nature ofcontinuous evaluation of costs and benefits. This technique is relevant for effective utilization of

resources and increasing the profitability of the organizations. So ZBB can be implemented as aplanning device in the overall corporate strategy.
SELF-ASSESMENT QUESTION
1. What do you understand by “Budgeting” ? Mention the type of budget that the Management of abig industrial concern would normally prepare.
2. What is budget ? What is sought to be achieved by Budgetary Control.
3. Has ‘Budgetary Control’ any significance with management accounting ?4. Outline a plan for sales budget and purchases budget. What considerations are necessary in the
preparation of such budgets ?
5. Mr. Managing Director is surprised that his profit every year is quiet different from what be wantsor expects to achieve. Someone advised him to install a formal system of budgeting. He employs afresh accountant to do this. For two years, the accountant faithfully makes all budgets based onprevious year’s accounts. The problem remains unsolved. Advise Mr. Managing Director and theAccountant on what steps they should take. Make assumption about what is lacking.
6. (a) What do you mean by budgetary control with reference to manufacturing-cum-sellingenterprise.
(b) What factors would influence the selection of budget period between two firms carrying ondiverse activities ?
(c) What do you mean by flexible budget allowance ? How is it ascertained ? Explain with acogent example.
7. (a) What do you mean by budgetary control ? Explain the objectives of budgetary control withspecial reference to a large manufacturing concern.
(b) Explain what is meant by flexible budget and its utility. Prepare a proforma of flexible budgetof a manufacturing concern for their imaginary activity, levels in a suitable form.
8. (a) What do you understand by budget and budgetary control ? Give example of five budgets thatmay be prepared and employed by a manufacturing concern.
(b) What is the principal budget factor ? Give a list of such factors and explain how you wouldproceed to prepare budgets in the case of a manufacturing company.
9. Are you in agreement with the view that Budgeting should better be called profit planning andcontrol.
10. ‘Why do responsible people in an organization agree to accept budgetary control in theory butresist in practice’ ? Explain.
11. ‘If the sales forecast is subject to error then there is no basis of budgeting’. Do you agree ? Alsoexplain how flexible budget can be used to help control cost.
12. Explain the procedure you would follow to prepare a projected Profit and Loss Account andProjected Balance Sheet. Explain also use of these statements.
13. ‘Budgetary control improves planning, aids in coordination and helps in having comprehensivecontrol’. Elucidate this statement.
14. Describe in brief the modus operandi for the purpose of preparation of a production budget. Whatare the principal considerations involved in budgeting production ?
15. What do you understand by budget and budgetary control ? How far is a budgetary control a tool inthe hands of management ?
16. What is ‘zero-base budgeting’ ?

17. What do you understand by the terms ‘Budget’ and ‘Budgetary Control’ ? What are the advantagesof ‘budgetary control’ ?
18. What is the mechanism of master budget ?
Discuss the difficulties which arise and how are they overcome in forecasting sales and preparingsales budget in a jobbing concern.
19. (a) What is master budget ? How is it prepared ?
(b) Explain zero-based budgeting.
20. Write an essay on zero-based budgeting and highlight its procedure, norms and superiority overfunctional budgeting.
21. What are different types of functional budgets which are prepared by a large scale manufacturingconcern ?
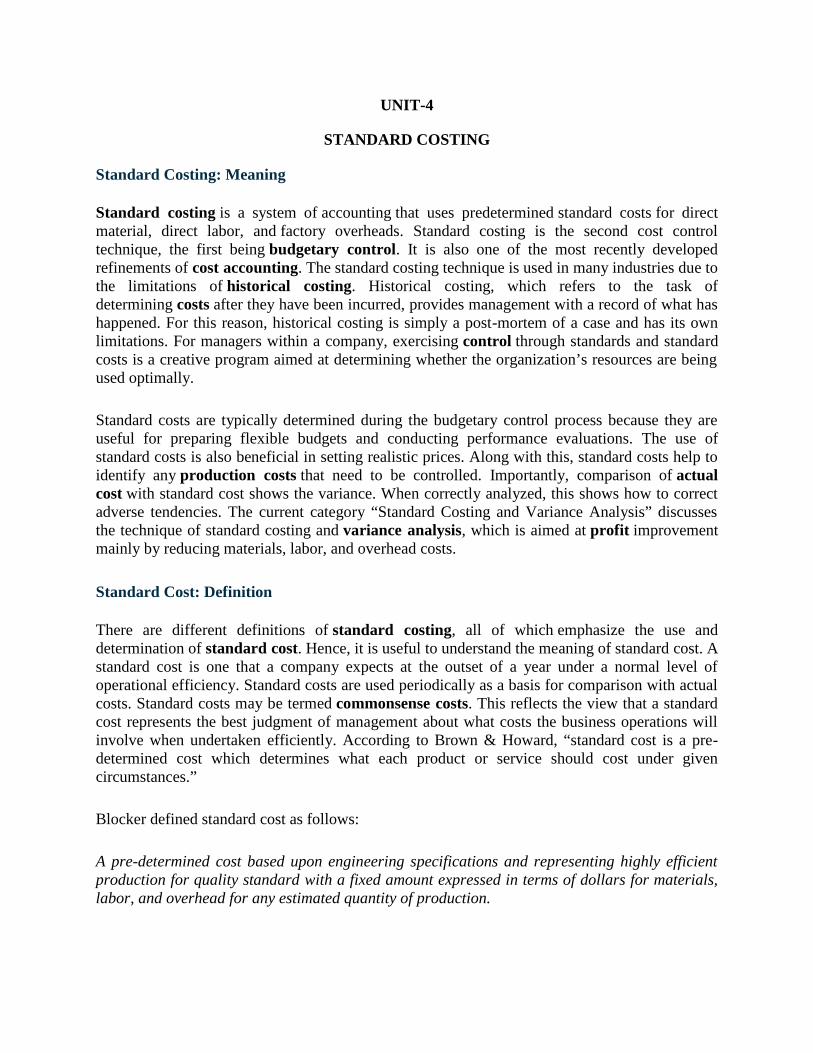
UNIT-4
STANDARD COSTING
Standard Costing: Meaning
Standard costing is a system of accounting that uses predetermined standard costs for directmaterial, direct labor, and factory overheads. Standard costing is the second cost controltechnique, the first being budgetary control. It is also one of the most recently developedrefinements of cost accounting. The standard costing technique is used in many industries due tothe limitations of historical costing. Historical costing, which refers to the task ofdetermining costs after they have been incurred, provides management with a record of what hashappened. For this reason, historical costing is simply a post-mortem of a case and has its ownlimitations. For managers within a company, exercising control through standards and standardcosts is a creative program aimed at determining whether the organization’s resources are beingused optimally.
Standard costs are typically determined during the budgetary control process because they areuseful for preparing flexible budgets and conducting performance evaluations. The use ofstandard costs is also beneficial in setting realistic prices. Along with this, standard costs help toidentify any production costs that need to be controlled. Importantly, comparison of actualcost with standard cost shows the variance. When correctly analyzed, this shows how to correctadverse tendencies. The current category “Standard Costing and Variance Analysis” discussesthe technique of standard costing and variance analysis, which is aimed at profit improvementmainly by reducing materials, labor, and overhead costs.
Standard Cost: Definition
There are different definitions of standard costing, all of which emphasize the use anddetermination of standard cost. Hence, it is useful to understand the meaning of standard cost. Astandard cost is one that a company expects at the outset of a year under a normal level ofoperational efficiency. Standard costs are used periodically as a basis for comparison with actualcosts. Standard costs may be termed commonsense costs. This reflects the view that a standardcost represents the best judgment of management about what costs the business operations willinvolve when undertaken efficiently. According to Brown & Howard, “standard cost is a pre-determined cost which determines what each product or service should cost under givencircumstances.”
Blocker defined standard cost as follows:
A pre-determined cost based upon engineering specifications and representing highly efficientproduction for quality standard with a fixed amount expressed in terms of dollars for materials,labor, and overhead for any estimated quantity of production.

The Institute of Cost and Management Accountants (ICMA) defined standard cost in thefollowing way:
A pre-determined cost which is calculated from management’s standards of efficient operationand the relevant necessary expenditure. It may be used as a basis for price fixation and for costcontrol through variance analysis.
In ICMA’s definition of standard cost, the phrase “management’s standards of efficientoperation” is important. This is because standard cost is ascertained on this basis.
The standard of efficient operation is decided based on previous experience, research findings, orexperiments. The standard is generally defined as that which is attainable but only aftersubstantial effort. Standard cost serves as a measure against which actual cost is compared. Ifactual cost does not exceed standard cost, performance is treated as fully efficient.
Standard cost also plays a role in evaluating staff performance. For example, by analyzing thedifference between actual costs and standard costs, management can identify the factors leadingthese differences.Standard costs also assist the management team when making decisions aboutlong-term pricing.
Features of Standard Costing System
1. Standard cost is a predetermined cost. It is based on past experience and is referred to asa common sense cost, reflecting the best judgment of management.
2. Standard cost relates to a product, service, process or an operation. It is also determined for anormal level of efficiency of operation.
3. Standard cost is used to measure the efficiency of future production or future operations. Forthis reason, it provides a useful basis for cost control.
4. Also, standard cost may be expressed in terms of money or other exact quantities.
Advantages of Standard Cost
This section highlights the most important advantages of standard cost.
1.First, standard costs serve as a yardstick against which actual costs can be compared.Thedifference between standard cost and actual cost are called variances. For proper control andperformance measurement in an organization, variances should be measured and analyzed. Thisalso ensures that regular checks are made on expenditures.

2. The second advantage is that if immediate attention is taken, control over costs is greatlyfacilitated. A proper standard costing system assists in achieving cost control and cost reduction.
3. Standard cost also helps to motivate employees. This is because the system can be used toprovide an incentive scheme wherein variance is minimized.
4. Production and pricing policies are formulated with certainty when standard cost systems arein place. This helps to keep costs in check.
5. The last advantage of using standard cost is that even when other standards and guidelines areconstantly being revised, standard cost serves as a reliable basis for evaluating performance andcontrol costs.
Nature and Purpose of Standard Costing System
The main purpose of standard cost is to provide management with information on the day-to-daycontrol of operations.
1. Standard costs are predetermined costs that provide a basis for more effectively controllingcosts. Standard cost offers a criterion against which actual costs incurred by the business can bemeasured and analyzed.
2. The difference between actual costs and standard costs is known as variance. Variance isidentified and carefully analyzed, and it is reported to managers to inform suitable correctiveactions.
Applicability of Standard Costing
Standard costing is applicable under diverse conditions. It requires the following:
There should be an output or the production of a sufficient volume of a standard product The methods, operations, and processes of production should be capable of
standardization The costs should be controllable
Standard costing techniques have been applied successfully in all industries that producestandardized products or follow process costing methods.
Examples of such industries include sugar, fertilizers, cement, footwear, breweries anddistilleries, and others.
Public utilities such as transport organizations, electricity supply companies, and waterworks canalso apply standard costing techniques to control costs and increase efficiency.

In jobbing industries, as well as industries that produce non-standardized products, it is notpossible to apply the technique advantageously.
Objectives of Using Standard Costing System
Within an organization, there are several objectives that a standard costing system may beestablished to help achieve.
1. First, a standard costing system may be used to control costs, which is achieved mainly bysetting standards for each type of cost incurred: material, labor, and overhead.
2. This also helps to analyze variance and, hence, enables managers to be effective in controllingthe costs for which they are held responsible.
3. The second objective that a standard costing system may be used to achieve is to help insetting budgets. Third, such a system may be used to provide useful and detailed information formanagerial planning and decision-making.
4. Fourthly, a standard costing system may be used to assess the performance and efficiency ofstaff and management.
5. Finally, standard costing is a control technique that follows the feedback control cycle.Therefore, the feedback system may help to eliminate unwanted costs in the future, leading to apotential reduction in costs.
Preliminaries to Consider Before Using a Standard Costing System
When deciding whether to use standard costing in a business, several preliminaries have to beconsidered. These preliminaries are:
1. Establishing cost centers2. Classification and codification of accounts3. Types of standards4. Setting the standards
1. Establishing Cost Centers
A cost center is a location, person, or item of equipment (or a group of these) for which costsmay be ascertained and used for the purpose of cost control. Cost centers may be personal costcenters or impersonal cost centers. Personal cost centers are related to a person, while impersonalcost centers are related to a location or item of equipment. Establishing cost centers is needed toallocate responsibilities and define lines of authority.

2.Classification and Codification of Accounts
Classification or grouping of accounts is essential for standard costing.
Accounts should be classified in such a way that the cost elements of every cost center areclearly and precisely reflected. Codes and symbols are assigned to different accounts to make thecollection and analysis of costs more quick and convenient.
Types of Standards
A standard is a predetermined measure relating to materials, labor, or overheads. It is a reflectionof what is expected, under specific conditions, of plant and personnel.
A standard is essentially an expression of quantity, whereas a standard cost is its monetaryexpression (i.e., quantity multiplied by price). It shows what the cost should be.
In setting standards, the key question is to decide on the type of standard to be used in fixing thecost. The main types of standards are ideal, basic, and currently attainable standards.
1. Ideal Standards
Ideal standards, also called perfection standards, are established on a maximum efficiency levelwith no unplanned work stoppages.
They are tight standards which in practice may never be obtained. They represent the level ofattainment that could be reached if all the conditions were perfect all of the time.
Ideal standards are effective only when the individuals are aware and are rewarded for achievinga certain percentage (e.g., 90%) of the standard.
2. Basic Standards
Basic standards are long-term standards and they remain the same after being computed for thefirst time. They are projections that are rarely revised or updated to reflect changes in products,prices, and methods.
Basic standards provide the basis for comparing actual costs over time with a constant standard.They are used primarily to measure trends in operating performance.
3. Currently Attainable Standards
A currently attainable standard is one that represents the best attainable performance. It can beachieved with reasonable effort (i.e., if the company operates with a “high” degree of efficiencyand effectiveness).
These standards make proper allowances for normal recurring interferences such as machinebreakdown, delays, rest periods, unavoidable waste, and so on.
It is assumed that these are unavoidable interferences and are a fact of life. However, allowancesare not made for any avoidable interference with output.
The currently attainable standard is the most popular standard, and standards of this kind areacceptable to employees because they provide a definite goal and challenge to them.
Setting the Standards or Establishing a Standard Costing System
Establishing a standard costing system for materials, labor, and overheads is a complex task,requiring the collaboration of a number of executives.
For this purpose, a Standards Committee is established. The Standards Committee generallyconsists of:
Production Manager Purchase Manager Personnel Manager Production Engineer Sales Manager Cost Accountant
The Budget Committee and Standards Committee can be combined into one committee.
The Standards Committee is responsible for fixing standards. It also assists in the effectiveapplication of standards, as well as making necessary changes as new circumstances renderprevious standards obsolete. Before fixing standards, a detailed study of the functions involvedin the manufacturing of the product is necessary. While fixing standard costs, the fundamentalprinciple to be observed is that the set standards are attainable so that these are taken asyardsticks for measuring the efficiency of actual performances. The setting up of standard costsrequires the consideration of quantities, price or rates, and qualities or grades for each element ofcost that enters a product (i.e., materials, labor, and overheads).
VARIANCE ANALYSIS
Variances may be classified into:

(i) Favourable and Unfavourable Variances, and(ii) Controllable and Uncontrollable Variances
(i) Favourable and Unfavourable Variances: When the actual cost incurred is less than thestandard cost, the deviation is known as 'favourable variance' whereas, when the actual costincurred is more than the standard cost, the variance is treated as 'unfavourable* or'adverse*. A favourable variance reflects the efficiency while unfavourable variance indicatesinefficiency. Favourable variance is also known as positive ( + ) or credit variance and viewedonly as profits whereas adverse variance is known as negative (-) or debit variance and isviewed as losses. In other words, any variance which increases the actual profit is favourablevariances and any variance which decreases the actual profit is unavoidable variable. Favourablevariance is designated by (F) and unfavourable or adverse by (A).
(ii) Controllable and Uncontrollable Variances: A variance is said to be controllable if primaryresponsibility of a specified person or department can be identified. For example, excessusage of materials by production department is controllable being the responsibility of theforeman of the said department. On the other hand, when variance is due to the factors beyondthe control of the concerned person, it is said to be uncontrollable. For example, increase inwage rate of workers on account of strike or government policy, etc. No individual person ordepartment can be held responsible for uncontrollable variances.
Variance analysis is a process of analysing variances by sub-dividing the total cost variance in such a waythat the management of the concern can assign the responsibility for off standard performance. It also leads toascertain the magnitude of each of the variances and reasons thereof. In variance analysis, the attention of themanagement is drawn not only to the monetary value of unfavourable and favourable managerial performancebut also the responsibility and reasons for the same.Material Variances
Material forms a very high percentage of the total cost. It is very important to study its cost variance.Materialvariances consist of the following variances:
(1) Material Cost Variance (MCV)(2) Material Price Variance (MPV)(3) Material Usage/Quantity/Volume Variance (MQV)(4) Material Mix Variance (MMV)(5) Material sub-usage Variance/Revised Material Quantity Variance {RMQV}(6) Material Yield Variance (MYV)
Classification of Cost Variances(1) Material Cost Variance (MCV): "Material cost variance is the difference between the
standard cost of materials specified for the actual output and actual cost of materialsused." — I.C.M.A., LondonIt is expressed as:MCV= Standard Cost of Material for Actual Output — Actual Cost of Materialor (SQ SP) - (AQ AP)SQ stands for Standard Quantity for Actual OutputSP stands for Standard PriceAQ stands for Actual QuantityAP stands for Actual PriceStandard Quantity for Actual Output is computed as follows
Standard QuantityAcual output
Standard Output
(2) Material Price Variance (MPV): Material price variance is the portion of the Material Cost Variancewhich arises due to the difference between the standard price specified and actual price paid. It can beexpressed as:Material Price Variance - Actual Quantity (Standard Price - Actual Price) or MPV = AQ (SP - AP)

The reasons for the material price variance may be the following:(i) Change in market price(ii) Change in quantity of purchase(iii) Change in quality of material purchased(iv) Emergency purchases leading to higher prices(v) Discounts not availed(vi) Rush order to meet shortage of supply, etc.(3) Material Usage/Quantity/Volume Variance: Material usage variance is the difference
between the standard quantity specified and the actual quantity used. This variance may arise due to thefollowing reasons:
(i) Use of inferior material(ii) Poor inspection of material(iii) Lack of due care in the handling of materials(iv) Abnormal wastage, theft, pilferage of materials(v) Setting of improper standards(vi) Improper maintenance of machine, etc.
It may be expressed as:Material Usage Variance = Standard Price (Standard Quantity for Actual Output- Actual Quantity)or MUV = SP(SQ-AQ)Relationship among MCV, MPV and MUV:MCV = MPV + MUVIllustration 4.1
The standard material required for production is 5,200 kg. A price of `2 per kg has been fixed forthe materials. The actual quantity of materials used for the product is 5,600 kg. A sum of ` 14,000 hasbeen paid for the materials.
Calculate: (a) Material Cost Variance; (b) Material Price Variance; (c) Material Usage Variance.Solution:Standard Quantity = 5,200 kgStandard Price = ` 2 per kgActual Quantity = 5,600 kg
Actual Price = 14,000
5,600= ` 2.50 per kg
(a) Material Cost Variance (MCV):MCV = (SQ SP) (AQ AP)= (5,200 2) (5,600 2.50)= ` 10,400 `14,000 = `3,600 (Adverse)(b) Material Price Variance (MPV):MPV = AQ{SP - AP} = 5,600 {2-2.50}= 5600(-0.50) = `2,800 (Adverse)(c) Material usage variance (MUV):MUV =SP(SQ-AQ)
= 2(5,200-5,600)= 2(-400) = `800 (Adverse)
Verification:MCV =MPV + MUV = `3,600(Adv.) = 2,800 (Adv.) + 800 (Adv.)Illustration 4.2
In a brass foundry, the standard mixture consists of 60% Copper and 40% Zinc. The standard lossof production is10% on input. From the actual production in a month calculate the Material CostVariance and analyse it:Copper 50kg@`30 per kg (standard 60kg)Zinc 50 kg@`20per kg (Standard 40 kg)

Actual Output: 86 kgSP and AP are the sameSolution:
Standard Mix Actual Mix
CopperZinc
Less (10%)(Loss)
SQ(kg) SP(`) Std. Cost(`) AQ(kg) AP(`) Actual Cost(`)6040
1001090
3020
1800800
2,600
5050
1001486
3020
1,5001,0002,500
Material Cost Variance (MCV) = (Std. Cost – Actual Cost)Std. Cost – (SQ for Actual Output SP)SQ for Actual Output will be computed as follows:
Copper60
86 57.3390
Zinc40
86 38.2290
Now, MCV for Copper = 57.33 30 50 30 ` 220 (Fav.)
MCV for = 38.22 20 50 20 ` 236 (Adv.)
= `16 (A|dv.)This is explained by
(i) Material Price Variance = Nil(ii) Material Mix Variance = (SQ-AQ)SP
Copper = 60 50 30 = `300 (Fav.)
Zinc = 40 50 20 = `200 (Fav.)
= `100 (Fav.)(iii) Material Yield Variance = (AY -SY)SC per unit
86 90 28.89* = `116 (Adv.)
2600*SC
90 `28.89
VerificationMCV = MPV + MMV + MYV`16 (Adv.) = Nil + `100 (Fav.) + `116(Adv.)`16 (Adv.) = `16(Adv.)Note: Since SPO and AP are the same and Standard Total Quantity and actual Total Quantity are
the same, there will be no Material Price variance and Material Usage Variance.Illustration 4.3The standard material cost for a normal mix of one tonne of chemical Z is based on:
Chemical Usage (Kg) Price Per Kg. (`)A 240 6B 400 12C 640 10

During a month, 12.5 tonnes of Z were produced from:Chemical Consumption (Tonnes) Cost (`)A 3.2 22,400B 4.8 60,000C 9.0 94,500
Analyse the Variances:Solution:
(i) SQ for Actual output:A = 24012.5 = 3,000 Kg
B = 400 12.5 = 5,000 Kg
C = 640 12.5 = 8,000 KgTotal SQ = 16,000Kg
(ii) Total AQ = 3.200 + 4,800 + 9,000 = 17,000 Kg.(iii) RSQ
3,000A 17,000 3,187.5 Kg.
16,000
5,000B 17,000 5,312.5 Kg.
16,000
8,000C 17,000 8,500 Kg.
16,000
Computation of Material Cost VariancesMaterial SQ for
AQSP(`) SQ +
SP(`)AQ AP(`) AQ
AP(`)RSQ RSQSP(`)
ABC
Loss
3,0005,0008,000
16,0003,500
12,500
61210
18,00060,00080,000
1,58,000
3,2004,8009,000
17,0004,500
12,500
7.012.510.5
22,40060,00094,500
1,76,900
3,187.55,312.5
8,500.00
19,12563,75085,000
1,67,875
(1) Material Cost Variance (MCV) = (SQ SP) – (AQAP)
= `1,58,000 – `1,76,000
= `18,000 (A)
(2) Material Price Variance (MPV) = AQ (SP – AP)
A = 3,200(6-7) = `3,200 (A)
B = 4,800 (12–12.5) = `2,400 (A)
C = 9,000 (10–10.5) = `4,500(A)
MPV = `10,100(A)

(3) Material Usage Variance (MUV) = SP (SQ- AQ)
A = 6 (3,000 – 3,200) = `1,200 (A)
B = 12 (5,000–4,800) = `2,400(F)
C = 10 (8,000 – 9,000) = `10,000(A)
MUV = 8,800(A)
(4) Material Mix Variance (MMV) = SP (RSQ-AQ)
A = 6(3,187.5 – 3,200) = `75(A)
B = 12(5,312.5 – 4,800) = `6,150 (A)
C = 10(8,500 – 9,000) = 5,000 (A)
MMV = `1,075(F)
(5) Material Yield Variance (MYV)
MYV = (Actual Yield – Std. Yield) SC per unit
Actual Yield = 12,500
Standard Yield = (12,500/16,000)17,000 = 13,281
Standard Cost = 1,58,000/12,500 = 12.64
MYV = (12,500 – 13.281) 12.64 = `9,875 (A)
Alternatively, MYV = SP(SQ – RSQ)
MYV = (SQSP) – (RSQSP)
= (1,58,000 – 1,67,875)
= `9,875 (A)
Verification:
1. MCV = MPV + MUV18,900 (A) = 10,100(A) + 8,800 (A)18,900(A) = 18,900 (A)
2. MUV = MMV + MYV8,800(A) = 1,075(F) + 9,875 (A)8,800 (A) = 8,800 (A)
Labour Variances
These may be two main reasons of the occurrence of deviations in cost of direct labour:
(i) Difference in actual rates and standard rates of labour and
(ii) The variation in the actual time taken by the workers and standard time allowed to them forperforming a job or an operation.
The various labour variances may be arranged as follows:
(1) Labour Cost Variance (LCV): It is the difference between the standard labour cost andactual labour cost of the product.LCV = (Standard Rate Standard Time for Actual Output*)-(Actual Rate Actual Time)

Standard Time* Actual output
Standard Output
LCV SR ST AR AT
Labour cost variance may be analysed further as (i) Labour rate variance, and (ii) Labour efficiencyvariance.(2) Labour Rate Variance (LRV): It is that portion of labour cost variance which is due to thedifference between the standard rate specified and the actual rate paid. It would occur due to the followingreasons:(i) Employment of one or more workers of different grade than the standard grade,(ii) Excessive overtime,(iii) Overtime work in excess of that provided in the standard,(iv) New workers not being allowed full wage rates, etc. The formula for calculating LRV is as
under: Labour Rate Variance (LRV) = Actual Time x {Standard Rate - Actual Rate)
or LRV=AT SR-AR
(3) Total Labour Time/Efficiency Variance (TLEV): It is that portion of labour costvariance which arises due to the difference between the Standard Labour hours specified andthe actual labour hours spent. It may arise due to the following reasons:(i) Wrong selection of workers,(ii) Higher labour turnover,(iii) Lack of supervision,(iv) Poor working conditions,(v) Defective machinery, tools and equipment,(vi) Use of non-standardised materials,(vii) Inefficiency of workers, etc.
TLEV = Standard Rate x {Standard Time for Actual Output* - Actual Time)Standard Time
* Actual outputStandard Output
TLEV = SR (ST - AT) TLEV can be divided into three parts:(i) Simple LEV = SR x (ST for Actual output - AT worked*)* AT Allowed - Idle Time - Holiday Time(ii) Idle Time Variance* = Idle Time x SRNote: Idle time is always adverse,(iii) Holiday/Calendar Variance - Holiday Time x SR
Note: Holiday/Calendar Variance is always adverse.TLEV = SLEV + Idle Time Variance + Holiday VarianceLabour Idle Time Variance: It is that portion of labour efficiency variance which may arise due toabnormal wastage of time on account of strikes, power out, non-availability of raw-material, breakdownof machinery etc.
Idle Time Variance = Idle Time (Hours) Standard Rate
(4) Labour Mix Variance (LMV): Where workers of two or more than two types are engaged in thedifference between the standard composition of workers and the actual gang (or group) of workers isknown as ‘Labour Mix Variance’. It is calculated as under:LMV Labour Mix Variance (LMV)= SR(RST-AT)
Revised Standard Time (RST) =Standard Time
Total Actual TimeTotal Standard Time

(5) Labour Yield Variance (LYV): It is that portion of labour efficiency variance which arises due to thedifference between actual output of worker and standard output of worker specified. It is calculated asfollows:(LYV) = SC(Actual Yield – Revised Standard Yield*)SC stands for standard cost of Labour per unit of standard outputSC is calculated as follows:
Standard Cost of LabourSC
Standard Output
*Revised Standard Yield = Actual mix of Labour beforeStandard Yield
Idle and Holiday TimeStandard Mix of Labourbefore Idle and Holiday Time
Illustration 4.4From the following information, compute labour cost variance, labour efficiency variance and labour ratevariance.
StandardWorkers Hours Rate per hour (`) Total Amount (`)
AB
1015
3.004.00
30.0060.00
ActualA 20 3.00 60.00B 5 4.50 22.50
Solution:(a) Labour Cost Variance (LCV):
LCV = (STSR) – (ATAR)Worker A = (10 3) – (20 3) = `30 (Adv.)Worker B = (15 4) – (5 4.50) = `37.50 (Fav.)
= `7.50 (Fav.)(b) Labour Efficiency Variance (LEV):
LEV = (ST - AT) SRA = (10 - 20) 3 = `30 (Adv.)B = (15 - 5) 4 = `40 (Fav.)
= `10 (Fav.)(c) Labour Rate Variance (LRV)L
LRV = (SR – AR) ATA = (3 - 3) 20 = 0B = (4 – 4.50) 5 = `2.50 (Av.)
= `2.50 (Adv.)Verification:LRV = LEV + LRV7.50 (Fav) = 10 (Fav.) + 2.50 (Adv.)`7.50 (Fav.) = `7.50 (Fav.)
Illustration 4.5Calculate Labour Variance from the following information:Labour Rate = `1 per hourHours as Standard per unit = 12 HoursActual Date:Units Produced = 1,000Actual Labour Cost = `10,000Hours Worked actually = 12,500 HoursSolution:

Standard Time (ST) = 100012 = 12,000 HoursStandard Cost = 12,0001 = `12,000Labour Cost Variance (LCV) = (Standard Cost – Actual Cost)
= (12,000 – 10,000)= `2,000 (Fav.)
Labour Rate Variance (LRV)= (SR – AR) AT 1.00 0.80 12, 500 = `2,500 (Fav)
Actual Rate=10,000
12,500= `0.80 per hour
Labour Efficiency Variance (LEV): (ST – AT) ATLEV = (12,000 – 12,500) 1
= `500 (Adv.)Verification:LCV = LRV + LEV`2,000(Fav.) = `2,500 (Fav.) + `500 (adv.)`2,000 (Fav.) = `2,000(Fav.)Illustration 4.6From the following information, calculate labour varianceStandard wages:
Grade X : 90 Labourers at `2 per hourGrade Y: 60 Labourers at `3 per hour
Actual Wages:X: 80 Labourers at `2.50 per hourY: 70 Labourers at `2.00 per hour
Budgeted Hours = 1,000Actual Hours = 900Budgeted Gross Production = 5,000 unitsStandard Loss = 20%Actual loss = 900 unitsSolution:
Standard ActualGrade Time (Hours) Rate (`) Amount(`) Time (Hours) Rate (`) Amount (`)
X(901000)Y(601,000)
90,00060,000
1,50,000
23
1,80,0001,80,000
3,60,000
(80900)72,00063,000(70900)1,35,000
2.502.00
1,80,0001,26,000
3,06,000
(i) Labour Cost Variance (LCV):Standard Cost for actual production – actual Cost
Here actual production = 5,000 – 900 =4,100 unitsSo, Standard cost for actual Production:3,60,000
4,1004,000
`3,69,000
Standard Production (SP) = 5,000- 1,000 = 4,000 unitsLCV = `3,69,000 - `3,06,000
= `63,000 (Fav.)(ii) Labour Rate Variance (LRV): AT (SR – AR)Grade X = 72,000 (2 – 2.50) = `36,000 (Adv.)

Grade Y = 63,000 (3 – 2.00) = `63,000 (Fav.)= 27,000(Fav.)
(iii) Labour Efficiency Variance (LEV):SR (ST for actual Output – Actual Time)
ST for Grade X= 90,0004,100 92, 250 hrs
4,000
ST for Grade Y = 60,0004,100 61,500 hrs
4,000
LEV:Grade X = 2(92,250 – 72.000) = `40,500 (Fav.)Grade Y = 3(61,500 – 63,000) = `4,500 (Adv.)
= 36,000 (Fav.)Labour efficiency Variance can be further analysed as follows:(iv) Labour Mix Variance (LMV): SR (RST – Actual Time)
RST =Standard Time
Total Actual TimeTotal Standard Time
Grade X =90,000
1,35,000 81,000 hrs1,50,000
Grade Y =60,000
1,35,000 54,000 hrs1,50,000
LMV:Grade X = 2(81,000 – 72,000) = `18,000 (Fav.)Grade Y = 3(54,000 – 63,000) = `27,000 (Adv.)
= `9,000 (Adv.)(v) Revised Efficiency Variance (REV):SR (ST for actual Output – RST)Grade X = 2(92,250- 81,000) = `22,500 (Fav.)Grade Y = 3(61,500 – 54,000) = `22,500 (Fav.)
= `45,000 (Fav.)Verification:
1. LEV = LMV + REV`36,000 (Fav.) = `9,000 (Adv.) + `45,000(Fav.)`36,000 (Fav.) = `36,000 (Fav.)
2. LCV = LRV + LEV`63,000 (Fav.) = `27,000 (Fav.) + `36,000 (Fav.)`63,000 (Fav.) = `63,000 (fav.)
Note: Revised Efficiency Variance (REV) is equal to Labour Yield variance:Labour Yield Variance = Standard Cost per unit (Standard Output for Actual Mix – Actual Output)
Here, Standard Cost per unit =3,60,000
4,000 `90
Standard Output for Actual Mix =standard Output
Acutal MixStandard Mix
4,0001,35,000 3,600
1,50,000
Labour Yield Variance = 90 (4,100 – 3,600) = `45,000 (Fav.)Overhead Variances

Overhead variance is the difference between the standard overhead specified and actual overheadincurred.Overhead variance is divided into:
(A) Variable Overhead variance.(B) Fixed Overhead Variance
(A) Variable Overhead VarianceVariable cost varies in proportion to the level of output, while cost is fixed per unit. As such the
standard cost per unit of these overheads remains the same irrespective of the level of output attend.(1) Variable Overhead Cost Variances. The variable overhead cost variance represents the
difference between the standard cost of variable overhead for actual output and the actualvariable overhead incurred during the period.
Variable Overhead Cost Variance= (Actual Output St. Variable Overhead Rate per unit) - Actual Variable Overhead Cost
Or= (St. Hours for Actual Output St. Variable Overhead Rate per Hour)
Actual Variable Overhead Cost(2) Variable Overhead Expenditure Variance. It is the difference between the actual
variable overhead rate per hour and standard variable overhead rate per hour multipliedby the actual hours worked. It is also known as 'Budget Variance'.
Variable Overhead Expenditure Variance= (St. Variable Overhead Rate x Actual Hours) - Actual Variable Overheads
Or= Recovered Variable Overheads - Actual Variable Overheads(3) Variable Overhead Efficiency Variance. The variable overhead efficiency variance is
calculated by taking the difference in standard output and actual output multiplied by thestandard variable overhead rate.
Variable Overhead Efficiency Variable = St.Variable Overhead Rate (St. Quantity ActualQuantity) Or
= SVOR (SHAO AH)Where SVOR = Standard Variable Overhead Rate per hour; SHAO = Standard Hours for
Actual Output;AH = Actual Hours. Confirmation:Variable Overhead Variance = V.O. Expenditure Variance + V.O. Efficiency VarianceIllustration 4.7From the following information, calculate: (a) Variable Overhead Variance, (b) Variable Overhead
Expenditure Variance, and (c) Variable Overhead Efficiency Variance.1. Standard hours per unit: 3; Variable Overhead per hour: `52. Actual Variable Overhead incurred: ` 4,20,0003. Actual Output: 30,000 units4. Actual Hours worked: 1,00,000 hours.
Solution:(a) Variable Overhead Variance = Standard Variable Overhead - Actual Variable Overhead
= (3 ` 5 30,000 units) `4,20,000= `4,50,000 ` 4,20,000 = ` 30,000 (F)
(b) Variable Overhead Expenditure Variance= Standard Variable Overhead for Actual Time - Actual Variable Overhead = (StandardOverhead Rate Actual Hours) - A.V.O.
= (` 5 1,00,000 hours) - `4,20,000= ` 5,00,000 ` 4,20,000 = `80,000 (F)

(c) Variable Overhead Efficiency Variance = Standard Variable Overhead on Actual Production Standard Variable Overhead for Actual Time= (3 `5 30,000units)-( `51,00,000 hours)= ` 4,50,000-`5,00,000 = ` 50,000 (A)
Confirmation:Variable Overhead Variance = V.O. Expenditure Variance + V.O. Efficiency Variance.
` 30,000 (F) = ` 80,000 (F) + ` 50,000 (A)` 30,000 (F) = ` 30,000 (F).
(B) Fixed Overhead VarianceFixed overhead variance reveals all items of expenditure which are more or less remain constant
irrespective of level of output or number of hours worked. Fixed overhead variance depends upontwo factors, which are: (i) fixed expenses incurred and (ii) volume of production obtained.
The volume of production depends upon (a) capacity at which the factory works, (b) number ofdays factory works, and (c) efficiency at which factory works.
Classification of Fixed Overhead Variances(1) Fixed Overhead Cost Variance. It shows the difference between the standard cost of
fixed overheads recovered for actual output and actual cost of fixed overheads incurred.Fixed Overhead Cost Variance = Standard Fixed Overheads - Actual Fixed OverheadsOr= (Actual Output x Standard Fixed Overhead Rate) Actual Fixed Overheads Fixed OverheadCost Variance may be classified as:(a) Fixed Overhead Expenditure Variance;(b) Fixed Overhead Volume Variance.
(2) Fixed Overhead Expenditure Variance. It is that part of fixed overhead cost variancewhich arises due to the difference between budgeted fixed overhead expenditure and theactual fixed overhead expenditure relating to a specified period.Fixed Overhead Expenditure Variance = Budgeted Fixed Overheads - Actual Fixed Overheads
Or
= (Standard Overhead Rate x Budgeted Output) - Actual Overhead Rate x Actual Output)
(3) Fixed Overhead Volume Variance. This variance reveals the difference between fixed overheadrecovered on actual output and fixed overheads on budgeted output. It is the result of difference involume of production multiplied by the standard rate. Fixed Overhead Volume Variance =Recovered Fixed Overheads - Budgeted Fixed Overheads
Or

= (Actual Output x Standard Overhead Rate) - (Budgeted Output x Standard Overhead Rate) Fixedoverhead volume variance can further be analysed as (a) Fixed Overhead Efficiency Variance, (b)Fixed Overhead Capacity Variance and (c) Fixed Overhead Calendar Variance
3 (a) Fixed Overhead Efficiency Variance. It is that part of fixed overhead volume variance which isdue to the difference between the budgeted efficiency of production and the actual efficiencyattained. The actual quantity produced and standard quantity fixed might be different because ofhigher or lower efficiency of workers employed in manufacturing of goods. Fixed OverheadEfficiency Variance = Recovered Fixed Overheads - Standard Overheads
Or= Standard Overhead Rate (Actual Quantity - Standard Quantity)
3 (b) Fixed Overhead Capacity Variance. The variance which is related to the over or underutilisation of plant capacity is known as fixed overhead capacity variance. Strikes, lock-out, idletime, etc., lead to under-utilisation and overtime, extra shift, etc., lead to over-utilisation. FixedOverhead Capacity Variance = Standard Overhead Rate per unit (Revised Budgeted Output -Budgeted Output)
OrHours = Standard Rate per hour (Revised Budgeted Hours - Budgeted Hours) Whereas, RevisedBudgeted Nos. = Actual Working days x Budgeted Hrs. per Day.
3 (c) Fixed Overhead Calendar Variance. It is that part of volume variance which arises due to thedifference between the number of working days anticipated in the budget period and the actualworking days in the budget period. The number of working days in the budget are arrived at bydividing the number of annual days by twelve. But the actual days of a month may be more or lessthan the standard days and with the result there may be calendar variance. Fixed OverheadCalendar Variance = possible Fixed Overheads - Budgeted Fixed Overheads
Or= (Standard Rate of Overhead per hour x Possible Hours)(Standard Overhead Rate per hour x Budgeted Hours)
Possible Hours = Standard Working hours per day x Actual Number of Working days.Or Fixed Overhead Calendar Revised Variance = (Standard Rate per hour/day) (Excess orDeficit Hours/Days Worked)Fixed Overhead Capacity Revised Variance = Standard Overhead - Possible Overhead
Illustration 4.8From the following data calculate Fixed Overhead Variances
Budgeted ActualOutput 20,000 units 18,000 unitsNumber of Working Days 25 28Fixed Overheads `40,000 `41,000There was an increase of 10% in capacitySolution:
Standard Overhead Rate =Standard Fixed Overheads
Standard Output40,000
=20,000 Units
`2.00
(a) Fixed Overhead Cost Variance= Standard Fixed Overheads - Actual Fixed Overheads= (Actual Output x Standard Fixed Overhead Rate)
- Actual Fixed OverheadsFOCV = (18,000 units ` 2.00) ` 41,000 = ` 36,000 ` 41,000

= ` 5,000 (A)(b) Fixed Overhead Expenditure Variance
= Budgeted Fixed Overheads - Actual Fixed OverheadsFOEV = ` 40,000 ` 41,000 = `1,000 (A)
(c) Fixed Overhead Volume Variance= Recovered Fixed Overheads - Budgeted Fixed Overheads= (Actual Output x Standard Overhead Rate)- (Budget Output x Standard Overhead Rate)= (18,000 units ` 2.00) (20,000 units x `2.00)
FOW = ` 36,000 ` 40,000 = ` 4,000 (A)(d) Fixed Overhead Efficiency Variance
= Standard Overhead Rate (Actual Quantity - Standard Quantity)Standard Quantity (without increase) = Budgeted Quantity
=20,000 unitsIncrease in Capacity @ 10% = 2,000 units Standard Production = 22,000 units(+) Standard Production for 3 days
i.e., 22,000units28 25 days 3 days 2640 units
25days
Thus, Standard Quantity after Increase of Capacity = 24.640 units. F.O.E.F.V = `3.00 (18,000 units 24,640 units) =` 13,280 (A)
(e) Fixed Overhead Capacity Variance= Standard Overhead Rate (Standard Output for Actual Time Budgeted Output)= Standard Overhead Rate (Revised Budgeted units Budgeted units)
= `2.00 [(20,000 + 20,00010
)100
= 20,000 units]
F.O.C.V = `2.00 (22.000 units - 20,000 units) = ` 4,000(F)
(f) Fixed Overhead Calendar Variance= Increase or Decrease in production due to more or less working days
Standard Overhead Rate per unit with the increase in capacity F.O.C.V = 2,640 units ` 2 = ` 5,280 (F)
Confirmation:Fixed Overhead Cost Variance = F.O. Expenditure Variance + F.O. Volume Variance
` 5,000 (A) = `1,000 (A) + ` 4,000 (A)` 5,000 (A) = ` 5.000 (A)
Fixed Overhead Volume Variance= F.O. Efficiency Variance + F.O. Capacity Variance +F.O. Calendar Variance`4,000 (A) = `13,280(A) + ` 4,000 (F) + ` 5,280 (F)` 4,000(A) = ` 13,280 (A) + `9,280 (F)` 4,000 (A) = ` 4,000(A)
Illustration 4.9Ankita Ltd. has furnished you the following data:
Budgeted Actual (July, 2014)Number of Working DaysProduction ( in units)Fixed Overheads (in `)
2520,00030,000
2722,00031,000
Budgeted Fixed Overhead Rate is `1.00 per hour. In July, 2014, the actual hours worked were 31,500.
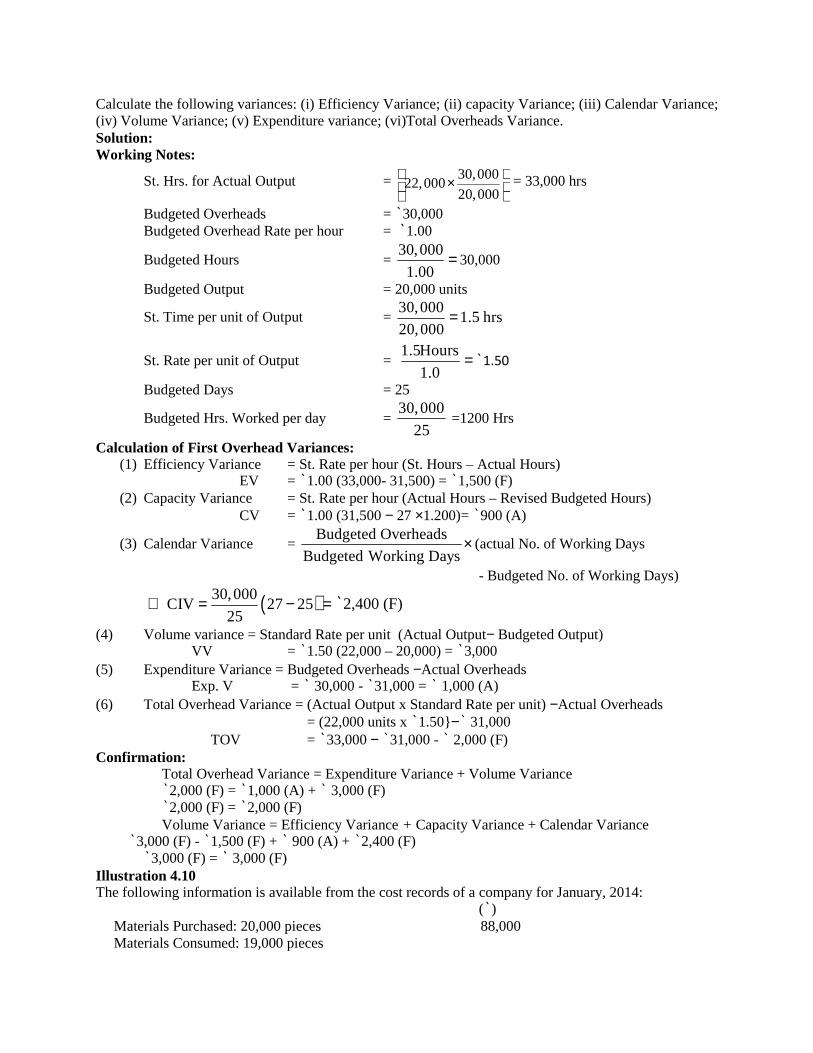
Calculate the following variances: (i) Efficiency Variance; (ii) capacity Variance; (iii) Calendar Variance;(iv) Volume Variance; (v) Expenditure variance; (vi)Total Overheads Variance.Solution:Working Notes:
St. Hrs. for Actual Output = 30,00022,000
20,000
= 33,000 hrs
Budgeted Overheads = `30,000Budgeted Overhead Rate per hour = `1.00
Budgeted Hours =30,000
1.00 30,000
Budgeted Output = 20,000 units
St. Time per unit of Output =30,000
1.5 hrs20,000
St. Rate per unit of Output =1.5Hours
1.0 `1.50
Budgeted Days = 25
Budgeted Hrs. Worked per day =30,000
25=1200 Hrs
Calculation of First Overhead Variances:(1) Efficiency Variance = St. Rate per hour (St. Hours – Actual Hours)
EV = `1.00 (33,000- 31,500) = `1,500 (F)(2) Capacity Variance = St. Rate per hour (Actual Hours – Revised Budgeted Hours)
CV = `1.00 (31,500 27 1.200)= `900 (A)
(3) Calendar Variance =Budgeted Overheads
Budgeted Working Days (actual No. of Working Days
- Budgeted No. of Working Days)
30,000CIV 27 25
25 `2,400 (F)
(4) Volume variance = Standard Rate per unit (Actual Output Budgeted Output)VV = `1.50 (22,000 – 20,000) = `3,000
(5) Expenditure Variance = Budgeted Overheads Actual OverheadsExp. V = ` 30,000 - `31,000 = ` 1,000 (A)
(6) Total Overhead Variance = (Actual Output x Standard Rate per unit) Actual Overheads= (22,000 units x `1.50}` 31,000
TOV = `33,000 `31,000 - ` 2,000 (F)Confirmation:
Total Overhead Variance = Expenditure Variance + Volume Variance`2,000 (F) = `1,000 (A) + ` 3,000 (F)`2,000 (F) = `2,000 (F)Volume Variance = Efficiency Variance + Capacity Variance + Calendar Variance
`3,000 (F) - `1,500 (F) + ` 900 (A) + `2,400 (F)`3,000 (F) = ` 3,000 (F)
Illustration 4.10The following information is available from the cost records of a company for January, 2014:
(`)Materials Purchased: 20,000 pieces 88,000Materials Consumed: 19,000 pieces

Actual Wages Paid: 4,950 Hours 24,750Factory Overheads Incurred 44,000Factory Overheads Budgeted 40,000Units Produced: 1,800Standard Rates and Prices are:Direct Material Rate `4 per piece
Standard Input 10 pieces per unitDirect Labour Rate `4 per hour
Standard Requirement 2.5 hours per unitOverhead `8 per labour hourRequired:
(a) Show the Standard Cost Card.(b)Compute all Material, Labour and Overhead Variances for January, 2014.
Solution:(a) Standard Cost Card
Per Unit m
DirectMaterialDirectLabourOverheads
— 10 pieces @ ` 4 per piece— 2.5 hrs @ `4 per hour— 2.5 hrs @ ` 8 per hourTotal Standard Cost
40102070
(b) Computation of Variances:I. Material Variances
(1) Total Material Cost Variance = Standard Cost of Material for Actual Output- Actual Material Cost
19 0001 800 10 88 000
20 000
,, pieces ` 4 ` ,,
TMCV = `72,000` 83,600 =` 11600 (A)(2) Material Price variance = Actual Qty. (St. Price - Actual Price)
MPV = 19,000 pieces88 000
420 000
` ,`,
= 19,000 pieces (`4 – `4.40) = `7,600 (A)(3) Material Usage Variance = St. Price (St. Qty. – A. Qty.)
MUV = `4.00 (18,000 19,000) = ` 4,000 (A)Confirmation:
TMCV = MPV + MUV` 11,600 (A) = ` 7,600 (A) + ` 4,000 (A)` 11,600 (A) = ` 11,600 (A)
II. Labour Variances(1) Total Labour Cost Variance — St. Cost of Labour for Actual Output
- Actual Labour Cost= (` 1,800 2.5 hrs x ` 4) ` 24,750
LTV = ` 18,000 ` 24,750 = ` 6,750 (A)(2) Labour Rate Variance = Actual hrs. (St. Rate per hour - Actual Rate per hour)
= 4,950 hrs.24 750
44 950
` ,`,
= 4,950 hrs. (`4 - `5)LRV = ` 4,950 (A)
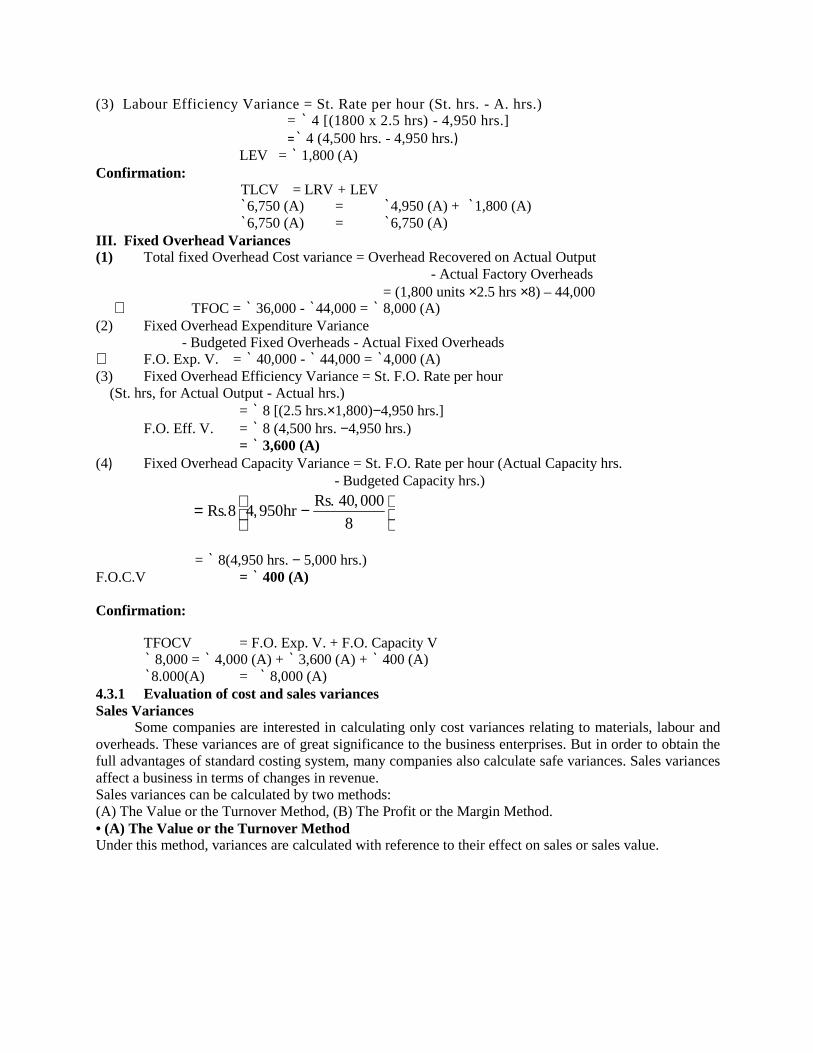
(3) Labour Efficiency Variance = St. Rate per hour (St. hrs. - A. hrs.)= ` 4 [(1800 x 2.5 hrs) - 4,950 hrs.]=` 4 (4,500 hrs. - 4,950 hrs.)
LEV = ` 1,800 (A)Confirmation:
TLCV = LRV + LEV`6,750 (A) = `4,950 (A) + `1,800 (A)`6,750 (A) = `6,750 (A)
III. Fixed Overhead Variances(1) Total fixed Overhead Cost variance = Overhead Recovered on Actual Output
- Actual Factory Overheads= (1,800 units 2.5 hrs 8) – 44,000
TFOC = ` 36,000 - `44,000 = ` 8,000 (A)(2) Fixed Overhead Expenditure Variance
- Budgeted Fixed Overheads - Actual Fixed Overheads F.O. Exp. V. = ` 40,000 - ` 44,000 = `4,000 (A)(3) Fixed Overhead Efficiency Variance = St. F.O. Rate per hour
(St. hrs, for Actual Output - Actual hrs.)= ` 8 [(2.5 hrs.1,800)4,950 hrs.]
F.O. Eff. V. = ` 8 (4,500 hrs. 4,950 hrs.)= ` 3,600 (A)
(4) Fixed Overhead Capacity Variance = St. F.O. Rate per hour (Actual Capacity hrs.- Budgeted Capacity hrs.)
Rs 40 000Rs 8 4 950hr
8
. ,. ,
= ` 8(4,950 hrs. 5,000 hrs.)F.O.C.V = ` 400 (A)
Confirmation:
TFOCV = F.O. Exp. V. + F.O. Capacity V` 8,000 = ` 4,000 (A) + ` 3,600 (A) + ` 400 (A)`8.000(A) = ` 8,000 (A)
4.3.1 Evaluation of cost and sales variancesSales Variances
Some companies are interested in calculating only cost variances relating to materials, labour andoverheads. These variances are of great significance to the business enterprises. But in order to obtain thefull advantages of standard costing system, many companies also calculate safe variances. Sales variancesaffect a business in terms of changes in revenue.Sales variances can be calculated by two methods:(A) The Value or the Turnover Method, (B) The Profit or the Margin Method.• (A) The Value or the Turnover MethodUnder this method, variances are calculated with reference to their effect on sales or sales value.

Classification of Sales Variances Based on Turnover
(1) Sales Value Variance (SVV): It shows the difference between the actual sales and thebudgeted sales. If the actual sales exceed the budgeted sales the variance is treated asfavourable and vice-versa.Sales Value Variance (SVV) = Actual Value of Sales - Budgeted Value of Sales
orSVV - (Actual Quantity Actual Selling Price)
(St. Quantity St. Selling Price)(2) Sales Price Variance (SPV): It is the that part of Sales Value Variance which arises due
to the difference between actual price and standard price of sales. If the actual priceattained is more than the standard price, the variance shall be favourable and vice-versa.Sales Price Variance {SPV) = Actual Quantity (Actual Selling Price - St. Selling Price)
(3) Sales Volume Variance (S.Vlm. V): It is that part of Sales Value Variance which arisesdue to the difference between the actual quantity sold and the standard quantity of sales.Sales Volume Variance (S. Vim. V) = St. Selling Price (Actual Quantity of Sales
St. Quantity of Sales)Sales Volume Variance can be further divided into:
3 (a) Sales Mix Variance (SMV): It is that part of Sales Volume Variance which arises due to thedifference between standard and actual composition of the sales mix. This variance arises onlywhen the business firm deals in more than one product. Sales Mix Variance (SMV) = St.Value of Actual Mix - St. Value of Revised St. Mix
orSMV = St. Selling Price (Actual Qty. - Revised St. Qty.)
3 (b) Sales Quantity Variance (SQV): It is that part of Sales Volume Variance which is due to thedifference between standard value of a actual sales at standard mix and the budgeted sales.Sales Quantity Variance (SQV) = Revised Standard Sales Value - Budgeted Sales Valueor SQV — Standard Selling Price per unit (Standard Proportion for
Actual Sales Quantity - Budgeted Quantity of Sales)or SQV — St. Selling Price per unit (Revised St. Mix - St. Mix)

Illustration 4.11
The budgeted sales for one month and the actual results achieved are as under:
Product Budget ActualQuantity(units)
Rate (`) Amount (`) Quantity(units)
Rate (`)
(`)
Amount (`)
M 1,000 10.00 10,000 1,200 12.50 15,000N 700 20.00 14,000 800 15.00 12,000O 500 30.00 15,000 600 30.00 18,000P
Total300
2,500
50.00 15,000 400 60.00 24,000
54,000 69,000
You are required to calculate in respect of each product, the Sales Variances.
Solution:(1) Sales Value Variance = Actual Value of Sales - Budgeted Value of Sales SVV = ` 69,000 ` 54,000 = ` 15,000 (F)(2) Sales Price Variance = Actual Qty. (Actual Selling Price - St. Selling Price)
M = 1200 (` 12.50 ` 10.00) = ` 3,000 (F)N = 800 (` 15.00 ` 20.00) = ` 4,000 (A)O = 600 (` 30.00 ` 30.00) = NilP = 400 (` 60.00 ` 50.00) = ` 4000 (F)
Total Sales Price Variance = ` 3.000 (F)(3) Sales Volume Variance = St. Selling Price (Actual Qty. - St. Qty.)
M = ` 10.00 (1200 - 1000) = ` 2,000 (F)N = ` 20.00 (800 - 700) = ` 2,000 (F)O = ` 30.00 (600 - 500) = ` 3,000 (F)P = ` 50.00 (400 - 300) = ` 5,000 (F) Total Sales Volume Variance = ` 12.000 (F)
3 (a) Sales Mix Variance = (St. Value of Actual Mix - St. Value of Revised St. Mix)or SMV = St. Selling Price (Actual Qty. Revised St. Qty.)
Whereas, Revised St. Qty. =Total Actual Mix of Sales
St.Qty.Total St. Mix of Sales
Revised St. Qty. for product M =3,000
10002,500
= 1,200 units
Revised St. Qty. for product N =3,000
7002,500
840 units
Revised St. Qty. for product O =3,000
5002,500
600 units
Revised St. Qty. for product P =3,000
3002,500
= 360 units
Sales Quantity Variance M = ` 10.00 (12001200) = Nil
N = ` 20.00 (800 840) = ` 800 (A)
O = ` 30.00 (600 600) = Nil

P = ` 50.00 (400 360) = ` 2,000 (F)Total Sales Mix Variance = ` 1,200 (F)
3 (b) Sales Quantity Variance - St. Selling Price (Revised St. Qty. - St. Qty.
M = ` 10.00 (1200 1000) = ` 2,000 (F)
N = ` 20.00 (840700) = ` 2,800 (F)
O = ` 30.00 (600 500) = ` 3.000 (F)
P = ` 50.00 (360 300) = ` 3,000 (F)
Total Sales Quantity Variance = ` 10.800 (F)
Confirmation:
Sales Value Variance = Sales Price Variance + Sales Volume Variance
` 15,000 (F) = ` 3,000 (F) + ` 12.000 (F)
`15,000 (F) = `15,000 (F)
Sales Volume Variance = Sales Mix Variance + Sales Quantity Variance
` 12,000 (F) = ` 1200 (F) + ` 10,800 (F)
` 12,000(F) = ` 12,000(F)
• (B) The Profit or Margin Method
The sales variances based on profit are also known as Sales Margin Variances which indicates thedeviation or difference between actual profit and standard or budgeted profit.
(1) Total Sales Margin Variance: This sales variance reveals the difference betweenactual profit and standard or budgeted profit.
Total Sales Margin Variance = Actual Profit - Budgeted Profitor = (Actual Qty. of Sales Actual Profit per unit)
- (Budgeted Qty. of Sales Budgeted Profit per unit)

(2) Sales Price Variance: It is that part of Total Sales Margin Variance per unit whichshows the difference between the standard price of the quantity of sales effected and theactual price of those sales.Sales Price Variance = Actual Qty. of Sales (Actual Profit per unit - Budgeted Profit per unit)or = (Actual Qty. of Sales St. Price) - (Actual Qty. of Sales Actual Price)
(3) Sales Volume Variance: It shows the difference between the actual units sold and thebudgeted quantity multiplied by either the standard profit per unit or the standardcontribution per unit.
Note: In Absorption Costing, standard profit per unit is used, but in Marginal Costing, standardcontribution per unit must be used,Sales Volume Variance = St. Profit per unit (Actual Qty. of Sales - St. Qty. of Sales)or = (St. Profit on Actual Qty. of Sales) - (St. Profit on St. Qty. of Sales)Sales Volume Variance can be further divided into:
3 (a) Sales Mix Variance: This variance arises only when the firm manufactures and sells morethan one type of product. This variance will be due to variation of actual mix and budgetedmix of sales.Sales Mix Variance - St. Profit per unit (Actual Qty. of Sales - Revised St. Qty. of Sales)or = Standard Profit - Revised Standard Profit
3 (b) Sales Quantity Variance: It is that part of Sales Volume Variance which arises due to thedifference between the standard profit and revised standard profit. Sales QuantityVariance = St. Profit per unit (St. Proportion for Actual Sales - Budgeted Qty. ofSales)or = Revised St. Profit - Budgeted Profitor = Budgeted Margin per unit on budgeted Mix (Total Actual Qty. - TotalBudgeted Qty.)
Illustration 4.12Rama Ltd. is manufacturing and selling three products X, Y and Z. The company has a
standard costing system and analysis the variances between the budget and the actuals periodically.The summarised working results for 2013-14 were as follows:
Product Budget ActualSelling Price
p. u.(`)Cost per unit(`)
No. of UnitsSold
Selling Pricep. u.(`)
Cost per unit(`)
No. of UnitsSold
X 50.00 16.00 20,000 48.00 15.00 24,000Y 40.00 12.00 28,000 42.00 12.50 24,000Z 30.00 9.00 32,000 31.00 10.00 30,000
(a) Calculate variances in profit during the period.(b). Analyse the variance in profit into: (1) Sales Price Variance; (2) Sales Volume Variance; (3)
Total Sales Margin Variance; (4) Sales in Quantity Variance; and (5) Sales Margin Mix Variance.Solution:
Working Notes:1 (a). Actual Margin per unit = Actual Sales Price per unit - St. Cost per unit
X = ` (4816) = `32Y = ` (4212) = `30Z = ` {31 9} = ` 22
1 (b). Budgeted Margin per unit - Budgeted Selling Price per unit - St. Cost per unitX = `(5016) = `34Y = ` (40 12) =` 28Z = ` (30 9) = ` 21

2 (a). Actual Profit = Actual Quantity of Units Sold x Actual Margin per unitX = 24,000 units ` 32 = ` 7,68,000Y = 24,000 units ` 30 = ` 7,20,000Z = 30.000 units `22 = ` 6.60,000
Total = ` 21.48.0002 (b). Budgeted Profit = Budgeted Quantity of Units Sold x Budgeted Profit per unit
X = 20,000 units `34 =` 6,80,000Y = 28.000 units ` 28 = ` 7,84,000Z = 32,000 units `21 =` 6,72,000
Total = ` 21,36,0003 (a). Budgeted Margin per unit on Actual Mix
34 24,000 28 24,000 21 30,000
24,000 24,000 30,000 units
8,16,000 6,72,000 6,30,000
78,000 units
21,18,000
78,000 units = `27.154
3 (b). Budgeted Margin per unit on Budgeted Mix
34 20,000 28 28,000 21 32,000
20,000 28,000 32,000 units
6,80,000 7,84,000 6,72,000
80,000 units
21,36,000
80,000 units = `26.70
Calculation of Sales Margin Variances:(1) Sales Margin Price Variance = Actual Qty. {Actual Margin per unit
Budgeted Margin per unit)X = 24,000 units (` 32 ` 34) = ` 48,000 (A)Y = 24.000 units (`30 ` 28) = ` 48,000 (F)Z = 30,000 units (` 22 `21) = ` 30,000 (F)Total Sales Margin Price Variance =` 30.000 (F)
(2) Sales Margin Volume Variance = Budgeted Margin per unit (Actual Qty. - Budgeted Qty.)X = ` 34 {24,000 units 20,000 units =` 1.36,000 (F)Y = ` 28 (24,000 units 28,000 units) = ` 1,12,000 (A)Z = ` 21 {30,000 units 32,000 units) = ` 42,000 (A)
Total Sales Margin Volume Variance =` 18,000 (A)(3) Total Sales Margin Variance = Actual Profit - Budgeted Profit
= ` 21,48,000 ` 21,36,000 = `12,000 (F)(4) Sales Margin Quantity Variance = Budgeted Margin per unit on Budgeted Mix
(Total Actual Qty. Total Budgeted Qty.)= ` 26,70 (78,000 units - 80,000 units)
Total Sales Margin Qty. Variance = ` 53,400 (A)(5) Sales Margin Mix Variance = Total Actual Qty. (Budgeted Margin per unit on Actual Mix
Budgeted Margin per unit on Budgeted Mix)

= 78,000 units (` 27.154 ` 26.70) . Total Sales Margin Mix Variance = ` 35,412 or ` 35,400
Confirmation:Total Sales Margin Variance = Sales Margin Price Variance + Sales Margin Volume Variance
` 12,000 (F) = ` 30,000 (F) + ` 18,000 (A)` 12,000 (F) = ` 12,000 (F)
Sales Margin Volume Variance = Sales Margin Qty. Variance + Sales Margin Mix Variance`18.000 (A) = ` 53.400 (A) + ` 35,400 (F)`18,000 (A) = ` 18,000 (A)
• Disposition of VariancesWhen standard costs are used by a business enterprise only as a statistical data and are not enteredin the books of account, the disposition of variances is not needed since no adjustments are required forvariances in such a case. But when standard costs are incorporated into accounting system throughwork-in-progress, finished goods and cost of goods sold accounts, the adjustment and disposition ofvariances is required. There is no hard and fast rule regarding the disposition of variances nor there is anysingle way of dealing with them. Hence, the method which will be adopted depends on the accountantsattitude and the practice that is followed by the business enterprise. However, the following methods maybe usually applied:
(1) Transfer to Costing Profit and Loss Account: According to this method, theunfavourable variances are debited to Costing Profit and Loss Account whereasfavourable variances are credited to Costing Profit and Loss Account, at the end ofaccounting period. Thus, work-in-progress, finished goods, and cost of goods soldaccounts are maintained at standard cost. This method has the significance of quick anduniform valuation of stocks and shows the different variances separately to enable themanagement to pay dual attention quickly and correctly.
(2) Allocation of Variances to Stocks and Cost of Sales: According to this method, costvariances are allocated among finished goods, work-in-progress and cost of sales on the basisof units or value. As a result, the stocks and cost of sales will appear in the books of actualcost.
(3) Transfer of Variances to Reserve Account: The variances, whether favourable orunfavourable are transferred to a Reserve Account to be carried forward to the nextaccounting period as deferred 'debits' or 'credits'. If variances are favourable, they areshown on liability side of Balance Sheet. On the other hand, if variances areunfavourable, they are shown on asset side of Balance Sheet.
4.4 SUMMARY Variances may be classified into two categories, “Favourable and unfavourable, Controllable and
uncontrollable variances. Variance is the Difference between standard and Actual is known as variance. Favourable variance will be designated by (F) and Adverse variance by (A). Revision variance represents the difference between the original standard cost nad the revised
standard cost. Direct material mix variance is that portion of the material usage variance which is due to the
difference between standard and actual composition of materials.4.5 KEY TERMS Actual production: is mean actual quantity produced during the actual hours worked. Standard Production: It means the quantity which have been produced during actual hours
worked. Budgeted cost: it means the budgeted quantity to be produced at the standard cost per unit. Standard cost: It means the actual quantity produced at the standard cost per unit. Material cost variance: Material cost variance is the difference between the standard cost of
materials specified for the actual output and actual cost of materials used.

Material price variance: Material price variance is the portion of the material cost variance whicharises due to the difference between the standard price specified and actual price paid.
Material usage variance: Material usage variance is the difference between the standard quantityspecified and the actual quantity used.
Material mix variance: Material mix variance is that portion of material usage variance which isdue to the difference between the standard and actual composition of as mixture.
Material yield variance: Material yield variance represents the portion of material usage variancewhich is due to the difference between the standard yield specified and the actual yield obtained.
Labour cost variance: it is the difference between the standard labour cost and actual labour costof the product.
4.6 SELF ASSESMENT QUESTIONS
1. What is standard costing? Explain its advantages and disadvantages.2. What is standard costing? Explain the requisites of standard costing method.3. Explain the procedure for determining standards.4. Distinguish between the following:5. Standard Cost and Estimated Cost, (b) Standard Costing and Budgetary Control.6. What do you mean by variances? What are its different kinds and explain it?7. What do you mean by 'Analysis of Variances'? Explain briefly the various types of
variances.8. "Standard Costing is always accompanied by a system of budgeting, but budgetary
control may be operated in business where standard costing would be impracticable."Comment.