beamforming for doa and localization in sensor networks dr. kung yao distinguished professor...
TRANSCRIPT
Beamforming for DOA and Localization in Sensor Networks
Dr. Kung YaoDistinguished ProfessorElectrical Engineering Dept.
NSF Center for Embedded Networked SensingUCLA
Presentation at Aerospace Corp.Nov. 3, 2011
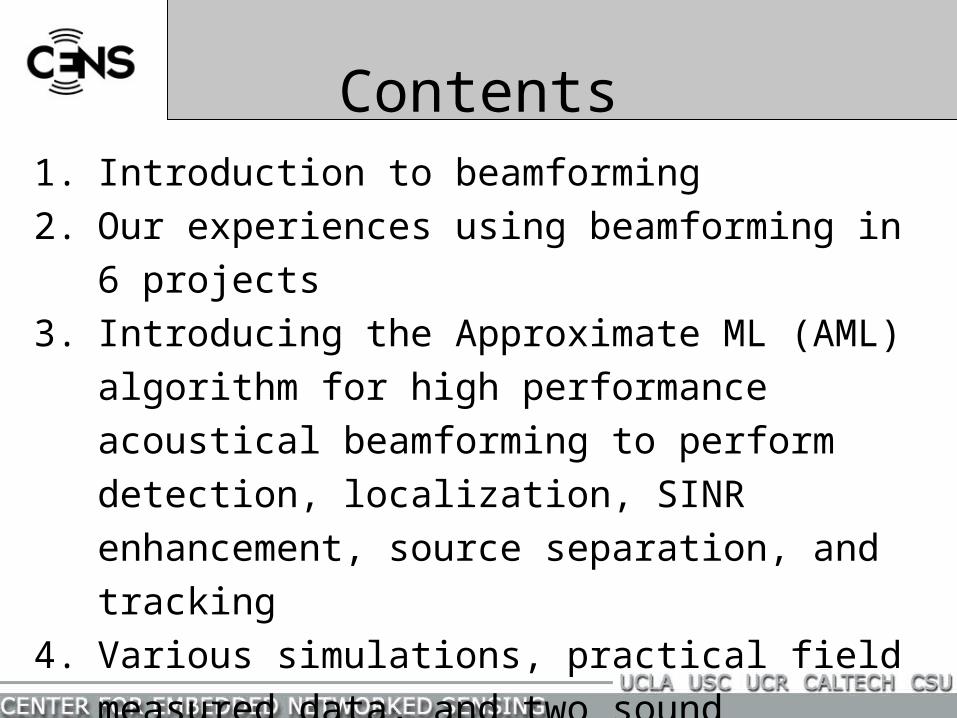
Contents1. Introduction to beamforming
2. Our experiences using beamforming in 6 projects
3. Introducing the Approximate ML (AML) algorithm
for high performance acoustical beamforming to
perform detection, localization, SINR
enhancement, source separation, and tracking
4. Various simulations, practical field measured
data, and two sound demonstrations illustrate the
usefulness of acoustical beamforming
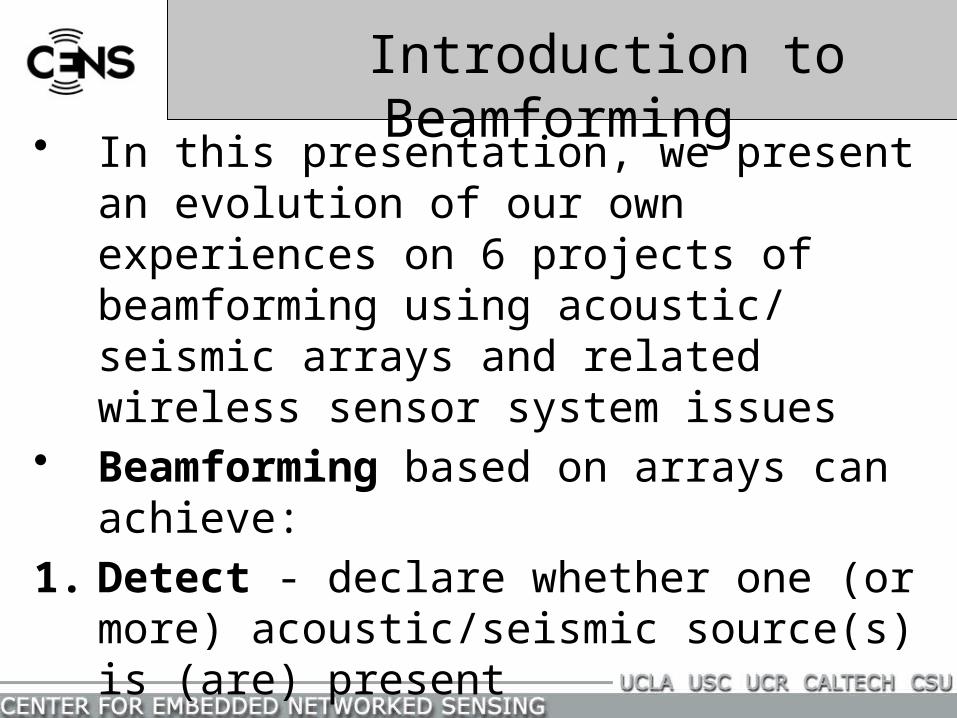
Introduction to Beamforming• In this presentation, we present an evolution
of our own experiences on 6 projects of beamforming using acoustic/ seismic arrays and related wireless sensor system issues
• Beamforming based on arrays can achieve:
1. Detect - declare whether one (or more) acoustic/seismic source(s) is (are) present
2. Increase SINR by enhancing desired signal
&/or reject/reduce unwanted signals/noises
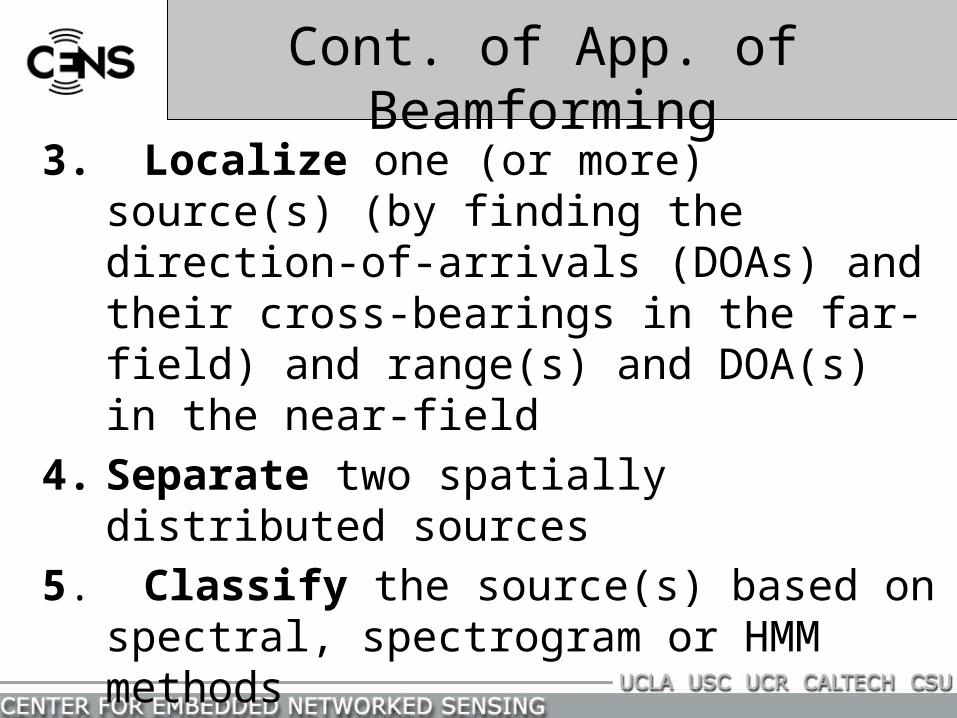
Cont. of App. of Beamforming
3. Localize one (or more) source(s) (by finding the direction-of-arrivals (DOAs) and their cross-bearings in the far-field) and range(s) and DOA(s) in the near-field
4. Separate two spatially distributed sources
5. Classify the source(s) based on spectral, spectrogram or HMM methods
6. Track one (or more) sources by Kalman/ Ext. Kalman or particle filtering methods
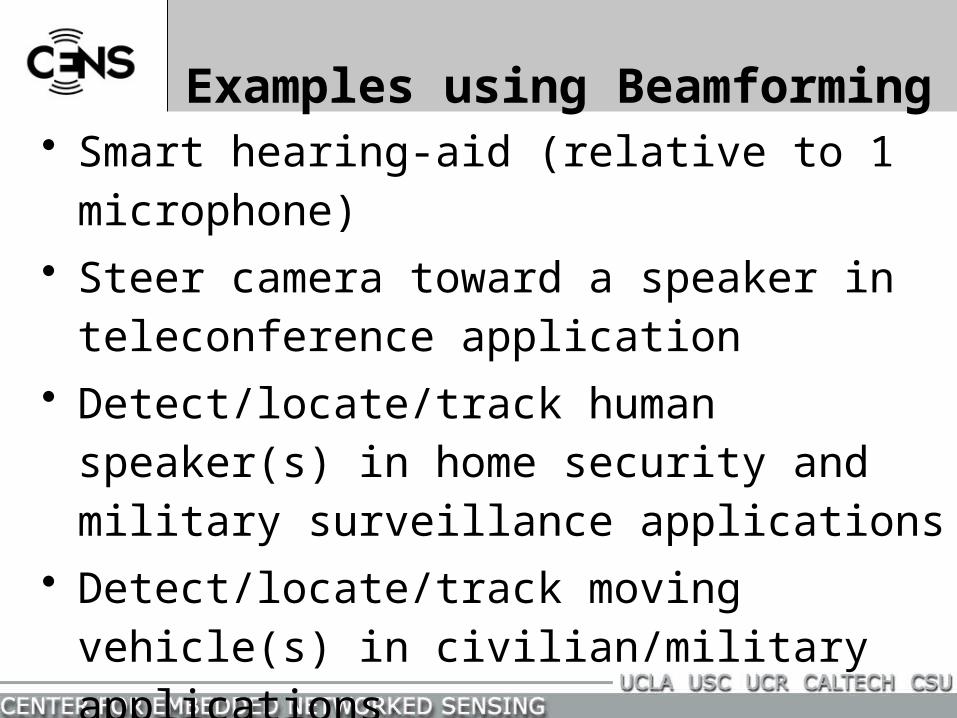
• Smart hearing-aid (relative to 1 microphone)
• Steer camera toward a speaker in teleconference application
• Detect/locate/track human speaker(s) in home security and military surveillance applications
• Detect/locate/track moving vehicle(s) in civilian/military applications
• Detect/locate/track/classify animal(s) in field biological studies
Examples using Beamforming
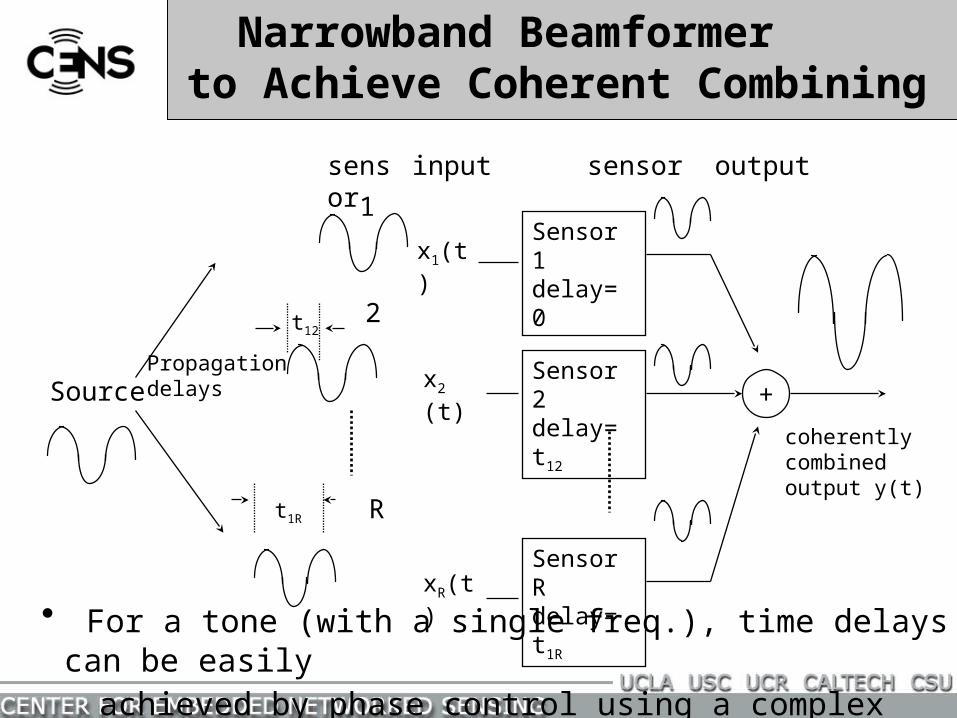
Sensor 1 delay= 0
Sensor 2 delay= t12
Sensor R delay= t1R
Source
x1(t)
sensor
input
1
Propagationdelays
R
x2 (t)
xR(t)
+
coherentlycombinedoutput y(t)
t1R
t122
sensor output
• For a tone (with a single freq.), time delays can be easily
achieved by phase control using a complex multipling weight
Narrowband Beamformer to Achieve Coherent Combining
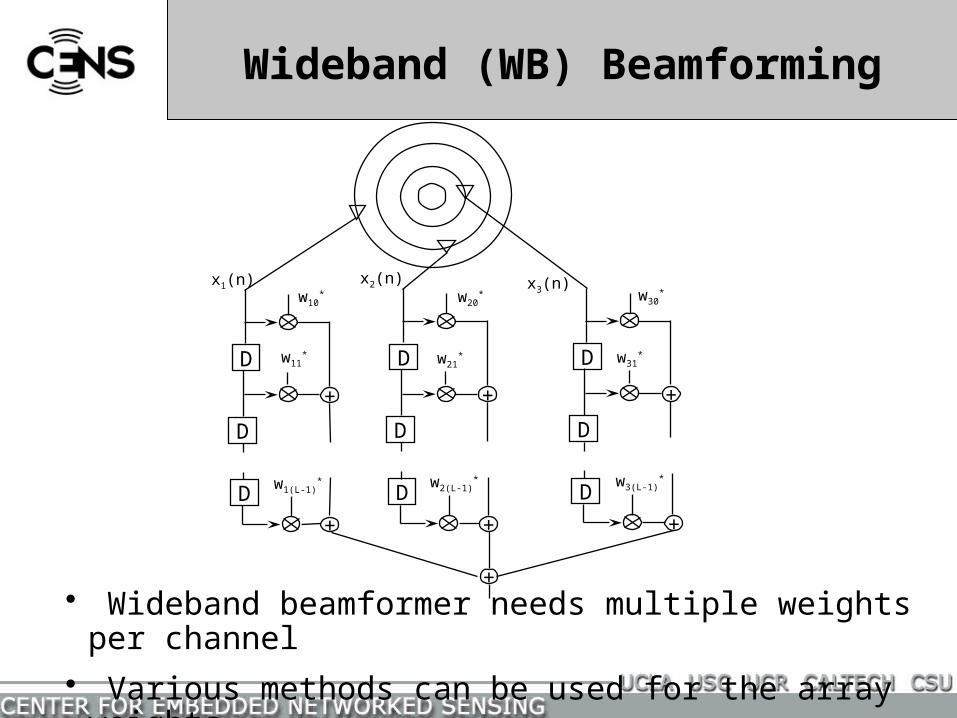
D
+
+
D
D
+
w10*
w11*
w20*
w1(L-1)*
D
+
+
D
D
w21*
w2(L-1)*
D
+
+
D
D
w30*
w31*
w3(L-1)*
x1(n) x2(n) x3(n)
• Wideband beamformer needs multiple weights per channel
• Various methods can be used for the array weights
Wideband (WB) Beamforming
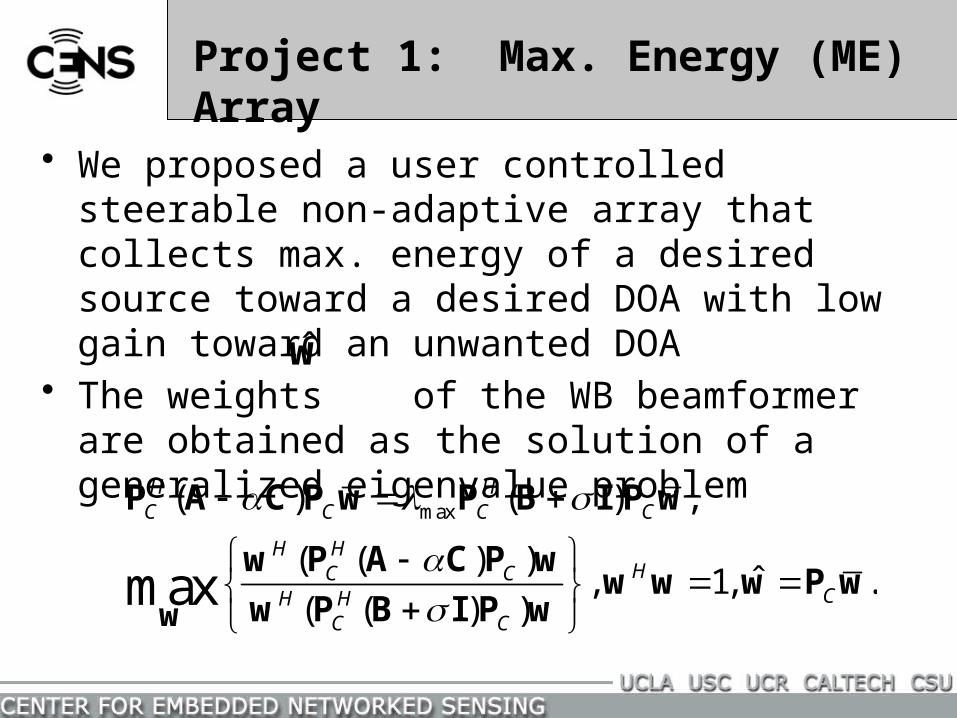
• We proposed a user controlled steerable non-adaptive array that collects max. energy of a desired source toward a desired DOA with low gain toward an unwanted DOA
• The weights of the WB beamformer are obtained as the solution of a generalized eigenvalue problem
w
max( ) ( ) ,
( ( ) )ˆ, 1, .
( ( ) )max
H HC C C C
H HHC C
CH HC C
w
P A C P w P B I P w
w P A C P ww w w P w
w P B I P w
Project 1: Max. Energy (ME) Array
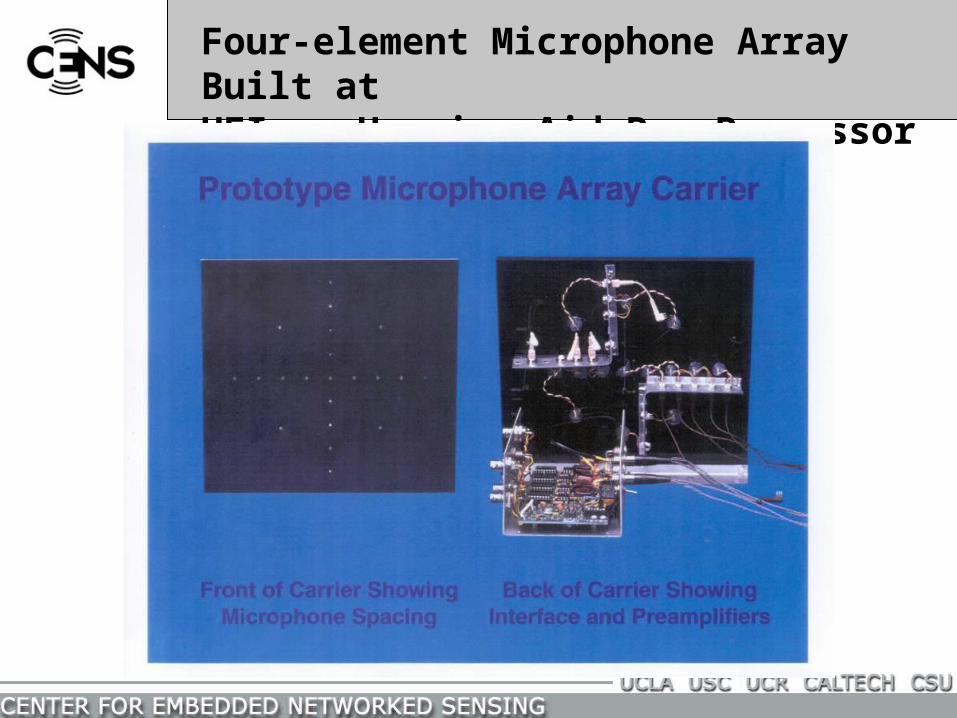
Four-element Microphone Array Built at HEI as Hearing-Aid Pre-Processor

Hearing Aid Beamformer• Hearing aid pre-processor steers a main beam
toward the desired speaker; also forms a low-gain beam toward the interferer
• Beamforming maximum energy criterion array uses 4 microphones as configured in the previous picture• Desired signal at 0;Interferer -30• Cases 1-3: S/I are both speeches;SIR=0 dB; • Cases 4-6: Intfererence is CN; SIR=-10dB• Case 1 Free space: Single microphone • Case 2 Free space: Array SIR = 22 dB • Case 3 Low/med. Reverberation: Array SIR = 12 dB
• Case 4 Free space: Single microphone
• Case 5 Free space: Array SIR = 21 dB
• Case 6 Low/med. Reverberation: Array SIR = 12 dB
y(t) = filtered array output
D
+
+
D
D
+
w10*
w11*
w20*
w1(L-1)*
D
+
+
D
D
w21*
w2(L-1)*
D
+
+
D
D
w30*
w31*
w3(L-1)*
x1(n) x2(n) x3(n)
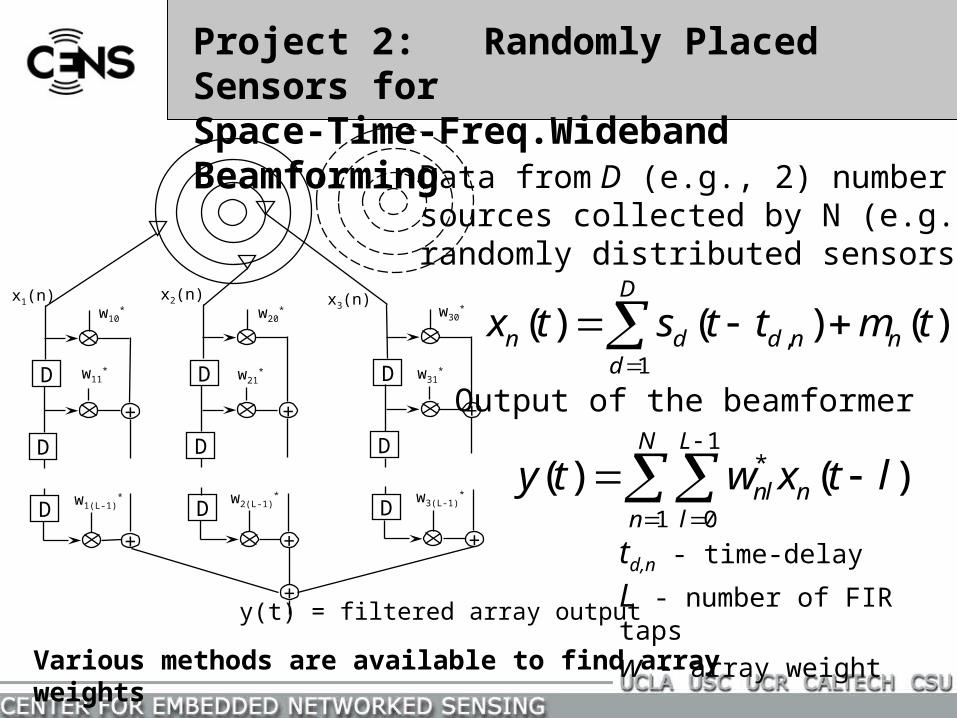
Data from D (e.g., 2) number of sources collected by N (e.g., 3)randomly distributed sensors
Output of the beamformer
td,n - time-delay
L - number of FIR taps
w - array weight
1*
1 0
( ) ( )N L
nl nn l
y t w x t l
,1
( ) ( ) ( )D
n d d n nd
x t s t t m t
Various methods are available to find array weights
Project 2: Randomly Placed Sensors forSpace-Time-Freq.Wideband Beamforming

Auto- and Cross-Correlation Matrices
Maximizing Beamformer Output
where w3L = [w10, w11,…,w1(L-1),…,w20,…,w2(L-1),…,w30,…,w3(L-1)]T
Time delays td, n est. from the w3L (Yao et al, IEEE JSAC, Oct. 1998)
the eigenvector of largest eigenvalue of R3Lw3L=3Lw3L (Szego Th.)is
Array Weight Obtained by Dominant Eigenvector of Cross-Correlation Matrix
11 22 331 1 2 2 3 3
12 21 121 2
13 31 131 3
23 32 232 3
11 12 13
21 22 233
31 32 33
{ }; { }; { },
{ }; ,
{ }; ,
{ }; ,
{ }
H H HL L L
H HL L L
H HL L L
H HL L L
L L LH
L L L L
L L L
E E E
E
E
E
E
R x x R x x R x x
R x x R R
R x x R R
R x x R R
R R R
R xx R R R
R R R
1 2 3, ,TT T T x x x x
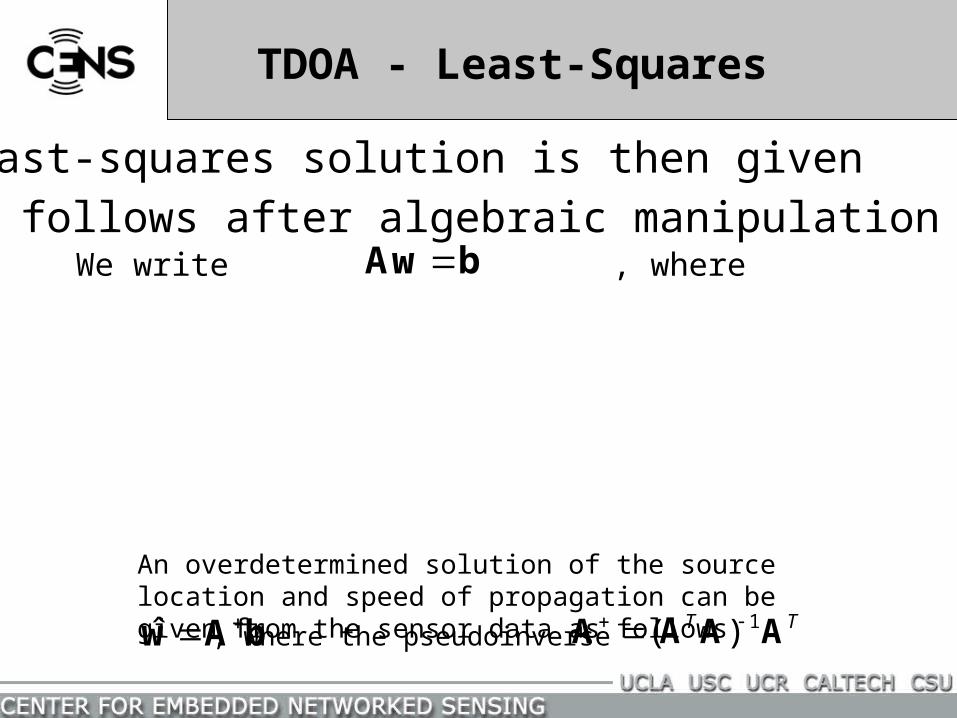
Least-squares solution is then given
as follows after algebraic manipulationWe write , where
, where the pseudoinverse
An overdetermined solution of the source location and speed of propagation can be given from the sensor data as follows
TDOA - Least-Squares
Aw b
ˆ w A b 1( )T T A A A A
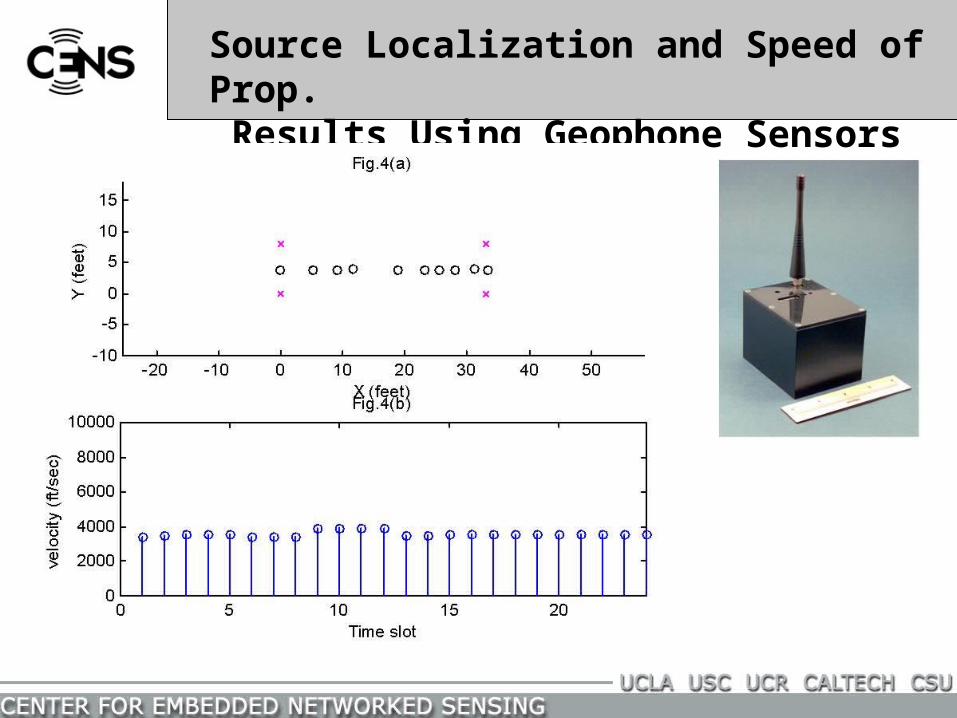
Source Localization and Speed of Prop. Results Using Geophone Sensors
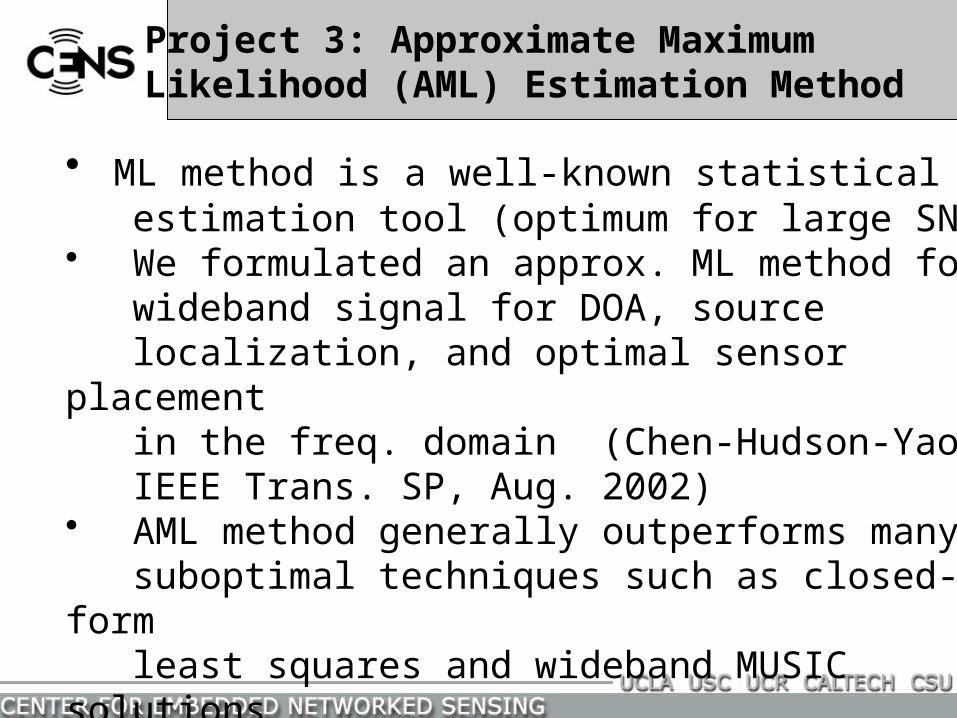
• ML method is a well-known statistical estimation tool (optimum for large SNR)• We formulated an approx. ML method for wideband signal for DOA, source localization, and optimal sensor placement in the freq. domain (Chen-Hudson-Yao, IEEE Trans. SP, Aug. 2002)• AML method generally outperforms many suboptimal techniques such as closed-form least squares and wideband MUSIC solutions• Has relative high complexity
Project 3: Approximate Maximum Likelihood (AML) Estimation Method
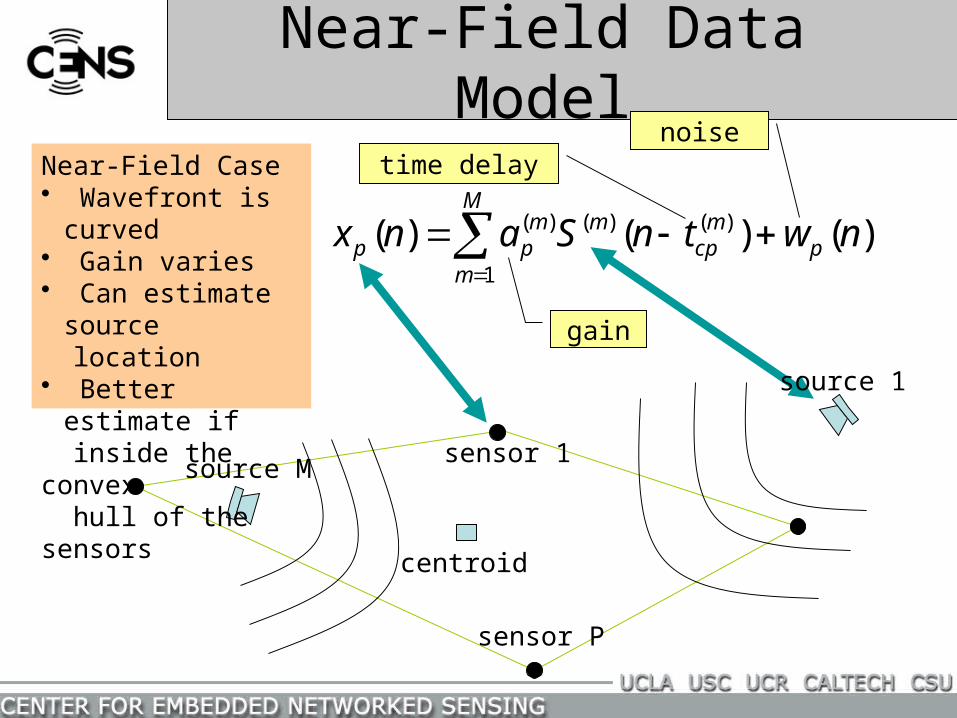
Near-Field Data Model
)()()( )(
1
)()( nwtnSanx pm
cp
M
m
mmpp
centroid
sensor 1
sensor P
source 1
source M
noisetime delay
gain
Near-Field Case• Wavefront is
curved• Gain varies• Can estimate
source location• Better estimate if inside the convex hull of the sensors
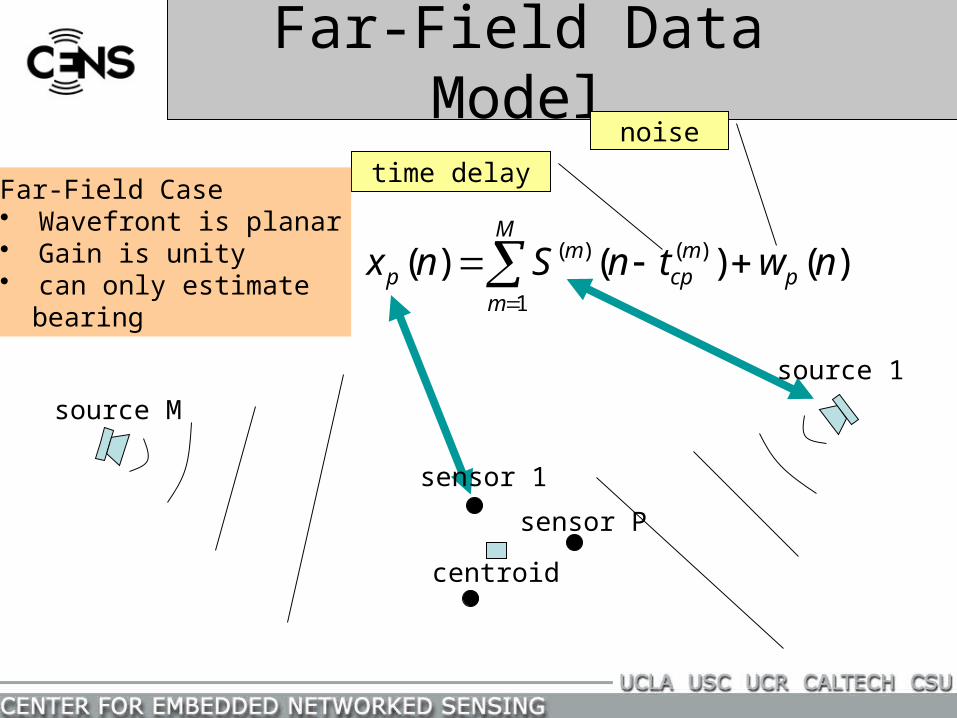
Far-Field Data Model
)()()( )(
1
)( nwtnSnx pm
cp
M
m
mp
centroid
sensor 1
sensor P
source 1
source M
noise
time delayFar-Field Case• Wavefront is planar• Gain is unity• can only estimate bearing

Wideband AML Algorithm (1)
)()()( )(
1
)( nwtnSnx pm
cp
M
m
mp
Data Model
FFT
Freq DomainModel
2/
1
2
,,||)()()(||min),(max
N
k
kkkL SDXSSS
Likelihoodfunction
)(
)(
)(
ee
ee 1
/ktj2/ktj2
/ktj2/ktj2
)()1(
)(1
)1(1
k
kS
kS
MNN
NN
Mcpcp
Mcc
WGN
Each column is a steering vector for each source

Wideband ML Algorithm (2)
2/
1
2
,,||)()()(||min),(max
N
k
kkkL SDXSSS
Likelihoodfunction
)()()(ˆ kkk XDS
2/,,1),(),()(ˆ Nkkkk MLML XDSSourceEstimate
Summation in Frequency
Estimated DOA
2/
1
2||)(),(||max)(maxN
k
kkJ XPSimplerLikelihoodfunction
),(),(),( kkk DDP
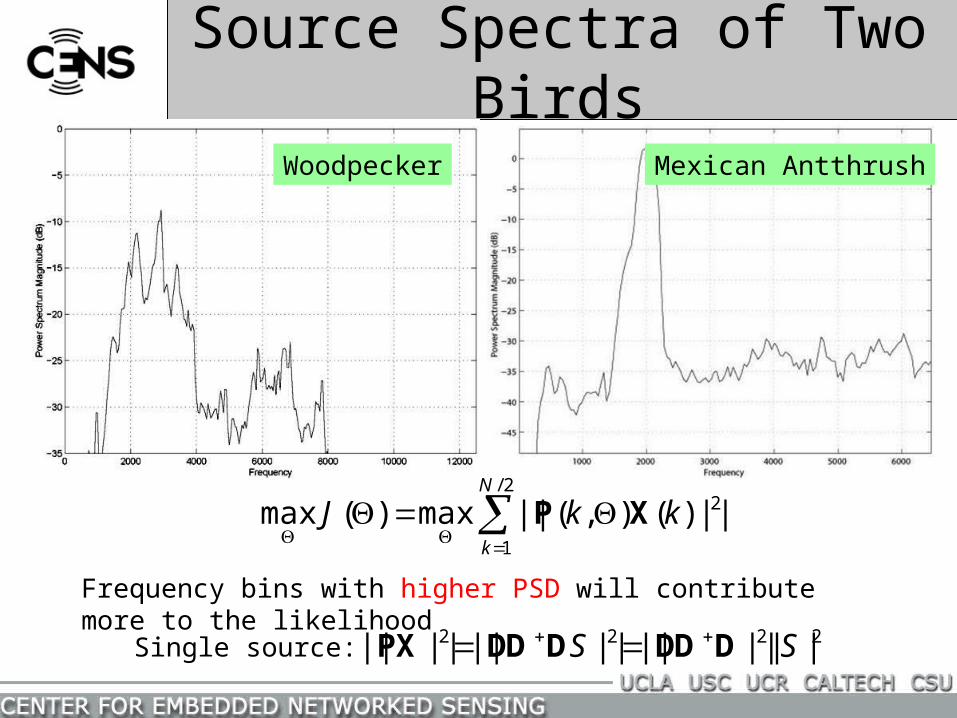
Source Spectra of Two Birds
Woodpecker Mexican Antthrush
Frequency bins with higher PSD will contribute more to the likelihood
2/
1
2||)(),(||max)(maxN
k
kkJ XP
2222 |||||||||||||| SS DDDDDDPX Single source:
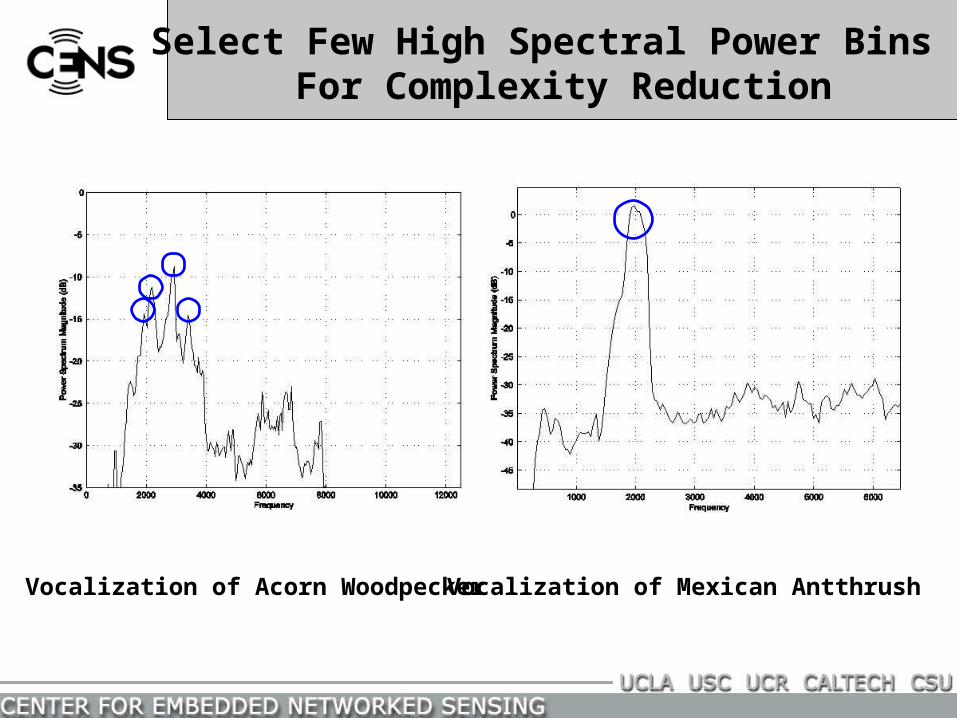
Vocalization of Acorn Woodpecker Vocalization of Mexican Antthrush
Select Few High Spectral Power Bins For Complexity Reduction
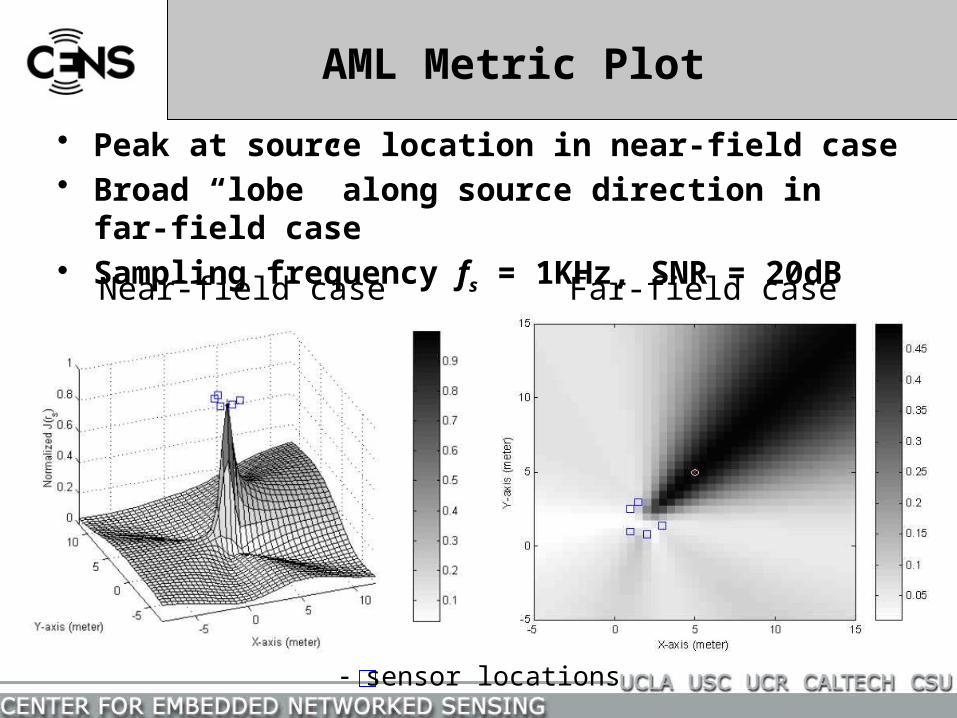
Near-field case Far-field case
• Peak at source location in near-field case• Broad “lobe” along source direction in far-field case• Sampling frequency fs = 1KHz, SNR = 20dB
sensor locations
AML Metric Plot

Data Collection in Semi-Anechoic Room at Xerox-Parc
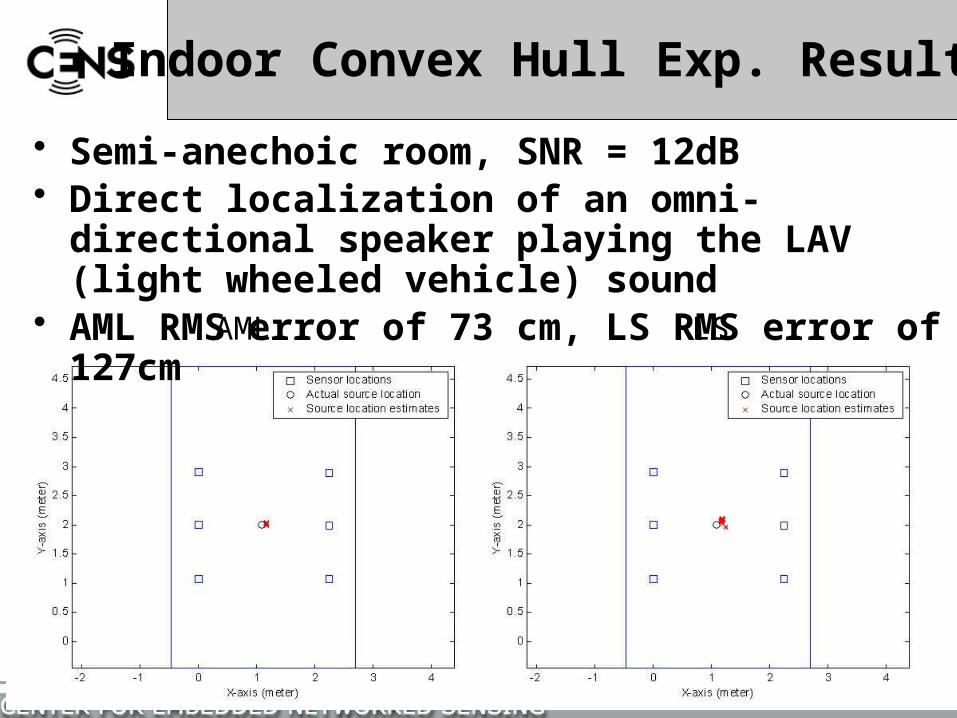
AML LS
• Semi-anechoic room, SNR = 12dB• Direct localization of an omni-directional speaker
playing the LAV (light wheeled vehicle) sound• AML RMS error of 73 cm, LS RMS error of 127cm
Indoor Convex Hull Exp. Results
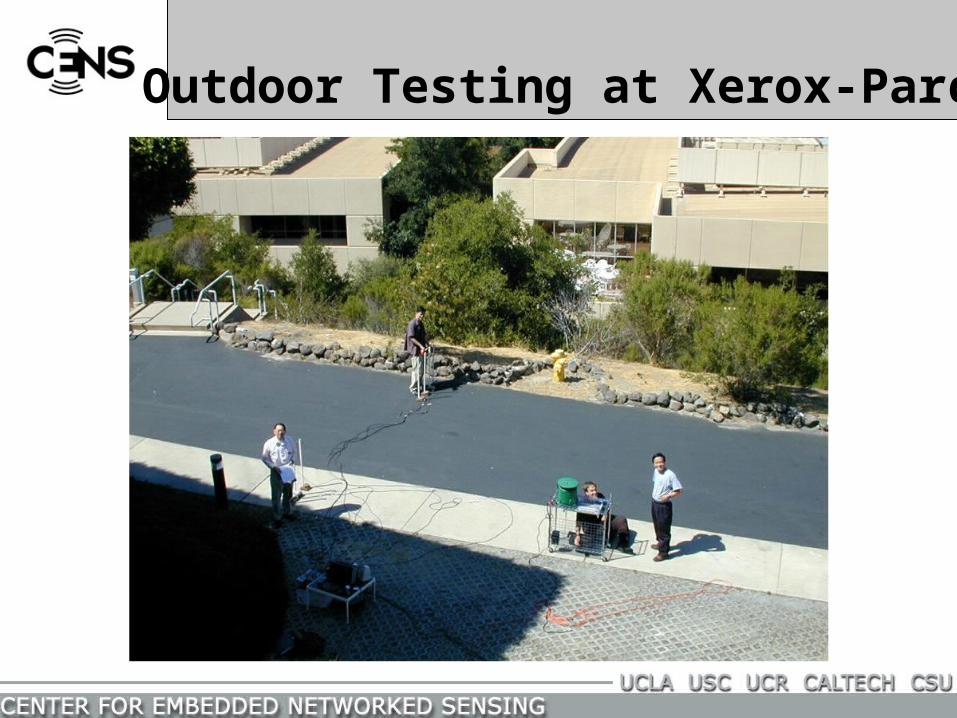
Outdoor Testing at Xerox-Parc
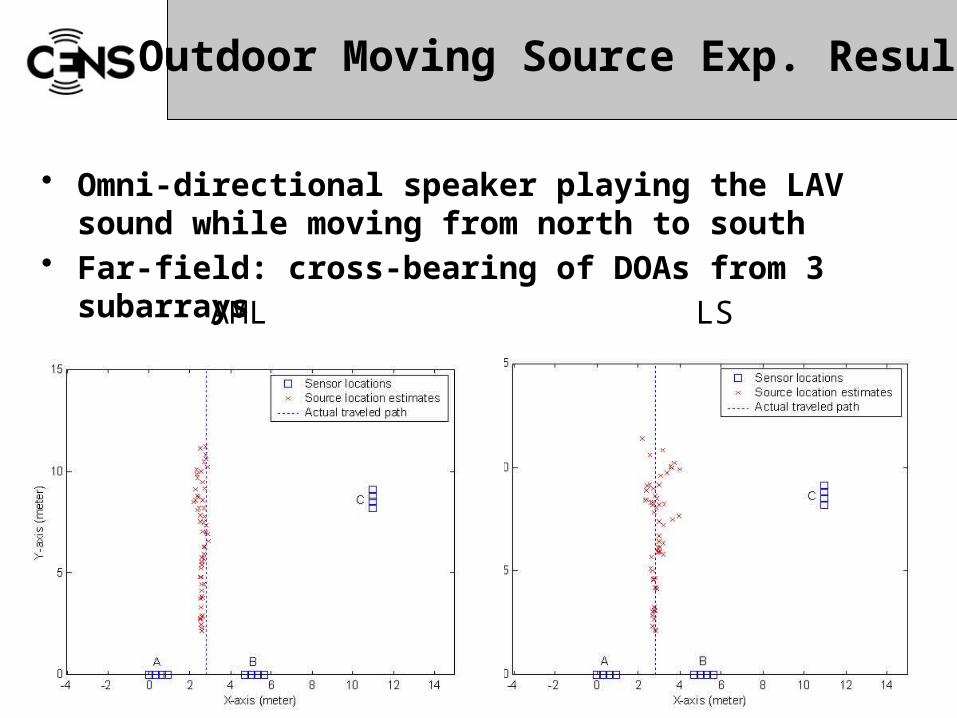
AML LS
• Omni-directional speaker playing the LAV sound while moving from north to south
• Far-field: cross-bearing of DOAs from 3 subarrays
Outdoor Moving Source Exp. Results
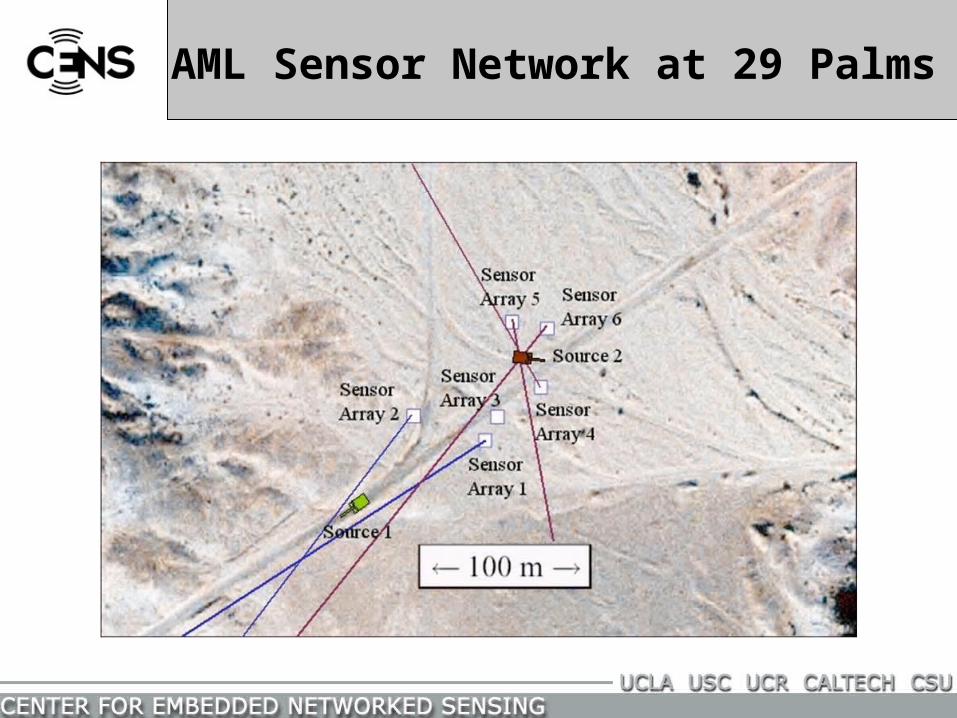
AML Sensor Network at 29 Palms
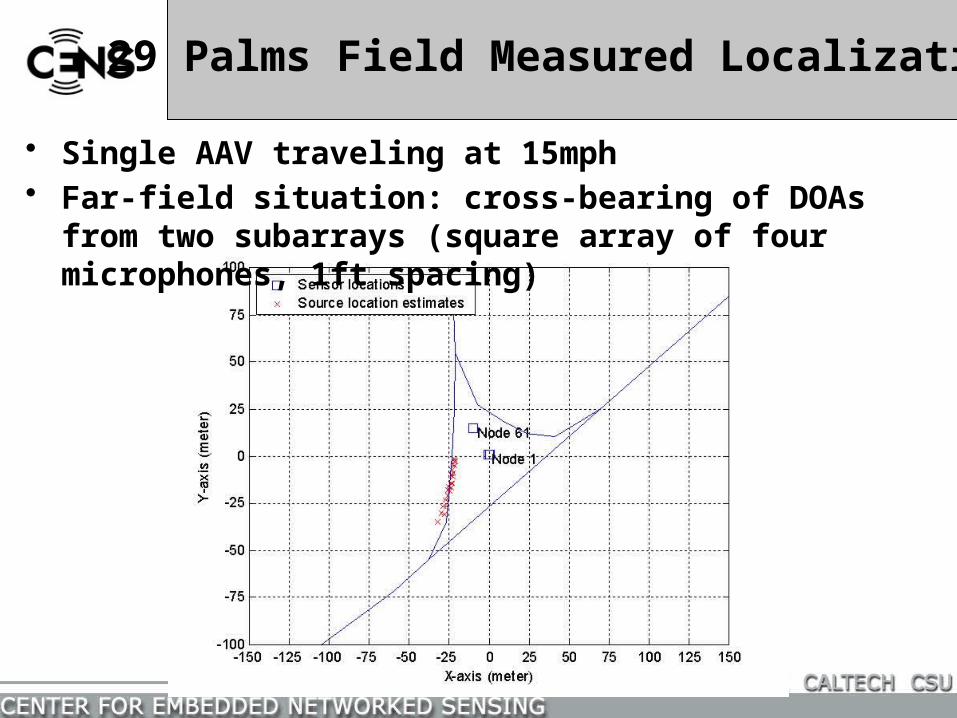
• Single AAV traveling at 15mph• Far-field situation: cross-bearing of DOAs from two
subarrays (square array of four microphones, 1ft spacing)
29 Palms Field Measured Localization
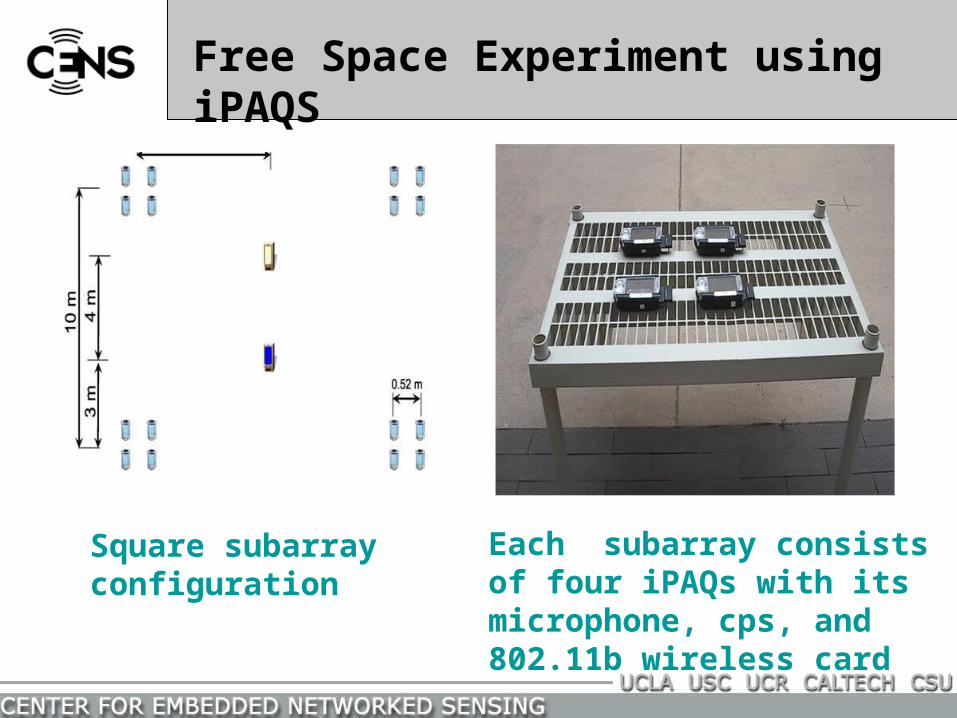
Square subarray configuration
Each subarray consists of four iPAQs with its microphone, cps, and 802.11b wireless card
Free Space Experiment using iPAQS
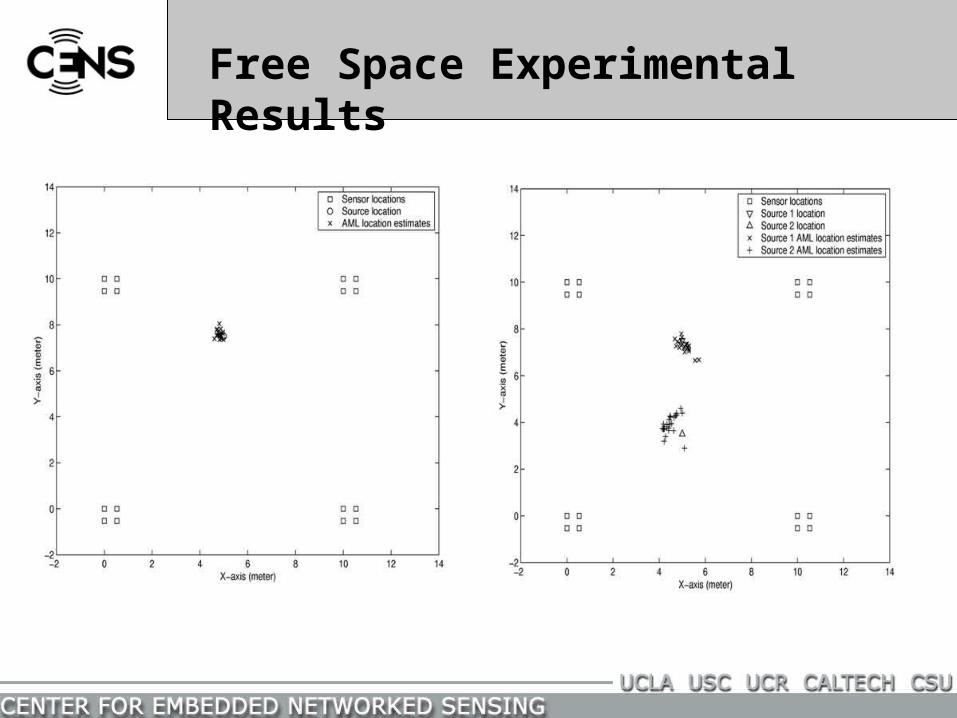
Free Space Experimental Results
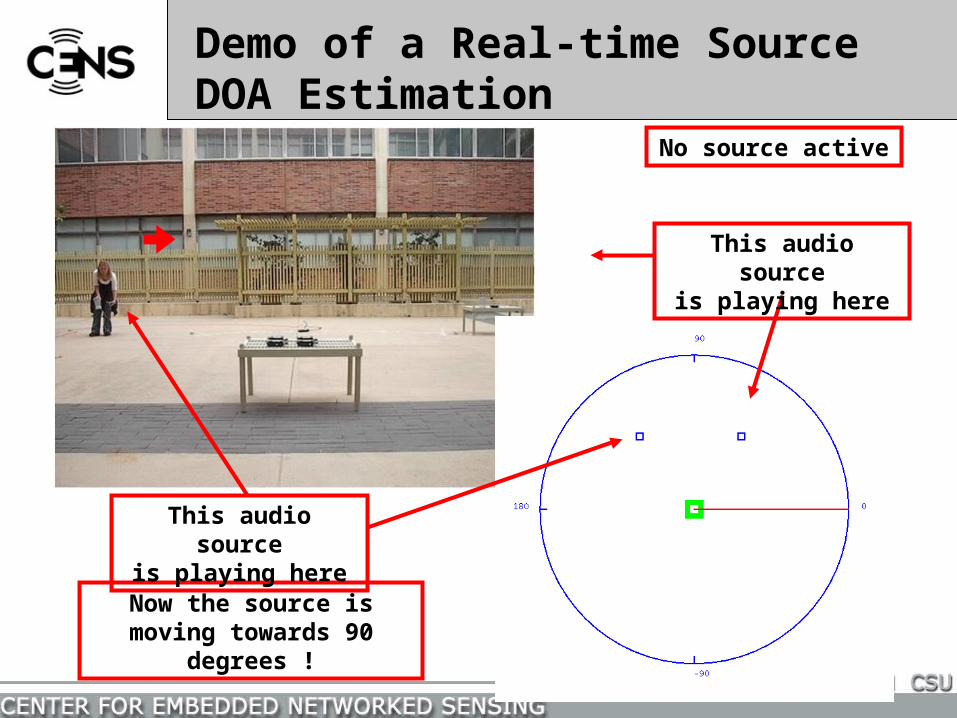
Now the source is moving towards 90 degrees !
No source active
This audio sourceis playing here
This audio sourceis playing here
Demo of a Real-time Source DOA Estimation
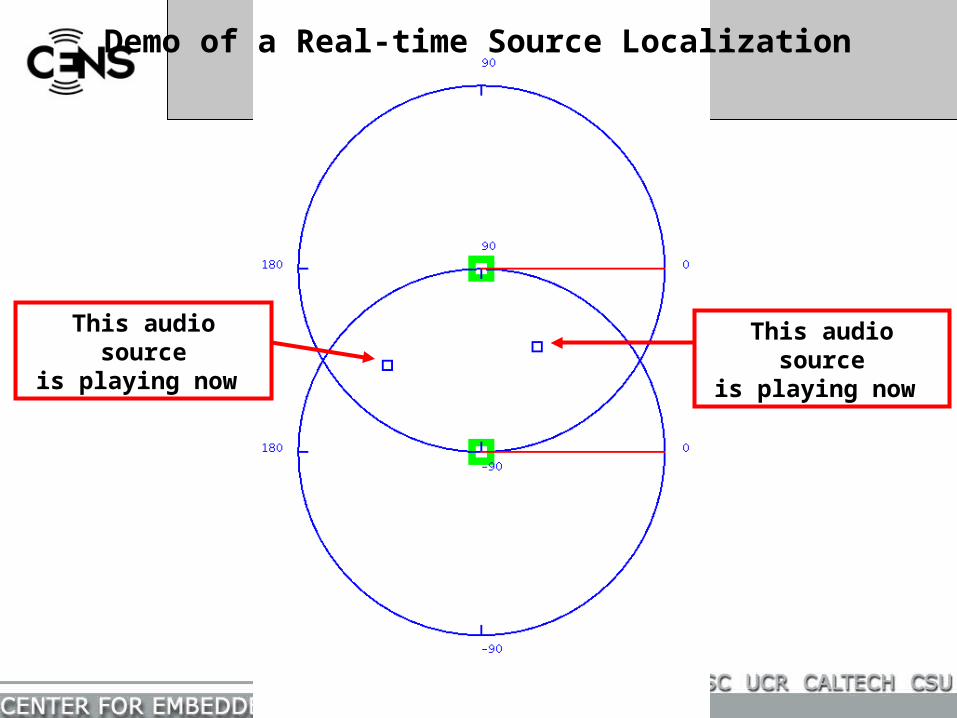
This audio sourceis playing now
This audio sourceis playing now
Demo of a Real-time Source Localization

Review of narrowband beamforming of a uniform linear array (ULA)
• Consider a narrowband source with wavelength λ
– If the inter-element spacing d >λ/2, grating lobes (lobe of the same
height of the mainlobe) will appear in the beampattern and results in
ambiguities in the DOA estimation. (spatial aliasing effect)
– The width of the lobes become narrower as d increases. (resolution
improves)
• For wideband signals, the beam-pattern is an average of the
beam-pattern of all frequency components.
(grating lobes become side-lobes)
• Uniform circular array is considered in our design, since we
have no preference in any azimuth angle.

Woodpecker, r=7.07 cm Woodpecker, r=2.83 cm
Antthrush, r=6.10 cm Antthrush, r=4.24 cm
Some facts:
Aperture
1)Width of mainlobe
(better resolution)
2)Number of
sidelobes
(less robust)
Optimal array size is
highly dependent on
the source spectrum
Beampattern of a 4-element UCA (1)
True DOA=60 degree
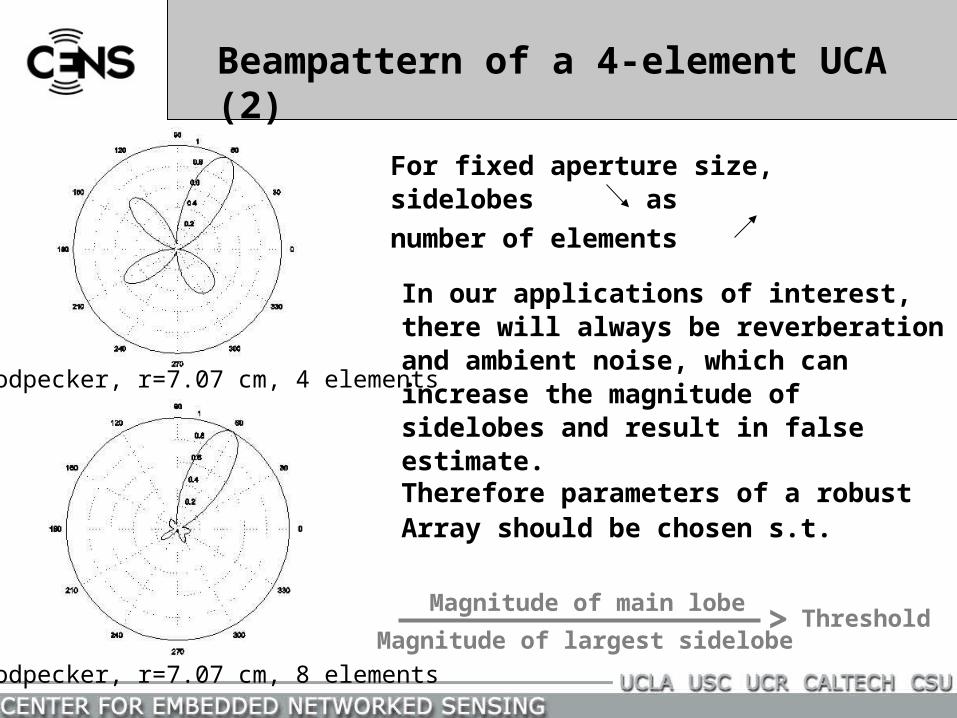
Woodpecker, r=7.07 cm, 4 elements
Woodpecker, r=7.07 cm, 8 elements
For fixed aperture size,sidelobes as
number of elements
In our applications of interest,there will always be reverberation and ambient noise, which can increase the magnitude of sidelobes and result in false estimate. Therefore parameters of a robustArray should be chosen s.t.
Magnitude of main lobe
Magnitude of largest sidelobe> Threshold
Beampattern of a 4-element UCA (2)
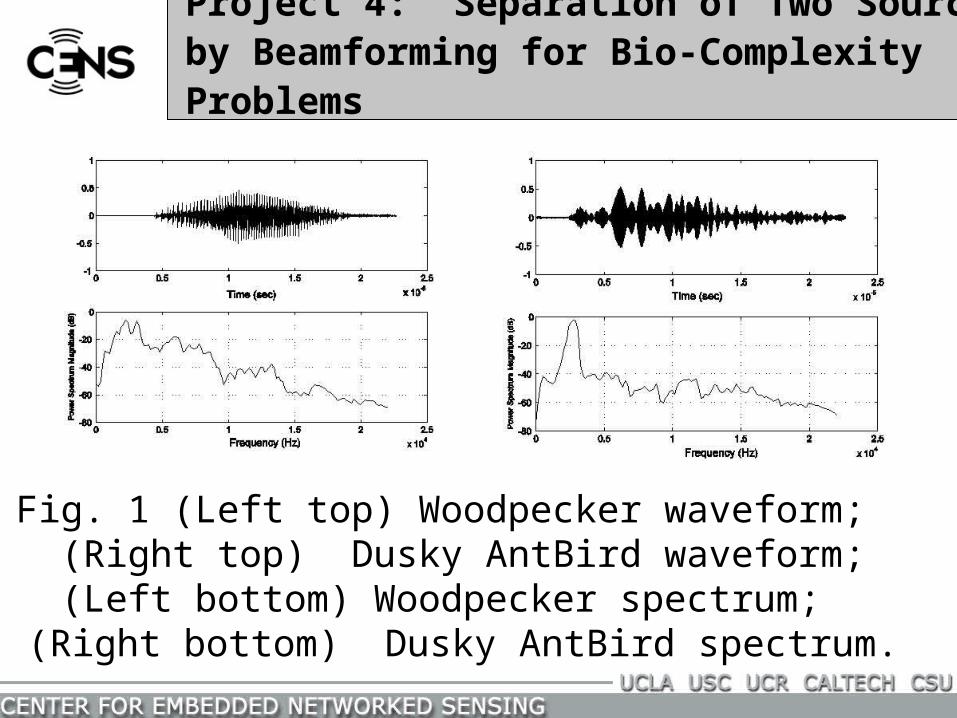
Project 4: Separation of Two Sources by Beamforming for Bio-Complexity Problems
Fig. 1 (Left top) Woodpecker waveform; (Right top) Dusky AntBird waveform;(Left bottom) Woodpecker spectrum;
(Right bottom) Dusky AntBird spectrum.
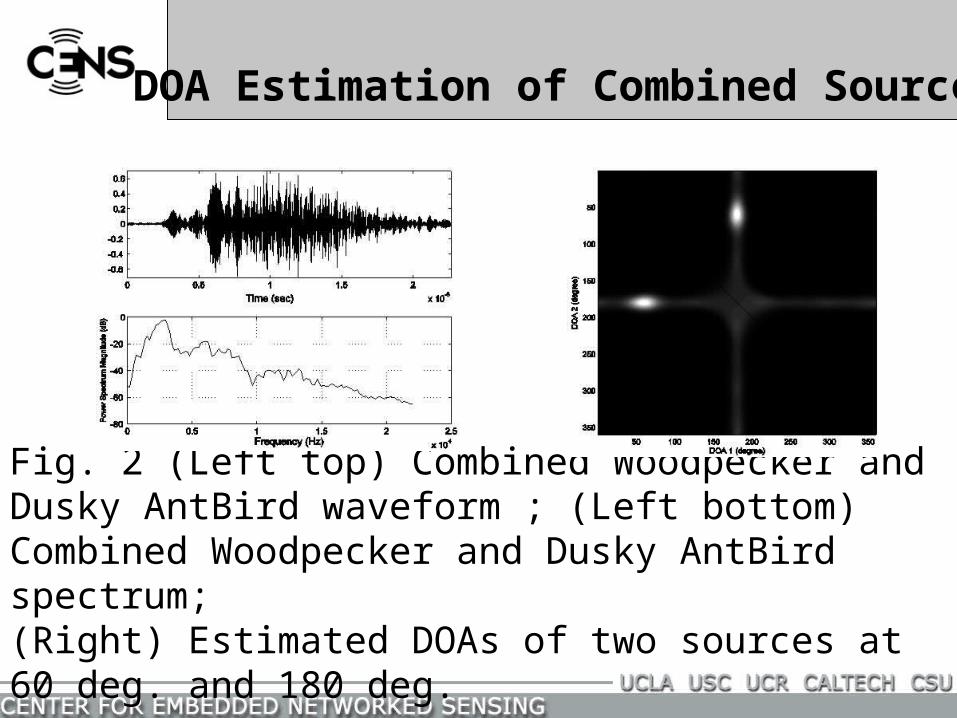
DOA Estimation of Combined Source
Fig. 2 (Left top) Combined Woodpecker and Dusky AntBird waveform ; (Left bottom) Combined Woodpecker and Dusky AntBird spectrum; (Right) Estimated DOAs of two sources at 60 deg. and 180 deg.
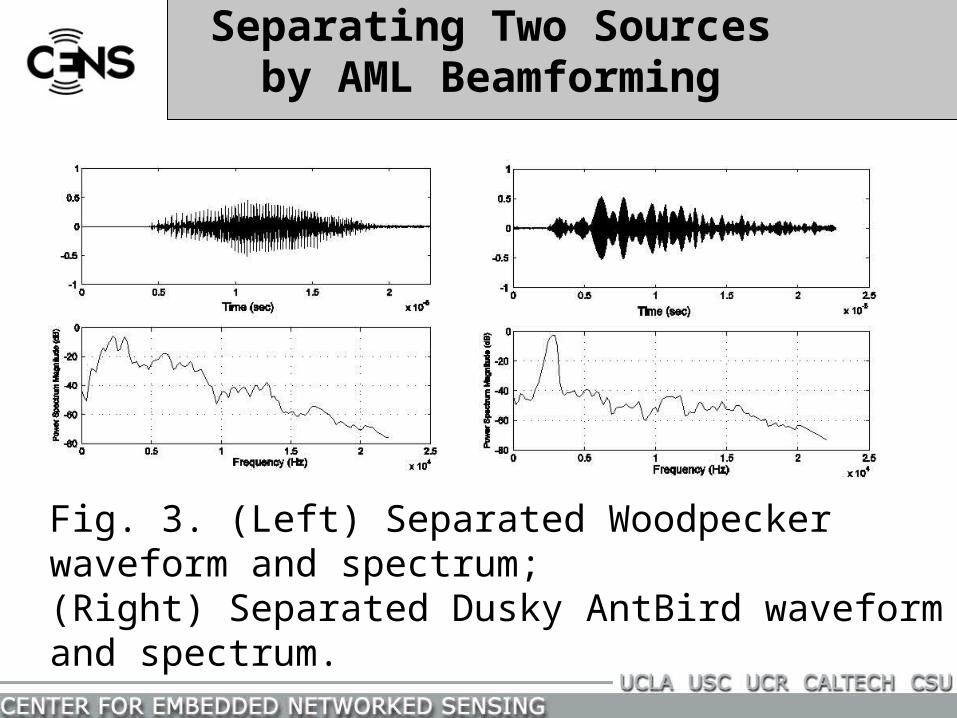
Separating Two Sourcesby AML Beamforming
Fig. 3. (Left) Separated Woodpecker waveform and spectrum; (Right) Separated Dusky AntBird waveform and spectrum.
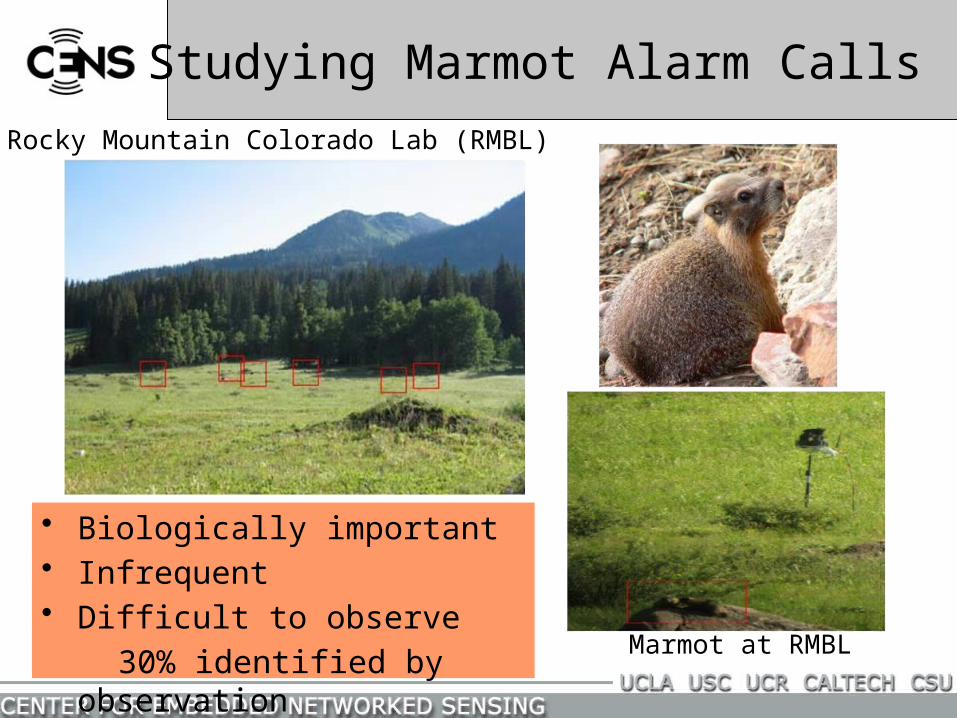
Studying Marmot Alarm Calls
• Biologically important• Infrequent• Difficult to observe
30% identified by observationMarmot at RMBL
Rocky Mountain Colorado Lab (RMBL)
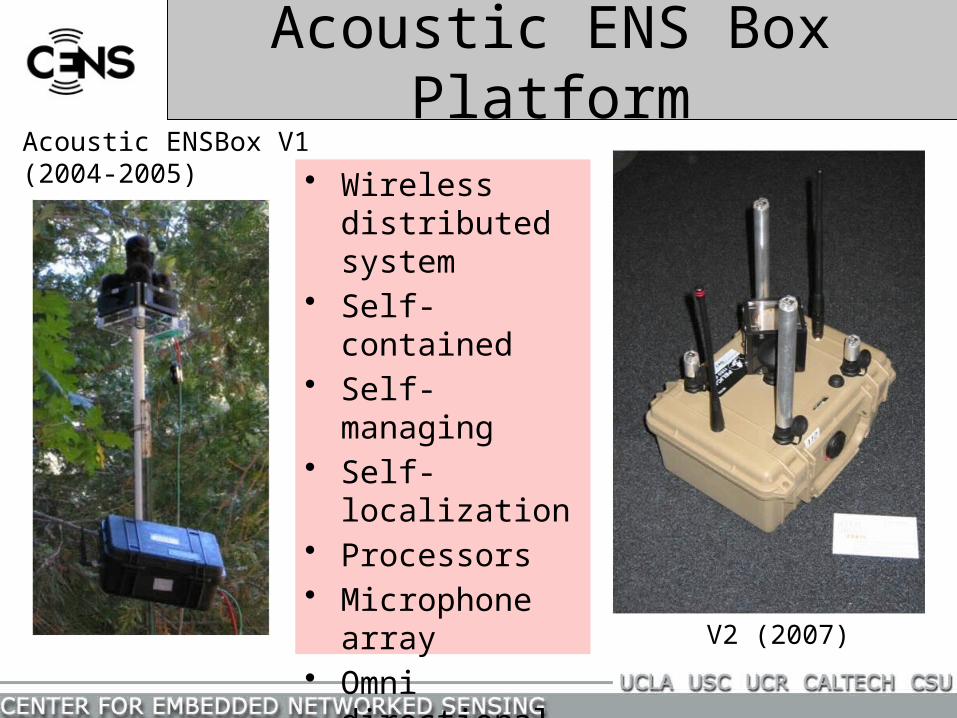
Acoustic ENS Box Platform
• Wireless distributed system
• Self-contained• Self-managing• Self-localization• Processors• Microphone
array• Omni directional
speaker
Acoustic ENSBox V1(2004-2005)
V2 (2007)
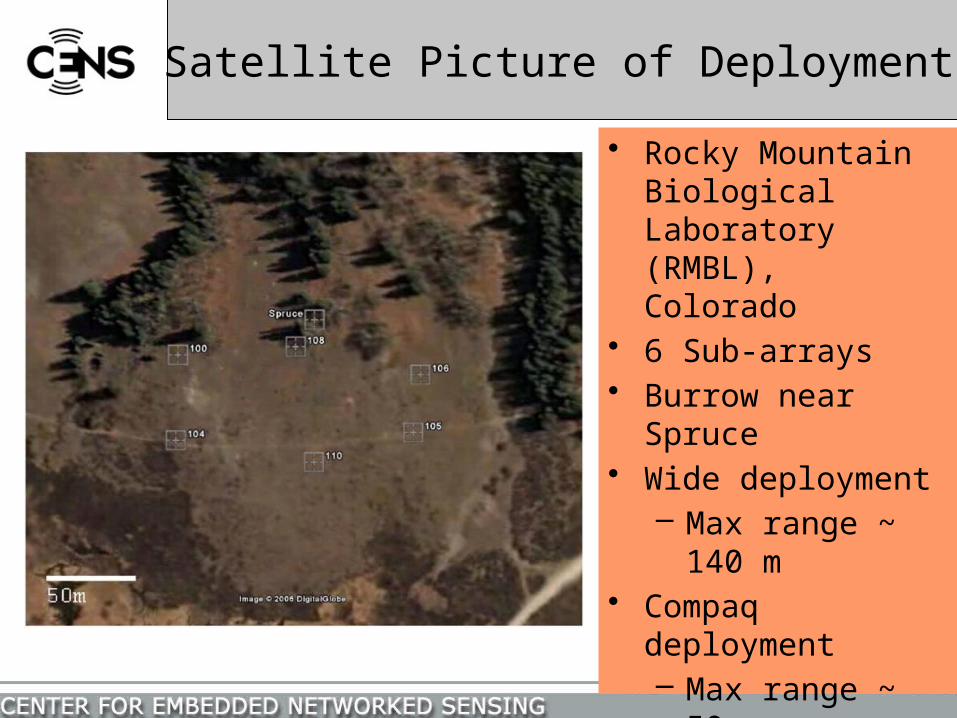
Satellite Picture of Deployment
• Rocky Mountain Biological Laboratory (RMBL), Colorado
• 6 Sub-arrays• Burrow near Spruce• Wide deployment
– Max range ~ 140 m
• Compaq deployment– Max range ~ 50 m
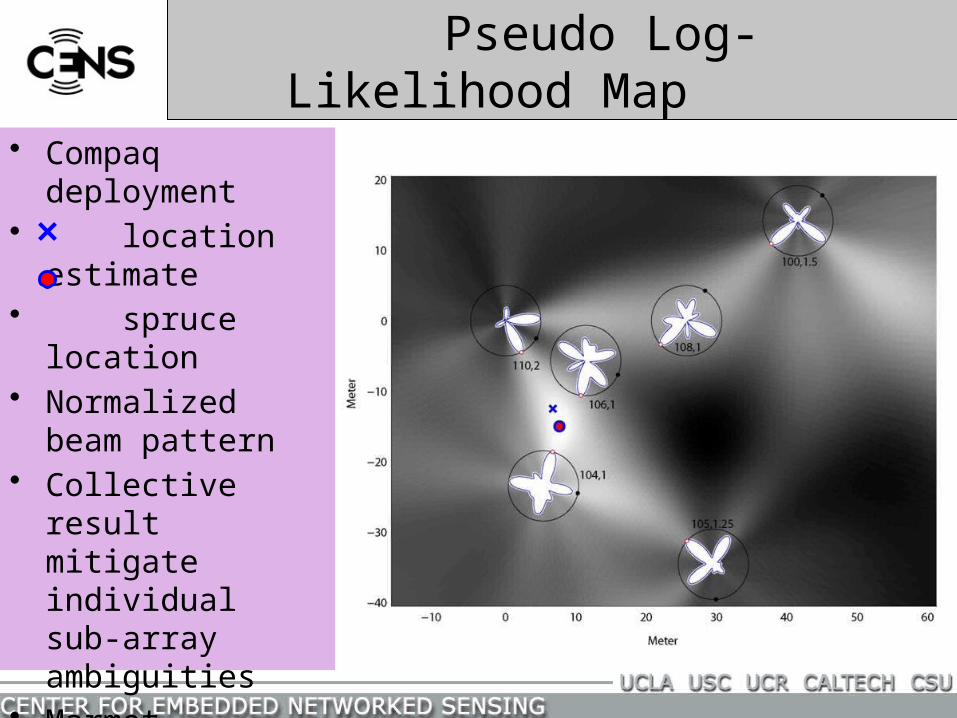
Pseudo Log-Likelihood Map
• Compaq deployment
• location estimate• spruce location• Normalized beam
pattern• Collective result
mitigate individual sub-array ambiguities
• Marmot observed near Spruce
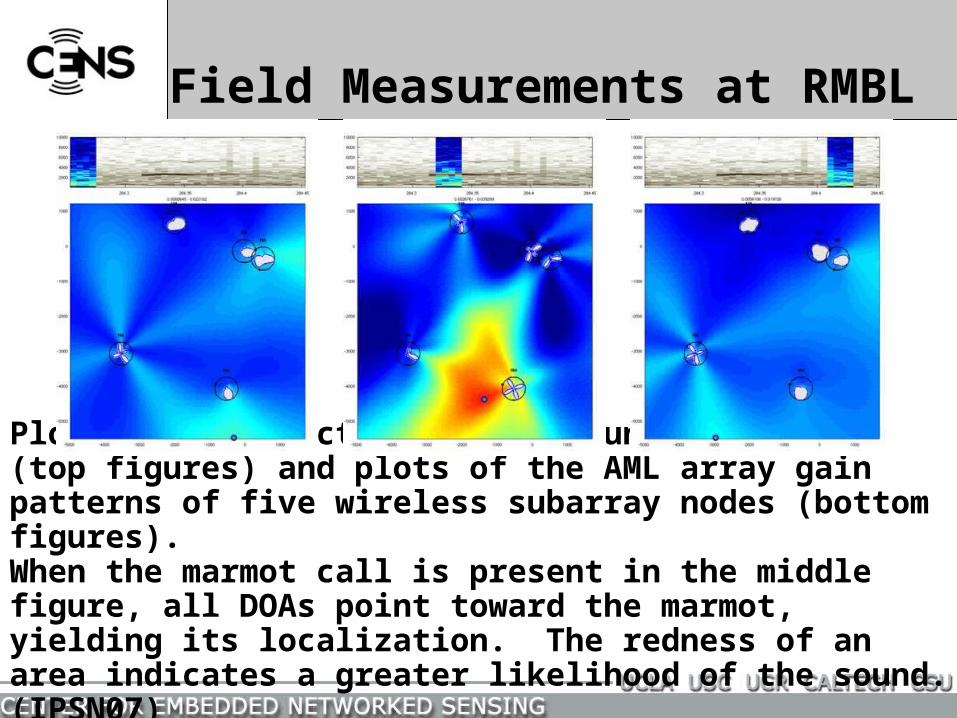
Field Measurements at RMBL
Plots of the spectrogram as a function of time (top figures) and plots of the AML array gain patterns of five wireless subarray nodes (bottom figures). When the marmot call is present in the middle figure, all DOAs point toward the marmot, yielding its localization. The redness of an area indicates a greater likelihood of the sound. (IPSN07)

Editor’s Choice
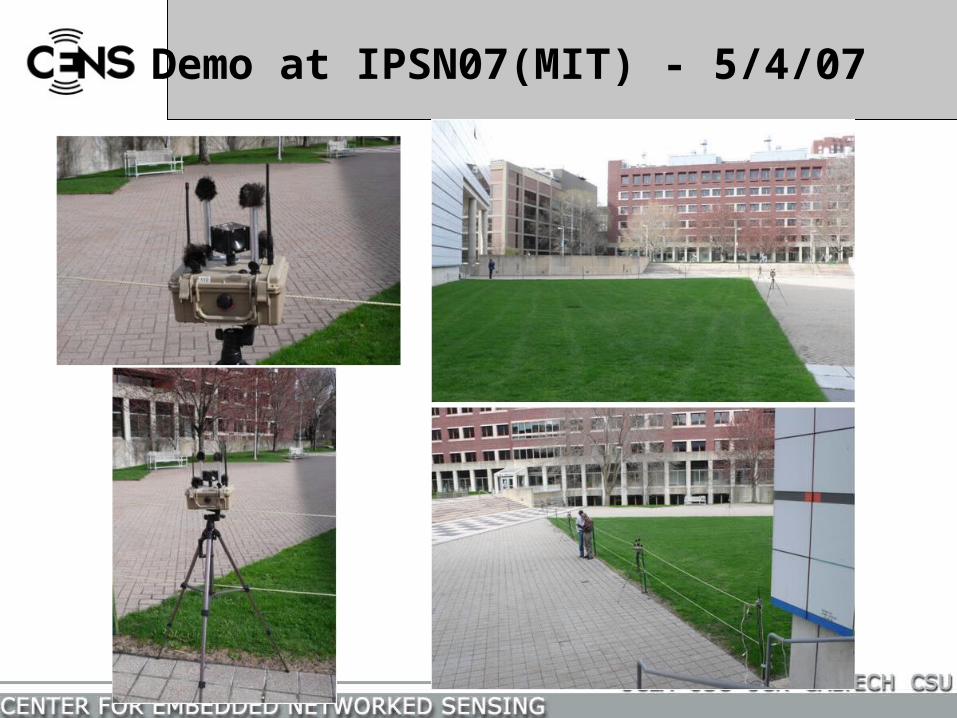
Demo at IPSN07(MIT) - 5/4/07
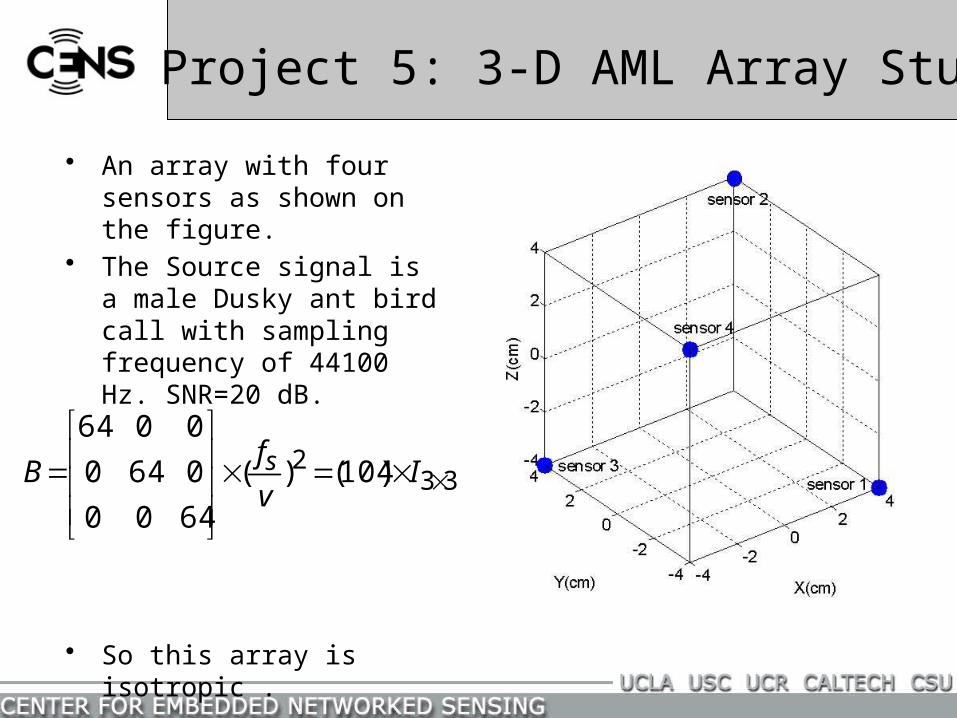
• An array with four sensors as shown on the figure.
• The Source signal is a male Dusky ant bird call with sampling frequency of 44100 Hz. SNR=20 dB.
• So this array is isotropic .
332 )104()(
6400
0640
0064
I
v
fB s
Project 5: 3-D AML Array Study
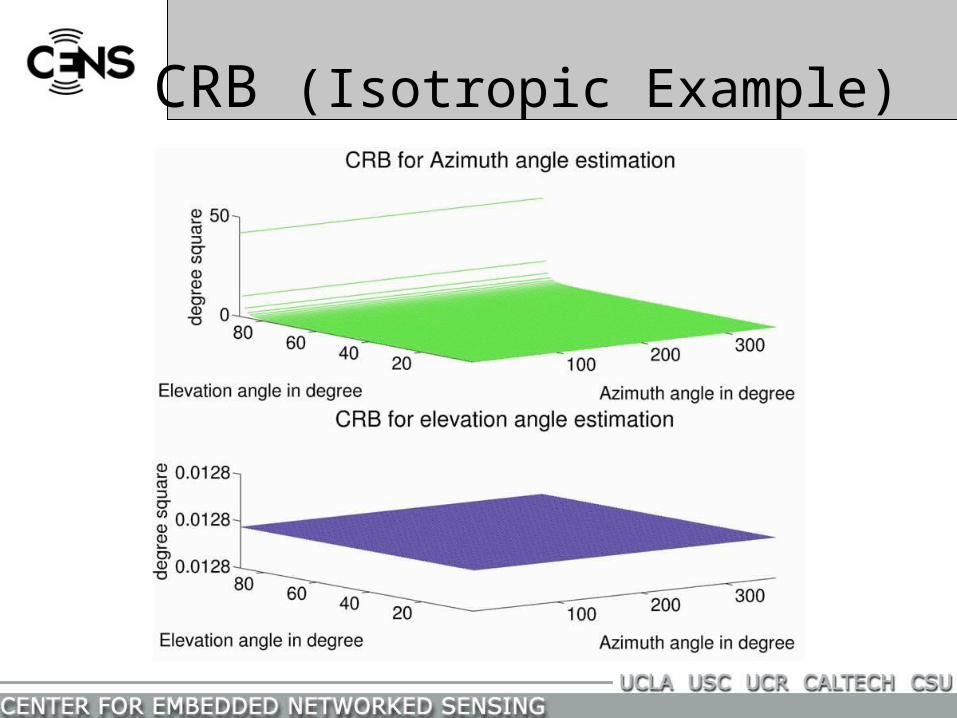
CRB (Isotropic Example)
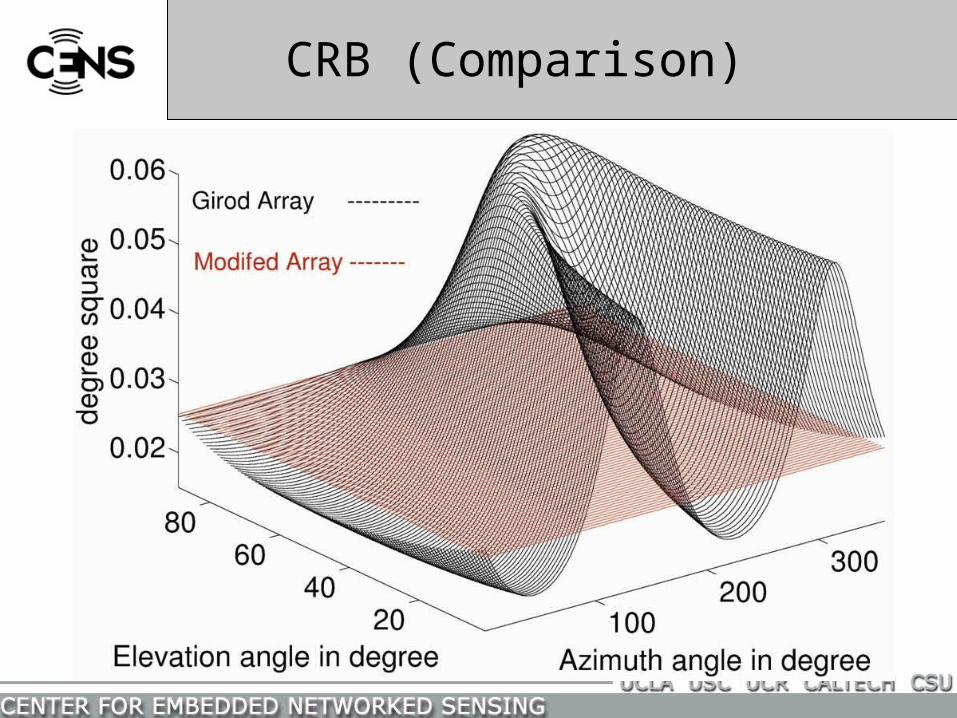
CRB (Comparison)
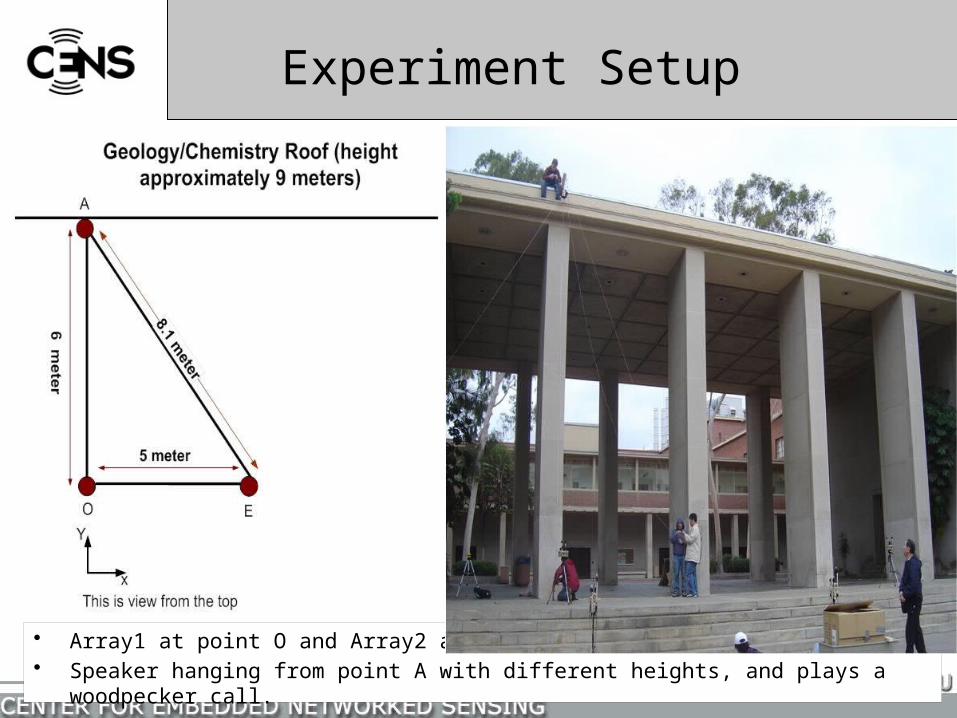
• Array1 at point O and Array2 at point E.• Speaker hanging from point A with different heights, and plays a woodpecker call.
Experiment Setup
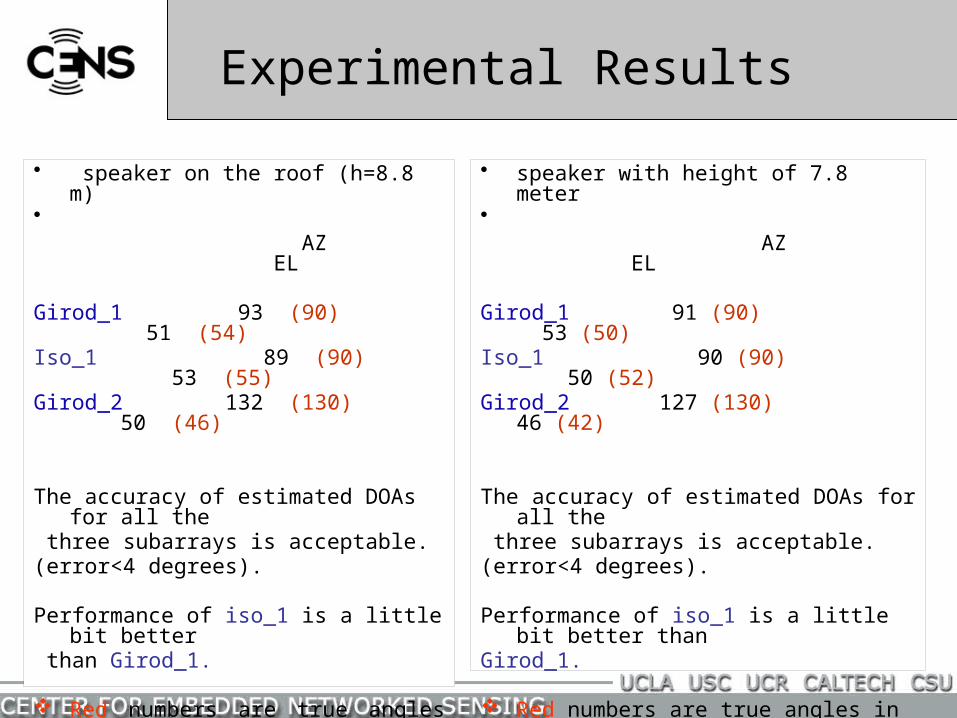
• speaker on the roof (h=8.8 m)• AZ EL Girod_1 93 (90) 51 (54)Iso_1 89 (90) 53 (55)Girod_2 132 (130) 50 (46)
The accuracy of estimated DOAs for all the three subarrays is acceptable. (error<4 degrees).
Performance of iso_1 is a little bit better than Girod_1.
Red numbers are true angles in degree Black numbers are estimated angles in
degree.
• speaker with height of 7.8 meter• AZ EL Girod_1 91 (90) 53 (50)Iso_1 90 (90) 50 (52)Girod_2 127 (130) 46 (42)
The accuracy of estimated DOAs for all the three subarrays is acceptable.(error<4 degrees).
Performance of iso_1 is a little bit better than Girod_1.
Red numbers are true angles in degree Black numbers are estimated angles in
degree.
Experimental Results
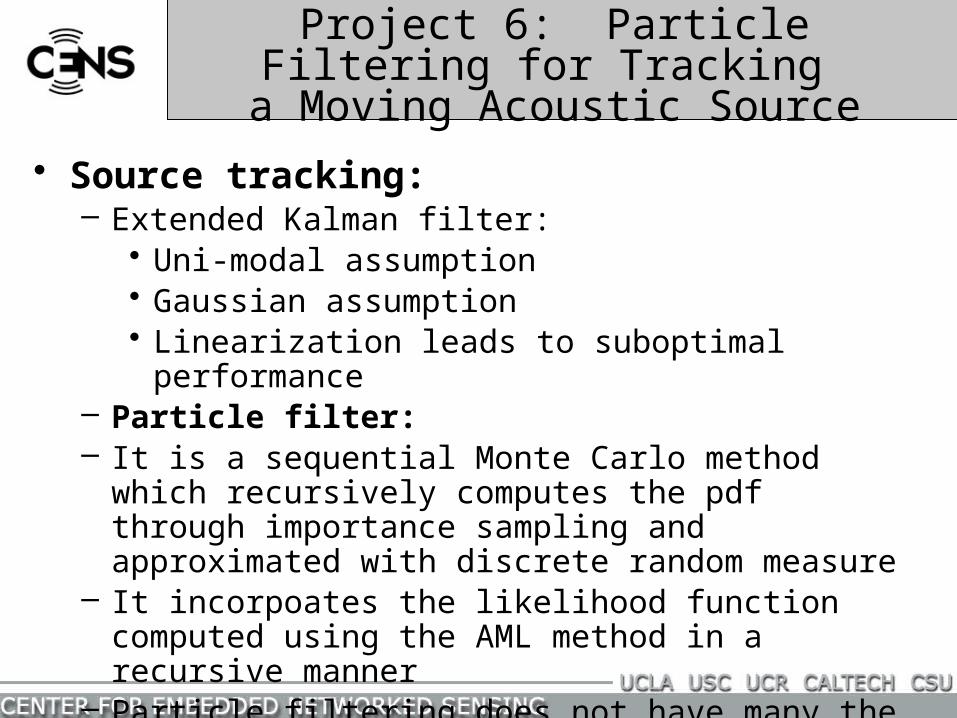
Project 6: Particle Filtering for Tracking a Moving Acoustic Source
• Source tracking:– Extended Kalman filter:
• Uni-modal assumption• Gaussian assumption• Linearization leads to suboptimal performance
– Particle filter:– It is a sequential Monte Carlo method which recursively
computes the pdf through importance sampling and approximated with discrete random measure
– It incorpoates the likelihood function computed using the AML method in a recursive manner
– Particle filtering does not have many the above restrictions and therefore is more flexible
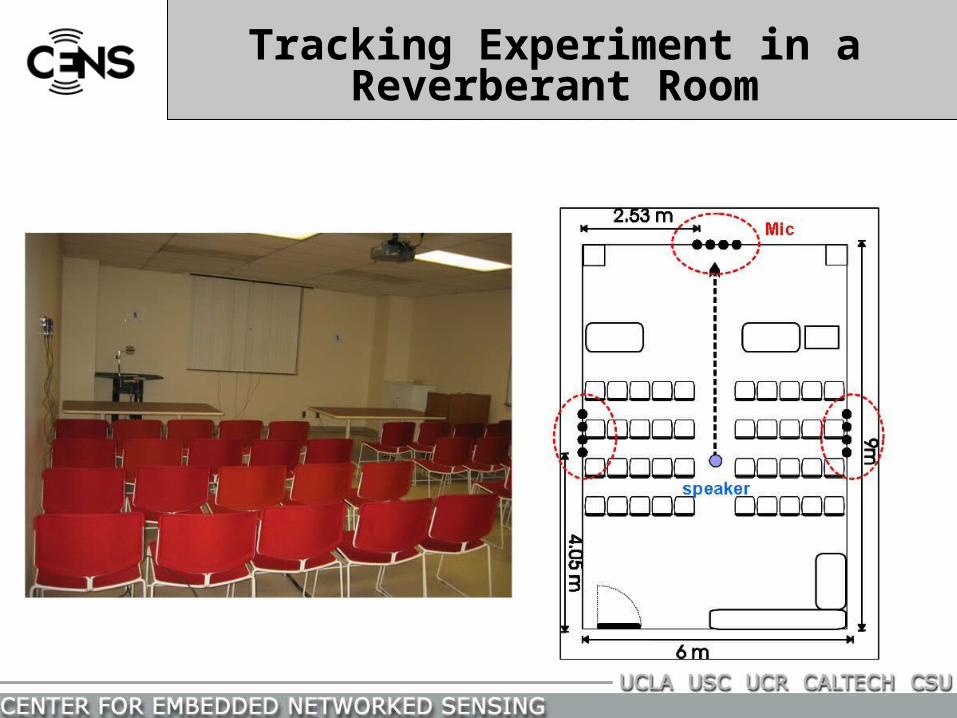
Tracking Experiment in aReverberant Room
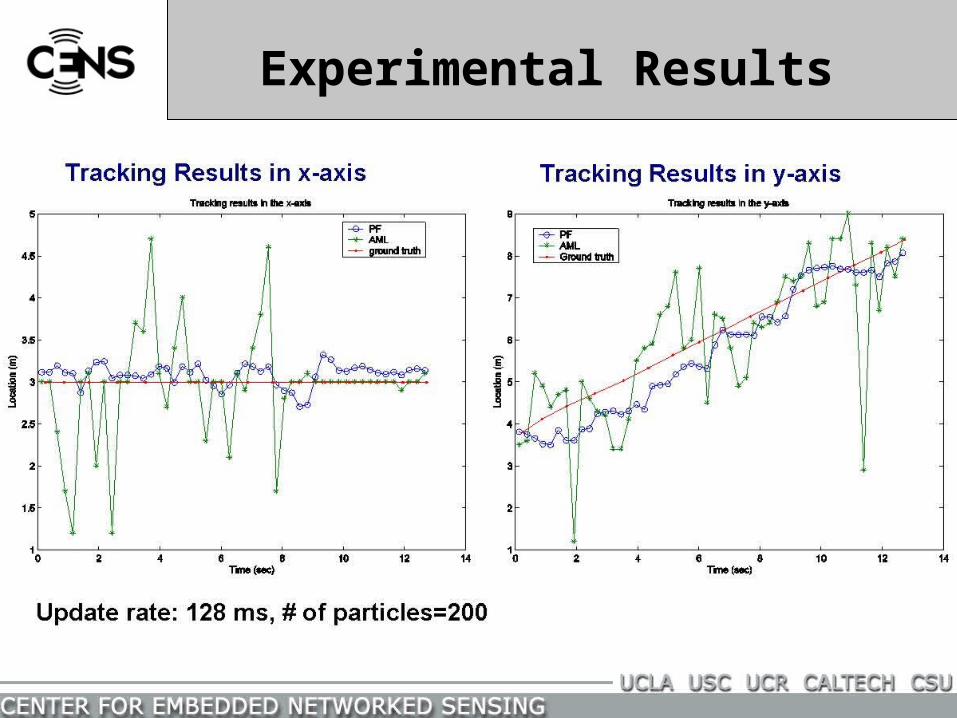
Experimental Results
Wireless sensor systems are challenged by:1.Battery constraints2.Low-data rate transfer capability (not suitable for
central processing systems)3.Local proc. systems may have computational
resources/capability at the nodes4. Severe RF propagation degrade close to ground5. Sensor activation, multi-hop routing challenges6. Robust stand-alone SN systems impose self-
adaptive and self-learning requirements
Acoustical Array in a Practical Wireless Sensor Network
Conclusions
• Introduced wideband acoustical beamforming• Presented six project experiences in utilizing
acoustical beamforming • AML beamforming algorithm can be used for:
detection, localization, source separation, and tracking
• Acoustical beamforming has been used for:
hearing aid application; vehicle/personnel detection/tracking; multiple animal source separation; etc.
• The contributions of various people, agencies, and acoustic sources are highly appreciated
• Funding agencies: DARPA, NSF, UC-Disc., STM• UCLA: Prof. C. Taylor, Prof. D. Blumstein, Dr.
R.E. Hudson, Dr. F. Lorenzelli, and Dr. L. Girod• Past and present UCLA Ph.D. students• Other contract/grant partners: RSC; Xerox-Parc,
BAE• Acoustic/seismic sources: Various tracked
vehicles; woodpeckers; dusty ant birds; marmots
Acknowledgments