bear assessment system - uc berkeley bear center€¦ · bear assessment system design of tasks...
TRANSCRIPT

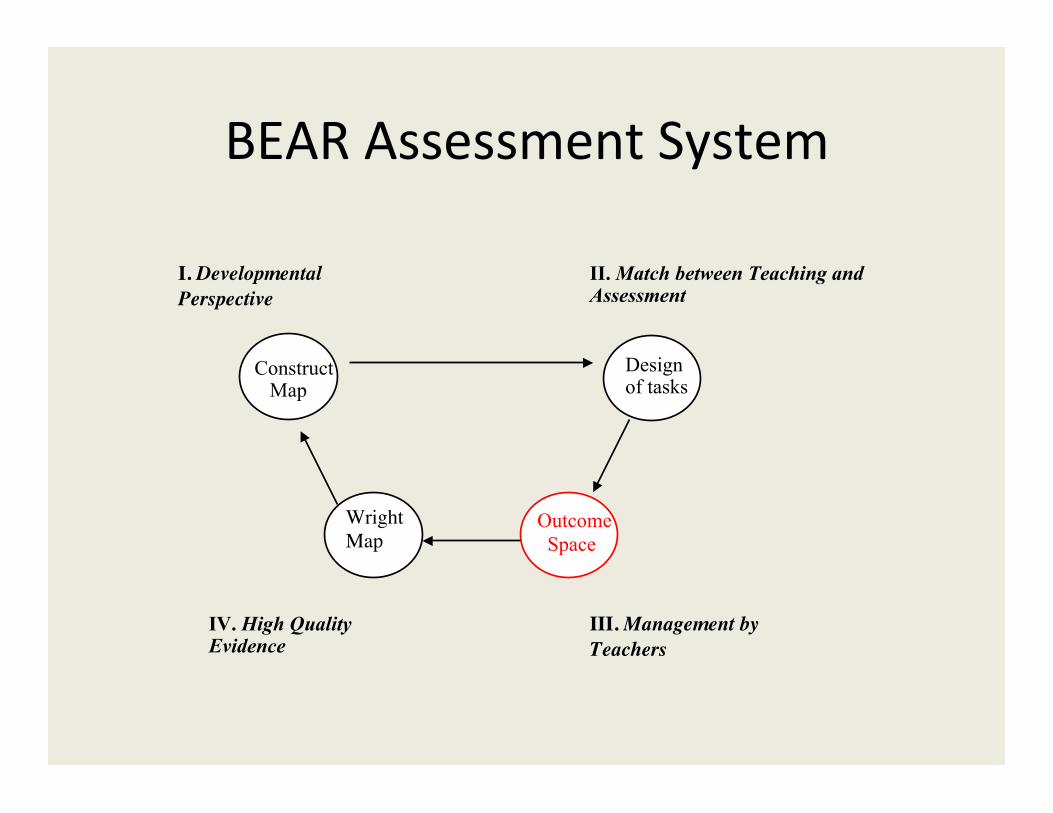
BEARAssessmentSystem
Design of tasks
Wright Map
Outcome Space
I. Developmental Perspective
II. Match between Teaching and Assessment
III. Management by Teachers
IV. High Quality Evidence
Construct Map

Six Constructs and one Topic
28
1. DataDisplay(DaD)2. Meta-RepersentationalCompetence(MRC)3. ConceptionsofStatistics(CoS)4. Chance(Cha)5. ModelingVariablity(MoV)6. InformalInference(InI)and1. TheoryofMeasurement(ToM)

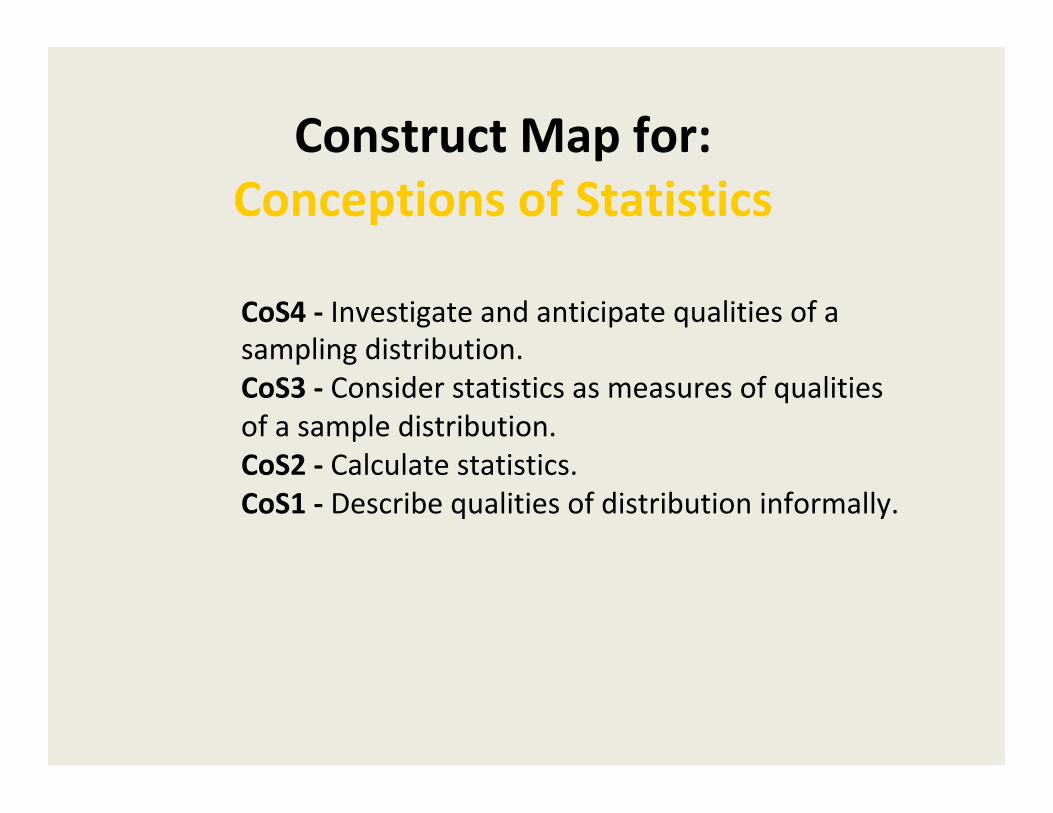
ConstructMapfor:ConceptionsofStatistics
CoS4-Investigateandanticipatequalitiesofasamplingdistribution.CoS3-Considerstatisticsasmeasuresofqualitiesofasampledistribution.CoS2-Calculatestatistics.CoS1-Describequalitiesofdistributioninformally.

BEARAssessmentSystem
Design of tasks
Wright Map
Outcome Space
I. Developmental Perspective
II. Match between Teaching and Assessment
III. Management by Teachers
IV. High Quality Evidence
Construct Map

ConstructMapfor:ConceptionsofStatistics
CoS4-Investigateandanticipatequalitiesofasamplingdistribution.CoS3-Considerstatisticsasmeasuresofqualitiesofasampledistribution.CoS2-Calculatestatistics.CoS1-Describequalitiesofdistributioninformally.

33
ItemsDesign:OpenAssessmentPrompt
StudentsreceivedtheirfinalgradesinSciencetoday.Inadditiontogivingeachstudenttheirgrade,theteacheralsotoldtheclassabouttheoverallclassaverage.
Student Final grades Robyn 10 Jake 9 Calvin 6 Sasha 7 Mike 8 Lori 8
WhentheteacherfinishedgradingMina’sworkandaddedherfinalgradeintotheoverallclassaverage,theoverallclassaveragestayedthesame.WhatcouldMina’sfinalgradehavebeen?(Showyourwork).
48/6=8
BEARAssessmentSystem
Construct Map
Design of tasks
Wright Map
Outcome Space
I. Developmental Perspective
II. Match between Teaching and Assessment
III. Management by Teachers
IV. High Quality Evidence

ConstructMapfor:ConceptionsofStatistics
CoS4-Investigateandanticipatequalitiesofasamplingdistribution.CoS3-Considerstatisticsasmeasuresofqualitiesofasampledistribution.CoS2-Calculatestatistics.CoS1-Describequalitiesofdistributioninformally.

OutcomeSpacefor:ConceptionsofStatistics(detail)
CoS3FChoose/Evaluatestatisticbyconsideringqualitiesofoneormoresamples.CoS3EPredicttheeffectonastatisticofachangeintheprocessgeneratingthesample.CoS3DPredicthowastatisticisaffectedbychangesinitscomponentsorotherwisedemonstrateknowledgeofrelationsamongcomponents.CoS3CGeneralizetheuseofastatisticbeyonditsoriginalcontextofapplicationorinvention.CoS3BInventasharable(replicable)measurementprocesstoquantifyaqualityofthesample.CoS3AInventanidiosyncraticmeasurementprocesstoquantifyaqualityofthesamplebasedontacitknowledgethatothersmaynotshare.

37
ItemsDesign:OpenAssessmentPrompt
StudentsreceivedtheirfinalgradesinSciencetoday.Inadditiontogivingeachstudenttheirgrade,theteacheralsotoldtheclassabouttheoverallclassaverage.
Student Final grades Robyn 10 Jake 9 Calvin 6 Sasha 7 Mike 8 Lori 8
WhentheteacherfinishedgradingMina’sworkandaddedherfinalgradeintotheoverallclassaverage,theoverallclassaveragestayedthesame.WhatcouldMina’sfinalgradehavebeen?(Showyourwork).
48/6=8

38
EvidenceBasedonResponseProcesses
• SmallGroupInterviews• ThinkAlouds
– Observingstudentswho“talkthrough”theirresponses
• ExitInterviews– Askingstudentstoreprisetheirperformanceaftertakinginstrument
– Askingthemabouttheirexperiences• ALLtobecomparedtoconstructmaps.

“When we spun it 10 time the numbers were 70%/30% and 80% 20%”
“When we spun it 100 time it was 60% 40%”
“When we spun it 1000 times it was closer to 48% and 52% and 53% and 47%”
“What I think is the higher the number the closer it is to 50% 50%! Pretty STINKEN AMAZING!”
SampleSize&SamplingVariability
39

40
EvidenceBasedonInternalStructure
• Intentionofinternalstructure=ConstructMap,etc.• ConstructMap IsorderinConstructMaprealizedintheWrightMap?Spearman’srho(ordinalcorrelation)
• Couldalsobeproblemswithitemsand/oroutcomesspace
• Doitems/stepsspanrangeofpersons?

BEARAssessmentSystem
Construct Map
Design of tasks
Wright Map
Outcome Space
I. Developmental Perspective
II. Match between Teaching and Assessment
III. Management by Teachers
IV. High Quality Evidence

ConstructMapfor:ConceptionsofStatistics
CoS4-Investigateandanticipatequalitiesofasamplingdistribution.CoS3-Considerstatisticsasmeasuresofqualitiesofasampledistribution.CoS2-Calculatestatistics.CoS1-Describequalitiesofdistributioninformally.

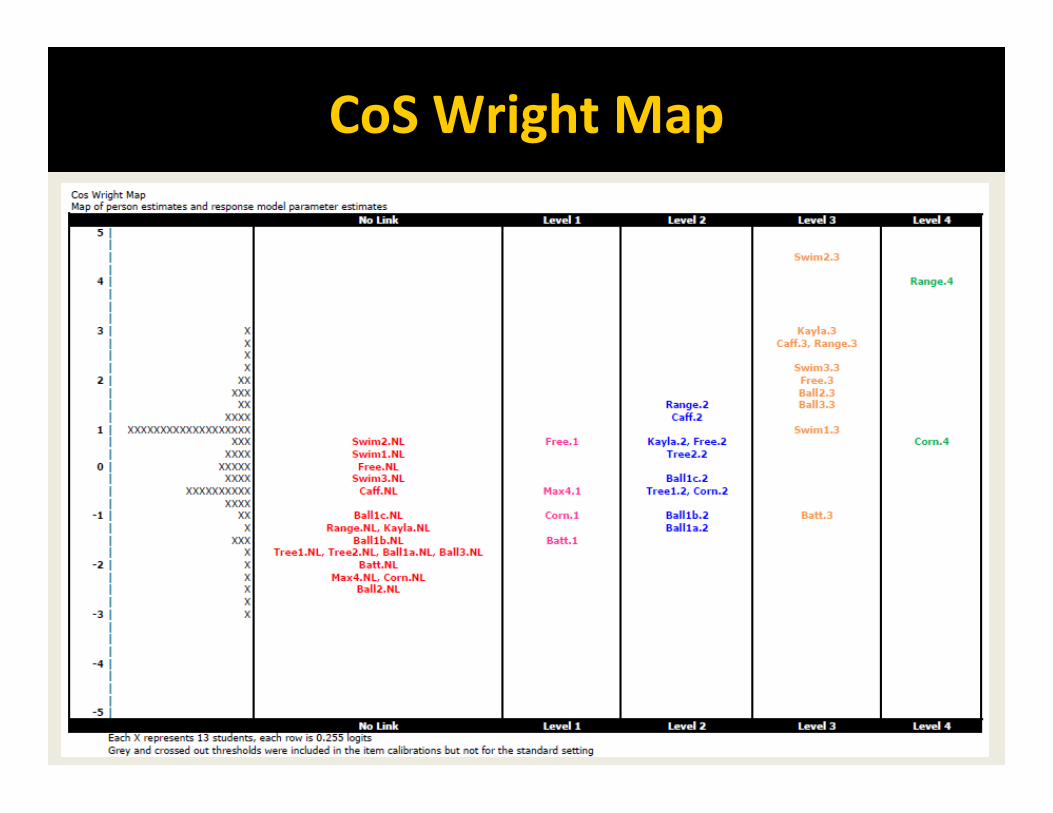
CoSWrightMap
| |2.2 | | | 3 | |14.3 |17.5 | |19.4 | |20.2 | 2 X| XX| X|10.2 XX|9.2 12.3 15.3 XXX| XXXX|13.2 14.2 XXX|6.2 XXX|18.3 1 XXXXXX|12.2 15.2 17.4 18.2 XXXXXX|17.3 XXXXXXX|16.2 17.2 XXXXXXXX|3.3 4.2 19.2 19.3 XXXXXXXX|8.3 11.2 14.1 XXXXXXXXX|1.2 8.2 18.1 XXXXXXXXXX| 0 XXXXXXXX|5.4 XXXXXXX|3.2 19.1 XXXXXXXX|5.2 5.3 7.2 7.3 XXXXXXXX| XXXXXXX|20.1 XXXXXXXXX|8.1 XXXXXX|7.1 16.1 17.1 XXXXXX| -1 XXXX|5.1 XXX| XXXX| XX|3.1 XX|12.1 XX|4.1 X|15.1 X|10.1 -2 X| X| X|1.1 2.1 6.1 X| X| X| | |9.1 11.1 13.1 -3 |
CoSWrightMap

CoSBandingSummary

46
MultidimensionalWrightMap

47
ItemsDesignItemAnalysisDidtheitemsdowhattheyaresupposedtodo?Meanlocationforrespondentsineachresponse category seenextslide Cf.Point-biserial

ConQuestOutput Cases for this item 1492 Item-Rest Cor. 0.45 Item-Total Cor. 0.55 Item Threshold(s): -0.08 0.38 0.47 5.75 Weighted MNSQ 1.12 Item Delta(s): 0.60 1.73 -1.67 5.74 ------------------------------------------------------------------------------ Label Score Count % of tot Pt Bis t (p) mean SD ------------------------------------------------------------------------------ 0 0.00 777 52.08 -0.36 -15.05(.000) -0.29 0.45 1 1.00 216 14.48 -0.10 -4.06(.000) -0.18 0.44 2 2.00 24 1.61 0.06 2.18(.030) 0.07 0.49 3 3.00 473 31.70 0.45 19.49(.000) 0.27 0.41 4 4.00 2 0.13 0.04 1.59(.111) 0.19 0.47 ============================================================================== item:2 (Candle1) Cases for this item 1375 Item-Rest Cor. 0.45 Item-Total Cor. 0.54 Item Threshold(s): 0.18 0.25 0.98 1.05 4.50 Weighted MNSQ 0.98 Item Delta(s): 2.74 -2.04 3.18 -1.40 4.49 ------------------------------------------------------------------------------ Label Score Count % of tot Pt Bis t (p) mean SD ------------------------------------------------------------------------------ 0 0.00 823 59.85 -0.43 -17.89(.000) -0.28 0.47 1 1.00 47 3.42 0.01 0.42(.676) -0.09 0.45 2 2.00 376 27.35 0.29 11.11(.000) 0.17 0.39 3 3.00 19 1.38 0.07 2.51(.012) 0.25 0.33 4 4.00 108 7.85 0.27 10.42(.000) 0.45 0.32 5 5.00 2 0.15 0.06 2.35(.019) 0.56 0.33 ==============================================================================

49
EvidenceBasedonRelationstoOtherVariablesCorrelatelocationswithotherexternalvariablesConvergentvs.DivergentEgs.Scoresonotherinstruments,measuresonrelated
variable,clinicaljudgments,Treatments,etc.Example—ADMCompositecomparedto Watson’sStatisticalLiteracyTest… Correlations 2.ADMPost 3.Watson(Post) 1.ADMPre .74 .71 2.ADMPost .88


51
EvidenceBasedonConsequencesofUsinganInstrument
Didtheinstrument’susageresultindesirableoutcomes?Andnotinundesirableoutcomes?
AnalogyoftheBayBridge.
52
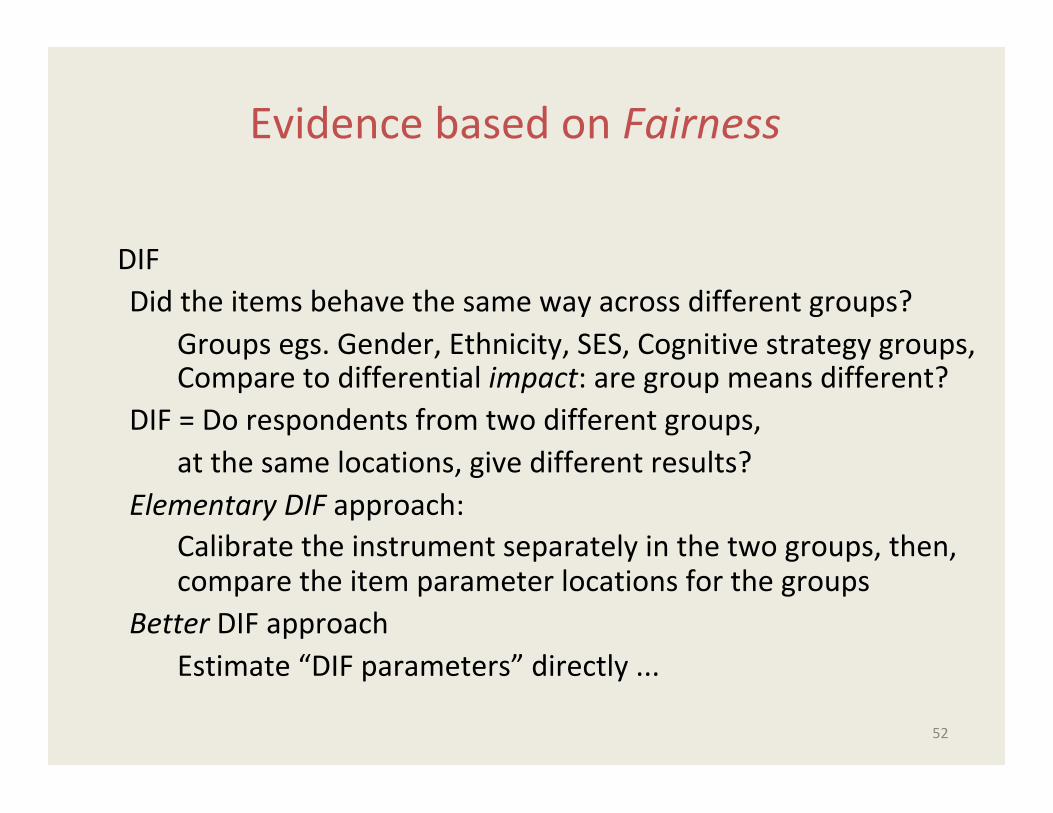
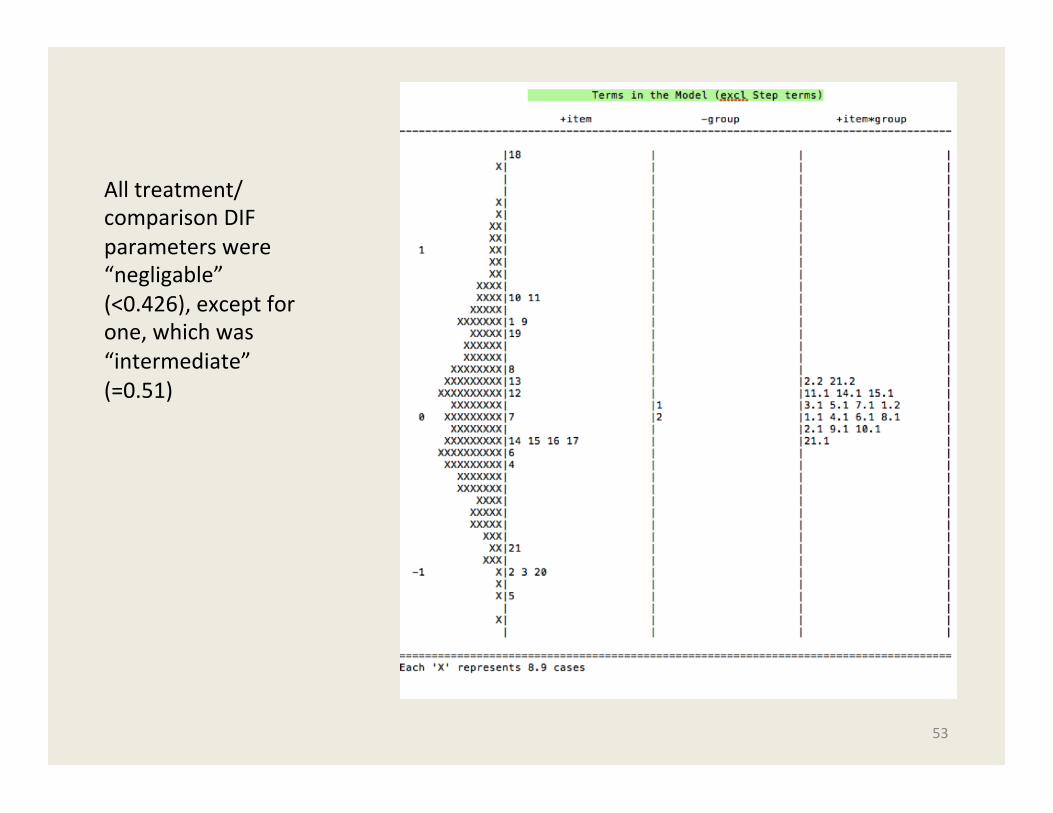
DIF Didtheitemsbehavethesamewayacrossdifferentgroups? Groupsegs.Gender,Ethnicity,SES,Cognitivestrategygroups, Comparetodifferentialimpact:aregroupmeansdifferent? DIF=Dorespondentsfromtwodifferentgroups, atthesamelocations,givedifferentresults? ElementaryDIFapproach: Calibratetheinstrumentseparatelyinthetwogroups,then, comparetheitemparameterlocationsforthegroups BetterDIFapproach Estimate“DIFparameters”directly...
EvidencebasedonFairness
53
Alltreatment/comparisonDIFparameterswere“negligable”(<0.426),exceptforone,whichwas“intermediate”(=0.51)

54
Alltreatment/comparisonDIFparameterswere“negligable”(<0.426),exceptforone,whichwas“intermediate”(=0.51)
Differentialimpact
DIF

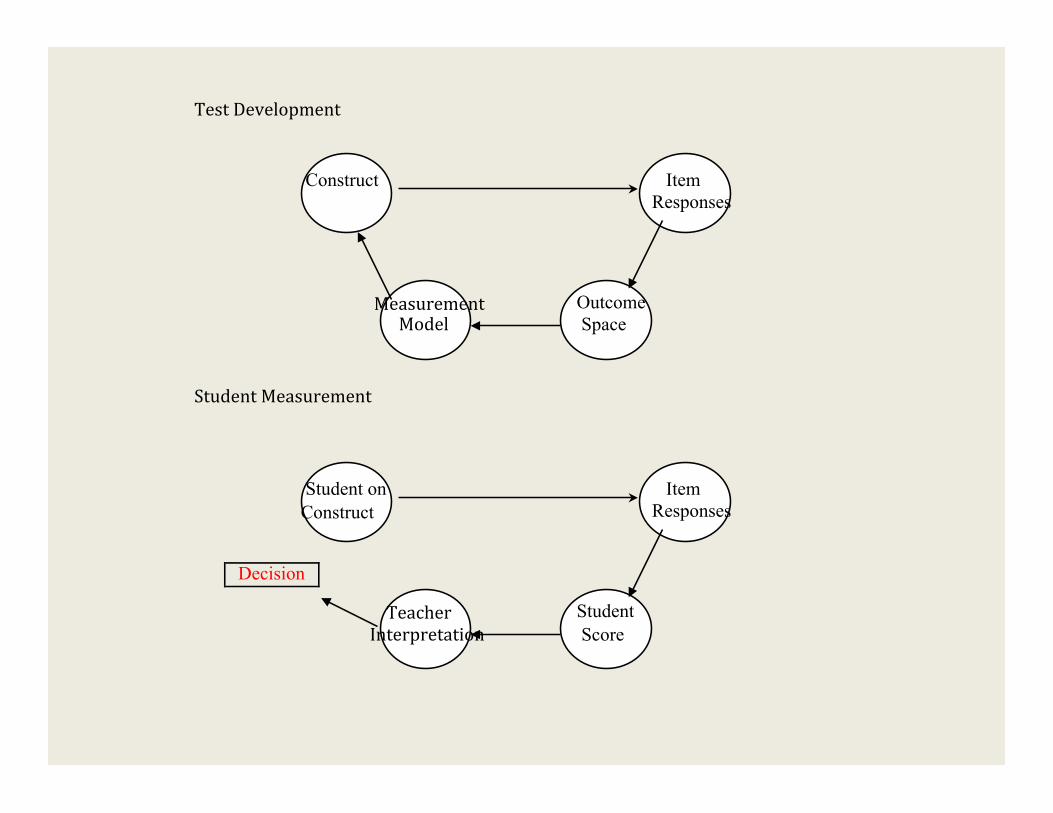
InSummary1.TheTestDevelopmentArgument

TestDevelopment
Construct Item Responses
MeasurementModel
Outcome Space


InSummary1. TheTestDevelopmentArgument2. TheInterpretation-UseArgument

StructureoftheInterpretiveArgument
• Scoring:fromresponsestoscore.• Generalization:fromobservedscoretouniversescoreor“true”score.
• Extrapolation:fromuniversescoretodomainscore.
• Abstraction:fromdomainscoretoconstruct/traitvalue.
• Decision:fromdomainscoreorconstructvaluetodecision. (Kane,2006)

StructureoftheInterpretiveArgument
• Scoring• Generalization• Extrapolation• Abstraction• Decision (Kane,2006)

Student on Construct
Item Responses
TeacherInterpretation
Student Score
Decision
Onemoreiteration,...Inthelocalcontext!

Abstraction
Scoring
Generalization
Extrapolation
Student on Construct
Item Responses
TeacherInterpretation
Student Score
Decision
TestDevelopmentStudentMeasurement
Construct Item Responses
MeasurementModel
Outcome Space
Student on Construct
Item Responses
TeacherInterpretation
Student Score
Decision

InSummary1. TheTestDevelopmentArgument2. TheInterpretation-UseArgument3. TheValidityArgument

TestDevelopmentStudentMeasurement
Construct Item Responses
MeasurementModel
Outcome Space
Student on Construct
Item Responses
TeacherInterpretation
Student Score
Decision
DevelopmentValidityEvidence
LocalValidityEvidence

66
Conclusion1. Forvalidity,the“testdevelopmentargument“isneededasa
preludetothe“interpretation-useargument”.2. TheBASprovidesaframeworkforconstructingboththetest
developmentandtheinterpretation-useargument --foundedintheContentevidencestrand.
3. Theseinturn,whenwell-designed,providesabasisforthevalidityargument --therestoftheevidencestrands
4. Otherframingsareavailable—mostprominently“Evidence-CenteredDesign”(Mislevy,1996).
5. Thisapproachmayalsobethoughtofintermsofmultidimensionalsituations,etc.

67
ForMoreInformationBEARAssessmentSystem:
– Wilson,M.(2005).ConstructingMeasures:AnItemResponseModelingApproach.Mahwah,NJ:Erlbaum.(nowpublishedbyTaylorandFrancis,NewYork).
– Seealso:http://bearcenter.berkeley.edu/

ReferencesAmericanEducationalResearchAssociation,AmericanPsychological
Association,&NationalCouncilonMeasurementinEducation.(2014).Standardsforeducationalandpsychologicaltesting.Washington,DC:Authors.
Kane,M.(2006).Validation.InR.Brennan(Ed.),Educationalmeasurement,4thed.(pp.17–64),Westport,CT: AmericanCouncilonEducationandPraeger.
Minner,D.,&Martinez,A.(2013,April).AReviewofSTEMresearchinstrumentsforassessingteacher practices,pedagogicalcontentknowledge,andcontentknowledge.PaperpresentedattheNARSTAnnualconference,PuertoRico.
Sussman,J.M.(2016).Standardizedtestsasoutcomemeasuresforevaluatinginstructionalinterventionsinmathematicsandscience(Doctoraldissertation).Retrievedfrom http://digitalassets.lib.berkeley.edu/etd/
ucb/text/Sussman_berkeley_00 28E_16642.pdfWilson,M.(2005).ConstructingMeasures:AnItemResponseModeling
Approach.Mahwah,NJ:Erlbaum.
