beaufort county public works 120 shanklin road beaufort, south … · 2019-04-12 · 1.3...
TRANSCRIPT

YEAR 2008-2009 REPORT
Beaufort County Storm Water Monitoring Beaufort County, South Carolina
Beaufort County Public Works 120 Shanklin Road Beaufort, South Carolina 29906
September 23, 2009

YEAR 2008-2009 REPORT
Beaufort County Storm Water Monitoring
Beaufort County, South Carolina
TABLE OF CONTENTS
Section Subject Page
Executive Summary .................................................................................. iii
1.0 Year 2 Storm Water Monitoring ............................................................... 1 1.1 Sample Locations and Purpose ..................................................... 1 1.2 Qualifying Storm Events............................................................... 1 1.3 Sampling/Analytical/QA-QC Procedures ..................................... 2 1.4 Bacterial Source Tracking ............................................................ 4 2.0 Adjustment’s During Year 2 Monitoring .................................................. 5 2.1 Monitoring Station Changes ......................................................... 6 2.2 Eagles Point BMP Efficiency ....................................................... 6 2.3 Bacterial Source Tracking ............................................................ 7 2.4 Test Procedures ............................................................................. 7 3.0 Year 2 Data Analysis ................................................................................ 8 3.1 Track Long-term Trends for BMP Effectiveness ......................... 8 3.2 Baseline Existing Water Quality ................................................... 9 3.3 Selective BMP Efficiency Comparison ........................................ 10 3.4 Selective Model Input Comparison .............................................. 10 3.5 Composite Versus Grab Sample Comparison ............................... 11 4.0 Year 2 Conclusions ................................................................................... 11 5.0 References ................................................................................................. 13

ii GEL Engineering, LLC a Member of The GEL Group, Inc.
YEAR 2008-2009 REPORT
Beaufort County Storm Water Monitoring
Beaufort County, South Carolina
TABLE OF CONTENTS (Continued)
Figures 1 Sampling Location Map
Tables
1 Recommended Tributary Sample Locations 2 Revised Tributary Sample Locations 3 Year 2 Data Summary – Ammonia-Nitrogen (NH3) 4 Year 2 Data Summary – Biochemical Oxygen Demand (BOD5) 5 Year 2 Data Summary – Cadmium (Total) 6 Year 2 Data Summary – Chlorophyll-a 7 Year 2 Data Summary – Chromium (Total) 8 Year 2 Data Summary – Conductivity 9 Year 2 Data Summary – Copper (Total) 10 Year 2 Data Summary – Dissolved Oxygen (DO) 11 Year 2 Data Summary – Fecal Coliform 12 Year 2 Data Summary – Iron (Total) 13 Year 2 Data Summary – Lead (Total) 14 Year 2 Data Summary – Manganese (Total) 15 Year 2 Data Summary – Mercury (Total) 16 Year 2 Data Summary – Nickel (Total) 17 Year 2 Data Summary – Nitrate-Nitrite (NOX) 18 Year 2 Data Summary – pH 19 Year 2 Data Summary – Phosphorus (Total) 20 Year 2 Data Summary – Salinity 21 Year 2 Data Summary – Temperature 22 Year 2 Data Summary – Total Kheldahl Nitrogen (TKN) 23 Year 2 Data Summary – Total Organic Carbon (TOC) 24 Year 2 Data Summary – Total Suspended Solids (TSS) 25 Year 2 Data Summary – Turbidity 26 Year 2 Data Summary – Zinc (Total)
Appendices
A-1 Bacterial Source Tracking Data Summary

iii GEL Engineering, LLC a Member of The GEL Group, Inc.
YEAR 2008-2009 REPORT
Beaufort County Storm Water Monitoring
Beaufort County, South Carolina
EXECUTIVE SUMMARY The Beaufort County Water Quality Monitoring Program was developed to achieve the four primary goals identified in the Storm Water Management Plan (SWMP) and support the county’s future implementation of this plan. GEL Engineering, LLC (GEL) was selected by Beaufort County to implement the water quality monitoring program. With regard to the Year 2 (2008-2009) sampling and analysis activities, adjustments were made to allow Beaufort County to more closely monitor fecal coliform levels in particularly sensitive areas. Additionally, bacterial source tracking (BST), also referred to as Microbial Source Tracking, or MST, took place beginning in February 2009, and continued through March 2009. Due to the inconclusive nature of the data derived during the additional BST, it was determined that remaining funds that were to be utilized for the tracking of potential bacterial sources were best spent determining existing baseline water quality for future evaluation of BMP effectiveness. Based on the Eagles Point monitoring results and Beaufort County’s desire to evaluate the performance/efficiency on an existing structural BMP (ex., a detention pond), the County intends to locate another BMP site to evaluate. While a data analysis tool has been developed, there are limited conclusions that can be drawn from the data collected thus far.
• A few of the sample collection sites remain under the influence of salt water due to tidal intrusion and should be relocated.
• Considering Beaufort County’s desire to address the need for BMP’s, it is now necessary to identify a new BMP sample collection location.
• Due to minor variability between grab sample data and timed/composited sample data, it may no longer be necessary to collect both sets of samples at the same locations.
• Some sample collection sites have demonstrated good water quality and Beaufort County may find it no longer necessary to collect data at these sites or to reduce the frequency of data collection allowing for long term tracking of water quality trends.

iv GEL Engineering, LLC a Member of The GEL Group, Inc.
• Data collected since the onset of the County’s monitoring program suggests that
there may be excessive differences between data initially used by CDM to calibrate their storm water model and data collected from the present storm water monitoring program.
YEAR 2008-2009 REPORT
Beaufort County Storm Water Monitoring
Beaufort County, South Carolina
1.0 Year 2 Storm Water Monitoring
GEL was retained to continue the storm water monitoring program that was initiated in June 2007. During Year 2, GEL:
• Continued monitoring all established stations in response to a qualified storm event rather than on a set schedule;
• Reported sample values exceeding “action levels” to Beaufort County for those parameters with “critical exceedance concentrations;”
• Routinely met with Beaufort County to review the latest data, and; • Made adjustments to sample locations, parameters measured, etc. based on the
monitoring results, data review, and monitoring program directives supplied by Beaufort County.
Table 2 summarizes the stations monitored during Year 2 including their name, watershed, receiving water body and classification, etc., and most importantly their purpose.
1.1 Sample Locations and Purpose
Since initiation of the storm water monitoring program, the identification of appropriate sampling sites for grab sampling and automatic storm event sampling has been based on the water quality sensitivity analysis (modeling), the current level of service for water quality segments, and the existing and future land use classifications. During Year 2, six trending sites were maintained, ten existing water quality stations were monitored, twelve additional months of data was collected to characterize the high and medium density residential runoff stations, and the evaluation of the Eagles Point BMP was continued through Year 2. Note that two additional existing water quality sites were initiated in Year 2 (refer to Table 2), and their purpose will be further discussed in Section 2 of this report. All sites monitored during Year 2 are displayed on Figure 1.
1.2 Qualifying Storm Events
During Year 2, GEL collected grab samples and conducted field measurements at all stations following a storm event that was greater than 0.1 inches in magnitude per hour and that occurred at least 72 hours from the previously measurable (greater than 0.1
Year 2008-2009 Report, Beaufort County Storm Water Monitoring September 3, 2009 Beaufort County, South Carolina Page 2
GEL Engineering, LLC a Member of The GEL Group, Inc.
inch rainfall) storm event. Twelve non-scheduled wet weather grab samples were collected during Year 2.
GEL also conducted twelve monthly composite sampling events at seven discrete auto sampler locations, provided that a storm event greater than 0.1 inches in magnitude per hour and that occurred at least 72 hours from a previously measurable (greater than 0.1 inch rainfall) storm event occurred during each month. Samples were collected with an automatic sampler that was established and secured in each of the four locations. The automatic sampler collected an aliquot every two minutes for the first 30 minutes following a qualifying storm event and then collected a 15 minute aliquot for the next two and a half hours for a composite sample.
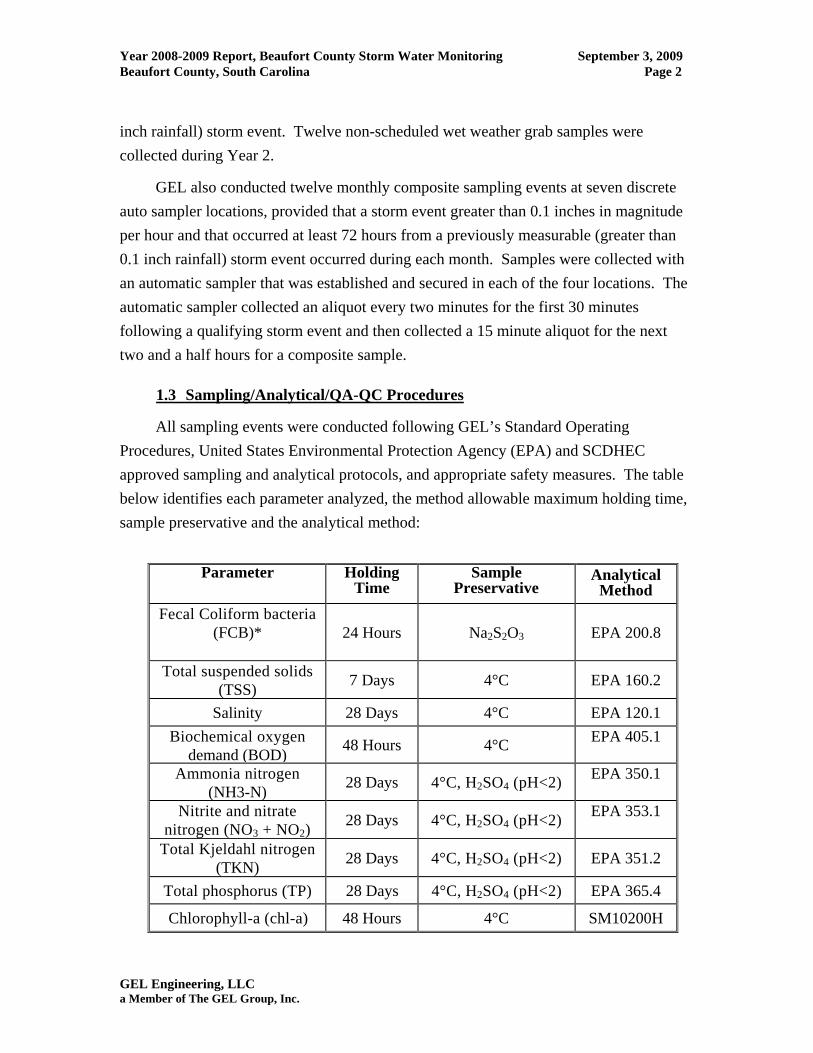
1.3 Sampling/Analytical/QA-QC Procedures
All sampling events were conducted following GEL’s Standard Operating Procedures, United States Environmental Protection Agency (EPA) and SCDHEC approved sampling and analytical protocols, and appropriate safety measures. The table below identifies each parameter analyzed, the method allowable maximum holding time, sample preservative and the analytical method:
Parameter Holding
Time Sample
Preservative Analytical
Method Fecal Coliform bacteria
(FCB)* 24 Hours Na2S2O3 EPA 200.8
Total suspended solids (TSS) 7 Days 4°C EPA 160.2
Salinity 28 Days 4°C EPA 120.1 Biochemical oxygen
demand (BOD) 48 Hours 4°C EPA 405.1
Ammonia nitrogen (NH3-N) 28 Days 4°C, H2SO4 (pH<2) EPA 350.1
Nitrite and nitrate nitrogen (NO3 + NO2)
28 Days 4°C, H2SO4 (pH<2) EPA 353.1
Total Kjeldahl nitrogen (TKN) 28 Days 4°C, H2SO4 (pH<2) EPA 351.2
Total phosphorus (TP) 28 Days 4°C, H2SO4 (pH<2) EPA 365.4
Chlorophyll-a (chl-a) 48 Hours 4°C SM10200H

Year 2008-2009 Report, Beaufort County Storm Water Monitoring September 3, 2009 Beaufort County, South Carolina Page 3
GEL Engineering, LLC a Member of The GEL Group, Inc.
Total organic carbon (TOC) - quarterly 28 Days 4°C, H2SO4 (pH<2),
zero headspace EPA 415.1
Metals (cadmium, chromium, copper, iron,
lead, manganese, mercury, nickel and zinc) — quarterly)
6 Months 4°C, HNO3 (pH<2) 6010B
* GEL recommended that fecal coliform levels be analyzed using the five-tube dilution method (also known as MPN) since it provides more accurate results for samples containing turbidity and saltwater and is consistent with methods used during the previous monitoring events. Additionally, the standard holding time for fecal coliform is six hours; however, this method allows for a holding time of 24 hours if the sample data is not for potable water and will not be used for compliance purposes. Analysis of pH, temperature, dissolved oxygen, turbidity and salinity was performed in the field using a calibrated Series 4a DataSonde, manufactured by Hydrolab. This allowed parameters with a short holding time to be analyzed in-situ at the time of sampling at each sample location, thus providing more accurate results. The results of the field analyses were stored in the Hydrolab and documented on Field Data Information Sheets. Ambient weather conditions noted during each monitoring event included precipitation over the previous 24 hours. In addition, tide levels were noted during the time of sampling at each location. Each of these field parameters was recorded on a Field Data Information Sheets.
While grab and composite samples collected using the auto samplers was described in Section 1.2 of this report, discrete grab samples were collected by lowering a new sampling container directly into the surface water and next transferred to the appropriate laboratory sample containers that have been pre-labeled and containing the appropriate sample preservative. Sampling personnel wore new laboratory-quality, PVC gloves during all sample collection activities, and changed gloves, at a minimum, between each monitoring location. Each sample container was identified with a laboratory label that was completed during collection, and each label included the following information:
• The address and telephone number of GEL; • A specific client code for the County; • The parameter to be analyzed from that container; • The sample identification number/name, and; • The date and time of sample collection.
A chain of custody (COC) was documented and maintained throughout sampling and transportation to the laboratory. Samples were transported to GEL Laboratories, LLC, or the designated subcontracted laboratory for analysis. A sufficient amount of

Year 2008-2009 Report, Beaufort County Storm Water Monitoring September 3, 2009 Beaufort County, South Carolina Page 4
GEL Engineering, LLC a Member of The GEL Group, Inc.
freezer packs and/or ice was maintained in the cooler to ensure that the samples remain at the recommended temperature (4° C). The analytical results were submitted to the County no more than 30 days from the date of sample collection. (The COC and analytical certificates were not submitted to the County and are not included within this report, but may be supplied upon request.)
1.4 Bacterial Source Tracking
The EPA recommends E. coli as the best indicator of health risk from water contact in recreational waters. They also recommend enterococci as the best indicator of health risk in salt water and a useful indicator in fresh water. Some states have changed their water quality standards to E. coli and fecal streptococci, and South Carolina has both fecal coliform and enterococci standards, but based on South Carolina’s historical data set, most monitoring is done utilizing the fecal coliform test.
One of the initial purposes for storm water quality monitoring was to evaluate sources of bacteria (human, bird, pets, wildlife, etc.) in locations where measured bacteria levels are substantially higher than expected based on the watershed’s land use and receiving water quality modeling. The United States Food and Drug Administration has established the minimum requirements necessary to regulate the interstate commerce of molluscan shellfish, as well as a program to protect the public health of consumers by assuring the sale or distribution of shellfish from safe sources, and assuring shellfish have not been adulterated during cultivating, harvesting, processing, shipping, or handling. To that end, it was determined to be appropriate to make an effort to identify and manage sources of bacterial contamination in shellfish harvesting waters. As a result, bacterial source tracking (BST), also referred to as Microbial Source Tracking or MST, was pursued to assist the County in taking appropriate actions to implement reliable management practices to reduce potential impairments.
Most BST studies have relied on matching “fingerprints” from bacterial strains isolated from a water sample to those isolated from various sources like humans, cows, dogs, horses and wildlife. The more recent BST approaches can be grouped into two methods. They are library dependent methods (LDM) and library independent methods (LIM). The LDMs require development of databases of fingerprints from suspected fecal sources. Samples are then compared to this library for classification. Generally, bacteria indicators of fecal contamination (i.e., E. coli and enterococci) are used in this method.

Year 2008-2009 Report, Beaufort County Storm Water Monitoring September 3, 2009 Beaufort County, South Carolina Page 5
GEL Engineering, LLC a Member of The GEL Group, Inc.
The non-library methods (LIM) do not depend on the development of databases from suspected fecal sources. Detection is performed via the amplification of a genetic marker by a Polymerase Chain Reaction (PCR) step. EPA’s BST guide states that no single method is clearly superior and the decision to use library dependent or library independent methods depend on the unique set of circumstances associated with the study area. Beaufort County chose to use the LIM method to provide the most accurate results in the most cost effective manner. GEL recommended that two trade-marked tests on human enterococcus and human bacteroidetes be performed. These tests were subcontracted to Source Molecular Corporation located in Miami, Florida.
During Year 1, the BST efforts were tied to existing grab sample locations and priority was given to grab sample sites with highest fecal coliform readings. The first test was the Human enterococcus ID test which uses PCR analytical technology to determine the presence of human fecal contamination by targeting the Enterococcus faecium human gene biomarker. The second test was a Human Bacteroiodetes ID test which also uses PCR technology. The second test is excellent for determining recent forms of fecal pollution, because these organisms are strict anerobes (i.e., they do not survive long outside the host organism). It was felt that these two tests, used together, would provide critical information for modeling and differentiating fecal coliform contamination in Beaufort County’s waters.
During Year 2, the BST efforts were again focused on evaluating sources of bacteria (human, bird, pets, wildlife, etc.) in the May River where measured bacteria levels are substantially higher than expected (based on the watershed and receiving water quality modeling). In addition, the May River is a significant shellfish harvesting water, and SCDHEC has recently restricted oyster harvesting based on elevated fecal coliform levels. Based on the significance of these closures and the effect on local business and recreation, Beaufort County focused the Year 2 BST efforts at four nearby stations (BECY-1, BECY-1.5, BECY-2, and Rose Dhu) in an attempt to track potential bacteriological sources that could eventually be controlled through BMPs.
2.0 Adjustments During Year 2 Monitoring
The adjustments made during Year 2 of the storm water monitoring program were few, especially when compared to Year 1. During Year 2, two new existing water quality stations were added, evaluation of the Eagles Point BMP efficiency was discontinued, and the May River BST efforts were evaluated and later discontinued.

Year 2008-2009 Report, Beaufort County Storm Water Monitoring September 3, 2009 Beaufort County, South Carolina Page 6
GEL Engineering, LLC a Member of The GEL Group, Inc.
2.1 Monitoring Station Changes
During Year 2, no station locations in place at the end of Year 1 were modified, and all sampling was performed in response to a storm event. As a result, consistent circumstances for the acquisition of “storm event” samples from these stations was established during Year 2.
In addition, two existing water quality stations were added during Year 2. Sampling at BECY-1.5 was initiated in March of 2009 to monitor fecal coliform (only parameter) in response to SCDHEC’s closure of oyster beds on the May River. Beaufort County determined that this additional fecal coliform data could be used to identify a potential “hotspot” of fecal coliform entering the May River. The second existing water quality station that was added was Southside, and its purpose is to establish a baseline of existing water quality before the forthcoming construction of a water quality control structure. The data from this station before and after construction will be used to determine the effectiveness of this control structure for possible application at other sites.
2.2 Eagles Point BMP Efficiency
One of the monitoring programs implemented by Beaufort County during Year 1 was evaluation of the efficiency of an existing BMP. The goal of this evaluation was to compare the calculated efficiency of the existing BMP to values used in the CDM model for various parameters. The challenge in evaluating an existing BMP is that all inputs and outputs must be monitored in order to calculate the removal efficiency. After searching for a candidate site, Beaufort County selected the Eagles Point Pond, and automatic grab and composite sampling began at the associated influent and discharge structures in April 2008.
During the Year 2 sampling at Eagles Point, three initial observations were made with regard to the resulting data – 1) the concentrations exiting the pond were very low, 2) the fecal coliform concentrations were decreasing across the pond, and 3) other parameter concentrations were increasing across the pond. As a result of the increasing concentrations, further investigation revealed that the BMP did not consist of only one input and one output. Additional inputs and sheet flow were determined to exist under wet, though not typically during dry, weather conditions. As a result, the auto sampler used at the Eagles Point inlet was moved at the end of Year 2 (May 2009) to Christine

Year 2008-2009 Report, Beaufort County Storm Water Monitoring September 3, 2009 Beaufort County, South Carolina Page 7
GEL Engineering, LLC a Member of The GEL Group, Inc.
Place (described in Section 2.1) and the evaluation of the BMP efficiency was discontinued. The auto sampler at the Eagles Point discharge was maintained and a flow meter was installed in the discharge pipe. Beaufort County is using the resulting concentration and flow data to calculate pollutant loadings at the pond discharge.
2.3 Bacterial Source Tracking
As indicated, during Year 2, the BST efforts were focused on determining and ultimately controlling potential sources of bacteria (human, bird, pets, wildlife, etc.) that discharge to the May River. BST was performed in February and March 2009 at four nearby stations: 1) BECY-1, an existing trending station, 2) BECY-1.5, the new fecal coliform-only station, and 3) BECY-2, an existing trending station, and 4) Rose Dhu, a nearby station that also leads to the May River. Unfortunately, while there were confirmed results for human and bird species contamination, the total data set was determined to be inconclusive. If future data is deemed to be conclusive with regard to these two species, the actual sources must be located. Once found, Beaufort County can likely mitigate for human contamination, but there is very little that can be done about bird contamination. As a result, Beaufort County continues to consider additional analytical methods to more clearly determine the bacteriological sources contributing to the May River impairments for fecal coliform.
2.4 Test Procedures
One significant analytical adjustment that was made during Year 2 was the development of station-specific sample dilutions for fecal coliform. As the initial fecal coliform data was being collected, a wide range of fecal coliform results were being reported across the stations, and it was realized that a significant number of sample results were not able to be quantified and were reported as greater than the upper limit of detection (ex., >2000 col/100 ml). Based on the historic values being reported at the stations, each station was designated a standard dilution for all future samples (0x/10x/100x dilutions). This maintains the maximum result accuracy while quantifying the majority of sample results to account for the wide range of fecal coliform concentrations. Making these changes allows for more accurate analysis of the data ranges, averages, standard deviations, etc. at each station.

Year 2008-2009 Report, Beaufort County Storm Water Monitoring September 3, 2009 Beaufort County, South Carolina Page 8
GEL Engineering, LLC a Member of The GEL Group, Inc.
3.0 Year 2 Data Analysis
As indicated, GEL’s monitoring is being performed to achieve four primary goals identified in the SWMP and support the county’s future implementation of this plan. The primary goals are:
1. Perform long-term trend analysis to track BMP effectiveness
2. Evaluate baseline existing water quality
3. Confirm model inputs for select structural BMPs
4. Confirm model inputs for runoff quality from land use areas
GEL reviewed the monitoring data as it was collected and also utilized an Excel spreadsheet data analysis tool to evaluate the total data set with regard to these goals. Note that while the purpose of the trending stations and existing water quality stations is different, the spreadsheet calculations performed are the same (ex., the number of water quality violations is calculated for the trend station data). Similarly, the average variability of the combined data was calculated for comparison to the variability of each individual station and the variability by parameter. This information was used to conclude that the difference between the data variability of the scheduled and wet-weather sampling events was relatively small, allowing for use of the full, combined Year 1 – Year 2 data set when evaluating the progress towards achieving the four primary goals.
3.1 Track Long-term Trends for BMP Effectiveness As indicated, the primary goal of the trending stations is to generate a long-term (i.e., 10 years or more) data set to evaluate BMP effectiveness and for comparison to the initial best and worst-case model predictions. The spreadsheet also includes a mathematical calculation that summarizes the trends of the monitored parameters at each station so they may be compared relative to each other. Regardless, based on only two years of data, no statistically significant trends can be obtained. At a minimum, three to five years of data should be collected from the trending stations before initial trends can be observed, stations compared, and the initial model results reviewed. In addition, based on the importance of fecal coliform concentrations and impairments, the data was evaluated for correlations between fecal coliform and other parameters, though none were found. Another very initial observation was an overall dissolved oxygen increase across all stations, though slight increases at stations may be the result of wet-weather sampling.

Year 2008-2009 Report, Beaufort County Storm Water Monitoring September 3, 2009 Beaufort County, South Carolina Page 9
GEL Engineering, LLC a Member of The GEL Group, Inc.
3.2 Baseline Existing Water Quality
The primary functions of the data analysis spreadsheet with regard to the existing water quality stations are to calculate the number of results above the water quality criteria, calculate the average salinity at each station, and calculate the variability of the data at each station. As indicated, the relative standard deviation (variability) of the combined Year 1&2 data set was compared to solely Year 2 data, and the overall variability was only slightly different based on wet-weather sampling events versus scheduled sampling events. In addition, the percent of samples above the associated water quality standard were also compared (Year 1&2 vs. Year 2), and the results were similar. This further supports evaluating the combined data set.
Stations with higher salinity values indicate the collection of tidally influenced samples rather than those of storm water resulting from a wet weather event. Stations BECY-4 (existing WQ), BECY-5 (existing WQ), and BECY-14 (trending) all indicate significant salinity. In addition, BECY-2 and BECY-3 indicate elevated salinity values, though the concentrations appear lower in Year 2 (wet-weather sampling).
As indicated, stations with more results above the applicable water quality standards should receive a higher priority for implementing future BMPs. Note that all stations have average fecal coliform concentrations greater than the state standard of 14 CFU/100 ml; therefore, the determination of stations with a higher than average number of results greater than the water quality standards is based on all results except fecal coliform. Fecal coliform impairment at the monitoring stations appears to be consistent across all stations. The stations with an elevated percentage of sample results above the water quality standards for parameters other than fecal coliform are BECY-4, BECY-5, and BECY-14. As indicated, all of these stations also have elevated salinity. Existing WQ stations BECY-12 and BECY-7ra are also above the average with regard to water quality exceedances, though BECY-7ra is based on a smaller data set since it was moved after Year 1. With regard to data variability at each station, those stations with higher overall data variability may indicate less confidence in the data set and necessitate further monitoring, while those with good water quality and low data variability may potentially be discontinued (based on 1+ years per CDM). BECY-13 and BECY-4 have the highest average relative standard deviation, and while BECY-13 should remain to further evaluate the data fluctuations, BECY-4 should be relocated based on high salinity as mentioned. The combination of good water quality and low data variability at stations

Year 2008-2009 Report, Beaufort County Storm Water Monitoring September 3, 2009 Beaufort County, South Carolina Page 10
GEL Engineering, LLC a Member of The GEL Group, Inc.
BECY-6r, BECY-8r, and BECY-10 make them potential candidates for “locking down” the data at those locations and moving them to new sites to collect additional water quality data for prioritizing BMPs.
The spreadsheet was also used to evaluate specific analytical parameters for potential elimination from future sampling. Several metals including cadmium, chromium, nickel, and zinc all had less than 4% of their results above the state water quality standards. These metals, as well as a few parameters that have no state water quality standard (iron, temperature, and total organic carbon), had lower average relative standard deviations than the other monitored parameters. Elimination of these parameters from future monitoring of existing water quality sites should be considered unless the resulting data would be necessary for future modeling efforts or a specific concern is known (i.e., a known upstream source or downstream impairment).
3.3 Selective BMP Efficiency Comparison
The data analysis spreadsheet calculates the percent removal for each monitored parameter (BOD5, fecal coliform, lead, TKN, phosphorus, TSS, and zinc) across a standard structural BMP, such as a wet detention pond, with one input and one output. The actual measured and calculated percent removal across the BMP is compared to the standard BMP removal efficiencies included within the SWMP and associated water quality model for each parameter.
As indicated, during the Year 2 sampling at Eagles Point, three initial observations were made with regard to the resulting data – 1) the concentrations exiting the pond were very low, 2) the fecal coliform concentrations were decreasing across the pond, and 3) other parameter concentrations were increasing across the pond. As a result of the increasing concentrations, further investigation revealed that the Eagles Point BMP did not consist of only one input and one output, and evaluation of the BMP efficiency was discontinued.
3.4 Selective Model Input Comparison As detailed earlier in this report, Event Mean Concentrations (EMCs) were used in the initial water quality model for the average runoff concentrations for each land use. The spreadsheet compares the monitoring data to the EMC’s used for each land use category – high, medium, and low density residential runoff as well as industrial runoff.
As indicated initially in the Year 1 report and during the last board meeting held on

Year 2008-2009 Report, Beaufort County Storm Water Monitoring September 3, 2009 Beaufort County, South Carolina Page 11
GEL Engineering, LLC a Member of The GEL Group, Inc.
August 5, 2009, the data collected to date indicates that the actual runoff concentrations from
BECY-1a (high density) and 4a (medium density) are significantly lower than values used in
the initial model – by several hundred percent on average. Based on the significant
difference in the model/monitored values, CDM should be consulted with regard to these
model inputs and the selected monitoring sites. If the initial site selections are not
appropriate, new high and medium-density runoff sites should be selected and monitored. If
the appropriateness of the site locations is confirmed, the data should be used for future
model predictions and future monitoring/BMP decisions, and the auto samplers should be
moved to appropriate low-density and industrial runoff locations.
3.5 Composite Versus Grab Sample Comparison
Auto samplers were recommended in the SWMP, and the samplers were set up to
collect both grab and composite samples. Data collected at the runoff quality sites (BECY-
1a and 4a), an existing quality station (BECY-7ra) and a trend station (BECY-9ra) indicate
that the average concentration, percent of samples above the water quality standards,
variability of the grab and composite sample results are similar. Therefore, based on the fact
that all manual grab samples are wet-weather samples, unless additional first flush data is
desired, there appears to be no relatively significant reason for continuing both grab and
composite sampling at the same monitoring location for the purposes of monitoring.
Beaufort County should consider eliminating the composite samples and/or move the auto
samplers to collect grabs at additional sites.
4.0 Year 2 Conclusions As noted in Section 6.0 of the "Year 2007-2008 Report," GEL was retained to
continue the storm water quality monitoring during year 2008-2009 while integrating
improvements over the existing sampling and analysis program. With GEL and Beaufort
County’s coordinated efforts, the Year 2008-2009 storm water sampling and analysis was
revised to incorporate lessons learned during the previous year. During year 2008-2009,
GEL and Beaufort County refined analytical ranges for fecal coliform analysis to include
data outside the previously monitored ranges. These adjustments allowed Beaufort

Year 2008-2009 Report, Beaufort County Storm Water Monitoring September 3, 2009 Beaufort County, South Carolina Page 12
GEL Engineering, LLC a Member of The GEL Group, Inc.
County to more accurately quantify the results across a wide range of fecal coliform
concentrations. Additionally, bacterial source tracking efforts were continued with
regard to fecal coliform contamination on the May River. In addition to summarizing the
Year 2008-2009 storm water monitoring program within this annual report, and, as
requested by the Beaufort County Storm Water Utility Board, GEL has listed
observations made during year 2008-2009 which we believe are worthy of further
consideration with regard to changes in future storm water quality monitoring in Beaufort
County:
• Moving BECY-4, BECY-5, and BECY-14. CDM recommended that Beaufort County relocate these three sampling locations due to possible influence/interference from salt water intrusion. Furthermore, data collected during year 2 supports this conclusion.
• BECY-7ra and BECY-12 may be good water quality monitoring sites for implementing future upstream BMPs. As noted above, these sites should not be influenced by salinity and should be true storm water derived samples. However, they have more results above the state water quality standards than other stations.
• Moving some of the existing water quality sites (BECY-6r, BECY-8r, and BECY-10) based on low data variability and good water quality. These sites have consistently demonstrated good water quality and may no longer require monitoring.
• Removing select parameters from existing water quality site analyses. As discussed in Section 3.2, some parameters have demonstrated low data variability with few or no water quality exceedence’s and may require no further monitoring.
• Locating a new BMP efficiency site. Presently there is no BMP site identified for the Beaufort County water quality monitoring program.
• Moving runoff sites to new high/medium density residential or industrial/low density residential sites. Due to the data collected from the existing sites being considerably lower than the data originally used by CDM to calibrate the water quality model, it may be advisable to collect data from other sites to see how it agrees with the model data.

Year 2008-2009 Report, Beaufort County Storm Water Monitoring September 3, 2009 Beaufort County, South Carolina Page 13
GEL Engineering, LLC a Member of The GEL Group, Inc.
• Eliminate collecting both grab and composite samples from the same site. Considering the relatively minor differences between the grab and composite data, it may be cost effective to eliminate collecting grab and composite samples from the same locations.
5.0 References
South Carolina Department of Health and Environmental Control, April 25, 2008, Water Classifications and Standards Regulation 61-68: Bureau of Water.
South Carolina Department of Health and Environmental Control, Shellfish Sanitation Program Water Monitoring, Assessment and Protection Division, Environmental Quality Control-Bureau of Water, Annual Update, July 2006 Update.
Beaufort County Storm Water Management Plan, February 20, 2006, Thomas & Hutton Engineering Co. and Camp Dresser McKee Inc.
Beaufort County Monitoring Program Review, March 24, 2008, Camp Dresser and McKee Inc.
USEPA, 2005. Microbial Source Tracking Guide Document. Office of Research and Development, Washington, DC, EPA/600/R-05/064.
USEPA, 2006, Water Quality Standards Database.

FIGURES


TABLES

Watershed Hydrologic Basin % Urban - Future Land Use
% Impervious - Future Land Use
Future Increase in % Urban
Future Increase in % Impervious Sampling Method Purpose
Beaufort River Southside 92% 51% 2% 1% Automatic High Density Residential RunoffBeaufort River Albergotti Creek 93% 67% 0% 0% Automatic Industrial RunoffColleton River Camp St. Marys 48% 8% 16% 2% Automatic Low Density Residential RunoffMorgan River Rock Springs Creek 96% 22% 7% 2% Automatic Medium Density Residential RunoffBeaufort River Burton Hill 71% 43% 19% 13% Grab Existing Quality1
Beaufort River Grober Hill 53% 25% 12% 3% Grab Existing Quality1
Beaufort River Salt Creek 75% 27% 35% 13% Grab Existing QualityBeaufort River Salt Creek South 78% 30% 41% 11% Grab Existing Quality1
Beaufort River Shanklin Road 81% 49% 31% 21% Grab Existing Quality1
Colleton River Berkeley Creek 67% 18% 15% 5% Grab Existing QualityMorgan River Factory Creek 84% 25% 15% 5% Grab Existing Quality1
Morgan River Lucy Point 95% 21% 6% 1% Grab Existing QualityBeaufort River Battery Creek North 90% 67% 55% 43% Grab Trend Analysis1
Beaufort River Battery Creek West 82% 28% 50% 10% Grab Trend Analysis1
Colleton River Okatie West 83% 25% 58% 19% Grab Trend AnalysisMay River Rose Dhu Creek 91% 22% 54% 13% Grab Trend AnalysisMay River Stoney Creek 72% 12% 51% 8% Grab Trend AnalysisMorgan River Coffin Creek 87% 22% 59% 14% Grab Trend Analysis
1 Sampling station is downstream of potential regional detention site, and therefore may provide data for prioritizing the construction of ponds and evaluating benefits (if pond is built)2 Location was inadvertently listed as "Coffin Creek" in the Beaufort County Stormwater Master Plan, Thomas & Hutton and CDM, 2006.
Table 1Recommended Tributary Sample Locations

Station Sample Meth Watershed Hydrologic Basin RWB Classification PurposeBECY-1a Auto Beaufort River Southside Battery Creek SFH High Density Res. RunoffBECY-1.5 Grab May River - - - Existing Water QualityBECY-1 Grab May River Stoney Creek May River ORW Trend AnalysisBECY-2 Grab May River Tose Dhu Creek May River ORW Trend AnalysisBECY-3 Grab Colleton River Okatie West Okatie River ORW Trend AnalysisBECY-4 Grab Colleton River Berkley Creek Okatie River ORW Existing Water QualityBECY-4a Auto Morgan River Rock Springs Creek Morgan River SFH Med. Density Res. RunoffBECY-5 Grab Colleton River Camp St. Marys Okatie River ORW Existing Water QualityBECY-6r Grab Beaufort River Grober Hill Battery Creek SFH Existing Water QualityBECY-7ra Auto Morgan River Burton Hill Battery Creek SFH Existing Water QualityBECY-8r Grab Beaufort River Battery Creek North Battery Creek SFH Trend AnalysisBECY-9ra Auto Beaufort River Battery Creek West Battery Creek SFH Trend AnalysisBECY-10 Grab Broad River Habersham Creek North Broad River SFH Existing Water QualityBECY-11 Grab Beaufort River Salt Creek South Beaufort River SA Existing Water QualityBECY-12 Grab Beaufort River Salt Creek Beaufort River SA Existing Water QualityBECY-13 Grab Morgan River Rock Springs Creek Morgan River SFH Existing Water QualityBECY-14 Grab Morgan River Village Creek Morgan River SFH Trend AnalysisBMPep - In Auto N/A N/A N/A N/A BMP EfficiencyBMPep - Out Auto N/A N/A N/A N/A BMP EfficiencySouthside Auto - - - - Existing Water Quality
Table 2Revised Tributary Sample Locations

Jun-08 Aug-08 Aug-08 Aug-08 Sep-08 Oct-08 Dec-08 Dec-08 Jan-09 Jan-09 Feb-09 Mar-09 Mar-09 Apr-09 Apr-09 Apr-09 May-09 May-096/29/2008 8/8/2008 8/13/2008 8/21/2008 9/12/2008 10/9/2008 12/1/2008 12/12/2008 1/13/2009 1/19/2009 2/19/2009 3/2/2009 3/17/2009 4/1/2009 4/6/2009 4/14/2009 5/6/2009 5/18/2009
BECY-1a Comp 0.208 . . 0.36 . 0.094 . . 0.03 . 0.233 . 0.109 0.144 . 0.125 0.141 0.115 10BECY-1a Grab 0.127 . . 0.24 . 0.121 . . 0.144 . 0.089 . 0.128 0.201 . 0.115 0.134 0.136 10BECY-4a Comp . . 0.11 0.10 0.224 . . 0.03 0.0842 . 0.105 . . . . . . . 6BECY-4a Grab . . 0.12 0.08 0.694 . . 0.03 0.0699 . 0.116 . . . . . . . 6BECY-7ra Comp 0.838 . . 0.07 . 0.145 . 0.075 0.211 . 0.114 0.058 0.069 0.14 0.11 0.164 0.645 . 12BECY-7ra Grab 0.72 . . 0.12 . 0.098 . 0.06 0.188 . 0.119 0.112 0.227 0.175 0.128 0.093 0.526 . 12BECY-9ra Comp 4 . . 0.04 0.207 0.569 . 0.03 0.177 . 0.069 . . 0.08 . 0.056 1.04 0.111 11BECY-9ra Grab 0.19 . . 0.04 0.109 1.71 . 0.047 0.117 . 0.086 . . 0.121 . 0.109 1.03 0.016 11BMPep - IN COMP . 0.13 . 0.16 . 0.091 0.129 . . . . . . 0.345 . 0.685 1.43 . 7BMPep - IN GRAB . 0.08 . 0.12 . 0.088 0.034 . . . . . . 0.072 . 0.638 1.36 . 7BMPep - OUT COMP . 0.56 . 0.11 . 0.182 0.15 0.064 . . 0.151 0.18 . . 0.016 0.13 0.644 . 10BMPep - OUT GRAB . 0.59 . 0.14 . 0.192 0.095 0.231 . . 0.232 0.2 . . 0.12 0.2 0.349 . 10SOUTHSIDE Comp . . . . . . . . . . 0.137 . . 0.234 . 0.81 0.384 0.016 5SOUTHSIDE Grab . . . . . . . . . . 0.067 . 0.132 0.161 . 1.35 0.427 0.344 6BECY-1 . 0.45 0.34 . 0.11 0.27 0.106 . 0.062 0.122 0.102 0.049 0.042 0.133 0.016 . . . 12BECY-2 . 0.12 0.28 . 0.111 0.186 0.078 . 0.0347 0.117 0.081 0.366 0.030 0.117 0.073 . . . 12BECY-3 . 0.23 0.19 . 0.227 0.213 0.094 . 0.0857 0.101 . 0.051 0.108 0.167 0.1 . . 0.169 12BECY-4 . 0.10 0.11 . . 0.114 0.105 . . 0.083 . 0.037 0.030 0.073 0.133 . . 0.174 10BECY-5 . 0.10 0.11 . 0.099 0.396 0.1 . 0.0803 0.101 . 0.03 0.046 0.086 0.076 . . 0.136 12BECY-6r . 0.08 0.12 . 3.27 0.541 0.168 . 0.112 0.042 . 0.03 0.030 0.308 0.244 . . 0.411 12BECY-8r . 0.08 0.10 . 0.119 0.107 0.94 . 0.0827 0.093 . 0.041 0.09 0.16 0.118 . . 0.116 12BECY-10 . 0.06 0.16 . 0.144 0.345 0.056 . 0.127 0.117 . 0.095 0.114 0.115 0.083 . . 0.12 12BECY-11 . 0.07 . . 0.189 0.124 0.324 . 0.0932 0.183 . 0.034 0.091 0.171 0.113 . . 0.192 11BECY-12 . 0.48 0.79 . 0.31 0.599 0.096 . 0.0471 0.138 . 0.12 0.108 0.169 0.234 . . 0.016 12BECY-13 . . 0.07 . 0.115 0.16 0.164 . 0.16 0.224 0.141 0.047 0.105 0.138 0.075 . . 0.117 12BECY-14 . 0.16 0.11 . 0.071 0.228 0.179 . 0.0719 0.223 . 0.03 0.154 0.079 0.166 . . 0.016 12
* Ammonia‐Nitrogen is internally tracked for Critical Exceedance Concentration information
# of Samples
Table 3 Year 2 Data Summary - Ammonia-Nitrogen* (NH3)
Station

Jun-08 Aug-08 Aug-08 Aug-08 Sep-08 Oct-08 Dec-08 Dec-08 Jan-09 Jan-09 Feb-09 Mar-09 Mar-09 Apr-09 Apr-09 Apr-09 May-09 May-096/29/2008 8/8/2008 8/13/2008 8/21/2008 9/12/2008 10/9/2008 12/1/2008 12/12/2008 1/13/2009 1/19/2009 2/19/2009 3/2/2009 3/17/2009 4/1/2009 4/6/2009 4/14/2009 5/6/2009 5/18/2009
BECY-1a Comp 5.05 . . 5.5 . 8.42 . . 11.2 . 9.38 . 11.5 15.1 . 1.39 6.26 5.85 10BECY-1a Grab 5.67 . . 4.2 . 9.38 . . 6.15 . 8.78 . 10.4 23.6 . 4.59 4.15 8.25 10BECY-4a Comp . . 4 1.5 1.02 . . 1 2.16 . 2.09 . . . . . . . 6BECY-4a Grab . . 2 2.6 1.55 . . 1.83 2.27 . 2.21 . . . . . . . 6BECY-7ra Comp 3.64 . . 2.8 . 4.27 . 2.94 2.58 . 2.93 2.3 2.17 7.52 7.46 4.54 4.96 . 12BECY-7ra Grab 4.34 . . 2.4 . 3.21 . 2.38 4.98 . 4.01 2.93 1.87 9.34 4.84 2.86 4.69 . 12BECY-9ra Comp 1.48 . . 4.8 1.19 9.08 . 8.29 25.7 . 3.63 . . 8.85 . 4.88 12.8 4.25 11BECY-9ra Grab 1.8 . . 4.9 1.27 9.83 . 7.78 28.6 . 4.89 . . 9.06 . 7.88 8.23 5.43 11BMPep - IN COMP . 3 . 1.0 . 4.3 3.36 . . . . . . 8.57 . 3.77 4.88 . 7BMPep - IN GRAB . 3 . 1.2 . 3.68 3 . . . . . . 10 . 3.74 6.79 . 7BMPep - OUT COMP . 3 . 2.3 . 7.89 4.21 4.2 . . 4.31 5.31 . . 5.53 4.64 7.06 . 10BMPep - OUT GRAB . 3 . 2.2 . 4.51 3.48 4.42 . . 4 5.92 . . 5.57 5.18 6.39 . 10SOUTHSIDE Comp . . . . . . . . . . 3.93 . . 14.6 3.35 1.9 5.34 5SOUTHSIDE Grab . . . . . . . . . . 4.89 . 5.96 14.3 2.75 7.69 6.2 6BECY-1 . 5 5 . 1.43 4.88 4.97 . 2.67 2.89 2.98 2.84 3.72 10.2 5.52 . . . 12BECY-2 . 3 2 . 1.71 3.97 1.94 . 2.66 2.06 3.31 1.56 2.04 8.82 6.1 . . . 12BECY-3 . 2 6 . 1.63 2.68 3.69 . 3.65 2.3 . 2.15 2.15 8.95 5.91 . . 4.18 12BECY-4 . 3 1 . . 3.26 3.95 . . 2.79 . 1.18 2.94 8.88 5.23 . . 3.32 10BECY-5 . 2 1 . 1 1.94 1 . 2.05 1.92 . 1 1.1 7.91 6.11 . . 3.35 12BECY-6r . 3 2 . 1.23 4.22 2.41 . 1 4.25 . 2.19 1.73 10.1 9.76 . . 4.38 12BECY-8r . 5 10 . 1.75 2.3 3.52 . 5.93 2.21 . 1.7 5.94 13.5 7.42 . . 4.28 12BECY-10 . 5 4 . 1.2 2.24 2.57 . 1.52 1.56 . 2.67 2.4 9.38 5.25 . . 4.73 12BECY-11 . 3 . . 1 2.94 2.46 . 1.43 1.81 . 1.27 2.15 9.22 4.53 . . 4.17 11BECY-12 . 5 4 . 2.79 4.78 2.37 . 2.52 1.6 . 2.18 1 8.31 3.48 . . 3.88 12BECY-13 . . 1 . 2.52 1.99 1.69 . 1.76 1.25 1 1.44 1.19 7.65 6.05 . . 3.13 12BECY-14 . 2 2 . 4.9 3.91 1.97 . 1.8 1.57 . 2.74 2.06 8.2 5.53 . . 3.55 12
* Biochemical Oxygen Demand is internally tracked for Critical Exceedance Concentration information
# of Samples
Table 4Year 2 Data Summary - Biochemical Oxygen Demand* (BOD5)
Station

Jun-08 Aug-08 Aug-08 Aug-08 Sep-08 Oct-08 Dec-08 Dec-08 Jan-09 Jan-09 Feb-09 Mar-09 Mar-09 Apr-09 Apr-09 Apr-09 May-09 May-096/29/2008 8/8/2008 8/13/2008 8/21/2008 9/12/2008 10/9/2008 12/1/2008 12/12/2008 1/13/2009 1/19/2009 2/19/2009 3/2/2009 3/17/2009 4/1/2009 4/6/2009 4/14/2009 5/6/2009 5/18/2009
BECY-1a Comp 10 . . . . 1 . . 1 . . . 1 . . . . . 4BECY-1a Grab 3.57 . . . . 1 . . 1 . . . 1.15 . . . . . 4BECY-4a Comp . . 1 . 1.00 . . 1.00 . . . . . . . . . . 3BECY-4a Grab . . 1 . 1.00 . . 1.00 . . . . . . . . . . 3BECY-7ra Comp 1.29 . . . . 1.09 . 1 . . . 1 . . . . . . 4BECY-7ra Grab 1.89 . . . . 1 . 1 . . . 1 . . . . . . 4BECY-9ra Comp 1 . . . 1 . . 1.11 . . . . . 1 . . . . 4BECY-9ra Grab 1 . . . 1 . . 1.03 . . . . . 1 . . . . 4BMPep - IN COMP . 1 . . . 1 1 . . . . . . 1 . . . . 4BMPep - IN GRAB . 1 . . . 1 1 . . . . . . 1 . . . . 4BMPep - OUT COMP . 1 . . . 1 1 1 . . . 1 . . . . . . 5BMPep - OUT GRAB . 1 . . . 1 1 1 . . . 1 . . . . . . 5SOUTHSIDE Comp . . . . . . . . . . . . . 1 . . . . 1SOUTHSIDE Grab . . . . . . . . . . . . . 1 . . . . 1BECY-1 . 5 . . 1 . 1 . . . . 1 . . . . . . 4BECY-2 . 5 . . 1 . 1 . . . . 1 . . . . . . 4BECY-3 . 5 . . 1 . 1 . . . . 1 . . . . . . 4BECY-4 . 5 . . . 1 10 . . . . 1 . . . . . . 4BECY-5 . 5 . . 1 . 10 . . . . 1 . . . . . . 4BECY-6r . 1 . . 1 . 1 . . . . 1 . . . . . . 4BECY-8r . 1 . . 1 . 1 . . . . 1 . . . . . . 4BECY-10 . 1 . . 1 . 1 . . . . 1 . . . . . . 4BECY-11 . 1 . . 1 . 1 . . . . 1 . . . . . . 4BECY-12 . 1 . . 1 . 1 . . . . 1 . . . . . . 4BECY-13 . . 1 . 1 . 1 . . . . 1 . . . . . . 4BECY-14 . 5 . . 1 . 10 . . . . 1 . . . . . . 4
# of Samples
Table 5Year 2 Data Summary - Cadmium (Total)
Station

Jun-08 Aug-08 Aug-08 Aug-08 Sep-08 Oct-08 Dec-08 Dec-08 Jan-09 Jan-09 Feb-09 Mar-09 Mar-09 Apr-09 Apr-09 Apr-09 May-09 May-096/29/2008 8/8/2008 8/13/2008 8/21/2008 9/12/2008 10/9/2008 12/1/2008 12/12/2008 1/13/2009 1/19/2009 2/19/2009 3/2/2009 3/17/2009 4/1/2009 4/6/2009 4/14/2009 5/6/2009 5/18/2009
BECY-1a Comp 3.60 . . 26.6 . 13.5 . . 16.4 . 103.1 . 125.3 97.9 . 28.3 62.4 15.8 10BECY-1a Grab 3.00 . . 24.7 . 38.3 . . 11.3 . 132.2 . 56.6 115.8 . 30.9 5.8 21.6 10BECY-4a Comp . . 0.50 0.2 0.2 . . <0.2 2.4 . 1.5 . . . . . . . 6BECY-4a Grab . . 0.30 0.2 0.2 . . 0.6 1.2 . 1.7 . . . . . . . 6BECY-7ra Comp 2.00 . . 10.4 . 7.6 . 1.0 1.4 . 13.2 3.5 4.7 1.3 <.2 2.2 4.5 . 12BECY-7ra Grab 1.30 . . 4.3 . 6.0 . 0.2 3.8 . 13.0 11.6 3.2 1.1 <.2 2.7 0.4 . 12BECY-9ra Comp 0.20 . . 2.2 6.1 0.5 . <0.2 1.4 . 8.9 . . 2.1 . 0.3 205.4 25.7 11BECY-9ra Grab 0.30 . . 2.5 0.3 0.3 . <0.2 1.2 . 51.9 . . 10.2 . 22.9 89.0 21.9 11BMPep - IN COMP . 16.60 . 0.2 . 1.7 <0.2 . . . . . . 0.7 . 3.7 0.2 . 7BMPep - IN GRAB . 36.20 . 0.2 . 1.4 0.3 . . . . . . 0.9 . 1.9 0.3 . 7BMPep - OUT COMP . 37.40 . 8.6 . 7.5 <0.2 2.2 . . 71.0 78.4 . . 0.3 41.9 16.3 . 10BMPep - OUT GRAB . 31.90 . 7.6 . 6.1 2.0 0.2 . . 55.2 57.2 . . 0.2 18.9 27.7 . 10SOUTHSIDE Comp . . . . . . . . . . 77.9 . 72.7 . 36.4 19.8 7.7 5SOUTHSIDE Grab . . . . . . . . . . 89.2 . 31.1* 121.8 . 21.1 15.4 9.3 6BECY-1 . 5.5 17.4 . 1.3 4.3 0.2 . 2.3 0.6 16.7 6.0 5.7 12.3 2.7 . . 12BECY-2 . 5.3 17.8 . . 13.0 <0.2 . 1.9 1.3 19.7 8.1 12.9 19.4 0.5 . . 11BECY-3 . 1.3 66.1 . 3.8 5.3 <0.2 . 2.6 1.2 . 15.2 20.5 16.1 0.3 . . 22.0 12BECY-4 . 66.6 9.8 . . 0.6 0.2 . . 2.0 . 9.0 12.1 23.6 0.5 . . 11.1 10BECY-5 . 8.5 6.3 . . 0.4 <0.2 . 0.5 1.1 . 2.5 4.7 5.6 0.3 . . 17.5 11BECY-6r . 3.8 21.8 . . 6.9 <0.2 . 0.2 0.3 . 8.4 3.5 7.1 <.2 . . 13.4 11BECY-8r . 11.9 1 . 2.0 3.1 <0.2 . 0.9 0.9 . 6.1 7.9 8.7 0.2 . . 2.8 12BECY-10 . 5.9 34.4 . 1.2 . <0.2 . 1.8 1.2 . 7.7 3.3 4.2 <.2 . . 4.5 11BECY-11 . 22 . . . 1.8 0.4 . 0.8 0.4 . 11.0 17.7 6.5 <.2 . . 2.7 10BECY-12 . 8.1 20.8 . 1.4 7.0 0.3 . 16.2 2.6 . 20.5 5.2 1.9 0.2 . . 5.4 12BECY-13 . . 20.8 . 0.2 0.4 <0.2 . 0.1 <0.2 0.7 1.5 0.6 0.4 0.2 . . 15.4 12BECY-14 . 15.5 16.3 . . 0.8 0.3 . 0.2 2.0 . 19.0 13.1 26.6 0.2 . . 17.8 11
# of Samples
Table 6 Year 2 Data Summary - Chlorophyll-a
Station

Jun-08 Aug-08 Aug-08 Aug-08 Sep-08 Oct-08 Dec-08 Dec-08 Jan-09 Jan-09 Feb-09 Mar-09 Mar-09 Apr-09 Apr-09 Apr-09 May-09 May-096/29/2008 8/8/2008 8/13/2008 8/21/2008 9/12/2008 10/9/2008 12/1/2008 12/12/2008 1/13/2009 1/19/2009 2/19/2009 3/2/2009 3/17/2009 4/1/2009 4/6/2009 4/14/2009 5/6/2009 5/18/2009
BECY-1a Comp 20 . . . . 2 . . 2 . . . 2.91 . . . . . 4BECY-1a Grab 2 . . . . 2 . . 2 . . . 2.47 . . . . . 4BECY-4a Comp . . 2.73 . 2 . . 2 . . . . . . . . . . 3BECY-4a Grab . . 2.75 . 2 . . 2 . . . . . . . . . . 3BECY-7ra Comp 6.11 . . . . 4.36 . 2 . . . 2 . . . . . . 4BECY-7ra Grab 2 . . . . 6.65 . 3.38 . . . 2 . . . . . . 4BECY-9ra Comp 3.36 . . . 2 . . 2 . . . . . 2.18 . . . . 4BECY-9ra Grab 2 . . . 2 . . 2.5 . . . . . 2.93 4BMPep - IN COMP . 2 . . . 2 2 . . . . . . 2 . . . . 4BMPep - IN GRAB . 2 . . . 2 2 . . . . . . 2 . . . . 4BMPep - OUT COMP . 2 . . . 2 2 2 . . . 2 . . . . . . 5BMPep - OUT GRAB . 2 . . . 2 2 2 . . . 2 . . . . . . 5SOUTHSIDE Comp . . . . . . . . . . . . . 3.47 . . . . 1SOUTHSIDE Grab . . . . . . . . . . . . . 3.33 . . . . 1BECY-1 . 2 . . 2 . 2 . . . . 2 . . . . . . 4BECY-2 . 2 . . 2 . 2 . . . . 2 . . . . . . 4BECY-3 . 10 . . 2 2 . . . . 2 . . . . . . 4BECY-4 . 10 . . . 2 20 . . . . 2 . . . . . . 4BECY-5 . 10 . . 2 . 20 . . . . 2 . . . . . . 4BECY-6r . 2 . . 2.28 . 2 . . . . 2.79 . . . . . . 4BECY-8r . 2 . . 2.14 . 2 . . . . 2 . . . . . . 4BECY-10 . 2 . . 2.92 . 2 . . . . 2 . . . . . . 4BECY-11 . 2 . . 3.16 . 2 . . . . 2 . . . . . . 4BECY-12 . 4 . . 5.69 . 2 . . . . 2 . . . . . . 4BECY-13 . . 10.3 . 2 . 2 . . . . 2 . . . . . . 4BECY-14 . 10 . . 2 . 20 . . . . 2 . . . . . . 4
# of Samples
Table 7Year 2 Data Summary - Chromium (Total)
Station
Jun-08 Aug-08 Aug-08 Aug-08 Sep-08 Oct-08 Dec-08 Dec-08 Jan-09 Jan-09 Feb-09 Mar-09 Mar-09 Apr-09 Apr-09 Apr-09 May-09 May-096/29/2008 8/8/2008 8/13/2008 8/21/2008 9/12/2008 10/9/2008 12/1/2008 12/12/2008 1/13/2009 1/19/2009 2/19/2009 3/2/2009 3/17/2009 4/1/2009 4/6/2009 4/14/2009 5/6/2009 5/18/2009
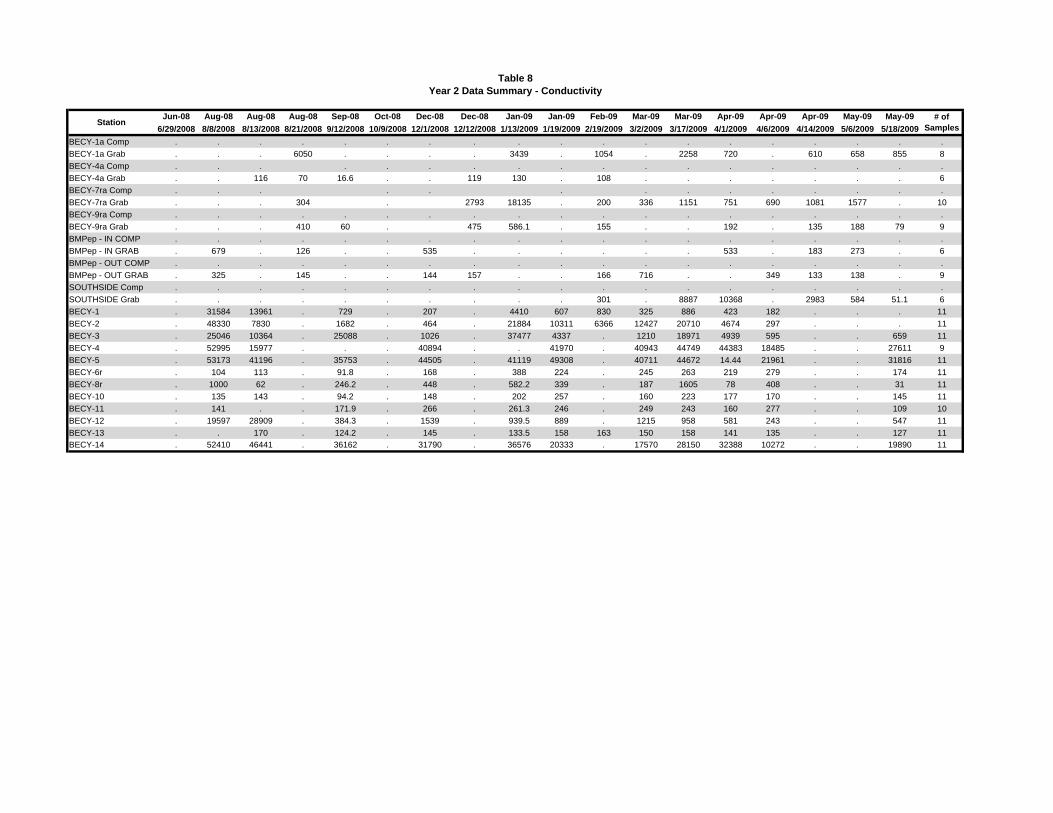
BECY-1a Comp . . . . . . . . . . . . . . . . . . .BECY-1a Grab . . . 6050 . . . . 3439 . 1054 . 2258 720 . 610 658 855 8BECY-4a Comp . . . . . . . . . . . . . . . . . .BECY-4a Grab . . 116 70 16.6 . . 119 130 . 108 . . . . . . . 6BECY-7ra Comp . . . . . . . . . . . . . .BECY-7ra Grab . . . 304 . 2793 18135 . 200 336 1151 751 690 1081 1577 . 10BECY-9ra Comp . . . . . . . . . . . . . . . . . . .BECY-9ra Grab . . . 410 60 . 475 586.1 . 155 . . 192 . 135 188 79 9BMPep - IN COMP . . . . . . . . . . . . . . . . . . .BMPep - IN GRAB . 679 . 126 . . 535 . . . . . . 533 . 183 273 . 6BMPep - OUT COMP . . . . . . . . . . . . . . . . . . .BMPep - OUT GRAB . 325 . 145 . . 144 157 . . 166 716 . . 349 133 138 . 9SOUTHSIDE Comp . . . . . . . . . . . . . . . . . . .SOUTHSIDE Grab . . . . . . . . . . 301 . 8887 10368 . 2983 584 51.1 6BECY-1 . 31584 13961 . 729 . 207 . 4410 607 830 325 886 423 182 . . . 11BECY-2 . 48330 7830 . 1682 . 464 . 21884 10311 6366 12427 20710 4674 297 . . . 11BECY-3 . 25046 10364 . 25088 . 1026 . 37477 4337 . 1210 18971 4939 595 . . 659 11BECY-4 . 52995 15977 . . . 40894 . . 41970 . 40943 44749 44383 18485 . . 27611 9BECY-5 . 53173 41196 . 35753 . 44505 . 41119 49308 . 40711 44672 14.44 21961 . . 31816 11BECY-6r . 104 113 . 91.8 . 168 . 388 224 . 245 263 219 279 . . 174 11BECY-8r . 1000 62 . 246.2 . 448 . 582.2 339 . 187 1605 78 408 . . 31 11BECY-10 . 135 143 . 94.2 . 148 . 202 257 . 160 223 177 170 . . 145 11BECY-11 . 141 . . 171.9 . 266 . 261.3 246 . 249 243 160 277 . . 109 10BECY-12 . 19597 28909 . 384.3 . 1539 . 939.5 889 . 1215 958 581 243 . . 547 11BECY-13 . . 170 . 124.2 . 145 . 133.5 158 163 150 158 141 135 . . 127 11BECY-14 . 52410 46441 . 36162 . 31790 . 36576 20333 . 17570 28150 32388 10272 . . 19890 11
# of Samples
Table 8Year 2 Data Summary - Conductivity
Station
Jun-08 Aug-08 Aug-08 Aug-08 Sep-08 Oct-08 Dec-08 Dec-08 Jan-09 Jan-09 Feb-09 Mar-09 Mar-09 Apr-09 Apr-09 Apr-09 May-09 May-096/29/2008 8/8/2008 8/13/2008 8/21/2008 9/12/2008 10/9/2008 12/1/2008 12/12/2008 1/13/2009 1/19/2009 2/19/2009 3/2/2009 3/17/2009 4/1/2009 4/6/2009 4/14/2009 5/6/2009 5/18/2009
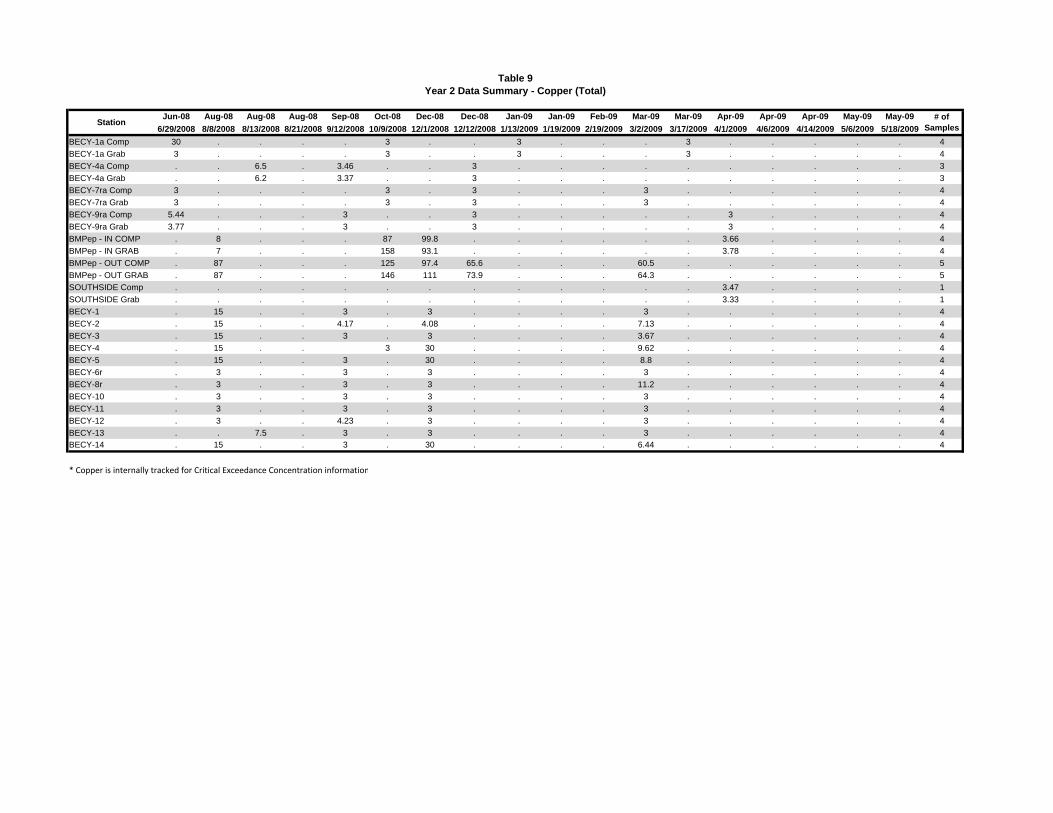
BECY-1a Comp 30 . . . . 3 . . 3 . . . 3 . . . . . 4BECY-1a Grab 3 . . . . 3 . . 3 . . . 3 . . . . . 4BECY-4a Comp . . 6.5 . 3.46 . . 3 . . . . . . . . . . 3BECY-4a Grab . . 6.2 . 3.37 . . 3 . . . . . . . . . . 3BECY-7ra Comp 3 . . . . 3 . 3 . . . 3 . . . . . . 4BECY-7ra Grab 3 . . . . 3 . 3 . . . 3 . . . . . . 4BECY-9ra Comp 5.44 . . . 3 . . 3 . . . . . 3 . . . . 4BECY-9ra Grab 3.77 . . . 3 . . 3 . . . . . 3 . . . . 4BMPep - IN COMP . 8 . . . 87 99.8 . . . . . . 3.66 . . . . 4BMPep - IN GRAB . 7 . . . 158 93.1 . . . . . . 3.78 . . . . 4BMPep - OUT COMP . 87 . . . 125 97.4 65.6 . . . 60.5 . . . . . . 5BMPep - OUT GRAB . 87 . . . 146 111 73.9 . . . 64.3 . . . . . . 5SOUTHSIDE Comp . . . . . . . . . . . . . 3.47 . . . . 1SOUTHSIDE Grab . . . . . . . . . . . . . 3.33 . . . . 1BECY-1 . 15 . . 3 . 3 . . . . 3 . . . . . . 4BECY-2 . 15 . . 4.17 . 4.08 . . . . 7.13 . . . . . . 4BECY-3 . 15 . . 3 . 3 . . . . 3.67 . . . . . . 4BECY-4 . 15 . . 3 30 . . . . 9.62 . . . . . . 4BECY-5 . 15 . . 3 . 30 . . . . 8.8 . . . . . . 4BECY-6r . 3 . . 3 . 3 . . . . 3 . . . . . . 4BECY-8r . 3 . . 3 . 3 . . . . 11.2 . . . . . . 4BECY-10 . 3 . . 3 . 3 . . . . 3 . . . . . . 4BECY-11 . 3 . . 3 . 3 . . . . 3 . . . . . . 4BECY-12 . 3 . . 4.23 . 3 . . . . 3 . . . . . . 4BECY-13 . . 7.5 . 3 . 3 . . . . 3 . . . . . . 4BECY-14 . 15 . . 3 . 30 . . . . 6.44 . . . . . . 4
* Copper is internally tracked for Critical Exceedance Concentration information
# of Samples
Table 9Year 2 Data Summary - Copper (Total)
Station

Jun-08 Aug-08 Aug-08 Aug-08 Sep-08 Oct-08 Dec-08 Dec-08 Jan-09 Jan-09 Feb-09 Mar-09 Mar-09 Apr-09 Apr-09 Apr-09 May-09 May-096/29/2008 8/8/2008 8/13/2008 8/21/2008 9/12/2008 10/9/2008 12/1/2008 12/12/2008 1/13/2009 1/19/2009 2/19/2009 3/2/2009 3/17/2009 4/1/2009 4/6/2009 4/14/2009 5/6/2009 5/18/2009
BECY-1a Comp . . . . . . . . . . . . . . . . . .BECY-1a Grab . . . 4.99 . . . . 12.25 . 10.4 . 0.27 2.86 . 3.45 1.14 5.88 8BECY-4a Comp . . . . . . . . . . . . . . . . . . .BECY-4a Grab . . 8.64 10.13 5.09 . . 6.4 7.33 . 5.6 . . . . . . . 6BECY-7ra Comp . . . . . . . . . . . . . . . . . . .BECY-7ra Grab . . . 6.81 . . . 10.43 6.54 . 6.5 7.6 3.49 5.93 4.51 4.33 4.02 . 10BECY-9ra Comp . . . . . . . . . . . . . . . . . . .BECY-9ra Grab . . . 7.7 6.45 . . 3.35 8.99 . 7.5 . . 5.92 . 3.9 2.5 7.6 9BMPep - IN COMP . . . . . . . . . . . . . . . . . . .BMPep - IN GRAB . 3.08 . 7.3 . . 9.5 . . . . . . 4.73 . 3.04 2.28 . 6BMPep - OUT COMP . . . . . . . . . . . . . . . . . . .BMPep - OUT GRAB . 3.54 . 7.28 . . 8.22 7.4 . . 5.3 8.86 . . 7.6 4.74 1.93 . 9SOUTHSIDE Comp . . . . . . . . . . . . . . . . . . .SOUTHSIDE Grab . . . . . . . . . . 5.3 . 2.13 1.1 . 1.97 1.5 4.23 6BECY-1 . 5.4 7.69 . 5.5 . 8 . 9.96 9.97 7.7 8.73 7.04 7.01 6.4 . . . 11BECY-2 . 4.34 8.18 . 5.9 . 9.64 . 5.91 9.3 8.4 12.4 12 7.06 7.44 . . . 11BECY-3 . 4.8 5.25 . 3.35 . 7.5 . 5.64 10.04 . 9.4 6.53 6.67 6.2 . . 8.09 11BECY-4 . 4.1 4.34 . . . 8.4 . . 10.8 . 7.63 6.79 6.81 6.32 . . 5.4 9BECY-5 . 4.3 3.19 . 3.8 . 8.08 . 6.18 9.55 . 7.3 6.03 5.78 5.35 . . 7.13 11BECY-6r . 0.86 3.88 . 4.43 . 6.01 . 6.53 9.5 . 9.57 6.27 6.24 5.4 . . 7.09 11BECY-8r . 0.56 7.14 . 4.69 . 4.27 . 7.35 9.42 . 6.4 6.01 7.17 3.82 . . 9.2 11BECY-10 . 3.56 2.96 . 4.7 . 6.61 . 5.95 9.3 . 7.27 5.64 5.07 4.25 . . 4.4 11BECY-11 . 2.3 . . 4.05 . 8.73 . 7.51 8.6 . 6.75 2.2 5.1 6.52 . . 8.2 10BECY-12 . 3.6 1.16 . 4.19 . 8.27 . 7.98 11.37 . 7.2 7.17 7.3 6.56 . . 7.4 11BECY-13 . . 4.17 . 6.14 . 7.51 . 6.88 7.5 8 8.12 7.95 7.35 5.46 . . 8.9 11BECY-14 . 2.26 2.88 . 3.63 . 5.78 . 7.28 10.5 . 7.38 5.95 5.58 5.02 . . 5.52 11
* Dissolved Oxygen is internally tracked for Critical Exceedance Concentration information
# of Samples
Table 10Year 2 Data Summary - Dissolved Oxygen* (DO)
Station

Jun-08 Aug-08 Aug-08 Aug-08 Sep-08 Oct-08 Dec-08 Dec-08 Jan-09 Jan-09 Feb-09 Mar-09 Mar-09 Apr-09 Apr-09 Apr-09 May-09 May-096/29/2008 8/8/2008 8/13/2008 8/21/2008 9/12/2008 10/9/2008 12/1/2008 12/12/2008 1/13/2009 1/19/2009 2/19/2009 3/2/2009 3/17/2009 4/1/2009 4/6/2009 4/14/2009 5/6/2009 5/18/2009
BECY-1a Comp 2 . . <200 . 300 . . 80 . 9000 . 20 11 . 20 110 1700 10BECY-1a Grab 2 . . <200 . 1300 . . 40 . 3000 . <20 40 . 40 40 130 10BECY-4a Comp . . 1300 800 2300 . . 500 1600 . 230 . . . . . . . 6BECY-4a Grab . . 1400 50000 8000 . . 500 900 . 170 . . . . . . . 6BECY-7ra Comp 2 . . <200 . 300 . 1300 300 . 5000 170 2800 130 270 9000 5000 . 12BECY-7ra Grab 2 . . 200 . 40 . 5000 500 . 3000 230 500 110 800 16000 300 . 12BECY-9ra Comp 17 . . 800 5000 >16000 . 1100 3000 . 1300 . . 500 . 3000 >16000 >16000 11BECY-9ra Grab 2 . . 5000 700 5000 . 1300 3000 . 700 . . 230 . 5000 >16000 16000 11BMPep - IN COMP . 170 . <200 . 500 60 . . . . . . 220 . 13 30 . 7BMPep - IN GRAB . 50 . <200 . <2 300 . . . . . . 170 . 60 11 . 7BMPep - OUT COMP . 13 . <200 . 500 8 50 . . <2 33 . . 8 9 30 . 10BMPep - OUT GRAB . 23 . <200 . 500 14 2 . . 2 30 . . 11 2 2 . 10SOUTHSIDE Comp . . . . . . . . . . >1600 . . 800 . 600 >16000 5000 5SOUTHSIDE Grab . . . . . . . . . . >1600 . . 500 . 2200 >16000 5000 5BECY-1 . >1600 11000 . 8000 2400 300 . 2400 300 1700 2200 500 90 170 . . . 12BECY-1.5 . . . . . . . . . . . . 1150 . . . . 500 2BECY-2 . 500 2200 . 2300 16000 500 . 800 500 3000 800 1300 16000 1100 . . . 12BECY-3 . 500 8000 . 400 1600 230 . 170 500 . 1100 230 1300 170 . . 300 11BECY-4 . 11 <200 . . 170 30 . . 11 . 60 8 8 130 . . 170 10BECY-5 . 17 17000 . 700 5000 40 . 40 20 . 80 <20 40 700 . . 500 12BECY-6r . >1600 400 . 3000 >16000 220 . <20 80 . 500 1300 1300 17 . . 1300 12BECY-8r . >1600 50000 . 5000 8000 1300 . 3000 400 . 600 3000 2300 800 . . 4000 12BECY-10 . >1600 <200 . 5000 1100 1300 . 500 500 . 800 230 500 110 . . 1700 12BECY-11 . >1600 . . 1100 <20 70 . 110 500 . 40 <20 500 230 . . 9000 11BECY-12 . >1600 2300 . 11000 300 2400 . 1700 3000 . 1300 170 1700 140 . . 5000 12BECY-13 . . 1700 . 200 3000 800 . 20 20 80 20 <20 <20 <20 . . 260 12BECY-14 . 70 <200 . 200 >1600 900 . 50 110 . 240 900 80 14 . . 500 12
* Fecal Coliform is internally tracked for Critical Exceedance Concentration information
# of Samples
Table 11Year 2 Data Summary - Fecal Coliform*
Station

Jun-08 Aug-08 Aug-08 Aug-08 Sep-08 Oct-08 Dec-08 Dec-08 Jan-09 Jan-09 Feb-09 Mar-09 Mar-09 Apr-09 Apr-09 Apr-09 May-09 May-096/29/2008 8/8/2008 8/13/2008 8/21/2008 9/12/2008 10/9/2008 12/1/2008 12/12/2008 1/13/2009 1/19/2009 2/19/2009 3/2/2009 3/17/2009 4/1/2009 4/6/2009 4/14/2009 5/6/2009 5/18/2009
BECY-1a Comp 357 . . . . 25 . . 180 . . . 557 . . . . . 4BECY-1a Grab 44.2 . . . . 25 . . 232 . . . 442 . . . . . 4BECY-4a Comp . . 431 . 345 . . 1560 . . . . . . . . . . 3BECY-4a Grab . . 428 . 198 . . 1040 . . . . . . . . . . 3BECY-7ra Comp 3070 . . . . 1740 . 2030 . . . 1340 . . . . . . 4BECY-7ra Grab 25 . . . . 3480 . 3860 . . . 1290 . . . . . . 4BECY-9ra Comp 4810 . . . 259 . . 1920 . . . . . 1260 . . . . 4BECY-9ra Grab 884 . . . 224 . . 2670 . . . . . 1360 4BMPep - IN COMP . 1680 . . . 1240 820 . . . . . . 1780 . . . . 4BMPep - IN GRAB . 1290 . . . 726 826 . . . . . . 1690 . . . . 4BMPep - OUT COMP . 665 . . . 604 815 911 . . . 711 . . . . . . 5BMPep - OUT GRAB . 565 . . . 607 956 995 . . . 738 . . . . . . 5SOUTHSIDE Comp . . . . . . . . . . . . 1190 . . . . 1SOUTHSIDE Grab . . . . . . . . . . . . 1180 . . . . 1BECY-1 . 1170 . . 2820 . 1420 . . . . 1430 . . . . . . 4BECY-2 . 844 . . 1790 . 958 . . . . 770 . . . . . . 4BECY-3 . 1080 . . 393 . 965 . . . . 1100 . . . . . . 4BECY-4 . 155 . . 25 250 . . . . 295 . . . . . . 4BECY-5 . 329 . . 125 . 262 . . . . 157 . . . . . . 4BECY-6r . 345 . . 1310 . 980 . . . . 2730 . . . . . . 4BECY-8r . 539 . . 529 . 495 . . . . 657 . . . . . . 4BECY-10 . 1490 . . 1140 . 1210 . . . . 1500 . . . . . . 4BECY-11 . 526 . . 4600 . 5840 . . . . 6570 . . . . . . 4BECY-12 . 1720 . . 2100 . 1180 . . . . 1310 . . . . . . 4BECY-13 . . 13100 . 572 . 1210 . . . . 464 . . . . . . 4BECY-14 . 822 . . 101 . 579 . . . . 522 . . . . . . 4
# of Samples
Table 12Year 2 Data Summary - Iron (Total)
Station

Jun-08 Aug-08 Aug-08 Aug-08 Sep-08 Oct-08 Dec-08 Dec-08 Jan-09 Jan-09 Feb-09 Mar-09 Mar-09 Apr-09 Apr-09 Apr-09 May-09 May-096/29/2008 8/8/2008 8/13/2008 8/21/2008 9/12/2008 10/9/2008 12/1/2008 12/12/2008 1/13/2009 1/19/2009 2/19/2009 3/2/2009 3/17/2009 4/1/2009 4/6/2009 4/14/2009 5/6/2009 5/18/2009
BECY-1a Comp 25 . . . . 2.5 . . 2.5 . . . 4.79 . . . . . 4BECY-1a Grab 2.5 . . . . 2.5 . . 2.5 . . . 2.5 . . . . . 4BECY-4a Comp . . 5.8 . 2.5 . . 2.5 . . . . . . . . . . 3BECY-4a Grab . . 6.7 . 2.5 . . 2.5 . . . . . . . . . . 3BECY-7ra Comp 2.5 . . . . 2.89 . 2.5 . . . 2.5 . . . . . . 4BECY-7ra Grab 2.5 . . . . 6.49 . 3.59 . . . 2.5 . . . . . . 4BECY-9ra Comp 2.5 . . . 2.5 . . 2.5 . . . . . 2.5 . . . . 4BECY-9ra Grab 2.5 . . . 2.5 . . 2.5 . . . . . 2.5 . . . . 4BMPep - IN COMP . 2.5 . . . 2.5 2.5 . . . . . . 2.5 . . . . 4BMPep - IN GRAB . 2.5 . . . 2.5 2.5 . . . . . . 2.5 . . . . 4BMPep - OUT COMP . 2.5 . . . 2.5 2.5 2.5 . . . 2.5 . . . . . . 5BMPep - OUT GRAB . 2.5 . . . 2.91 2.5 2.5 . . . 2.5 . . . . . . 5SOUTHSIDE Comp . . . . . . . . . . . . . 2.5 . . . . 1SOUTHSIDE Grab . . . . . . . . . . . . . 2.5 . . . . 1BECY-1 . 12.5 . . 2.5 . 2.5 . . . . 2.5 . . . . . . 4BECY-2 . 12.5 . . 2.5 . 2.5 . . . . 2.5 . . . . . . 4BECY-3 . 12.5 . . 2.5 . 2.5 . . . . 2.5 . . . . . . 4BECY-4 . 12.5 . . . 2.5 25 . . . . 12.5 . . . . . . 4BECY-5 . 12.5 . . 2.5 . 25 . . . . 12.5 . . . . . . 4BECY-6r . 2.5 . . 2.5 . 2.5 . . . . 2.5 . . . . . . 4BECY-8r . 2.5 . . 2.5 . 2.5 . . . . 2.5 . . . . . . 4BECY-10 . 2.5 . . 2.5 . 2.5 . . . . 2.5 . . . . . . 4BECY-11 . 2.5 . . 2.5 . 2.5 . . . . 2.5 . . . . . . 4BECY-12 . 2.5 . . 7.74 . 2.5 . . . . 2.5 . . . . . . 4BECY-13 . . 7.8 . 2.5 . 2.5 . . . . 2.5 . . . . . . 4BECY-14 . 12.5 . . 2.5 . 25 . . . . 2.5 . . . . . . 4
# of Samples
Table 13Year 2 Data Summary - Lead (Total)
Station

Jun-08 Aug-08 Aug-08 Aug-08 Sep-08 Oct-08 Dec-08 Dec-08 Jan-09 Jan-09 Feb-09 Mar-09 Mar-09 Apr-09 Apr-09 Apr-09 May-09 May-096/29/2008 8/8/2008 8/13/2008 8/21/2008 9/12/2008 10/9/2008 12/1/2008 12/12/2008 1/13/2009 1/19/2009 2/19/2009 3/2/2009 3/17/2009 4/1/2009 4/6/2009 4/14/2009 5/6/2009 5/18/2009
BECY-1a Comp 20 . . . . 28.9 . . 50.8 . . . 53.7 . . . . . 4BECY-1a Grab 13.1 . . . . 37 . . 20.3 . . . 56 . . . . . 4BECY-4a Comp . . 9 . 7.4 . . 40.9 . . . . . . . . . . 3BECY-4a Grab . . 7 . 6.37 . . 38.5 . . . . . . . . . . 3BECY-7ra Comp 216 . . . . 58.3 . 36 . . . 5.47 . . . . . . 4BECY-7ra Grab 124 . . . . 95 . 59.2 . . . 6.04 . . . . . . 4BECY-9ra Comp 263 . . . 7.02 . . 100 . . . . . 35.7 . . . . 4BECY-9ra Grab 8.99 . . . 5.93 . . 90.4 . . . . . 28.5 . . . . 4BMPep - IN COMP . 18 . . . 20.5 15 . . . . . . 19 . . . . 4BMPep - IN GRAB . 16 . . . 15.8 15 . . . . . . 18.3 . . . . 4BMPep - OUT COMP . 22 . . . 22.1 14 15.4 . . . 23.5 . . . . . . 5BMPep - OUT GRAB . 22 . . . 24.3 15 21.3 . . . 24 . . . . . . 5SOUTHSIDE Comp . . . . . . . . . . . . . 60.7 . . . . 1SOUTHSIDE Grab . . . . . . . . . . . . . 61.1 . . . . 1BECY-1 . 454 . . 164 . 88.3 . . . . 88.5 . . . . . . 4BECY-2 . 136 . . 84.4 . 25.8 . . . . 80.1 . . . . . . 4BECY-3 . 251 . . 234 . 34.9 . . . . 74.6 . . . . . . 4BECY-4 . 49 . . . 48.3 23.2 . . . . 13.2 . . . . . . 4BECY-5 . 40 . . 58.2 . 20 . . . . 11.5 . . . . . . 4BECY-6r . 80 . . 17.9 . 8.87 . . . . 57.8 . . . . . . 4BECY-8r . 132 . . 32.1 . 19.2 . . . . 16.7 . . . . . . 4BECY-10 . 84 . . 42.1 . 43.4 . . . . 88.5 . . . . . . 4BECY-11 . 138 . . 159 . 328 . . . . 88.5 . . . . . . 4BECY-12 . 337 . . 109 . 35.4 . . . . 88.5 . . . . . . 4BECY-13 . . 232 . 18.4 . 24.7 . . . . 88.5 . . . . . . 4BECY-14 . 346 . . 302 . 142 . . . . 88.5 . . . . . . 4
# of Samples
Table 14Year 2 Data Summary - Manganese (Total)
Station

Jun-08 Aug-08 Aug-08 Aug-08 Sep-08 Oct-08 Dec-08 Dec-08 Jan-09 Jan-09 Feb-09 Mar-09 Mar-09 Apr-09 Apr-09 Apr-09 May-09 May-096/29/2008 8/8/2008 8/13/2008 8/21/2008 9/12/2008 10/9/2008 12/1/2008 12/12/2008 1/13/2009 1/19/2009 2/19/2009 3/2/2009 3/17/2009 4/1/2009 4/6/2009 4/14/2009 5/6/2009 5/18/2009
BECY-1a Comp 0.03 . . . . 0.067 . . 0.067 . . . 0.067 . . . . . 4BECY-1a Grab 0.03 . . . . 0.067 . . 0.067 . . . 0.067 . . . . . 4BECY-4a Comp . . 0.03 . 0.03 . . 0.067 . . . . . . . . . . 3BECY-4a Grab . . 0.03 . 0.03 . . 0.067 . . . . . . . . . . 3BECY-7ra Comp 0.03 . . . . 0.067 . 0.067 . . . 0.067 . . . . . . 4BECY-7ra Grab 0.03 . . . . 0.067 . 0.067 . . . 0.067 . . . . . . 4BECY-9ra Comp 0.03 . . . 0.03 . . 0.067 . . . . . 0.067 . . . . 4BECY-9ra Grab 0.03 . . . 0.03 . . 0.067 . . . . . 0.067 . . . . 4BMPep - IN COMP . 0.03 . . . 0.067 0.067 . . . . . . 0.067 . . . . 4BMPep - IN GRAB . 0.03 . . . 0.067 0.067 . . . . . . 0.067 . . . . 4BMPep - OUT COMP . 0.03 . . . 0.067 0.067 0.067 . . . 0.067 . . . . . . 5BMPep - OUT GRAB . 0.03 . . . 0.067 0.067 0.067 . . . 0.067 . . . . . . 5SOUTHSIDE Comp . . . . . . . . . . . . . 0.067 . . . . 1SOUTHSIDE Grab . . . . . . . . . . . . . 0.067 . . . . 1BECY-1 . 0.03 . . 0.03 . 0.067 . . . . 0.067 . . . . . 4BECY-2 . 0.03 . . 0.03 . 0.067 . . . . 0.067 . . . . . 4BECY-3 . 0.03 . . 0.03 0.067 . . . . 0.067 . . . . . 4BECY-4 . 0.03 . . . 0.067 0.067 . . . . 0.067 . . . . . 4BECY-5 . 0.03 . . 0.03 . 0.067 . . . . 0.067 . . . . . 4BECY-6r . 0.03 . . 0.03 . 0.067 . . . . 0.067 . . . . . 4BECY-8r . 0.03 . . 0.03 . 0.067 . . . . 0.067 . . . . . 4BECY-10 . 0.03 . . 0.03 . 0.067 . . . . 0.067 . . . . . 4BECY-11 . 0.03 . . 0.03 . 0.067 . . . . 0.067 . . . . . 4BECY-12 . 0.03 . . 0.03 . 0.067 . . . . 0.067 . . . . . 4BECY-13 . . 0.03 . 0.03 . 0.067 . . . . 0.067 . . . . . 4BECY-14 . 0.03 . 0.03 . 0.067 . . . . 0.067 . . . . . 4
# of Samples
Table 15Year 2 Data Summary - Mercury (Total)
Station

Jun-08 Aug-08 Aug-08 Aug-08 Sep-08 Oct-08 Dec-08 Dec-08 Jan-09 Jan-09 Feb-09 Mar-09 Mar-09 Apr-09 Apr-09 Apr-09 May-09 May-096/29/2008 8/8/2008 8/13/2008 8/21/2008 9/12/2008 10/9/2008 12/1/2008 12/12/2008 1/13/2009 1/19/2009 2/19/2009 3/2/2009 3/17/2009 4/1/2009 4/6/2009 4/14/2009 5/6/2009 5/18/2009
BECY-1a Comp 10 . . . . 1.00 . . 1.39 . . . 1.00 . . . . . 4BECY-1a Grab 1 . . . . 1.00 . . 1.21 . . . 1.00 . . . . . 4BECY-4a Comp . . 1.00 . 1.00 . . 1.00 . . . . . . . . . . 3BECY-4a Grab . . 1.02 . 1.00 . . 1.00 . . . . . . . . . . 3BECY-7ra Comp 1 . . . . 1.00 . 1.19 . . . 1.05 . . . . . . 4BECY-7ra Grab 1 . . . . 1.00 . 1.20 . . . 1 . . . . . . 4BECY-9ra Comp 1.66 . . . 1.00 . . 1.00 . . . . . 5.37 . . . . 4BECY-9ra Grab 1.07 . . . 1.00 . . 2.23 . . . . . 4.32 . . . . 4BMPep - IN COMP . 1.00 . . . 1.00 1 . . . . . . 3.80 . . . . 4BMPep - IN GRAB . 1.00 . . . 1.00 1 . . . . . . 4.09 . . . . 4BMPep - OUT COMP . 1.00 . . . 1.00 7.33 1.00 . . . 1 . . . . . . 5BMPep - OUT GRAB . 1.00 . . . 1.00 1.04 1.00 . . . 1 . . . . . . 5SOUTHSIDE Comp . . . . . . . . . . . . . 4.14 . . . . 1SOUTHSIDE Grab . . . . . . . . . . . . . 5.09 . . . . 1BECY-1 . 5.00 . . 1.00 . 1 . . . . 1 . . . . . . 4BECY-2 . 5.00 . . 1.00 . 1 . . . . 1 . . . . . . 4BECY-3 . 5.00 . . 1.00 . 1.73 . . . . 1 . . . . . . 4BECY-4 . 5.00 . . . 1.00 12.8 . . . . 2.13 . . . . . . 4BECY-5 . 5.00 . . 1.00 . 10 . . . . 2.05 . . . . . . 4BECY-6r . 1.00 . . 1.00 . 1 . . . . 1.16 . . . . . . 4BECY-8r . 1.00 . . 1.00 . 1.00 . . . . 1 . . . . . . 4BECY-10 . 1.41 . . 1.00 . 1.00 . . . . 1 . . . . . . 4BECY-11 . 1.00 . . 1.00 . 2.08 . . . . 2.29 . . . . . . 4BECY-12 . 1.00 . . 1.56 . 1.06 . . . . 1.14 . . . . . . 4BECY-13 . . 2.75 . 1.00 . 1.00 . . . . 1.04 . . . . . . 4BECY-14 . 5.00 . 1.00 . 10.00 . . . . 2.08 . . . . . . 4
# of Samples
Table 16Year 2 Data Summary - Nickel (Total)
Station

Jun-08 Aug-08 Aug-08 Aug-08 Sep-08 Oct-08 Dec-08 Dec-08 Jan-09 Jan-09 Feb-09 Mar-09 Mar-09 Apr-09 Apr-09 Apr-09 May-09 May-096/29/2008 8/8/2008 8/13/2008 8/21/2008 9/12/2008 10/9/2008 12/1/2008 12/12/2008 1/13/2009 1/19/2009 2/19/2009 3/2/2009 3/17/2009 4/1/2009 4/6/2009 4/14/2009 5/6/2009 5/18/2009
BECY-1a Comp 0.434 . . 0.12 . 0.31 . . 0.05 . 0.114 . 0.01 0.01 . 0.01 0.155 0.012 10BECY-1a Grab 0.631 . . 0.19 . 0.193 . . 0.05 . 0.137 . 0.01 0.01 . 0.01 0.106 0.01 10BECY-4a Comp . . 0.01 0.22 0.0839 . . 0.05 0.317 . 0.06 . . . . . . . 6BECY-4a Grab . . 0.01 0.24 0.0353 . . 0.05 0.314 . 0.201 . . . . . . . 6BECY-7ra Comp 0.05 . . 0.05 . 0.0675 . 0.05 0.05 . 0.12 0.151 0.0835 0.0176 0.213 0.0281 0.166 . 12BECY-7ra Grab 0.102 . . 0.05 . 0.059 . 0.05 0.05 . 0.132 0.178 0.056 0.01 0.209 0.063 0.205 . 12BECY-9ra Comp 0.103 . . 0.05 0.0283 0.259 . 0.05 0.0705 . 0.05 . . 0.82 . 0.0602 0.555 0.0179 11BECY-9ra Grab 0.0504 . . 0.05 0.01 0.665 . 0.05 0.071 . 0.05 . . 0.85 . 0.0573 0.735 0.026 11BMPep - IN COMP . 0.07 . 0.24 . 0.101 0.05 . 0.025 . 0.207 0.01 . 7BMPep - IN GRAB . 0.07 . 0.25 . 0.071 0.05 . 0.0285 . 0.157 0.01 . 7BMPep - OUT COMP . 0.33 . 0.18 . 0.16 0.05 0.05 0.05 0.26 . . 0.01 0.01 0.199 . 10BMPep - OUT GRAB . 0.33 . 0.38 . 0.165 0.052 0.05 0.071 0.293 . . 0.01 0.01 0.205 . 10SOUTHSIDE Comp . . . . . . . . . . 0.187 . . 0.01 . 0.01 0.157 0.0224 5SOUTHSIDE Grab . . . . . . . . . . 0.212 . 0.01 0.01 . 0.01 0.157 0.0204 6BECY-1 . 0.06 0.01 . 0.01 0.0875 0.05 . 0.05 0.05 0.05 0.05 0.01 0.01 0.01 . . . 12BECY-2 . 0.02 0.01 . 0.01 0.115 0.05 . 0.05 0.05 0.05 0.05 0.01 0.01 0.01 . . . 12BECY-3 . 0.06 0.01 . 0.01 0.05 0.05 . 0.05 0.05 . 0.05 0.01 0.0116 0.01 . . 0.01 12BECY-4 . 0.02 0.01 . . 0.076 0.05 . . 0.05 . 0.05 0.01 0.01 0.01 . . 0.01 10BECY-5 . 0.02 0.01 . 0.01 0.0805 0.05 . 0.05 0.05 . 0.05 0.01 0.01 0.01 . . 0.01 12BECY-6r . 0.18 0.01 . 0.0448 0.073 0.168 . 0.05 0.05 . 0.439 0.0336 0.0469 0.283 . . 0.158 12BECY-8r . 0.03 0.01 . 0.01 0.05 0.05 . 0.305 0.05 . 0.0535 0.0346 0.0216 0.01 . . 0.0107 12BECY-10 . 0.03 0.05 . 0.01 0.259 0.05 . 0.068 0.0925 . 0.05 0.0125 0.01 0.01 . . 0.01 12BECY-11 . 0.02 . . 0.01 0.05 0.225 . 0.073 0.0875 . 0.05 0.01 0.05 0.05 . . 0.0105 11BECY-12 . 0.06 0.05 . 0.0223 0.05 0.05 . 0.05 0.0515 . 0.05 0.01 0.05 0.1 . . 0.0208 12BECY-13 . . 1.6 . 0.995 1.16 0.865 . 1.29 1.4 1.17 0.975 1.27 1.26 0.65 . . 0.264 12BECY-14 . 0.02 0.01 . 0.01 0.05 0.05 . 0.05 0.05 . 0.05 0.01 0.01 0.01 . . 0.01 12
# of Samples
Table 17Year 2 Data Summary - Nitrate-Nitrite (NOX)
Station

Jun-08 Aug-08 Aug-08 Aug-08 Sep-08 Oct-08 Dec-08 Dec-08 Jan-09 Jan-09 Feb-09 Mar-09 Mar-09 Apr-09 Apr-09 Apr-09 May-09 May-096/29/2008 8/8/2008 8/13/2008 8/21/2008 9/12/2008 10/9/2008 12/1/2008 12/12/2008 1/13/2009 1/19/2009 2/19/2009 3/2/2009 3/17/2009 4/1/2009 4/6/2009 4/14/2009 5/6/2009 5/18/2009
BECY-1a Comp . . . . . . . . . . . . . . . . . . .BECY-1a Grab . . . 6.80 . . . . 7.74 . 8.40 . 7.03 6.89 . 6.90 6.66 7.10 8BECY-4a Comp . . . . . . . . . . . . . . . . . . .BECY-4a Grab . . 22.20 7.60 7.00 . . 6.50 9.37 . 6.90 . . . . . . . 6BECY-7ra Comp . . . . . . . . . . . . . . . . . . .BECY-7ra Grab . . . 7.40 . . . 7.60 6.44 . 7.00 6.78 6.95 6.93 7.45 6.78 7.70 . 10BECY-9ra Comp . . . . . . . . . . . . . . . . . . .BECY-9ra Grab . . 7.40 7.00 . . 6.75 7.00 . 6.90 . . 6.99 . 6.83 7.04 6.80 9BMPep - IN COMP . . . . . . . . . . . . . . . . . . .BMPep - IN GRAB . 9.68 . 7.50 . . 8.49 . . . . . . 8.17 . 6.59 6.04 . 6BMPep - OUT COMP . . . . . . . . . . . . . . . . . . .BMPep - OUT GRAB . 9.18 . 7.70 . . 8.06 6.93 . . 6.70 8.64 . 8.58 6.90 7.01 . 9SOUTHSIDE Comp . . . . . . . . . . . . . . . . . . .SOUTHSIDE Grab . . . . . . . . . . 7.50 . 6.80 7.12 . 6.00 6.68 7.30 6BECY-1 . 7.6 10.21 . 7.6 . 7.53 . 7.91 8.9 7.5 8.63 8.45 8.02 8.02 . . . 11BECY-2 . 7.9 12.7 . 7.7 . 7.81 . 7.76 8.1 7.1 7.57 7.97 7.48 8 . . . 11BECY-3 . 8.35 10.7 . 7.4 . 8.44 . 7.78 8.2 . 8.4 7.59 8.15 7.91 . . 8.17 11BECY-4 . 7.94 10.34 . . . 7.59 . . 7.7 . 7.36 7.47 7.87 7.69 . . 6.8 9BECY-5 . 7.84 8.61 . 7.2 . 7.52 . 7.68 7.2 . 7.2 7.07 7.74 6.75 . . 6.13 11BECY-6r . 7.83 7.52 . 6.7 . 6.54 . 6.15 6.9 . 6.76 7.29 6.98 7.54 . . 7.76 11BECY-8r . 7.75 8.04 . 6.7 . 6.62 . 7.16 6.2 . 6.82 6.61 7.04 7.01 . . 6.9 11BECY-10 . 8.37 8.86 . 6.8 . 6.69 . 9.43 6.3 . 6.82 6.94 6.88 7.63 . . 6.8 11BECY-11 . 9.15 . . 7 . 7.1 . 8.93 6.5 . 6.71 6.93 7.01 6.47 . . 6.95 10BECY-12 . 7.82 6.63 . 6.9 . 6.91 . 9.07 6.9 . 7.2 6.95 6.7 6.84 . . 7.5 11BECY-13 . . 7.18 . 6.3 . 5.74 . 7.46 6.9 6.8 6.43 7.52 7.2 6.53 . . 6.9 11BECY-14 . 7.35 6.96 . 6.4 . 6.78 . 6.04 6.7 . 6.59 7.05 6.62 6.55 . . 6.1 11
* pH is internally tracked for Critical Exceedance Concentration information
# of Samples
Table 18Year 2 Data Summary - pH*
Station

Jun-08 Aug-08 Aug-08 Aug-08 Sep-08 Oct-08 Dec-08 Dec-08 Jan-09 Jan-09 Feb-09 Mar-09 Mar-09 Apr-09 Apr-09 Apr-09 May-09 May-096/29/2008 8/8/2008 8/13/2008 8/21/2008 9/12/2008 10/9/2008 12/1/2008 12/12/2008 1/13/2009 1/19/2009 2/19/2009 3/2/2009 3/17/2009 4/1/2009 4/6/2009 4/14/2009 5/6/2009 5/18/2009
BECY-1a Comp 0.261 . . 0.15 . 0.359 . . 0.224 . 0.418 . 0.393 0.258 . 0.174 0.128 0.163 10BECY-1a Grab 0.297 . . 0.20 . 0.245 . . 0.286 . 0.3 . 0.385 0.19 . 0.142 0.158 0.2 10BECY-4a Comp . . 0.09 0.15 0.194 . . 0.072 0.238 . 0.046 . . . . . . . 6BECY-4a Grab . . 0.12 0.09 0.188 . . 0.365 0.073 . 0.05 . . . . . . . 6BECY-7ra Comp 0.216 . . 0.14 . 0.311 . 0.379 0.104 . 0.223 0.123 0.201 0.116 0.107 0.166 0.37 12BECY-7ra Grab 0.235 . . 0.25 . 0.343 . 0.245 0.109 . 0.214 0.238 0.106 0.116 0.11 0.135 0.447 12BECY-9ra Comp 0.512 . . 0.33 0.226 0.378 . 0.812 0.901 . 0.104 . . 0.235 . 0.389 0.358 0.159 11BECY-9ra Grab 0.125 . . 0.34 0.155 0.517 . 1.53 0.522 . 0.2 . . 0.636 . 0.293 0.342 0.153 11BMPep - IN COMP . 0.08 . 0.21 . 0.15 0.193 . . . . . . 0.223 . 0.656 0.301 . 7BMPep - IN GRAB . 0.09 . 0.22 . 0.19 0.186 . . . . . . 0.2 . 0.187 0.296 . 7BMPep - OUT COMP . 0.23 . 0.18 . 0.155 0.198 0.218 . . 0.183 0.195 . . 0.205 0.191 0.343 . 10BMPep - OUT GRAB . 0.37 . 0.23 . 0.182 0.226 0.189 . . 0.223 0.23 . . 0.203 5.35 0.151 . 10SOUTHSIDE Comp . . . . . . . . . . 0.773 . . 0.603 . 1.21 1.17 0.362 5SOUTHSIDE Grab . . . . . . . . . . 0.105 . 1.48 1.52 . 0.928 1.09 1.1 6BECY-1 . 0.34 0.37 . 0.2 0.494 0.145 . 0.207 0.132 0.243 0.073 0.149 0.171 0.11 . . . 12BECY-2 . 0.18 0.57 . 0.345 0.206 0.208 . 0.165 0.21 0.333 0.155 0.135 0.19 0.194 . . . 12BECY-3 . 0.15 0.29 . 0.192 0.311 0.151 . 0.094 0.118 . 0.132 0.12 0.13 0.148 . . 0.122 12BECY-4 . 0.13 0.11 . . 0.157 0.122 . . 0.0848 . 0.078 0.118 0.09 0.142 . . 0.146 10BECY-5 . 0.14 0.13 . 0.168 0.263 0.106 . 0.089 0.101 . 0.068 0.116 0.083 0.139 . . 0.256 12BECY-6r . 0.63 0.17 . 0.206 0.234 0.156 . 0.105 0.0857 . 0.081 0.11 0.24 0.106 . . 0.17 12BECY-8r . 0.34 0.25 . 0.273 0.195 0.244 . 0.152 0.2 . 0.117 0.201 0.14 0.364 . . 0.086 12BECY-10 . 0.36 0.31 . 0.173 0.196 0.324 . 0.106 0.227 . 0.18 0.143 0.163 0.169 . . 0.161 12BECY-11 . 0.15 . . 0.188 0.197 0.214 . 0.103 0.024 . 0.133 0.083 0.093 0.099 . . 0.142 11BECY-12 . 0.30 0.21 . 0.223 0.336 0.024 . 0.208 0.115 . 0.178 0.199 0.254 0.162 . . 0.127 12BECY-13 . . 2.37 . 0.168 0.218 0.101 . 0.051 0.024 0.043 0.042 0.067 0.035 0.051 . . 0.135 12BECY-14 . 0.19 0.14 . 0.2 0.198 0.185 . 0.089 0.13 . 0.144 0.123 0.1 0.128 . . 0.131 12
* Total Phosphorus is internally tracked for Critical Exceedance Concentration information
# of Samples
Table 19Year 2 Data Summary - Phosphorus* (Total)
Station

Jun-08 Aug-08 Aug-08 Aug-08 Sep-08 Oct-08 Dec-08 Dec-08 Jan-09 Jan-09 Feb-09 Mar-09 Mar-09 Apr-09 Apr-09 Apr-09 May-09 May-096/29/2008 8/8/2008 8/13/2008 8/21/2008 9/12/2008 10/9/2008 12/1/2008 12/12/2008 1/13/2009 1/19/2009 2/19/2009 3/2/2009 3/17/2009 4/1/2009 4/6/2009 4/14/2009 5/6/2009 5/18/2009
BECY-1a Comp 1 . . 3.6 . 11.8 . . 3.1 . 1 . 1.7 1.2 . 1 1 1 10BECY-1a Grab 1 . . 3.5 . 11.9 . . 2.2 . 1 . 1.6 1.2 . 1 1 1 10BECY-4a Comp . . 1 1.0 1 . . 1 1 . 1 . . . . . . . 6BECY-4a Grab . . 1 1.0 1 . . 1 1 . 1 . . . . . . . 6BECY-7ra Comp 1 . . 29.8 . 6.2 . 1.3 28.3 . 1 1 1 0.3 1 1 1 . 12BECY-7ra Grab 1 . . 29.8 . 6.5 . 1.5 12.1 . 1 1 1 1 1 1 1 . 12BECY-9ra Comp 1 . . 1.0 1 1 . 1 1 . 1 . . 1 . 1 1 1 11BECY-9ra Grab 1 . . 1.0 1 1 . 1 1 . 1 . . 1 . 1 1 1 11BMPep - IN COMP . 1 . 1.0 . 1 1 . . . . . . 1 . 1 1 . 7BMPep - IN GRAB . 1 . 1.0 . 1 1 . . . . . . 1 . 1 1 . 7BMPep - OUT COMP . 1 . 1.0 . 1 1 1 . . 1 1 . . 1 1 1 . 10BMPep - OUT GRAB . 1 . 1.0 . 1 1 1 . . 1 1 . . 1 1 1 . 10SOUTHSIDE Comp . . . . . . . . . . 1 . . 6.8 . 3.4 1 1 5SOUTHSIDE Grab . . . . . . . . . . 1 . 2.6 6.9 . 2.3 1 1 6BECY-1 . 21.5 8.7 . 1 8.3 1 . 2.5 1 1 1 1 1 1 . . . 12BECY-2 . 29.9 4.7 . 1 7.1 1 . 15.6 5.4 3.9 2.9 11.6 2.6 1 . . . 12BECY-3 . 14.5 7.8 . 18.5 1.9 1 . 29 2.3 . 1 10.8 2.3 1 . . 1 12BECY-4 . 33.6 32.7 . . 31.3 27.7 . . 30.3 . 27.7 30.8 19.6 12.9 . . 19.9 10BECY-5 . 33.2 28.5 . 27.2 22 29.9 . 32.2 30.8 . 30.7 31.2 31.4 15.8 . . 24.3 12BECY-6r . 1.0 1 . 1 1 1 . 1 1 . 1 1 1 1 . . 1 12BECY-8r . 1.0 1.0 . 1 1 1 . 1 1 . 1 1 1 1 . . 1 12BECY-10 . 1 1 . 1 1 1 . 1 1 . 1 1 1 1 . . 1 12BECY-11 . 1 . . 1 1 1 . 1 1 . 1 1 1 1 . . 1 11BECY-12 . 11.5 19.8 . 2.5 17.5 1 . 1 1 . 1 1 1 1 . . 1 12BECY-13 . . 1 . 1 1 1 . 1 1 1 1 1 1 1 . . 1 12BECY-14 . 33.2 33.5 . 27.7 21.4 18.8 . 28.2 21.5 . 11.6 19.1 22.3 7.4 . . 15.5 12
# of Samples
Table 20Year 2 Data Summary - Salinity
Station

Jun-08 Aug-08 Aug-08 Aug-08 Sep-08 Oct-08 Dec-08 Dec-08 Jan-09 Jan-09 Feb-09 Mar-09 Mar-09 Apr-09 Apr-09 Apr-09 May-09 May-096/29/2008 8/8/2008 8/13/2008 8/21/2008 9/12/2008 10/9/2008 12/1/2008 12/12/2008 1/13/2009 1/19/2009 2/19/2009 3/2/2009 3/17/2009 4/1/2009 4/6/2009 4/14/2009 5/6/2009 5/18/2009
BECY-1a Comp . . . . . . . . . . . . . . . . . . .BECY-1a Grab . . 25.8 . . . . . 10.4 . 16.5 . 18.5 18.1 . 20.4 23.4 15.9 8BECY-4a Comp . . . . . . . . . . . . . . . . . . .BECY-4a Grab . . 25.4 . 25.4 . . 12.9 11.4 . 14.6 . . . . . . . 5BECY-7ra Comp . . . . . . . . . . . . . . . . . .BECY-7ra Grab . . 25.4 . . . . 11.4 9.4 . 16.2 8.4 15.9 16.7 18.1 17.5 20.5 . 10BECY-9ra Comp . . . . . . . . . . . . . . . . . . .BECY-9ra Grab . . 26.0 . 24.7 . . 10.3 10.1 . 15.7 . . 16.8 . 17.7 20.6 16.8 9BMPep - IN COMP . . . . . . . . . . . . . . . . . . .BMPep - IN GRAB . 26.1 26.2 . . . 12.1 . . . . . . 18.9 . 18.6 20.9 . 6BMPep - OUT COMP . . . . . . . . . . . . . . . . . . .BMPep - OUT GRAB . 29.6 26.2 . . . 12.0 14.4 . . 15.2 7.2 . . 20.7 18.8 24.3 . 9SOUTHSIDE Comp . . . . . . . . . . . . . . . . . . .SOUTHSIDE Grab . . . . . . . . . . 16.2 . 17.0 17.4 . 18.2 21.2 15.7 6BECY-1 . 29.0 23.9 . 27.5 . 12.3 . 10.1 10.01 15.37 9.06 18.42 17.52 19.3 . . . 11BECY-2 . 30.2 24.1 . 30.0 . 13.1 . 11.2 12.07 16.92 11.3 18.65 20.11 20.2 . . . 11BECY-3 . 27.5 24.9 . 27.9 . 13.0 . 11.2 11.28 . 8.94 17.3 18.44 19.07 . . 17.96 11BECY-4 . 30.0 27.5 . . . 13.3 . . 9 . 12.49 18.75 19.33 20.6 . . 22.5 9BECY-5 . 30.2 26.3 . 28.4 . 13.0 . 11.9 11.24 . 11.12 18.04 19.15 20.57 . . 22.5 11BECY-6r . 25.2 24.3 . 25.0 . 12.9 . 11.2 9.53 . 8.73 15.97 16.85 18.06 . . 16.91 11BECY-8r . 26.9 27.0 . 26.0 . 12.7 . 11.7 9.78 . 10.53 17.37 18.72 19.15 . . 17.4 11BECY-10 . 25.3 24.1 . 25.3 . 12.8 . 9.4 7.99 . 9.26 15.59 16.26 18.11 . . 19.4 11BECY-11 . 24.7 . . 24.2 . 9.2 . 8.9 8.74 . 7.47 15.36 16.81 17.69 . . 16.6 10BECY-12 . 25.1 24.9 . 24.2 . 12.3 . 9.1 8.33 . 8.88 16.02 16.2 17.69 . . 17.14 11BECY-13 . . 24.3 . 24.1 . 16.0 . 15.2 15.89 15.92 14.4 16.76 17.35 18.4 . . 18.9 11BECY-14 . 28.4 27.0 . 28.0 . 13.1 . 11.3 9.37 . 10.27 16.43 18.5 19.42 . . 18.6 11
# of Samples
Table 21Year 2 Data Summary - Temperature
Station

Jun-08 Aug-08 Aug-08 Aug-08 Sep-08 Oct-08 Dec-08 Dec-08 Jan-09 Jan-09 Feb-09 Mar-09 Mar-09 Apr-09 Apr-09 Apr-09 May-09 May-096/29/2008 8/8/2008 8/13/2008 8/21/2008 9/12/2008 10/9/2008 12/1/2008 12/12/2008 1/13/2009 1/19/2009 2/19/2009 3/2/2009 3/17/2009 4/1/2009 4/6/2009 4/14/2009 5/6/2009 5/18/2009
BECY-1a Comp 0.299 . . 0.84 . 1.36 . . 2.34 . 1.42 . 1.45 1.41 . 0.892 0.979 0.447 10BECY-1a Grab 0.391 . . 1.46 . 0.603 . . 1.7 . 0.52 . 1.51 0.258 . 0.932 0.808 0.21 10BECY-4a Comp . . 0.33 0.57 0.358 . . 0.122 0.472 . 0.264 . . . . . . . 6BECY-4a Grab . . 0.46 0.55 0.879 . . 1.05 0.408 . 0.25 . . . . . . . 6BECY-7ra Comp 0.201 . . 0.06 . 0.22 . 0.896 0.283 . 0.662 0.032 0.805 0.512 0.656 0.916 1.49 . 12BECY-7ra Grab 0.78 . . 0.20 . 0.265 . 0.454 0.053 . 0.392 0.441 0.28 0.512 0.774 0.37 1.56 . 12BECY-9ra Comp 4.77 . . 0.86 0.487 0.645 . 1.03 1.17 . 0.283 . . 0.367 . 1.36 2.57 0.609 11BECY-9ra Grab 0.473 . . 0.75 0.223 3.12 . 2.68 0.952 . 0.636 . . 1.13 . 1.05 2.83 0.034 11BMPep - IN COMP . 0.34 . 1.21 . 0.095 1.04 . . . . . . 1.42 . 1.08 1.99 . 7BMPep - IN GRAB . 0.38 . 1.13 . 0.579 1.03 . . . . . . 1.09 . 1.29 2.23 . 7BMPep - OUT COMP . 1.71 . 1.03 . 0.768 0.838 0.9 . . 1.02 1.19 . . 0.902 0.201 2.12 . 10BMPep - OUT GRAB . 1.69 . 1.17 . 0.319 0.524 1.51 . . 1.33 1.15 . . 0.838 24.9 1.55 . 10SOUTHSIDE Comp . . . . . . . . . . 1.48 . . 0.215 . 2.21 1.33 0.099 5SOUTHSIDE Grab . . . . . . . . . . 2.39 . 0.622 1.21 . 2.5 1.34 1.75 6BECY-1 . 0.35 0.35 . 0.248 0.358 0.63 . 0.934 0.28 0.293 0.058 0.077 0.959 1.09 . . . 12BECY-2 . 0.03 0.77 . 0.665 0.211 0.58 . 0.41 0.48 0.095 0.499 0.029 0.268 0.659 . . . 12BECY-3 . 0.31 0.55 . 0.28 0.524 0.481 . 0.234 0.51 . 0.638 0.099 0.238 0.817 . . 0.875 12BECY-4 . 0.15 0.22 . . 0.291 0.346 . . 0.91 . 0.117 0.181 0.121 0.128 . . 0.435 10BECY-5 . 0.15 0.03 . 0.336 0.358 0.186 . 0.181 0.55 . 0.145 0.165 0.123 0.11 . . 0.626 12BECY-6r . 1.30 0.80 . 3.2 1.98 0.775 . 0.864 0.322 . 0.165 0.681 2.09 1.25 . . 1.02 12BECY-8r . 0.86 0.42 . 0.799 0.935 0.567 . 0.747 0.509 . 0.355 1.3 0.689 1.73 . . 0.312 12BECY-10 . 0.60 0.57 . 0.277 0.787 0.385 . 0.305 0.548 . 0.421 0.444 0.668 0.783 . . 0.639 12BECY-11 . 0.56 . . 0.341 0.469 0.145 . 0.434 0.409 . 0.029 0.194 0.457 0.839 . . 0.675 11BECY-12 . 1.70 0.39 . 0.497 0.688 0.453 . 0.417 0.442 . 0.619 0.627 0.907 0.61 . . 0.033 12BECY-13 . . 3.56 . 0.285 1.18 0.347 . 0.348 0.235 0.341 0.305 0.22 0.433 0.397 . . 0.7 12BECY-14 . 0.34 0.21 . 0.145 0.397 0.309 . 0.182 2.53 . 0.145 0.116 0.155 0.174 . . 0.033 12
* Total Kjeldahl Nitrogen is internally tracked for Critical Exceedance Concentration information
# of Samples
Table 22Year 2 Data Summary - Total Kjeldahl Nitrogen (TKN)
Station

Jun-08 Aug-08 Aug-08 Aug-08 Sep-08 Oct-08 Dec-08 Dec-08 Jan-09 Jan-09 Feb-09 Mar-09 Mar-09 Apr-09 Apr-09 Apr-09 May-09 May-096/29/2008 8/8/2008 8/13/2008 8/21/2008 9/12/2008 10/9/2008 12/1/2008 12/12/2008 1/13/2009 1/19/2009 2/19/2009 3/2/2009 3/17/2009 4/1/2009 4/6/2009 4/14/2009 5/6/2009 5/18/2009
BECY-1a Comp 5.11 . . . . 6.28 . . 19.3 . . . 29.5 . . . . . 4BECY-1a Grab 5.07 . . . . 5.81 . . 19.5 . . . 28.2 . . . . . 4BECY-4a Comp . . 9.92 . 7.44 . . 8.58 . . . . . . . . . . 3BECY-4a Grab . . 7.42 . 9.11 . . 7.77 . . . . . . . . . . 3BECY-7ra Comp 4.33 . . . . 14.3 . 16.6 . . . 11.6 . . . . . . 4BECY-7ra Grab 6.4 . . . . 14.3 . 16.7 . . . 10.3 . . . . . . 4BECY-9ra Comp 13.7 . . . 5.34 . . 8.81 . . . . . 7.71 . . . . 4BECY-9ra Grab 5.03 . . . 5.08 . . 18.3 . . . . . 7.36 . . . . 4BMPep - IN COMP . 5.52 . . . . 14.2 . . . . . . 29.1 . . . . 4BMPep - IN GRAB . 5.82 . . . . 15.2 . . . . . . 32.5 . . . . 4BMPep - OUT COMP . 11.4 . . . 14 14 12.9 . . . 12.8 . . . . . . 5BMPep - OUT GRAB . 11.6 . . . 12.7 13 14.2 . . . 13 . . . . . . 5SOUTHSIDE Comp . . . . . . . . . . . . . 4.67 . . . . 1SOUTHSIDE Grab . . . . . . . . . . . . . 4.61 . . . . 1BECY-1 . 3.59 . . 22.3 . 31.4 . . . 23 . . . . . . 4BECY-2 . 2.23 . . 13.4 . 18.7 . . . 6.8 . . . . . . 4BECY-3 . 3.56 . . 3.46 . 22.5 . . . 15.2 . . . . . . 4BECY-4 . 1.77 . . . 1.98 1.89 . . . 0.667 . . . . . . 4BECY-5 . 1.59 . . 1.7 . 1.62 . . . 0.683 . . . . . . 4BECY-6r . 24 . . 22.7 . 23.3 . . . 13.2 . . . . . . 4BECY-8r . 12.6 . . 7.82 . 10.5 . . . 11.4 . . . . . . 4BECY-10 . 12.4 . . 11.9 . 12.8 . . . 11.5 . . . . . . 4BECY-11 . 14.8 . . 11.8 . 9.4 . . . 6.47 . . . . . . 4BECY-12 . 14.3 . . 24.5 . 27.6 . . . 19.6 . . . . . . 4BECY-13 . . 25.3 . 6.2 . 14.7 . . . 6.12 . . . . . . 4BECY-14 . 2.81 . . 3.23 . 5.06 . . . 9 . . . . . . 4
# of Samples
Table 23Year 2 Data Summary - Total Organic Carbon (TOC)
Station

Jun-08 Aug-08 Aug-08 Aug-08 Sep-08 Oct-08 Dec-08 Dec-08 Jan-09 Jan-09 Feb-09 Mar-09 Mar-09 Apr-09 Apr-09 Apr-09 May-09 May-096/29/2008 8/8/2008 8/13/2008 8/21/2008 9/12/2008 10/9/2008 12/1/2008 12/12/2008 1/13/2009 1/19/2009 2/19/2009 3/2/2009 3/17/2009 4/1/2009 4/6/2009 4/14/2009 5/6/2009 5/18/2009
BECY-1a Comp 19.2 . . 21.9 . 24.6 . . 51.2 . 23.6 . 26.4 23.2 . 10.7 6.01 14.5 10BECY-1a Grab 7.6 . . 24 . 41.5 . . 17.3 . 61.8 . 33.8 23 . 9.02 7.41 11.6 10BECY-4a Comp . . 11.5 8.4 7.3 . . 80.9 141 . 9.17 . . . . . . . 6BECY-4a Grab . . 23.6 7 11.6 . . 51.2 52.5 . 45 . . . . . . . 6BECY-7ra Comp 14 . . 40 . 46.8 . 37.2 106 . 18.2 17.4 20 4.4 6.92 28.4 32.7 . 12BECY-7ra Grab 11.5 . . 31.4 . 33 . 49.3 26 . 24 15.2 10 6.8 6.83 21.2 30.5 . 12BECY-9ra Comp 18.6 . . 13 25.8 23.8 . 30.5 246 . 22.7 . . 18 . 45.2 36.3 99.3 11BECY-9ra Grab 3.3 . . 12.6 18 32.1 . 26 8.8 . 30.6 . . 55.5 . 46.1 35.3 44.2 11BMPep - IN COMP . 4.8 . 3.03 . 5.84 10 . . . . . . 6.4 . 32 29.8 . 7BMPep - IN GRAB . 3.1 . 2.5 . 4.6 9.84 . . . . . . 6.6 . 11.6 23.4 . 7BMPep - OUT COMP . 9 . 6.6 . 8.4 32.2 22.8 . . 17 12.7 . . 4.8 32 25.6 . 10BMPep - OUT GRAB . 9.4 . 6 . 9.4 13.3 13.6 . . 18.9 15.7 . . 3.15 25 8 . 10SOUTHSIDE Comp . . . . . . . . . . 75 . . 19.5 . 13 10.8 43.1 5SOUTHSIDE Grab . . . . . . . . . . 38.3 . 15 50.5 . 12.8 20.5 20.6 6BECY-1 . 45.8 205 . 34 73.3 14.2 . 15.2 8.88 34 15.2 13.8 16.8 13.5 . . . 12BECY-2 . 51.6 415 . 59.6 67.9 13.2 . 18.6 16.6 37.6 15.1 17.4 21.9 23.2 . . . 12BECY-3 . 41.9 388 . 47.4 460 14.6 . 24.4 30.6 . 45.6 33.6 43.4 25.7 . . 36 12BECY-4 . 31.6 74 . . 50.3 17.6 . . 12.3 . 28 19.8 19.4 35.9 . . 39.6 10BECY-5 . 34.6 101 . 33.2 83.6 25.7 . 12.9 31.2 . 20.9 36.5 22.7 43 . . 118 12BECY-6r . 10.4 7.4 . 22.7 112 6.33 . 18.8 10.8 . 24.8 19.7 23.3 11.7 . . 154 12BECY-8r . 8.4 30.4 . 22.4 20.2 14.2 . 19.4 13.6 . 13.8 23.2 12.1 3.8 . . 33.8 12BECY-10 . 15.7 6.4 . 34 6.97 16 . 3.6 7.13 . 14.4 12.7 8 6 . . 8.6 12BECY-11 . 6 . . 34 8 26.7 . 34 5.8 . 25.1 17 24.5 5 . . 52.5 11BECY-12 . 80.9 73.2 . 34 128 16.4 . 48.9 13.6 . 15.8 8.1 18.8 8.21 . . 35.7 12BECY-13 . . 155 . 34 32.3 14.4 . 2.7 7.13 4.46 12.8 2.8 15.8 1.9 . . 130 12BECY-14 . 50 70 . 34 187 27.4 . 26.4 20.2 . 29.6 34.9 44 31.9 . . 123 12
# of Samples
Table 24Year 2 Data Summary - Total Suspended Solids (TSS)
Station

Jun-08 Aug-08 Aug-08 Aug-08 Sep-08 Oct-08 Dec-08 Dec-08 Jan-09 Jan-09 Feb-09 Mar-09 Mar-09 Apr-09 Apr-09 Apr-09 May-09 May-096/29/2008 8/8/2008 8/13/2008 8/21/2008 9/12/2008 10/9/2008 12/1/2008 12/12/2008 1/13/2009 1/19/2009 2/19/2009 3/2/2009 3/17/2009 4/1/2009 4/6/2009 4/14/2009 5/6/2009 5/18/2009
BECY-1a Comp . . . . . . . . . . . . . . . . . . .BECY-1a Grab . . . 14.6 . 20.5 . . 4.8 . 14.7 . 13.2 10.5 . 18.2 16.2 14.3 9BECY-4a Comp . . . . . . . . . . . . . . . . . . .BECY-4a Grab . . 37.3 10.1 8.0 . 8.4 14.8 . 11.0 . . . . . . . 6BECY-7ra Comp . . . . . . . . . . . . . . . . . . .BECY-7ra Grab . . . 18.2 . 33.2 . 21.4 14.2 . 19.2 9.7 11.9 11.6 14.1 13.1 29.7 . 11BECY-9ra Comp . . . . . . . . . . . . . . . . . . .BECY-9ra Grab . . . 14.5 13.4 35.7 . 17.0 21.4 . 14.5 . . 14.5 . 33.5 24.6 24.2 10BMPep - IN COMP . . . . . . . . . . . . . . . . . . .BMPep - IN GRAB . 5.8 . 5.5 . 16.3 20.8 . . . . . . 14.3 . 15.4 21.7 . 7BMPep - OUT COMP . . . . . . . . . . . . . . . . . . .BMPep - OUT GRAB . 6.0 . 3.8 . 10.5 16.2 18.9 . . 11.2 11.9 . . 12.1 18.2 11.2 . 10SOUTHSIDE Comp . . . . . . . . . . . . . . . . . . .SOUTHSIDE Grab . . . . . . . . . . 13.2 . 19.8 19.7 . 8.9 19.2 21.3 6BECY-1 . 18.4 102.6 . 23.3 50.1 17.3 . 14.4 19.45 25.91 14.56 19.65 18.83 13.07 . . . 12BECY-2 . 16.5 133.5 . 28.2 30.7 18.7 . 1.8 13.91 19.8 4.82 14.84 11.64 14.71 . . . 12BECY-3 . 24.3 116.5 . 18.0 125.4 22.0 . 11.7 11.14 . 24.09 11.04 24.26 14.44 . . 24.74 12BECY-4 . 12.1 15.4 . . 25.4 17.4 . . 4.81 . 4.85 8.54 11.92 15.25 . . 18.4 10BECY-5 . 12.3 30.6 . 9.8 59.5 18.3 . 4.6 11.24 . 4.27 1.23 14.44 21.71 . . 29.4 12BECY-6r . 8.7 113.0 . 23.6 90.4 16.8 . 31.0 19.81 . 21.04 19.41 24.83 19.83 . . 31.3 12BECY-8r . 7.5 62.0 . 9.3 7.7 24.0 . 14.4 15.64 . 9.53 13.91 14.53 9.04 . . 21.11 12BECY-10 . 28.3 143.0 . 17.7 9.9 18.2 . 14.1 4.14 . 13.14 14.77 11.24 11.41 . . 14.14 12BECY-11 . 10.9 . . 18.6 12.0 31.3 . 11.0 4.41 . 19.97 21.91 24.22 8.01 . . 21.9 11BECY-12 . 55.0 30.4 . 34.5 44.2 24.4 . 21.1 19.71 . 14.67 11.74 11.28 9.59 . . 16.7 12BECY-13 . . 56.3 . 9.9 19.4 17.1 . 4.0 1.81 9.72 11.2 4.77 13.82 8.94 . . 11.41 12BECY-14 . 16.9 21.8 . 18.9 64.4 22.1 . 14.9 9.74 . 19.11 13.45 11.29 24.24 . . 31.71 12
# of Samples
Table 25Year 2 Data Summary - Turbidity
Station

Jun-08 Aug-08 Aug-08 Aug-08 Sep-08 Oct-08 Dec-08 Dec-08 Jan-09 Jan-09 Feb-09 Mar-09 Mar-09 Apr-09 Apr-09 Apr-09 May-09 May-096/29/2008 8/8/2008 8/13/2008 8/21/2008 9/12/2008 10/9/2008 12/1/2008 12/12/2008 1/13/2009 1/19/2009 2/19/2009 3/2/2009 3/17/2009 4/1/2009 4/6/2009 4/14/2009 5/6/2009 5/18/2009
BECY-1a Comp 20.3 . . . . 2 . . 3.74 . . . 15.8 . . . . . 4BECY-1a Grab 2.04 . . . . 2 . . 4.52 . . . 14.8 . . . . . 4BECY-4a Comp . . 21.3 . 19.5 . . 16.2 . . . . . . . . . . 3BECY-4a Grab . . 20.1 . 19.5 . . 11.2 . . . . . . . . . . 3BECY-7ra Comp 20 . . . . 10.1 . 7.38 . . . 8.73 . . . . . . 4BECY-7ra Grab 20 . . . . 13.8 . 10.8 . . . 8.37 . . . . . . 4BECY-9ra Comp 86.4 . . . 39.9 . . 14.7 . . . . . 40.1 . . . . 4BECY-9ra Grab 24.1 . . . 18.8 . . 10.3 . . . . . 19.7 . . . . 4BMPep - IN COMP . 7.75 . . . 6.65 6.3 . . . . . 16.8 . . . . 4BMPep - IN GRAB . 8.26 . . . 4.83 4.91 . . . . . 16.4 . . . . 4BMPep - OUT COMP . 7.93 . . . 14.9 6.05 3.37 . . . 4 . . . . . . 5BMPep - OUT GRAB . 6.02 . . . 5.51 5.63 8.87 . . . 4.04 . . . . . . 5SOUTHSIDE Comp . . . . . . . . . . . . . 75.5 . . . . 1SOUTHSIDE Grab . . . . . . . . . . . . . 75.7 . . . . 1BECY-1 . 10 . . 12.2 . 6.32 . . . . 4.13 . . . . . . 4BECY-2 . 10 . . 71.6 . 4.31 . . . . 2 . . . . . . 4BECY-3 . 10 . . 2 5.04 . . . . 4.63 . . . . . . 4BECY-4 . 10 . . . 10 20 . . . . 10 . . . . . . 4BECY-5 . 10 . . 2 . 20 . . . . 10 . . . . . . 4BECY-6r . 8.62 . . 19.9 . 10.6 . . . . 15.9 . . . . . . 4BECY-8r . 27.3 . . 35.5 . 21.3 . . . . 21.6 . . . . . . 4BECY-10 . 8.57 . . 17.4 . 13.7 . . . . 10.5 . . . . . . 4BECY-11 . 23.4 . . 17 . 12.5 . . . . 20 . . . . . . 4BECY-12 . 2 . . 42.5 . 15.5 . . . . 10.5 . . . . . . 4BECY-13 . . 59.2 . 12.6 . 6.27 . . . . 5.36 . . . . . . 4BECY-14 . 10 . . 2 . 20 . . . . 2 . . . . . . 4
# of Samples
Table 26Year 2 Data Summary - Zinc (Total)
Station

APPENDICES

Station Sample Date
Human - Bacteroidetes
Human - Enterococcus
Dog - Bacteroidetes
Deer - Enterococcus
Horse - Bacteroidetes
Hog - Bacteroidetes
Hog - Enterococcus
Bird - Bacteroidetes
Bird - Enterococcus
BECY-1 2/19/2009 Negative Negative Negative Negative Negative . . . .BECY-2 2/19/2009 Negative Detected Negative Negative Negative . . . .BECY-1 3/2/2009 Negative Negative Negative Negative Negative . . . .BECY-2 3/2/2009 Negative Detected Negative Negative Negative . . . .BECY-1 3/19/2009 . . . . . Negative Negative Negative NegativeBECY-1.5 3/19/2009 Negative Negative Negative Negative Negative Negative Negative Detected DetectedBECY-2 3/19/2009 Negative Negative Negative Negative Negative Negative Negative Negative DetectedROSE DHU 3/19/2009 Negative Negative . . . . . . .
Table A-1Bacterial Source Tracking Data Summary