bed coupling 1. introduction 2. sources of the idea boulton's experiments remote sensing 3....
TRANSCRIPT
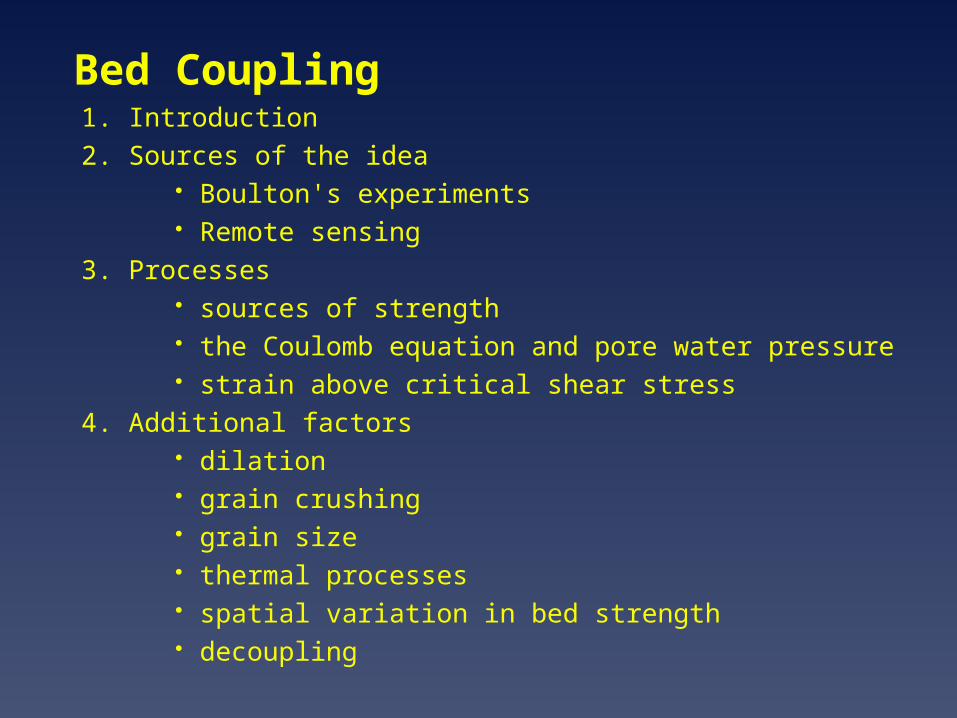
Bed Coupling1. Introduction
2. Sources of the idea Boulton's experiments Remote sensing
3. Processes sources of strength the Coulomb equation and pore water pressure strain above critical shear stress
4. Additional factors dilation grain crushing grain size thermal processes spatial variation in bed strength decoupling

References
Bennett, M.R. and Glasser, N.F. (1996) Glacial geology: ice sheets and landforms. Wiley, Chichester. Chapter 3

Introduction
The bed may not be the ice-substrate
An "effective“ bed
The idea:• Shear stress exerted by the ice may exceed the shear
strength of the sediment• Deformation penetrates the substrate to the depth at
which shear strength exceeds shear stress• Shear stress diminishes with increased particle to particle
contact• Pervasive deformation and forward movement sediment• aka Subsole deformation

USUF UD
A horizon
B horizon
Unfrozen sediment bed
Ice surface

Sources of ideas
Pleistocene geology of North America – what was the substrate?
Experiments conducted by G.S. Boulton on Breidamerkajokull an outlet glacier of Vatnajokull in Iceland
• Tunnels in the cliff to access the bed• Inserted segmented rods into the substrate• Excavated several days later and found that the rods
were displaced downstream


Sources of ideas (ctd.)
A two-tired till
Upper layer (A)• Porous, low density• Only 40-50% mineral grains• 0.5m thick
Lower layer (B)• Denser• Limited deformation• Brittle deformation
Displacement constituted 80-95% of forward motion of the glacier
• Pore water pressures• fluctuated on daily basis, probably linked to the
production of surface melt• high pressures = high strain rates• Slurry ejected from tunnel
Comment

Other experiments
Borehole dataTrapridge Glacier, Yukon (Blake et al.)Storglaciaren, Sweden (Iverson et al.)Revealed complex patterns of subsole deformationUp to69% motionLittle information on stress-strain relationships
Seismic dataUnfrozen till beneath the Antarctic ice sheet Ice stream B (Alley et al. 1986; Blankenship et al. 1987) Shear of a thin layer of basal till of motion 69% Englehardt et al. 1998
Other experiments
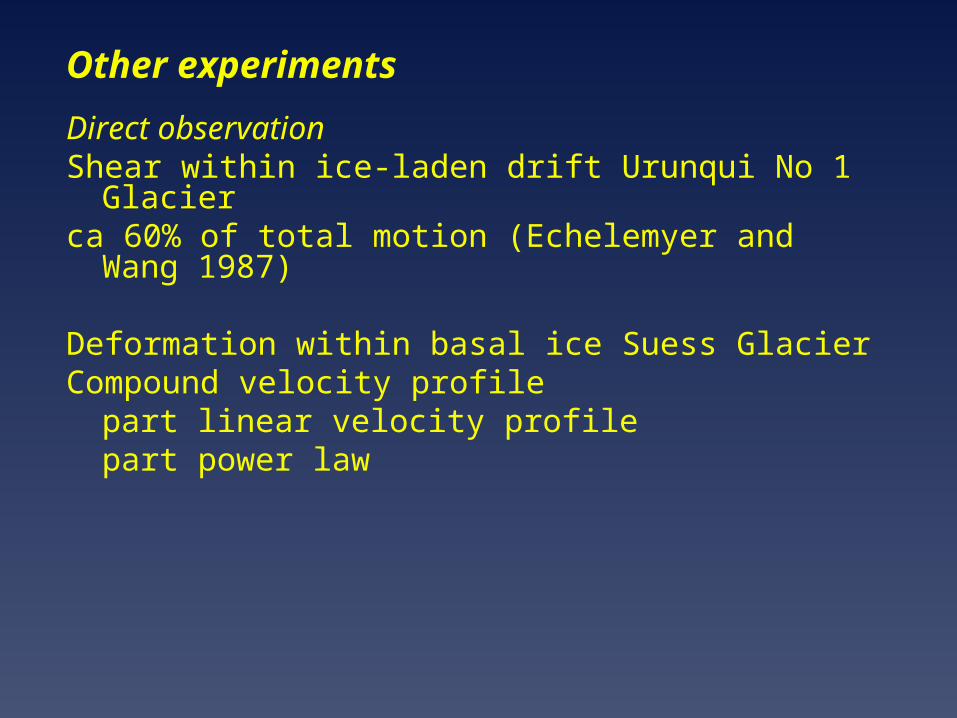
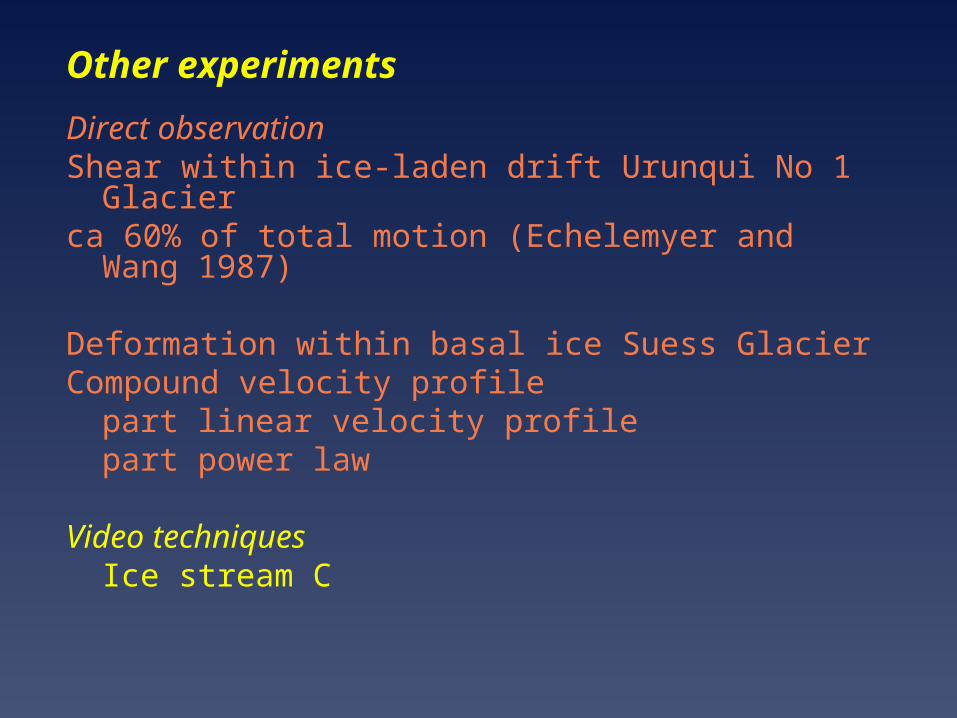
Direct observationShear within ice-laden drift Urunqui No 1 Glacierca 60% of total motion (Echelemyer and Wang 1987)
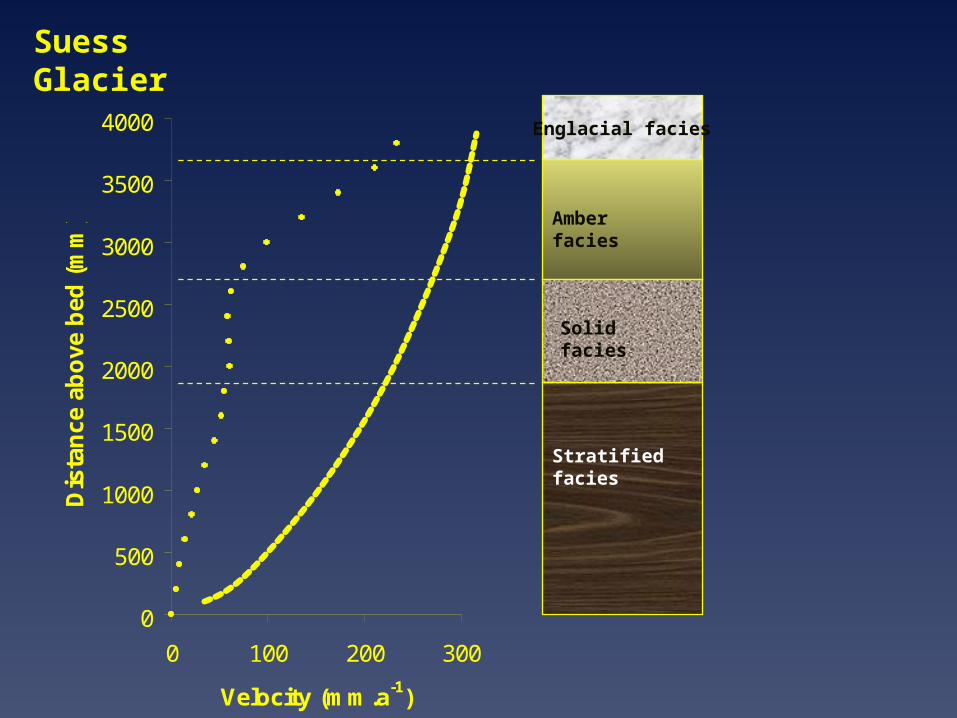
Deformation within basal ice Suess GlacierCompound velocity profile
part linear velocity profilepart power law
0
500
1000
1500
2000
2500
3000
3500
4000
0 100 200 300
Velocity (mm.a-1)
Dis
tan
ce a
bo
ve b
ed (
mm
)
Stratified facies
Englacial facies
Solid facies
Amber facies
Suess Glacier
Other experiments
Direct observationShear within ice-laden drift Urunqui No 1 Glacierca 60% of total motion (Echelemyer and Wang 1987)
Deformation within basal ice Suess GlacierCompound velocity profile
part linear velocity profilepart power law
Video techniquesIce stream C
Processes
From the field studies:• a lack of empirical data• no repetition of Boulton's experiment• influence on glacier morphology not agreed
(modelling)• no agreement on how widespread
Agreed:• no deformation occurs unless the yield stress or
critical shear stress of the material is exceeded

Critical shear stress
Minimum stress required to overcome the strength of material
= shear strength at the onset of movement
Sources of strength – cohesion and friction

Cohesion electrostatic forces between particles chemical bonds between grains negligible for particles >1mm

Frictional strength Resistance of grains to shearing and crushing Variables
Size Packing Sorting
Directly proportional to normal stress

Frictional strength Resistance of grains to shearing and crushing
Size Packing Sorting
Directly proportional to normal stress Represented by the tangent of the angle if the
normal and shear stresses are at right angles Coefficient of the angle of friction (tan ) Typical values vary between 7 and 50o

Typical cohesion values and friction angles for some geological materials Material Cohesion (kPa) Friction Angle (o) Dense sand (well sorted) 0 32-40
Dense sand (poorly sorted) 0 38-46
Gravel (well sorted) 0 34-37
Gravel (poorly sorted) 0 45-48
Bentonite clay 10-20 7-13
Soft glacial clay 30-70 27-32
Stiff glacial clay 70-150 30-32
Till (mixed grain size) 150-250 32-35
Soft sedimentary rock 1,000-20,000 25-35
Igneous rock 35,000-55,000 35-45
Source: Selby (1982)

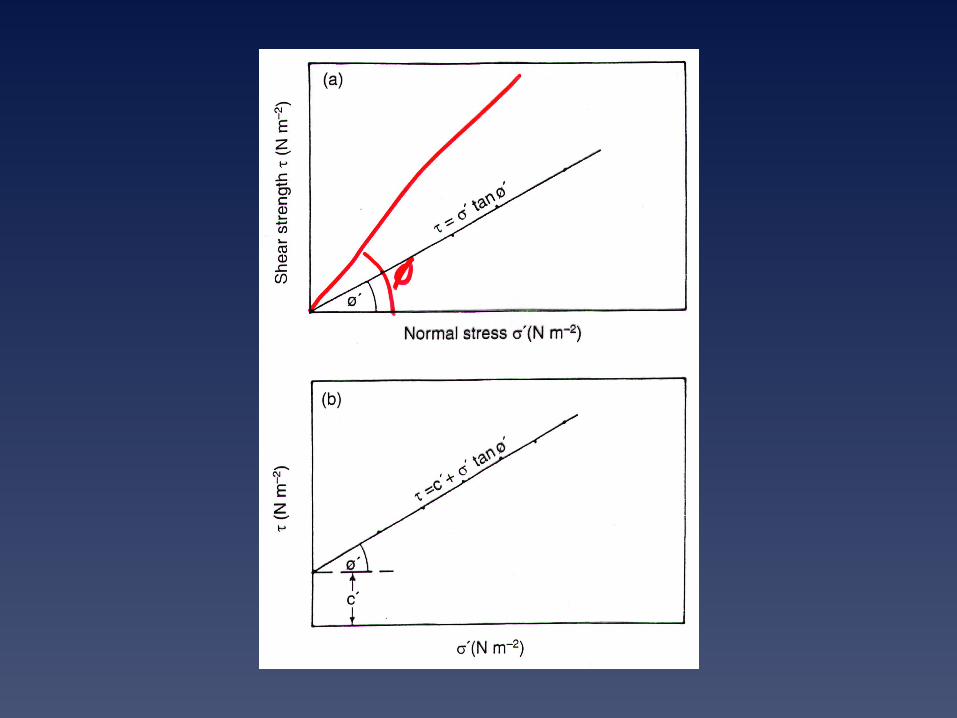
The coulomb equation and pore water pressure
s = c + tan
Frictional strength modulated by pore water pressure
At low water contents surface tension pulls the grains together thereby increasing frictional strength
At higher water contents part of the normal stress is transferred and borne by the pore water

=Pi - Pw
where
= effective pressure
Pi = ice overburden pressure
Pw = water pressure
eg saturated sand weaker than dry or damp sand
Incorporated into Coulomb equation:
s=c + (Pi - Pw) tan
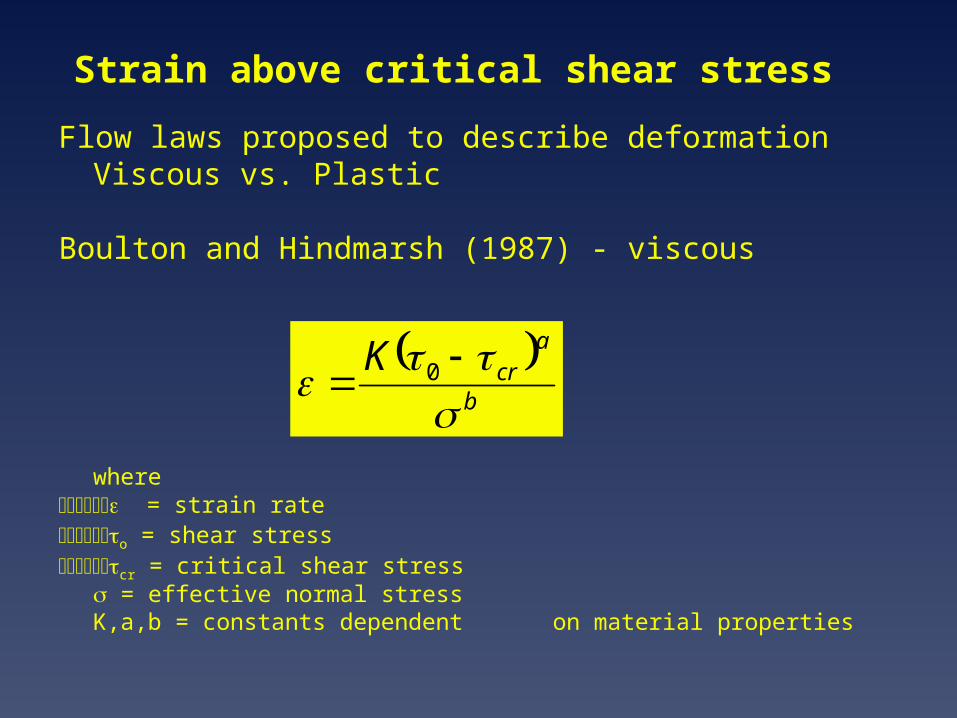
Strain above critical shear stress
Flow laws proposed to describe deformationViscous vs. Plastic
Boulton and Hindmarsh (1987) - viscous
where = strain rateo = shear stresscr = critical shear stress
= effective normal stressK,a,b = constants dependent on material properties
b
acrK
0

This "law" states that: the strain rate rises as shear stress becomes greater
than critical shear stress the strain rate increases as effective normal pressure
increases
In ice strain is independent of normal stress

How do the equations describe subsole deformation:
The deforming layer is confined to the upper part of the bed because the normal stress and the frictional strength increase in a downward direction
Therefore there will be a cross-over and deformation will cease at some depth
Therefore changes in pore water pressure could result in thinning and/or thickening of the deforming layer

Basal shear stress
Sediment shear strength
Stress
Depth
below
glacier
sole
Strain rate
A Horizon
B Horizon

Shear strain rates increase upwards where normal stress is at a minimum
Strain rates increase with pore water pressure due to the influence on effective normal stress and intergranular friction
Therefore inefficient drainage is conducive to high strain

There are, however, several additional factors that may be important:
Dilation Grain crushing Grain size Thermal processes Spatial variations in bed strength Decoupling of the bed

Dilation
Why the low density of the tills at Breidamerkurjokull?
Attributed to the dilation during shear
How?
It has been suggested that a critical shear is required to sustain dilation
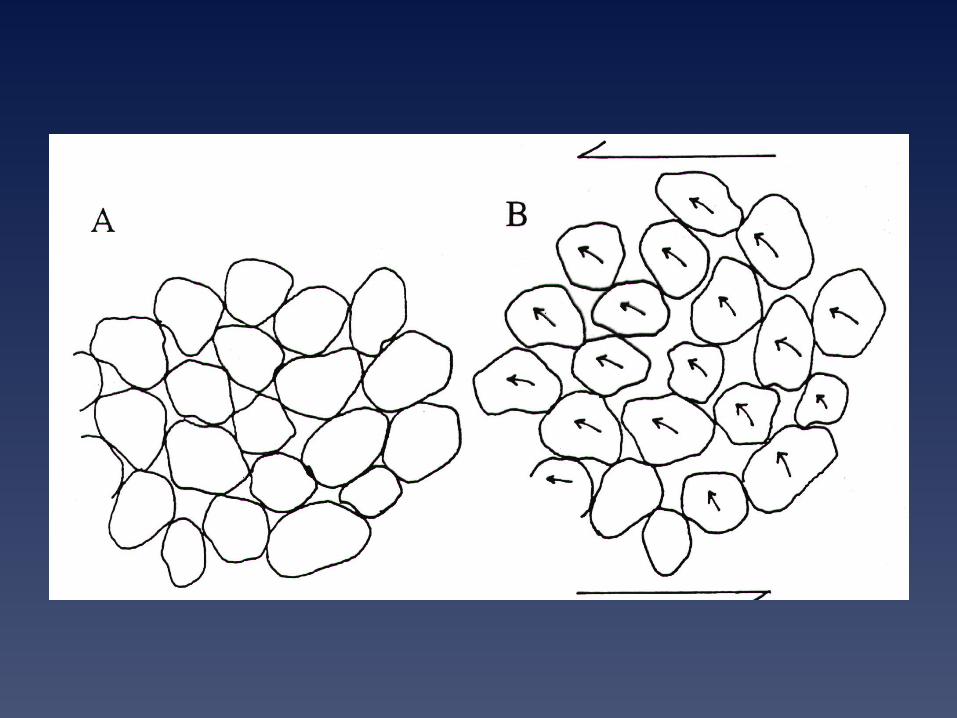
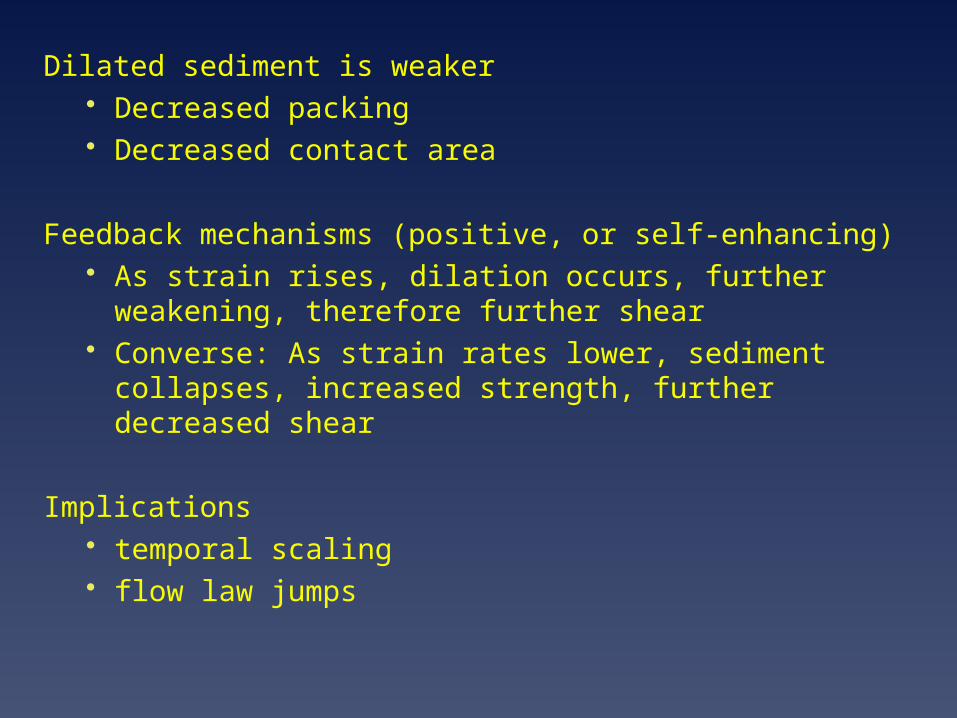
Dilated sediment is weaker Decreased packing Decreased contact area
Feedback mechanisms (positive, or self-enhancing) As strain rises, dilation occurs, further weakening,
therefore further shear Converse: As strain rates lower, sediment collapses,
increased strength, further decreased shear
Implications temporal scaling flow law jumps

Grain crushing
Shearing by crushing (Hooke and Iversen)
Only works if shear strength is greater than grain strength Stress concentrations?
Probably only important is strong, stiff, non dilatent material
Not likely when pore water pressures are high
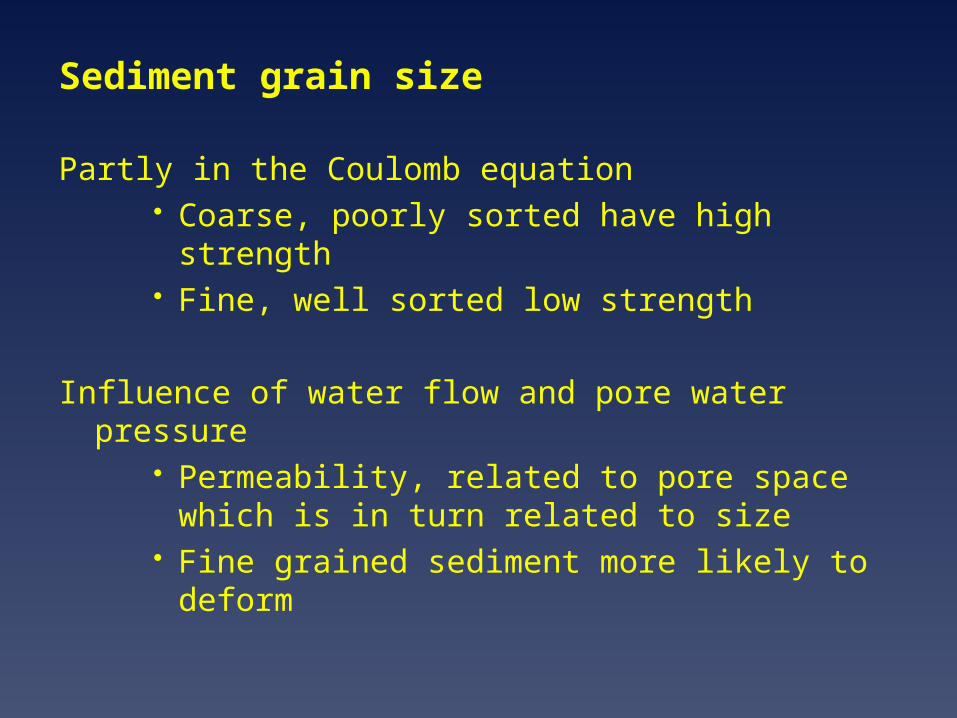
Sediment grain size
Partly in the Coulomb equation Coarse, poorly sorted have high strength Fine, well sorted low strength
Influence of water flow and pore water pressure Permeability, related to pore space which is in turn
related to size Fine grained sediment more likely to deform
Thermal processes
Cannot be considered separately from thermal processes considered previously
Expect a wide range of ice, debris and water mixtures
Therefore a wide variety of flow behavior
More later
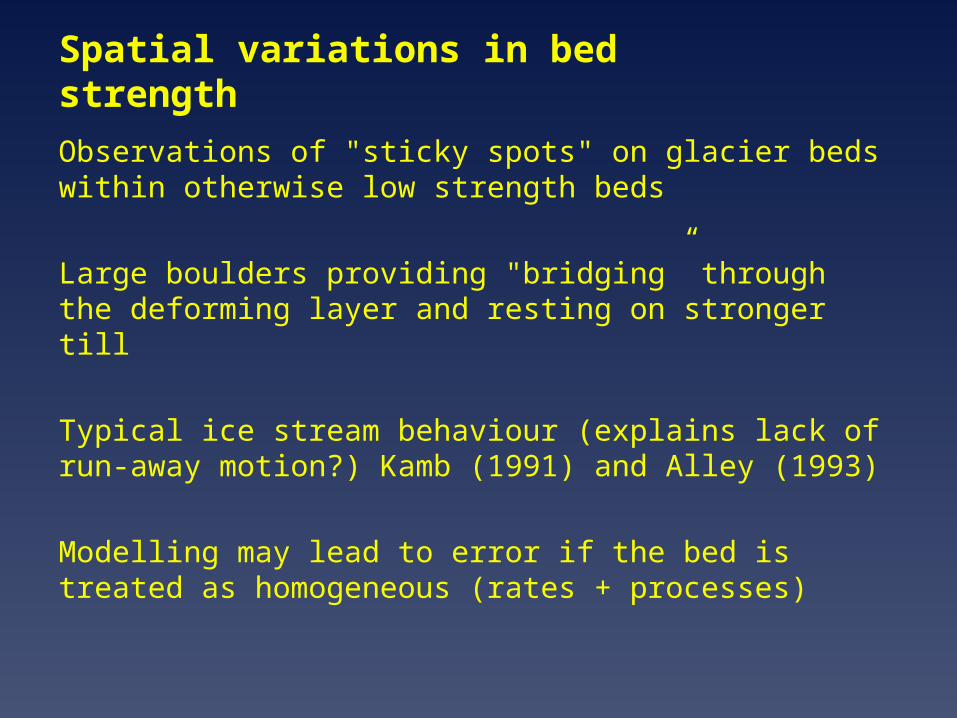
Spatial variations in bed strength
Observations of "sticky spots" on glacier beds within otherwise low strength beds
Large boulders providing "bridging” through the deforming layer and resting on stronger till
Typical ice stream behaviour (explains lack of run-away motion?) Kamb (1991) and Alley (1993)
Modelling may lead to error if the bed is treated as homogeneous (rates + processes)

Decoupling
Very high water pressures may lead to decreases in strain rates in bed materials
Self organisation of a distributed hydro system at the ice-till interface (if there is such an interface)
Canal networks postulated (Walder and Fowler 1994)

Decoupling
Canal networks postulated (Walder and Fowler 1994)
The model suggests that:
At low pore pressures high sed strength limits deformation ice will tend to infiltrate the bed coupling it to the glacier possible "ploughing" of the bed
At higher pore pressures sediment strength is reduced encouraging deformation
at a critical limit dilation is pervasive and flow occurs rising pore pressures reduce the tendency for ice to penetrate
the sediment and decoupling occurs

Decoupling
At very high pore pressures a distributed drainage system develops at the ice-sediment interface
Decoupling Sliding is very efficient May not change total glacier velocity


Basal thermodynamics: thermal control of glacial erosion and deposition
where
s = heat due to sliding
g = heat due to geothermal heating
Ki = thermal conductivity of ice
T/H = temperature gradient of basal ice
iH
TK igs
iH
TK igs
iH
TK igs
Three thermal conditions
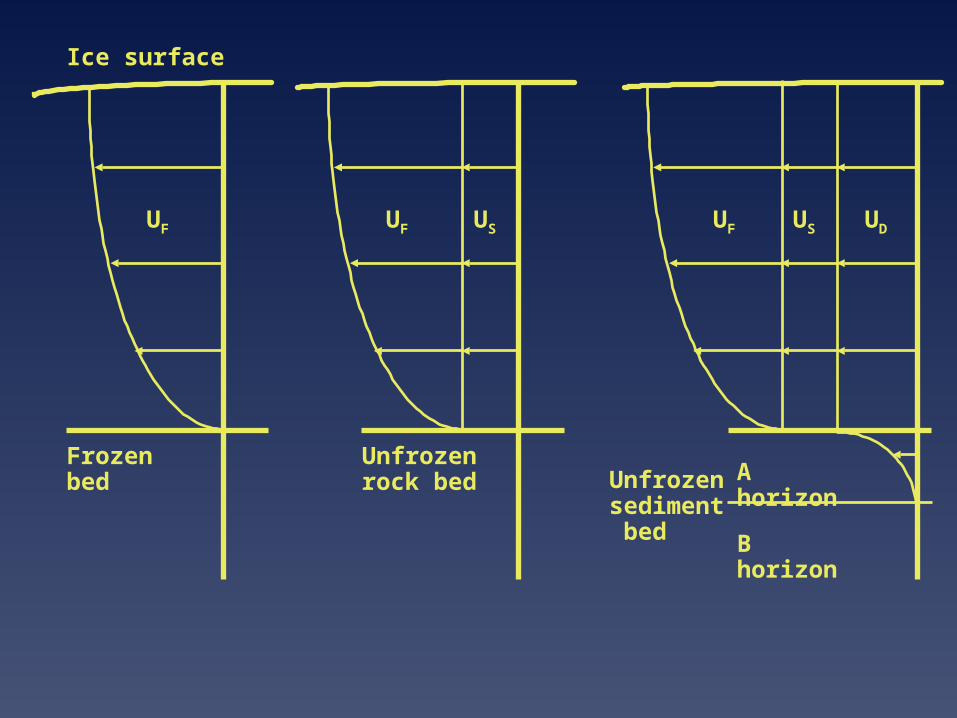
US
Unfrozen rock bed
UFUF
Frozen bed
Ice surface
USUF UD
A horizon
B horizon
Unfrozen sediment bed

Case 1: Temperature gradient is insufficient to drain away heat supplied to the basal debris zone. Melting and sliding results.
Case 2: Temperature gradient is just sufficient to conduct heat from the bed, an approximate balance between melting and freezing. Regelation takes place readily and sliding occurs.
Case 3: The temperature gradient is more than sufficient to conduct all the heat from the bed. Dry-based.