beef cattle marketing in north carolina · beef cattle marketing in north carolina ... describes...
TRANSCRIPT

1
BEEF CATTLE MARKETING IN NORTH CAROLINA
Geoff Benson1, Dale Miller2, and Richard Lichtenwalner2
Introduction Profitable management and marketing decisions require reliable information about cattle prices. For example, cattle can be marketed more profitably if a producer can take advantage of the observed seasonal price patterns or estimate potential sale prices by using the relationship of cattle prices in North Carolina to cattle futures prices. The value of cattle depends on specific characteristics, including weight, breed or color, sex, frame size and fleshiness. How the cattle are marketed can also result in price premiums. This publication describes alternative marketing channels, and presents and evaluates historic cattle price relationships, both for North Carolina markets and between North Carolina and national markets. This information can help guide production, purchasing and marketing decisions or strategies. For example, a producer can use this information to project the potential profit from buying stocker cattle for summer grazing. Larger producers and cattle buyers can use the relationship between local and national prices when using futures or options to hedge against changes in prices. Although this publication emphasizes marketing issues, marketing options for producers are more numerous if the entire production program has followed prescribed management practices. These practices include sound selection decisions to produce the kind of feeder cattle the buyers want, a restricted breeding/calving season to increase uniformity in calves, good forage management, and an appropriate herd health program. Assuming a producer has made reasonable efforts to incorporate these practices, several options are available for marketing his or her feeder cattle. Cattle Prices and Marketing Channels
The price a producer receives for his or her cattle is determined by several factors. The national supply and demand situation for meats, including beef, poultry and pork products, determines the general level of prices at retail and wholesale. Expectations about future wholesale meat prices, animal performance and cost of gain determine what a feedlot operator is willing to pay for feeder cattle. If cost of gain rises due to rising feed prices, feeder cattle prices will decline. Furthermore, prices paid for lighter feeder cattle will decline relative to heavier cattle because they are on feed for a longer period. The expected sale price for feeder cattle, in turn, affects the price stocker operators can afford to pay for weaned feeder calves. This price is also affected by the availability and cost of feed and the expected performance of the cattle. Because there is seasonal variation in calf births and pasture production, cattle prices have also shown a reasonably consistent seasonal price pattern historically.
Feedlot and stocker operators try to pencil out a profit based on their expected selling price for fat cattle and cost of gain when they figure out what to offer for the feeder cattle they buy. Cow-calf operators are last in line and see the strongest prices when cattle supplies are 1 Department of Agricultural and Resource Economics, North Carolina State University 2 Department of Animal Science, North Carolina State University

2
short, demand for beef is strong, and feed costs are low. Conversely, they receive very low prices when cattle are plentiful, demand for beef is weak and feed costs are high. Beef production is cyclical, with periods of higher production and lower prices followed by periods of lower production and higher prices. One cycle may last for a dozen years, measured from peak to peak. For any given market situation and outlook, cattle buyers will pay more for certain kinds of cattle based on their expected performance in stocker operations and feed lots.
The choice of marketing channel affects assembly and transportation costs and, therefore, the price cattle buyers can afford to pay. The following sections provide information on alternative marketing channels, premiums and discounts for specific cattle characteristics, seasonal price patterns, the relationship of North Carolina prices to cattle prices nationally, and the cattle cycle. Using this information in making business decisions is discussed. In the following discussion, the North Carolina auction price information is for feeder cattle sold at three markets, Asheville, Siler City and Smithfield from 1990-2001. These prices are reported in the Market News, published by the North Carolina Department of Agriculture & Consumer Services. The North Carolina Graded Sales price data are for feeder calves and stocker cattle sold at these sales from 1991-2001. The futures price data are for feeder cattle traded on the Chicago Mercantile Exchange.
Cattle producers can choose among several marketing channels. Each of these has different characteristics, may generate different price premiums or discounts, may require different production practices, and may have different marketing costs. Producers should weigh all of these factors when selecting the most appropriate marketing channel for their circumstances. Livestock Auctions. The first and most commonly used marketing channel is the weekly livestock auction. There are approximately 17 different facilities in North Carolina, which hold sales of this type. These auctions operate year round but the number of cattle sold tends to be higher in the fall months and again during late winter and early spring. Numbers at such auctions may increase substantially during emergency situations, such as summer droughts. These auctions provide the facilities to process, weigh and sell cattle and provide an important link in the cattle distribution system across the United States. These auctions assemble different types of cattle from many farms into more uniform lots that are more acceptable to buyers. Cattle sold at auctions include bulls, cull cows, and processed and unprocessed calves. The buyer's include commercial cattlemen, order buyers, packers and traders. Weekly auctions operate on a commission basis, and these generally range from two to four percent of the sale value of individual animals. The number of cattle sold through weekly auctions varies considerably between locations. This influences the number of prospective buyers which, in turn, may affect the prices paid for cattle at a particular market. A weekly report of numbers sold and prices paid for various classes of cattle at North Carolina auctions is available from the Market News Division of the N.C. Department of Agriculture and Consumer Services. Graded Sales. Graded sales typically sell feeder calves in the fall and stocker cattle in the spring. These sales are a cooperative effort by the N.C. Department of Agriculture, the N.C. Cattlemen’s Association, the N.C. Cooperative Extension Service and participating livestock markets. The purpose of graded sales is to group similar cattle into uniform lots, allowing buyers to minimize assembly and transportation costs, thus increasing their relative value. In these graded sales, cattle are sorted into uniform lots based on sex, weight, grade and breed. Feeder cattle grading standards developed by the USDA are used and cattle are assembled into lots with a maximum weight spread of 100 pounds. These sales have operated in North Carolina

3
since 1952. Cattle sold through these sales have consistently received sizable premiums over similar cattle sold through weekly auctions. Direct Sales. This type of sale is increasing in popularity. It is attractive to many cattle buyers because cattle are offered in truck-load lots of 48,000 to 50,000 pounds, which is the most cost-effective lot size for transportation. These cattle may come from a single large farm that has sufficient cow numbers to produce enough calves of similar type and size, or from a backgrounding operator who had purchased the cattle originally. Health risks for potential buyers can be reduced by co-mingling, sorting and vaccinating the cattle prior to sale. Cattle sold through direct sales are usually heavier than cattle sold through other channels, are accustomed to eating grain-based feeds from a feed bunk, and adapt quickly to a feedlot environment with less stress or weight loss. As a consequence, direct sale cattle typically command price premiums. A report from Kansas State University reported premiums as high as $12 /cwt. but anecdotal reports from North Carolina suggest smaller premiums, ranging from $2.00 to 6.00/cwt. over cattle sold through other marketing channels. Several forms of direct farm sales are available to producers with adequate cattle numbers. Tele-auction sales are held via conference telephone calls where sellers and buyers hold a private auction. Buyers base their decisions on a written description of each lot, developed by a reputable agent who has seen and evaluated the cattle. Video and satellite auctions incorporate video footage of each lot offered for sale, along with a written description developed by a qualified representative. Although premiums are not assured, these sales have the advantage of commanding larger audiences of potential buyers where other sale types may attract only a limited number of buyers.
Most feeder cattle sold direct from farms are weighed on the truck. This weight is normally reduced (shrunk) by two percent and the resulting weight is paid for at the agreed price. This weight adjustment is intended to account for gut fill in cattle from grass pastures. Most buyers will also request that cattle be penned and held off feed the morning of shipment. Shrinkage in transit is reduced under these conditions compared to shipping cattle soon after feeding. Under certain conditions, a shrink adjustment is not warranted. For example, cattle that must be penned in several locations and transported to central loading facilities will lose a considerable amount of gut fill and will be relatively empty at the time of weighing.
Cattle prices are quoted in dollars per 100 pounds but prices are affected by the weight
of the cattle. The price agreed upon at the farm based on a weight estimate may be adjusted up or down for differences between the estimate and the measured weight on the truck at loading. This adjustment is known as a “slide” and, depending on the price and weight of the cattle, may range from $2 to $8/cwt. The Value of Specific Characteristics of Cattle Feeder cattle prices are heavily influenced by weight per head, sex, breed, grade and condition. This is true regardless of the marketing channel used. The premiums or discounts associated with these various characteristics reflect differences in value further along the production pipeline that ends with the consumer. For example, buyers of feeder cattle try to estimate feedlot performance and the cost of gain on each set of cattle. The lower the expected cost of gain relative to the expected future sales price per hundredweight, the higher price buyers are willing to pay.

4
An analysis of the North Carolina Graded Sale data emphasizes the economic importance of several of these factors. Information was available on 163,000 head of feeder calves sold at the fall sales and 54,000 head of stocker cattle sold at the spring sales during the 1991-2001 period. Summaries of the graded sales are published annually. Summaries of the 1991-2001 sales are available in two publications from the Animal Science Department at North Carolina State University. They are "Average Prices for the North Carolina Fall Graded Feeder Calf Sales, 1991-2001", EAH-02-02, and "Average Prices for the North Carolina Spring Graded Stocker Sales, 1991-2001", EAH-02-01. Electronic versions are available from the Animal Science Department web site at: http://www.an-sci.ncsu.edu/ Price differences related to different cattle characteristics are shown in Table 1 for feeder calves and stockers sold in the graded sales during the 1991-2001 period. The price differences for cattle of different weights can be seen quite clearly. A useful base or reference point is 500-599 lb. M1 black steers because this is the most numerous and readily identifiable category. So, for example, in Table 1, 400-499 lb. Black M1 steers received an average of $3.71 per cwt. more than similar 500-599 lb. cattle and 600-699 lb. M1 steers fetched $3.54 per cwt. less.
The graded sale data also showed the relative value of steers and heifers. For example,
500-599 pound M1 feeder heifer calves sold at a $8.53/cwt. discount relative to steers of the same type. Stocker heifers of this weight sold at a $14.39 discount to steers, Table 1. Heifers sell at a discount to steers of the same description because of performance differences. Heifers gain at a slower rate than steers and fatten at lighter weights. Prospective buyers take account of these differences when bidding for cattle. The lighter the feeders, the more these performance differences affect returns and the greater the heifer discounts.
A third aspect of the Graded Sale data in Table 1 is the effect of frame size. For example, small framed 500-599 lb. steer feeder calves were discounted $10.84/cwt. compared to medium framed cattle of the same weight. However, large frame cattle of this weight sold at a small premium. For graded stocker cattle, the discount for small frame 500-599 lb. steers relative to medium frame cattle of the same weight was $16.50. Large frame stockers of this weight sold for prices that were almost identical to the medium frame ones. A $10.00\cwt. discount for frame size equates to $55.00/head in a 550-lb. calf; a difference that a profit minded producer cannot afford to overlook.
A fourth consideration is the muscling discount for feeder cattle of less than average thickness (USDA No. 2’s). These cattle were less numerous in the sales but 500-599 lb. steer feeder calves were discounted $6.38/cwt. compared to MI steers of the same weight. For stocker cattle, the comparable difference was $9.48/cwt. As was the case for frame size, producing and selling thin muscled feeder cattle can result in a significant reduction in income compared to producing average or better-muscled cattle.
Flesh and weighing conditions of feeder cattle are also important to a backgrounder or
feedlot operator. Within reasonable limits, decreasing amounts of flesh or body condition make feeder cattle progressively more attractive to cattle buyers. Cattle with less flesh often gain weight at a faster rate than fleshy cattle. Healthy, parasite free cattle grazing good quality pastures and supplemented with high protein and energy rations may gain weight rapidly and become over conditioned, or fleshy, creating buyer resistance. Small-framed cattle are especially prone to over-fleshing.

5
Table 1. North Carolina Graded Feeder Calf and Stocker Sales, Summary of AveragePrices Paid, 1991-2001.
Weight Feeder Calf Sale Stocker SaleClass Grade Steers Heifers Steers Heifers
lb. $/cwt. $/cwt. $/cwt. $/cwt.
300-399 L1 97.24 85.51 -- --400-499 88.75 78.05 99.28 79.19500-599 82.60 70.38 89.19 71.98600-699 74.32 65.86 79.01 68.54700-799 69.72 62.68 71.39 63.70800-999 62.88 55.27 67.75 59.36
300-399 M1 89.07 72.78 95.69 79.56400-499 84.36 72.40 92.50 77.20500-599 79.85 71.32 89.27 74.88600-699 76.62 68.89 78.67 66.87700-799 72.65 66.12 69.87 63.49800-999 68.39 59.88 65.33 58.83
300-399 S1 71.99 59.27 79.87 65.99400-499 71.07 59.30 76.13 63.64500-599 69.01 58.48 72.77 61.51600-699 66.28 57.80 66.72 59.02700-799 62.79 54.76 61.66 58.31800-999 62.69 54.00 56.89 51.89
300-399 LMS2 80.94 67.56 88.01 71.41400-499 77.39 66.12 83.30 71.38500-599 73.47 64.82 79.79 67.84600-699 70.17 62.44 72.82 62.59700-799 66.33 58.34 65.74 57.94800-999 -23.41 51.49 58.58 51.29
Breed, breed combination or color of feeder cattle has a substantial impact on price, as the North Carolina Graded Sale data in Tables 2 and 3 show. These data show Graded Sale price differences for feeder calves (Table 2) and stockers (Table 3), using the price for 500-599 pound Black M1 steers as the base. Black cattle typically sell at the top of any given feeder cattle market and they are the most numerous type of cattle sold. For a feeder calf example, Table 2, an exotic cross (i.e. a Continental and British breed cross) 500-599 lb. M1 steer feeder calves sold at a $5.77 per cwt. discount to blacks. Hereford cattle sold at a $9.82 per cwt. discount. Brahman and straight continental breeds of feeder cattle also sell at a significant discount. The observed discounts were smaller in the spring stocker sales, Table 3, with the exception of straight continental breeds. Price differences for heifers are shown in Appendix 1.

6
Table 2. North Carolina Graded Feeder Calf Sales, Price Differences Relative to 5-weight Black M1Steers, in $/cwt., 1991-2001
WeightClass,
Grade Black B&WFace
Hereford Exotic Brahman Other Holstein StraightCont.
lb. $/100 lb.300-399 L1 13.67400-499 9.28 14.94 6.19 4.26 4.62 1.49500-599 4.20 7.27 1.89 -1.93 -14.98 -2.73 -5.91600-699 -4.52 -4.04 -5.04 -9.44 -16.85 -7.79 -7.57700-799 -11.86 -12.60 -13.33 -19.73 -7.29 -12.01800-999 -21.08 -17.88 -21.08 -9.71
300-399 M1 7.89 8.66 2.83 4.97 -1.28 7.46400-499 3.71 4.27 -2.91 -0.29 -10.18 -2.58 -11.94500-599 0.00a -0.48 -9.82 -5.77 -13.58 -7.24 -12.09600-699 -3.54 -5.04 -11.63 -8.39 -11.81 -10.53 -11.69700-799 -7.61 -9.46 -11.88 -11.73 -17.96 -15.07 -15.55800-999 -13.11 -13.41 -14.81 -15.40 -17.99 -10.84
300-399 S1 -9.54 -8.37 -15.06 -13.71 -10.73 -12.40400-499 -10.76 -8.99 -16.75 -14.72 -21.59 -15.78500-599 -12.52 -12.00 -17.33 -17.56 -23.80 -24.12600-699 -15.63 -14.63 -15.46 -21.10 -19.06700-799 -19.26 -19.65 -19.60 -23.17800-999 -17.68 -20.29
300-399 LMS2 0.89 0.81 -7.96 -4.38 -8.50 -12.11400-499 -2.05 -3.46 -14.23 -7.92 -15.07 -13.45 -11.33500-599 -5.59 -8.82 -15.26 -12.56 -18.62 -13.33 -17.04600-699 -8.99 -12.90 -16.52 -15.81 -20.41 -15.23 -19.06 -21.40700-799 -13.30 -15.84 -21.27 -17.75 -23.08 -22.47 -22.80800-999 -23.41 -20.11 -22.44 -29.41 -26.48
a Base price

7
Table 3. North Carolina Graded Stocker Sales, Price Differences Relative to 5-weight Black M1 Steers, in$/cwt., 1991-2001
WeightClass
Grade Black B&WFace
Hereford Exotic Brahman Other Holstein StraightCont.
lb. $/100 lb.300-399 L1400-499 7.89500-599 2.37 -3.12600-699 -13.56 -11.45 -12.07700-799 -17.82 -20.93 -20.30800-999 -23.48 -24.06 -24.01
300-399 M1 5.49 5.98 3.03 1.43400-499 3.19 3.15 -3.70 -1.90 -7.73 -6.93500-599 0.00a 0.49 -2.69 -5.98 -7.49 -7.59 -13.57600-699 -11.68 -10.98 -13.66 -14.97 -22.17 -17.97 -21.84700-799 -21.15 -19.97 -19.87 -23.63 -25.95 -24.91 -28.75800-999 -25.35 -26.28 -26.40 -27.30 -26.08
300-399 S1 -11.64 -8.40 -24.12 -6.57400-499 -14.46 -13.79 -19.92 -17.96 -24.64500-599 -17.66 -16.95 -23.79 -22.73 -30.94600-699 -24.79 -22.51 -30.03 -26.49700-799 -29.39 -25.95 -29.87 -34.12800-999 -35.36 -34.24 -34.61
300-399 LMS2 0.62 -0.79 -8.29 -8.10 -7.61 -11.83 -12.06400-499 -5.28 -6.35 -14.61 -9.88 -12.43 -20.76 -17.49 -11.40500-599 -9.08 -9.71 -16.02 -13.50 -21.90 -26.28 -21.66 -17.53600-699 -16.54 -16.63 -20.38 -20.64 -26.70 -28.78 -22.06 -24.13700-799 -24.04 -23.41 -27.63 -27.36 -34.11 -34.06 -29.63800-999 -32.01 -32.45 -30.35 -33.95 -34.82
a Base price Seasonal Price Patterns
In any given year, the supply of feeder cattle fluctuates in a somewhat predictable pattern. Most calving is concentrated from fall to spring, thus most feeder cattle are weaned and sold the following fall as 8-10 month old feeders. The local demand for grass type cattle; cattle weighing less than 600 pounds, is generally greatest in the spring when grasses are most available. This is also a time when available supplies of feeder cattle are low. Consequently, feeder cattle prices typically peak in the spring when grass is available, demand for feeder cattle is high and supplies are low. Prices bottom out in the late fall when availability of grass is low and supplies of feeder cattle are abundant. This seasonal trend is somewhat predictable but not assured. Figure 1 shows average monthly prices for three weights of cattle at three North Carolina auction markets during the 1990-2001 period. Figure 2 expresses the seasonal pattern as the difference between the monthly price and the yearly average. Annual data and monthly data for each market and weight of cattle are provided in Appendix 2.

8
Figure 1. 12-Year Average Monthly Price for 3 North Carolina Markets, M1 Steers, $/100 lb., 1990-2001
60
65
70
75
80
85
90
95
100
Jan Feb Mar Apr May Jun Jul Aug Sep Oct Nov Dec
$ p
er c
wt.
400-500 lb.
500-599 lb.
600-799 lb.
Figure 2. Average Difference Between Monthly and Average Yearly Prices for 3 North Carolina Markets, M1 Steers, $/100 lb., 1990-2001
-8
-6
-4
-2
0
2
4
6
8
Jan Feb Mar Apr May Jun Jul Aug Sep Oct Nov Dec
$ p
er c
wt.
400-500 lb. 500-599 lb. 600-799 lb.
Factors affecting the overall beef market can be quite complex and price fluctuations are
often difficult to anticipate. Climatic conditions in other countries can influence grain prices and result in significant, unpredictable swings in cattle markets. Supplies and prices of competitive meats can also change unexpectedly and impact the beef market. However, seasonal price patterns for cattle tend to be somewhat predictable. Producers familiar with these patterns can

9
alter their production and marketing programs to take advantage of these patterns and substantially increase net returns to the beef enterprise. Conversely, failure to recognize these patterns and alter marketing plans may cause producers to receive low prices during peak marketing periods and these may be below their cost of production.
The 12-year average differences between the annual price for a specific weight of cattle and monthly prices for the same weight category are shown in the graph in Figure 2. The seasonal price drop from peak to trough was greatest for 4-weight cattle at over $10 per hundredweight. Cattle in the 500-599 lb. category dropped almost as much, $9 per hundredweight. The heaviest cattle showed the smallest drop at $6 per hundredweight. These long-term price changes can help summer grazers and winter backgrounders judge the price movements they are likely to see over the long haul. However, in any given year, the futures market price for feeder cattle provide useful information on likely price movements. For cow-calf producers these seasonal price movements help form decisions about marketing the calf crop. The price drop between August and September is quite sharp for lighter cattle. Typically, feeder calves are adding little value per head at this time of year because the weight they put on is at least partly offset by falling prices.
Price differences between cattle of different weights are shown in Figures 1 and 2. Typically, the differences are somewhat wider in the spring and narrower in the fall. More importantly, as cattle gain weight and move into the heavier categories the value per hundredweight falls. This is particularly true for stockers bought in the spring and sold in the fall, so it takes a low cost of gain if these cattle are to return a profit.
The price relationships shown in the graphs are long-term averages and these relationships do not hold every year; the size of both the seasonal price spread and the weight spread can widen or narrow. Nevertheless, these long-tem averages provide food-for-thought as producers make their production and marketing plans. The Cattle Cycle Because the consumption habits of today’s consumers are relatively stable, the supply of beef has a large effect on beef prices. When net returns to domestic cow/calf operations are relatively high, producers expand their herds and total cattle populations begin to rise. This increase in cattle numbers results in increased beef supplies, which eventually reduces retail beef prices. Resulting net returns to cow/calf producers recede and cattle numbers begin to decrease. Due to the relatively slow reproductive rate of cattle, these cycles usually range from 8 - 12 years in length. Numerous other factors such as grain prices, exports, weather, and government programs affect the cattle market, but usually lack the significance of cattle numbers on resulting beef supplies.
Figure 3 shows the cyclical nature of domestic cattle inventory. Over the last dozen years or so, we have experienced the ups-and-downs of the cattle cycle, seasonal fluctuations and the effects of extreme highs and lows in corn prices. These experiences can help guide producer decisions today.

10
The effects of the cattle cycle on North Carolina prices can be seen in the graph in
Figure 4, which shows the average price per hundredweight for steers sold at NC auction markets since 1990. Actual prices are given in Appendix 2. Recent prices for 4- and 5-weight cattle beat the previous highs back in 1991, but only by a small margin. Most producers won't need to be reminded of the slump in prices in 1996, when prices crashed under pressure from abundant meat supplies combined with extremely high corn prices. These past fluctuations remind us that high prices don't last long and producers need a business plan that will allow them to ride out the times when prices are weak.
Seasonal price fluctuations in the feeder cattle market can have a substantial impact on beef producers' financial returns. We can attribute these seasonal price swings to changes in available supplies and demand for feeder cattle at different times of the year and to the availability of pasture to graze cattle. Almost three-fourths of all calves born in the United States are born in the first quarter of each year, leading to a relatively large supply of feeder cattle in the fall. Impending winter weather and reduced forage availability dampens buyer interest, resulting in lower feeder cattle prices for all weights of cattle. This pattern certainly holds true for North Carolina. The graph in Figure 1 shows that prices for the lighter cattle were at their peak in February and bottomed out in October. Prices for heavier cattle held fairly steady from February through June, then declined.
F i g u r e 3 . U S C a t t l e I n v e n t o r y , 1 9 2 5 - 2 0 0 1
5 0
6 0
7 0
8 0
9 0
1 0 0
1 1 0
1 2 0
1 3 0
1 4 0
2 5 3 0 3 5 4 0 4 5 5 0 5 5 6 0 6 5 7 0 7 5 8 0 8 5 9 0 9 5 0 0
Y e a r
Mill
ion
Hea
d
.
S o u r c e : U S D A

11
Figure 4. Average Price for 3 North Carolina Markets, M1 Steers, $/100 lb., 1990-2001
0
10
20
30
40
50
60
70
80
90
100
110
1990 1991 1992 1993 1994 1995 1996 1997 1998 1999 2000 2001
$ p
er c
wt.
400-500 lb. 500-599 lb. 600-799 lb.
Cattle prices around the country tend to move together but there are regional differences in the price level. This is illustrated in Figure 5, which shows prices for North Carolina and Oklahoma, a major cattle producing state. Lower prices are seen in North Carolina because of the cost of transportation to the regions where the majority of feedlots are to be found, including Oklahoma. However, prices in the two states move up and down together. The historic price relationships between North Carolina auction prices and the prices of feeder cattle futures contracts can be used to anticipate future prices. This relationship is called the basis and it can be used by cattle producers and buyers to estimate market prices as part of the process of projecting the profitability and cash flow consequences of alternative management decisions. This in turn helps guide production, purchasing and marketing decisions or strategies. For example, a producer can use this information to project the potential profit from buying stocker cattle for summer grazing. Larger producers and cattle buyers can use this relationship between local and national prices when using futures or options to hedge against changes in prices.

12
F i g u r e 5 . N o r t h C a r o l i n a a n d O k l a h o m a F e e d e r S t e e r P r i c e s , 1 9 9 0 - 2 0 0 1
3 0
4 0
5 0
6 0
7 0
8 0
9 0
1 0 0
1 9 9 0 1 9 9 1 1 9 9 2 1 9 9 3 1 9 9 4 1 9 9 5 1 9 9 6 1 9 9 7 1 9 9 8 1 9 9 9 2 0 0 0 2 0 0 1
$/cw
t.
O K P r i c e
N C P r i c e
Making Price Projections and Managing Price Risk
Many business decisions depend on expected prices at some time in the future. The
futures market is the most useful indicator of expected prices because it represents the accumulated opinions of a huge number of individuals. Furthermore, it is the opinion of individuals who "have put their money where their mouths are" by trading in the market. Of course, these opinions change as new information becomes available but this doesn't invalidate the prices we see reported from the trading floor. The Chicago Mercantile Exchange offers futures and options contracts for live (fed) cattle and for feeder cattle.
The feeder cattle futures contract is of greater interest to most North Carolina cattle producers because they sell feeder calves or cattle. This contract is for a 50,000-pound load of 700-849 pound M1 and L1 feeder steers. Contracts are available for January, March, April, May, August, September, October, and November. Feeder cattle futures are cash settled, meaning that someone who buys and holds a cattle futures contract does not take delivery of any cattle when the contract expires. The buyers and sellers close out their positions through a cash settlement. (This also holds true for holders of "in the money" options.)
Larger producers can use the futures markets to manage price risk. However, all producers can use the futures market to form price expectations when making buying and selling decisions. Any use of the futures market requires knowledge of the relationship between the futures market and the local cash (auction) market price. This relationship is called the basis, that is: Local Cash Price - Futures Price = Basis.
A positive basis means the local cash price is higher than the futures price. A negative basis means the local price is lower. There are some important reasons why local cash prices and national futures prices differ. One of these is transportation cost. Cattle produced closer to the major centers for cattle feeding will sell for higher prices than those produced further away.

13
Other factors include the buyers perceptions of the health and productivity of local cattle relative to those from other parts of the country. Justified or not, cattle from the south do not have a strong reputation. For these reasons, we would expect the basis to be negative for North Carolina markets.
The basis is likely to be different for different North Carolina markets so a producer needs to know the basis for the market where they plan to sell. The graph in Figure 6 and the data in Table 4 show the average monthly basis for Asheville, Siler City and Smithfield from 1990-2000. The observed differences among North Carolina markets are likely to be the result of differences in transportation costs.
Figure 6. North Carolina Cattle Price Basis, 600-799 lb. M1 Steers, Monthly, 1990-2000
-14.00
-12.00
-10.00
-8.00
-6.00
-4.00
-2.00
0.00Jan Feb Mar Apr May Jun Jul Aug Sep Oct Nov Dec
$/cw
t
ASHEVILLE
SILER CITY
SMITHFIELD
The size of the basis can change during the course of the year because of changes in
the local demand for or supply of cattle. In the Mid-Atlantic region, there is a demand in spring for cattle for summer pasture and large sales in the fall when pasture runs out. This can be seen in Table 4 and in Figure 6.

14
Table 4. Average Cattle Price Basis with Nearby Futures for 3 NC Auction Markets for 600-799 lb. M1 Steers, Monthly, 1990-2000
Jan Feb Mar Apr May Jun Jul Aug Sep Oct Nov Dec$/cwt. $/cwt. $/cwt. $/cwt. $/cwt. $/cwt. $/cwt. $/cwt. $/cwt. $/cwt. $/cwt. $/cwt.
ASHEVILLEAvg. -3.76 -2.57 -1.55 -0.85 -3.32 -2.40 -3.03 -3.58 -5.93 -8.67 -7.62 -6.20High 2.86 1.36 1.84 4.52 8.04 2.50 3.00 1.73 -1.23 -1.81 -0.77 -0.94Low -8.31 -6.23 -5.42 -6.61 -13.43 -8.26 -9.09 -9.55 -11.54 -12.92 -14.23 -14.06
SILER CITYAvg. -5.86 -5.08 -3.64 -3.64 -4.24 -5.10 -5.71 -5.83 -9.22 -11.35 -10.38 -8.94High 2.86 -2.01 -0.89 1.90 7.74 3.63 3.13 -1.93 -5.53 -4.23 -3.72 -3.85Low -11.51 -11.35 -6.56 -10.04 -13.16 -12.01 -13.93 -12.45 -15.15 -19.32 -17.73 -15.98
SMITHFIELDAvg. -7.24 -5.87 -4.75 -5.76 -6.40 -6.67 -6.61 -7.46 -9.66 -11.48 -11.86 -9.37High 1.11 -1.14 -1.11 -1.51 4.17 0.29 -2.25 -0.89 -4.36 -5.23 -6.35 -5.54Low -10.91 -10.83 -8.31 -10.41 -15.01 -13.43 -12.43 -12.45 -13.32 -17.42 -19.80 -18.48
The basis information presented here is called the "nearby" basis, which is the most
common measure of basis. It is calculated using the relationship between the local cash (auction) price in a given month and the price quoted during that same month for the futures contract that expires in the next closest month in the future. For example, the basis for September would use a September cash price and the price observed in September for the October futures contract. This approach has proved to be more reliable than calculations that use the futures price for the contract that expires the same month as the cash price we are interested in. Futures markets trade daily, but most North Carolina auction markets only operate one day a week. Basis is often calculated monthly to remove some of the unexplained volatility we see in cattle prices.
The average basis is calculated for the whole 11-year period. The highest and lowest basis values are also shown in the tables, to indicate how much the basis can vary. Ideally, this range should be narrow, meaning the basis is stable from year to year. However, the data in Table 4 indicate that this is not the case and there is quite a wide range from high to low. Monthly basis data for each of the markets for this period is reported in Appendix 3. Because of this variability, there is a risk that projections of futures prices that use the average basis will miss the mark. This is known as basis risk. Some people prefer to use an estimate of basis that is more conservative than the historic average, i.e., one that is closer to the lower end of the range.
Strictly speaking, basis is the difference between local cash and futures prices for similar cattle, that is, cattle that fit the futures contract specification. However, note that North Carolina markets do not report price data that exactly corresponds to the futures contract of 700-849 lb. Also, the futures contract is for M1 and L1 cattle but the auction market prices used in the calculation are for M1s. Unfortunately, there is no information available to measure precisely the price differences due to these differences in cattle characteristics. However, the data provided previously on grade and weight premiums do provide some guidance.

15
Basis and prices in the futures market can be used to form price expectations but unless a specific group of cattle match the futures contract specifications, some additional calculations are necessary. Producers may sell cattle of various weights and prices vary according to weight. Figure 7 shows the 12-year average monthly prices for 400-499, 500-599 and 600-799 lb. M1 steers. Actual dollar figures are given in Appendix 2.
Figure 7. 12-Year Average Monthly Price for 3 North Carolina Markets, 600-799 lb. M1 Steers, $/100 lb., 1990-2001
50
55
60
65
70
75
80
85
Jan Feb Mar Apr May Jun Jul Aug Sep Oct Nov Dec
$ pe
r cw
t.
Asheville Siler City Smithfield
As an example of the process, suppose it is March and a producer is trying to decide
how much he can afford to pay for stocker cattle on summer pasture. He is trying to estimate the likely selling price of 750-pound M&L1 feeder steers in September in Siler City. Suppose that the futures price in March for the October feeder cattle contract is $81.25 per cwt. The average basis for 600-799 lb. steers for September is -$9.22 from Table 4. So, the projected local price for September is $72.03 per cwt. (that is, $81.25 - $9.22 per cwt.). A second example is a cow-calf operator who is trying to predict the value of his feeder calves in the fall. He expects to sell mostly 550 lb. M1 steers. The October futures contract is selling at $84.10 and the September basis is -$11.35. However, 550 lb. cattle sell at a weight premium of $4.72. His price forecast is $77.50, ($84.10 -$11.35 + $4.72), or $426 per head.
The price received for specific cattle is more complex than this simple example. Price projections must also incorporate differences in the other characteristics that affect cattle prices, including frame, muscling and breed or color. Price premiums for these characteristics are given for feeder calves in Table 5 and for stockers in Table 6, based on NC Graded Sale data. The base for these price differences is the average sale price for 700-799 pound M1 and L1 steers, because these cattle most closely match the futures market contract specifications. Heifer discounts are provided in Appendix 4. Note that the price differences shown here have a different base than Tables 2 and 3. Tables 2 and 3 show price differences as an aid to cow-calf

16
herd management and decision-making. The price differences in Tables 5 and 6 are intended for use in price forecasting.
Table 5. Steer Feeder Calves: Breed price differences relative to the averageprice for 7-weight M1 & L1 Steer Feeder Calves, based on North CarolinaGraded Feeder Calf Sale Data, 1991-2001.
Weight B&W StraightClass, lb. Grade Black Face Hereford Exotic Brahman Other Holstein Cont.
------- $ per cwt. ------300-399 L1 23.90 18.80400-499 19.51 25.18 16.42 14.49 14.86 11.73500-599 14.44 17.50 12.13 8.31 -4.75 7.50 4.33600-699 5.71 6.20 5.20 0.79 -6.62 2.45 2.66700-799 -1.62 -2.36 -3.10 -9.49 2.95 -1.78800-999 -10.84 -7.64 -10.84 0.52
300-399 M1 18.12 18.90 13.06 15.20 8.96 17.70400-499 13.95 14.50 7.33 9.94 0.05 7.65 -1.70500-599 10.24 9.76 0.41 4.47 -3.34 3.00 -1.85600-699 6.69 5.19 -1.40 1.84 -1.58 -0.30 -1.45700-799 2.62 0.78 -1.64 -1.50 -7.72 -4.83 -5.32800-999 -2.87 -3.17 -4.57 -5.16 -7.75 -0.61
300-399 S1 0.70 1.86 -4.82 -3.47 -0.50 -2.16400-499 -0.52 1.25 -6.51 -4.48 -11.35 -5.55500-599 -2.28 -1.76 -7.10 -7.32 -13.56 -13.88600-699 -5.39 -4.39 -5.23 -10.86 -8.83700-799 -9.02 -9.41 -9.36 -12.93800-999 -7.44 -10.05
300-399 LMS2 11.13 11.05 2.27 5.86 1.73 -1.88400-499 8.18 6.78 -4.00 2.31 -4.83 -3.21 -1.10500-599 4.64 1.42 -5.03 -2.32 -8.39 -3.10 -6.81600-699 1.24 -2.66 -6.29 -5.57 -10.17 -5.00 -8.83 -11.16700-799 -3.06 -5.60 -11.04 -7.51 -12.85 -12.24 -12.56800-999 -13.17 -9.88 -12.21 -19.18 -16.24

17
Table 6. Stocker Steers: Breed price differences relative to the average pricefor 7-weight M1 & L1 Stocker Steers, based on North Carolina Graded StockerSale Data, 1991-2001.
Weight B&W StraightClass, lb. Grade Black Face Hereford Exotic Brahman Other Holstein Cont.
------- $ per cwt. ------300-399 L1400-499 29.52500-599 24.00 18.51600-699 8.08 10.19 9.56700-799 3.82 0.71 1.33800-999 -1.85 -2.42 -2.38
300-399 M1 27.12 27.61 24.66 23.07400-499 24.82 24.78 17.93 19.74 13.91 14.70500-599 21.63 22.12 18.95 15.65 14.15 14.04 8.07600-699 9.95 10.65 7.98 6.66 -0.54 3.67 -0.20700-799 0.48 1.67 1.77 -2.00 -4.32 -3.28 -7.12800-999 -3.72 -4.65 -4.76 -5.67 -4.45
300-399 S1 10.00 13.23 -2.49 15.07400-499 7.18 7.85 1.71 3.68 -3.00500-599 3.97 4.68 -2.16 -1.10 -9.31600-699 -3.16 -0.87 -8.40 -4.85700-799 -7.76 -4.32 -8.24 -12.48800-999 -13.73 -12.61 -12.98
300-399 LMS2 22.25 20.84 13.35 13.53 14.03 9.80 9.58400-499 16.36 15.29 7.02 11.75 9.20 0.88 4.14 10.23500-599 12.55 11.92 5.62 8.13 -0.27 -4.64 -0.03 4.10600-699 5.10 5.00 1.25 1.00 -5.07 -7.14 -0.43 -2.49700-799 -2.41 -1.78 -6.00 -5.72 -12.48 -12.42 -8.00800-999 -10.38 -10.82 -8.71 -12.32 -13.19
Table 7 is a worksheet to assist producers and others in estimating prices for a specific group of cattle based on futures market data, using the information in Tables 4-6. It provides a structure for organizing the information that affects cattle prices. However, there is always unexplained variability in cattle prices on a given date. Therefore, the worksheet provides the opportunity to make three estimates; most likely, conservative (lower) and optimistic (higher) based on a producer's opinions about price variability in local cattle markets. This worksheet can also be used in hedging decisions, to evaluate the attractiveness of a specific contract or option.

18
Table 7. Worksheet for estimating cattle prices.
Date of sale____________________________
Estimated weight of cattle at date of sale_____________________
Item Best Estimate ConservativeEstimate
OptimisticEstimate
Current feeder cattle futures contract price forthe sale month
$ per cwt. $ per cwt. $ per cwt.
+ or - the NC basis for the month and themarket of choice+ or - the weight adjustment relative to thefutures contract specifications
+ or - the heifer adjustment, if applicable
+ or - the frame adjustment if not M or L
+ or - the muscling adjustment if not No. 1+ or - the breed or color adjustment relative tothe market average+ or - other premiums or discounts, e.g., lotsize, direct sale, graded sale
Estimated price per cwt.
Producers with truckload lots of cattle can use the futures markets to hedge the risk of
unfavorable prices. Basis is important because producers sell in local markets but the futures contracts are traded nationally. Judging whether the futures market is offering an acceptable price depends on the basis. Adding the local basis to the futures price provides an estimate of the local price for cattle of similar type to those in the futures contract. The actual basis for a specific sale seldom turns out to be what is predicted, as the ranges in Table 4 illustrates. This introduces an element of risk that the actual price received will not be what was projected -- it may be higher or lower than expected and this is known as basis risk. However, this approach to price risk management is the most effective tool currently available.
Selling a futures contract locks in the price at the time of the transaction. If the market falls from the time the producer sells a contract the futures contract will increase in value and this gain offsets the lower price received for cattle sold in the cash market. If the market rises then the producer sells his cattle at a higher price in the cash market but owes money to settle

19
the futures contract. Either way the producer nets the same amount of money from the contract.
Options on futures contracts (buying a put) can be used to place a floor under prices without sacrificing the upside potential if prices rise in the cash market. Here again, a producer uses the basis to estimate the local price that is equivalent to the strike price of the option, net of the option premium. Summary This report provides information on North Carolina cattle prices that were not previously available. Annual average auction price data provide a long run perspective on price levels and variability, which is helpful for planning purposes. Monthly average prices describe a seasonal pattern to prices that producers can also use in planning their cattle production and marketing activities. Both the annual and monthly data show historic price relationships between cattle of different weights. The graded sale data complement the auction market data because more detail is available. These data also show the price differences among cattle of different weights. In addition, graded sale data show the premiums and discounts associated with various other characteristics, including sex, frame, muscling and breed or color. In combination, these price differences have a large impact on the value of feeder calves and stocker cattle. This information, when used in conjunction with animal performance and cost of production and marketing data should permit cattle producers to make more informed business decisions. The auction price data were also combined with futures market data to generate basis information for three North Carolina markets. There is considerable year-to-year variation in the basis; nevertheless, it increases a producers ability to formulate price expectations and to make hedging decisions. It takes some time to study the price relationship presented here but the end result should be a profitable use of time for producers and others with an interest in the business side of the North Carolina cattle industry.
20
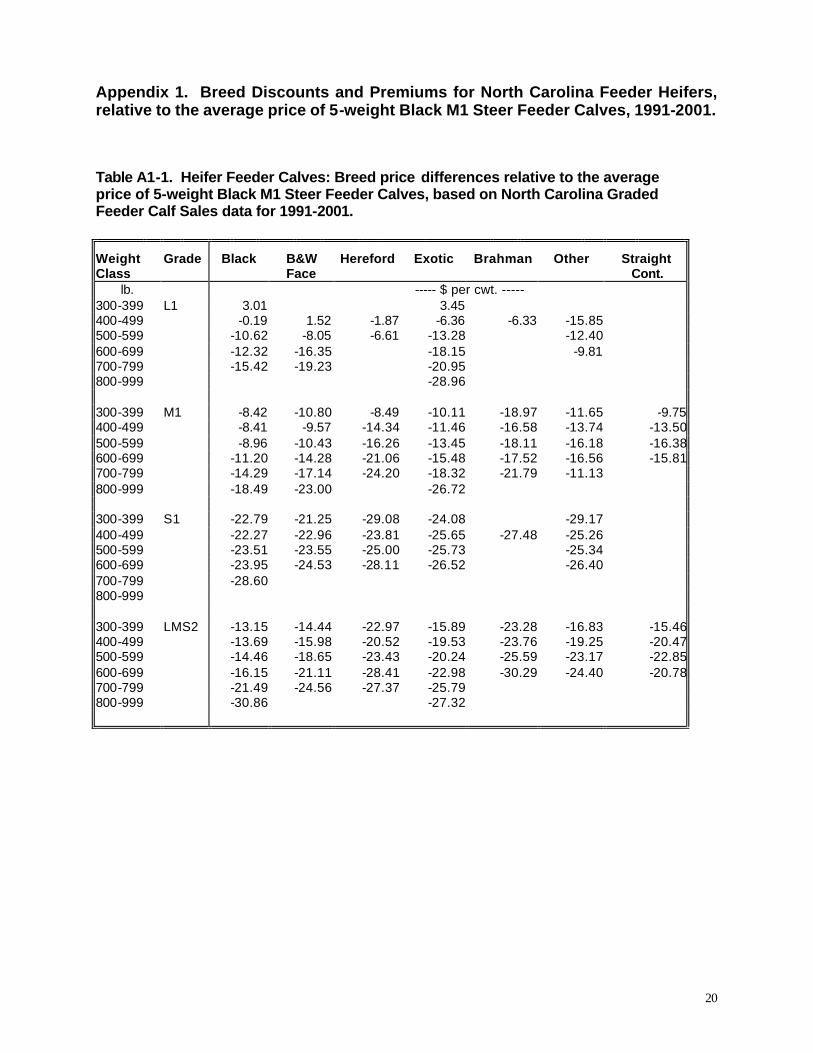
Appendix 1. Breed Discounts and Premiums for North Carolina Feeder Heifers, relative to the average price of 5-weight Black M1 Steer Feeder Calves, 1991-2001. Table A1-1. Heifer Feeder Calves: Breed price differences relative to the average price of 5-weight Black M1 Steer Feeder Calves, based on North Carolina Graded Feeder Calf Sales data for 1991-2001.
Weight Class
Grade Black B&W Face
Hereford Exotic Brahman Other Straight Cont.
lb. ----- $ per cwt. ----- 300-399 L1 3.01 3.45 400-499 -0.19 1.52 -1.87 -6.36 -6.33 -15.85 500-599 -10.62 -8.05 -6.61 -13.28 -12.40 600-699 -12.32 -16.35 -18.15 -9.81 700-799 -15.42 -19.23 -20.95 800-999 -28.96
300-399 M1 -8.42 -10.80 -8.49 -10.11 -18.97 -11.65 -9.75400-499 -8.41 -9.57 -14.34 -11.46 -16.58 -13.74 -13.50500-599 -8.96 -10.43 -16.26 -13.45 -18.11 -16.18 -16.38600-699 -11.20 -14.28 -21.06 -15.48 -17.52 -16.56 -15.81700-799 -14.29 -17.14 -24.20 -18.32 -21.79 -11.13 800-999 -18.49 -23.00 -26.72
300-399 S1 -22.79 -21.25 -29.08 -24.08 -29.17 400-499 -22.27 -22.96 -23.81 -25.65 -27.48 -25.26 500-599 -23.51 -23.55 -25.00 -25.73 -25.34 600-699 -23.95 -24.53 -28.11 -26.52 -26.40 700-799 -28.60 800-999
300-399 LMS2 -13.15 -14.44 -22.97 -15.89 -23.28 -16.83 -15.46400-499 -13.69 -15.98 -20.52 -19.53 -23.76 -19.25 -20.47500-599 -14.46 -18.65 -23.43 -20.24 -25.59 -23.17 -22.85600-699 -16.15 -21.11 -28.41 -22.98 -30.29 -24.40 -20.78700-799 -21.49 -24.56 -27.37 -25.79 800-999 -30.86 -27.32

21
Table A1-2. Heifer Feeder Calves: Breed price differences relative to the average price of 5-weight Black M1 Stocker Steers, based on North Carolina Graded Stocker Sales data for 1991-2001. Weight Class
Grade Black B&W Face
Hereford Exotic Brahman Other Straight Cont.
lb. ----- $/cwt. ----- 300-399 L1 400-499 -12.08 500-599 -14.93 -19.27 600-699 -18.11 -19.25 -23.41 700-799 -20.74 -33.80 -28.53 800-999 -31.88 -33.55 -31.89
300-399 M1 -11.67 -11.09 -8.29 -13.62 400-499 -12.56 -12.08 -16.31 -17.28 -16.53 -15.23 500-599 -16.05 -15.86 -16.83 -17.62 -25.68 -24.35 -24.31600-699 -23.00 -22.30 -21.78 -28.13 -31.16 -26.71 -28.28700-799 -26.57 -30.69 -29.34 -27.80 -36.52 -26.66 800-999 -32.28 -33.57 -37.03 -31.64
300-399 S1 -25.56 -23.53 -20.88 -34.22 400-499 -26.28 -26.55 -32.05 -34.12 -31.96 -28.30 500-599 -28.98 -29.96 -33.38 -34.03 -36.26 600-699 -31.81 -33.21 -40.07 -29.99 700-799 -31.23 -31.70 -36.53 800-999
300-399 LMS2 -18.12 -18.99 -23.08 -21.89 -25.72 -31.45 400-499 -17.98 -17.72 -23.19 -22.95 -24.70 -30.82 500-599 -20.61 -22.22 -33.22 -25.26 -28.55 -33.74 -27.28600-699 -27.28 -26.79 -35.12 -31.20 -34.93 -34.18 700-799 -29.57 -31.73 -35.28 -38.18 800-999 -42.18 -38.13

22
Appendix 2. North Carolina Cattle Auction Prices, 1990-2001
Table A2-1. North Carolina Auction Prices for M1 Steers, Average of Weekly Prices, 1990-2001 SILER CITY ASHEVILLE SMITHFIELD 3-MARKET AVERAGE
YEAR 400-500 500-600 600-800 400-500 500-600 600-800 400-500 500-600 600-800 400-500 500-600 600-800 $/100lb $/100lb $/100lb $/100lb $/100lb $/100lb $/100lb $/100lb $/100lb $/100lb $/100lb $/100lb
1990 94.24 87.14 80.08 98.72 88.63 81.11 91.89 84.85 78.19 94.95 86.87 79.79 1991 98.18 89.15 81.98 101.43 91.99 83.55 96.70 87.86 80.06 98.77 89.66 81.86 1992 85.78 80.11 74.53 91.57 83.09 76.27 85.78 79.64 73.66 87.71 80.94 74.82 1993 92.36 85.58 79.59 99.46 89.59 82.85 91.74 84.20 78.54 94.52 86.45 80.33 1994 84.18 76.81 70.65 89.89 80.90 72.75 85.18 76.88 70.83 86.42 78.19 71.41 1995 67.92 62.89 59.07 71.81 67.33 62.76 67.41 61.71 58.16 69.05 63.97 60.00 1996 51.94 51.24 49.08 56.24 54.57 52.84 51.95 50.57 49.13 53.37 52.12 50.35 1997 78.89 74.86 68.56 82.86 78.10 71.53 78.67 73.43 66.98 80.14 75.46 69.02 1998 77.99 72.98 65.60 83.27 76.16 67.48 77.95 71.39 64.74 79.74 73.51 65.94 1999 81.94 77.38 69.37 85.83 80.35 72.11 81.95 76.88 68.05 83.24 78.20 69.84 2000 98.02 91.07 81.85 101.76 94.43 82.20 98.50 90.51 79.58 99.43 92.00 81.21 2001 95.09 89.41 80.32 99.18 93.54 82.87 95.67 87.86 79.34 96.65 90.27 80.84 Avg. 83.88 78.22 71.72 88.50 81.55 74.03 83.61 77.15 70.61 85.33 78.97 72.12
Table A2-2. North Carolina Auction Prices for M1 Steers, Monthly Average, 1990-2001a SILER CITY ASHEVILLE SMITHFIELD 3-MARKET AVERAGE MONTH 400-500 500-600 600-800 400-500 500-600 600-800 400-500 500-600 600-800 400-500 500-600 600-800
$/100lb $/100lb $/100lb $/100lb $/100lb $/100lb $/100lb $/100lb $/100lb $/100lb $/100lb $/100lb Jan 82.80 77.08 70.46 88.59 81.44 72.59 82.86 76.02 68.95 84.75 78.18 70.67 Feb 90.77 83.08 74.41 96.29 85.28 76.82 90.07 81.38 73.18 92.37 83.24 74.80 Mar 89.62 82.19 73.16 94.26 85.89 75.06 89.19 80.79 71.22 91.03 82.96 73.15 Apr 88.73 82.04 73.38 94.21 87.71 76.63 88.42 80.74 71.39 90.45 83.50 73.80 May 86.75 82.23 74.86 91.47 84.74 75.99 86.89 79.80 72.80 88.37 82.26 74.55 Jun 84.76 80.65 74.23 88.91 82.71 76.47 85.28 79.85 73.05 86.32 81.07 74.58 Jul 83.99 79.02 73.29 88.22 82.34 76.13 83.24 78.18 72.28 85.15 79.85 73.90 Aug 82.99 77.56 73.06 87.10 80.85 75.20 82.67 77.09 71.55 84.25 78.50 73.27 Sep 78.87 74.38 69.88 84.58 78.61 73.31 78.80 73.61 69.26 80.75 75.54 70.82 Oct 79.05 72.96 67.80 83.58 76.67 70.58 77.72 72.30 67.70 80.12 73.98 68.69 Nov 80.94 74.26 69.09 85.18 77.75 71.67 79.70 73.25 67.85 81.94 75.09 69.54 Dec 80.64 75.22 69.23 85.52 78.22 72.14 81.01 74.35 68.98 82.39 75.93 70.12
a Monthly averages are calculated only for months with two or more reported weekly prices. Numbers in italics are estimated from adjacent months Table A2-3. North Carolina Auction Prices for M1 Steers, Monthly Difference Relative to Annual Average Price, Average for 1990-2001a SILER CITY ASHEVILLE SMITHFIELD 3-MARKET AVERAGE MONTH 400-500 500-600 600-800 400-500 500-600 600-800 400-500 500-600 600-800 400-500 500-600 600-800
$/100lb $/100lb $/100lb $/100lb $/100lb $/100lb $/100lb $/100lb $/100lb $/100lb $/100lb $/100lb Jan 0.21 -0.15 -0.34 0.09 -0.12 -0.57 0.43 -0.15 -0.80 0.24 -0.14 -0.57 Feb 3.98 2.40 0.62 4.85 1.28 0.87 3.57 1.81 0.62 4.13 1.83 0.70 Mar 5.74 3.96 1.44 5.76 4.34 1.03 5.58 3.64 1.39 5.69 3.98 1.29 Apr 4.84 3.82 1.66 5.71 6.16 2.61 4.81 3.60 0.78 5.12 4.52 1.68 May 2.86 4.01 3.13 2.97 3.19 1.97 3.27 2.65 2.20 3.03 3.28 2.43 Jun 0.88 2.42 2.51 0.41 1.16 2.74 1.66 2.71 2.44 0.98 2.10 2.56 Jul 0.10 0.80 1.57 -0.28 0.78 2.10 -0.37 1.03 1.67 -0.19 0.87 1.78 Aug -0.89 -0.66 1.33 -1.40 -0.70 1.17 -0.95 -0.06 0.95 -1.08 -0.47 1.15 Sep -4.91 -3.84 -1.84 -3.92 -2.94 -0.72 -4.82 -3.53 -1.34 -4.55 -3.44 -1.30 Oct -4.83 -5.26 -3.92 -5.58 -4.88 -4.00 -5.89 -4.85 -2.91 -5.43 -4.99 -3.61 Nov -5.58 -5.36 -3.78 -4.84 -5.10 -3.38 -5.39 -5.30 -3.89 -5.27 -5.25 -3.68 Dec -4.28 -3.00 -2.49 -2.98 -3.33 -1.88 -2.60 -2.79 -1.62 -3.29 -3.04 -2.00
a Monthly averages are calculated only for months with two or more reported weekly prices. Numbers in italics are estimated from adjacent months

23
Table A2-4. Siler City Friday Auction Prices for 400-499 lb. M1 Steers, Monthly, 1990-2001
Year Jan. Feb. Mar. Apr. May Jun. Jul. Aug. Sep. Oct. Nov. Dec.
$/100lb $/100lb $/100lb $/100lb $/100lb $/100lb $/100lb $/100lb $/100lb $/100lb $/100lb $/100lb 1990 88.25 90.25 98.20 98.13 98.60 95.38 96.25 96.40 90.88 89.38 90.17 95.83 1991 97.00 106.38 107.13 107.25 106.70 100.00 101.75 94.60 91.25 86.00 85.38 84.75 1992 85.90 90.25 90.00 88.00 86.50 84.63 85.75 88.00 83.00 83.00 80.75 83.75 1993 85.50 93.88 95.63 99.00 97.25 97.75 93.13 92.13 89.90 90.38 86.00 86.75 1994 88.63 98.17 96.50 94.83 87.50 79.88 82.25 84.38 76.10 75.00 74.63 78.25 1995 79.50 80.75 77.40 73.25 70.50 72.50 66.00 60.80 60.88 59.75 55.40 53.75 1996 52.33 52.63 53.38 49.88 51.90 51.00 48.17 53.00 50.67 50.40 54.00 55.83 1997 65.30 73.75 80.63 81.63 82.90 79.38 84.50 82.50 77.75 82.40 76.33 81.00 1998 86.80 89.00 87.50 91.50 84.63 78.00 68.83 66.75 63.50 70.20 69.50 73.75 1999 82.63 82.25 81.63 80.80 77.88 80.88 81.38 81.63 80.70 81.75 82.33 90.13 2000 97.83 96.75 101.50 101.00 98.13 95.25 108.50 100.40 93.50 92.38 95.10 94.75 2001 98.13 97.00 106.00 99.50 98.50 102.50 91.33 95.33 89.63 88.00 83.10 89.17 Avg. 83.98 87.59 89.63 88.73 86.75 84.76 83.99 82.99 78.98 79.05 77.72 80.64
Table A2-5. Siler City Friday Auction Prices for 500-599 lb. M1 Steers, Monthly, 1990-2001
Year Jan. Feb. Mar. Apr. May Jun. Jul. Aug. Sep. Oct. Nov. Dec. $/100lb $/100lb $/100lb $/100lb $/100lb $/100lb $/100lb $/100lb $/100lb $/100lb $/100lb $/100lb
1990 81.38 84.63 88.00 90.50 91.60 90.38 89.63 89.80 84.75 81.75 83.33 87.00 1991 88.00 94.13 94.88 96.75 97.20 94.88 93.13 87.20 81.63 80.00 77.50 80.25 1992 80.30 82.13 82.75 82.20 80.13 80.00 81.25 82.00 78.88 76.80 75.88 79.25 1993 82.00 84.63 86.50 89.80 90.88 89.88 87.25 84.38 86.00 82.75 81.38 80.38 1994 83.25 85.00 87.00 85.25 79.50 75.25 76.63 77.13 68.00 66.75 68.75 70.88 1995 75.25 73.75 70.10 66.63 65.38 66.13 60.88 57.40 55.50 54.63 52.90 53.50 1996 50.67 51.17 52.63 48.88 51.10 51.25 49.00 52.50 49.67 50.00 53.63 54.00 1997 60.40 69.38 76.00 80.75 82.60 77.00 80.25 77.63 73.38 75.90 70.33 75.00 1998 79.80 83.00 81.63 84.50 84.25 75.88 65.00 63.88 60.88 63.50 63.50 67.75 1999 73.88 78.13 76.25 75.70 77.75 75.75 76.75 77.25 76.80 76.13 80.00 84.75 2000 90.83 88.75 94.50 93.13 91.13 90.38 99.50 92.80 88.75 86.88 87.20 87.25 2001 90.13 90.33 96.00 90.38 95.30 101.00 89.00 88.80 88.38 80.50 75.33 82.67 Avg. 77.99 80.42 82.19 82.04 82.24 80.65 79.02 77.56 74.39 72.97 72.48 75.22
Table A2-6. Siler City Friday Auction Prices for 600-799 lb. M1 Steers, Monthly, 1990-2001
Year Jan. Feb. Mar. Apr. May Jun. Jul. Aug. Sep. Oct. Nov. Dec. $/100lb $/100lb $/100lb $/100lb $/100lb $/100lb $/100lb $/100lb $/100lb $/100lb $/100lb $/100lb
1990 75.67 77.88 79.20 81.13 82.40 83.88 83.88 83.40 79.38 74.75 75.83 80.33 1991 81.75 85.75 84.63 85.75 87.30 87.63 84.13 82.10 78.63 74.80 73.63 73.50 1992 72.80 74.88 72.13 75.40 74.00 74.50 75.88 77.88 75.50 72.70 74.25 75.75 1993 78.88 77.50 78.25 81.60 84.50 83.75 79.38 81.50 79.40 78.50 75.25 75.00 1994 77.25 75.67 79.10 77.63 73.38 70.13 71.75 69.25 66.00 61.38 63.88 64.50 1995 70.50 65.63 63.40 60.38 61.00 63.00 57.50 55.70 54.75 54.13 52.30 49.67 1996 47.00 45.88 48.63 46.00 50.10 51.25 49.33 51.60 48.67 47.50 51.00 52.75 1997 56.40 63.38 69.50 67.50 74.30 73.63 75.75 73.50 70.13 67.90 64.83 66.17 1998 70.50 72.13 72.13 73.90 75.75 65.75 59.88 60.63 57.88 58.20 59.38 60.88 1999 63.88 67.88 67.38 66.80 66.00 68.00 70.67 73.63 68.60 71.88 72.38 76.50 2000 79.83 76.75 81.30 85.25 84.25 82.25 88.88 83.70 80.63 78.63 78.40 82.00 2001 82.31 81.06 82.30 79.25 85.30 87.00 82.50 83.80 79.06 73.25 71.20 73.75 Avg. 71.40 72.03 73.16 73.38 74.86 74.23 73.29 73.06 69.89 67.80 67.69 69.23

24
Table A2-7. Asheville Auction Prices for 400-499 lb. M1 Steers, Monthly, 1990-2001
Year Jan. Feb. Mar. Apr. May Jun. Jul. Aug. Sep. Oct. Nov. Dec. $/100lb $/100lb $/100lb $/100lb $/100lb $/100lb $/100lb $/100lb $/100lb $/100lb $/100lb $/100lb
1990 93.63 97.63 99.50 101.00 103.13 100.00 94.83 99.90 96.63 99.50 97.50 102.25 1991 99.20 110.75 108.83 111.38 109.30 102.67 104.17 98.70 95.75 94.20 90.67 89.83 1992 91.88 97.88 96.13 93.60 88.33 90.13 91.25 92.50 90.38 85.50 90.17 90.25 1993 95.25 99.83 102.83 104.00 105.38 102.88 100.10 99.13 96.80 98.00 92.17 95.83 1994 97.50 101.13 103.63 101.13 93.25 87.63 86.63 88.25 79.30 78.88 82.83 81.38 1995 85.88 86.83 83.90 77.88 74.25 76.63 68.13 65.90 62.50 60.88 60.13 57.50 1996 56.00 55.25 57.83 54.25 54.13 53.13 53.33 57.90 56.13 57.50 59.83 60.50 1997 67.90 77.63 84.25 85.00 86.70 83.75 91.00 87.38 86.38 83.10 80.67 86.75 1998 89.83 96.00 95.88 102.38 92.50 80.00 75.00 75.00 72.38 76.30 74.17 75.00 1999 81.25 84.50 82.88 86.50 84.38 86.00 87.50 84.88 85.60 86.75 85.33 94.00 2000 101.00 104.00 108.60 104.63 102.83 98.88 106.83 101.30 100.00 94.38 98.75 97.50 2001 103.75 103.00 106.90 108.75 103.45 105.25 99.83 94.35 93.13 88.00 84.88 95.50 Avg. 88.59 92.87 94.26 94.21 91.47 88.91 88.22 87.10 84.58 83.58 83.09 85.52
Table A2-8. Asheville Auction Prices for 500-599 lb. M1 Steers, Monthly, 1990-2001
Year Jan. Feb. Mar. Apr. May Jun. Jul. Aug. Sep. Oct. Nov. Dec. $/100lb $/100lb $/100lb $/100lb $/100lb $/100lb $/100lb $/100lb $/100lb $/100lb $/100lb $/100lb
1990 84.00 85.38 89.25 92.50 94.50 90.63 87.75 91.40 86.25 85.75 87.25 90.25 1991 89.50 97.38 99.17 104.50 100.38 92.50 94.17 89.20 87.50 85.90 82.00 79.00 1992 81.88 84.13 86.25 84.50 82.33 82.38 84.00 85.38 83.88 79.90 82.00 82.25 1993 86.50 84.83 89.83 97.00 93.75 92.25 92.30 90.75 88.40 86.38 83.67 85.33 1994 86.17 88.50 91.50 93.75 83.63 77.38 79.63 78.88 74.30 70.25 73.50 73.33 1995 77.75 77.50 77.10 71.33 69.00 69.20 64.25 61.80 60.38 59.50 57.67 56.75 1996 54.50 53.80 55.17 53.38 52.63 52.00 54.67 55.30 55.75 55.10 55.83 57.00 1997 68.10 71.63 78.25 82.00 82.50 80.63 84.33 80.75 79.00 77.30 76.00 80.50 1998 83.83 83.75 86.00 92.00 83.33 77.63 72.00 69.13 65.63 67.30 66.17 68.67 1999 75.75 78.17 79.50 81.00 79.25 80.50 80.80 79.63 79.80 81.13 80.33 87.88 2000 93.13 93.25 99.30 97.25 96.50 96.40 99.67 97.20 91.88 86.63 89.13 90.00 2001 96.13 93.63 99.35 103.31 99.13 101.06 94.50 90.80 90.63 84.94 79.38 87.67 Avg. 81.44 82.66 85.89 87.71 84.74 82.71 82.34 80.85 78.62 76.67 76.08 78.22
Table A2-9. Asheville Auction Prices for 600-799 lb. M1 Steers, Monthly, 1990-2001a
Year Jan. Feb. Mar. Apr. May Jun. Jul. Aug. Sep. Oct. Nov. Dec. $/100lb $/100lb $/100lb $/100lb $/100lb $/100lb $/100lb $/100lb $/100lb $/100lb $/100lb $/100lb
1990 77.00 76.75 78.40 82.33 81.54 80.75 81.25 86.00 82.38 80.50 80.75 85.00 1991 84.88 86.13 87.50 89.50 91.00 86.17 87.00 82.60 81.75 80.90 75.67 73.17 1992 74.50 75.25 75.00 76.25 74.33 75.75 79.13 79.63 78.88 73.60 75.50 78.50 1993 80.63 79.50 80.50 85.00 87.00 85.00 84.60 85.50 83.70 80.13 77.75 77.75 1994 77.00 79.42 81.83 80.25 78.85 77.44 74.63 75.25 68.40 65.13 68.25 67.17 1995 70.50 69.00 67.40 63.83 64.42 65.00 61.63 59.60 58.13 56.67 57.17 55.50 1996 52.83 51.00 51.17 49.17 49.83 52.00 54.17 54.50 54.50 53.90 54.50 54.67 1997 59.60 66.50 70.50 72.88 74.10 73.88 78.83 76.38 74.75 72.13 69.33 72.25 1998 73.17 74.33 71.00 76.50 76.25 71.38 65.38 62.00 60.38 61.10 61.00 63.75 1999 64.75 72.38 69.88 72.25 70.00 71.50 73.40 72.13 73.30 73.75 73.00 80.50 2000 83.00 81.63 85.50 84.13 80.75 88.25 86.50 84.10 79.63 72.00 78.63 81.33 2001 85.50 84.13 82.05 87.50 83.85 90.50 87.00 84.70 83.94 77.13 74.00 76.50 Avg. 73.61 74.67 75.06 76.63 75.99 76.47 76.13 75.20 73.31 70.58 70.46 72.17
a Monthly averages are calculated only for months with two or more reported weekly prices. Numbers in italics are estimated from adjacent months

25
Table A2-10. Smithfield Auction Prices for 400-499 lb. M1 Steers, Monthly, 1990-2001
Year Jan. Feb. Mar. Apr. May Jun. Jul. Aug. Sep. Oct. Nov. Dec.
$/100lb $/100lb $/100lb $/100lb $/100lb $/100lb $/100lb $/100lb $/100lb $/100lb $/100lb $/100lb 1990 87.13 90.63 93.80 92.50 94.20 90.33 91.63 96.20 92.50 86.38 89.75 98.75 1991 99.63 103.63 103.50 105.00 103.00 101.63 100.17 93.20 89.75 85.50 86.50 86.67 1992 85.63 89.63 90.13 87.70 84.25 83.75 84.63 89.63 84.13 82.90 82.67 83.17 1993 89.63 90.88 95.63 98.13 94.63 95.13 90.10 93.75 90.10 88.75 83.00 89.17 1994 90.00 98.17 97.88 94.63 90.75 83.33 82.25 84.13 77.20 72.13 76.33 79.13 1995 83.75 77.00 79.40 72.88 70.13 71.60 64.88 61.20 58.38 57.00 54.63 54.83 1996 52.13 54.17 55.38 49.75 51.30 50.50 49.50 53.13 51.25 50.80 53.67 52.83 1997 64.30 74.13 79.63 78.63 83.00 83.00 88.88 81.50 76.25 78.50 77.83 82.75 1998 84.20 86.88 88.00 91.50 86.75 79.50 68.38 69.75 63.17 67.70 66.83 72.17 1999 80.63 83.83 82.88 81.50 81.00 82.13 82.50 79.63 81.50 81.63 78.33 87.38 2000 96.67 95.38 99.40 105.38 102.38 99.20 102.00 96.10 93.13 94.50 101.00 97.17 2001 97.38 100.63 104.70 103.50 101.30 103.25 94.00 93.80 88.25 86.88 80.75 88.17 Avg. 84.26 87.08 89.19 88.43 86.89 85.28 83.24 82.67 78.80 77.72 77.61 81.02
Table A2-11. Smithfield Auction Prices for 500-599 lb. M1 Steers, Monthly, 1990-2001
Year Jan. Feb. Mar. Apr. May Jun. Jul. Aug. Sep. Oct. Nov. Dec. $/100lb $/100lb $/100lb $/100lb $/100lb $/100lb $/100lb $/100lb $/100lb $/100lb $/100lb $/100lb
1990 78.75 82.63 84.00 86.83 89.00 88.00 84.50 88.00 85.63 80.38 83.25 87.50 1991 87.75 91.75 93.50 94.00 90.30 91.00 93.67 88.88 81.13 79.80 76.67 79.50 1992 77.88 83.13 82.50 82.25 80.38 77.83 78.67 81.17 81.00 75.50 76.17 78.83 1993 82.38 81.63 84.88 88.50 86.63 86.88 86.10 86.00 83.90 81.25 79.17 80.50 1994 81.13 81.50 86.50 85.00 81.67 76.75 74.75 78.50 69.60 65.63 69.25 71.17 1995 73.50 72.63 69.80 63.33 61.13 65.70 61.75 55.90 53.25 54.75 52.33 50.00 1996 51.00 48.13 51.75 48.25 49.50 51.13 50.50 52.70 51.13 50.90 51.33 50.50 1997 60.75 69.50 75.13 74.25 74.40 76.63 81.38 76.38 72.00 73.60 69.25 77.75 1998 77.25 79.33 80.88 83.63 82.25 76.88 62.50 64.67 58.38 62.20 62.50 65.00 1999 75.38 77.67 74.38 74.25 77.88 76.25 79.50 74.88 77.88 76.75 73.17 84.50 2000 89.75 87.38 90.90 95.13 92.38 92.70 95.67 89.30 84.13 89.00 90.25 90.00 2001 88.50 88.00 95.30 93.50 92.10 98.50 89.17 88.70 85.38 77.88 74.75 77.00 Avg. 77.00 78.61 80.79 80.74 79.80 79.85 78.18 77.09 73.62 72.30 71.51 74.35
Table A2-12. Smithfield Auction Prices for 600-799 lb. M1 Steers, Monthly, 1990-2001a
Year Jan. Feb. Mar. Apr. May Jun. Jul. Aug. Sep. Oct. Nov. Dec. $/100lb $/100lb $/100lb $/100lb $/100lb $/100lb $/100lb $/100lb $/100lb $/100lb $/100lb $/100lb
1990 73.17 76.00 74.88 78.50 80.38 80.38 81.33 81.50 82.13 74.67 75.38 79.25 1991 81.63 84.00 83.83 82.75 83.70 82.50 81.75 78.75 78.88 75.00 71.00 71.32 1992 71.63 72.83 72.50 74.13 74.25 72.88 75.00 76.38 74.88 73.40 71.00 76.50 1993 76.50 79.13 76.50 77.13 79.67 82.83 81.17 81.00 79.90 77.50 74.33 76.00 1994 76.67 73.00 78.88 79.38 72.88 71.63 70.38 72.63 64.40 61.50 65.25 64.83 1995 68.75 66.50 64.00 56.67 56.88 59.50 56.88 54.50 54.38 54.13 50.33 51.17 1996 47.63 46.40 48.75 46.38 48.25 49.83 50.83 51.60 50.50 49.40 52.00 50.25 1997 57.00 62.50 67.25 67.13 68.80 68.50 74.50 69.38 67.63 67.30 63.50 70.75 1998 66.88 71.13 72.38 71.38 72.38 68.50 60.50 60.50 59.00 56.50 57.17 59.33 1999 63.00 68.00 66.00 64.38 67.63 68.63 73.00 68.13 68.63 69.75 65.83 75.50 2000 76.75 75.13 78.50 80.25 84.63 82.30 81.83 80.60 74.38 79.75 79.13 80.75 2001 80.50 76.75 80.50 78.63 84.20 89.13 80.17 83.70 76.50 73.50 71.75 72.17 Avg. 70.01 70.95 72.00 71.39 72.80 73.05 72.28 71.56 69.27 67.70 66.39 68.98
a Monthly averages are calculated only for months with two or more reported weekly prices. Numbers in italics are estimated from adjacent months

26
APPENDIX 3. North Carolina Basis Data for Feeder Cattle Table A3-1 Monthly Basis for Asheville. 1990-2000 Table 3a. Cattle Price Basis with Nearby Futures for Asheville, M1 Steers, 600-799 lb., $/100 lb. Year Jan Feb Mar Apr May Jun Jul Aug Sep Oct Nov Dec 1990 -4.69 -4.94 -3.74 -1.04 -6.52 -6.02 -0.92 -4.11 -6.49 -5.19 -0.94 1991 -3.47 -2.24 -0.67 2.21 7.00 2.17 3.00 -2.07 -4.00 -1.81 -1.68 -4.18 1992 -3.87 -3.12 -2.63 0.61 -9.68 -8.26 -4.88 -3.70 -4.20 -8.81 -10.19 -7.19 1993 -4.75 -5.88 -4.31 -0.24 -0.01 -2.01 -2.41 -0.73 -1.23 -2.60 -3.79 1994 -4.11 1.84 4.52 -2.66 1.73 -4.85 -9.16 -5.42 -6.50 1995 2.86 1.36 1.50 -1.71 -0.52 -3.89 -5.14 -6.56 -8.02 -0.77 -2.44 1996 -4.40 -6.23 -1.70 -6.61 -13.43 -9.09 -9.55 -9.32 -12.92 -14.23 -14.06 1997 -8.31 -1.41 -0.85 -4.66 -5.97 -6.19 -1.24 -3.45 -2.91 -7.42 -7.80 -4.88 1998 -2.05 -0.89 -5.42 -0.62 8.04 3.17 -2.83 -6.49 -11.54 -11.10 -11.72 -8.97 1999 -7.48 0.15 -2.31 -1.53 -7.48 -5.98 -4.08 -7.50 -8.45 -10.03 -12.63 -5.13 2000 -1.09 -2.46 1.29 -0.24 -5.00 2.50 0.75 -1.53 -8.05 -17.02 -10.39 -7.69 Avg. -3.76 -2.57 -1.55 -0.85 -3.32 -2.40 -3.03 -3.58 -5.93 -8.67 -7.62 -6.20 High 2.86 1.36 1.84 4.52 8.04 2.50 3.00 1.73 -1.23 -1.81 -0.77 -0.94 Low -8.31 -6.23 -5.42 -6.61 -13.43 -8.26 -9.09 -9.55 -11.54 -12.92 -14.23 -14.06 Table A3-2. Cattle Price Basis with Nearby Futures for Asheville, M1 Steers, 500-599 lb., $/100 lb. Year Jan Feb Mar Apr May Jun Jul Aug Sep Oct Nov Dec 1990 2.31 3.69 7.11 9.13 7.23 3.36 0.48 4.48 -0.24 -1.24 1.31 4.31 1991 2.63 9.01 11.00 17.21 16.38 8.50 10.17 4.53 1.75 3.19 4.65 1.65 1992 3.51 5.76 8.62 8.86 -1.68 -1.63 -0.01 2.05 0.80 -2.51 -3.69 -3.44 1993 1.12 -0.55 5.02 11.76 6.74 5.24 5.29 4.52 3.47 3.65 2.13 3.79 1994 5.06 7.39 11.51 18.02 6.34 0.09 2.34 5.36 1.05 -4.04 -0.17 -0.34 1995 10.11 9.86 11.20 5.79 3.48 3.68 -1.27 -2.94 -4.31 -5.19 -0.27 -1.19 1996 -2.73 -3.43 2.30 -2.40 -10.63 -11.26 -8.59 -8.75 -8.07 -11.72 -12.90 -11.73 1997 0.19 3.72 6.90 4.46 2.43 0.56 4.26 0.92 1.34 -2.25 -1.13 3.37 1998 8.61 8.53 9.58 14.88 15.12 9.42 3.79 0.64 -6.29 -4.90 -6.55 -4.05 1999 3.52 5.94 7.31 7.22 1.77 3.02 3.32 0.00 -1.95 -2.65 -5.30 2.25 2000 9.04 9.16 15.09 12.88 10.75 10.65 13.92 11.57 4.20 -2.39 0.11 0.98 Avg. 3.94 5.37 8.69 9.80 5.27 2.88 3.06 2.03 -0.75 -2.73 -1.98 -0.40 High 10.11 9.86 15.09 18.02 16.38 10.65 13.92 11.57 4.20 3.19 4.65 4.31 Low -2.73 -3.43 2.30 -2.40 -10.63 -11.26 -8.59 -8.75 -8.07 -11.72 -12.90 -11.73
27
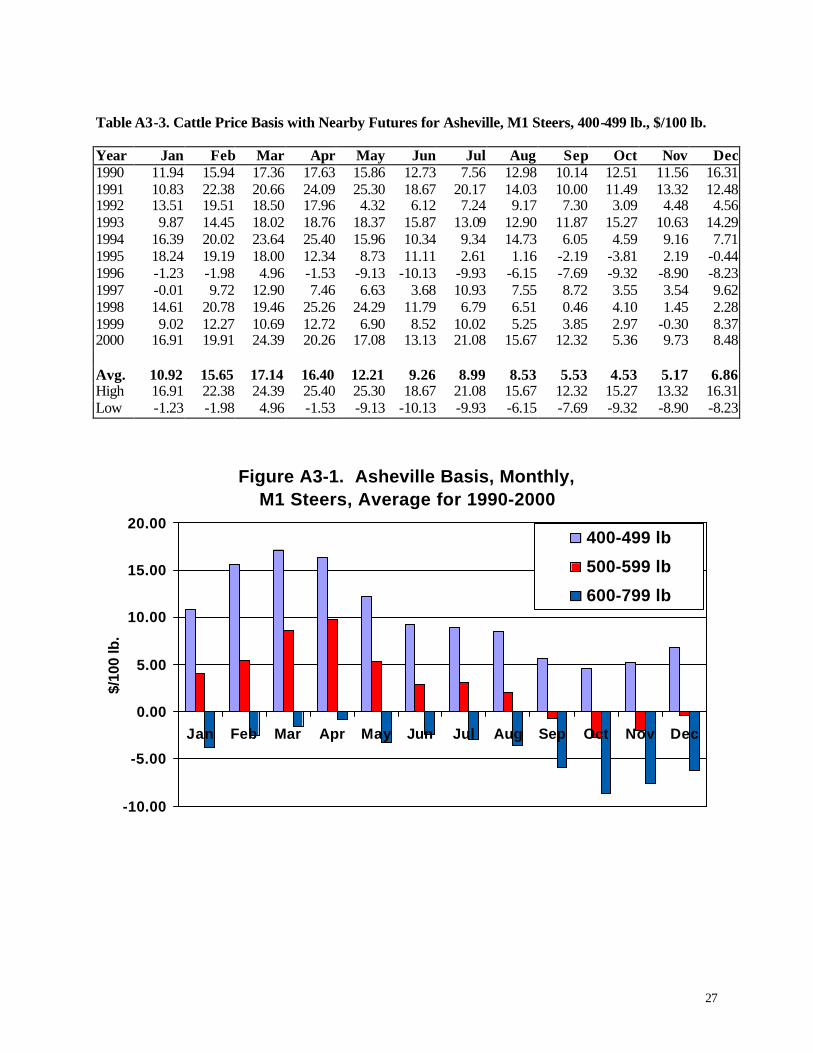
Table A3-3. Cattle Price Basis with Nearby Futures for Asheville, M1 Steers, 400-499 lb., $/100 lb. Year Jan Feb Mar Apr May Jun Jul Aug Sep Oct Nov Dec 1990 11.94 15.94 17.36 17.63 15.86 12.73 7.56 12.98 10.14 12.51 11.56 16.31 1991 10.83 22.38 20.66 24.09 25.30 18.67 20.17 14.03 10.00 11.49 13.32 12.48 1992 13.51 19.51 18.50 17.96 4.32 6.12 7.24 9.17 7.30 3.09 4.48 4.56 1993 9.87 14.45 18.02 18.76 18.37 15.87 13.09 12.90 11.87 15.27 10.63 14.29 1994 16.39 20.02 23.64 25.40 15.96 10.34 9.34 14.73 6.05 4.59 9.16 7.71 1995 18.24 19.19 18.00 12.34 8.73 11.11 2.61 1.16 -2.19 -3.81 2.19 -0.44 1996 -1.23 -1.98 4.96 -1.53 -9.13 -10.13 -9.93 -6.15 -7.69 -9.32 -8.90 -8.23 1997 -0.01 9.72 12.90 7.46 6.63 3.68 10.93 7.55 8.72 3.55 3.54 9.62 1998 14.61 20.78 19.46 25.26 24.29 11.79 6.79 6.51 0.46 4.10 1.45 2.28 1999 9.02 12.27 10.69 12.72 6.90 8.52 10.02 5.25 3.85 2.97 -0.30 8.37 2000 16.91 19.91 24.39 20.26 17.08 13.13 21.08 15.67 12.32 5.36 9.73 8.48 Avg. 10.92 15.65 17.14 16.40 12.21 9.26 8.99 8.53 5.53 4.53 5.17 6.86 High 16.91 22.38 24.39 25.40 25.30 18.67 21.08 15.67 12.32 15.27 13.32 16.31 Low -1.23 -1.98 4.96 -1.53 -9.13 -10.13 -9.93 -6.15 -7.69 -9.32 -8.90 -8.23
Figure A3-1. Asheville Basis, Monthly,M1 Steers, Average for 1990-2000
-10.00
-5.00
0.00
5.00
10.00
15.00
20.00
Jan Feb Mar Apr May Jun Jul Aug Sep Oct Nov Dec
$/10
0 lb
.
400-499 lb
500-599 lb
600-799 lb

28
Monthly Basis for Siler City, 1990-2000 Table A3-4. Cattle Price Basis with Nearby Futures for Siler City, M1 Steers, 600-799 lb., $/100 lb. Year Jan Feb Mar Apr May Jun Jul Aug Sep Oct Nov Dec 1990 -6.02 -3.81 -2.94 -2.24 -4.87 -3.39 -3.39 -3.52 -7.11 -12.24 -10.11 -5.61 1991 -6.27 -2.62 -3.54 -1.54 3.30 3.63 0.13 -2.57 -7.12 -7.91 -3.72 -3.85 1992 -5.57 -3.49 -5.50 -0.24 -10.01 -9.51 -8.13 -5.45 -7.58 -9.71 -11.44 -9.94 1993 -6.50 -7.88 -6.56 -3.64 -2.51 -3.26 -7.63 -4.73 -5.53 -4.23 -6.29 -6.54 1994 -3.86 -5.44 -0.89 1.90 -3.91 -7.16 -5.54 -4.27 -7.25 -12.91 -9.79 -9.17 1995 2.86 -2.01 -2.50 -5.16 -4.52 -2.52 -8.02 -9.04 -9.94 -10.56 -5.64 -8.27 1996 -10.23 -11.35 -4.24 -9.78 -13.16 -12.01 -13.93 -12.45 -15.15 -19.32 -17.73 -15.98 1997 -11.51 -4.53 -1.85 -10.04 -5.77 -6.44 -4.32 -6.33 -7.53 -11.65 -12.30 -10.96 1998 -4.72 -3.09 -4.29 -3.22 7.74 -2.46 -8.33 -7.86 -14.04 -14.00 -13.34 -11.84 1999 -8.35 -4.35 -4.81 -6.98 -11.48 -9.48 -6.81 -6.00 -13.15 -11.90 -13.25 -9.13 2000 -4.26 -7.34 -2.91 0.88 -1.50 -3.50 3.13 -1.93 -7.05 -10.39 -10.62 -7.02 Avg. -5.86 -5.08 -3.64 -3.64 -4.24 -5.10 -5.71 -5.83 -9.22 -11.35 -10.38 -8.94 High 2.86 -2.01 -0.89 1.90 7.74 3.63 3.13 -1.93 -5.53 -4.23 -3.72 -3.85 Low -11.51 -11.35 -6.56 -10.04 -13.16 -12.01 -13.93 -12.45 -15.15 -19.32 -17.73 -15.98 Table A3-5. Cattle Price Basis with Nearby Futures for Siler City, M1 Steers, 500-599 lb., $/100 lb. Year Jan Feb Mar Apr May Jun Jul Aug Sep Oct Nov Dec 1990 -0.31 2.94 5.86 7.13 4.33 3.11 2.36 2.88 -1.74 -5.24 -2.61 1.06 1991 0.33 5.76 6.71 9.46 13.20 10.88 9.13 2.53 -4.12 -2.71 0.15 2.90 1992 1.93 3.76 5.12 6.56 -3.88 -4.01 -2.76 -1.33 -4.20 -5.61 -9.81 -6.44 1993 -3.38 -0.75 1.69 4.56 3.87 2.87 0.24 -1.85 1.07 0.02 -0.16 -1.16 1994 2.14 3.89 7.01 9.52 2.21 -2.04 -0.66 3.61 -5.25 -7.54 -4.92 -2.79 1995 7.61 6.11 4.20 1.09 -0.14 0.61 -4.64 -7.34 -9.19 -10.06 -5.04 -4.44 1996 -6.56 -6.06 -0.24 -6.90 -12.16 -12.01 -14.26 -11.55 -14.15 -16.82 -15.10 -14.73 1997 -7.51 1.47 4.65 3.21 2.53 -3.07 0.18 -2.20 -4.28 -3.65 -6.80 -2.13 1998 4.58 7.78 5.21 7.38 16.04 7.67 -3.21 -4.61 -11.04 -8.70 -9.22 -4.97 1999 1.65 5.90 4.06 1.92 0.27 -1.73 -0.73 -2.38 -4.95 -7.65 -5.63 -0.88 2000 6.74 4.66 10.29 8.76 5.38 4.63 13.75 7.17 1.07 -2.14 -1.82 -1.77 Avg. 0.66 3.22 4.96 4.79 2.88 0.63 -0.05 -1.37 -5.16 -6.37 -5.54 -3.21 High 6.74 7.78 10.29 9.52 16.04 10.88 13.75 7.17 1.07 0.02 0.15 2.90 Low -7.51 -6.06 -0.24 -6.90 -12.16 -12.01 -14.26 -11.55 -14.15 -16.82 -15.10 -14.73

29
Table A3-6. Cattle Price Basis with Nearby Futures for Siler City, M1 Steers, 400-499 lb., $/100 lb. Year Jan Feb Mar Apr May Jun Jul Aug Sep Oct Nov Dec 1990 7.27 8.56 16.06 14.76 11.33 8.11 8.98 9.48 4.39 2.39 4.23 9.89 1991 10.53 18.01 18.96 19.96 22.70 16.00 17.75 9.93 5.50 3.29 8.03 7.40 1992 7.53 11.88 12.37 12.36 2.49 0.62 1.74 4.67 -0.08 0.59 -4.94 -1.94 1993 0.12 8.50 10.82 13.76 10.24 10.74 6.12 5.90 4.97 7.65 4.46 5.21 1994 7.52 17.06 16.51 19.10 10.21 2.59 4.96 10.86 2.85 0.71 0.96 4.58 1995 11.86 13.11 11.50 7.71 4.98 6.98 0.48 -3.94 -3.81 -4.94 -2.54 -4.19 1996 -4.90 -4.60 0.51 -5.90 -11.36 -12.26 -15.09 -11.05 -13.15 -16.42 -14.73 -12.90 1997 -2.61 5.84 9.28 4.09 2.83 -0.69 4.43 2.67 0.09 2.85 -0.80 3.87 1998 11.58 13.78 11.08 14.38 16.42 9.79 0.62 -1.74 -8.42 -2.00 -3.22 1.03 1999 10.40 10.02 9.44 7.02 0.40 3.40 3.90 2.00 -1.05 -2.03 -3.30 4.50 2000 13.74 12.66 17.29 16.63 12.38 9.50 22.75 14.77 5.82 3.36 6.08 5.73 Avg. 6.64 10.44 12.17 11.26 7.51 4.98 5.15 3.96 -0.26 -0.41 -0.52 2.11 High 13.74 18.01 18.96 19.96 22.70 16.00 22.75 14.77 5.82 7.65 8.03 9.89 Low -4.90 -4.60 0.51 -5.90 -11.36 -12.26 -15.09 -11.05 -13.15 -16.42 -14.73 -12.90
Figure A3-2. Siler City Basis, Monthly, M1 Steers, Average for 1990-2000
-15.00
-10.00
-5.00
0.00
5.00
10.00
15.00
Jan Feb Mar Apr May Jun Jul Aug Sep Oct Nov Dec$/10
0 lb
400-499 lb
500-599 lb
600-799 lb

30
Monthly Basis for Smithfield. 1990-2000 Table A3-7. Cattle Price Basis with Nearby Futures for Smithfield, M1 Steers, 600-799 lb., $/100 lb. Year Jan Feb Mar Apr May Jun Jul Aug Sep Oct Nov Dec 1990 -8.52 -5.69 -7.26 -4.87 -6.89 -6.89 -5.94 -5.42 -4.36 -12.32 -10.56 -6.69 1991 -6.77 -4.37 -4.34 -4.54 -0.30 -1.50 -2.25 -5.92 -6.87 -7.71 -6.35 1992 -6.74 -5.54 -5.13 -1.51 -9.76 -11.13 -9.01 -6.95 -8.20 -9.01 -14.69 -9.19 1993 -8.88 -6.25 -8.31 -8.11 -7.34 -4.18 -5.84 -5.23 -5.03 -5.23 -7.21 -5.54 1994 -4.44 -8.11 -1.11 3.65 -4.41 -6.91 -0.89 -8.85 -12.79 -8.42 -8.84 1995 1.11 -1.14 -1.90 -8.87 -8.64 -6.02 -8.64 -10.24 -10.31 -10.56 -7.61 -6.77 1996 -9.60 -10.83 -4.12 -9.40 -15.01 -13.43 -12.43 -12.45 -13.32 -17.42 -16.73 -18.48 1997 -10.91 -5.41 -4.10 -10.41 -11.27 -11.57 -5.57 -10.45 -10.03 -12.25 -13.63 -6.38 1998 -8.34 -4.09 -4.04 -5.74 4.17 0.29 -7.71 -7.99 -12.92 -15.70 -15.55 -13.39 1999 -9.23 -4.23 -6.19 -9.40 -9.85 -8.85 -4.48 -11.50 -13.12 -14.03 -19.80 -10.13 2000 -7.34 -8.96 -5.71 -4.12 -1.12 -3.45 -3.92 -5.03 -13.30 -9.27 -9.89 -8.27 Avg. -7.24 -5.87 -4.75 -5.76 -6.40 -6.67 -6.61 -7.46 -9.66 -11.48 -11.86 -9.37 High 1.11 -1.14 -1.11 -1.51 4.17 0.29 -2.25 -0.89 -4.36 -5.23 -6.35 -5.54 Low -10.91 -10.83 -8.31 -10.41 -15.01 -13.43 -12.43 -12.45 -13.32 -17.42 -19.80 -18.48 Blank cells indicate too few cattle sold to compute the basis. Source: NCDA&CS Market News and CME futures price data purchased from CRB. Table A3-8. Cattle Price Basis with Nearby Futures for Smithfield, M1 Steers, 500-599 lb., $/100 lb. Year Jan Feb Mar Apr May Jun Jul Aug Sep Oct Nov Dec 1990 -2.94 0.94 1.86 3.46 1.73 0.73 -2.77 1.08 -0.86 -6.61 -2.69 1.56 1991 0.63 3.38 5.33 6.71 6.30 7.00 9.67 4.21 -4.62 -2.91 -0.68 2.15 1992 -0.49 4.76 4.87 6.61 -3.63 -6.18 -5.34 -2.16 -2.08 -6.91 -9.52 -6.86 1993 -3.00 -3.75 0.07 3.26 -0.38 -0.13 -0.91 -0.23 -1.03 -1.48 -2.37 -1.04 1994 0.02 0.39 6.51 9.27 4.38 -0.54 -2.54 4.98 -3.65 -8.66 -4.42 -2.50 1995 5.86 4.99 3.90 -2.21 -4.39 0.18 -3.77 -8.84 -11.44 -9.94 -5.61 -7.94 1996 -6.23 -9.10 -1.12 -7.53 -13.76 -12.13 -12.76 -11.35 -12.69 -15.92 -17.40 -18.23 1997 -7.16 1.59 3.78 -3.29 -5.67 -3.44 1.31 -3.45 -5.66 -5.95 -7.88 0.62 1998 2.03 4.11 4.46 6.51 14.04 8.67 -5.71 -3.82 -13.54 -10.00 -10.22 -7.72 1999 3.15 5.44 2.19 0.47 0.40 -1.23 2.02 -4.75 -3.87 -7.03 -12.46 -1.13 2000 5.66 3.29 6.69 10.76 6.63 6.95 9.92 3.67 -3.55 -0.02 1.23 0.98 Avg. -0.22 1.46 3.50 3.09 0.51 -0.01 -0.99 -1.88 -5.73 -6.86 -6.55 -3.65 High 5.86 5.44 6.69 10.76 14.04 8.67 9.92 4.21 -0.86 -0.02 1.23 2.15 Low -7.16 -9.10 -1.12 -7.53 -13.76 -12.13 -12.76 -11.35 -13.54 -15.92 -17.40 -18.23

31
Table A3-9. Cattle Price Basis with Nearby Futures for Smithfield, M1 Steers, 400-499 lb., $/100 lb. Year Jan Feb Mar Apr May Jun Jul Aug Sep Oct Nov Dec 1990 5.44 8.94 11.66 9.13 6.93 3.06 4.36 9.28 6.01 -0.61 3.81 12.81 1991 12.13 15.26 15.33 17.71 19.00 17.63 16.17 8.53 4.00 2.79 9.15 9.32 1992 7.26 11.26 12.50 12.06 0.24 -0.26 0.62 6.30 1.05 0.49 -3.02 -2.52 1993 4.25 5.50 10.82 12.89 7.62 8.12 3.09 7.52 5.17 6.02 1.46 7.63 1994 8.89 17.06 17.89 18.90 13.46 6.04 4.96 10.61 3.95 -2.16 2.66 5.46 1995 16.11 9.36 13.50 7.34 4.61 6.08 -0.64 -3.54 -6.31 -7.69 -3.31 -3.11 1996 -5.10 -3.06 2.51 -6.03 -11.96 -12.76 -13.76 -10.92 -12.57 -16.02 -15.06 -15.90 1997 -3.61 6.22 8.28 1.09 2.93 2.93 8.81 1.67 -1.41 -1.05 0.70 5.62 1998 8.98 11.66 11.58 14.38 18.54 11.29 0.17 1.26 -8.75 -4.50 -5.89 -0.55 1999 8.40 11.60 10.69 7.72 3.52 4.65 5.02 0.00 -0.25 -2.15 -7.30 1.75 2000 12.58 11.29 15.19 21.01 16.63 13.45 16.25 10.47 5.45 5.48 11.98 8.15 Avg. 6.85 9.55 11.81 10.56 7.41 5.48 4.10 3.74 -0.33 -1.76 -0.44 2.61 High 16.11 17.06 17.89 21.01 19.00 17.63 16.25 10.61 6.01 5.48 11.98 12.81 Low -5.10 -3.06 2.51 -6.03 -11.96 -12.76 -13.76 -10.92 -12.57 -16.02 -15.06 -15.90
Figure A3-3. Smithfield Basis, Monthly, M1 Steers, Average for 1990-2000
-15.00
-10.00
-5.00
0.00
5.00
10.00
15.00
Jan Feb Mar Apr May Jun Jul Aug Sep Oct Nov Dec$/10
0 lb
400-499 lb
500-599 lb
600-799 lb

32
Appendix 4. Breed Discounts and Premiums for North Carolina Feeder Heifers Relative to 7-weight M1 & L1 Steer Feeder Calves, 1991-2001 Table A4-1. Heifer Feeder Calves: Breed price differences relative to the average price for 7-weight M1 & L1 Steer Feeder Calves, based on North Carolina Graded Feeder Calf Sale Data, 1991-2001.
Weight B&W Straight Class, lb. Grade Black Face Hereford Exotic Brahman Other Holstein Cont.
------- $ per cwt. ------ 300-399 L1 13.24 13.69 400-499 10.04 11.76 8.37 3.87 3.91 -5.61 500-599 -0.38 2.19 3.63 -3.04 -2.16 600-699 -2.09 -6.12 -7.91 0.43 700-799 -5.18 -9.00 -10.72 800-999 -18.72
300-399 M1 1.81 -0.57 1.75 0.12 -8.74 -1.42 400-499 1.82 0.67 -4.10 -1.23 -6.34 -3.50 -3.26500-599 1.27 -0.20 -6.03 -3.21 -7.88 -5.95 -6.15600-699 -0.97 -4.05 -10.82 -5.25 -7.29 -6.33 -5.57700-799 -4.05 -6.91 -13.97 -8.08 -11.56 -0.90 800-999 -8.26 -12.76 -16.48
300-399 S1 -12.55 -11.01 -18.85 -13.85 -18.93 400-499 -12.04 -12.73 -13.57 -15.41 -17.25 -15.02 500-599 -13.27 -13.32 -14.76 -15.49 -15.10 600-699 -13.71 -14.30 -17.87 -16.28 -16.17 700-799 -18.37 800-999
300-399 LMS2 -2.91 -4.21 -12.74 -5.65 -13.05 -6.60 -5.22400-499 -3.46 -5.75 -10.29 -9.30 -13.53 -9.01 -10.24500-599 -4.23 -8.42 -13.20 -10.01 -15.35 -12.93 -12.61600-699 -5.92 -10.88 -18.17 -12.74 -20.05 -14.17 -10.55700-799 -11.25 -14.32 -17.13 -15.56 800-999 -20.63 -17.09

33
Table A4-2. Stocker Heifers: Breed price differences relative to the average price for 7-weight M1 & L1 Stocker Steers, based on North Carolina Graded Stocker Sale Data, 1991-2001.
Weight B&W Straight Class, lb. Grade Black Face Hereford Exotic Brahman Other Holstein Cont.
------- $ per cwt. ------ 300-399 L1 400-499 9.55 500-599 6.71 2.36 600-699 3.52 2.38 -1.78 700-799 0.89 -12.16 -6.90 800-999 -10.25 -11.92 -10.26
300-399 M1 9.96 10.54 13.34 8.01 400-499 9.07 9.55 5.32 4.36 5.10 6.41 500-599 5.58 5.77 4.80 4.01 -4.05 -2.71 -2.67600-699 -1.36 -0.67 -0.15 -6.50 -9.53 -5.08 -6.65700-799 -4.94 -9.06 -7.71 -6.17 -14.89 -5.03 800-999 -10.65 -11.94 -15.40 -10.01
300-399 S1 -3.92 -1.89 0.76 -12.59 400-499 -4.65 -4.92 -10.42 -12.48 -10.33 -6.67 500-599 -7.34 -8.32 -11.74 -12.40 -14.63 600-699 -10.18 -11.58 -18.44 -8.36 700-799 -9.60 -10.07 -14.90 800-999
300-399 LMS2 3.51 2.65 -1.45 -0.26 -4.09 -9.82 400-499 3.66 3.91 -1.55 -1.31 -3.07 -9.19 500-599 1.02 -0.58 -11.58 -3.63 -6.92 -12.11 -5.65600-699 -5.64 -5.16 -13.49 -9.57 -13.30 -12.54 700-799 -7.94 -10.10 -13.65 -16.55 800-999 -20.55 -16.50