beekeepers’ survey
TRANSCRIPT

Alberta 2011 Beekeepers’ Survey
Results

-i-
Acknowledgements The Statistics and Data Development Branch of Alberta Agriculture and Rural Development (ARD) gratefully acknowledge and thank the many producers who participated in the Alberta 2011 Beekeepers’ survey. Without their participation, this report would not have been possible. As well, the Branch wishes to acknowledge several staff members of ARD, including Reynold Jaipaul, Gail Atkinson, Guangzhi Liu, Emmanuel Laate, John Paul Emunu, Roy Larsen, Melodie Mynzak, and Medhat Nasr for their contributions to this report. This report is also available on the Internet at: http://www1.agric.gov.ab.ca/$department/deptdocs.nsf/all/sdd12589 To obtain additional copies, please contact: Alberta Agriculture and Rural Development Economics and Competitiveness Division Statistics and Data Development Branch #302, 7000-113 Street Edmonton, Alberta T6H 5T6 Phone: 780-427-4011 Fax : 780-427-5220 ISSN 1701-3283 (Print) ISSN 1929-7033 (Online)
-ii-
Table of Contents Page
Acknowledgements ............................................................................................................................ i Table of Contents ............................................................................................................................. ii Alberta 2011 Beekeepers’ Survey Results Purpose of Survey ............................................................................................................................. 1 Methodology ............................................................................................................................. 1 Highlights of the Alberta 2010/2011 Paired Beekeeping Surveys ..................................... 3 Honey Production in Alberta ........................................................................................................... 7
List of Tables
Table 1 - 2010 and 2011 Beekeeping Survey Results ........................................................... 5 Table 2 - 2011 Honey Production Estimate - Alberta .......................................................... 8 Table 3 - Alberta Honey Statistics, 1992-2011 .................................................................... 11 Table 4 - Honey Production by Region in Alberta, 2004-2011........................................... 12
Region Classification
Map of ARD Regions in Alberta ..................................................................................................... 9 Alberta Municipalities Classified by Region ............................................................................... 10

-1-
Alberta 2011 Beekeepers’ Survey Purpose of Survey To address some of the data gaps and information needs of the beekeeping industry in Alberta, each year the Statistics and Data Development (SADD) Branch conducts a survey of beekeepers in the province. The survey results along with information from other sources are used in the development of provincial and regional estimates for selected honey variables such as colony numbers, yield, production and prices. These estimates, along with the survey results, are shared with survey participants, industry and other stakeholders. This report focuses on the results of the Alberta 2011 Beekeepers’ Survey and the related estimates generated. Methodology The Alberta Beekeepers’ Survey, which is provincial in scope, collects data from producers through a non-probability survey. In November 2011, survey questionnaires were mailed out to 539 beekeepers across the province. The questionnaire specifically asked survey participants to provide, at their earliest convenience, information on colony numbers, production, yield, bee purchases, prices (expected/actual), carry-over stocks and selected management practices, for their related beekeeping operation in 2011. Participants were made aware that participation in the survey was voluntary. They were also assured that all individual responses would be kept confidential under both the Statistics Act of Canada, and the Alberta Freedom of Information and Protection of Privacy (FOIP) Act, by which the SADD Branch is governed and operates. In return for their participation, respondents who were interested in the survey results were mailed the Branch’s publication highlighting the results of the 2011 Beekeepers’ survey. As of April 5, 2012, a total of 318 questionnaires were received of which 287 were usable and formed the basis for the Alberta 2011 honey production estimates.

-2-
Survey responses received were reviewed for data completeness, validated and entered into an electronic database. The data was then subjected to some computerized analyses, the results of which were rolled up into group summaries, to preserve the confidentiality of data provided by individual respondents. In turn, the group summaries, in conjunction with input from industry and Alberta Agriculture and Rural Development (ARD) staff and provincial apiculturist, were used to develop provincial and regional estimates on the number of producers, colonies, yield and production. Just to note, the derived estimates could be subject to error. Some of the possible causes of error include data coding, data entry, editing and tabulation. Nonetheless, we believe that the statistics published in this report are reliable estimates for Alberta. For further information regarding the survey or survey results, please do not hesitate to contact: John Paul Emunu Livestock Statistician Alberta Agriculture and Rural Development Economics and Competitiveness Division Statistics and Data Development Branch Phone: 780-427-4243; Fax 780-427-5220 E-mail: [email protected]

-3-
Highlights of the Alberta 2010/2011 Paired Beekeeping Surveys The following survey highlights are based on the responses of 168 producers in Alberta who participated in both the 2010 and 2011 Alberta Beekeepers’ Surveys (See Table 1). Paired Sample Highlights: ► In 2011, beekeepers purchased less packages/nucs than in 2010. Purchases decreased
approximately four per cent, with the average beekeeper buying 79 packages/nucs, compared to 83 in 2010. The majority of packages/nucs purchased were imported (98 per cent), with the remainder purchased locally.
► The distribution of imported packages was as follows: New Zealand (80 per cent) and
Australia (approximately 20 per cent) and “Other” (less than one per cent). Compared to 2010, imports of packages from New Zealand decreased, while imports from Australia increased.
► In 2011, beekeepers sourced 44 per cent of their nuc purchases from British Columbia,
42 per cent from other Canadian provinces (such as Saskatchewan and Manitoba) and 15 per cent from Alberta. Imports of nucs from British Columbia and other Canadian were down compared to the previous year, while those from Alberta were up. The 2010 average nuc price in British Columbia was $147.26, in Alberta it was $151.25 and $147.98 for other Canadian provinces.
► Individual queen purchases increased 13 per cent in 2011, with producers purchasing
254 queens on average, compared to 225 in 2010. Most of the queen purchases were sourced from outside of the province. Hawaii continues to be the primary source of imports, accounting for 67 per cent of the total, while other US States were second with 28 per cent, and New Zealand was third, with slightly over two per cent.
► Average queen prices in 2011 ranged from $21.43 to $26.67, depending upon the source
of purchase. Prices were lowest for queens from other US states at $21.43 per queen, followed by New Zealand at $21.92 per queen, then Hawaii at $22.19 per queen. Prices were the highest for queens from Saskatchewan at $26.67 per queen.
► In 2011, the percentage deathloss for queens purchased in packages and nucs was six
per cent, down 33 per cent from 2010. Average deathloss of individual queens decreased to 5.5 per cent from 5.7 per cent in 2010.
► On June 30, 2011, there was more honey in inventory than a year earlier. Producers on
average had 1,760 pounds in stock, up six per cent from 1,663 pounds in 2010. ► Alberta continues to be the preferred location for the over-wintering of bees. In 2011,
94 per cent of over-wintering activity occurred in Alberta with rest carried out in British Columbia.

-4-
► “Outdoor” over-wintering is still the favored practice, accounting for 71 per cent of total colonies over-wintered in 2011.
► The average beekeeper had about 17 years of beekeeping experience. Years of
experience in over-wintering “outdoor” was lower at 14 years, while for “indoor” it was 11 years.
► Producer prices received in 2010 for honey were higher than expected for both retail
and wholesale. The average price realized for wholesale honey was $152.76 per cwt, $0.26 higher than the expected price of $152.50 per cwt. The realized price for retail honey was $276.55 per cwt, $2.89 higher than the expected price of $273.66 per cwt. The 2011 expected prices for honey are $153.15 per cwt wholesale, and $268.70 per cwt retail.

Table 1 - 2010 AND 2011 BEEKEEPING SURVEY RESULTS - ALBERTA*(GROUP AVERAGES)**
DESCRIPTION 2010 2011 11/10 (%) PACKAGES/NUCS: Average number of packages/nucs purchased in spring per beekeeper: 82.86 79.30 -4.3 Package queen/nuc deathloss (%): 7.84 5.29 -32.5 Percent of packages/nucs purchased: - Locally (Alberta) (%) 1.12 2.48 121.4 - Imported (%) 98.88 97.52 -1.4 Distribution of imported packages purchased:
- New Zealand (%) 84.45 79.69 -5.6 - Australia (%) 9.43 19.98 111.9 - Other (%) 6.12 0.33 -94.6
Distribution of nucs purchased: - Alberta (%) 3.22 14.58 352.8 - British Columbia (%) 50.19 43.90 -12.5 - Other Canadian provinces (%) 46.59 41.51 -10.9
Average price per package (2 lb equivalent) purchased from: - New Zealand ($) 132.76 138.18 4.1 - Australia ($) 150.14 135.33 -9.9
Average price per nuc purchased from: - Alberta ($) 136.01 151.25 11.2 - British Columbia ($) 132.07 147.26 11.5
- Other Canadian provinces ($) 142.47 147.98 3.9 INDIVIDUAL QUEENS: Average number of queens purchased in spring per beekeeper: 224.62 254.25 13.2 Purchased individual queen deathloss (%): 5.72 5.56 -2.8 Percent of individual queens purchased: - Locally (Alberta) (%) 0.08 0.03 -62.5 - Imported (%) 99.92 99.90 0.0 Distribution of imported queens:
- British Columbia (%) 1.11 0.98 -11.7 - Saskatchewan ($) 0.02 0.03 28.2 - Other Canadian provinces (%) 0.66 0.41 -38.2 - New Zealand (%) 0.55 2.16 290.6 - Australia (%) - 0.06 n/a - Hawaii (%) 83.34 67.36 -19.2 - Other United States (%) 13.72 27.71 102.0 - Chile (%) 0.54 0.88 61.5 - Other (%) 0.06 0.41 640.6
Average price per individual queen purchased from: - British Columbia ($) 26.00 25.97 -0.1 - Saskatchewan ($) 25.00 26.67 n/a - Other Canadian provinces ($) 23.50 24.63 4.8 - New Zealand ($) 22.98 21.92 -4.6 - Australia ($) - 22.76 n/a - Hawaii ($) 20.16 22.19 10.1 - Other United States ($) 17.72 21.43 20.9 - Chile ($) 20.01 22.98 14.8 - Other ($) 24.67 23.12 -6.3
* Based on paired sample ** Weighted n/a Not applicable Note: Some totals may not add up due to rounding. Source: Alberta Agriculture and Rural Development, Economics and Competitiveness Division, Statistics and Data Development Branch
-5-
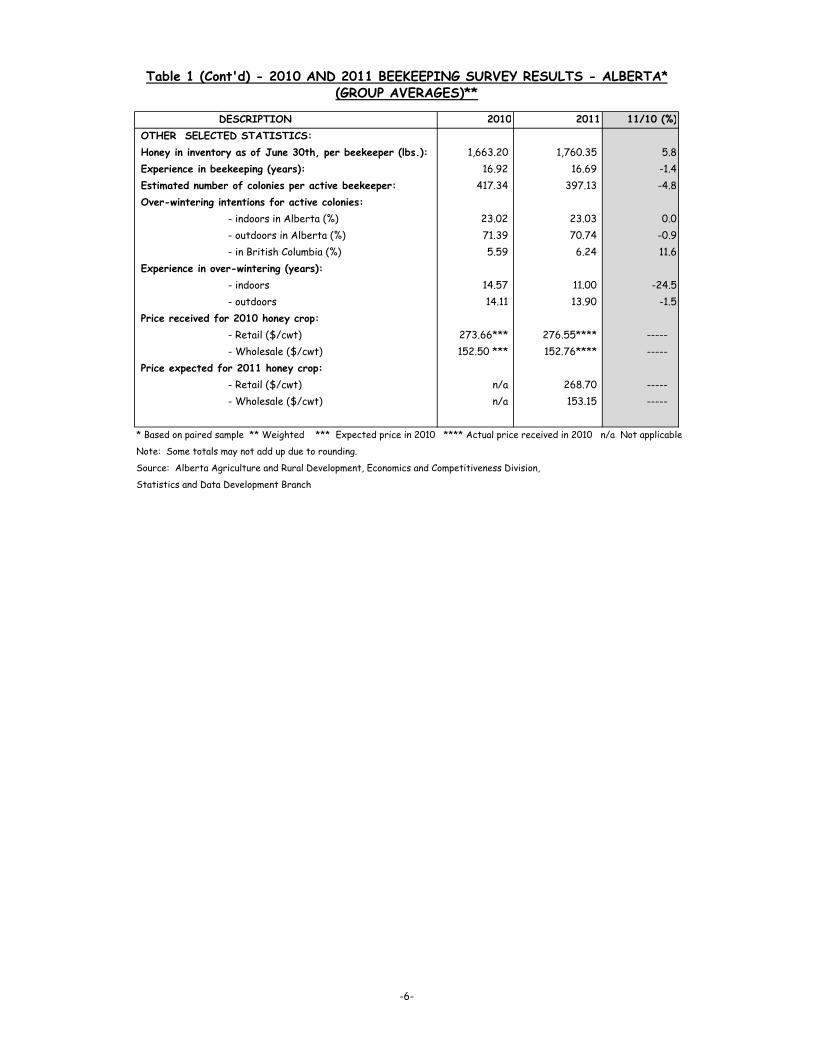
Table 1 (Cont'd) - 2010 AND 2011 BEEKEEPING SURVEY RESULTS - ALBERTA*(GROUP AVERAGES)**
DESCRIPTION 2010 2011 11/10 (%) OTHER SELECTED STATISTICS: Honey in inventory as of June 30th, per beekeeper (lbs.): 1,663.20 1,760.35 5.8 Experience in beekeeping (years): 16.92 16.69 -1.4 Estimated number of colonies per active beekeeper: 417.34 397.13 -4.8 Over-wintering intentions for active colonies:
- indoors in Alberta (%) 23.02 23.03 0.0 - outdoors in Alberta (%) 71.39 70.74 -0.9 - in British Columbia (%) 5.59 6.24 11.6
Experience in over-wintering (years): - indoors 14.57 11.00 -24.5 - outdoors 14.11 13.90 -1.5
Price received for 2010 honey crop: - Retail ($/cwt) 273.66*** 276.55**** ----- - Wholesale ($/cwt) 152.50 *** 152.76**** -----
Price expected for 2011 honey crop: - Retail ($/cwt) n/a 268.70 ----- - Wholesale ($/cwt) n/a 153.15 -----
* Based on paired sample ** Weighted *** Expected price in 2010 **** Actual price received in 2010 n/a Not applicable
Note: Some totals may not add up due to rounding.
Source: Alberta Agriculture and Rural Development, Economics and Competitiveness Division,
Statistics and Data Development Branch
-6-
-7-
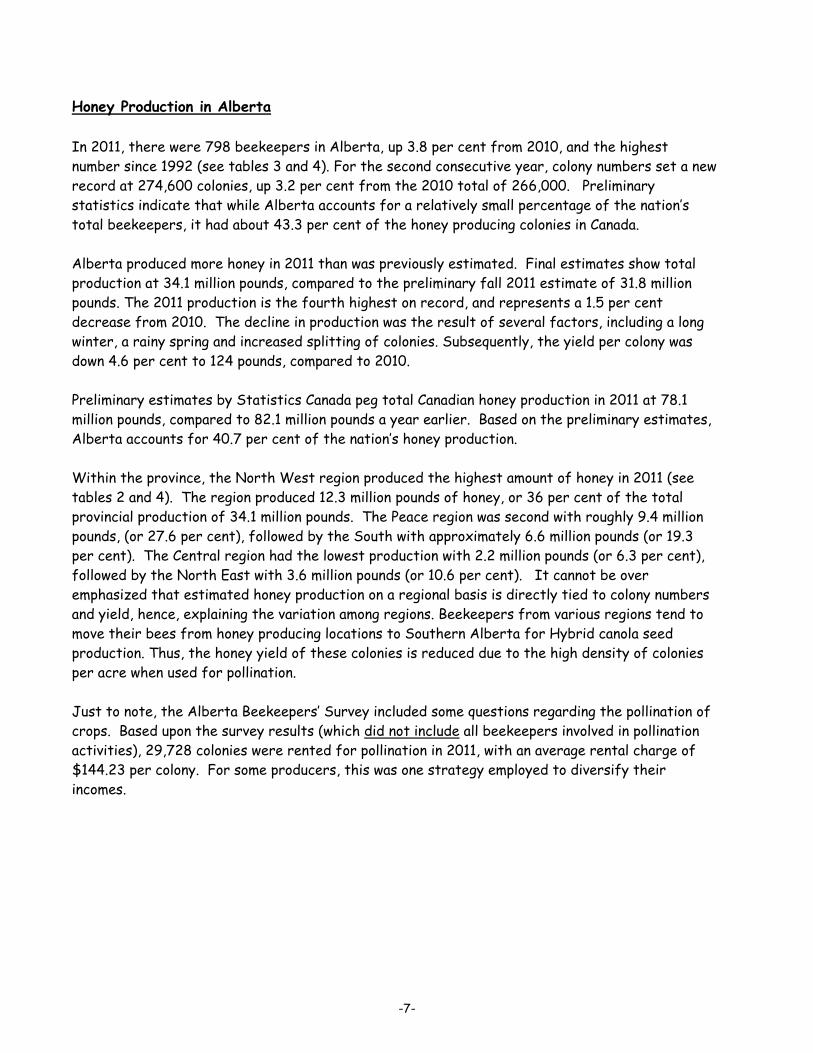
Honey Production in Alberta In 2011, there were 798 beekeepers in Alberta, up 3.8 per cent from 2010, and the highest number since 1992 (see tables 3 and 4). For the second consecutive year, colony numbers set a new record at 274,600 colonies, up 3.2 per cent from the 2010 total of 266,000. Preliminary statistics indicate that while Alberta accounts for a relatively small percentage of the nation’s total beekeepers, it had about 43.3 per cent of the honey producing colonies in Canada. Alberta produced more honey in 2011 than was previously estimated. Final estimates show total production at 34.1 million pounds, compared to the preliminary fall 2011 estimate of 31.8 million pounds. The 2011 production is the fourth highest on record, and represents a 1.5 per cent decrease from 2010. The decline in production was the result of several factors, including a long winter, a rainy spring and increased splitting of colonies. Subsequently, the yield per colony was down 4.6 per cent to 124 pounds, compared to 2010. Preliminary estimates by Statistics Canada peg total Canadian honey production in 2011 at 78.1 million pounds, compared to 82.1 million pounds a year earlier. Based on the preliminary estimates, Alberta accounts for 40.7 per cent of the nation’s honey production. Within the province, the North West region produced the highest amount of honey in 2011 (see tables 2 and 4). The region produced 12.3 million pounds of honey, or 36 per cent of the total provincial production of 34.1 million pounds. The Peace region was second with roughly 9.4 million pounds, (or 27.6 per cent), followed by the South with approximately 6.6 million pounds (or 19.3 per cent). The Central region had the lowest production with 2.2 million pounds (or 6.3 per cent), followed by the North East with 3.6 million pounds (or 10.6 per cent). It cannot be over emphasized that estimated honey production on a regional basis is directly tied to colony numbers and yield, hence, explaining the variation among regions. Beekeepers from various regions tend to move their bees from honey producing locations to Southern Alberta for Hybrid canola seed production. Thus, the honey yield of these colonies is reduced due to the high density of colonies per acre when used for pollination.
Just to note, the Alberta Beekeepers’ Survey included some questions regarding the pollination of crops. Based upon the survey results (which did not include all beekeepers involved in pollination activities), 29,728 colonies were rented for pollination in 2011, with an average rental charge of $144.23 per colony. For some producers, this was one strategy employed to diversify their incomes.

Table 2 - 2011 HONEY PRODUCTION ESTIMATE - ALBERTA
Number of Number of Honey Yield Total Honey
Registered Producing Per Colony Produced
Region Beekeepers Colonies lbs kg lbs tonnes
South 101 83,948 78 35 6,556,706 2,974
Central 216 22,501 96 43 2,149,770 975
North East 107 26,111 139 63 3,617,803 1,641
North West 274 75,757 163 74 12,320,331 5,588
Peace 100 66,283 142 64 9,405,790 4,266
Province 798 274,600 124 56 34,050,400 15,445
Note: Yield and honey production rounded to the nearest pound, kilogram or tonne. Totals may not add due to rounding.
Source: Alberta Agriculture and Rural Development, Economics and Competitiveness Division, Statistics and Data Development Branch
2011 REGIONAL DISTRIBUTION OF ALBERTA'S ESTIMATED HONEY PRODUCTION(SELECTED HONEY STATISTICS)
South
Central
North East
North West
Peace
Province
0
100
200
300
400
500
600
700
800
900
Number of Active Beekeepers
South
Central North East
North West Peace
Province
0
50
100
150
200
250
300
Number of Producing Colonies ('000)
South
Central
North East
North West
Peace Province
0
20
40
60
80
100
120
140
160
180
200
Average Honey Yield Per Colony (Pounds)
South
Central North East
North West Peace
Province
0
5
10
15
20
25
30
35
40
Honey Production (Million Pounds)
-8-

1. South
2. Central
3. North East
4. North West
5. Peace
Hanna(S.A. 2)
Oyen(S.A. 3)
Consort(S.A. 4)
Grande Prairie(Co. 1)
Vulcan(Co. 2)
Ponoka (Co. 3)
Newell(Co. 4)
Warner(Co. 5)
Stettler(Co. 6)
Thor-hild
(Co. 7)
Forty Mile(Co. 8)
Beaver(Co.9)
Wetaskiwin (Co. 10)
Barrhead(Co. 11)
Athabasca(Co. 12)
SmokyLake
(Co. 13)
Lacombe (Co. 14)
Wheatland(Co. 16)
Mountain View(Co. 17)
Paintearth(Co. 18)
St. Paul(Co.19)
Strath-cona
(Co. 20)
Two Hills (Co. 21)
Camrose(Co. 22)
Red Deer (Co. 23)
VermilionRiver
(Co. 24)Leduc (Co. 25)
Lethbridge(Co. 26)
Minburn(Co. 27)
Lac Ste. Anne(Co. 28)
Flagstaff (Co. 29)
Lamont (Co. 30)
Parkland (Co. 31)
Lac la Biche County
CypressCounty
CardstonCounty
Bighorn(MD 8)
PincherCreek(MD 9)
Taber(MD 14)
WoodlandsCounty
Greenview (MD 16)
Opportunity (MD 17)
BirchHills
(MD 19)
Saddle Hil lsCounty
Clear Hills (MD 21)
Northern Lights (MD 22)
Mackenzie (MD 23)
WillowCreek
(MD 26)
Foothills(MD 31)
Acadia(MD 34)
Rocky View(MD 44)
StarlandCounty
KneehillCounty
Provost(MD 52)
Wainwright(MD 61)
Ranchland(MD 66)
Brazeau(MD 77)
Bonnyville(MD 87)
SturgeonCounty
WestlockCounty
Yellowhead County
Clearwater (MD 99)
Lesser Slave River(MD 124)
SmokyRiver
(MD 130)
Northern Sunrise(MD 131)
MD133
MD135Fairview
(MD 136)
M.D.of
Big Lakes
Wood Buffalo (Regional)
Kananaskis(ID 5)
Jasper ID
ID 4
Banff Park (ID 9)
Jasper Park(ID 12)
Wood Buffalo Park(ID 24)
WillmoreWilderness
(ID 25)
Calgary
Ed
Crowsnest Pass
ARD Regions (2012)
Government of AlbertaAgriculture and Rural Development
1
2
3
4
5
-9-

-10-
South Region* Legal Name AMC Reference Cardston County ------- M.D. No. 6 Crowsnest Pass ------- Crowsnest Pass Cypress County ------- M.D. No. 1 Foothills No. 31 MD 31 M.D. No. 31 Forty Mile County No. 8 CO 8 County No.8 Lethbridge County ------- County No. 26 Newell County No. 4 CO 4 County No. 4 Pincher Creek No. 9 MD 9 M.D. No. 9 Ranchland No. 66 MD 66 M.D. No. 66 Taber MD M.D. No. 14 Vulcan County ------- County No. 2 Warner County No. 5 CO 5 County No. 5 Wheatland County ------- County No. 16 Willow Creek No. 26 MD 26 M.D. No. 26
Central Region* Legal Name AMC Reference Acadia No. 34 MD 34 M.D. No. 34 Bighorn No. 8 MD 8 M.D. No. 8 Calgary ------- Calgary Clearwater County ------- M.D. No. 99 Kneehill County ------- M.D. No. 48 Lacombe County ------- County No. 14 Mountain View County ------- County No. 17 Paintearth County No. 18 CO 18 County No. 18 Ponoka County ------- County No. 3 Red Deer County ------- County No. 23 Rocky View No. 44 MD 44 M.D. No. 44 Special Area No. 2 SA 2 S.A. No. 2 Special Area No. 3 SA 3 S.A. No. 3 Special Area No. 4 SA 4 S.A. No. 4 Starland County ------- M.D. No. 47 Stettler County No. 6 CO 6 County No. 6
North West Region* Legal Name AMC Reference Athabasca County No. 12 CO 12 County No. 12 Barrhead County No. 11 CO 11 County No. 11 Brazeau No. 77 MD 77 M.D. No. 77 Edmonton ------- Edmonton Lac Ste. Anne County ------- County No. 28 Leduc County ------- County No. 25 Lesser Slave River No. 124 MD 124 M.D. No. 124 Parkland County ------- County No. 31 Strathcona County ------- County No. 20 Sturgeon County ------- M.D. No. 90 Thorhild County No. 7 CO 7 County No. 7 Westlock County ------- M.D. No. 92 Wetaskiwin County No. 10 CO 10 County No. 10 Woodlands County ------- M.D. No. 15 Yellowhead County ------- M.D. No. 94
Peace Region* Legal Name AMC Reference Big Lakes MD M.D. BGL Birch Hills County ------- M.D. No. 19 Clear Hills No. 21 MD 21 M.D. No. 21 Fairview No. 136 MD 136 M.D. No. 136 Greenview No. 16 MD 16 M.D. No. 16 Grande Prairie County No. 1 CO 1 County No. 1 Mackenzie No. 23 MD 23 M.D. No. 23 Northern Lights No. 22 MD 22 M.D. No. 22 Northern Sunrise County -------- M.D. No. 131 Peace No. 135 MD 135 M.D. No. 135 Saddle Hills County ------- M.D. No. 20 Smoky River No. 130 MD 130 M.D. No. 130
Spirit River No. 133 MD 133 M.D. No 133
AMC – Abbreviated Municipality Code Reference – Prior Legal Name * Alberta Agriculture and Rural Development regional boundaries no longer exist; however, these have been maintained to facilitate historical comparisons.
North East Region* Legal Name AMC Reference Beaver County ------- County No. 9 Bonnyville No. 87 MD 87 M.D. No. 87 Camrose County No. 22 CO 22 County No. 22 Flagstaff County ------- County No. 29 Lakeland County ------- M.D. No. 87 Lamont County ------- County No. 30 Minburn County No. 27 CO 27 County No. 27 Opportunity No. 17 MD 17 M.D. No. 17 Provost No. 52 MD 52 M.D. No. 52 Smoky Lake County ------- County No. 13 St. Paul County No. 19 CO 19 County No. 19 Two Hills County No. 21 CO 21 County No. 21 Vermilion River County No. 24 CO 24 County No. 24 Wainwright No. 61 MD 61 M.D. No. 61

Table 3 - ALBERTA HONEY STATISTICS, 1992-2011
No. of No. of Production Yield per Colony No. of ColoniesYear Beekeepers Colonies ('000 pounds) (pounds) Per Beekeeper
1992 800 148,000 23,088 156 1851993 761 148,000 23,745 160 1941994 750 159,000 31,005 195 2121995 750 175,000 21,306 122 2331996 750 175,000 20,215 116 2331997 725 175,000 23,625 135 2411998 730 205,000 38,335 187 2811999 725 205,000 24,805 121 2832000 747 217,000 24,087 111 2902001 739 227,000 26,786 118 3072002 702 227,000 29,737 131 3232003 754 221,000 27,846 126 2932004 693 248,000 33,480 135 3582005 728 251,000 31,877 127 3452006 733 254,000 46,736 184 3472007 726 237,000 28,914 122 3262008 620 226,000 25,990 115 3652009 683 251,000 29,116 116 3672010 769 266,000 34,580 130 3462011 798 274,600 34,050 124 344
Alberta Honey Production, Yield, Beekeepers and Colonies, 1992-2011
Source: Alberta Agriculture and Rural Development, Economics and Competitiveness Division, Statistics and Data Development Branch
80100120140160180200220
914192429343944
Yield
per
Colony
(Po
unds
)
Prod
uction
(M
illion
poun
ds)
Honey Production and Yield
Production Yield Per Colony
130150170190210230250270
600
850
Num
ber
of C
olon
ies
('00
0)
Num
ber
of B
eeke
eper
s
Beekeepers and Colonies
Number of Beekeepers Number of Colonies
-11-

-12-
Table 4 - HONEY PRODUCTION BY REGION IN ALBERTA (2004-2011)
Region 2004 2005 2006 2007 2008 2009 2010 2011
Number of Active Beekeepers
South 87 90 90 94 90 94 94 101Central 138 150 151 141 128 147 176 216North East 106 117 115 110 87 96 118 107North West 252 255 262 267 227 244 274 274Peace 110 116 115 114 88 102 107 100
Province 693 728 733 726 726 683 769 798
Number of Producing Colonies
South 57,861 66,923 65,671 66,895 66,901 66,934 73,039 83,948Central 20,885 17,100 18,240 17,819 17,604 19,611 20,742 22,501North East 33,858 33,297 30,799 27,780 25,439 26,689 27,682 26,111North West 64,968 68,564 73,076 64,480 63,546 74,209 73,183 75,757Peace 70,427 65,116 66,213 60,026 52,510 63,558 71,354 66,283
Province 248,000 251,000 254,000 237,000 226,000 251,000 266,000 274,600
Average Yield (pounds per colony)
South 50 60 117 72 49 64 92 78Central 131 142 198 103 76 144 130 96North East 147 129 225 139 160 154 156 139North West 162 175 253 164 137 122 154 163Peace 175 140 152 131 164 140 134 142
Province 135 127 184 122 115 116 130 124
Honey Production ('000 pounds)
South 2,905 4,036 7,702 4,842 3,306 4,250 6,745 6,557Central 2,740 2,430 3,611 1,827 1,334 2,829 2,704 2,150North East 4,978 4,306 6,928 3,850 4,058 4,106 4,323 3,618North West 10,539 12,015 18,455 10,551 8,700 9,043 11,243 12,320Peace 12,318 9,090 10,040 7,844 8,591 8,887 9,565 9,406
Province 33,480 31,877 46,736 28,914 25,990 29,116 34,580 34,050
Note: Some totals may not add up due to rounding.Source: Alberta Agriculture and Rural Development, Economics and Competitiveness Division, Statistics and Data Development Branch