beer's- lambert law and standard curves
TRANSCRIPT

BCH 312 [Practical]
Beer's- Lambert Law and Standard Curves
Spectrophotometer:
Spectrophotometer can be used to measure the amount of light absorbed or transmitted by a solution.
It consist of two parts: spectrometer and photometer.
By using the spectrophotometer, we can quantitatively measure absorbance, and this information can be
used to determine the concentration of the absorbing molecule.
More concentrated solution will absorb more light and transmits less.
So:
➢ the more concentrated solution high absorbance value.
➢And Less concentrated solution less absorbance value.

Cont’
Wavelength in this instrument divided into:
1. Invisible range-ultraviolet- (from 100 to 360 nm).
2. Visible range (above 360 nm -700 nm).
Blank: contain everything except the compound to be measured.
Beer-Lambert law:
Principle:
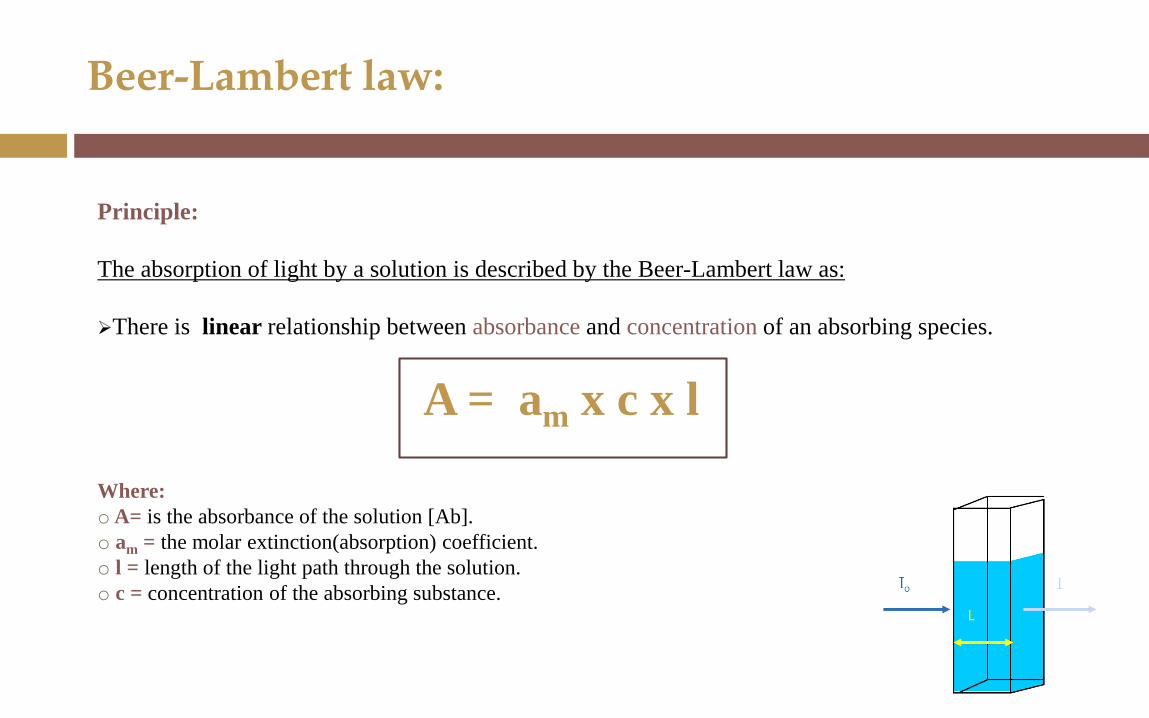
The absorption of light by a solution is described by the Beer-Lambert law as:
➢There is linear relationship between absorbance and concentration of an absorbing species.
A = am x c x l
Where:
oA= is the absorbance of the solution [Ab].
o am = the molar extinction(absorption) coefficient.
o l = length of the light path through the solution.
o c = concentration of the absorbing substance.

Cont’
From the law we observe :
1. Direct relationship between C and A.
2. Direct proportional between l and A.
➢If we plot absorbance against concentration, we get a straight line.
➢The linear relationship between concentration and absorbance is both simple and straightforward.
Which is why we prefer to express the Beer-Lambert law using absorbance as a measure of the
concentration rather than %T ( % transmittance).

Standard curve for concentrations:
➢It is a graph that shows the relationship between different known concentrations of a substance and the
absorbance at a specific wave length.
➢Standard curve are most commonly used to determine the concentration of a substance, using serial
dilution of solutions (Standard solutions) of known concentrations.
What is standard solutions:
Is a solution containing a precisely known concentration of an
element or a substance.
➢A series of known standard solutions can be Prepare by diluting the
stock known solution.
(We should calculate the concentration of the diluted solution by the
formula: C1 X V1 = C2 X V2 )

Some points to consider:
1. The Ab of solution with “unknown concentration” must be lower than highest Ab value in standard Curve.
[ the absorbance of solution with “unknown concentration”, is within the rang of absorbance values of solution with “known concentration solutions”].
2. If your unknown sample had an absorbance higher the highest absorbance recorded by standard [out of the rang], how will you determine its concentration correctly ?
Two choices:
A. Increase the concentration of standard solution.
B. Dilute the solution with “unknown concentration” measure the Ab after dilution then determine its concentration from the curve then multiply the value by Dilution factor.
3. If there is insufficient volume the light may pass over the solution instead of going through it.
4. Absorbance has no units.
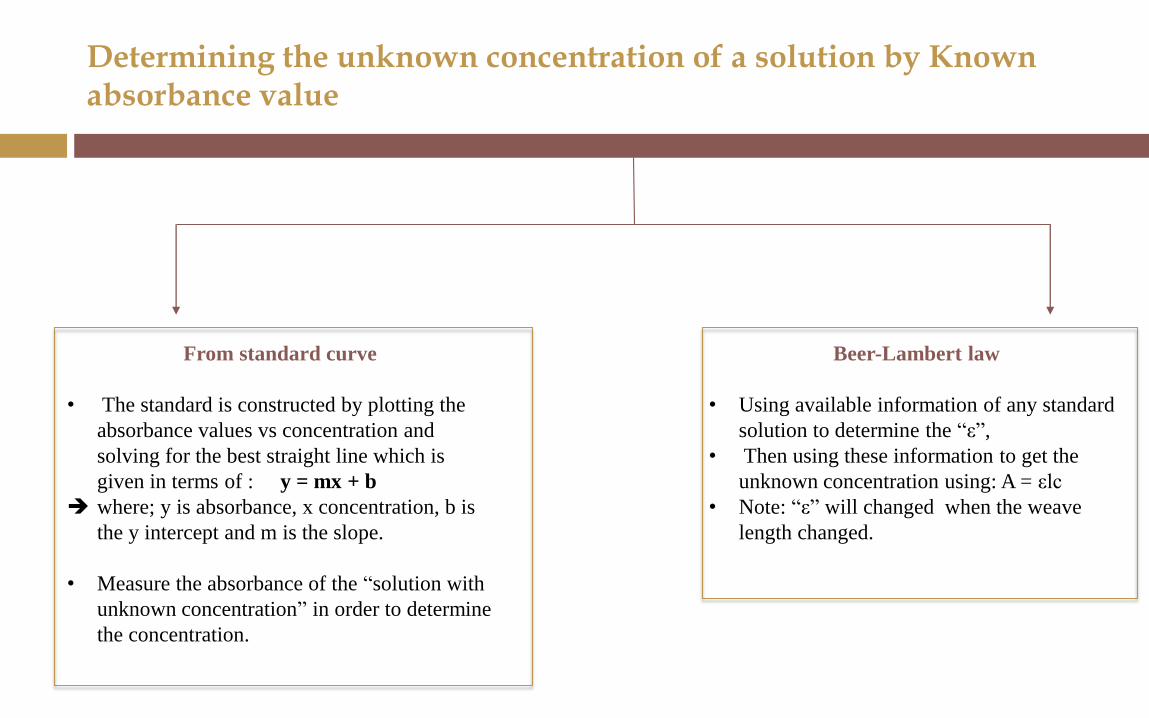
Determining the unknown concentration of a solution by Known absorbance value
From standard curve
• The standard is constructed by plotting the
absorbance values vs concentration and
solving for the best straight line which is
given in terms of : y = mx + b
where; y is absorbance, x concentration, b is
the y intercept and m is the slope.
• Measure the absorbance of the “solution with
unknown concentration” in order to determine
the concentration.
Beer-Lambert law
• Using available information of any standard
solution to determine the “ε”,
• Then using these information to get the
unknown concentration using: A = εlc
• Note: “ε” will changed when the weave
length changed.

Practical Part
Objectives:
To understand the concept of Beer-Lambert law and its application.
Getting familiar with standard curve.
Determination of an unknown concentration for a solution.

Method:
You are provided by:
1. Standard solution (Stock solution) of Copper Sulfate with 0.1 M [known concentration].
2. Solution with Unknown concentration "A".
3. Solution with Unknown concentration "B".
Set up 8 test tubes, as following table:
Tube 0.1M Copper Sulfate
Standard Solution (ml)
Distal water
(ml)
Solutions with unknown concentration
(ml)
Blank - 10 ml -
A 2ml 8ml -
B 4ml 6ml -
C 6ml 4ml -
D 8ml 2ml -
E 10ml - -
Solution "A" - - 10 ml
Solution "B" - - 10 ml
Mix the contents using the vortex.
Measure the absorbance of each tube at 600 nm against the blank[………………..….].

Results:
Calculate the concentrations of the series of known standard solutions.
Plot the standard curve (Absorbance vs. Concentration), determine the concentration of unknown
from graph.
Determine the concentration of Solution "A" and "B".
1) from standard curve
2) using Beer-Lambert law
Tube Absorbance at
600nm
Concentration M
A
B
C
D
E
Solution "A" From the curve=
Solution "B" From the curve=