before doing comparative research with sem … prof. jarosław górniak institute of sociology...
Post on 21-Dec-2015
213 views
TRANSCRIPT

Before doing comparative research with SEM …
Prof. Jarosław Górniak
Institute of Sociology
Jagiellonian University
Krakow

What is worth to consider
Think about your theory Check your data Explore your data Build your model carefully Think about survey error:
Systematic => Are the country samples representative? Is the non-response properly addressed?
Sampling variance => Is it computed properly? Consequently: are our model tests properly computed?
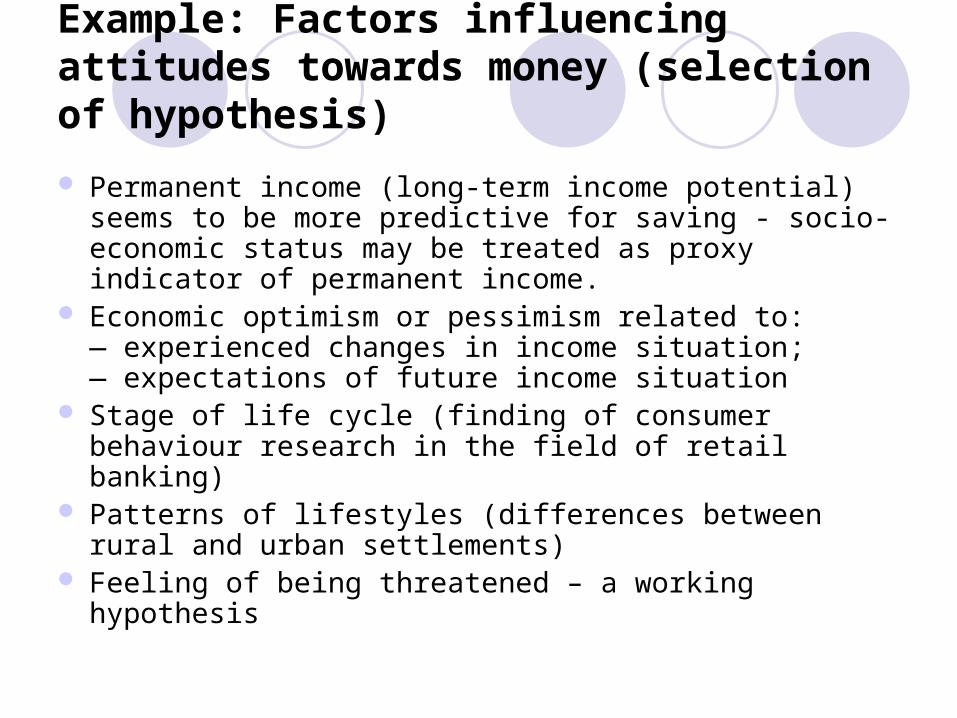
Example: Factors influencing attitudes towards money (selection of hypothesis)
Permanent income (long-term income potential) seems to be more predictive for saving - socio-economic status may be treated as proxy indicator of permanent income.
Economic optimism or pessimism related to: — experienced changes in income situation;— expectations of future income situation
Stage of life cycle (finding of consumer behaviour research in the field of retail banking)
Patterns of lifestyles (differences between rural and urban settlements)
Feeling of being threatened – a working hypothesis

Exploratory data analysis – theory driven insight into data
-0.6 -0.4 -0.2 0.2 0.4 0.6 0.8
-0.6
-0.4
-0.2
0.2
0.4
0.6
0.8
A good custom: don't borrowCredit is rather necessary evil
Credit - unresonable
G. custom: Don't borrow!Buy for money you have
Credit is dangerous
Credit = bad economy
Credit - yes if business
Would like to buy for instalment
Better to take loan than save
Rather spends than saves
Saving is resonable
Spending more attractingSavers don't enjoy life
Better to invest with risk
Respect for savers
Better cash at home
Try to put money aside
Prone to risk if profits
Children should learn saving
18-25
26-35 36-45 46-55
56-65
66+
Element.
Voational
Full second.Prof. college
Higher
Business/Professional
White collar
Blue collar/farmer
Pensioner
Student
Other not work.
Bank 1/week
Bank 1/monthBank less often
Bank not in last year
Savings book
Current account
Fixed deposits PLN

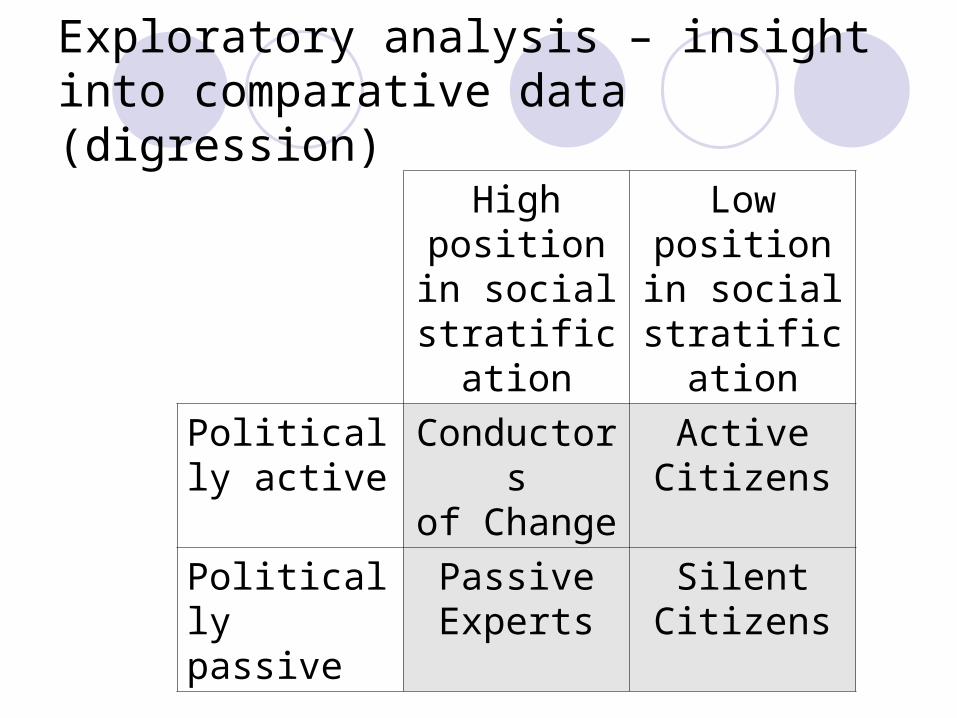
Exploratory analysis – insight into comparative data (digression)
Factor Loadings (PCA) of Attitude Scales for Pooled Sample 1994-1995of ten Central and Eastern European Countries
Factor 1
Fa
cto
r 2
Leftism
AuthoritarianismNationalism
Business Aptitute
Political Mobil.
Economic Optimism
-0,4
-0,2
0,0
0,2
0,4
0,6
0,8
1,0
-0,8 -0,6 -0,4 -0,2 0,0 0,2 0,4 0,6 0,8 1,0

Exploratory analysis – insight into comparative data (digression)
Mean Factor Scores (PCA) for CountriesPooled Sample 1994-1995
Factor 1: National Socialism?
Fa
cto
r 2
: Act
ivis
m Poland 94
Poland 95 Hungary 94
Czech 94Czech Re 95
Slovakia 94
Slovakia 95
Estonia 94
Estonia 95
Latvia 94
Latvia 95Lithuani 94
Lithuani 95
Russia 94
Russia 95
Ukraine 94 Ukraine 95
Belarus 94Belarus 95
Bulgaria 95
Romania 95
-0,4
-0,2
0,0
0,2
0,4
-0,8 -0,6 -0,4 -0,2 0,0 0,2 0,4 0,6
Exploratory analysis – insight into comparative data (digression)
Highposition in
social stratification
Lowposition in
social stratification
Politically active
Conductorsof Change
ActiveCitizens
Politically passive
PassiveExperts
SilentCitizens

Political Actors in ten Countries (1994)Positioning in PSE Model factor space
Factor 1: National Socialism
Fa
cto
r 2
: E
con
om
ic &
Po
litic
al A
ctiv
ism
Conductors of ChangeACTORS:
Pol
Hun
CzechSlov
LatLit
Rus
UkrBel
-0,6
-0,4
-0,2
0,0
0,2
0,4
0,6
0,8
-1,4 -0,8 -0,2 0,4 1,0
Passive ExpertsACTORS:
PolHun
Czech
SlovEst
LatLit Rus
Ukr Bel
-1,4 -0,8 -0,2 0,4 1,0
Active CitizensACTORS:
PolHun
CzechSlov
Est
Lat
Lit Rus
Ukr
Bel
-0,6
-0,4
-0,2
0,0
0,2
0,4
0,6
0,8
-1,4 -0,8 -0,2 0,4 1,0
Silent CitizensACTORS:
Pol
Hun
Czech
SlovEstLatLit Rus
Ukr
Bel
-1,4 -0,8 -0,2 0,4 1,0
Est
Exploratory analysis – insight into comparative data (digression)
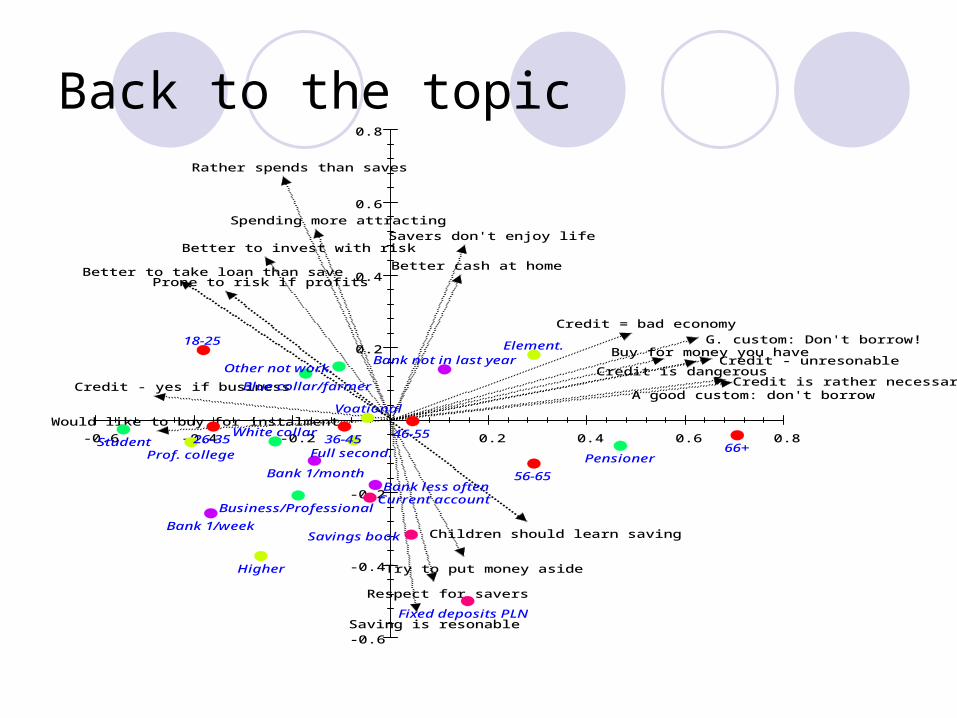
Back to the topic
-0.6 -0.4 -0.2 0.2 0.4 0.6 0.8
-0.6
-0.4
-0.2
0.2
0.4
0.6
0.8
A good custom: don't borrowCredit is rather necessary evil
Credit - unresonable
G. custom: Don't borrow!Buy for money you have
Credit is dangerous
Credit = bad economy
Credit - yes if business
Would like to buy for instalment
Better to take loan than save
Rather spends than saves
Saving is resonable
Spending more attractingSavers don't enjoy life
Better to invest with risk
Respect for savers
Better cash at home
Try to put money aside
Prone to risk if profits
Children should learn saving
18-25
26-35 36-45 46-55
56-65
66+
Element.
Voational
Full second.Prof. college
Higher
Business/Professional
White collar
Blue collar/farmer
Pensioner
Student
Other not work.
Bank 1/week
Bank 1/monthBank less often
Bank not in last year
Savings book
Current account
Fixed deposits PLN

General idea of the path model
Attitude toward saving
Attitude toward debt
Sense of being threatened
Socio-economic status- optimal scale
Age
z4
1
z1
z2
1
Size of settlement
Economic pessimism
z31
1

Attitude towards debt – one factor solution
,36In current situation it is
not reasonable to contracta credit
,43
Taking credits is onlya bad necessity
,24It is dangerous
to contract creditat a bank
,47Good custom - do not
borrow moneyfrom anybody
,31One should buy only formoney one owns, and
not for credit or instalment
,20Buying for credit or instalment
indicates bad moneymanagement
,13
I would like to buy forcredit or instalment
Chi sq. = 413,05p = ,00; Chi sq./df = 20,65
RMSEA = ,14; RMSEA D90 = ,13; RMSEA G90 = ,15Pr(RMSEA <= .05) = ,00GFI = ,89; AGFI = ,80
Hoelter's N (.05) = 76,00
,42
One shouldn't borrowmoney from anybody
d19
d18
d6
d24
d25
d22
d13
d17
No debt
,60
,65
,49
,55
,45
-,37
,68
,64

Attitude towards debt – three factors solution
,51In current situation it is
not reasonable to contracta credit
,57
Taking credits is onlya bad necessity
,33It is dangerous
to contract creditat a bank
,56Good custom - do not
borrow moneyfrom anybody
,61One should buy only formoney one owns, and
not for credit or instalment
,32Buying for credit or instalment
indicates bad moneymanagement
,28
I would like to buy forcredit or instalment
No credits
No instalments
,72
,76
,58
,78
,57
-,53
Chi sq. = 54,93p = ,00; Chi sq./df = 3,23
RMSEA = ,05; RMSEA D90 = ,03; RMSEA G90 = ,06Pr(RMSEA <= .05) = ,60GFI = ,99; AGFI = ,97
Hoelter's N (.05) = 502,00
,50
One shouldn't borrowmoney from anybody
d19
d18
d6
d24
d25
d22
d13
d17
Don't borrow
,75
,71
,70
,66
,45

,57In current situation it is
not reasonable to contracta credit
,55
Taking credits is onlya bad necessity
,34It is dangerous
to contract creditat a bank
,46Good custom - do not
borrow moneyfrom anybody
,64One should buy only formoney one owns, and
not for credit or instalment
,32Buying for credit or instalment
indicates bad moneymanagement
,28
I would like to buy forcredit or instalment
,62
No credits
,50
No instalments
,76
,74
,59
,80
,56
-,53
Chi sq. = 91,52p = ,00; Chi sq./df = 4,82
RMSEA = ,06; RMSEA D90 = ,05; RMSEA G90 = ,07Pr(RMSEA <= .05) = ,06GFI = ,98; AGFI = ,96
Hoelter's N (.05) = 329,00
,54
One shouldn't borrowmoney from anybody
d19
d18
d6
d24
d25
d22
d13
d17
,73
Don't borrow
Z1
Z2
,68
,74
No debt,85
Z3,79
,71
Attitude towards debt – hierarchical CFA

Psychographics – problem with correlated error terms
„How, in your opinion, has the economic situation changed in Poland in the last 12 months?"
„Do you think that in the next 12 months the economic situation in Poland will be:"
„Comparing your current financialsituation with a year ago,
would you say that the situatiom today is:"
„What changes do you expect in yourliving standard in the next 12 months"
„I often fear when I think about my future”
„I'm really concerned about myliving standard in the future”
„I'm afraid that I can have an accident”
„I fear that my flat may be broken into”
Economic pessimism
,58
,58
,67
,70
Sense of beingthreatened
,56
,81
,38
,22
,40
d_v1,81
d_v2,82
d_v6,74
d_v7,72
d17.5,83
d18.2,59
d18.3,92
d18.6,98
Chi sq. = 75,68df= 17 p = ,00; Chi kw./ss = 4,45
RMSEA = ,06;Pr(RMSEA <= .05) = ,13
GFI = ,98; AGFI = ,96,31
,30

Structural model – non-correlated error terms
,48
Prodigality
,18
Affirmation of saving as a norm
,38
Aversion towardscredits
,31Aversion towards
buyingon instalment,62
Aversion towardsborrowing money
in general
,10
Pronenessto save money
,23
General aversiontowards debt
-,69
,43
,61,56
,79
d1
d2
d3
d4
d5
,11
Sense of being threatened
Socio-economicstatus -
optimal scale
Age
,03z5
,11
,26
z1
,27,22
-,10
z2
Size of settlement-,11
-,32
,18
Economicpessimism
z3
,13
-,14
-,12
,33
Chi sq. = 456,24df= 91 p = ,00; Chi kw./ss = 5,01
RMSEA = ,06;Pr(RMSEA <= .05) = ,00GFI = ,94; AGFI = ,92
Hoelter's N (.05) = 250,00
,23
-,24
-,13
,47How... economicsituation changed
in ... last 12 m.
d6,47
in the next 12 m.economic situation
in PL will be:
d7
,69
,38Comparing yourcurrent fin. sit.with a year ago
d8
,62
,42What changes
...expect in yourliving standard...
d9
,08I fear that
my flat maybe broken into
d13
,28,19
I'm afraidthat I can have
an accident
d12
,44,57I'm really concernedabout my living std
in the future”
d11
,75,34I often fearwhen I think
about my future
d10
,58
,69 ,65
-,03

Hybrid model – using parcels in SEM
Hybrid model: includes a combination of latent and observed variables
Parcels are indexes computed by summing or averaging 2 or more items More reliable than items More normally distributed than items Usually higher loadings and better fit Less problems with identification, especially compared with
hierarchical factor models The use of parcels is controversial Is less controversial if scaling diagnostics is done:
Using parcels you better check for unidimensionality Using parcels check in FA if the loadings of the items are similar Determine reliability

Structural model – correlated error terms
,48
Prodigality
,18
Affirmation of saving as a norm
,38
Aversion towardscredits
,31Aversion towards
buyingon instalment,62
Aversion towardsborrowing money
in general
,10
Pronenessto save money
,22
General aversiontowards debt
-,69
,42
,61,56
,79
d1
d2
d3
d4
d5
,11
Sense of being threatened
Socio-economicstatus -
optimal scale
Age
-,01z5
,10
,27
z1
,28,21
-,10
z2
Size of settlement-,10
-,33
,20
Economicpessimism
z3
,19
-,14
-,13
,32
Chi sq. = 302,85df = 88 p = ,00; Chi kw./ss = 3,44
RMSEA = ,05;Pr(RMSEA <= .05) = ,55GFI = ,96; AGFI = ,94
Hoelter's N (.05) = 366,00
,23
-,24
-,13
,28How... economicsituation changed
in ... last 12 m.
d6,29
in the next 12 m.economic situation
in PL will be:
d7
,54
,50Comparing yourcurrent fin. sit.with a year ago
d8
,71
,59What changes
...expect in yourliving standard...
d9
,04I fear that
my flat maybe broken into
d13
,20,14
I'm afraidthat I can have
an accident
d12
,38,66I'm really concernedabout my living std
in the future”
d11
,81,32I often fearwhen I think
about my future
d10
,56
,53 ,77
,36
,31
-,03
-,17

SEM are not causal models
,50
Prodigality
,18Affirmationof saving
as a norm
,37
Aversion towardscredits
,31Aversion towards
buyingon instalment,62
Aversion towardsborrowing money
in general
,15
Pronenessto save money
,17
General aversiontowards debt
-,70
,42
,61,56
,79
d1
d2
d3
d4
d5
,14
Sense of being threatened
,75Socio-economic
status -optimal scale
Agez5
z1
,19
z2
,21
Economicpessimism
z3-,12
,31
Chi sq. = 307,13df= 88 p = ,00; Chi kw./ss = 3,49
RMSEA = ,05;Pr(RMSEA <= .05) = ,49GFI = ,96; AGFI = ,94
Hoelter's N (.05) = 361,00,28
How... economicsituation changed
in ... last 12 m.
d6,30
in the next 12 m.economic situation
in PL will be:
d7
,54
,50Comparing yourcurrent fin. sit.with a year ago
d8
,71
,59What changes
...expect in yourliving standard...
d9
,04I fear that
my flat maybe broken into
d13
,21,14
I'm afraidthat I can have
an accident
d12
,38,66I'm really concernedabout my living std
in the future”
d11
,81,32I often fearwhen I think
about my future
d10
,56
,53 ,77
SES
,17
-,07
-,38
-,17
d15
,87
Size of settlement,18
,20
,33
-,03
-,07
-,28
-,15
-,03
,36 -,16
,31
,23

Single indicator constructs – using reliability information
Using single indicator (like SES scale): fix the variance of indicator error term at the
level =(1-alpha)*variance of the indicator If the scale is standardised (automatically done
in optimal scaling like MCA) – the formula simplifies
Fix the loading of this indicator at 1
The reliability information can be used in terms of any indicator with known reliability

Structural model – using known reliability of the scale
Prodigality
Affirmationof saving
as a norm
Aversion towardscredits
Aversion towardsbuying
on instalment
Aversion towardsborrowing money
in general
Pronenessto save money
General aversiontowards debt
1
1
d11
d21
d31
d41
d51 Sense of being
threatened
Socio-economicstatus -
optimal scale
Agez5
z11
z2
1
Economicpessimism
z3
1
How... economicsituation changed
in ... last 12 m.
d6
in the next 12 m.economic situation
in PL will be:
d7
1
Comparing yourcurrent fin. sit.with a year ago
d8
1
What changes...expect in yourliving standard...
d91
I fear thatmy flat may
be broken into
d13
1
1I'm afraid
that I can havean accident
d12
1
I'm really concernedabout my living std
in the future”
d11
1
I often fearwhen I think
about my future
d101
1
1
1
SES
0,25d15
1
Size of settlement
1

Structural model – using known reliability of the scale
,48
Prodigality
,18Affirmationof saving
as a norm
,37
Aversion towardscredits
,31Aversion towards
buyingon instalment,62
Aversion towardsborrowing money
in general
,11
Pronenessto save money
,23
General aversiontowards debt
-,69
,42
,61,56
,79
d1
d2
d3
d4
d5
,14
Sense of being threatened
,75Socio-economic
status -optimal scale
Agez5
z1
,20
z2
,20
Economicpessimism
z3-,12
,31
Chi sq. = 302,86df= 88 p = ,00; Chi kw./ss = 3,44
RMSEA = ,05;Pr(RMSEA <= .05) = ,55GFI = ,96; AGFI = ,94
Hoelter's N (.05) = 366,00
,24
,28How... economicsituation changed
in ... last 12 m.
d6,29
in the next 12 m.economic situation
in PL will be:
d7
,54
,50Comparing yourcurrent fin. sit.with a year ago
d8
,71
,59What changes
...expect in yourliving standard...
d9
,04I fear that
my flat maybe broken into
d13
,20,14
I'm afraidthat I can have
an accident
d12
,38,66I'm really concernedabout my living std
in the future”
d11
,81,32I often fearwhen I think
about my future
d10
,56
,53 ,77
SES
,13
-,11
-,38
-,17d15
,87
Size of settlement
,18
,27
,27
-,03
-,10
-,28
-,15
-,03
,36 -,18
,31

Prodigality
Affirmationof saving
as a norm
Aversion towardscredits
Aversion towardsbuying
on instalment
Aversion towardsborrowing money
in general
Pronenessto save money
General aversiontowards debt
1
1
0,24d1
1
0,216d2
1
0,21d3
1
0,29d4
1
0,345d5
1 Sense of being threatened
Socio-economicstatus -
optimal scale
Agez5
z11
z2
1
Economicpessimism
z3
1
How... economicsituation changed
in ... last 12 m.
d6
in the next 12 m.economic situation
in PL will be:
d7
1
Comparing yourcurrent fin. sit.with a year ago
d8
1
What changes...expect in yourliving standard...
d91
I fear thatmy flat may
be broken into
d13
1
1
I'm afraidthat I can have
an accident
d12
1
I'm really concernedabout my living std
in the future”
d11
1
I often fearwhen I think
about my future
d10
11
1
1
SES
0,25d15
1
Size of settlement
1
Structural model – using known reliability of parcels
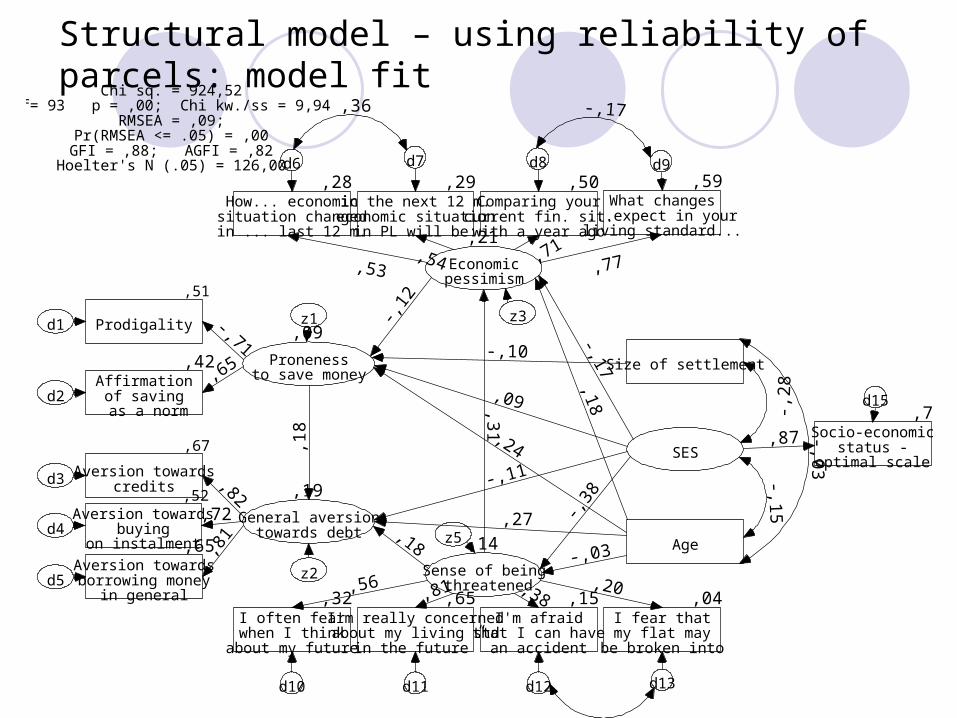
Structural model – using reliability of parcels: model fit
,51
Prodigality
,42Affirmationof saving
as a norm
,67
Aversion towardscredits
,52Aversion towards
buyingon instalment,65
Aversion towardsborrowing money
in general
,09
Pronenessto save money
,19
General aversiontowards debt
-,71
,65
,82,72
,81
d1
d2
d3
d4
d5
,14
Sense of being threatened
,75Socio-economic
status -optimal scale
Agez5
z1
,18
z2
,21
Economicpessimism
z3-,12
,31
Chi sq. = 924,52df= 93 p = ,00; Chi kw./ss = 9,94
RMSEA = ,09;Pr(RMSEA <= .05) = ,00GFI = ,88; AGFI = ,82
Hoelter's N (.05) = 126,00
,18
,28How... economicsituation changed
in ... last 12 m.
d6,29
in the next 12 m.economic situation
in PL will be:
d7
,54
,50Comparing yourcurrent fin. sit.with a year ago
d8
,71
,59What changes
...expect in yourliving standard...
d9
,04I fear that
my flat maybe broken into
d13
,20,15
I'm afraidthat I can have
an accident
d12
,38,65I'm really concernedabout my living std
in the future”
d11
,81,32I often fearwhen I think
about my future
d10
,56
,53 ,77
SES
,09
-,11
-,38
-,17
d15
,87
Size of settlement,18
,24
,27
-,03
-,10
-,28
-,15
-,03
,36 -,17
,31

Topics which are usually less considered in SEM context but are very important Complex samples and SEM
Sampling variance changed by clustering, stratification and weighting for non equal inclusion probabilities
Weighting not always available (like in AMOS) Non-response and SEM:
Item non-response – solutions exists Special estimation algorithms (like in AMOS) Imputation before analysis
Survey non-response Falling response rates – what populations we model? The non-response mechanism is not MAR (Missing
Completely at Random) Usual post-hoc solution is weighting for non-response but
not always possible in SEM (AMOS) Addressing systematic error increases sampling
variance, but this is not considered in popular SEM applications

Before doing comparative research with SEM…
Check if your theory is plausible Think about your model, construct definitions
and indicators before fieldwork Examine your data, also secondary data Explore your data with theoretical background Build your SEM model carefully Check alternative models Think about survey error and … do something
about it!