behavior of standard hook anchorage … reports...aci/aashto equations for the development length...
TRANSCRIPT

Un
ivers
ity o
f Flo
rid
a
C
ivil
an
d C
oast
al
En
gin
eeri
ng
University of Florida
Civil and Coastal Engineering
Final Report June 2008
BEHAVIOR OF STANDARD HOOK ANCHORAGE MADE WITH CORROSION RESISTANT REINFORCEMENT Principal investigator:
H. R. Hamilton III Research assistants:
Gianni G. Ciancone Antonis P. Michael Department of Civil and Coastal Engineering University of Florida P.O. Box 116580 Gainesville, Florida 32611 Sponsor: Florida Department of Transportation (FDOT) Marcus H. Ansley, P.E. – Project Manager Contract: UF Project No. 00005766 FDOT Contract No. BD 545-40

ii
DISCLAIMER The opinions, findings, and conclusions expressed in this publication are those of the
authors and not necessarily those of the State of Florida Department of Transportation.

iii
Technical Report Documentation Page 1. Report No.
2. Government Accession No.
3. Recipient's Catalog No.
5. Report Date
June 2008 4. Title and Subtitle Behavior of Standard Hook Anchorage with Corrosion Resistant
Reinforcement 6. Performing Organization Code
7. Author(s)
G. G. Ciancone, A. P. Michael, and H. R. Hamilton III 8. Performing Organization Report No.
00051711 10. Work Unit No. (TRAIS)
9. Performing Organization Name and Address University of Florida Department of Civil & Coastal Engineering P.O. Box 116580 Gainesville, FL 32611-6580
11. Contract or Grant No. BD 545-40
13. Type of Report and Period Covered Final Report
12. Sponsoring Agency Name and Address Florida Department of Transportation Research Management Center 605 Suwannee Street, MS 30 Tallahassee, FL 32301-8064
14. Sponsoring Agency Code
15. Supplementary Notes
16. Abstract The objective of this study was to evaluate the behavior of standard hooks that are made using corrosion resistant
reinforcement, which typically have higher yield and ultimate strengths than that of ASTM A615 Grade 60 reinforcement. Two steel types were evaluated in this research. The stainless steel was 316LN, which is a low-carbon austenitic stainless steel that has been nitrogen strengthened. The mechanical properties conformed to ASTM A955. The corrosion resistant bar was a low-carbon steel bar with chromium added and conformed to ASTM A1035. The impetus is that the current ACI/AASHTO equations for the development length of standard hooks do not directly address the use of high-strength steel bars that do not have a well-defined yield point or a relatively flat post-yield slope.
Hooked reinforcement is typically used to develop reinforcement in a relatively short distance and is usually associated with a nodal region of a strut and tie system. A test setup was devised that uses the strut and tie behavior of hooked anchorage to impose forces similar to those occurring in the structure. The specimen configuration and test setup were arranged to promote a splitting tension failure of the concrete in the plane of the hook, which is the typical behavior of hooked anchorage without ties. Single #5 and #7 bars were tested with either 90- or 180-deg standard hooks. Grade 60 reinforcement was first tested to ensure that the desired failure mode was achieved and that the ACI and AASHTO development length equations for hooks did indeed ensure that the reinforcement reached yield before the concrete failed. Stainless steel reinforcement with a yield strength over 100 ksi and corrosion resistant reinforcement with a yield strength over 120 ksi were also tested. Anchorage capacity ratios (ultimate load/specified yield load) were calculated for each of the specimens to determine the effectiveness of the development lengths. In addition, strain ductility ratios (strain at ultimate capacity/yield strain from bare bar tension test) were determined for each specimen to provide a basis for comparison. Finally, recommendations for adjusting the equation for hook development length were developed.
G17. Key Word Development Length, Standard Hook, Anchorage Capacity, Bond Strength, Ductility, Stainless Steel
Reinforcement
18. Distribution Statement No restrictions. This document is available to the public through the National Technical Information
Service, Springfield, VA, 22161
19. Security Classif. (of this report) Unclassified
20. Security Classif. (of this page) Unclassified
21. No. of Pages 111
22. Price
Form DOT F 1700.7 (8-72) Reproduction of completed page authorized

iv
ACKNOWLEDGMENTS
The authors would like to thank Florida Department of Transportation (FDOT) State
Materials Office and Structural Lab for their support in materials testing and bar bending.
Special thanks go to the University of Florida-Structural Laboratory personnel.
The authors would also like to thank VALBRUNA stainless steel, MMFX Technologies
Corp, FLORIDA ROCK Industries, and BARSPLICE Products Inc. for their contributions to this
research.

v
EXECUTIVE SUMMARY
The objective of this study was to evaluate the behavior of standard hooks that are made
using corrosion resistant reinforcement, which typically have higher yield and ultimate strengths
than that of ASTM A615 Grade 60 reinforcement. Two steel types were evaluated in this
research. The stainless steel was 316LN, which is a low-carbon austenitic stainless steel that has
been nitrogen strengthened. The mechanical properties conformed to ASTM A955. The
corrosion resistant bar was a low-carbon steel bar with chromium added and conformed to
ASTM A1035. The impetus is that the current ACI/AASHTO equations for the development
length of standard hooks do not directly address the use of high-strength steel bars that do not
have a well-defined yield point or a relatively flat post-yield slope.
Hooked reinforcement is typically used to develop reinforcement in a relatively short
distance and is usually associated with a nodal region of a strut and tie system. A test setup was
devised that uses the strut and tie behavior of hooked anchorage to impose forces similar to those
occurring in the structure. The specimen configuration and test setup were arranged to promote a
splitting tension failure of the concrete in the plane of the hook, which is the typical behavior of
hooked anchorage without ties. Single #5 and #7 bars were tested with either 90- or 180-deg
standard hooks. Grade 60 reinforcement was first tested to ensure that the desired failure mode
was achieved and that the ACI and AASHTO development length equations for hooks did indeed
ensure that the reinforcement reached yield before the concrete failed. Stainless steel
reinforcement with a yield strength over 100 ksi and corrosion resistant reinforcement with a
yield strength over 120 ksi were also tested. Anchorage capacity ratios (ultimate load/specified
yield load) were calculated for each of the specimens to determine the effectiveness of the
development lengths. In addition, strain ductility ratios (strain at ultimate capacity/yield strain
from bare bar tension test) were determined for each specimen to provide a basis for comparison.
Finally, recommendations for adjusting the equation for hook development length were
developed.

vi
TABLE OF CONTENTS EXECUTIVE SUMMARY ........................................................................................................................................vi 1 INTRODUCTION..............................................................................................................................................1 2 LITERATURE REVIEW..................................................................................................................................2
2.1 HOOK BEHAVIOR AND GEOMETRY..............................................................................................................2 2.2 CURRENT HOOK DESIGN PRACTICE ............................................................................................................4 2.3 STRUT AND TIE EVALUATION OF ANCHORAGE ...........................................................................................9
3 EXPERIMENTAL PROGRAM .....................................................................................................................12 3.1 SPECIMEN DESIGN...............................................................................................................................12 3.2 CONCRETE MIXTURE DESIGNS.........................................................................................................18 3.3 SPECIMEN CONSTRUCTION...............................................................................................................19 3.4 TEST SETUP ...........................................................................................................................................22 3.5 DATA ACQUISITION SETUP................................................................................................................25
4 RESULTS AND DISCUSSION ......................................................................................................................28 4.1 MATERIAL PROPERTIES .....................................................................................................................28 4.2 TEST RESULTS ......................................................................................................................................31
4.2.1 BEHAVIOR AND FAILURE MODES .................................................................................................31 4.2.2 ASTM A615 GRADE 60 SPECIMENS.................................................................................................34 4.2.3 STAINLESS STEEL SPECIMENS........................................................................................................42 4.2.4 MMFX SPECIMENS............................................................................................................................47
5 ANALYSIS OF RESULTS..............................................................................................................................52 5.1 EFFECT OF STRUT ANGLE ..................................................................................................................52 5.2 EFFECT OF BEND ANGLE....................................................................................................................53 5.3 ANCHORAGE CAPACITY ....................................................................................................................54 5.4 DUCTILITY.............................................................................................................................................57 5.5 DEVELOPMENT LENGTH EQUATION...............................................................................................61
6 SUMMARY AND CONCLUSIONS...............................................................................................................64 7 RECOMMENDATIONS.................................................................................................................................66 8 FUTURE RESEARCH ....................................................................................................................................68 9 REFERENCES.................................................................................................................................................68 APPENDIX A.............................................................................................................................................................71 APPENDIX B.............................................................................................................................................................73 APPENDIX C.............................................................................................................................................................98

vii
List of Figures FIGURE 1. HOOK USED TO DEVELOP BAR IN CANTILEVER BEAM....................................................... 3 FIGURE 2. TENSILE STRESSES IN #7 BAR WITH 90 DEG. STANDARD HOOK. (MARQUES AND JIRSA
(1975))..................................................................................................................................... 3 FIGURE 3. STANDARD HOOK DETAILS. ............................................................................................. 4 FIGURE 4. POINTS WHERE SLIP WAS MEASURED IN RESEARCH BY MARQUES AND JIRSA (1975)....... 5 FIGURE 5. COMPARISON OF HOOK PROVISIONS PROPOSED BY COMMITTEE 408 WITH THOSE IN ACI
318-77. .................................................................................................................................... 8 FIGURE 6. EXTENDED NODAL ZONE FOR STANDARD HOOK ANCHORAGE. .................................... 10 FIGURE 7. SCHEMATIC AND STRUT AND TIE MODEL OF TYPICAL USES OF A STANDARD HOOK
ANCHORAGE F.B.D (A) PIER CAP, (B) DEEP BEAM, AND (C) RETAINING WALL..................... 11 FIGURE 8. SPECIMEN CONFIGURATION AND STRUT AND TIE MODEL OF SPECIMEN USED IN MARQUES
AND JIRSA (1975) RESEARCH. ................................................................................................ 11 FIGURE 9. SPECIMEN DESIGN WITH IDEALIZED BOUNDARY CONDITIONS (A) UNCONFINED, (B)
CONFINED WITH STIRRUPS, (C) 90 DEG. HOOK, UNCONFINED WITH DEBONDED LENGTH, AND (D) 180 DEG. HOOK, UNCONFINED WITH DEBONDED LENGTH. ...................................................... 13
FIGURE 10. SPECIMEN DESIGN DETAILS FOR SERIES 1: (A) UNCONFINED SPECIMEN DETAILS AND (B) CONFINED SPECIMEN DETAILS. ............................................................................................... 14
FIGURE 11. SPECIMEN DESIGN FOR SERIES 2 THROUGH 5: (A) UNCONFINED SPECIMEN DETAILS FOR 90 DEGREE BEND AND (B) UNCONFINED SPECIMEN DETAILS FOR 180 DEGREE BEND. ............. 16
FIGURE 12. FORMWORK FOR CASTING SPECIMENS (A) PLAN VIEW, AND (B) SECTION. .................... 20 FIGURE 13. PHOTO OF FORMWORK READY FOR CONCRETE PLACEMENT......................................... 20 FIGURE 14. READY-MIXED CONCRETE BEING DISCHARGED INTO THE CONTAINER FOR
TRANSPORTING. ..................................................................................................................... 21 FIGURE 15. CASTING AND COMPACTION OF THE SPECIMEN (A), AND FINISHING OF SPECIMENS (B). 22 FIGURE 16. CURING OF THE SPECIMENS. ........................................................................................ 22 FIGURE 17. LOAD TEST SETUP (A) ELEVATION, (B) SECTION, AND (C) PHOTO. ................................ 23 FIGURE 18. SWAGED COUPLER SYSTEM.......................................................................................... 24 FIGURE 19. DETAILS OF SUPPORT CONDITIONS............................................................................... 25 FIGURE 20. POSITIONING OF SLIP WIRE IN HOOKED BAR. ................................................................ 25 FIGURE 21. BOND SLIP INSTRUMENTATION (A) DISPLACEMENT AND SLIP POSITION, (B) LINEAR
POTENTIOMETERS................................................................................................................... 26 FIGURE 22. LINEAR POTENTIOMETER PLACEMENT TO MEASURE BAR STRAIN................................. 27 FIGURE 23. DATA ACQUISITION SYSTEM. ....................................................................................... 27 FIGURE 24. STRESS-STRAIN CURVE OF STEEL WITH NO WELL-DEFINED YIELD POINT...................... 29 FIGURE 25. COMPARISON OF STRESS STRAIN CURVES FOR GR60, SS, AND MM BARS. .................. 31 FIGURE 26. PHOTO OF TYPICAL CRACK PATTERN AFTER CONCRETE SPLITTING FAILURE (A) TOP, (B)
SIDE, (C) REAR, AND (D) FRONT FACES. (MM_7_180_35_3).................................................. 32 FIGURE 27. DRAWING OF TYPICAL CRACK PATTERN AFTER CONCRETE SPLITTING FAILURE.
(MM_7_180_35_3)............................................................................................................... 33 FIGURE 28. CRUSHED CONCRETE INSIDE OF BEND RADIUS (A) 90 DEG. HOOK AND (B) 180 DEG.
HOOK. .................................................................................................................................... 33 FIGURE 29. LOAD-DISPLACEMENT PLOT FOR GR60 (A) #5, AND (B) #7.......................................... 35 FIGURE 30. LOAD-SLIP PLOT FOR SPECIMENS (A) 60_5_90_1 AND (B) 60_5_90_S. ....................... 39

viii
FIGURE 31. LOCATIONS WHERE RELATIVE SLIP WAS MEASURED FOR (A) UNCONFINED, AND (B) CONFINED WITH STIRRUP........................................................................................................ 39
FIGURE 32. LOAD-SLIP PLOT FOR SPECIMEN (A) 60_7_90_1 AND (B) 60_7_90_S. ......................... 40 FIGURE 33. TYPICAL LOAD-SLIP BEHAVIOR FOR #5 GR60 STEEL SPECIMENS WITH 180-DEGREE
HOOK (60_5_180_35_2 SHOWN). .......................................................................................... 41 FIGURE 34. RELATIVE SLIP AT LOCATIONS D1 AND D2 FOR UNCONFINED SPECIMENS WITH
DEBONDED LENGTH................................................................................................................ 41 FIGURE 35. TYPICAL LOAD-SLIP BEHAVIOR FOR #7 GR60 STEEL SPECIMENS WITH 180-DEGREE
HOOK (60_7_180_35_4 SHOWN). .......................................................................................... 42 FIGURE 36. LOAD - DISPLACEMENT PLOT FOR SS (A) 16 MM, AND (B) 20 MM. ............................... 43 FIGURE 37. LOAD-SLIP BEHAVIOR FOR SPECIMENS (A) SS_16_90_25_2 AND (B) SS_16_90_35_2.
............................................................................................................................................... 46 FIGURE 38. TYPICAL LOAD-SLIP BEHAVIOR FOR 16MM SS SPECIMENS WITH BOTH 90 AND 180-
DEGREE HOOKS (SS_16_180_35_4 SHOWN). ......................................................................... 46 FIGURE 39. TYPICAL LOAD-SLIP BEHAVIOR FOR 20MM SS SPECIMENS WITH BOTH 90 AND 180-
DEGREE HOOKS (SS_20_90_35_2 SHOWN). ........................................................................... 47 FIGURE 40. LOAD-DISPLACEMENT PLOT FOR MM SPECIMENS (A) #5, AND (B) #7. ......................... 48 FIGURE 41. TYPICAL LOAD-SLIP BEHAVIOR FOR #5 MM SPECIMENS WITH EITHER 90 AND 180-
DEGREE HOOKS (MM_5_90_25_2 SHOWN). .......................................................................... 51 FIGURE 42. TYPICAL LOAD-SLIP BEHAVIOR FOR #7 MM SPECIMENS WITH EITHER 90 AND 180-
DEGREE HOOKS (MM_7_180_35_4 SHOWN). ........................................................................ 51 FIGURE 43. INFLUENCE OF STRUT ANGLE ON ULTIMATE CAPACITY. ............................................... 52 FIGURE 44. COMPARISON OF BEND ANGLE FOR GR60 SPECIMENS. ................................................ 53 FIGURE 45. COMPARISON OF BEND ANGLE FOR SS SPECIMENS....................................................... 53 FIGURE 46. COMPARISON OF BEND ANGLE FOR MM SPECIMENS.................................................... 54 FIGURE 47. ANCHORAGE CAPACITY RATIOS FOR ALL SIZES AND STEEL TYPES. .............................. 56 FIGURE 48. METHOD USED TO DETERMINE THE DUCTILITY RATIO FOR SPECIMEN SS_16_90_25_2
............................................................................................................................................... 57 FIGURE 49. COMPARISON OF DUCTILITY RATIOS. ........................................................................... 60 FIGURE 50. COMPARISON OF EQUATION COEFFICIENT WITH CAPACITY RATIO............................... 67 FIGURE 51. COMPARISON OF DUCTILITY AND DEVELOPMENT LENGTH EQUATION COEFFICIENT..... 67

ix
List of Tables TABLE 1. MINIMUM DIMENSIONS FOR STANDARD HOOKS. ............................................................... 4 TABLE 2. SPECIMEN DESIGN DETAILS FOR SERIES 1. ...................................................................... 14 TABLE 3. SPECIMEN DESIGN DETAILS FOR SERIES 2 THROUGH 5..................................................... 17 TABLE 4. CONCRETE MIXTURE PROPORTIONS (QUANTITIES ARE PER CUBIC YARD). ....................... 19 TABLE 5. AVERAGE CONCRETE COMPRESSIVE STRENGTH OF EACH SERIES. ................................... 28 TABLE 6. TENSION TEST RESULTS FOR GR60 REINFORCEMENT...................................................... 29 TABLE 7. TENSION TEST RESULTS FOR STAINLESS STEEL (316LN) BARS........................................ 30 TABLE 8. TENSION TEST RESULTS FOR MMFX BARS. .................................................................... 30 TABLE 9. TEST RESULTS FOR GR60 #5 AND #7 SPECIMENS. ........................................................... 37 TABLE 10. TEST RESULTS FOR SS 16 MM AND 20 MM SPECIMENS. ................................................. 45 TABLE 11. TEST RESULTS FOR MM #5 AND #7 SPECIMENS. ........................................................... 50 TABLE 12. ANCHORAGE CAPACITY RATIO - GR60 SPECIMENS ....................................................... 55 TABLE 13. ANCHORAGE CAPACITY RATIO - SS SPECIMENS ............................................................ 55 TABLE 14. ANCHORAGE CAPACITY RATIO - MM SPECIMENS ......................................................... 55 TABLE 15. DUCTILITY RATIO FOR GR60 STEEL.............................................................................. 58 TABLE 16. DUCTILITY RATIO FOR SS. ............................................................................................ 58 TABLE 17. DUCTILITY RATIO FOR MM SPECIMENS. ....................................................................... 59 TABLE 18. MEAN DUCTILITY RATIO FOR ALL STEEL TYPES............................................................ 60 TABLE 19. K-FACTOR FOR #5 AND #7 GR60 SPECIMENS................................................................ 62 TABLE 20. K-FACTOR FOR 16 MM AND 20 MM SS SPECIMENS. ....................................................... 62 TABLE 21. K-FACTOR FOR #5 AND #7 MM SPECIMENS. ................................................................. 63 TABLE 22. COMPRESSIVE CONCRETE STRENGTH RESULTS –AGE (DAYS) ...................................... 71 TABLE 23. TENSILE TEST RESULTS. ............................................................................................... 71 TABLE 24. CRACK PATTERNS, FAILURE MODES, LOAD-SLIP, AND STRESS-STRAIN CURVES FOR
GR60 STEEL HOOKED BARS.................................................................................................. 73 TABLE 25. CRACK PATTERNS, FAILURE MODES, LOAD-SLIP, AND STRESS-STRAIN CURVES FOR
STAINLESS STEEL HOOKED BARS. ......................................................................................... 81 TABLE 26. CRACK PATTERNS, FAILURE MODES, LOAD-SLIP, AND STRESS-STRAIN CURVES FOR
MMFX HOOKED BARS. ......................................................................................................... 89

BD545-40 Page 1
1 INTRODUCTION
Corrosion of steel reinforcement causes premature deterioration of concrete structures
that are exposed to environments containing high chloride levels. Corrosion can drastically
reduce the service life of the structure requiring costly repairs or even replacement early in the
life of the structure. One potential solution that has been explored in recent years is to either
treat the reinforcement with coatings such as zinc or epoxy or to use a corrosion resistant steel to
manufacture the bar. Corrosion resistant steels tend to have higher yield and ultimate strength
than that of ASTM A615 bars. They may also have different post-yield behavior.
Current concrete structural design specifications (ACI or AASHTO) do not clearly
address the use of these materials. Furthermore, FDOT construction specifications limit bar
reinforcement to ASTM A615, effectively limiting the specified yield strength to 60 ksi.
Equations used to calculate the development length of standard hooks were developed using test
data from ASTM A615 bars. These equations need to be evaluated to determine their
applicability when used to calculate hook development lengths for high-strength and corrosion
resistant steel bars.

BD545-40 Page 2
2 LITERATURE REVIEW
This literature review covers the background of the current development length
equations, which were based on ASTM A615 bars. It was found that limited research has been
conducted dealing with the behavior of standard hook anchorages made with high-strength
reinforcement.
2.1 HOOK BEHAVIOR AND GEOMETRY
The AASHTO LRFD Bridge Design Specifications (2004) (AASHTO) and ACI Building
Code Requirements for Structural Concrete (2005) (ACI) are formulated to ensure that steel
reinforcement will yield before the concrete crushes when the nominal strength of a reinforced
concrete element is reached. Development of the yield strength of a reinforcing bar requires that
a sufficient length of bond is available on both sides of the critical section where capacity is
expected to occur. In locations where space is limited, insufficient length may be available to
ensure full development. In these cases, it is common to bend the bar to form either a 90-degree
or 180-degree hook. Figure 1 gives an example of one possible situation where a concentrated
load is located near the end of a cantilever beam. The critical section for flexural strength is
located at the face of the support. If the required straight development length is longer than the
cantilever, then the bar would protrude from the concrete. The typical method to deal with this
situation is to turn the bar down into the section, creating a 90-degree hook.
The required length to develop the hook is shorter due to the mechanical advantage
provided by the concrete located along the inside radius of the bend. Figure 2 shows the normal
bar stresses in a #7 90-degree hook as reported by Marques and Jirsa (1975). The stresses in the
bar increase dramatically around the bend of the hook (from 13 ksi to 57 ksi), indicating that the
bearing of the inside of the hook against the concrete provides a significant portion of the
anchorage. These bearing stresses cause transverse tensile stresses, which can result in a
splitting failure when confinement reinforcement is not present.

BD545-40 Page 3
Critical Sectionfor Flexure
Figure 1. Hook used to develop bar in cantilever beam
57 ksi
13 ksi
75 ksi
45 kips
Figure 2. Tensile stresses in #7 bar with 90 deg. standard hook. (Marques and Jirsa (1975))
Standard bend radii and tail lengths are specified in AASHTO because the development
length equation was derived empirically from test data. Figure 3 shows the dimensions for
“standard hooks” that are the same in both ACI and AASHTO. The development length
approach was first proposed by Pinc, Watkins, and Jirsa (1977). Table 1 shows the minimum
hook dimensions proposed in this research.

BD545-40 Page 4
Figure 3. Standard hook details.
Table 1. Minimum dimensions for standard hooks.
180 degree 90 degree
Bar No. db (in) Diameter (in.) 6db
Head (in.) 4db
Extension (in.) 4db
Tail (in.) 12db
Ratio (in.) 3db
5 0.625 3.75 2.50 2.50 7.50 1.88 7 0.875 5.25 3.50 3.50 10.50 2.625
16 mm 0.629 3.77 2.52 2.52 7.55 1.89 20 mm 0.787 4.72 3.15 3.15 9.44 2.36
2.2 CURRENT HOOK DESIGN PRACTICE
Standard hook anchorages are currently designed using the following equations:
cfyfbλd.
le
dh ′=
ψ020 Equation 1
60
38 yf
fbd
lc
dh ′= Equation 2
where ldh is the hook development length in in., ψe is the coating factor, λ is the lightweight
aggregate concrete factor, db is the bar diameter in in., f’c is the specified concrete strength in psi
for Equation 1 and ksi for Equation 2, and fy is the specified yield strength of the bar in psi.

BD545-40 Page 5
Equation 1 is from ACI and Equation 2 is from AASHTO. These provisions were developed in
the early 1970’s and were finally implemented into the code in their present form in 1979.
Minor and Jirsa (1975) studied the factors that affect the anchorage capacity of bent
deformed bars. Specimen geometry was varied to determine the effect of bond length, bar
diameter, inside radius of bend, and angle included in the bend. Slip between the bar and the
concrete was measured at several points along the bar as load was applied. Load-slip curves
were used to compare different bar geometries. The results indicated that most of the slip
occurred in the straight and curved portion of the hook, with little occurring in the tail.
Marques and Jirsa (1975) investigated the anchorage capacity of hooked bars in beam-
column joints and the effect of the confinement on development. The variables included bar
size, hook geometry, embedment length, confinement, and column axial load. Full scale beam-
column specimen used #7 or #11 hooked bars made from ASTM A615 bars. Slip of the bar
relative to the surrounding concrete was measured at five points along the anchored bar (see
Figure 4). The slip measured on the tail of the hook was small in comparison with slip measured
at 1H and 2H. The slip measured at the lead was greatest in most of the cases. Also, the slip at
point (2H) was similar to the slip at point (1H) when the straight portion of the hook was short.
columnface
1H2H3H
4H
4V
3V
Slip Vert.Horiz.{
Figure 4. Points where slip was measured in research by Marques and Jirsa (1975).
Marques and Jirsa (1975) found that the equations from ACI 318-71 underestimated the
anchorage capacity of the hooks. They found that for their test specimens the tensile stress in the
bar when the bond capacity was reached was:
')3.01(700 cbh fdf ψ−= Equation 3

BD545-40 Page 6
where fh is the bar stress and can not be greater than fy in psi, db is the diameter of the bar in in.,
f’c is the average concrete strength in psi, and ψ is a coefficient factor which depends on the size
of the bar, the lead straight embedment, side concrete cover and cover extension of the tail. It
was also found that the straight lead embedment length (ll) (shown in Figure 3) between the
critical section and the hook could be expressed as follows:
'' ]/)(04.0[ lfffAl chybl +−= Equation 4
where l’ is 4db or 4 in., whichever is greater, Ab is the bar area in sq. in., fy the yield strength of
the bar in psi, fh the tensile stress of the bar in psi, and f’c is the average concrete strength in psi.
Pinc, Watkins, and Jirsa (1977) also studied beam-column joints to determine the effect
of lead embedment and lightweight aggregate concrete on the anchorage capacity of the hook.
The first approach consisted in examining the hook and lead embedment separately. Variables
fl/f’c0.5 and ll/db were correlated to obtain the lead embedment ultimate stress (fl):
')3/(67 cbll fdlf ψ−= Equation 5
The bar stress at failure (fu) can be obtained by summing Equation 3 and Equation 5 to obtain:
')/8.04.01(550 cblbu fdldf ψ+−= Equation 6
In an alternative approach the following equation resulted when the hook and lead length were
examined together using fu/f’c0.5 and ldh/db:
bcdhu dflf /50 'ψ= Equation 7
An equation is needed that provides a length necessary to develop the yield stress in the
bar (not ultimate stress). Consequently, fy is substituted for fu in Equation 7 and the equation is
rearranged as follows:

BD545-40 Page 7
'
02.0
c
ybdh
f
fdl
ψ= Equation 8
where ldh represents the development length for a hooked bar in in. and is measured from the
critical section to the back of the hook (Figure 3).
The ACI 408.1R-79 document presented recommendations for standard hook provisions
for deformed bars in tension based on the study reported by Pinc, Watkins, and Jirsa (1977), and
those recommendations were discussed and explained by Jirsa, Lutz, and Gergely (1979). Based
on the research and discussions, ACI committee 408 recommended the following basic
development length equation:
'
960
c
bhb
f
dlφ
= Equation 9
where lhb represents the basic development length for a hooked bar in in., db is the diameter of
the bar in in., f’c is the average concrete strength in psi, and φ represents the factor for anchorage
which was incorporated in the design equation. The basic development length (lhb) is then
modified by the following factors: fy/60,000 for reinforcement having yield strength over 60,000
psi, 0.7 for side cover, 0.8 for use of stirrups, 1.25 for use of lightweight aggregate, and Asr/Asp
for reinforcement in flexural members in excess of that required for strength.
Figure 5 shows a comparison between the development length proposed by ACI
Committee 408 and the provisions that were then current in ACI 318-77. The proposed
development length was computed as a linear function of the diameter of the bar. The
development length from ACI 318-77 underestimated development lengths for #3 through #8
bars and overestimated for bars greater than #8 in comparison with the proposed.

BD545-40 Page 8
Figure 5. Comparison of hook provisions proposed by committee 408 with those in ACI 318-77.
ACI 318 adopted the recommendations by ACI Committee 408 and the development
length equation and factors have not changed since that adoption in 1979. The epoxy-coated
factor of 1.2 which was proposed by Hamad, Jirsa, and D’Abreu de Paulo (1993) was added in
ACI 318-95.
Currently ACI hook development equation is:
cfyfbλd.
le
dh ′=
ψ020 Equation 10
where ψe is the epoxy coated reinforcement factor, λ is the lightweight aggregate factor, db is the
nominal bar diameter, fy is the specified yield strength of the steel (psi), and f’c is the specified
compressive strength of the concrete (psi).
AASHTO requires the following hook development length:
cfbd
l dh ′=
0.38 Equation 11
where f’c is the specified compressive strength of the concrete (ksi). An additional factor (fy/60)
makes this equation identical to ACI’s equation with the difference in the coefficient being due
to the units conversion of f’c under the radical. Further factors for cover, epoxy coating, and
lightweight aggregate are also identical to ACI’s factors.

BD545-40 Page 9
2.3 STRUT AND TIE EVALUATION OF ANCHORAGE
Hooked reinforcement is typically required to provide anchorage for a tie in the disturbed
region of a strut and tie system. The strut-and-tie method has been incorporated into the design
specifications relatively recently. AASHTO adopted this method in 1994 and ACI included it as
an alternative design method in 2002. Strut and tie analysis requires that the structural concrete
system be idealized as a truss made up of a series of struts, ties, and nodal regions. The element
is divided into B and D regions. The B-regions are based on the Bernoulli hypothesis which
facilitates the flexural design of reinforced concrete structures by allowing a linear strain
distribution for any loading stages (bending, shear, axial forces and torsional moments). D-
regions (D for discontinuity, or disturbance) are portions of the element where the strain
distribution is nonlinear. D-regions are typically characterized by geometrical discontinuities or
concentrated forces.
Nodal regions connect struts and ties, requiring the transfer of large forces in relatively
small areas. They are typically classified according to the sign of the forces. A C-C-C node
represents three compressive forces, a C-C-T node represents two compressive forces and one
tensile force, a C-T-T node represents two tensile forces and one compressive force, and a T-T-T
node represents three tensile forces. Figure 6 shows a C-C-T node in which the external reaction
and diagonal strut provide the two compressive forces. These are reacted by a tie composed of
steel reinforcement that terminates in a standard hook. The length available to develop the hook
(ldh) is a function of the strut-and-tie geometry and is determined by finding the extended nodal
zone. The anchorage provided by the hook must be of sufficient strength so that the yield
strength of the bar is reached at the intersection of the extended nodal zone and the centroid of
the tie. Figure 7 shows some examples of nodal regions in common structural elements that may
contain standard hooks.

BD545-40 Page 10
Extended nodal zone
Nodal zone
C
C
T
ldh
wt
ws
wt
critical sectiontie must be at yield
Figure 6. Extended nodal zone for standard hook anchorage.
Critical Sectionfor Flexure
(a) (b)
(c)

BD545-40 Page 11
Figure 7. Schematic and strut and tie model of typical uses of a standard hook anchorage F.B.D (a) Pier Cap, (b) Deep Beam, and (c) Retaining Wall.
Although not explicitly addressed in their research, the beam-column specimen used for
the original hook development research (Marques and Jirsa (1975)) can be modeled using the
strut-and-tie approach. Figure 8 shows a free body diagram of the test specimen used in those
tests. The region around the hooked bar can be modeled using strut and time. The reinforcement
terminates in a C-C-T node where the compression reactions are provided by the eccentric axial
force required to balance the couple created by tension in the bar. The distribution of this
reaction is unknown.
Figure 8. Specimen configuration and strut and tie model of specimen used in Marques and Jirsa (1975) research.

BD545-40 Page 12
3 EXPERIMENTAL PROGRAM
The primary objective of the experimental program was to determine if the current
development length equations would provide sufficient strength to ensure that the yield strength
of the reinforcement was reached prior to failure of the concrete. Initially it was necessary to
develop a test setup that gave agreeable results when testing ASTM A615 steel. Eventually a
specimen taking advantage of the strut and tie modeling was chosen for this setup. Once this
was complete then testing of unconfined specimens (with no transverse reinforcement) was
conducted on A615 and high-strength steel bars to evaluate the efficacy of the development
length equations.
3.1 SPECIMEN DESIGN
Initial testing was conducted with the specimen design shown in Figure 9a and b, which
are denoted as unconfined and confined, respectively. The specimen configuration incorporated
a single bar centered in a concrete block. The focus of this initial testing was to validate the test
setup, specimen design, and loading configuration. Consequently, only ASTM A615 Grade 60
(hereinafter referred to as GR60) reinforcement was tested. Because the design complied with
both design specifications, the expectation was that the specimens would be capable of reaching
at least the yield strength of the GR60 reinforcement in both the confined and unconfined
specimens. The test results, however, indicated that only the confined specimens could reach
yield, but that the unconfined specimens were well below yield when the concrete failed.
Furthermore, the failure was generally spalling of a corner section of concrete under the reaction
at the outside of the hook, which was not the targeted splitting of the specimen in the plane of the
hook.
The specimen configuration was then adjusted to simulate the strut and tie behavior of a
hook in a C-C-T nodal region as shown in Figure 9c and d. The bearing over the hook was
lengthened to ensure complete engagement of the bar over the design development length. It is
likely that the bearing stress distribution varied along the length of the specimen as shown in the
figure, but the setup did not allow this distribution to be determined quantitatively. This was not
expected to affect the results significantly. Furthermore, any effect would likely be conservative
since the provided development would be shortened due to the concentration of stresses near the

BD545-40 Page 13
bend of the hook. The embedded portion of the bar beyond the design development length was
debonded to ensure that only the bond under the bearing contributed to the hook development.
The remainder of the testing was conducted with these two configurations using unconfined
specimens.
ldh
ldh
(a) (b)
STRU
T
Debonded
ldh
STRU
T
Debonded
ldh
(c) (d)
Figure 9. Specimen design with idealized boundary conditions (a) unconfined, (b) confined with stirrups, (c) 90 deg. hook, unconfined with debonded length, and (d) 180 deg. hook, unconfined
with debonded length.
Forty eight specimens were cast and tested in five series, with each series representing
the specimens cast with a single batch of concrete. The specimen details and testing
configuration for the first series are given in Figure 10 and Table 2, which were designed to test
GR60 steel. Clear cover and stirrup spacing complied with both AASHTO and ACI. The
specimens were designed with side cover and cover on bar extension beyond hook not less than
2-1/2 in and 2 in., respectively. Confined specimens used #3 stirrups spaced at 1.88 or 2.63 in.

BD545-40 Page 14
along the development length of the hook. This configuration was abandoned in favor of the
strut and tie design used in series 2 through 5.
W
B
HW
Cs
A A
Section A - A
ldh
(a)
A A
Section A - AW B
W No. 3 stirrup
Hldh
(b)
Figure 10. Specimen design details for series 1: (a) unconfined specimen details and (b) confined specimen details.
Table 2. Specimen design details for Series 1.
Specimen W (in)
H (in)
B (in)
ldh (in)
60_5_90_S 14.5 8.5 10 6 60_5_90_1 14.5 10.5 10 8 60_7_90_S 18.5 11.5 10 9 60_7_90_1 18.5 13.5 10 11

BD545-40 Page 15
The remaining four series are detailed in Figure 11 and Table 3 and also complied with
both AASHTO and ACI for clear cover. The specimen naming convention is as follows. The
first term represents the type of steel where 60 indicates ASTM A615 Grade 60, SS indicates
stainless steel, and MM indicates MMFX bars. The second term represents the bar size, #5, #7,
16 mm or 20 mm. The third term represents the hook bend angle of 90 or 180 degrees. The
fourth term represents the strut angle 25, 35 or 47 degrees, and the last term represents the
replicate number.
The metric designation of the stainless steel bars was retained because they were
manufactured in Italy under “hard” metric sizes. The 16 mm diameter and area are very near that
of a U.S. Customary #5, the 20 mm has slightly smaller diameter and respective area than that of
a #7.
The tables describe the specimen geometry including the development length of the
hooked bar as measured from the back edge of the hook. The strut angles shown in the tables are
a function of the specimen geometry and were varied in series 3 to determine the effect of the
strut angle on the hook capacity. Results from series two indicated some minor differences in
behavior between the two strut angles. The difference in strut angle, however, did not appear to
have a significant effect on the specimen capacity. Therefore, a strut angle of 35 deg. was
selected for use in series four and five.
Finally, because of the failure of SS and MM specimens to develop in earlier series the
development lengths of the specimens in the later series were increased to determine if the bars
could be developed.

BD545-40 Page 16
A A
Section A - A
B
W
dL
W
Hldh
2.5 in.2 in.
2.5 in.
α
(a)
Section A - A
B
W
Cb
A A
dL
W
H
α
ldh
2.5 in.
2.5 in.
(b)
Figure 11. Specimen design for series 2 through 5: (a) unconfined specimen details for 90 degree bend and (b) unconfined specimen details for 180 degree bend.

BD545-40 Page 17
Table 3. Specimen design details for series 2 through 5.
Series Number Specimen W
(in) H
(in) B
(in) α
(deg.) ldh (in)
dL (in)
60_5_90_25_1 14.5 12.1 10 25 7 2.60 60_5_90_25_2 14.5 12.1 10 25 7 2.60 60_7_90_47_1 18.5 22.8 10 47 10 10.30 Two
60_7_90_47_2 18.5 22.8 10 47 10 10.30 SS_16_90_25_1 14.5 17.1 10 25 12 2.60 SS_16_90_25_2 14.5 17.1 10 25 12 2.60 SS_16_90_35_1 14.5 18.4 10 35 12 3.90 SS_16_90_35_2 14.5 18.4 10 35 12 3.90 MM_5_90_25_1 14.5 19.1 10 25 14 2.60 MM_5_90_25_2 14.5 19.1 10 25 14 2.60 MM_5_90_35_1 14.5 20.4 10 35 14 3.90 MM_5_90_35_2 14.5 20.4 10 35 14 3.90 MM_7_90_25_1 18.5 27 10 25 20 4.50 MM_7_90_25_2 18.5 27 10 25 20 4.50 MM_7_90_35_1 18.5 29.1 10 35 20 6.60
Three
MM_7_90_35_2 18.5 29.1 10 35 20 6.60 SS_16_180_35_1 14.5 17.4 10 35 11 3.90 SS_16_180_35_2 14.5 17.4 10 35 11 3.90 SS_16_180_35_3 14.5 18.4 10 35 12 3.90 SS_16_180_35_4 14.5 18.4 10 35 12 3.90 MM_5_180_35_1 14.5 18.4 10 35 12 3.90 MM_5_180_35_2 14.5 18.4 10 35 12 3.90 MM_5_180_35_3 14.5 20.4 10 35 14 3.90 MM_5_180_35_4 14.5 20.4 10 35 14 3.90 MM_7_180_35_1 18.5 26.1 10 35 17 6.60 MM_7_180_35_2 18.5 26.1 10 35 17 6.60 MM_7_180_35_3 18.5 29.1 10 35 20 6.60
Four
MM_7_180_35_4 18.5 29.1 10 35 20 6.60 60_5_180_35_1 14.5 13.4 10 35 7 3.90 60_5_180_35_2 14.5 13.4 10 35 7 3.90 60_7_180_35_1 18.5 18.0 10 35 9 6.60 60_7_180_35_2 18.5 18.0 10 35 9 6.60 60_7_180_35_3 18.5 19.0 10 35 10 6.60 60_7_180_35_4 18.5 19.0 10 35 10 6.60 SS_20_90_35_1 17.0 21.1 10 35 13 5.60 SS_20_90_35_2 17.0 21.1 10 35 13 5.60 SS_20_90_35_3 17.0 22.1 10 35 14 5.60 SS_20_90_35_4 17.0 22.1 10 35 14 5.60 SS_20_180_35_1 17.0 21.1 10 35 13 5.60 SS_20_180_35_2 17.0 21.1 10 35 13 5.60 SS_20_180_35_3 17.0 22.1 10 35 14 5.60 SS_20_180_35_4 17.0 22.1 10 35 14 5.60 MM_7_90_35_3 18.5 29.1 10 35 20 6.60
Five
MM_7_90_35_4 18.5 29.1 10 35 20 6.60

BD545-40 Page 18
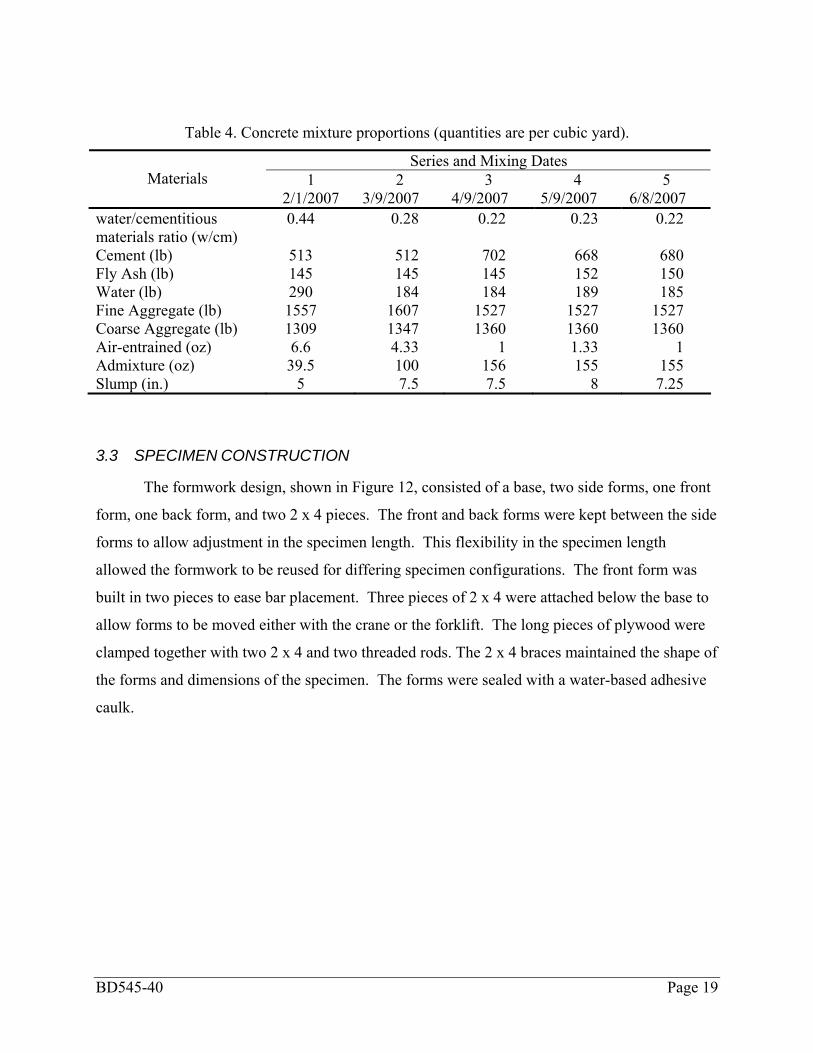
3.2 CONCRETE MIXTURE DESIGNS
Five concrete batches were used to construct each of the five series. The batch for the
first series was prepared at Florida Department of Transportation State Materials Office (SMO)
in Gainesville, and the last four batches were prepared by Florida Rocks Industries, a local
ready-mix concrete supplier. The concrete mixture proportions per cubic yard are shown in
Table 4. All mixtures used a crushed limestone coarse aggregate with a maximum size of 3/8-in.
(#89) and silica sand fine aggregate.
The size of the first batch was nine cubic feet (0.25 cubic meters), and for the last four
batches was 81 cubic feet (2.29 cubic meter) per batch. Air-entrained admixture and high-range
water reducer were included in the mixture proportions. The water to cement ratio was reduced
in the last four batches by using a high-range water reducer (superplasticizer) obtain high
concrete strengths at early age (14 days). Air-entraining admixture was also used to improve the
workability of the concrete. The volume of concrete used in each batch included the specimens,
extra examples and concrete for quality control testing.
About twenty standard cylinders 6 x 12-in (152 x 305-mm) were cast at the same time as
the specimens, and vibrated in two layers by means of a vibrating table. The cylinders were
cured at room temperature and under the same condition as the specimens for each concrete
batch. Compressive tests were performed in accordance with the Standard Test Method for
Compressive Strength of Cylindrical Concrete Specimens (ASTM C39–01). All cylinders were
loaded at a load rate of 35 pound square inch per second to failure. The maximum load obtained
from the universal testing machine was used to calculate the maximum compressive strength.
BD545-40 Page 19
Table 4. Concrete mixture proportions (quantities are per cubic yard).
Series and Mixing Dates 1 2 3 4 5 Materials
2/1/2007 3/9/2007 4/9/2007 5/9/2007 6/8/2007 water/cementitious materials ratio (w/cm)
0.44 0.28 0.22 0.23 0.22
Cement (lb) 513 512 702 668 680 Fly Ash (lb) 145 145 145 152 150 Water (lb) 290 184 184 189 185 Fine Aggregate (lb) 1557 1607 1527 1527 1527 Coarse Aggregate (lb) 1309 1347 1360 1360 1360 Air-entrained (oz) 6.6 4.33 1 1.33 1 Admixture (oz) 39.5 100 156 155 155 Slump (in.) 5 7.5 7.5 8 7.25
3.3 SPECIMEN CONSTRUCTION
The formwork design, shown in Figure 12, consisted of a base, two side forms, one front
form, one back form, and two 2 x 4 pieces. The front and back forms were kept between the side
forms to allow adjustment in the specimen length. This flexibility in the specimen length
allowed the formwork to be reused for differing specimen configurations. The front form was
built in two pieces to ease bar placement. Three pieces of 2 x 4 were attached below the base to
allow forms to be moved either with the crane or the forklift. The long pieces of plywood were
clamped together with two 2 x 4 and two threaded rods. The 2 x 4 braces maintained the shape of
the forms and dimensions of the specimen. The forms were sealed with a water-based adhesive
caulk.

BD545-40 Page 20
A A
2 x 4 Lumber5/8" Thread Rod 1 x 1 Lumber
Coupler
(a)
2.5"Plywood 3/4"
Coupler
2 x 4 Lumber
Section A - A
2 pieces of 3/4"of Plywood placedabove and below thebar
(b)
Figure 12. Formwork for casting specimens (a) plan view, and (b) section.
Figure 13. Photo of formwork ready for concrete placement.

BD545-40 Page 21
Four specimens were cast in series one and two, twelve specimens in series three and
four, and sixteen specimens in series five. All specimens were cast with the bar placed in the
bottom of the forms with the tail of the bend pointed upward (see Figure 12b and Figure 13). A
thin wire was attached to the side forms and to the tail of the hook to hold the bar level, and to
maintain the side cover required. The debonded part of the bar was composed of a plastic tube
which was sealed with electric tape to prevent cement paste from entering the tube.
Since most of the formwork was placed inside of University of Florida-Structural
Laboratory, the concrete from the ready mix truck was poured directly to a galvanized steel
container, which was then moved near the formwork (see Figure 14).
Figure 14. Ready-mixed concrete being discharged into the container for transporting.
To ensure that the instrumentation and bar position were not disturbed, concrete was
delivered to the forms from the container by hand (see Figure 15a). Each specimen was cast in
two lifts, which were compacted using mechanical vibrators. As concrete was placed in the
forms, standard 6x12-in (152 x 305-mm) cylinders were cast, and also vibrated in two layers.
Once finished with the casting procedure, the top surfaces of the specimens were smoothed with

BD545-40 Page 22
a finishing trowel (see Figure 15b). Finally, a plastic sheet was placed over the specimens to
minimize the evaporation of the water (see Figure 16). The specimens and cylinders were left to
cure in the same environment until they were tested.
(a) (b)
Figure 15. Casting and compaction of the specimen (a), and finishing of specimens (b).
Figure 16. Curing of the specimens.
3.4 TEST SETUP
Figure 17 shows the test frame used to test all of the specimens. The concrete block was
oriented in the frame to allow the bar to be tensioned vertically using a threaded rod inserted into
the coupling on the reinforcing bar. A structural steel tube was placed between the frame and

BD545-40 Page 23
block to react the vertical tension force. Rotation was restrained by the vertical portion of the
frame.
The test frame was constructed with back-to-back structural channels. Each two
structural channels were connected and stiffened by 0.5-in. thick plates. Back-to-back channels
(C15x40) were connected to form a 90 degree frame. Each end of the frame was then welded to
C12x30 shapes, which were attached to the strong floor and wall. Stiffeners were added to
stiffen the frame against the heavy concentrated loads from the specimen (see Figure 17a, and
Figure 17c).
2C15x40
2C15x40
StrongWall
C12x30
C12x30
4' - 2"
4'
5' - 3"
Load CellHydraulic
Jack
StrongFloor
A
A HSS4x3x1/4
58
" BoltsOpen holes
17"14" 12"
78
"
14"
Section A-A
22" x 22" Base
2C6x13
ThreadRod Coupler
(a) (b)
(c)
Figure 17. Load test setup (a) elevation, (b) section, and (c) photo.

BD545-40 Page 24
After fabrication, the test frame was connected to the strong wall and floor by means of
eight 5/8” bolts, and eight 1-1/4-in. diameter bolts respectively (see Figure 17b). The specimen
was supported by a 22 x 22-in. steel base. Tension was applied to the bar extension by means of
a center hole hydraulic jack. The threaded rod passed through the 2C15x40 beam, and the center
hole hydraulic jack (see Figure 17b). A swaged coupler system was used to connect the
anchored bar to a threaded rod (see Figure 18). This load was reacted with a strut placed
between the specimen and the horizontal member of the reaction frame. The moment generated
by the couple was reacted horizontally with the vertical member of the reaction frame. The
reaction on the left face of the specimen shown in Figure 19 was distributed over the
development length of the hook. The remaining portion above the bar was debonded to ensure
that only the portion of the hook under the reaction contributed to the bar development.
Figure 18. Swaged coupler system.

BD545-40 Page 25
T
2C6x13
Shims 6x10x1/4Neoprene 6x8x1/4
Neoprene6x8x1/4
HSS4x3x1/4
Shims 6x12x1/4
Neoprene6x12x1/4
Plate12x30x1
Bearing lengthvaried as neededto create targetdevelopment length
STRU
T
ldh
Figure 19. Details of support conditions.
3.5 DATA ACQUISITION SETUP
Relative slip between the bar and the concrete was measured by modifying a technique
developed and used by Minor and Jirsa (1975). Figure 20 shows the locations along the hook
where relative slip was measured. Location 1 was at the loaded end and location 2 was at the
beginning of the bend. A 0.0625 in. diameter hole was drilled in the hooked bar. A 0.016 in.
diameter wire was attached to the anchored bar at points 1 and 2 by inserting part of the wire to
the ¼-in deep holes and securing with a small brass screw. The wire was placed inside of a thin
plastic conduit of 0.042 in. diameter along the entire length in order to prevent bonding and to
allow free movement of the wire relative to the surrounding concrete.
1 2
Figure 20. Positioning of slip wire in hooked bar.

BD545-40 Page 26
The conduit containing the wire was extended from the bar attachment point through the
concrete and exited the specimen on the side opposite to the straight portion of the bar. The
exposed conduit and wire was then connected to a linear pot placed in a 1 x 1-in. frame (see
Figure 21b). The linear pots were used to measure the relative movement between the wire and
the conduit, which is nearly a direct measure of the relative movement of the bar and concrete at
attachment point of the wire. Bar displacement was also measured relative to the top side of the
specimen using a linear pot clamped to the bar (see Figure 21a, Figure 22). The purpose of this
linear pot was to measure the strain of the debonded portion of the bar and any slip that might
occur before failure.
1
2
Bond Slip
Bond Slip
Displacement
Load Cell
(a) (b)
Figure 21. Bond slip instrumentation (a) displacement and slip position, (b) linear potentiometers.
BD545-40 Page 27
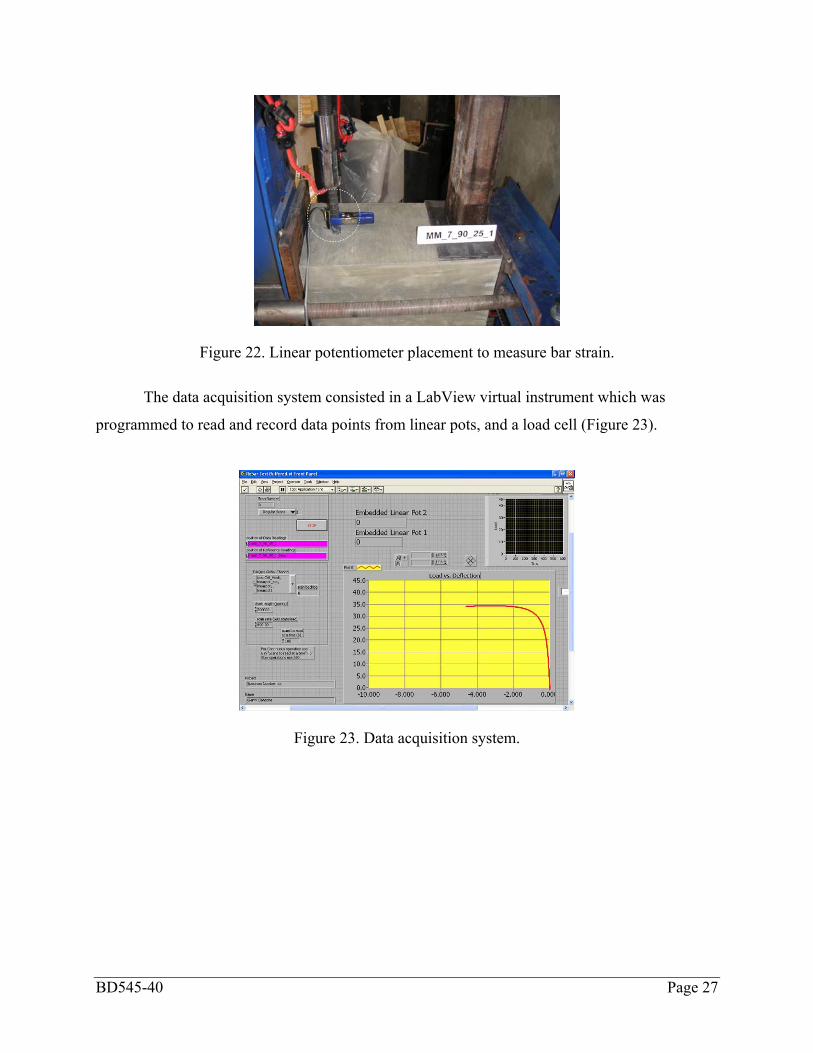
Figure 22. Linear potentiometer placement to measure bar strain.
The data acquisition system consisted in a LabView virtual instrument which was
programmed to read and record data points from linear pots, and a load cell (Figure 23).
Figure 23. Data acquisition system.

BD545-40 Page 28
4 RESULTS AND DISCUSSION
4.1 MATERIAL PROPERTIES About twenty standard cylinders 6 x 12-in (152 x 305-mm) per batch were tested in
accordance with the Standard Test Method for Compressive Strength of Cylindrical Concrete
Specimens (ASTM C39–01). Pull-out specimens and companion cylinders were cured
uncovered in the laboratory to ensure similar curing conditions. Companion cylinder tests were
conducted each day that pull-out tests were conducted to determine the concrete strength for that
particular test within a 24-hour window. The cylinder strength data are included with the pull-
out test results later in this section. For reference, the average of these compressive strengths for
each batch is shown in Table 5. The first batch was mixed at Florida Department of
Transportation State Materials Office (SMO) in Gainesville, and the last four batches were
delivered by Florida Rock Industries, a local ready-mix concrete supplier. Compressive
strengths were tested after 7, 14, 21, and 28 days of continuous lab cured for all the concrete
mixes (see APPENDIX A).
Table 5. Average concrete compressive strength of each series.
Series 1 2 3 4 5
Average Concrete Strength 5700 5520 6500 6180 6070 Coefficient of Variation (%) 4.8 3.8 3.3 3.4 3.7
Samples of each bar type were tested in accordance with ASTM A370 at Florida
Department of Transportation State Materials Office (SMO) in Gainesville. Two samples were
tested for each bar size and steel type. The load rate used was 0.20 inches per minute per in. of
distance between the grips (in/min/in) until the yield point was reached. After yielding, the rate
was adjusted to 3.5 in/min/in until bar rupture occurred.
ACI indicates that for bars exceeding a specified yield strength of 60 ksi (413 MPa), the
yield strength is to be determined using the stress corresponding to a 0.35% strain. The 0.2%
offset method (ASTM A370), however, is more generally applicable to high-strength steel that
does not have a well-defined yield point. Consequently, for the SS and MM bars that do not
have well-defined yield points, the 0.2% offset method (illustrated in Figure 24) was used in lieu

BD545-40 Page 29
of the 0.35% strain method. Data gathered during tension tests included strain at 0.2% offset,
load at 0.2% offset, and ultimate strength. Complete tension test results are given in Appendix
A.
f
fy
ε εy 0.2 %
Figure 24. Stress-strain curve of steel with no well-defined yield point.
Grade 60 Steel
All GR60 bars were purchased locally at a building supply center and were thought to be
from the same heat. As will be discussed later, test results for the specimens with #5 bars
indicated that there may have been different heats in the batch of reinforcement tested. Table 6
shows the average results for the bar tests. The two samples of each size exceeded the GR60
requirements of minimum yield strength (60 ksi) and tensile strength (90 ksi).
Table 6. Tension test results for GR60 reinforcement.
Samples Yield Strength at 0.35% strain
(ksi)
Strain at 0.35% yield (in/in)
Load at 0.35% (kip)
Ultimate Strength (ksi)
Ave. 62.8 0.00350 19.5 104.7 #5 COV (%) < 1 < 1 < 1 < 1 Ave. 63.7 0.00350 38.2 105.9
#7 COV (%) < 1 < 1 < 1 < 1

BD545-40 Page 30
Stainless Steel
The stainless steel 316LN bars were manufactured in Italy and were provided by
Valbruna Stainless Steel. Table 7 shows the measured properties of the reinforcement. After
testing was initiated it was noted that the 16 mm bars had two heats of steel, which are noted in
the table. The yield and tensile strengths measured complied with the minimum yield strength of
75 ksi and minimum tensile strength of 100 ksi required for ASTM A955 and Valbruna product
specifications.
Table 7. Tension test results for stainless steel (316LN) bars.
Samples Yield Strength at 0.2% offset (ksi)
Strain at 0.2% offset yield
(in/in)
Load at 0.2% offset
(kip)
Ultimate Strength
(ksi) Ave. 91.0 0.00555 28.2 114 16 mm (0.625 in)
Heat 1 COV (%) 3 1 3 1 Ave. 106 0.00615 32.9 124 16 mm (0.625 in)
Heat 2 COV (%) < 1 1 < 1 < 1 Ave. 100.8 0.0061 49.1 120
20 mm (0.787 in) COV (%) < 1 3 < 1 < 1
MMFX Steel
The MMFX bars were provided by MMFX Steel Corporation of America. Table 8 shows
the tested properties of the bars used in the specimens. The yield strength measured in the two
samples of each size exceeded and complied with the minimum yield strength of 100 ksi and
ultimate strength of 150 ksi required by ASTM A1035.
Table 8. Tension test results for MMFX bars.
Samples Yield Strength at 0.35% strain
(ksi)
Strain at 0.35% yield (in/in)
Load at 0.35% (kip)
Ultimate Strength (ksi)
Ave. 122.4 0.00649 37.9 158.1 #5 COV (%) < 1 < 1 < 1 < 1 Ave. 128.0 0.00670 76.8 162.9
#7 COV (%) < 1 2 < 1 < 1

BD545-40 Page 31
4.2 TEST RESULTS
4.2.1 BEHAVIOR AND FAILURE MODES
Figure 25 shows the stress-strain plot of three pullout specimens to illustrate the typical
behavior of each type of steel. Load-slip and stress-strain curves for all specimens are shown in
Appendix B. The stress was obtained by dividing the measured load by the nominal area of the
reinforcing bar. The strain was obtained by dividing the measured bar displacement by the
debonded length.
Strain (in/in)
Stre
ss (k
si)
Stre
ss (M
Pa)
-0.01 0.04 0.09 0.14 0.19 0.240
40
80
120
160
0
300
600
900
1200
-0.01 0.04 0.09 0.14 0.19 0.240
40
80
120
160
0
300
600
900
1200
60_5_90_25_1MM_5_90_25_1SS_16_90_25_1
Figure 25. Comparison of stress strain curves for GR60, SS, and MM bars.
In general, as load was applied the specimen remained uncracked and linear elastic until
the yield point was reached. In some of the specimens cracking occurred before the bar reached
yield, which resulted in a loss of bond and a premature failure. This failure mode was deemed
concrete splitting, which occurred suddenly when the peak load was reached. This type of
failure was characterized by cracks that split the specimen from the front to the right face (see
Figure 26a). Also, diagonal cracks formed on the right and left side of the specimen confirming
the strut behavior of the specimens (Figure 26b). The front face of the specimen presented the

BD545-40 Page 32
typical Y – crack which is seen in bond test using beam end specimens (Ahlborn and
DenHartigh, 2002). The rear face exhibited an inverted Y – crack which split the specimen in
three parts (see Figure 26c and d). Figure 27 shows a sketch of the crack pattern on each face.
STRUT
(a) (b)
(c) (d)
Figure 26. Photo of typical crack pattern after concrete splitting failure (a) top, (b) side, (c) rear, and (d) front faces. (MM_7_180_35_3)
After testing, a larger portion of the side cover was easy to remove. During the specimen
examination, crushing of the concrete inside radius of the hook was noted. This kind of behavior
was seen not only in 90 degree but also in 180 degree hooks (see Figure 28). Moreover, crushing
of the concrete near to the radius of the bend was because of the large bearing stresses between

BD545-40 Page 33
the bar radius and concrete resulting in loss of bond. This type of behavior was also observed
and reported by Marques and Jirsa (1975) and Hamad, Jirsa, and D’Abreu de Paulo (1993).
Top Front Rear Bottom
Right Left
Figure 27. Drawing of typical crack pattern after concrete splitting failure. (MM_7_180_35_3)
(a) (b)
Figure 28. Crushed concrete inside of bend radius (a) 90 deg. hook and (b) 180 deg. hook.
If the specimen was able to sustain load beyond yield, one of two possible failure modes
occurred. The bar yield with concrete splitting, occurred after the bar had yielded indicating that
the anchorage was able to hold load at least to the yield point. Crack patterns were similar to the
concrete splitting failure.
Bar yield was characterized by continued deformation of the bar without concrete
splitting or bar rupture. This typically occurred on the SS specimens when the hydraulic jack
stroke limit was reached. Specimens SS_16_90_25_1, SS_16_90_25_2, SS_16_90_35_1,
SS_16_90_35_2, SS_16_180_35_1, and SS_16_180_35_4 were loaded until the stroke of the
hydraulic jack reached its limit, which was well beyond the yield point. After testing, no cracks
were noted on the faces of the specimens.

BD545-40 Page 34
Finally, several specimens failed due to bar yield and rupture. This occurred when the
full rupture strength of the bar was reached before the concrete failed. The bar yield and rupture
failure was mainly observed in #5 MM specimens.
4.2.2 ASTM A615 GRADE 60 SPECIMENS
In this section the detailed results of the GR60 steel specimens are presented and
discussed. Failure modes for each specimen are documented as well as the load displacement
and load slip behavior.
Figure 29 shows the load displacement behavior for all of the #5 and #7 GR60 steel
specimens. The plots for each are shown with different scales to accentuate the differences in
behavior among the specimens with the same size bar. The 25-degree strut specimens appear to
have a larger initial stiffness than that of the 35-degree strut specimens when comparing the
results for the #5 bar. This is likely due to the manner in which the displacements were
measured. The linear potentiometer was attached to the bar at the point where it exits the
concrete and measured the relative movement between the bar and concrete. The 25-degree strut
specimens had shorter debonded lengths than that of the 35-degree strut specimens resulting in
larger elastic deformations under the same load.
The sudden change in slope of the load displacement plots indicates yielding of the bars.
The #5 bars appear to exhibit two slightly different yield points while all of the #7 bars appear to
be near the same yield point. The average yield points measured in the bare bar tests are plotted
as a horizontal line denoted with Pyt. The #7 bar tests appear to very consistent and to agree with
the results of the bare bar test. The #5 bars, however, appear to have two distinctly different
yield points when specimens 60_5_90 1 and 60_5_90_S are ignored. The bare bar results seem
to better match the lower yield point. This may indicate that there were two different steel heats
tested in the GR60 #5 bars.
Post-yield slopes are not likely to provide useful information because the measurement of
bar displacement was made relative to the concrete surface around the bar. Microcracking was
likely to occur near yield, which would result in movement of the concrete along with the bar as
ultimate strength is approached. This behavior is described more fully when the slip data are
presented in a later section.

BD545-40 Page 35
Displacement (in.)
Loa
d (k
ip)
Loa
d (K
N)
0 0.1 0.2 0.3 0.40
10
20
30
40
0
40
80
120
160
0 0.1 0.2 0.3 0.40
10
20
30
40
0
40
80
120
160
Pyt
60_5_90_25_160_5_90_25_260_5_90_160_5_90_S60_5_180_35_160_5_180_35_2
(a))
Displacement (in.)
Loa
d (k
ip)
Loa
d (K
N)
0 0.2 0.4 0.6 0.80
10
20
30
40
50
60
70
0
40
80
120
160
200
240
280
Pyt60_7_90_47_160_7_90_47_260_7_90_160_7_90_S60_7_180_35_160_7_180_35_260_7_180_35_360_7_180_35_4
(b)
Figure 29. Load-displacement plot for GR60 (a) #5, and (b) #7.
The complete test results for GR60 steel specimens are shown in the Table 9. f’cr is the
average concrete strength of the specimen concrete as tested on the day of the pullout test. Pu is

BD545-40 Page 36
the peak measured load applied to the bar. To allow comparison of the peak measured loads
among the specimens that contained varying concrete strength, Pu was normalized to the square
root of the ratio of the design strength (5500 psi) to the measured strength. Py is the load in the
bar at a measured strain of 0.35%. Δu is the displacement corresponding to Pu and Δy is the
displacement corresponding to Py. The bar stress based on the peak measured load is also given
(Pu /Ab). D1 and D2 represent the total measured slip of the bar when the load in the bar is Pu.

BD545-40 Page 37
Table 9. Test results for GR60 #5 and #7 specimens.
Specimen notation
f'cr (psi)
Pu (kips
)
Py (kips
) Δu (in) Δy (in) D1u
(in) D2u (in)
Pu/Ab (ksi) cr
u fP
'5500
(kips) Failure Modes
60_5_90_1 5700 20.2 N.A 0.085 NA 0.162 0.152 63.8
19.8 Bar yield with concrete splitting
60_5_90_S 5700 25.5 N.A 0.289 NA 0.117 0.074 80.8
25.0 Bar yield and rupture
60_5_90_25_1 5490 26.5 18.7 0.151 0.009 NA NA 85.6
26.5 Bar yield with concrete splitting
60_5_90_25_2 5490 27.0 19.1 0.150 0.009 0.167 0.132 87.1
27.0 Bar yield with concrete splitting
60_5_180_35_1 6330 34.6 18.9 0.274 0.017 0.178 0.081 106.0
32.9 Bar yield and rupture
60_5_180_35_2 6330 34.8 18.9 0.275 0.016 0.157 0.074 106.5
33.0 Bar yield and rupture
60_7_90_1 5700 27.8 N.A 0.037 N.A 0.102 0.097 45.4
27.3 Concrete splitting
60_7_90_S 5700 47.0 N.A 0.089 N.A 0.099 0.019 77.0
46.2 Bar yield with concrete splitting
60_7_90_47_1 5490 58.1 38.9 0.497 0.036 N.A N.A 97.0 58.2 Bar yield 60_7_90_47_2 5490 54.1 39.5 0.358 0.036 0.249 0.164 90.2 54.1 Bar yield 60_7_180_35_1 6330 54.4 40.8 0.172 0.023 0.166 0.158
84.6 50.7 Bar yield with
concrete splitting 60_7_180_35_2 6330 52.4 31.2 0.163 0.023 0.251 0.226
81.5 48.9 Bar yield with
concrete splitting 60_7_180_35_3 6330 58.9 36.5 0.238 0.023 0.174 0.085
91.5 54.9 Bar yield with
concrete splitting 60_7_180_35_4 6330 59.1 36.9 0.285 0.023 0.401 0.263
91.8 55.1 Bar yield with
concrete splitting

BD545-40 Page 38
Figure 30 shows two graphs that compare the confined and unconfined #5 bar specimens
from the first series of testing. Recall that this testing was conducted with the original test
configuration. It is readily apparent that the unconfined specimen (which did not reach yield)
has a shallower load-slip slope than that of the confined specimen with stirrups, indicating that
the lack of stirrups allowed greater bar movement prior to reaching ultimate capacity. This
confirms observations by Hamad, Jirsa, and D’Abreu de Paulo (1993) when evaluating beam-
column joints with GR60 steel and epoxy-coated hooked bars. They found that for #7 uncoated
specimens with 90 degree hooks, the anchorage strength increased about 51% when stirrups were
added. This compares well with results of this research in which a 69% increase was found
when stirrups were added.
Further examination of the plots indicates that the slip at D1 is greater than that of D2
until higher loads are reached where the plots cross. This occurs in both the confined and
unconfined specimens. D1 was expected to remain greater than D2 up to failure since the bar
exits the specimen near where D1 is measured. The cross-over of the plots is likely due to
cracking late in the loading process and is a function of the slip measurement technique and not
an indication of peculiar behavior. Figure 31 shows the idealized location of cracks in
unconfined and confined specimens, which are similar to those observed during and after the
testing. As load is applied, the slip at D1 is greater than that of D2. As additional load is applied,
diagonal cracks form perhaps along line 2-3. When these cracks occur, a spall in the shape of 1-
2-3 forms and moves with the bar as further load is applied resulting in zero bond stress in this
area. Because the slip measurement device measures relative movement between the concrete
and steel, less (or zero) slip will register after the spall occurs. These cracks likely form when
the specimen is near capacity, which confirms the crossing locations in the plots.
For unconfined specimens, initial slip located at D1 was greater than slip located at D2
until diagonal cracks formed as shown in Figure 31a. For confined specimens, the use of
transverse reinforcement not only improved the anchorage capacity of the hooked bar but also
controlled crack propagation. The inclusion of transverse reinforcement was sufficient to yield
the bar and to achieve the bar rupture failure.

BD545-40 Page 39
Slip (in.)
Loa
d (k
ip)
Stre
ss (k
si)
0 0.05 0.1 0.15 0.20
5
10
15
20
25
30
0
15
30
45
60
75
90
Pu
crossing
D1D2
Slip (in.)
Loa
d (k
ip)
Stre
ss (k
si)
0 0.05 0.1 0.15 0.20
5
10
15
20
25
30
0
15
30
45
60
75
90
Py
Pu
crossing
D1D2
(a) (b)
Figure 30. Load-slip plot for specimens (a) 60_5_90_1 and (b) 60_5_90_S.
D1
D2
loss in stiffnessfrom cracking
1
3
2Spall
loss in stiffnessfrom cracking
D1
D2
1 2
3
Spall
(a) (b)
Figure 31. Locations where relative slip was measured for (a) unconfined, and (b) confined with stirrup.
Figure 32 shows the relative behavior of the confined and unconfined #7 tests. The
unconfined test is similar to that of the #5 with failure occurring before bar yield and with a
crossing of the slip plots near the specimen ultimate capacity. In contrast, however, the confined
specimen never exhibits the cross-over of the slip plots. This is probably due to the confinement
restricting the formation of the spall in the region of D1.

BD545-40 Page 40
Slip (in.)
Loa
d (k
ip)
Stre
ss (k
si)
0 0.04 0.08 0.12 0.160
10
20
30
40
50
60
0
15
30
45
60
75
90
Pu
D1D2
Slip (in.)
Loa
d (k
ip)
Stre
ss (k
si)
0 0.04 0.08 0.12 0.160
10
20
30
40
50
60
0
15
30
45
60
75
90
Pu
Py
D1D2
(a) (b)
Figure 32. Load-slip plot for specimen (a) 60_7_90_1 and (b) 60_7_90_S.
Slip behavior of the series 2 through 5 tests was similar to that of the unconfined
specimen from series 1 except that most of the specimens tested with the revised setup reached
yield before failure. Figure 33 provides an example of the load slip behavior for a #5 bar with a
180-deg. hook. As expected, D1 remained greater than D2 for the entire test, and never crossed
D2 as the load approached capacity. Recall that the slip D1 was measured at the end of the
debonded length (dL), which placed it closer to the bend than in the previous test setup (Figure
34). Figure 34 shows two possible locations where diagonal cracks formed at the edge of the
strut. Crack 2-3 is shown above D1 and Crack 4-5 is shown below. It is believed that the reason
there was no cross-over is that the cracking occurred primarily along line 2-3, which formed
spall 1-2-3 and allowed the relative slip D1 to continue to be measured up to failure.
Furthermore, the D2 plot shows a plateau forming while D1 remains linear up until failure of the
concrete indicating that the bar was well beyond its yield point at D1.

BD545-40 Page 41
Slip (in.)
Loa
d (k
ip)
Stre
ss (k
si)
0 0.05 0.1 0.15 0.20
10
20
30
40
0
30
60
90
120Pu
Py
D1D2
Figure 33. Typical load-slip behavior for #5 GR60 steel specimens with 180-degree hook (60_5_180_35_2 shown).
D1
D2
loss in stiffnessfrom cracking
dL
1 2
3
4
5
Potential cracklocations
STRUT
Figure 34. Relative slip at locations D1 and D2 for unconfined specimens with debonded length.
Typical behavior of a #7 GR60 steel bar with a 180-degree hook is shown in Figure 35.
The behavior illustrated is similar to that of the #5 specimen in that D1 remains larger than D2
until failure.

BD545-40 Page 42
Slip (in.)
Loa
d (k
ip)
Stre
ss (k
si)
0 0.1 0.2 0.3 0.4 0.50
10
20
30
40
50
60
70
0
15
30
45
60
75
90
105Pu
Py
D1D2
Figure 35. Typical load-slip behavior for #7 GR60 steel specimens with 180-degree hook (60_7_180_35_4 shown).
4.2.3 STAINLESS STEEL SPECIMENS
Figure 36 shows the load displacement behavior for all of the 16 and 20-mm SS
specimens. Also, Figure 36 shows the yield load when testing the bar only (Pyt) for 16mm and
20mm, which confirms that the bars reached yield. The plots for each are shown with different
scales to accentuate the differences in behavior among the specimens with the same size bar. All
of the specimens with 16 mm bars reached their yield point with no bar rupture. In many cases,
the test was terminated when the stroke of the hydraulic jack reached its limit. In contrast, most
specimens with 20 mm bars reached their yield point but then failed by splitting of the concrete.
During this portion of the testing program it was discovered that SS bars from two different heats
had used (Pyt1 and Pyt2), which explains the difference in the yield loads exhibited in Figure 36a
for the 16 mm bars. A second tensile test was conducted on the remaining reinforcing bar. The
results of the tests on the two heats were reported earlier.

BD545-40 Page 43
Displacement (in.)
Loa
d (k
ip)
Loa
d (K
N)
0 0.2 0.4 0.6 0.80
8
16
24
32
40
0
30
60
90
120
150
180
Pyt1
Pyt2
SS_16_90_25_1SS_16_90_25_2SS_16_90_35_1SS_16_90_35_2SS_16_180_35_1SS_16_180_35_2SS_16_180_35_3SS_16_180_35_4
(a)
Displacement (in.)
Loa
d (k
ip)
Loa
d (K
N)
0 0.2 0.4 0.6 0.80
15
30
45
60
75
0
60
120
180
240
300
Pyt
SS_20_90_35_1SS_20_90_35_2SS_20_90_35_4SS_20_180_35_1SS_20_180_35_2SS_20_180_35_3SS_20_180_35_4
(b)
Figure 36. Load - displacement plot for SS (a) 16 mm, and (b) 20 mm.
The test results for SS specimens are shown in the Table 10. f’
cr shows the average
concrete strength of the specimen concrete as tested on the day of the pullout test. Pu is the peak

BD545-40 Page 44
measured load applied to the bar. To allow comparison of the peak measured loads among the
specimens that contained varying concrete strength, Pu was normalized to the square root of the
ratio of the design strength (5500 psi) to the measured strength. Py is the load at which the bar
yielded using the 0.2% offset strain. Δu is the displacement corresponding to Pu and Δy is the
displacement corresponding to Py. The bar stress based on the peak measured load is also given
(Pu /Ab). D1 and D2 represent the total measured slip of the bar when the load in the bar is Pu.

BD545-40 Page 45
Table 10. Test results for SS 16 mm and 20 mm specimens.
Specimen notation f'cr (psi)
Pu (kips)
Py (kips) Δu (in) Δy (in) D1u
(in) D2u (in) Pu/Ab (ksi) cr
u fP
'5500
(kips) Failure Modes
SS_16_90_25_1 6350 35.4 32.15 0.497 0.036 0.287 0.186 105.7 33.0 Bar yield SS_16_90_25_2 6350 33.3 27.44 0.497 0.015 0.265 0.126 99.2 31.0 Bar yield SS_16_90_35_1 6350 36.7 32.84 0.658 0.024 0.446 0.235 109.6 34.2 Bar yield SS_16_90_35_2 6350 33.6 28.98 0.729 0.022 0.413 0.148 100.2 31.3 Bar yield SS_16_180_35_1 6100 36.3 22.62 0.882 0.022 0.400 0.882 110.4 34.5 Bar yield SS_16_180_35_2 6100 37.3 34.89 0.204 0.024 0.207 0.108 113.5 35.4 Bar yield with
concrete splitting SS_16_180_35_3 6100 35.1 32.43 0.177 0.024 0.109 0.102 106.8 33.3 Bar yield and
rupture SS_16_180_35_4 6100 37.4 28.64 0.758 0.032 0.334 0.051 113.8 35.5 Bar yield SS_20_90_35_1 6150 59.5 39.83 0.263 0.033 0.239 0.188 114.9 56.3 Bar yield with
concrete splitting SS_20_90_35_2 6150 59.1 39.75 0.099 0.032 0.193 0.146 114.0 55.9 Bar yield with
concrete splitting SS_20_90_35_3 6150 58.5 N.A 0.011 N.A 0.166 0.158 113.0 55.4 Bar yield with
concrete splitting SS_20_90_35_4 6150 60.4 39.38 0.150 0.032 0.077 0.041 116.5 57.1 Bar yield with
concrete splitting SS_20_180_35_1 6150 62.4 40.94 0.364 0.032 0.222 0.061 120.4 59.0 Bar yield with
concrete splitting SS_20_180_35_2 6150 62.5 35.15 0.358 0.031 0.146 0.043 120.6 59.1 Bar yield with
concrete splitting SS_20_180_35_3 6150 52.5 41.74 0.056 0.032 0.167 0.132 101.3 49.6 Bar yield with
concrete splitting SS_20_180_35_4 6150 55.6 38.03 0.066 0.032 0.152 0.079 107.2 52.5 Bar yield with
concrete splitting

BD545-40 Page 46
The 25-degree strut specimens had shorter debonded lengths than that of the 35-degree
strut specimens, which resulted in larger elastic deformations under the same load (see Figure
37). As a result, it was found that the maximum slip for specimen SS_16_90_35_2 increased
about 56% as the strut angle increased in comparison with the specimen SS_16_90_25_2 (see
Table 10).
Slip (in.)
Loa
d (k
ip)
Stre
ss (k
si)
0 0.1 0.2 0.3 0.4 0.50
8
16
24
32
40
0
25
50
75
100
125
Py
Pu
D1D2
Slip (in.)
Loa
d (k
ip)
Stre
ss (k
si)
0 0.1 0.2 0.3 0.4 0.50
8
16
24
32
40
0
25
50
75
100
125Pu
Py
crossing
D1D2
(a) (b)
Figure 37. Load-slip behavior for specimens (a) SS_16_90_25_2 and (b) SS_16_90_35_2.
Typical load-slip behavior is illustrated in Figure 38 for 16 mm SS specimens. Initial slip
is larger for D1 than for D2. As the load nears yield, however, the plots cross, indicating that the
diagonal crack formed the 1-4-5 spall (Figure 34) in the debonded region of the bar.
Slip (in.)
Loa
d (k
ip)
Stre
ss (k
si)
0 0.1 0.2 0.3 0.40
10
20
30
40
50
0
30
60
90
120
150
Pu
Py
D1D2
Figure 38. Typical load-slip behavior for 16mm SS specimens with both 90 and 180-degree hooks (SS_16_180_35_4 shown).

BD545-40 Page 47
Figure 39 indicates that the 20 mm SS specimens behave more like the #7 GR60 steel
specimens than that of the 16 SS specimens. This may be due to the difference in the failure
mode. Recall that the 16 mm SS specimens did not split while both the #7 GR60 steel and 20
mm SS specimens yielded and then split.
Slip (in.)
Loa
d (k
ip)
Stre
ss (k
si)
0 0.05 0.1 0.15 0.2 0.250
10
20
30
40
50
60
70
0
20
40
60
80
100
120
140Pu
Py
D1D2
Figure 39. Typical load-slip behavior for 20mm SS specimens with both 90 and 180-degree hooks (SS_20_90_35_2 shown).
4.2.4 MMFX SPECIMENS
In this section the detailed results of the MMFX specimens are presented and discussed.
Failure modes for each specimen are documented as well as the load displacement and load slip
behavior.
Figure 40 shows the load displacement behavior for all of the #5 and #7 MM specimens.
Also, Figure 40 shows the bar yield load (Pyt) for #5 and #7. The plots for each are shown with
different scales to accentuate the differences in behavior among the specimens with the same size
bar. All of the specimens with #5 bars reached yield, which appears to be at approximately the
same load. In contrast, just a few specimens with #7 bars reached their yield point before failure
by concrete splitting occurred, indicating that the bond strength was not sufficient to develop the
#7 bars as fully as the #5 bars.

BD545-40 Page 48
Displacement (in.)
Loa
d (k
ip)
Loa
d (K
N)
0 0.1 0.2 0.3 0.40
10
20
30
40
50
60
0
40
80
120
160
200
240Pyt
MM_5_90_25_1MM_5_90_25_2MM_5_90_35_1MM_5_90_35_2MM_5_180_35_1MM_5_180_35_2MM_5_180_35_4
(a)
Displacement (in.)
Loa
d (k
ip)
Loa
d (K
N)
0 0.2 0.4 0.6 0.80
20
40
60
80
0
80
160
240
320Pyt
MM_7_90_25_1MM_7_90_25_2MM_7_90_35_4MM_7_180_35_1MM_7_180_35_2MM_7_180_35_3MM_7_180_35_4
(b)
Figure 40. Load-displacement plot for MM specimens (a) #5, and (b) #7.

BD545-40 Page 49
The test results for MM specimens are shown in the Table 11. f’cr shows the average
concrete strength of the specimen concrete as tested on the day of the pullout test. Pu is the peak
measured load applied to the bar. To allow comparison of the peak measured loads among the
specimens that contained varying concrete strength, Pu was normalized to the square root of the
ratio of the design strength (5500 psi) to the measured strength. Py is the load at which the bar
yielded using the 0.2% offset strain. Δu is the displacement corresponding to Pu and Δy is the
displacement corresponding to Py. The bar stress based on the peak measured load is also given
(Pu /Ab). D1 and D2 represent the total measured slip of the bar when the load in the bar is Pu.
.

BD545-40 Page 50
Table 11. Test results for MM #5 and #7 specimens.
Specimen notation
f'cr (psi)
Pu (kips)
Py (kips) Δu (in) Δy (in) D1u
(in) D2u (in)
Pu/Ab (ksi) cr
u fP
'5500
(kips) Failure Modes
MM_5_90_25_1 6450 49.5 27.6 0.115 0.017 0.071 0.067 159.7 45.7 Bar rupture MM_5_90_25_2 6450 48.6 28.2 0.155 0.017 0.114 0.077 156.7 44.8 Bar rupture
MM_5_90_35_1 6450 44.9 33.3 0.064 0.025 0.145 0.057 144.9 41.5 Bar yield with concrete splitting
MM_5_90_35_2 6450 49.4 34.6 0.162 0.025 0.244 0.233 159.3 45.6 Bar yield with concrete splitting
MM_5_180_35_1 6320 41.0 23.1 0.057 0.025 0.019 0.014 132.3 38.2 Bar yield with concrete splitting
MM_5_180_35_2 6320 51.0 32.7 0.096 0.025 0.087 0.037 164.4 47.5 Bar yield with concrete splitting
MM_5_180_35_3 6320 47.4 44.8 0.051 0.025 0.199 0.197 153.0 44.3 Bar yield with concrete splitting
MM_5_180_35_4 6320 52.9 31.4 0.145 0.026 0.187 0.154 170.5 49.3 Bar rupture MM_7_90_25_1 6600 69.9 N.A 0.021 N.A 0.379 0.291 116.5 63.8 Concrete splitting MM_7_90_25_2 6600 71.7 N.A 0.029 N.A 0.044 0.018 119.4 65.4 Bar cast out of position MM_7_90_35_1 6600 58.3 N.A 0.010 N.A 0.003 0.000 97.1 53.2 Bar cast out of position MM_7_90_35_2 6600 65.8 N.A 0.029 N.A 0.284 0.150 109.6 60.0 Bar cast out of position MM_7_90_35_3 6330 58.9 N.A 0.044 N.A 0.237 0.234 98.2 54.9 Concrete splitting
MM_7_90_35_4 6330 77.2 67.5 0.059 0.044 0.088 0.086 128.6 71.9 Bar yield with concrete splitting
MM_7_180_35_1 6170 59.3 N.A 0.035 N.A 0.171 0.126 98.8 56.0 Concrete splitting
MM_7_180_35_2 6170 71.4 65.3 0.051 0.044 0.077 0.052 119.1 67.5 Bar yield with concrete splitting
MM_7_180_35_3 6170 67.6 N.A 0.014 N.A 0.106 0.096 112.7 63.9 Concrete splitting
MM_7_180_35_4 6170 70.4 59.6 0.068 0.044 0.309 0.252 117.3 66.5 Bar yield with concrete splitting

BD545-40 Page 51
Typical behavior of a #5 and #7 MM specimen with a 90 and 180-degree hooks is shown
in Figure 41 and Figure 42. The behavior illustrated is similar to that of the #5 and #7 GR60
steel specimens with 180 degree hook in that D1 remains larger than D2 until failure. The
maximum slip for specimen MM_5_90_35_2 increased about 114% as the strut angle increased
in comparison with the specimen MM_5_90_25_2. Also, it was found that the maximum slip for
specimen MM_5_180_35_2 increased about 116% as the development length increased in
comparison with the specimen MM_5_180_35_4.
Slip (in.)
Loa
d (k
ip)
Stre
ss (k
si)
0 0.05 0.1 0.15 0.20
10
20
30
40
50
60
0
30
60
90
120
150
180Pu
Py
D1D2
Figure 41. Typical load-slip behavior for #5 MM specimens with either 90 and 180-degree hooks (MM_5_90_25_2 shown).
Slip (in.)
Loa
d (k
ip)
Stre
ss (k
si)
0 0.1 0.2 0.3 0.40
20
40
60
80
0
30
60
90
120Pu
Py
D1D2
Figure 42. Typical load-slip behavior for #7 MM specimens with either 90 and 180-degree hooks (MM_7_180_35_4 shown).

BD545-40 Page 52
5 ANALYSIS OF RESULTS
This chapter presents the results of several analyses that are intended to quantitatively
analyze results of the hooked anchorage tests and determine the suitability of the current design
equations.
5.1 EFFECT OF STRUT ANGLE
One of the variables examined in the series two tests was the angle of the diagonal strut,
which is controlled by the length of the specimen. The average capacities of the two angles, 25
deg. and 35 deg., are compared in Figure 43. All specimens had 90-deg. bend angles to ensure
that this did not cause a variation. The SS and MM specimens showed little effect from the
difference in angle with the possible exception of #7 MM in which the larger angle appeared to
cause a reduction in capacity. The 35-deg specimens had the hooks out of alignment, which may
have contributed to the reduced capacity. Since the angle did not appear to make a significant
difference in the results, 35-degrees was chosen to ensure that the specimen was a compact as
possible for handling.
Strut Angle (deg.)
P u/A
b (k
si)
0
40
80
120
160
25 35 25 35 25 3525 35 25 35 25 35
16mm SS #7 MM
#5 MM
Figure 43. Influence of strut angle on ultimate capacity.

BD545-40 Page 53
5.2 EFFECT OF BEND ANGLE
Figure 44 through Figure 46 provide a compare the capacity of 90-deg. bend against 180-
deg. bends for each steel type. The #5 GR60 bars appear to have been affected by the bend angle
with the 180-deg. angle providing a higher capacity than that of the 90-deg. bend. The
remainder of the specimens, however, does not appear to be significantly affected by the bend
angle. Consequently, the remainder of the analysis does not distinguish the bend angle.
P u
/Ab
(ksi)
0
30
60
90
120
90 180 90 180
85
112
94 94
Bend Angle:Bar Size: #5 #7
Figure 44. Comparison of bend angle for GR60 specimens.
P u/A
b (k
si)
0
30
60
90
120
90 180 90 180
104111 115 112
Bend Angle:Bar Size: 16mm 20mm
Figure 45. Comparison of bend angle for SS specimens.

BD545-40 Page 54
P u/A
b (k
si)
0
40
80
120
160
90 180 90 180
143 144
103 106
Bend Angle:Bar Size: #5 #7
Figure 46. Comparison of bend angle for MM specimens.
5.3 ANCHORAGE CAPACITY
One method that can be used to compare the results of tests on high strength bars is the
excess force capacity available beyond the yield point. Mechanical couplers are required to
reach least 1.25 times the specified yield strength (fy) of the bar when splicing reinforcement
(ACI 318-05 Section 12.14.3.2). The rationale for this approach is not specified, but it has also
been used by Marques and Jirsa (1975) and by Ueda, Lin, and Hawkins (1986) in evaluating the
capacity and ductility of hooked bar anchorages that used GR60 steel. It is likely that this
provides a factor of safety for the coupler should the reinforcing steel have a significantly higher
actual yield strength than specified. The disadvantage of this approach, however, is that the
current research is comparing steels that have higher yield strengths and different post-yield
properties than that of GR60 steel. Consequently, the bars already vary in how much post-yield
strength is available, both in the absolute and relative sense.
For the purposes of analyzing these pullout data, the Anchorage Capacity Ratio (Pu/Py) is
defined as the ultimate capacity of the test specimen divided by the specified yield strength of the
bar in terms of load. Note that the corrected ultimate strength value is used in these calculations
to ensure that the comparison is made with specified values. Table 12 through Table 14 show
the individual anchorage capacity ratios calculated for all of the specimens tested in the strut and
tie test configuration.

BD545-40 Page 55
Figure 47 compares the anchorage capacity ratios by bar size and type of steel. All steel
types and bar sizes exceed the 1.25 mark except for #7 MM, which has a single value above
1.25. Judging the specimens by the 1.25 criteria, then all would be deemed acceptable except for
the #7 MM.
Table 12. Anchorage capacity ratio - GR60 specimens
Specimen notation
Pu (kips) cr
u fP
'5500
(kips)
Py Load at fy
(kips)
Anchorage Ratio
(Pu/Py) 60_5_90_25_1 26.5 26.5 18.6 1.42 60_5_90_25_2 27.0 27.0 18.6 1.45 60_5_180_35_1 34.6 32.9 18.6 1.86 60_5_180_35_2 34.8 33.0 18.6 1.87 60_7_90_47_1 58.1 58.2 36 1.61 60_7_90_47_2 54.1 54.1 36 1.50 60_7_180_35_1 54.4 50.7 36 1.51 60_7_180_35_2 52.4 48.9 36 1.46 60_7_180_35_3 58.9 54.9 36 1.64 60_7_180_35_4 59.1 55.1 36 1.64
Table 13. Anchorage capacity ratio - SS specimens
Specimen notation
Pu (kips) cr
u fP
'5500
(kips)
Py Load at fy
(kips)
Anchorage Ratio
(Pu/Py) SS_16_90_25_1 35.4 33.0 23.4 1.51 SS_16_90_25_2 33.3 31.0 23.4 1.42 SS_16_90_35_1 36.7 34.2 23.4 1.57 SS_16_90_35_2 33.6 31.3 23.4 1.44 SS_16_180_35_1 36.3 34.5 23.4 1.55 SS_16_180_35_2 37.3 35.4 23.4 1.60 SS_16_180_35_3 35.1 33.3 23.4 1.50 SS_16_180_35_4 37.4 35.5 23.4 1.60 SS_20_90_35_1 59.5 56.5 36.5 1.63 SS_20_90_35_2 59.1 56.1 36.5 1.62 SS_20_90_35_3 58.5 55.4 36.5 1.60 SS_20_90_35_4 60.4 57.3 36.5 1.65 SS_20_180_35_1 62.4 59.2 36.5 1.71 SS_20_180_35_2 62.5 59.4 36.5 1.71 SS_20_180_35_3 52.5 49.8 36.5 1.44 SS_20_180_35_4 55.6 52.8 36.5 1.52

BD545-40 Page 56
Table 14 Anchorage capacity ratio - MM specimens
Specimen notation
Pu (kips) cr
u fP
'5500
(kips)
Py Load at fy
(kips)
Anchorage Ratio
(Pu/Py) MM_5_90_25_1 49.5 45.7 31 1.60 MM_5_90_25_2 48.6 44.8 31 1.57 MM_5_90_35_1 44.9 41.5 31 1.45 MM_5_90_35_2 49.4 45.6 31 1.59 MM_5_180_35_1 41.0 38.2 31 1.32 MM_5_180_35_2 51.0 47.5 31 1.65 MM_5_180_35_4 52.9 49.3 31 1.53 MM_7_90_25_1 69.9 63.8 60 1.17 MM_7_90_25_2* 71.7 65.4 60 1.20 MM_7_90_35_1* 58.3 53.2 60 0.97 MM_7_90_35_2* 65.8 60 60 1.10 MM_7_90_35_3 58.9 54.9 60 0.98 MM_7_90_35_4 77.2 71.9 60 1.29 MM_7_180_35_1 59.3 56 60 0.99 MM_7_180_35_2 71.4 67.5 60 1.19 MM_7_180_35_3 67.6 63.9 60 1.13 MM_7_180_35_4 70.4 66.5 60 1.17 * Bars cast out of position.
0.000.250.500.751.001.251.501.752.00
#5 G
R60
#7 G
R60
16m
m S
S
20m
m S
S
#5 M
M
#7 M
M
Reinforcement
Cap
acity
Rat
io (P
u/Py
)
Figure 47. Anchorage capacity ratios for all sizes and steel types.

BD545-40 Page 57
5.4 DUCTILITY
Previous researchers have used ductility as a means to evaluate the performance of
reinforcement anchorage (Azizinamini et al. 1999). The focus was on lap splices of #8 and #11
bars in high-strength concrete. The test setup was four-point bending with the splice centered in
the constant moment region. Displacement ductility was determined by dividing the
displacement at ultimate capacity by the displacement at first yield.
In this research the strain measured in the debonded portion of the bar was used to
determine a strain ductility ratio to compare hook anchorage performance when using a material
other than GR60. This approach resolves the problem of the varying post-yield slopes that occur
in various steel types.
The strain ductility ratio for each specimen was calculated as illustrated in Figure 48.
The bar displacement was divided by the length of the debonded portion of the bar to obtain
strain. The measured load was divided by the nominal bar area to obtain stress. The strain at
ultimate capacity (εu) was determined from the strain measured at the ultimate load of each
specimen and is shown in Table 15 through Table 17. The ultimate strain capacity was then
divided by the yield strain (εy) measured in the bar tests corresponding to 0.35% for the GR60
bars and the 0.2% offset for the SS and MM specimens to form the ductility ratio shown in the
tables (εu/εy).
0
20
40
60
80
100
120
0.000 0.050 0.100 0.150 0.200
Strain (in/in)
Stre
ss (k
si)
Yield point from bar tests (εy)
Strain at ultimate capacity (εu)
Figure 48. Method used to determine the ductility ratio for Specimen SS_16_90_25_2

BD545-40 Page 58
Table 15. Ductility ratio for GR60 steel.
Specimen notation
εu [Strain at Pu]
(in/in)
εy [Strain at 0.35%]
(in/in)
Ductility Ratio (εu/εy)
60_5_90_25_1 0.0580 0.0035 16.6 60_5_90_25_2 0.0579 0.0035 16.6 60_5_180_35_1 0.0699 0.0035 20.0 60_5_180_35_2 0.0701 0.0035 20.0 60_7_90_47_2 0.0347 0.0035 9.9 60_7_180_35_1 0.0261 0.0035 7.5 60_7_180_35_2 0.0248 0.0035 7.1 60_7_180_35_3 0.0361 0.0035 10.3 60_7_180_35_4 0.0433 0.0035 12.4
Table 16. Ductility ratio for SS.
Specimen notation
εu [Strain at Pu]
(in/in)
εy [Strain at 0.2%
offset yield] (in/in)
Ductility Ratio (εu/εy)
SS_16_90_25_1 0.1856 0.0062 30.2 SS_16_90_25_2 0.1896 0.0056 34.2 SS_16_90_35_1 0.1682 0.0062 27.4 SS_16_90_35_2 0.2090 0.0056 37.7 SS_16_180_35_1 0.2256 0.0056 40.6 SS_16_180_35_4 0.1939 0.0056 34.9 SS_20_90_35_1 0.0466 0.0058 8.1 SS_20_90_35_2 0.0175 0.0058 3.0 SS_20_90_35_4 0.0266 0.0058 4.6 SS_20_180_35_1 0.0645 0.0058 11.2 SS_20_180_35_2 0.0635 0.0058 11.0 SS_20_180_35_3 0.0099 0.0058 1.7 SS_20_180_35_4 0.0116 0.0058 2.0

BD545-40 Page 59
Table 17. Ductility ratio for MM specimens.
Specimen notation εu
[Strain at Pu] (in/in)
εy [Strain at 0.2%
offset yield] (in/in)
Ductility Ratio (εu/εy)
MM_5_90_25_1 0.0440 0.0065 6.8 MM_5_90_25_2 0.0590 0.0065 9.1 MM_5_90_35_1 0.0165 0.0065 2.5 MM_5_90_35_2 0.0414 0.0065 6.4 MM_5_180_35_1 0.0147 0.0065 2.3 MM_5_180_35_2 0.0247 0.0065 3.8 MM_5_180_35_4 0.0130 0.0065 2.0 MM_7_90_25_1 0.0370 0.0065 5.7 MM_7_90_25_2 0.0052 0.0067 0.8 MM_7_90_35_1 0.0013 0.0067 0.2 MM_7_90_35_2 0.0038 0.0067 0.6 MM_7_90_35_3 0.0066 0.0067 1.0 MM_7_90_35_4 0.0089 0.0067 1.3 MM_7_180_35_1 0.0053 0.0067 0.8 MM_7_180_35_2 0.0077 0.0067 1.2 MM_7_180_35_3 0.0021 0.0067 0.3 MM_7_180_35_4 0.0103 0.0067 1.5
No clear trend is present when comparing the data from 90-deg and 180-deg hooks.
Consequently, the data have been plotted in Figure 49 to provide a visual comparison across bar
size and steel type. In addition, the mean ductility ratios are presented in Table 18. In all steel
types, the ductility of the smaller bars is greater than that of the larger bars. For instance, #5
GR60 bars have nearly twice the ductility of the #7 bars, while the SS 16mm bars have nearly 6
times the ductility as that of the 20 mm bars. The large difference in the SS bars is likely due, at
least partially, to the longer developments lengths provided for the 16mm bars than was required
by the equation for the specified yield strength of the material (this will be discussed further in
the next section). Finally, the #5 MM specimens have more than 3 times the ductility of the #7
bars. The larger ductility for the smaller bars is expected due to the lower bond stresses created
by the larger surface-area-to-cross-sectional area ratio provided by smaller bars.

BD545-40 Page 60
0.00
10.00
20.00
30.00
40.00
50.00
#5 G
R60
#7 G
R60
16m
m S
S
20m
m S
S
#5 M
M
#7 M
M
Reinforcement
Duc
tility
( εu/ ε
y)
Figure 49. Comparison of ductility ratios.
Table 18. Mean ductility ratio for all steel types
Specimen Bar Size
Mean Ductility
Ratio (εu/εy) GR60 #5 18 #7 9.4 SS 16mm 34 20mm 5.9 MM #5 4.7 #7 1.3

BD545-40 Page 61
5.5 DEVELOPMENT LENGTH EQUATION
The ACI and AASHTO equations given in equations 1 and 2 give identical results for
required development length. The ACI equation will be used here for convenience. The ACI
equation can be rewritten to include the additional multipliers as:
c
yb
f
fKdldh ′
= Equation 12
where the K is the coefficient 0.02. Additional multipliers are needed for epoxy coating,
lightweight aggregate concrete, and concrete cover. If the side cover and cover on bar extension
beyond the hook are not less than 2-1/2 in. and 2 in., respectively for the specimens, then a 0.7
reduction factor is used. The specimens in this research met these criteria.
Equation 12 can be rearranged to allow the computation of the coefficient based on the
test parameters used in this research:
by
cdh
dffl
K7.0
′= Equation 13
where ldh represents the tested development length, db is the nominal diameter of the bar, fy is the
specified yield strength, and f’c is the average concrete strength. The yield strength was selected
to calculate the coefficient because this is the value that would be used in design, not the actual
steel strength. Furthermore, the actual concrete strength was used to ensure that the coefficients
were conservative. They are conservative because this is the concrete strength needed to give the
anchorage capacity measured. If the specified strength was used, then the coefficient would be
unconservatively low. Table 19, Table 20, and Table 21 show the experimental K-factor
obtained for each specimen.
The coefficients for GR60 steel are all within 10% of the code specified equation of 0.02,
indicating that the test conditions for the GR60 steel bars, including tested development length,
matched that required by the code equation. Development lengths were varied for the SS and
MM specimens to determine if the longer development lengths could provide improved

BD545-40 Page 62
performance. The SS coefficients varied from 0.0247 to a maximum of 0.0291. Note that larger
coefficients indicate longer development lengths than required by code.
Table 19. K-factor for #5 and #7 GR60 specimens.
Specimen f'c (psi)
fy (psi)
ldh (in)
db (in) K
60_5_90_25_1 5490 60000 7 0.625 0.0198 60_5_90_25_2 5490 60000 7 0.625 0.0198 60_5_180_35_1 6100 60000 7 0.625 0.0208 60_5_180_35_2 6100 60000 7 0.625 0.0208 60_7_90_47_1 5490 60000 10 0.875 0.0202 60_7_90_47_2 5490 60000 10 0.875 0.0202 60_7_180_35_1 6330 60000 9 0.875 0.0195 60_7_180_35_2 6330 60000 9 0.875 0.0195 60_7_180_35_3 6330 60000 10 0.875 0.0216 60_7_180_35_4 6330 60000 10 0.875 0.0216
Table 20. K-factor for 16 mm and 20 mm SS specimens.
Specimen f'c (psi)
fy (psi)
ldh (in)
db (in) K
SS_16_90_25_1 6350 75000 12 0.625 0.0291 SS_16_90_25_2 6350 75000 12 0.625 0.0291 SS_16_90_35_1 6350 75000 12 0.625 0.0291 SS_16_90_35_2 6350 75000 12 0.625 0.0291 SS_16_180_35_1 6100 75000 11 0.625 0.0262 SS_16_180_35_2 6100 75000 11 0.625 0.0262 SS_16_180_35_3 6100 75000 12 0.625 0.0286 SS_16_180_35_4 6100 75000 12 0.625 0.0286 SS_20_90_35_1 6150 75000 13 0.787 0.0247 SS_20_90_35_2 6150 75000 13 0.787 0.0247 SS_20_90_35_3 6150 75000 14 0.787 0.0266 SS_20_90_35_4 6150 75000 14 0.787 0.0266 SS_20_180_35_1 6150 75000 13 0.787 0.0247 SS_20_180_35_2 6150 75000 13 0.787 0.0247 SS_20_180_35_3 6150 75000 14 0.787 0.0266 SS_20_180_35_4 6150 75000 14 0.787 0.0266

BD545-40 Page 63
Table 21. K-factor for #5 and #7 MM specimens.
Specimen f'c (psi)
fy (psi)
ldh (in)
db (in) K
MM_5_90_25_1 6450 100000 14 0.625 0.0257 MM_5_90_25_2 6450 100000 14 0.625 0.0257 MM_5_90_35_1 6450 100000 14 0.625 0.0257 MM_5_90_35_2 6450 100000 14 0.625 0.0257 MM_5_180_35_1 6320 100000 12 0.625 0.0218 MM_5_180_35_2 6320 100000 12 0.625 0.0218 MM_5_180_35_3 6320 100000 14 0.625 0.0254 MM_5_180_35_4 6320 100000 14 0.625 0.0254 MM_7_90_25_1 6600 100000 20 0.875 0.0265 MM_7_90_25_2* 6600 100000 20 0.875 0.0265 MM_7_90_35_1* 6600 100000 20 0.875 0.0265 MM_7_90_35_2* 6600 100000 20 0.875 0.0265 MM_7_90_35_3 6330 100000 20 0.875 0.0260 MM_7_90_35_4 6330 100000 20 0.875 0.0260 MM_7_180_35_1 6170 100000 17 0.875 0.0218 MM_7_180_35_2 6170 100000 17 0.875 0.0218 MM_7_180_35_3 6170 100000 20 0.875 0.0256 MM_7_180_35_4 6170 100000 20 0.875 0.0256 *Bars cast out of position

BD545-40 Page 64
6 SUMMARY AND CONCLUSIONS
This research report covers testing of concrete reinforcement made with high strength
steel and hooked to provide anchorage. Hooked reinforcement is typically used to develop
reinforcement in a relatively short distance and is usually associated with a nodal region of a
strut and tie system. A test setup was devised that uses the strut and tie behavior of hooked
anchorage to impose forces similar to those occurring in the structure. The specimen
configuration and test setup were arranged to promote a splitting tension failure of the concrete
in the plane of the hook, which is the typical behavior of hooked anchorage without ties. Single
#5 and #7 bars were tested with either 90- or 180-deg standard hooks. GR60 reinforcement was
first tested to ensure that the desired failure mode was achieved and that the ACI and AASHTO
development length equations for hooks did indeed ensure that the reinforcement reached yield
before the concrete failed. Stainless steel reinforcement with a yield strength over 100 ksi and
corrosion resistant reinforcement with a yield strength over 120 ksi were also tested. Anchorage
capacity ratios (ultimate load/specified yield load) were calculated for each of the specimens to
determine the effectiveness of the development lengths. In addition, strain ductility ratios (strain
at ultimate capacity/yield strain from bare bar tension test) were determined for each specimen to
provide a basis for comparison. The following conclusions are offered:
1. The test setup and the procedures using the strut and tie approach appear to provide an
adequate basis to evaluate the unconfined anchorage capacities of GR60 hooked bars.
The predominant failure mode generated using this test setup was splitting of the concrete
in the plane of the hook. GR60 bars gave results consistent and agreeable with ACI and
AASHTO requirements for development lengths. No clear trends indicated a
performance difference between 90-deg. and 180-deg. hooks.
2. The anchorage capacity ratios were well above 1.25 for all specimens except #7 MM.
The majority of the #7 MM specimens had anchorage capacity ratios below 1.25. This is
an indication that development lengths longer than were tested in this program would be
required for the #7 MM or that confinement reinforcement would be needed to ensure
development, or both.
3. The mean strain ductility ratios of the GR60 bars were 18 and 9.4 for #5 and #7,
respectively.

BD545-40 Page 65
4. The mean strain ductility ratios of the SS bars were 34 and 6 for 16 mm and 20mm,
respectively.
5. The mean strain ductility ratios of the MM specimens were 4.7 and 1.3 for #5 and #7,
respectively.
6. Stainless steel #5 and #7 bars and the #5 MM specimens were able to resist loads beyond
their respective yield points as indicated by the ductility ratios. Development lengths
longer than that required by the current design equation, however, were needed to
develop the necessary anchorage forces to attain the reported ductility.

BD545-40 Page 66
7 RECOMMENDATIONS
A test approach and procedure by which hook development length can be tested has been
developed. The test data indicate that the results are applicable for up to and including #7 bars.
Although the tests were conducted on single bars causing a failure mode of concrete splitting in
the plane of the hook, it is anticipated (but not experimentally validated) that multiple hooks
placed in a row will be developed independently and that these results are applicable to those
conditions, assuming code clearances and cover are maintained. Three methods of comparison
were presented. The first was the capacity ratio, which measured the load beyond yield that the
anchorage could sustain. The second was the strain ductility ratio, which is the ultimate bar
strain divided by the yield strain measured in the bar tests. Finally, the development length
equation was reorganized to allow the comparison of the coefficient, K. This coefficient is
indicative of the geometry of the hook and the associated material properties.
Figure 50 shows the development length equations plotted against the capacity ratio for
all test specimens. Figure 51 shows a similar plot with the ductility. Note that as the
development length equation increases (K increases), there is no apparent increase in capacity or
ductility, which may indicate that for larger bars increasing development length will not
necessarily result in increased capacity or ductility. These results are similar to those found in
lap splices in high performance concrete. Increasing the development did not really increase the
splice capacity. In either case, transverse reinforcement may be required to ensure that the bars
can be fully developed.

BD545-40 Page 67
0.00
0.25
0.50
0.75
1.00
1.25
1.50
1.75
2.00
0.0150 0.0200 0.0250 0.0300
Development Length Equation Coefficient K
Cap
acity
Rat
io (P
u/Py)
#5 Grade 60#7 Grade 6016 mm SS20 mm SS#5 MMFX#7 MMFX
Figure 50. Comparison of equation coefficient with capacity ratio
0
10
20
30
40
50
0.0150 0.0200 0.0250 0.0300
Development Length Equation Coefficient K
Duc
tility
( εu/ ε
y)
#5 Grade 60#7 Grade 6016 mm SS20 mm SS#5 MMFX#7 MMFX
Figure 51. Comparison of ductility and development length equation coefficient.
Nevertheless, full development for some of the bars tested in this research was reached.
Consequently, it is recommended that the following adjustment to the code equation be made to
account for the higher strength steels. For bars up to #5 with fy = 100 ksi and fu = 150 ksi and up
to #7 for steel with fy = 75 ksi and fu = 100 ksi the recommended change to the ACI Equation is:

BD545-40 Page 68
cfyfbλd.
le
dh ′=
ψ0260 Equation 14
Where ψe is the epoxy coated reinforcement factor, λ is the lightweight aggregate factor,
db is the nominal bar diameter, fy is the specified yield strength of the steel, and f’c is the
specified compressive strength of the concrete.
For bars up to #5 with fy = 100 ksi and fu = 150 ksi and up to #7 for steel with fy = 75 ksi
and fu = 100 ksi the recommended change to AASHTO LRFD Specifications equation is:
cfbd
l dh ′=
50 Equation 15
8 FUTURE RESEARCH
The research reported in this report presented a test procedure for determine the
effectiveness of standard hook anchorage for concrete reinforcement. The variables studied in
this research were limited to #5 and #7 bar sizes that were unconfined by transverse
reinforcement. Although longer development lengths were attempted for the #7 MM specimens,
full development of these bars was unsuccessful. Further research is required to determine if
even longer lengths can develop these bars. If not, transverse reinforcement should be
investigated to determine if the full development length can be reached. Another option might
be to increase the radius of the bar bend to ease the bearing stresses on the inside of the bar.
Finally, bars up to #11 should be tested to determine if these bars can be developed without
transverse reinforcement.
9 REFERENCES
AASHTO (2001). “ Standard Specifications for Highway Bridges.” American Association of
States Highway and Transportation Officials.
ACI 408.1R-79 (1979). “Suggested Development, Splice, and Standard Hook Provisions for
Deformed Bars in Tension.” American Concrete Institute.

BD545-40 Page 69
ACI Committee 318 (1977). “Building Code Requirements for Reinforced Concrete (ACI 318-
77).” American Concrete Institute.
ACI Committee 318 (1995). “Building Code Requirements for Reinforced Concrete (ACI 318-
95).” American Concrete Institute.
ACI Committee 318 (2002). “Building Code Requirements for Reinforced Concrete (ACI 318-
02).” American Concrete Institute.
ASTM A 370 (2007). “Standard Test Methods and Definitions for Mechanical Testing of Steel
Products.” American Society for Testing and Materials.
ASTM A1035/A1035M (2007). “Standard Specification for Deformed and Plain, Low-carbon,
Chromium, Steel Bars for Concrete Reinforcement.” American Society for Testing and
Materials.
ASTM C 39 (1999). “Standard Test Method for Compressive Strength of Cylindrical Concrete
Specimens.” American Society for Testing and Materials.
ASTM C 143 (2000). “Standard Test Method for Slump of Hydraulic Cement Concrete.”
American Society for Testing and Materials.
Ahlborn, Tess and DenHarting Tim (2002). “A Comparative Bond Study of MMFX Reinforcing
Steel in Concrete”. Michigan Technological University. Center for Structural Durability.
Final Report CSD-2002-03.
Azizinamini, A., Darwin, D., Eligehausen, R., Pavel, R., and Ghosh, S. K. (1999) “Proposed
Modifications to ACI 318-95 Tension Development and Lap Splice for High-Strength
Concrete” ACI Structural Journal, 96(6), 822-827.
Hamad, B.S., Jirsa, J.O. and D’Abreu de Paulo, N.I (1993). “Anchorage Strength of Epoxy-
Coated Hooked Bars.” ACI Structural Journal, 90(2), 210-217.

BD545-40 Page 70
Jirsa, J.O., Lutz, L.A. and Gergely, P (1979). “Rationale for Suggested Development, Splice, and
Standard Hook Provisions for Deformed Bars in Tension.” Concrete International, 79(7),
47-61.
Marques, J.L.G., and Jirsa, J.O (1975). “A Study of Hooked Bar Anchorages in Beam-Column
Joints.” ACI Journal, 72(5), 198-209.
Minor, J., and Jirsa, J.O (1975). “Behavior of Bent Bar Anchorages.” ACI Journal, 72(4), 141-
149.
Pinc, R.L., Watkins, M.D. and Jirsa, J.O (1977). “Strength of Hooked Bar Anchorages in Beam-
Column Joints.” CESRL Report No. 77-3, Department of Civil Engineering, The
University of Texas, Austin, Texas.

BD545-40 Page 71
APPENDIX A
Table 22. Compressive concrete strength results –age (days)
Concrete Strength (psi) - Age (days) Batches 7 14 21 28
1 4670 5850 6320 - 2 3490 4420 5050 5890 3 6350 6690 - 8060 4 5170 6320 6670 7160 5 4170 5330 6150 6880
Table 23. Tensile test results.
#5 Grade 60
Samples Yield Strength at 0.35% strain (ksi)
Strain at 0.35% yield (in/in)
Load at 0.35% strain (kip)
Ultimate Strength (ksi)
Elongation (%)
1 62.78 0.0035 19.46 104.6 9 2 62.74 0.0035 19.45 104.8 9 Avg. 62.76 0.0035 19.46 104.7 9 COV (%) 0 0 0 0
#7 Grade 60
Samples Yield Strength at 0.35% strain (ksi)
Strain at 0.35% yield (in/in)
Load at 0.35% strain (kip)
Ultimate Strength (ksi)
Elongation (%)
1 63.51 0.0035 38.10 105.9 13 2 63.96 0.0035 38.37 105.9 13 Avg. 63.73 0.0035 38.24 105.9 13 COV (%) < 1 < 1 < 1 < 1
16 mm Stainless Steel (Heat 1)
Samples Yield Strength at 0.2% offset (ksi)
Strain at 0.2% offset yield
(in/in) Load at 0.2% offset (kip)
Ultimate Strength (ksi)
Elongation (%)
1 93.262 0.0056 28.911 114.25 20 2 88.800 0.0055 27.528 112.79 18 Avg. 91.031 0.00555 28.220 113.52 19 COV (%) 3 1 3 1

BD545-40 Page 72
Table 23. Tensile test results (cont.)
16 mm Stainless Steel (Heat 2)
Samples Yield Strength at 0.2% offset (ksi)
Strain at 0.2% offset yield
(in/in) Load at 0.2% offset (kip)
Ultimate Strength (ksi)
Elongation (%)
1 106.2 0.0061 32.93 123.9 n/a 2 106.2 0.0062 32.92 123.7 n/a Avg. 106.2 0.00615 32.92 123.8 n/a COV (%) < 1 1 < 1 < 1
20 mm Stainless Steel
Samples Yield Strength at 0.2% offset (ksi)
Strain at 0.2% offset yield
(in/in) Load at 0.2% offset (kip)
Ultimate Strength (ksi)
Elongation (%)
1 100.7 0.0063 49.03 119.9 20 2 100.9 0.006 49.17 120.2 16 Avg. 100.8 0.0061 49.10 120.0 18 COV (%) < 1 3 < 1 < 1 16
#5 MMFX
Samples Yield Strength at 0.2% offset (ksi)
Strain at 0.2% offset yield
(in/in) Load at 0.2% offset (kip)
Ultimate Strength (ksi)
Elongation (%)
1 123.273 0.00648 38.215 157.79 5 2 121.622 0.00650 37.703 158.50 8 Avg. 122.448 0.00649 37.959 158.14 COV (%) 1 < 1 1 < 1
#7 MMFX
Samples Yield Strength at 0.2% offset (ksi)
Strain at 0.2% offset yield
(in/in) Load at 0.2% offset (kip)
Ultimate Strength (ksi)
Elongation (%)
1 128.089 0.0066 76.854 163.12 6 2 128.073 0.0068 76.844 162.81 8 Avg. 128.081 0.0067 76.849 162.97 COV (%) < 1 2 < 1 < 1

BD545-40 Page 73
APPENDIX B
Table 24. Crack patterns, failure modes, load-slip, and stress-strain curves for GR60 steel hooked
bars.
Top Front Rear Bottom
Right Left
60_5_90_1
Bar yield followed by concrete splitting
Top Front Rear Bottom
Right Left
60_5_90_S
Bar Rupture
Slip (in.)
Loa
d (k
ip)
Stre
ss (k
si)
Load-Slip for Linear Pots60_5_90_1
0 0.05 0.1 0.15 0.20
5
10
15
20
25
30
0
15
30
45
60
75
90
Linear pot 1Linear pot 2
Slip (in.)
Loa
d (k
ip)
Stre
ss (k
si)
Load-Slip for Linear Pots60_5_90_S
0 0.05 0.1 0.15 0.20
5
10
15
20
25
30
0
15
30
45
60
75
90
Linear pot 1Linear pot 2

BD545-40 Page 74
Displacement (in.)
Loa
d (k
ip)
Loa
d (K
N)
Load-Displacement60_5_90_1 vs. 60_5_90_S
0 0.08 0.16 0.24 0.320
4
8
12
16
20
24
28
0
20
40
60
80
100
120
60_5_90_160_5_90_S

BD545-40 Page 75
Top Front Rear Bottom
Right Left
60_5_90_25_1
Bar yield followed by concrete splitting
Top Front Rear Bottom
60_5_90_25_2
Bar yield followed by concrete splitting
Right Left
Slip (in.)
Loa
d (k
ip)
Stre
ss (k
si)
Load-Slip for Linear Pots60_5_90_25_2
0 0.05 0.1 0.15 0.20
5
10
15
20
25
30
0
15
30
45
60
75
90
Linear pot 1Linear pot 2
Displacement (in.)
Loa
d (k
ip)
Loa
d (K
N)
Load-Displacement60_5_90_25_1 vs. 60_5_90_25_2
-0.01 0.04 0.09 0.14 0.190
5
10
15
20
25
30
0
20
40
60
80
100
120
-0.01 0.04 0.09 0.14 0.190
5
10
15
20
25
30
0
20
40
60
80
100
120
60_5_90_25_160_5_90_25_2
Strain (in/in)
Stre
ss (k
si)
Stre
ss (M
Pa)
Stress-Strain60_5_90_25_1 vs. 60_5_90_25_2
-0.01 0.01 0.03 0.050
20
40
60
80
100
0
150
300
450
600
60_5_90_25_160_5_90_25_2

BD545-40 Page 76
60_5_180_35_1
Bar Rupture
Top Front Rear Bottom
Right Left
60_5_180_35_2
Bar Rupture
Top Front Rear Bottom
Right Left
Slip (in.)
Loa
d (k
ip)
Stre
ss (k
si)
Load-Slip for Linear Pots60_5_180_35_1
0 0.05 0.1 0.15 0.20
6
12
18
24
30
36
0
20
40
60
80
100
Linear pot 1Linear pot 2
Slip (in.)
Loa
d (k
ip)
Stre
ss (k
si)
Load-Slip for Linear Pots60_5_180_35_2
0 0.05 0.1 0.15 0.20
6
12
18
24
30
36
0
20
40
60
80
100
0 0.05 0.1 0.15 0.20
6
12
18
24
30
36
0
20
40
60
80
100
Linear pot 1Linear pot 2
Displacement (in.)
Loa
d (k
ip)
Loa
d (K
N)
Load-Displacement60_5_180_35_1 vs. 60_5_180_35_2
0 0.06 0.12 0.18 0.24 0.30
6
12
18
24
30
36
0
25
50
75
100
125
150
60_5_180_35_160_5_180_35_2
Strain (in/in)
Stre
ss (k
si)
Stre
ss (M
Pa)
Stress-Strain60_5_180_35_1 vs. 60_5_180_35_2
0 0.02 0.04 0.06 0.080
20
40
60
80
100
120
0
150
300
450
600
750
60_5_180_35_160_5_180_35_2

BD545-40 Page 77
Top Front Rear Bottom
Right Left
60_7_90_1
Bar yield followed by concrete splitting
Top Front Rear Bottom
Right Left
60_7_90_S
Bar yield followed by concrete splitting
Slip (in.)
Loa
d (k
ip)
Stre
ss (k
si)
Load-Slip for Linear Pots60_7_90_1
0 0.04 0.08 0.12 0.160
10
20
30
40
50
60
0
15
30
45
60
75
90
Linear pot 1Linear pot 2
Slip (in.)
Loa
d (k
ip)
Stre
ss (k
si)
Load-Slip for Linear Pots60_7_90_S
0 0.04 0.08 0.12 0.160
10
20
30
40
50
60
0
15
30
45
60
75
90
Linear pot 1Linear pot 2
Displacement (in.)
Loa
d (k
ip)
Loa
d (K
N)
Load-Displacement60_7_90_1 vs. 60_7_90_S
0 0.025 0.05 0.075 0.10
10
20
30
40
50
60
0
40
80
120
160
200
240
60_7_90_160_7_90_S

BD545-40 Page 78
Top Front Rear Bottom
Right Left
60_7_90_47_1
Bar yield followed by concrete splitting
Top Front Rear Bottom
Right Left
60_7_90_47_2
Bar yield followed by concrete splitting
Slip (in.)
Loa
d (k
ip)
Stre
ss (k
si)
Load_Slip for Linear Pots60_7_90_47_2
0 0.08 0.16 0.24 0.320 0
10 17
20 33
30 50
40 67
50 83
60 100
Linear pot 1Linear pot 2
Displacement (in.)
Loa
d (k
ip)
Loa
d (K
N)
Load-Displacement60_7_90_47_1 vs. 60_7_90_47_2
0 0.15 0.3 0.45 0.60
10
20
30
40
50
60
0
40
80
120
160
200
240
60_7_90_47_160_7_90_47_2
Strain (in/in)
Stre
ss (k
si)
Stre
ss (M
Pa)
Stress-Strain60_7_90_47_1 vs. 60_7_90_47_2
-0.01 0.01 0.03 0.050
20
40
60
80
100
0
150
300
450
600
60_7_90_47_160_7_90_47_2

BD545-40 Page 79
Top Front Rear Bottom
Right Left
60_7_180_35_1
Bar yield followed by concrete splitting
Top Front Rear Bottom
60_7_180_35_2
Bar yield followed by concrete splitting
Right Left
Slip (in.)
Loa
d (k
ip)
Stre
ss (k
si)
Load-Slip for Linear Pots60_7_180_35_1
0 0.08 0.16 0.24 0.320
10
20
30
40
50
60
0
15
30
45
60
75
90
Linear pot 1Linear pot 2
Slip (in.)
Loa
d (k
ip)
Stre
ss (k
si)
Load-Slip for Linear Pots60_7_180_35_2
0 0.08 0.16 0.24 0.320
10
20
30
40
50
60
0
15
30
45
60
75
90
Linear pot 1Linear pot 2
Displacement (in.)
Loa
d (k
ip)
Loa
d (K
N)
Load-Displacement60_7_180_35_1 vs. 60_7_180_35_2
0 0.05 0.1 0.15 0.20
10
20
30
40
50
60
0
40
80
120
160
200
240
0 0.05 0.1 0.15 0.20
10
20
30
40
50
60
0
40
80
120
160
200
240
60_7_180_35_160_7_180_35_2
Strain (in/in)
Stre
ss (k
si)
Stre
ss (M
Pa)
Stress-Strain60_7_180_35_1 vs. 60_7_180_35_2
0 0.008 0.016 0.024 0.0320
20
40
60
80
100
0
150
300
450
600
0 0.008 0.016 0.024 0.0320
20
40
60
80
100
0
150
300
450
600
60_7_180_35_160_7_180_35_2

BD545-40 Page 80
Top Front Rear Bottom
60_7_180_35_3
Bar yield followed by concrete splitting
Right Left
Top Front Rear Bottom
60_7_180_35_4
Bar yield followed by concrete splitting
Right Left
Slip (in.)
Loa
d (k
ip)
Stre
ss (k
si)
Load-Slip for Linear Pots60_7_180_35_3
0 0.1 0.2 0.3 0.4 0.50
10
20
30
40
50
60
70
0
15
30
45
60
75
90
105
Linear Pot 1Linear Pot 2
Slip (in.)
Loa
d (k
ip)
Stre
ss (k
si)
Load-Slip for Linear Pots60_7_180_35_4
0 0.1 0.2 0.3 0.4 0.50
10
20
30
40
50
60
70
0
15
30
45
60
75
90
105
Linear Pot 1Linear Pot 2
Displacement (in.)
Loa
d (k
ip)
Loa
d (K
N)
Load-Displacement60_7_180_35_3 vs. 60_7_180_35_4
0 0.08 0.16 0.24 0.320
10
20
30
40
50
60
70
0
40
80
120
160
200
240
280
60_7_180_35_360_7_180_35_4
Strain (in./in)
Stre
ss (k
si)
Stre
ss (M
Pa)
Stress-Strain60_7_180_35_3 vs. 60_7_180_35_4
0 0.01 0.02 0.03 0.04 0.050
15
30
45
60
75
90
105
0
100
200
300
400
500
600
700
60_7_180_35_360_7_180_35_4

BD545-40 Page 81
Table 25. Crack patterns, failure modes, load-slip, and stress-strain curves for stainless steel hooked bars.
Top Front Rear Bottom
Right Left
SS_16_90_25_1
Bar yield no rupture stroke limit reached
Top Front Rear Bottom
Right Left
SS_16_90_25_2
Bar yield no rupture stroke limit reached
Slip (in.)
Loa
d (k
ip)
Stre
ss (k
si)
Load-Slip for Linear PotsSS_16_90_25_1
0 0.08 0.16 0.24 0.320
8
16
24
32
40
0
25
50
75
100
125
Linear pot 1Linear pot 2
Slip (in.)
Loa
d (k
ip)
Stre
ss (k
si)
Load-Slip for Linear PotsSS_16_90_25_2
0 0.08 0.16 0.24 0.320
8
16
24
32
40
0
25
50
75
100
125
Linear pot 1Linear pot 2
Displacment (in.)
Loa
d (k
ip)
Loa
d (K
N)
Load-DisplacmentSS_16_90_25_1 vs. SS_16_90_25_2
0 0.15 0.3 0.45 0.60
8
16
24
32
40
0
30
60
90
120
150
180
SS_16_90_25_1SS_16_90_25_2
Strain (in/in)
Stre
ss (k
si)
Stre
ss (M
Pa)
Stress-StrainSS_16_90_25_1 vs. SS_16_90_25_2
0 0.06 0.12 0.18 0.240
20
40
60
80
100
120
0
150
300
450
600
750
SS_16_90_25_1SS_16_90_25_2

BD545-40 Page 82
Top Front Rear Bottom
Right Left
SS_16_90_35_1
Bar yield no rupture stroke limit reached
Top Front Rear Bottom
Right Left
SS_16_90_35_2
Bar yield no rupture stroke limit reached
Slip (in.)
Loa
d (k
ip)
Stre
ss (k
si)
Load-Slip for Linear PotsSS_16_90_35_1
0 0.1 0.2 0.3 0.4 0.50
8
16
24
32
40
0
25
50
75
100
125
Linear pot 1Linear pot 2
Slip (in.)
Loa
d (k
ip)
Stre
ss (k
si)
Load-Slip for Linear PotsSS_16_90_35_2
0 0.1 0.2 0.3 0.4 0.50
8
16
24
32
40
0
25
50
75
100
125
Linear pot 1Linear pot 2
Displacement (in.)
Loa
d (k
ip)
Loa
d (K
N)
Load-DisplacementSS_16_90_35_1 vs. SS_16_90_35_2
0 0.25 0.5 0.75 10
8
16
24
32
40
0
30
60
90
120
150
180
SS_16_90_35_1SS_16_90_35_2
Strain (in/in)
Stre
ss (k
si)
Stre
ss (M
Pa)
Stress_StrainSS_16_90_35_1 vs. SS_16_90_35_2
0 0.06 0.12 0.18 0.240
20
40
60
80
100
120
0
150
300
450
600
750
SS_16_90_35_1SS_16_90_35_2

BD545-40 Page 83
Top Front Rear Bottom
Right Left
SS_16_180_35_1
Bar yield no rupture stroke limit reached
Top Front Rear Bottom
Right Left
SS_16_180_35_2
Bar yield followed by concrete splitting
Slip (in.)
Loa
d (k
ip)
Stre
ss (k
si)
Load-Slip for Linear PotsSS_16_180_35_1
0 0.1 0.2 0.3 0.4 0.50
10
20
30
40
0
30
60
90
120
Linear pot 1Linear pot 2
Slip (in.)
Loa
d (k
ip)
Stre
ss (k
si)
Load-Slip for Linear PotsSS_16_180_35_2
0 0.1 0.2 0.3 0.4 0.50
10
20
30
40
0
30
60
90
120
Linear pot 1Linear pot 2
Displacement (in.)
Loa
d (k
ip)
Loa
d (K
N)
Load-DisplacementSS_16_180_35_1 vs. SS_16_180_35_2
0 0.25 0.5 0.75 10
8
16
24
32
40
0
30
60
90
120
150
180
SS_16_180_35_1SS_16_180_35_2
Strain (in/in.)
Stre
ss (k
si)
Stre
ss (M
Pa)
Stress-StrainSS_16_180_35_1 vs. SS_16_180_35_2
0 0.06 0.12 0.18 0.240
20
40
60
80
100
120
140
0
150
300
450
600
750
900
SS_16_180_35_1SS_16_180_35_2

BD545-40 Page 84
Top Front Rear Bottom
Right Left
SS_16_180_35_3
Bar Rupture
Top Front Rear Bottom
Right Left
SS_16_180_35_4
Bar yield no rupture stroke limit reached
Slip (in.)
Loa
d (k
ip)
Stre
ss (k
si)
Load-Slip for Linear PotsSS_16_180_35_3
0 0.1 0.2 0.3 0.40
10
20
30
40
0
30
60
90
120
Linear pot 1Linear pot 2
Slip (in.)
Loa
d (k
ip)
Stre
ss (k
si)
Load-Slip for Linear PotsSS_16_180_35_4
0 0.1 0.2 0.3 0.40
10
20
30
40
0
30
60
90
120
Linear pot 1Linear pot 2
Displacement (in.)
Loa
d (k
ip)
Loa
d (K
N)
Load-DisplacementSS_16_180_35_3 vs. SS_16_180_35_4
0 0.2 0.4 0.6 0.80
10
20
30
40
0
40
80
120
160
SS_16_180_35_3SS_16_180_35_4
Strain (in/in)
Stre
ss (k
si)
Stre
ss (M
Pa)
Stress-StrainSS_16_180_35_3 vs. SS_16_180_35_4
0 0.06 0.12 0.18 0.240
20
40
60
80
100
120
140
0
150
300
450
600
750
900
SS_16_180_35_3SS_16_180_35_4

BD545-40 Page 85
Top Front Rear Bottom
Right Left
SS_20_90_35_1
Bar yield followed by concrete splitting
SS_20_90_35_2
Bar yield followed by concrete splitting
Top Front Rear Bottom
Right Left
Slip (in.)
Loa
d (k
ip)
Stre
ss (k
si)
Load-Slip for Linear PotsSS_20_90_35_1
0 0.06 0.12 0.18 0.24 0.30
10
20
30
40
50
60
70
0
20
40
60
80
100
120
140
Linear pot 1Linear pot 2
Slip (in.)
Loa
d (k
ip)
Stre
ss (k
si)
Load-Slip for Linear PotsSS_20_90_35_2
0 0.06 0.12 0.18 0.24 0.30
10
20
30
40
50
60
70
0
20
40
60
80
100
120
140
Linear pot 1Linear pot 2
Displacement (in.)
Loa
d (k
ip)
Loa
d (K
N)
Load-DisplacementSS_20_90_35_1 vs. SS_20_90_35_2
0 0.06 0.12 0.18 0.24 0.30
15
30
45
60
75
0
60
120
180
240
300
SS_20_90�_35_1SS_20_90�_35_2
Strain (in/in)
Stre
ss (k
si)
Stre
ss (M
Pa)
Stress-StrainSS_20_90_35_1 vs. SS_20_90_35_2
0 0.01 0.02 0.03 0.04 0.050
20
40
60
80
100
120
140
0
150
300
450
600
750
900
SS_20_90_35_1SS_20_90_35_2

BD545-40 Page 86
Top Front Rear Bottom
Right Left
SS_20_90_35_3
Bar yield followed by concrete splitting
Top Front Rear Bottom
Right Left
SS_20_90_35_4
Bar yield followed by concrete splitting
Slip (in.)
Loa
d (k
ip)
Stre
ss (k
si)
Load-Slip for Linear PotsSS_20_90_35_3
0 0.06 0.12 0.18 0.24 0.30
10
20
30
40
50
60
70
0
20
40
60
80
100
120
140
Linear pot 1Linear pot 2
Slip (in.)
Loa
d (k
ip)
Stre
ss (k
si)
Load-Slip for Linear PotsSS_20_90_35_4
0 0.06 0.12 0.18 0.24 0.30
10
20
30
40
50
60
70
0
20
40
60
80
100
120
140
Linear pot 1Linear pot 2
Displacement (in.)
Loa
d (k
ip)
Loa
d (K
N)
Load-DisplacementSS_20_90_35_3 vs. SS_20_90_35_4
-0.02 0.02 0.06 0.1 0.140
20
40
60
80
0
80
160
240
320
SS_20_90_35_3SS_20_90_35_4
Strain (in/in)
Stre
ss (k
si)
Stre
ss (M
Pa)
Stress-StrainSS_20_90_35_3 vs. SS_20_90_35_4
-0.005 0.005 0.015 0.0250
20
40
60
80
100
120
140
0
150
300
450
600
750
900
SS_20_90_35_3SS_20_90_35_4

BD545-40 Page 87
SS_20_180_35_1
Bar yield followed by concrete splitting
Top Front Rear Bottom
Right Left
SS_20_180_35_2
Bar yield followed by concrete splitting
Top Front Rear Bottom
Right Left
Slip (in.)
Loa
d (k
ip)
Stre
ss (k
si)
Load-Slip for Linear PotsSS_20_180_35_1
0 0.05 0.1 0.15 0.2 0.250
20
40
60
80
0
40
80
120
160
Linear pot 1Linear pot 2
Slip (in.)
Loa
d (k
ip)
Stre
ss (k
si)
Load-Slip for Linear PotsSS_20_180_35_2
0 0.05 0.1 0.15 0.2 0.250
20
40
60
80
0
40
80
120
160
Linear pot 1Linear pot 2
Displacement (in.)
Loa
d (k
ip)
Loa
d (K
N)
Load-DisplacementSS_20_180_35_1 vs. SS_20_180_35_2
0 0.1 0.2 0.3 0.40
20
40
60
80
0
80
160
240
320
SS_20_180_35_1SS_20_180_35_2
Strain (in/in)
Stre
ss (k
si)
Stre
ss (K
N)
Stress-StrainSS_20_180_35_1 vs. SS_20_180_35_2
0 0.02 0.04 0.06 0.080
20
40
60
80
100
120
140
0
150
300
450
600
750
900
SS_20_180_35_1SS_20_180_35_2

BD545-40 Page 88
Top Front Rear Bottom
Right Left
SS_20_180_35_3
Bar yield followed by concrete splitting
Top Front Rear Bottom
Right Left
SS_20_180_35_4
Bar yield followed by concrete splitting
Slip (in.)
Loa
d (k
ip)
Stre
ss (k
si)
Load-Slip for Linear PotsSS_20_180_35_3
0 0.04 0.08 0.12 0.16 0.20
10
20
30
40
50
60
0
20
40
60
80
100
120
Linear pot 1Linear pot 2
Slip (in.)
Loa
d (k
ip)
Stre
ss (k
si)
Load-Slip for Linear PotsSS_20_180_35_4
0 0.04 0.08 0.12 0.16 0.20
10
20
30
40
50
60
0
20
40
60
80
100
120
Linear pot 1Linear pot 2
Displacement (in.)
Loa
d (k
ip)
Loa
d (K
N)
Load-DisplacementSS_20_180_35_3 vs. SS_20_180_35_4
0 0.02 0.04 0.06 0.080
10
20
30
40
50
60
0
50
100
150
200
250
SS_20_180_35_3SS_20_180_35_4
Strain (in/in)
Stre
ss (k
si)
Stre
ss (M
Pa)
Stress-StrainSS_20_180_35_3 vs. SS_20_180_35_4
0 0.003 0.006 0.009 0.0120
25
50
75
100
125
0
150
300
450
600
750
SS_20_180_35_3SS_20_180_35_4

BD545-40 Page 89
Table 26. Crack patterns, failure modes, load-slip, and stress-strain curves for MMFX hooked bars.
Top Front Rear Bottom
Right Left
MM_5_90_25_1
Bar rupture
Top Front Rear Bottom
Right Left
MM_5_90_25_2
Bar rupture
Slip (in.)
Loa
d (k
ip)
Stre
ss (k
si)
Load-Slip for Linear PotsMM_5_90_25_1
0 0.03 0.06 0.09 0.120
10
20
30
40
50
60
0
30
60
90
120
150
180
Linear pot 1Linear pot 2
Slip (in.)
Loa
d (k
ip)
Stre
ss (k
si)
Load-Slip for Linear PotsMM_5_90_25_2
0 0.03 0.06 0.09 0.120
10
20
30
40
50
60
0
30
60
90
120
150
180
Linear pot 1Linear pot 2
Displacement (in.)
Loa
d (k
ip)
Loa
d (K
N)
Load-DisplacementMM_5_90_25_1 vs. MM_5_90_25_2
0 0.04 0.08 0.12 0.160
10
20
30
40
50
60
0
40
80
120
160
200
240
MM_5_90_25_1MM_5_90_25_2
Strain (in/in)
Stre
ss (k
si)
Stre
ss (M
Pa)
Stress-StrainMM_5_90_25_1 vs. MM_5_90_25_2
0 0.02 0.04 0.06 0.080
30
60
90
120
150
180
0
200
400
600
800
1000
1200
MM_5_90_25_1MM_5_90_25_2

BD545-40 Page 90
Top Front Rear Bottom
Right Left
MM_5_90_35_1
Bar yield followed by concrete splitting
Top Front Rear Bottom
Right Left
MM_5_90_35_2
Bar yield followed by concrete splitting
Slip (in.)
Loa
d (k
ip)
Stre
ss (k
si)
Load-Slip for Linear PotsMM_5_90_35_1
0 0.08 0.16 0.24 0.320
10
20
30
40
50
60
0
30
60
90
120
150
180
Linear pot 1Linear pot 2
Slip (in.)
Loa
d (k
ip)
Stre
ss (k
si)
Load-Slip for Linear PotsMM_5_90_35_2
0 0.08 0.16 0.24 0.320
10
20
30
40
50
60
0
30
60
90
120
150
180
Linear pot 1Linear pot 2
Displacement (in.)
Loa
d (k
ip)
Loa
d (K
N)
Load-DisplacementMM_5_90_35_1 vs. MM_5_90_35_2
0 0.04 0.08 0.12 0.16 0.20
10
20
30
40
50
60
0
40
80
120
160
200
240
MM_5_90_35_1MM_5_90_35_2
Strain (in/in)
Stre
ss (k
si)
Stre
ss (M
Pa)
Stress-StrainMM_5_90_35_1 vs. MM_5_90_35_2
0 0.01 0.02 0.03 0.04 0.050
30
60
90
120
150
180
0
200
400
600
800
1000
1200
MM_5_90_35_1MM_5_90_35_2

BD545-40 Page 91
Top Front Rear Bottom
Right Left
MM_5_180_35_1
Bar yield followed by concrete splitting
Top Front Rear Bottom
Right Left
MM_5_180_35_2
Bar yield followed by concrete splitting
Slip (in.)
Loa
d (k
ip)
Stre
ss (k
si)
Load-Slip for Linear PotsMM_5_180_35_1
0 0.02 0.04 0.06 0.08 0.10
10
20
30
40
50
60
0
30
60
90
120
150
180
Linear pot 1Linear pot 2
Slip (in.)
Loa
d (k
ip)
Stre
ss (k
si)
Load-Slip for Linear PotsMM_5_180_35_2
0 0.02 0.04 0.06 0.08 0.10
10
20
30
40
50
60
0
30
60
90
120
150
180
Linear pot 1Linear pot 2
Displacement (in.)
Loa
d (k
ip)
Loa
d (K
N)
Load-DisplacementMM_5_180_35_1 vs. MM_5_180_35_2
0 0.025 0.05 0.075 0.10
10
20
30
40
50
60
0
40
80
120
160
200
240
MM_5_180_35_1MM_5_180_35_2
Strain (in/in)
Stre
ss (k
si)
Stre
ss (M
Pa)
Stress-StrainMM_5_180_35_1 vs. MM_5_180_35_2
0 0.007 0.014 0.021 0.0280
30
60
90
120
150
180
0
200
400
600
800
1000
1200
MM_5_180_35_1MM_5_180_35_2

BD545-40 Page 92
Top Front Rear Bottom
Right Left
MM_5_180_35_3
Bar yield followed by concrete splitting
Top Front Rear Bottom
Right Left
MM_5_180_35_4
Bar rupture
Slip (in.)
Loa
d (k
ip)
Stre
ss (k
si)
Load-Slip for Linear PotsMM_5_180_35_3
0 0.06 0.12 0.18 0.240
10
20
30
40
50
60
0
30
60
90
120
150
180
Linear pot 1Linear pot 2
Slip (in.)
Loa
d (k
ip)
Stre
ss (k
si)
Load-Slip for Linear PotsMM_5_180_35_4
0 0.06 0.12 0.18 0.240
10
20
30
40
50
60
0
30
60
90
120
150
180
Linear pot 1Linear pot 2
Displacement (in.)
Loa
d (k
ip)
Loa
d (K
N)
Load-DisplacementMM_5_180_35_3 vs. MM_5_180_35_4
0 0.04 0.08 0.12 0.160
10
20
30
40
50
60
0
40
80
120
160
200
240
MM_5_180_35_3MM_5_180_35_4
Strain (in/in)
Stre
ss (k
si)
Stre
ss (M
Pa)
Stress-StrainMM_5_180_35_3 vs. MM_5_180_35_4
0 0.01 0.02 0.03 0.040
30
60
90
120
150
180
0
200
400
600
800
1000
1200
MM_5_180_35_3MM_5_180_35_4

BD545-40 Page 93
Top Front Rear Bottom
Right Left
MM_7_90_25_1
Concrete splitting
Slip (in.)
Loa
d (k
ip)
Stre
ss (k
si)
Load-Slip for Linear PotsMM_7_90_25_1
0 0.1 0.2 0.3 0.40
20
40
60
80
0
60
120
180
240
Linear pot 1Linear pot 2
Slip (in.)
Loa
d (k
ip)
Stre
ss (k
si)
Load-Slip for Linear PotsMM_7_90_25_2
0 0.1 0.2 0.3 0.40
20
40
60
80
0
60
120
180
240
Linear pot 1Linear pot 2
Displacement (in.)
Loa
d (k
ip)
Loa
d (K
N)
Load-DisplacementMM_7_90_25_1 vs. MM_7_90_25_2
0 0.008 0.016 0.024 0.0320
20
40
60
80
0
80
160
240
320
MM_7_90_25_1MM_7_90_25_2
Strain (in/in)
Stre
ss (k
si)
Stre
ss (M
Pa)
Stress_StrainMM_7_90_25_1 vs. MM_7_90_25_2
0 0.0015 0.003 0.0045 0.0060
25
50
75
100
125
0
150
300
450
600
750
MM_7_90_25_1MM_7_90_25_2

BD545-40 Page 94
Top Front Rear Bottom
Right Left
MM_7_90_35_1
Bar cast out of position
Top Front Rear Bottom
Right Left
MM_7_90_35_2
Bar cast out of position
Slip (in.)
Loa
d (k
ip)
Stre
ss (k
si)
Load-Slip for Linear PotsMM_7_90_35_1
0 0.08 0.16 0.24 0.320
20
40
60
80
0
30
60
90
120
Linear pot 1Linear pot 2
Slip (in.)
Loa
d (k
ip)
Stre
ss (k
si)
Load-Slip ComparisonMM_7_90_35_2
0 0.08 0.16 0.24 0.320
20
40
60
80
0
30
60
90
120
Linear pot 1Linear pot 2
Displacement (in.)
Loa
d (k
ip)
Loa
d (K
N)
Load-DisplacementMM_7_90_35_1 vs. MM_7_90_35_2
0 0.008 0.016 0.024 0.0320
20
40
60
80
0
80
160
240
320
MM_7_90_35_1MM_7_90_35_2
Strain (in/in)
Stre
ss (k
si)
Stre
ss (M
Pa)
Stress-StrainMM_7_90_35_1 vs. MM_7_90_35_2
0 0.001 0.002 0.003 0.0040
20
40
60
80
100
120
0
150
300
450
600
750
MM_7_90_35_1MM_7_90_35_2

BD545-40 Page 95
Top Front Rear Bottom
Right Left
MM_7_90_35_3
Concrete splitting
Top Front Rear Bottom
Right Left
MM_7_90_35_4
Bar yield followed by concrete splitting
Displacement (in)
Loa
d (k
ip)
Loa
d (K
N)
Load_DisplecementMM_7_90_35_3 vs. MM_7_90_35_4
0 0.02 0.04 0.06 0.080
20
40
60
80
0
80
160
240
320
MM_7_90_35_3MM_7_90_35_4
Strain (in/in)
Stre
ss (k
si)
Stre
ss (M
Pa)
Stress-StrainMM_7_90_35_3 vs. MM_7_90_35_4
0 0.002 0.004 0.006 0.008 0.010
40
80
120
160
0
300
600
900
MM_7_90_35_3MM_7_90_35_4

BD545-40 Page 96
Top Front Rear Bottom
Right Left
MM_7_180_35_1
Concrete Splitting
Top Front Rear Bottom
Right Left
MM_7_180_35_2
Bar yield followed by concrete splitting
Slip (in.)
Loa
d (k
ip)
Stre
ss (k
si)
Load-Slip for Linear PotsMM_7_180_35_1
0 0.05 0.1 0.15 0.20
20
40
60
80
0
30
60
90
120
Linear pot 1Linear pot 2
Slip (in.)
Loa
d (k
ip)
Stre
ss (k
si)
Load-Slip for Linear PotsMM_7_180_35_2
0 0.05 0.1 0.15 0.20
20
40
60
80
0
30
60
90
120
Linear pot 1Linear pot 2
Displacement (in.)
Loa
d (k
ip)
Loa
d (K
N)
Load-DisplacementMM_7_180_35_1 vs. MM_7_180_35_2
0 0.015 0.03 0.045 0.060
20
40
60
80
0
80
160
240
320
MM_7_180_35_1MM_7_180_35_2
Strain (in/in)
Stre
ss (k
si)
Stre
ss (M
Pa)
Stress-StrainMM_7_180_35_1 vs. MM_7_180_35_2
0 0.002 0.004 0.006 0.0080 0
32 224
64 448
96 672
128 896
MM_7_180_35_1MM_7_180_35_2

BD545-40 Page 97
Top Front Rear Bottom
Right Left
MM_7_180_35_3
Concrete Splitting
Top Front Rear Bottom
Right Left
MM_7_180_35_4
Bar yield followed by concrete splitting
Slip (in.)
Loa
d (k
ip)
Stre
ss (k
si)
Load-Slip for Linear PotsMM_7_180_35_3
0 0.1 0.2 0.3 0.40
20
40
60
80
0
30
60
90
120
Linear pot 1Linear pot 2
Slip (in.)
Loa
d (k
ip)
Stre
ss (k
si)
Load-Slip for Linear PotsMM_7_180_35_4
0 0.1 0.2 0.3 0.40
20
40
60
80
0
30
60
90
120
Linear pot 1Linear pot 2
Displacement (in.)
Loa
d (k
ip)
Loa
d (K
N)
Load-DisplacementMM_7_180_35_3 vs. MM_7_180_35_4
0 0.02 0.04 0.06 0.080
20
40
60
80
0
80
160
240
320
MM_7_180_35_3MM_7_180_35_4
Strain (in/in)
Stre
ss (k
si)
Stre
ss (M
Pa)
Stress-StrainMM_7_180_35_3 vs. MM_7_180_35_4
0 0.003 0.006 0.009 0.0120
25
50
75
100
125
0
150
300
450
600
750
MM_7_180_35_3MM_7_180_35_4

BD545-40 Page 98
APPENDIX C
Two fully confined tests were conducted on MMFX bars. Figure 52 shows the test setup.
A single #6 bar was embedded in the reinforced slab as shown. The slab for test 1 was
constructed with concrete that had an average strength of 7251 psi when tested at 33 days. The
slab for test 2 had an average strength of 6572 psi when tested at 29 days. The embedment
provided was calculated according to ACI 318-02 section 12.5 assuming f’c = 6000 psi and a
yield strength of fy = 120 ksi, which resulted in a development length of approximately 16.3 in.
after the application of the appropriate reduction factors. Because the bar was embedded in a
continuous slab with very large cover, it was decided to use a smaller development length since
the goal at that time was to determine the actual development length and not to test the
applicability of the ACI equation for MMFX hooked bars. Therefore, an embedment of 14 in.
was selected as development length for the #6 900 hooked MMFX bars.
The bar was tested using two structural steel wide-flange shapes spanning between
supports placed near the edge of the slab. The hydraulic jack was placed on the frame and the
bar was secured with a strand chuck for a 0.6-in. diameter prestressing strand. Hydraulic
pressure was applied until the bar ruptured.

BD545-40 Page 99
(a) (b)
(c)
Figure 52. Confined test setup (a) schematic, (b) end view photo, and (c) elevation photo.
Load was measured with a load cell mounted between the jack and chuck. Displacement
was measured with an LVDT placed on the end of the bar with reference to the surface of the
concrete. The resulting gage length for the elongation measurement was approximately 55
inches.
60”

BD545-40 Page 100
Figure 54 shows the load displacement relationship for the two tests. The load-
displacement relationship remains linear up to the proportional limit at approximately 120 ksi.
Beyond the proportional limit, bar test 1 and 2 reached an ultimate stress of 235 ksi and 190 ksi,
respectively. Bar test 2 was paused for several minutes during loading, which may have affected
the results.
The development length used was lower than that calculated by the ACI equation for a
900 hook. However, the bar was fully developed (ruptured) even with the lower embedment and
despite the fact that the yield strength used to calculate the development length was 120 ksi in
contrast to the actual ultimate tensile strength of the bars which was approximately 190 ksi and
235 ksi.
Figure 53. Bar condition after test (a) spalled concrete around base of bar and (b) rupture surface of bar.

BD545-40 Page 101
Strain (in/in)
Stre
ss (k
si)
0 0.02 0.04 0.06 0.080
50
100
150
200
250
Bar Test 1Bar Test 2
Figure 54. Load displacement of bar tests.