behavioral assumptions in energy efficiency potential studies
TRANSCRIPT
Behavioral Assumptions in Energy Efficiency Potential Studies
Prepared by:
Principal Investigator and Primary Author
Mithra Moezzi, Ph.D. Ghoulem Research
Contributing Authors
Maithili Iyer, Ph.D., Lawrence Berkeley National Laboratory Loren Lutzenhiser, Ph.D., Portland State University
James Woods, Ph.D., Portland State University
Prepared for:
CIEE Behavior and Energy Program Edward Vine, Program Manager
California Institute for Energy and Environment 1333 Broadway, Suite 240
Oakland, CA 94612-1918
May 2009

DISCLAIMER This report was prepared as an account of work sponsored by the California Public Utilities Commission. It does not necessarily represent the views of the Commission or any of its employees except to the extent, if any, that it has formally been approved by the Commission at a public meeting. For information regarding any such action, communicate directly with the Commission at 505 Van Ness Avenue, San Francisco, California 94102. Neither the Commission nor the State of California, nor any officer, employee, or any of its subcontractors or Subcontractors makes any warranty, express or implied, or assumes any legal liability whatsoever for the contents of this document.

i
Acknowledgements
The authors acknowledge the contributions of the following people and thank them for having very generously shared their time and ideas: Ahmad Faruqui, Rafael Friedmann, Bruce Hackett, Jeff Loiter, Alan Meier, Mike Rufo, and Ken Seiden. We also thank the anonymous reviewers of the draft, the program managers Linda Schuck and Ed Vine of the California Institute for Energy and Environment, Jane Peters of Research Into Action, Inc., and the California Public Utilities Commission for funding this work.

Behavioral Assumptions in Energy Efficiency Potential Studies
ii
iii
Abstract
This paper is one of a series of white papers commissioned by the California Public Utilities Commission (CPUC) to address topics in energy use and behavior. It considers the behavioral assumptions in energy efficiency potential studies, and options for modifying and supplementing these assumptions, using recent California energy efficiency potential studies as the main example. Besides fulfilling planning and administrative roles as intended, energy efficiency potential studies present a statement on what energy efficiency programs can and should do, and even a template for thinking on the diffusion of energy efficiency and the future energy use of society. Such broader interpretations, of interest outside the utility planning community, transcend the original intended scope of the studies. An analysis of the behavioral assumptions of energy efficiency potential studies properly considers both what is expressed in energy efficiency potential studies on their own terms, as well as what these studies – and device-centered views of energy efficiency in general – miss. This paper addresses both the narrower and broader views of bottom-up energy efficiency potential studies.
As to the narrower level, California energy efficiency potential studies explicitly consider behavior only as a matter of technology adoption. Technology adoptions are modeled as decisions based on cost-effectiveness, subject to the effect of generalized market barriers. Demand-side management programs are modeled as affecting adoption rates, both through financial incentives and through overcoming market barriers. The empirical data available to support these depictions of technology adoption are quite limited. Insofar as our analysis can surmise, the approach of current California energy efficiency potential studies is at least adequate for their intended purposes, especially given the limitations of modeling something as complex as future energy use. There are, however, modeling enhancements that could be made, data that could be collected, and differences between the modeled view and social scientific view of the problems that could be addressed – in particular, the degree to which energy efficiency programs can overcome market barriers. Some possible changes are suggested, along with research recommendations to support these changes. Rather than modeling enhancements per se, the chief behavioral concern is that the concepts of how energy efficiency works that are embodied in energy efficiency potential studies restrict how researchers and policymakers see the problem of future energy use, as well as solutions to the policy problems of the day.
This broader interpretation of energy efficiency potential studies is especially important when the policy goal is reducing absolute levels of energy consumption and carbon emissions. Energy efficiency potential studies are only partially oriented to this question, but bring together many of the basic assumptions of the energy efficiency field. These assumptions link to a constellation of relationships among technology, behavior, physical and social systems, societal change, and energy use, much beyond utility demand-side management programs. This high-level view suggests that efforts directed to individual voluntary changes, and even mandatory changes at the level of isolated devices and structures, miss some of the most important determinants of societal energy use. Exploring these other levels and routes to influencing them can open new possibilities for reducing future energy use, as well as help to improve current energy efficiency program assumptions.

Behavioral Assumptions in Energy Efficiency Potential Studies
iv
i
Table of Contents
Executive Summary........................................................................................................I
1. Introduction ..............................................................................................................1 1.1 Scope and Strategy..................................................................................................2 1.2 Context for Energy Efficiency Potential Studies ......................................................3
1.3 Purpose of Energy Efficiency Potential Studies .......................................................5 1.4 California vs. IOU perspective ................................................................................6
2. Narrower and Broader Views of Potential ..............................................................8 2.1 Basic Structure of Bottom-Up Energy Efficiency Potential Estimation ....................9
2.2 Assessing Behavioral Assumptions .......................................................................13 2.3 Broader Potential...................................................................................................14
3. Role of Behavioral Assumptions ..........................................................................21 3.1.1 Data ............................................................................................................................... 22
3.2 Usage ....................................................................................................................23 3.2.1 Averages versus Distributions..................................................................................... 24 3.2.2 Energy Price Elasticity................................................................................................. 25 3.2.3 Rebound and Other Post-Installation Changes in Use............................................... 26 3.2.4 Manual versus Automatic ............................................................................................ 27 3.2.5 Measure Effectiveness & Persistence ......................................................................... 28
3.3 Measure Adoption .................................................................................................29 3.3.1 Details: California Energy Efficiency Potential Study Example .............................. 30 3.3.2 Theories on Why Energy Efficiency Investments are “Under” ................................ 33 3.3.3 Possibilities for Improvement ..................................................................................... 38
4. Prospects for Integrating Behavioral Conservation Measures ..........................40 4.1 BC Hydro’s Conservation Potential Review ..........................................................41
4.2 Residential Conservation Measures .......................................................................43 4.3 Commercial Sector Measures ................................................................................46
4.4 Beyond Behavior...................................................................................................48 4.5 Prospects and Difficulties......................................................................................49

Behavioral Assumptions in Energy Efficiency Potential Studies
ii
5. Quantitative Data on Energy Behavior .................................................................51 5.1 Information as Intervention ...................................................................................51 5.2 Reviews on Behavior-Centered Intervention..........................................................52
5.3 Why Collecting and Using Behavioral Data Is Hard ..............................................54
6. Technology Examples............................................................................................57 6.1 Residential Sector..................................................................................................57
6.1.1 Programmable Thermostats ......................................................................................... 58 6.1.2 Swimming Pool Covers ............................................................................................... 61 6.1.3 CFLs.............................................................................................................................. 61
6.2 Commercial Sector Examples................................................................................62 6.2.1 Leadership in Energy and Environmental Design (LEED) Program........................ 63 6.2.2 Daylighting and Lighting Controls ............................................................................. 64
7. Alternative Views on Potential ..............................................................................66 7.1 Using Difference and Change................................................................................66
7.1.1 Energy Crises................................................................................................................ 67 7.1.2 Feedback ....................................................................................................................... 68 7.1.3 Variation and Difference ............................................................................................. 68
7.2 Visions and Actions...............................................................................................70
7.3 Modeling Suggestions ...........................................................................................71
8. Summary, Conclusions, and Recommendations ................................................73 8.1 Within Frame Recommendations...........................................................................74
1. Landscape of Energy-Relevant Purchase Decision-Making ..................................... 74 2. Meta-analysis of Program Data................................................................................... 75 3. Uncertainty ................................................................................................................... 75
8.2 Expanding Frame Recommendations.....................................................................75 4. Behavioral Conservation ............................................................................................. 75 5. Observational Studies .................................................................................................. 76 6. Higher Scales of Efficiency and Consumption: From the Individual to the
Sociotechnical.............................................................................................................. 76 8.3 Outside Scope and Crosscutting Recommendations...............................................77
7. Institutions .................................................................................................................... 77 8. Making Social Sciences (Appear) Useful: Better Understanding Between Social
Scientists and Technologists, and More Coordination Between Academic and Corporate Work ........................................................................................................... 78
Behavioral Assumptions in Energy Efficiency Potential Studies
iii
9. References..............................................................................................................79
Appendix A: Glossary .................................................................................................98
List of Figures Figure 1: Three Different Levels at Which Energy Efficiency Potential Studies Can Be Interrogated.........................................................................................................8 Figure 2: Relative Shares of Residential Electricity End-Use Consumption In California ......................................................................................................................57
List of Tables Table 1: Types of Energy Efficiency Potential Identified In Standard Energy Efficiency Potential Studies...........................................................................................10
Table 2: The Variety of Realms Influencing Energy Use ...............................................15 Table 3: Snapshot Comparison of Equipment-Based Versus Behavioral and Lifestyle Conservation Achievable Potential for 2026 (20 year forecast) in BC Hydro's 2007 Conservation Potential Review ................................................................42
Table 4: Examples of Behavioral Conservation Measures for the Residential Sector, Based on Measures Included in BC Hydro’s 2007 Conservation Potential Review ..........................................................................................................................44 Table 5: Examples of Occupant Behavioral Conservation Measures for the Commercial Sector, All Included in BC Hydro’s 2007 Conservation Potential Review ..........................................................................................................................47

Behavioral Assumptions in Energy Efficiency Potential Studies
iv

I
Executive Summary
This paper is one of a series of white papers commissioned by the California Public Utilities Commission (CPUC) to address topics in energy use and behavior. It considers the behavioral assumptions in energy efficiency potential studies, options for modifying and supplementing these assumptions, and how the question of energy efficiency potential could be expanded to meet the new policy challenges that call for aggressive absolute reductions in energy consumption and carbon emissions. The focus is on California energy efficiency potential studies; only residential and commercial sectors are considered.
California energy efficiency potential studies estimate the potential for future energy savings through utility demand-side management (DSM) programs, relating future energy savings from a portfolio of technological measures under a variety of program funding scenarios. Most of the explicit behavioral assumptions lie in the analytical step between economic potential and achievable (and program) potential. This step uses a technology adoption model in which consumers, whether individuals or organizations, adopt energy efficiency measures according to their cost-effectiveness, as mediated by market barriers. In the most recent California studies, market barriers are represented by two high-level parameters: awareness of a measure and willingness to adopt that product if it were cost-effective. Programs are modeled as influencing adoption, both through reducing the incremental cost of measures via incentives, and through decreasing the impact of barriers by increasing consumer awareness of measures and their willingness to adopt them. Cost-effectiveness criteria and barrier levels are assigned for each measure in the portfolio; barrier levels are assigned based on professional judgment.
Social scientists have long argued the faults of the basic technology adoption model employed in energy efficiency potential studies, pointing to many differences in how consumers actually adopt energy efficiency relative to model depictions. The concept of market barriers does not adequately capture all of these differences. The scales and intents of the technology adoption model and the social scientific critiques are very different, however, and many of the differences noted by social scientists are not amenable to modeling. Among the changes that might profitably be made to California energy efficiency potential studies are the following: more explicit accounting of split-incentive situations; updating payback and cost-effectiveness criteria by new experiments or analysis of program data; and improvements in the depiction of market barriers. The analysis also underscores questions about the ability of increased program funding to overcome barriers to measure adoption; in particular, aggressive information campaigns and high levels of program incentives cannot necessarily get consumers to adopt technology at the desired levels.
Due to the complexity of the questions addressed and the difficulties of quantifying behavior from a calculative standpoint, there are strict limits to the value of elaborating the basic model insofar as gross planning needs are concerned. Looking at the differences between the social scientific and physical-technical-economic modeled views of decision-making, however, provides a basis for revealing knowledge gaps and for bringing schematic understandings of technology adoption closer to the problems observed in the real world. This revised view can
Behavioral Assumptions in Energy Efficiency Potential Studies
II
help policy to better address new problems and new contexts. It can also help to reveal where current definitions and implementations of energy efficiency may run at cross-purposes to reduced energy use.
More attention to qualitative observations, as well as more quantitative data, can help to construct a new core view of how energy is used and how increases in energy efficiency are adopted. Among the possibilities raised in this new core view are the following: shifts in attention away from cost-effectiveness and towards assuring non-energy benefits; better tracking of absolute consumption; better integration of the variability of energy use, as opposed to average use; improved understanding of automation versus manual control; more measurement of energy use in practice; and more recognition of the sociotechnical context that shapes energy consumption and how this context might be influenced by policy.
Energy efficiency potential studies are not designed to consider all routes to societal energy savings. In general, bottom-up energy efficiency potential studies:
Do not consider major infrastructural, lifestyle, societal, or behavioral changes;
Center on individual devices and incremental change to isolated technologies, rather than service provision systems;
Consider a limited set of technical measures presently commercial viable, usually without speculating on technological advancements; and
Prioritize particular definitions of cost-effectiveness.
Energy efficiency potential studies cannot address decisions about what energy services are used or decisions affecting indirect energy consumption. They also cannot address possibilities of large-scale changes to technological and social systems that shape the context for energy services. This means that much of what matters about energy use – as opposed to increases in device-level energy efficiency – are not accounted for in energy efficiency potential studies. This is not the fault of the studies, which are restricted by remit, by what DSM programs do, by standards of what constitutes proper evidence, and by modeling logic and feasibility. Rather, the limitations of energy efficiency potential studies for addressing energy efficiency potential is revealed by comparing the assumptions of energy efficiency potential analysis to outside views of how energy is consumed and saved. Greenhouse gas (GHG) emission goals, in particular, force attention to these alternative views, especially because the relative savings provided by energy efficiency, as historically defined, translate only partially to absolute reductions in GHG emissions.
Energy efficiency potential studies provide a constructive launching point for beginning to attend to these new goals and alternative views. For example, the 2007 Conservation Potential Review by the Canadian utility BC Hydro added behavioral conservation measures alongside technical measures in their bottom-up assessment of future energy savings potential. This addition contrasts with traditional energy efficiency potential studies in integrating behavioral change as a consumption-reduction strategy and thus in relaxing the standard assumption that energy savings measures do not reduce energy service levels.

Behavioral Assumptions in Energy Efficiency Potential Studies
III
Evidence of substantial behavioral energy conservation during energy crisis, results from energy-use feedback studies in the residential sector, and differences in energy consumption amongst premises and across countries all underscore that a great deal of variation in energy use is a matter of factors other than technology and weather. But there are major difficulties in quantifying the effects of behavioral and social change, and, in particular, in relating policy interventions to behavioral and social change, and to persistent energy savings. These difficulties, and the overall “softness” of behavioral change, as opposed to the apparent solidity of technological change, have been stumbling blocks to sufficient acknowledgment and assessment of behavior.
To improve knowledge about how behavior relates to potential energy savings, this paper suggests possible research topics, both within and outside the traditional framework for energy efficiency potential studies. Three of these topics are within the current framework for energy efficiency potential studies:
1. More detailed understanding of the landscape of energy-relevant purchase decision-making, including the quantification and extent of some important market barriers
2. Meta-analysis of utility program data to help support modeling and program development
3. Improved analysis of uncertainty, in order to make uncertainty more explicit and to help judge how much any prospective data and structural improvements “matter” quantitatively
An additional three topics pertain to an expanded frame for energy efficiency potential studies:
4. Better understanding of behavioral conservation, energy service use, the psychological effects of energy conservation communications, and related topics
5. More observations of what people and organizations actually do – how they use energy and make energy-relevant purchases – from a sociological rather than a technical perspective
6. Moving away from an emphasis on individual choices and devices to more attention to the sociotechnical infrastructure that shapes possibilities, needs, and desires
Finally, we suggest two crosscutting topics:
7. Analysis of institutional constraints faced by researchers, funders, and policymakers, relative to the new policy problems faced
8. Better understanding between social scientists and the rest of the field toward improving the utility of and expectations for social science (such as, strengthened links and joint projects among corporate analysts, academic researchers, government researchers, and policymakers)
Behavioral Assumptions in Energy Efficiency Potential Studies
IV
With the expanded global interest in energy efficiency, the field has the opportunity to become a leader in a fundamentally applied realm, one intersecting the emerging transdisciplinary field of sustainability science. In crystallizing some of the central questions about energy efficiency in society (e.g., how efficiency is defined, what program strategies can be taken to achieve policy goals, how social welfare should be accounted for), energy efficiency potential studies provide a forum to broaden the energy efficiency field’s terms of engagement with these more fundamental questions, and to move from the objective of persuading society to conform to various technical and economic ideals to the objective of supporting sociotechnical transformation that is socially welcome, as well as reducing energy and environmental burdens.
1
1. Introduction This white paper is one of a series of papers commissioned by the California Public Utilities Commission (CPUC) to address topics in energy use and behavior. The present paper examines behavioral assumptions in energy efficiency potential studies. California utilities are currently required to submit energy efficiency potential studies to the CPUC every two years. Rather than being a detailed technical review of these CPUC studies, interpreted strictly within the California regulatory context, the paper uses California and other energy efficiency potential studies as a platform to examine an array of perspectives relating behavior to energy savings.1
Energy efficiency potential studies are a widespread industry practice (EPRI 2009; Frisch 2008; NAPEE 2007). They fulfill planning and administrative roles, as they are designed to do. But they also present a statement on what energy efficiency does, can, and should do. After a lull in their practice between the mid-1990s to early 2000s, renewed concerns about energy supply and the embrace of climate change as a societal problem have brought a new wave of energy efficiency potential studies. The new wave of studies emerges in a fresh context: intensified interest in diffusing energy-efficient technologies in the name of reducing absolute levels of energy consumption and growing interest in the prospects for mobilizing behavioral change to do so. Behavioral change beyond purchasing is outside the immediate scope of most energy efficiency potential studies. But questions of energy efficiency and energy savings potential are of interest beyond the limits that resource planners and program implementers face, so a proper analysis of behavioral assumptions in the study of energy efficiency potential must proceed beyond these limits.
This white paper examines the new wave of energy potential studies with a two-fold purpose. First, it provides a technical discussion of the behavioral assumptions made in these energy efficiency studies and addresses the utility, adequacy, rationale, and data support for these assumptions. It highlights some general assumptions of the field that have been made stark by their expression in energy efficiency potential models and suggests possibilities for improvements. Second, it steps outside the conventional framework for calculating energy efficiency potential and examines alternative frames for understanding behavior’s role in future energy use. The intent is to open up space for constructive debate at the intersection of technical and social scientific views on energy efficiency potential.
California energy efficiency potential studies assess how much future supply needs would be reduced by increases in the energy efficiency of a specific portfolio of measures, as related to given levels of utility program investment. Energy efficiency potential studies have historically excluded behavioral changes, other than those implied in technology adoption. Rather, energy
1 Thus, this paper is intended as an outside view of energy efficiency potential studies. None of the authors have conducted energy efficiency potential studies nor worked for demand-side management programs. Understanding of how energy efficiency potential studies are conducted has been greatly improved by interviews with the industry experts noted in the acknowledgements.
Behavioral Assumptions in Energy Efficiency Potential Studies
2
savings are framed as a technological matter, with clear boundaries on what changes are considered, and rules that rest in regulatory guidelines and in long-standing industry traditions and assumptions.2 This makes the studies unambiguous to interpret, more straightforward to conduct, and creates a conservatism that helps establish credibility. The questions answered are clear, insofar as they are bounded by the methodology itself.
When the policy research objective is exploring routes to reduced energy use, these assumptions become too restrictive. They rest on rigid notions of needs and energy services, and troublesome measures of social welfare. They do not acknowledge the fluidity of behavior nor the importance of context. They cannot capture the effects of large-scale social and technical systems that shape and constrain individual decision-making, and they rarely address the vexed relationship between increased device efficiency and absolute levels of consumption (Herring 1998; Levett 1998; Lutzenhiser 1993, 2002b; Moezzi & Diamond 2005; Sanne 2002; Shove 2003a, 2003b; Shui & Dowlatabadi 2005; Wilhite 2007; Wilhite et al. 2000).
These protests do not offer a replacement for the device-centered energy efficiency potential estimation in current practice. But they do help to orient energy efficiency potential studies within the broader questions being asked about future energy use, point to knowledge gaps, and offer some practical possibilities. Above all, they can serve as a refreshed basis for thinking and acting differently in the face of new challenges.
1.1 Scope and Strategy
This examination draws on analysis of published energy efficiency potential studies, interviews with experts in the field of energy efficiency potential estimation, and social scientific and technical literature on energy demand. It is neither a technical critique of any particular energy efficiency potential study nor a detailed analysis of behavioral elements in proprietary calculation models. To limit the scope, only residential and commercial sectors are considered, and the focus is on final adoption decisions and usage, rather than on intermediate market actors or market transformation. Demand response, load shape, supply issues in general, detailed consideration of GHG emissions, and most attribution issues are only incidentally addressed.3
The first two sections cover the basics of energy efficiency potential studies and what sorts of remaining energy savings potential might be considered. The third section uses California studies
2 Rules is meant in the social scientific sense (see Searle 1995); some may be written, some not. 3 Demand-response and load-shape issues are especially interesting from a behavioral point-of-view, but are not the main focus of energy efficiency potential studies. The decision to exclude them from this research project was made at the recommendation of the project manager. The authors also acknowledge the importance of market transformation effects on energy efficiency potential study results, affecting both naturally-occurring energy savings and energy efficiency program potential, but for reasons of scope, these and related topics (free-riders, spillover, attribution, and net-to-gross ratio) are not treated here. Itron and KEMA (2008) discuss issues for estimating market effects for California energy efficiency potential, Sebold et al. (2001) present a theoretical framework for examining market effects.
Behavioral Assumptions in Energy Efficiency Potential Studies
3
as an example to address how behavioral assumptions enter current approaches to energy efficiency potential estimation, offers suggestions for possible improvements, and suggests research questions underscored by the model. The fourth section examines adding behavioral conservation measures to the current energy efficiency potential framework and identifies threshold questions to pursuing this move. These questions require a review of evidence for energy behavior-change program performance in general, covered in the fifth section. Examples of how the traditional energy efficiency potential framework plays out in assessing a few technology-centered measures are then presented. Discussion then returns to some alternative approaches for thinking on energy efficiency and energy savings potential, followed by conclusions and research recommendations.
1.2 Context for Energy Efficiency Potential Studies
Energy efficiency potential studies not only refer to a specific genre of study, but also a widespread approach to thinking about future energy use, with roots going back at least forty years.4 California’s AB2021 and SB1037 require that the state’s Investor Owned Utilities (IOUs) and Public Owned Utilities (POUs) report on projected savings from energy efficiency programs, with cost-effective energy efficiency serving as the first-choice solution to future energy supply.5 The core framework and basic assumptions of these studies have evolved and been partly traditionalized through practice, as well as through formal specifications, such as outlined in the CPUC’s Standard Practice Manual (CPUC 2001). The recent California studies for IOU potential are well developed and publicly documented. This analysis focuses on methods outlined in the latest available California Energy Efficiency Potential Study (Itron & KEMA 2008).
Outside of California, at least 36 U.S. state and regional energy efficiency potential studies have been published since 1998 (Frisch 2008). In their guide to conducting energy efficiency potential studies, the National Action Plan on Energy Efficiency (NAPEE) covers results from 21 studies, and discusses the varieties of types and policy situations in which energy efficiency potential studies are used (NAPEE 2007).6 Using the structure outlined in the NAPEE report, EPRI (2009) prepared an energy efficiency potential study for the United States for 2010-2030, using the U.S. Department of Energy’s Energy Information Administration’s (EIA) reference case.
4 Meier (1982) includes a brief history of conservation potential estimation. Early work on conservation supply curves developed in an era of resource planning studies conducted from the late 1980s to mid-1990s, in the context of integrated resources planning, with a rebirth in intensity starting about five years ago, soon after the California 2000-2001 Energy Crisis. 5 This current series of energy efficiency potential studies started, however, with a voluntary study completed by Pacific Gas and Electric (PG&E), funded by the Energy Foundation, California’s Secret Energy Surplus (Rufo & Coito 2002). See also Vine et al. (2007) and NAPEE (2006, 2007). The four California IOUs provide 80% of statewide electricity and peak demand, and 99% of natural gas consumption (KEMA-Xenergy 2003). 6 Other useful reviews include Nadel et al. (2004), which analyzes 11 U.S. energy efficiency potential studies, and Gellings et al. (2006).
Behavioral Assumptions in Energy Efficiency Potential Studies
4
The most elaborate energy efficiency potential studies, including those for California, are bottom-up studies estimating the potential for a specific set of technological measures. Some bottom-up studies focus on end-use, rather than device-centered, modeling (Rufo & North 2007). Others – often cheaper and faster, and the only thing possible when micro-level data are especially weak – are top-down studies estimating efficiency potential as an aggregate reduction, based on past experience (NAPEE 2007). There are also macro-scale studies that address energy efficiency potential through energy productivity (McKinsey Global Institute 2007a, 2007b). The McKinsey study found that U.S. energy productivity – defined as the ratio of real gross domestic product (GDP) to unit of energy – was the lowest energy productivity among developed countries.7
Bottom-up energy efficiency potential studies typically start with calculating the maximum energy savings potential, defined by the complete installation of specified technological changes wherever they are deemed physically feasible, calculated relative to a modeled future reference case. Based on specific criteria, successively smaller slices of this technical potential are designated as economic and achievable (or program) potential. Achievable potential is often separated by naturally-occurring versus program potential. This hierarchy of potential levels forms the basic framework of most bottom-up energy efficiency potential studies. In California’s case, there is a calibration step that scales modeled potential in accordance with recent program performance data. These definitions and steps are treated in more detail below.
Aside from energy efficiency potential studies per se, estimating potential energy savings is one of the most common day-to-day activities of the field. These efforts include, for example, calculations done for designing components of large energy efficiency programs, preparing factoids for marketing material, estimating savings from building codes or appliance standards, and many others. This estimation activity, much of it in the gray literature, is rarely publicly documented in sufficient detail to thoroughly subject it to technical review.8
Energy efficiency potential studies face an evolving policy, technology, and data context. The interpretation of energy efficiency potential studies has accordingly been stretched to address questions beyond the original intent of the studies (Goldstein 2008; Rufo et al. 2008), especially as driven by aggressive state goals for technology diffusion, energy savings, and carbon emissions reductions (CEC 2003; CPUC 2008). At the same time, questions about behavior have become more visible for a variety of reasons: (1) climate change and increased attention to absolute levels of energy use and carbon emissions; (2) the apparent success of behavior-based conservation during the California 2000-2001 Energy Crisis; (3) increased visibility of social marketing for addressing environmental issues in general; (4) a slowing of technological
7 McKinsey (2007b) argues that by using existing technologies with internal rates of an investment return of 10% or more, U.S. energy productivity could be substantially boosted. The study includes transportation energy use. 8 For appliance standards, National Appliance Energy Conservation Act (NAECA) rule-making provides particularly good public documentation, but most analysis does not meet this level of public transparency and is not funded to do so. Furthermore, subjective judgments are often necessary and energy-relevant data are often proprietary.

Behavioral Assumptions in Energy Efficiency Potential Studies
5
progress in energy savings from market-available or market-ready devices (Meier 2003); and (5) perhaps the declining effectiveness of California’s IOU efficiency programs, measured in terms of kWh saved per real dollar spent (CEC 2003).9
As to climate change, California law requires the state to reduce GHG emissions to 1990 levels by 2020, as outlined in AB 32. GHG emissions reduction, however, is only partly aligned with energy efficiency goals (Meier 2003; Moezzi & Diamond 2005). In practice, definitions of efficiency rarely question size (such as the size of a house, as opposed to the thermal characteristics of its components) or absolute consumption, so while delivering relative savings under specific criteria, efficiency does not necessarily deliver absolute savings. This is consistent with the general nature of efficiency as addressing means, not ends. But it leaves the promotion of energy efficiency vulnerable to encouraging increased consumption (Harris et al. 2007; Moezzi & Diamond 2005).
Over two decades of increasingly sophisticated evaluations have yielded more empirical and semi-empirical data. These empirical results may tend to tone down estimates based on cost-effectiveness and modeling alone (Vine et al. 2007).10 Not new, but critical for interpreting energy efficiency potential studies beyond the near future, is the fact that technology develops over time, while the measure lists in energy efficiency potential studies are usually static. This creates difficulties as the presence of currently commercially-available measures becomes saturated (Itron & KEMA 2008). It can also lead to short-sightedness as new technologies and patterns of demand, such as zero-net energy buildings and electric vehicle charging, come into view.11 These uncertainties all limit the value of adding modeling complexity or increasing data precision in energy efficiency potential modeling.
1.3 Purpose of Energy Efficiency Potential Studies
NAPEE (2007) identifies three main purposes for energy efficiency potential studies: (1) to make a political case for the importance of energy efficiency; (2) to evaluate energy efficiency as an alternative to energy supply; and (3) to examine funding levels and how to allocate funding across various program options. The California studies emphasize the latter goal, to “help
9 The increase in naturally-occurring potential seen in recent California energy efficiency potential studies, reflecting the increased general awareness of efficiency in the population as whole (Itron & KEMA 2008), may be contributing to this decline. 10 In another example of how empirical findings have influenced modeling assumptions, the 2008 California energy efficiency potential study reduced per-unit energy savings for boiler controllers by 80%, based on the results of a recent impact evaluation (Itron & KEMA 2008, p. 11.13). 11 The 2008 California residential and commercial sector energy efficiency potential study makes estimates for two periods: while focusing on 2007-2016, it also includes 2016-2026. The latter period is modeled with the same technology measure list as used for 2007-2016, adding in or continuing previous savings as equipment dies. The study authors (Itron & KEMA, p. 4.4-4.5) note that while new, more efficient measures are expected to be developed and adopted by consumers, speculating on these developments would be at odds with the primary value of the study, “characterizing energy efficiency at a high level of detail over the short- to mid-term.”
Behavioral Assumptions in Energy Efficiency Potential Studies
6
determine where potential savings remain and which technologies offer the most efficient opportunities for energy savings” (Itron & KEMA 2008).
By intent, these California energy efficiency potential studies consider potential from only certain kinds of changes. Relative to these included changes, future energy use is affected by a far greater array of factors. Some of these are treated in the exogenous reference case, against which some energy efficiency potential studies calculate savings, and some do not. To address potential, what is included and what is not must be clear.
1.4 California vs. IOU perspective
Bottom-up energy efficiency potential studies are designed to consider only certain possibilities for change. They:
Do not consider major infrastructural, lifestyle, or societal changes, and consider energy service needs as fixed;
Consider a very limited scope of behavioral change;12
Center on individual devices, rather than service provision systems; and
Consider only technical measures presently commercial viable, usually without speculating on technological advancements or exploring customized optimization.
They furthermore inject cost-effectiveness criteria toward ensuring that programs improve social welfare.13 Most studies, including the recent California studies (CMUA 2007; Itron & KEMA 2008), focus on the potential of utility demand-side management (DSM) programs, net of standards and codes, and of federal and state programs, such as ENERGY STAR® and Flex Your Power. 14 The measures considered are defined to avoid reductions in energy services, as consistent with the traditional definition of end-use or device-level energy efficiency.15 In
12 DSM programs attempt to influence consumers’ adoption of efficient technologies via information, financial incentives, and influences on the supply chain, which can be considered behavioral. Certain technological measures may also require changes in habitual behavior in order to be effective (e.g., replacing compressor cooling with the use of a whole-house fan for some load hours, noted in Section 3), but these changes are coincidental to the study itself. 13 The technical potential stage does not require cost-effectiveness, but measures are usually pre-selected to meet or have a good chance of meeting the cost-effectiveness criteria used to define economic potential (NAPEE 2007); these, in turn, are subjected to cost-effectiveness criteria to estimate adoptions. 14 Rufo (2007) offers a list of strengths and weaknesses of the California energy efficiency potential studies. Among the strengths: use of saturation data and stock accounting; calibration to past accomplishments; and suitability for treating “widgets.” Among the weaknesses: lack of empirical data; quality of data; static measures; treatment of market effects over time; “out of sample” initiatives; false perceptions of precision; and limited treatment of uncertainty. 15 See, for example, the definition given in NAPEE 2007 (p. 2-1).
Behavioral Assumptions in Energy Efficiency Potential Studies
7
general, these measures are straightforward swap-outs to more efficient technologies already on the market, rather than changes at a larger scale. Major structural changes, such as Heating Ventilation and Air Conditioning (HVAC) and building envelope systems redesign in residential buildings (KEMA-Xenergy 2003), or other whole-house efficiency strategies, are not usually considered. And of course, only a limited set of measures can practically be included in any study, among the thousands of measures that could be specified.16
Behavioral changes and lifestyle changes are hard to specify and measure, harder to prove, harder still to prove persistent, and – because of the way that social welfare is conventionally defined – threaten the presumption that energy programs should increase social welfare. In particular, the implicit logic appears to be that if these behavioral changes are accompanied by reduced energy use, they do so without concomitant non-energy benefits, so that they result reduction in energy services and, by implication, social welfare other than monetary savings. Neither behavioral changes nor larger-scale societal changes, such as variations in how things are used, where people live, and what daily schedules are like, are considered. Nor are these changes amenable to the energy efficiency potential modeling framework or, for the most part, DSM programs. Instead, energy efficiency potential studies are down-to-earth studies that try to project the near- and mid-term potential, based on projections of future purchases mediated by past experience.
The outstanding strength of California energy efficiency potential studies is their ability to lay out a well-bounded system and to play within it, using an assemblage of the best available data. This modeling system also serves as a statement about what is considered controllable and what is considered exogenous to the project of energy efficiency.17 These restrictions render the studies comprehensible and credible, but incomplete when it comes to thinking on how future energy use might change. Some California energy efficiency potential studies have loosened certain restrictions. For example, Rufo & North (2007) examine residential electricity efficiency potential through 2050 by including increasing proportions of multifamily housing, and BC Hydro’s Conservation Potential Review considered behavioral conservation and lifestyle changes (Section 4, below).
Even more can be done. The next section summarizes the core structure of bottom-up energy efficiency potential studies. It uses this structure as a launching point for raising questions about the intersection of behavior and technology toward building a revised view of energy efficiency and energy savings potential.
16 For example, cooking, electric miscellaneous uses, televisions, computers, and waterbeds are not included (KEMA-Xenergy 2003); see also the discussion of California residential electricity use in Section 6. While such end-uses in sum account for a considerable proportion of electricity consumption, each consumes little itself. The details required to manage measure-specific savings potential would be difficult to support and defend. 17 The target “project” for California energy efficiency potential studies is formally the energy efficiency programs of the IOUs or POUs.
8
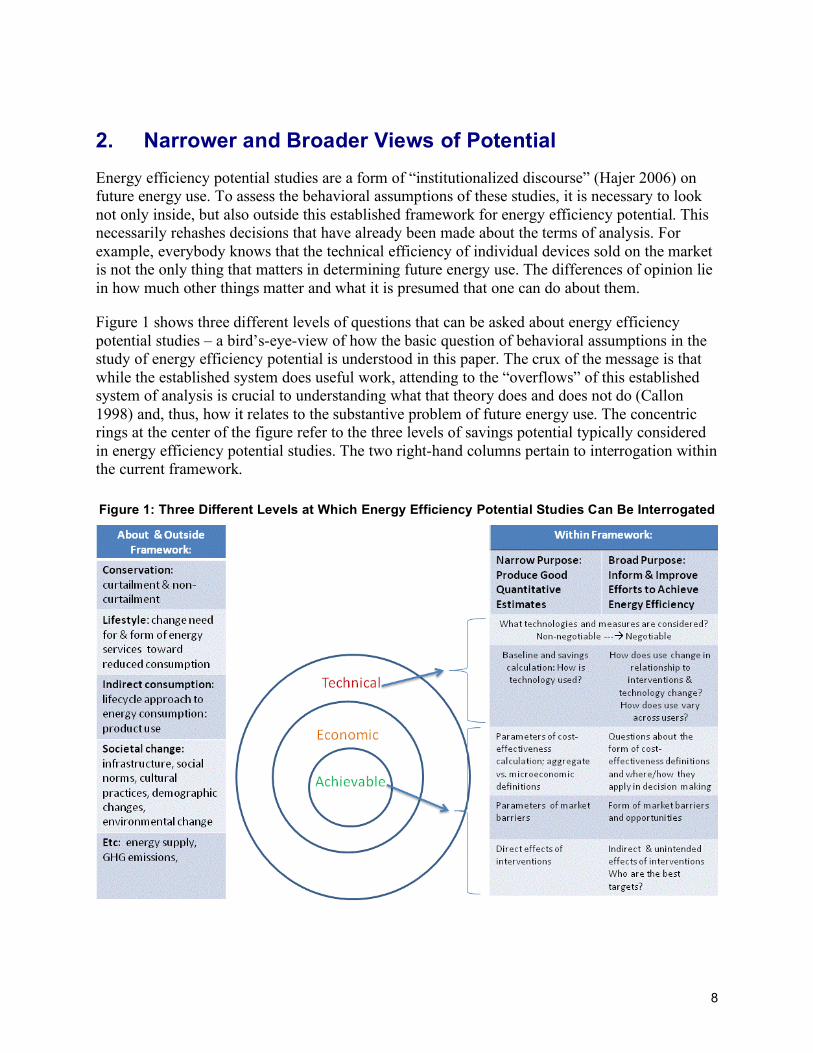
2. Narrower and Broader Views of Potential Energy efficiency potential studies are a form of “institutionalized discourse” (Hajer 2006) on future energy use. To assess the behavioral assumptions of these studies, it is necessary to look not only inside, but also outside this established framework for energy efficiency potential. This necessarily rehashes decisions that have already been made about the terms of analysis. For example, everybody knows that the technical efficiency of individual devices sold on the market is not the only thing that matters in determining future energy use. The differences of opinion lie in how much other things matter and what it is presumed that one can do about them.
Figure 1 shows three different levels of questions that can be asked about energy efficiency potential studies – a bird’s-eye-view of how the basic question of behavioral assumptions in the study of energy efficiency potential is understood in this paper. The crux of the message is that while the established system does useful work, attending to the “overflows” of this established system of analysis is crucial to understanding what that theory does and does not do (Callon 1998) and, thus, how it relates to the substantive problem of future energy use. The concentric rings at the center of the figure refer to the three levels of savings potential typically considered in energy efficiency potential studies. The two right-hand columns pertain to interrogation within the current framework.
Figure 1: Three Different Levels at Which Energy Efficiency Potential Studies Can Be Interrogated
Behavioral Assumptions in Energy Efficiency Potential Studies
9
For their narrowest purpose, energy efficiency potential studies should be viewed on their own terms. These terms follow the energy efficiency field’s dominant theoretical model of how energy is used and saved: energy consumption is modeled as being determined by physical characteristics and humans, as economic agents, making energy-relevant purchases based on cost-effectiveness in order to fulfill service needs, which are defined exogenously. Lutzenhiser (1993, 2009) refers to this treatment broadly as the physical-technical-economic model of energy consumption and energy consumption change, or PTEM. Alongside other policy instruments – especially standards and codes – DSM programs are intended to support the voluntary diffusion of energy efficiency by contributing to technological development, by providing information and encouragement to customers to get them to adopt more efficient technologies, and by exploiting the presumed price-elasticity of efficient products (van den Bergh 2008) via financial incentives to increase their penetration.
This concept of energy use and changes in energy use is amenable to modeling and requires little discussion of behavior or the dynamics of consumption. It is generally consistent with the market-friendly goal of getting people and companies to trade-up in a technological progression.18 Social scientists have long pointed out how much real life deviates from the PTEM (e.g., Ehrhardt-Martinez et al. 2008; Lutzenhiser 1993, 2009; Shove 1998, 2003b). Nearly everybody, not just social scientists, agrees that there are deviations, but the questions are: first, whether PTEM models are “correct” on average; second, how deviations can or should be treated in modeling, program design, and implementation.
Where the purpose is to inform and improve efforts to increase energy efficiency (rightmost column of Figure 1), more complexity is required and a new set of questions arises. Here it becomes more important to track variability and diversity in energy use and technology adoption toward the targeting of the most attractive opportunities.
Largely separate from the notions of technical, economic, and achievable potential, as they are defined in energy efficiency potential studies, a third set of possibilities (leftmost column in Figure 1) – in particular, lifestyle, indirect consumption, and sociotechnical infrastructure – must be considered, both for placing energy efficiency potential studies in context and for building broader approaches. The remainder of this section expands on all three levels of interpretation.
2.1 Basic Structure of Bottom-Up Energy Efficiency Potential Estimation
Table 1 shows the basic levels of energy efficiency potential covered in most potential studies. The final column of the table lists behavioral questions that arise for each type of potential.
18 This statement does not mock the desire for policies to be market-friendly. Rather, the point is to highlight the condition of (particular definitions of) market-friendliness in bounding what is defined as appropriate and possible.

Behavioral Assumptions in Energy Efficiency Potential Studies
10
Table 1: Types of Energy Efficiency Potential Identified In Standard Energy Efficiency Potential Studies
CATEGORY DESCRIPTION EXAMPLE BEHAVIORAL QUESTIONS
Technical Potential
Theoretical construct estimating savings that would be captured if all energy efficiency measures considered are undertaken, considering all possible participants, irrespective of cost, in all remaining opportunities. This defines the maximum savings possible. Switch-out may be phased-in or immediate. Usually defined for technological measures only (installation, maintenance, shell), rather than behavioral change. Especially for longer-term timeframes, the question to treat technological change (e.g., emerging technologies, new end-uses) can be important.
Inside framework: What user choices are reflected in estimates of base and post-intervention energy consumption, and how should variation in user choices be incorporated? What set of technologies are considered?
Outside framework: How are service needs defined and to what extent are these negotiable? How do programs motivate or constrain technological potential? What is the role of changes outside of the end-use, such as housing choices or demographic changes? Can behavioral measures or social change be usefully or adequately incorporated into this framework?
Economic Potential
Subset of Technical Potential that can be achieved meeting specified levels of cost-effectiveness. Cost-effectiveness may be defined from the perspective of society or ratepayers in various ways (CPUC 2001). Economic potential is a theoretical construct with no market barriers and no programs or program costs. In the case of California’s energy efficiency potential studies, the portfolio of measures, rather than any particular measures, must meet cost-effectiveness criteria; various scenarios are considered (Itron & KEMA 2008).
Inside framework: Which cost-effectiveness tests are used and with what parameters? How are societal benefits and costs defined?
Outside framework: How appropriate a guide is cost-effectiveness?
Achievable or Market Potential
Proportion of Economic Potential that can be realized, considering a variety of market barriers and implementing programs. These may be estimated based on evaluations indicating past performance and include various scenarios reflecting different levels and forms of program investment, and different price and demographic assumptions.
Inside framework: What market barriers are assumed and how do these market barriers work? How do long-term and short-term adoption relate?
Outside framework: What is the potential contribution of behavioral conservation or lifestyle change? What competing policies and social patterns work against DSM policies or reduced energy use? What larger-scale societal changes might facilitate technological, behavioral, or lifestyle changes – with what effects and with what policies? To what extent might programs encourage new demand for energy services via “rebound” or other mechanisms? How realistic or useful is the market-barriers model and what are its limitations? What are the environmental and social effects of policies beyond energy use?
Continued

Behavioral Assumptions in Energy Efficiency Potential Studies
11
CATEGORY DESCRIPTION EXAMPLE BEHAVIORAL QUESTIONS
Program Potential
Often differentiated from full Achievable Potential, this is the portion of that potential that would result from specific levels of program investment or activities.
Inside framework: What is the relationship between program investment and adoption? How should market effects be accounted for?
Outside framework: How should the value of educational programs be counted? What other changes do programs and technologies bring along with them?
Naturally Occurring Potential
This is the savings that would “naturally” occur in the absence of programs (e.g., high efficiency adoptions that would be adopted in the absence of utility incentives in the case of California energy efficiency potential studies).
Similar questions to those listed for program potential, and: How should the catalytic effects of utility programs be credited in terms of transforming the market for energy efficiency?
These questions, many of which are discussed throughout the remainder of the paper, are divided into two classes: (1) inside framework, referring to questions that are routinely debated in the conduct of energy efficiency potential studies; and (2) outside framework, meaning questions that are conventionally assumed to be outside the remit of energy efficiency potential studies.
Technical potential – what Shove (1998) calls “the cornerstone of energy efficiency policy and the driving force for energy related research” – is a theoretical construct. For energy efficiency potential studies, it is defined as savings that would be captured if all measures in the considered portfolio were undertaken in all remaining opportunities, with only engineering feasibility considered. Typically, services consumed and levels of amenity are considered non-negotiable in energy efficiency potential studies – central air conditioning cannot be replaced with evaporative coolers or the elimination of cooling.19 Technical potential depends fundamentally on the portfolio of technological measures considered, yet this portfolio cannot be readily objectively defined. Taken to extremes, for example, very little energy may be required to deliver many energy services (CMUA 2007). But most energy efficiency potential studies use a portfolio dominated by established technological measures, usually for which some relevant program
19 In the 2006 California energy efficiency potential study, residential evaporative coolers were considered a legitimate substitution for some central air conditioning; in the 2008 study, this possible substitution was eliminated, under the rationale that evaporative coolers do not provide the same service as central air conditioners (Itron & KEMA 2008). This is a sensible argument from the point-of-view of guarding study boundaries of what measures can be considered. From the point-of-view of identifying potential energy savings, the strict requirements on service levels may miss some important possibilities. For example, evaporative cooling is not necessarily or uniformly inferior – which is obviously subjective anyway -- and has some advantages over compressor cooling, such as the fact that homeowners can usually make any repairs and that evaporative coolers bring in outside “fresh” air (Karpiscak & Marion 1994). This sort of restriction in defining energy efficiency improvements disallows consideration of major differences in technologies. This, in turn, can hamper innovation and, in practice, may work to ratchet up service levels even in the name of efficiency (Shove 2003a).
Behavioral Assumptions in Energy Efficiency Potential Studies
12
experience is already amassed, and they also generally avoid considering measures that will not pass subsequent economic screening criteria.
Economic potential is the subset of technical potential that can, in theory, be achieved cost-effectively from a societal perspective. Societal benefits and cost-effectiveness can be defined in a variety of ways. For California, definitions and criteria are laid out in the CPUC’s Standard Practice Manual (CPUC 2001). Current California energy efficiency potential studies use the societal version of CPUC’s Total Resource Cost test to determine economic potential (Itron & KEMA 2008). This test does not include program costs, but does include various external costs (such as environmental externalities and national security) and uses a societal discount rate (CPUC 2001).
The next slice, achievable potential, is that portion of economic potential expected to be adopted by consumers. This is determined by applying specific criteria, centering on cost-effectiveness at the consumer level in conjunction with other conditions representing market barriers. Achievable potential is often partitioned into naturally-occurring versus program potential, all considered under various scenarios for program investment and various assumptions of market versus direct program effects.
The latest California energy efficiency potential study (Itron & KEMA 2008) identifies behavior as being the source of the greatest uncertainty in its predictions. Put another way, behavior is the component of the efficiency potential calculations that connects theory to real world achievements. Increasing program effort and investment is generally assumed to bring achievable potential closer to the level of economic potential. The intensification of funding for energy efficiency raises the question: how much is recovering the shortfall between economic potential and achievable potential a matter of escalating program efforts by increased funding, versus reflecting more fundamental constraints?20 Some differences in opinion about what market barriers represent and how much programs can overcome them via information and financial incentives are examined in Section 3.
This traditional framework for energy efficiency potential estimation provides a fairly transparent method for assessing potential and socially desirable (as defined by cost-effectiveness) energy savings from technology adoption under a specific set of conditions and relative to a projected baseline. It allows an assessment of costs to achieve particular levels of relative savings, as well as a sensitivity analysis for these savings relative to variations in assumptions, such as program investment and electric rate increases.21 The framework is not intended to reflect all dynamics and intricacies of future energy consumption, but to be sufficiently considered and accurate for its purposes, and to provide a defined structure for
20 For example, the CEC (2007) specifies energy efficiency savings goals as achieving 100% of the economic potential calculated in energy efficiency potential studies, rather than specifying goals relative to the achievable potential calculated in those studies. These goals are to be achieved by a combination of utility and non-utility programs (CEC 2007), so it is not equivalent to requiring that utility DSM achieve all economic potential. 21 The 2006 and 2008 California energy efficiency potential studies did not examine the question of electric rate changes, though the 2002/2003 study did (Itron & KEMA 2008).
Behavioral Assumptions in Energy Efficiency Potential Studies
13
estimation, debate, and action, with form and level of detail incorporated, jointly determined by resources, data availability, and what’s at stake.
2.2 Assessing Behavioral Assumptions
Energy-relevant behavior may be categorized most simply as being either about measure adoption behavior or about energy usage behavior. Assumptions about both are present in energy efficiency potential studies, but only adoption behavior is represented explicitly. It is easy to see why this is. First, technology diffusion is the explicit focus of most DSM programs. Second, energy supply planning is a quantitative, risk averse, as well as political, process. The presence of uncertain or “soft” estimates (e.g., the benefits of contractor training or the assumption of behavioral change) can be detrimental in the politics of government support for energy efficiency, especially in states where energy efficiency is a less accepted strategy than it is in California.22 The duality of energy efficiency potential studies – as political instruments, as well as research reflections – complicates the representation of behavior within them.
There are three basic responses as to what should be done to improve the behavioral assumptions in any bottom-up energy efficiency potential study. They may be: (1) left as is; (2) made simpler, or (3) modified by improving the quality of the data, increasing the structural complexity of the model, or expanding the scope of what is covered. Rather than thinking of energy efficiency potential studies as a singular form of answering questions about future energy use, energy efficiency potential analysis is better treated as a system of program and potential planning, including (but going beyond) energy efficiency potential studies. In this case, more powerful possibilities open up. In particular, with the separation from the structural rigidity and uniformity of treatment inherent in large-scale energy efficiency potential studies, more sophisticated behavioral and sociological analysis is possible. Thompson et al. (2008) outline a three-layer pyramid: a detailed market assessment serves as the foundation, DSM potential studies are the middle layer, and DSM programs are the pyramid’s tip. This depiction opens up questions about how market assessment, energy efficiency potential estimation, and DSM programs relate in practice, and highlights the possibility of exploiting variability, such as seen across segments in detailed analysis of markets and energy use (Thompson et al. 2008). It may also help to allow qualitative assessments (see Section 7) to more actively inform the essentially quantitatively-oriented core.
Modeling and data quality of any energy modeling study can always be improved, if improvement means better correspondence to empirical observation. But this does not mean that such improvements are necessary. The adequacy of behavioral assumptions depends on the study purpose and the likelihood that modifications would make a difference in what is learned or what is done. If precise quantification is the point, improved behavioral assumptions may matter if new information increases the accuracy and precision of the final quantitative estimates. Thus,
22 That is, to avoid inviting skepticism, studies may be conservative in their assumptions about the least-provable elements of energy savings. Goldstein (2008) notes a similar tendency for technology-based savings.

Behavioral Assumptions in Energy Efficiency Potential Studies
14
even inaccurate or highly glossed depictions of behavior are not necessarily a problem, because there are so many uncontrollable uncertainties in the modeling task.
Beyond being machinery for generating quantitative estimates, however, modeling assumptions reflect and serve as a template for mental models of how technological adoptions take place, how programs work, and how much behavior matters to energy use. Accuracy then takes on a different meaning. The recent California energy efficiency potential studies do not cast modeling as forecasts, but instead, as scenario simulations (Itron & KEMA 2008). The intensive quantitative appearance of such studies may lead to false impressions of precision (Rufo 2007; Wynne 1984). Rather than being just about prediction, energy efficiency potential studies express and aid the debate on how policy, programs, technologies, and, to some extent, people mutually interact insofar as technological diffusion is concerned, and provide quantitative and qualitative scenarios to clarify and bound thinking, as well as the details of the strategies by which these savings might be best achieved. They write out in equation form some of the assumptions that remain vague or implicit in normal debates, and thus help make them debatable.
For most developers of energy efficiency potential studies, the basic structure of these studies poses behavior as detracting from the potential promised by technology.23 Implicit in the definition of technical potential, maximum potential is defined by the availability of technology to fulfill a fixed set of future needs. The core view of the future is one in which the world remains basically as it is, while the penetration of particular devices changes, with people as agents of this desirable technological diffusion.
As recalcitrant to being modeled as they are, people and society need to be seen in order to better orient technology to energy consumption in the real – as opposed to modeled – world, and to strategize on interactions between devices, technical systems, and social systems.
2.3 Broader Potential
Energy efficiency programs address only a small portion of societal energy use (Stern & Gardner 1981). Recent policy documents (e.g., CPUC 2008) praise the success of past energy efficiency efforts, but call out the need for deeper changes. The current California energy efficiency potential studies have not been designed to support broader effort, deeper changes, or long-term scenarios. The studies have become, however, a natural launching point for thinking about these broader possibilities (Goldstein 2008; Marbek Resource Associates 2007; Pears 2004; Rufo & North 2007), though most extensions remain firmly centered on devices and on the thermal efficiency of structures.
Rather than view people as agents of a particular course of technological diffusion, with policy aspiring to higher levels of technical efficiency, people and the society they make up can be recast at the center of energy use, determining what uses are desirable, as well as the
23 For others, behavior can be seen as one component in these studies that enhances the potential provided by technologies – e.g., increasing the number of program participants, market share, or the use of technologies.
Behavioral Assumptions in Energy Efficiency Potential Studies
15
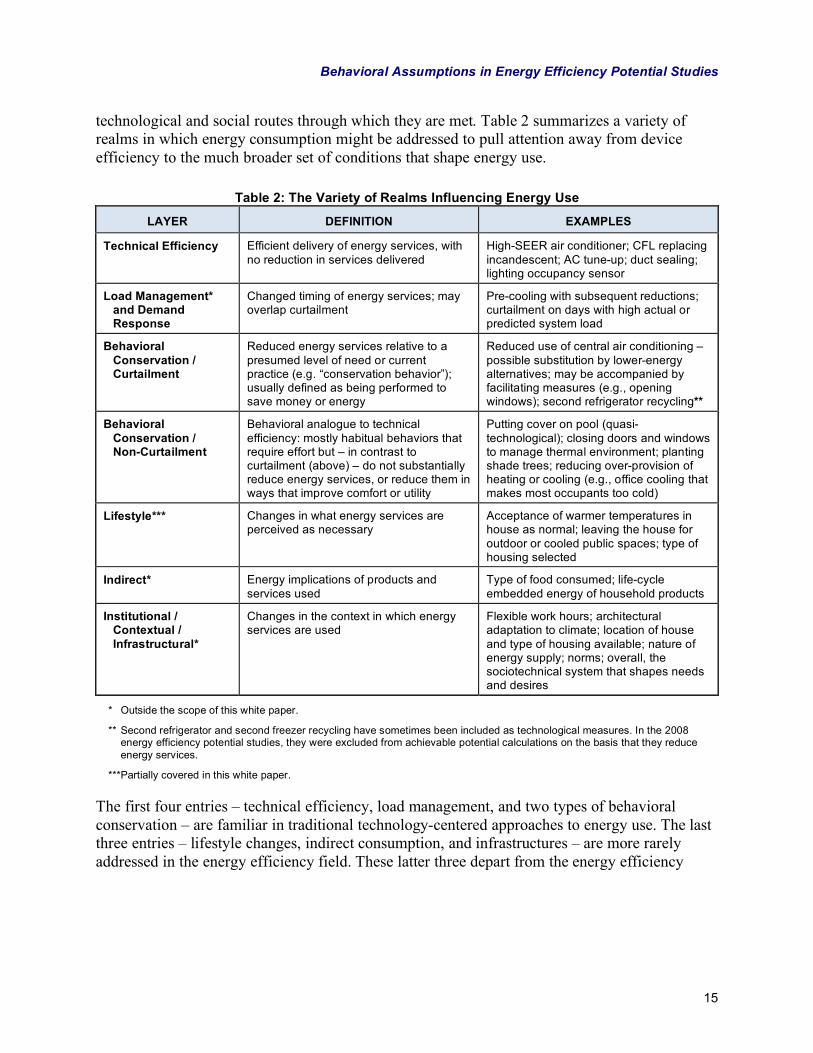
technological and social routes through which they are met. Table 2 summarizes a variety of realms in which energy consumption might be addressed to pull attention away from device efficiency to the much broader set of conditions that shape energy use.
Table 2: The Variety of Realms Influencing Energy Use
LAYER DEFINITION EXAMPLES
Technical Efficiency Efficient delivery of energy services, with no reduction in services delivered
High-SEER air conditioner; CFL replacing incandescent; AC tune-up; duct sealing; lighting occupancy sensor
Load Management* and Demand Response
Changed timing of energy services; may overlap curtailment
Pre-cooling with subsequent reductions; curtailment on days with high actual or predicted system load
Behavioral Conservation / Curtailment
Reduced energy services relative to a presumed level of need or current practice (e.g. “conservation behavior”); usually defined as being performed to save money or energy
Reduced use of central air conditioning –possible substitution by lower-energy alternatives; may be accompanied by facilitating measures (e.g., opening windows); second refrigerator recycling**
Behavioral Conservation / Non-Curtailment
Behavioral analogue to technical efficiency: mostly habitual behaviors that require effort but – in contrast to curtailment (above) – do not substantially reduce energy services, or reduce them in ways that improve comfort or utility
Putting cover on pool (quasi-technological); closing doors and windows to manage thermal environment; planting shade trees; reducing over-provision of heating or cooling (e.g., office cooling that makes most occupants too cold)
Lifestyle*** Changes in what energy services are perceived as necessary
Acceptance of warmer temperatures in house as normal; leaving the house for outdoor or cooled public spaces; type of housing selected
Indirect* Energy implications of products and services used
Type of food consumed; life-cycle embedded energy of household products
Institutional / Contextual / Infrastructural*
Changes in the context in which energy services are used
Flexible work hours; architectural adaptation to climate; location of house and type of housing available; nature of energy supply; norms; overall, the sociotechnical system that shapes needs and desires
* Outside the scope of this white paper.
** Second refrigerator and second freezer recycling have sometimes been included as technological measures. In the 2008 energy efficiency potential studies, they were excluded from achievable potential calculations on the basis that they reduce energy services.
***Partially covered in this white paper.
The first four entries – technical efficiency, load management, and two types of behavioral conservation – are familiar in traditional technology-centered approaches to energy use. The last three entries – lifestyle changes, indirect consumption, and infrastructures – are more rarely addressed in the energy efficiency field. These latter three depart from the energy efficiency
Behavioral Assumptions in Energy Efficiency Potential Studies
16
field’s traditional focus on individual devices and individual choice.24 They do not fit the traditional energy efficiency potential studies framework well, and most are outside the direct purview of utility programs and regulation. They all are crucial in shaping overall energy use, however, and are potentially addressed and influenced by policy, albeit with difficulty and imprecision.
Most of this paper works within the established framework of energy efficiency potential studies – namely, a focus on technical efficiency.25 The level at which efficiency is defined matters. In bottom-up studies, efficiency is typically specified at the level of devices or thermal components of buildings. In contrast, in top-down or other comparative studies, efficiency might also be defined at a functional level, like energy-per-person or energy-per-unit of GDP (Boonekamp 2006). There may be powerful advantages to addressing buildings and their components as systems (EERE 1999; NEEA 2008), but a systems orientation requires more refined information about the context for any technological upgrade (e.g., does the building for which the HVAC upgrade is considered have operable windows? what are the operating hours of a particular office?), as well as its costs, much of which may be impossible to fairly account for in aggregate models. Some energy efficiency potential studies do include packages of measures.26
Efficiency saves energy insofar as it replaces an alternative that would have used more energy. Energy use may be compared to previous levels, but most savings are hypothetical, with the reference system (or base case) within which these savings are compared, often not sufficiently debated or verified (Boonekamp 2006). The higher the alternative consumption is assumed to be, the more energy is assumed to be saved. Ironically, this may reward higher consumption or promote higher levels of energy services.27 Generally, technology is viewed as it is optimally designed (Jelsma 2004), with appropriate choices (e.g., the right size air-conditioner), good installation and commissioning, full compliance, and performance as good as modeled levels, unless strong evidence is available to show otherwise. Behavior, in contrast, tends to be viewed skeptically. However, savings from most technological measures have important behavioral
24 Obviously, standards and codes, as non-optional “command and control” strategies, may be seen as exceptions to the focus on individual choice. 25 Technical efficiency is generically defined as technologies or physical measures that provide, or lead to, the same or better energy services for less energy than specified alternatives, such as stock energy efficiency or the minimum efficiency on the market. The criteria for defining technical efficiency are not self-evident. They must be translated to administrative definitions. The definitions can be objectively stated and evaluated, but are necessarily incorporate subjective decisions and assumptions. In practice, it can take tremendous effort to derive accepted definitions as, for example, in the rule-making under the National Appliance Energy Consumption Act. 26 For example, California energy efficiency potential studies include packages for the residential and commercial new construction sectors (Itron & KEMA 2008). 27 Since the more one uses, the more one saves, and many calculations of energy efficiency potential are performed in a context where the appearance of high savings is desirable, there can sometimes be inadvertent promotion of consumption. The business-as-usual alternative can rarely be observed, which makes such patterns difficult to see and limits the grounds on which they can be proved. See Deumling (2004), Harris et al. (2007), Moezzi (1998), and Shove (2003b) for examples.
Behavioral Assumptions in Energy Efficiency Potential Studies
17
components that are not often identified (Jelsma 2004; Shove 1999) or are glossed over as “proper use.”
Beyond choices of equipment, energy usage also depends on the quality of installation, maintenance, and how the equipment is operated.28 Variations in usage and installation are often set aside as random noise caused by behavior, clustered around a technologically-defined average. But recognizing the interdependence suggests that rather than envisioning the energy future as being comprised of an ideal technical system that society should strive to achieve, the social and the technical mutually develop, which means that policy solutions might appropriately address sociotechnical systems, not just one or the other (Shove 1998, 2003b).
Behavioral conservation refers to behaviors that reduce how much energy is used, without a change in technology. These behaviors are implicitly defined relative to what is considered normal – though what is normal is poorly known (Section 5). There are many different types of actions that are often counted as behavioral conservation; Table 2 suggests a simple separation of curtailment from non-curtailment actions.29 Reducing energy consumption by reducing the level of energy services demanded – generally referred to as curtailment – is the bulk of old-style behavioral conservation.30 This is usually seen as conscious efforts to save energy or money, with the presumption that such conservation is a natural category of behavior, at least in the residential sector. Changing ideas about what constitutes correct behavior (about healthy temperatures, good housekeeping, productive environments, etc.) can also coincide with conservation actions, but since they change “normal” levels, they are not easily counted as conservation. If retained for a long period, conservative behaviors become elements of a more conservative lifestyle, sometimes called energy soberness or energy sufficiency.
28 In real life, transparent swap-out of one technology for another may be rare. In fact, changes in technology often invite or implicitly rely on behavioral changes. 29 A taxonomy might include: actions that improve the delivery of energy services (e.g., replacing an air filter on a heater); actions that reduce losses of energy services (e.g., closing doors to conserve heat, using light paint colors) or lower the need for energy services (e.g., use window shades to lower heat gain); actions that substitute natural methods for mechanical ones (e.g., passive cooling, daylighting, using natural cold storage rather than a refrigerator); actions that reduce the scope in which energy services are required (e.g., grouping activities by time or geography, so that energy services can be shared, such as in cooling centers); actions that match technology to the task (e.g., using the lower speed on a dual-speed motor, rather than a single-speed motor ); actions that substitute a lower-energy technology for a higher-energy technology (e.g., evaporative air conditioning, rather than central air conditioning); reducing overprovision of energy services (e.g., reduce air conditioning temperature if most people in the office are too cold); and several others. All rest on behavioral change (as does program-induced technology adoption), but the presumption that conservation necessarily has only costs and no benefits other than energy savings is unfounded. In other words, the typical assumption that increases in energy services imply increases in economic utility or welfare, and vice versa, is flawed. 30 More energy services are not necessarily preferred to less energy services. For example, office occupants may complain of too much air conditioning as much as they complain of too little (Moezzi 2009). In the past (e.g., Meier 1982), curtailment was contrasted with conservation measures, which are currently defined as efficiency measures. The terminology is fluid, and differs over time and across countries.

Behavioral Assumptions in Energy Efficiency Potential Studies
18
Non-curtailment behavioral conservation refers to behavioral measures that do not reduce energy services, or do so only ambiguously – such as putting on pool covers, using daylight rather than electric light, using shading to retain coolth, using cold water for washing, and so on. These are sometimes considered as technological measures, such as using pool covers or commercial-sector daylighting systems (Section 6).
With rare exception, behavioral conservation is excluded from energy efficiency potential studies.31 Curtailment reduces energy services which, as mentioned above, are implicitly assumed to be non-negotiable – unless monetarily compensated, as in demand response. And while technological change is literally built-in to the world (whether or not it delivers the expected energy savings), behavioral change is not. Though how things are used can make a tremendous difference in energy consumption, this how – its changeability and the persistence of those changes – is still poorly backed by evidence or theory (Section 5). The consequence is that it may be difficult to include behavioral conservation in predictions of future energy use in cases where overestimating savings is to be avoided.
This paper does not address load management, though demand response is an excellent forum for studying behavior/energy-services links and energy savings may result from a focus on shifting or, more generally, from increased attention to energy use likely to accompany demand response.
Lifestyle is used here less in its marketing sense, but to refer to conditions and choices that affect the energy services expected. This definition admits that standards of living (as defined by energy services) are negotiable. Lutzenhiser and Gossard (2000) propose the definition “distinctive modes of existence that are accomplished by persons and groups through socially sanctioned and culturally intelligible patterns of action.” This includes: differences in the size and type of a dwelling; the portfolio of energy services used (e.g., a central air conditioner vs. evaporative cooler vs. none at all); the expectation of a particular level or range of temperatures considered adequate where an activity takes place (e.g., where one lives); the use of private versus shared services (e.g., a smaller household versus a larger one); and so on. The perspective rejects the presumption that the higher the level of energy service, the better – often implicit in promoting efficiency over conservation and in defining efficiency itself (Moezzi 1998). Lifestyles are systems of consumption, shaped by a constellation of circumstance and experiences. They rest only partly on conscious individual choice – social and technical structures matter (Lutzenhiser 2002b; Sanne 2002), as is further explored in the discussion on infrastructure below.
Indirect energy use refers to the energy use embedded in the products and services used by or in the household – for example, the food purchased. Using a life-cycle approach and counting
31 BC Hydro’s 2007 Conservation Potential Review estimated the potential for a portfolio of conservation behaviors, as well as technical measures, as will be discussed below. Ontario Power Authority’s Conservation and Demand Management (CDM) study included several behavioral residential measures – coldwater wash, clothesline kit, draft proofing, and alternative food preparation (toaster oven and microwave oven instead of conventional oven), as well as individual metering – for their calculations of cost-effectiveness, (SeeLine Group Inc. 2005).
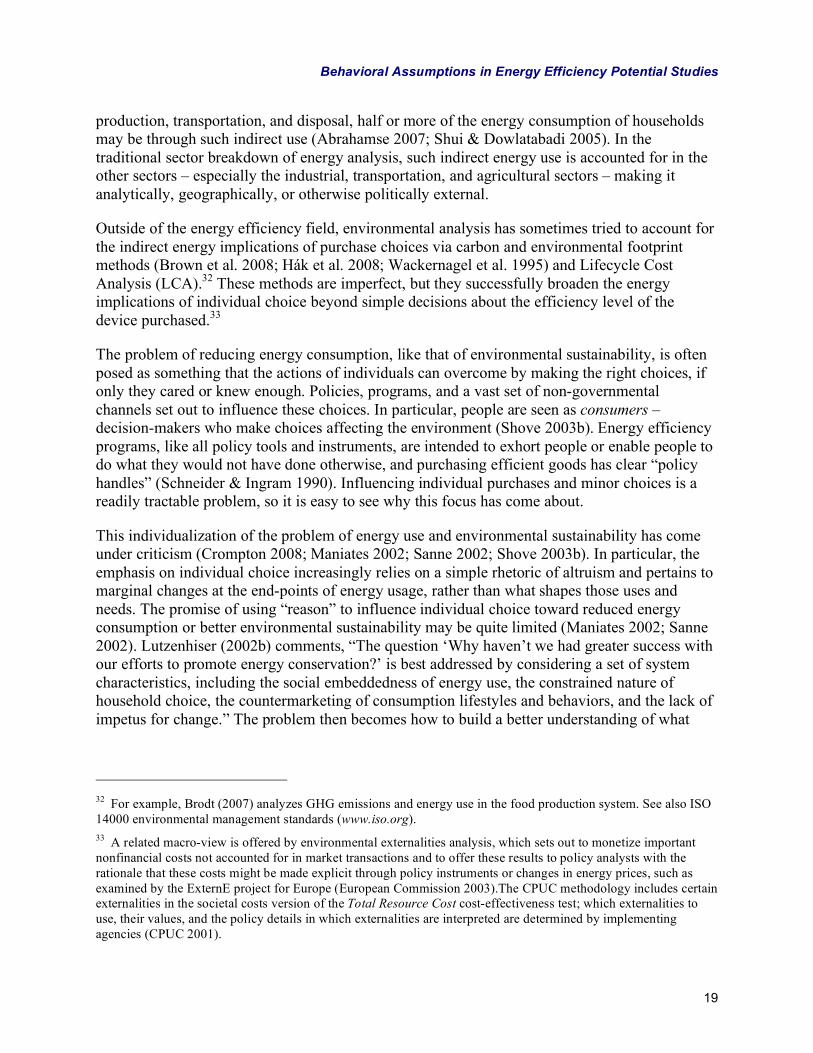
Behavioral Assumptions in Energy Efficiency Potential Studies
19
production, transportation, and disposal, half or more of the energy consumption of households may be through such indirect use (Abrahamse 2007; Shui & Dowlatabadi 2005). In the traditional sector breakdown of energy analysis, such indirect energy use is accounted for in the other sectors – especially the industrial, transportation, and agricultural sectors – making it analytically, geographically, or otherwise politically external.
Outside of the energy efficiency field, environmental analysis has sometimes tried to account for the indirect energy implications of purchase choices via carbon and environmental footprint methods (Brown et al. 2008; Hák et al. 2008; Wackernagel et al. 1995) and Lifecycle Cost Analysis (LCA).32 These methods are imperfect, but they successfully broaden the energy implications of individual choice beyond simple decisions about the efficiency level of the device purchased.33
The problem of reducing energy consumption, like that of environmental sustainability, is often posed as something that the actions of individuals can overcome by making the right choices, if only they cared or knew enough. Policies, programs, and a vast set of non-governmental channels set out to influence these choices. In particular, people are seen as consumers – decision-makers who make choices affecting the environment (Shove 2003b). Energy efficiency programs, like all policy tools and instruments, are intended to exhort people or enable people to do what they would not have done otherwise, and purchasing efficient goods has clear “policy handles” (Schneider & Ingram 1990). Influencing individual purchases and minor choices is a readily tractable problem, so it is easy to see why this focus has come about.
This individualization of the problem of energy use and environmental sustainability has come under criticism (Crompton 2008; Maniates 2002; Sanne 2002; Shove 2003b). In particular, the emphasis on individual choice increasingly relies on a simple rhetoric of altruism and pertains to marginal changes at the end-points of energy usage, rather than what shapes those uses and needs. The promise of using “reason” to influence individual choice toward reduced energy consumption or better environmental sustainability may be quite limited (Maniates 2002; Sanne 2002). Lutzenhiser (2002b) comments, “The question ‘Why haven’t we had greater success with our efforts to promote energy conservation?’ is best addressed by considering a set of system characteristics, including the social embeddedness of energy use, the constrained nature of household choice, the countermarketing of consumption lifestyles and behaviors, and the lack of impetus for change.” The problem then becomes how to build a better understanding of what
32 For example, Brodt (2007) analyzes GHG emissions and energy use in the food production system. See also ISO 14000 environmental management standards (www.iso.org). 33 A related macro-view is offered by environmental externalities analysis, which sets out to monetize important nonfinancial costs not accounted for in market transactions and to offer these results to policy analysts with the rationale that these costs might be made explicit through policy instruments or changes in energy prices, such as examined by the ExternE project for Europe (European Commission 2003).The CPUC methodology includes certain externalities in the societal costs version of the Total Resource Cost cost-effectiveness test; which externalities to use, their values, and the policy details in which externalities are interpreted are determined by implementing agencies (CPUC 2001).
Behavioral Assumptions in Energy Efficiency Potential Studies
20
constitutes this social (and technical) embeddedness of energy use, and how policy can or should seek to influence it.
Physical, social, and cultural infrastructure shapes and constrains individual choices. Much of energy demand is built into social and technical context, as is readily seen in comparing lifestyles and energy use across various countries (Section 7). The choice to leave a building or open a window when it is too hot inside, versus turning the air conditioning up a notch, depends on what is available outside (a garden? a freeway?) and whether the windows can even be opened. The choice of what to eat for dinner depends on what the store has and how tired the meal-preparer feels. The choice of housing depends on where that housing is and what living there means. The classic American dream does not involve apartments, for example, but perhaps apartments could be constructed to better fit the dream for more people, and the dream, as reinforced by government rhetoric and policies, subject to modification itself. Just as there are advantages to treating energy use within a structure as a technical system, there are advantages to seeing energy use in an even broader sociotechnical context.
Obviously, the large-scale physical infrastructure has not been completely forgotten in sustainability efforts – in particular, for transportation planning. Inter-institutional coordination makes these large-scale issues less tractable, and the difficulty of effective design and possible unintended consequences of broad policy approaches make them scary, to say nothing of the politics of implementing changes. But this does not mean that nothing more can be done, especially if policy can come to terms with new orders of problems that are now missed in what Hajer (2003) calls an “institutional void.”
The next section returns to the traditional framework of future DSM potential, as depicted in energy efficiency potential studies. The question remains how this more constrained view, and utility programs in general, might be integrated with the broader agendas discussed in this section.

21
3. Role of Behavioral Assumptions The explicit behavioral assumptions of the California energy efficiency potential studies are specified in the analytical step between economic potential and achievable potential, representing measure adoption decisions and the effects of program investment on adoption rates.34 These studies bring together many assumptions being used in the field and make them explicit. This section interprets the model structure and parameters in light of the dominant theories in the energy efficiency field and associated critiques.
There are three basic points to emphasize before moving to the analysis. First, for recent California studies, the core model is a bottom-up, economic-engineering structural model, but calibrations were used to adjust modeled results to certain empirical findings reflected in markets and recent program activity. This calibration maps the past to the future, which may reduce uncertainty in the short-term, but increase it in the long-term, as programs shift and markets change (Itron & KEMA 2008). The intricacy of the core model and calibration play off each other. Calibration substitutes, to some extent, for model elaborations and parameter precision, creating ambiguity about the interpretation of certain model parameters (unless the parameters were changed to reflect the real world). Calibration has important effects on the final results of the potential study, but is out of the scope for this paper.
Second, the comparison between the economic-engineering perspective and the social science-based critiques hearkens to the most basic question in modeling: What is the model supposed to do? Modeling in energy efficiency potential studies depicts aggregate levels and patterns (Sanstad et al. 2006). Bottom-up models are micro in their stock accounting, but do not represent the detailed mechanisms by which adoption decisions in individual cases are made. More elaborate depictions could be integrated, but where the balance between detail and simplicity lies depends on a number of factors: funding limitations; data availability; the ability to identify and depict decision-making types; and the need for maintaining sufficient transparency to withstand inquiries of multiple stakeholders. The modeling task is already difficult. Thus, from a calculative standpoint, simplifications may often be better than additional complexity. As suggested below, it is clear that modeling and data improvements could be made so that models
34 This examination is based on the written reports, rather than examination of the computer models or data files. For the 2006 and 2008 California commercial and residential sector analyses, and the 2008 industrial sector analysis, Itron’s ASSET (Assessment of End Use Technologies) model was used (Itron & KEMA 2006, 2008); a User Guide provided in the report (Appendix M) explains model parameters in detail. For the 2006 existing industrial sector analysis, KEMA’s DSM ASSYST model was used, as it was for residential and commercial sector analyses in previous years; a User Guide is also provided in the report (Itron & KEMA 2006, Appendix N). Many other end-use forecasting models are available, such as End Use Forecaster (Cadmus Group/Quantec) and MarketTREK (EPRI). IEA (1996) summarizes some of the models available.
Behavioral Assumptions in Energy Efficiency Potential Studies
22
better match current theories or observations; but that is true for nearly any model. What changes should be made first, and with what benefits and costs, is less clear.35
A quarter century ago, Freedman et al. (1983, 24) wrote “many energy models cannot be relied upon in forecasting or policy analysis … there is little hard evidence to show that such models work.” Since then, models have changed and data are certainly better; however, the basic ability to predict the future about something as socially fundamental as energy use must still be considered weak. Even the results of fairly simple programs projected a few years into the future can probably not be predicted very well. As Strauch (1974) notes, the substantive problems addressed by policy are far “squishier” than what quantitative methods can handle directly. As a result, the substantive problem is rendered as a formal problem (i.e., a formal problem of allocating funds to increase voluntary investment in particular energy-efficient technologies), and the formal problem is rendered as a calculative model. Consequently, these interpretations and calculations are of more consequence than the link between the formal model and the quantitative results it produces. The translation of the squishy problem of reducing future energy use to a formal problem was covered in the first two sections of the paper; this section treats how the formal problem is rendered as a calculative model.
The explicit and intended uses of energy efficiency potential models are clear enough. However, it is important to know what ideas the models reflect and how they shape concepts of the problem addressed and their policy solutions. In addition, the calculative models and the dominant mental models that they reflect can reinforce and create “blind spots” (Stern 1986). They divert attention from overflows (Callon 1998) and deviations from the model, and from realizing the limits of what the model might explain. This leads, in turn, to research gaps that further limit how much alternative viewpoints can contribute. Because models provide convenient and attractive high-level theory, they may substitute for observation. Deviations and counterexamples are accordingly difficult to take into account. The importance of calculative models exceeds the quantitative results they provide.
3.1.1 Data
California energy efficiency potential studies draw data from a variety of sources, which are documented in the published reports. The main sources of data are: the California Database for Energy Efficiency Resources (DEER); the California Residential Appliance Saturation Survey (RASS); the California Commercial End-Use Survey (CEUS); proprietary load shape libraries; the CPUC Policy Manual (CPUC 2003); program evaluations; and utility sources, including
35 Answering this question would be a community task, and would require, at a minimum, a sensitivity analysis and detailed technical analysis of modeling structure and inputs.
Behavioral Assumptions in Energy Efficiency Potential Studies
23
detailed information on program design and achievements (Itron & KEMA 2008).36 California may have better data on energy use in the state than any other jurisdiction, but from the standpoint of statistical analysis, data on consumption are weak compared to many of the tasks at hand, especially insofar as variation can be represented. In particular, little empirically measured data at the end-use or device level are available, whether baseline or in response to technological change, and variation from premise to premise – critical in figuring where potential lies, even if this potential can only be roughly targeted by policy measures – is difficult to establish. And there is also very limited data aimed at quantified (or qualitative) descriptions of decision-making or on how far funding increases can go in increasing technology adoptions.
3.2 Usage
In most bottom-up energy efficiency potential studies, assumptions about the “energy services” required and how they are supplied are generally fixed throughout the forecast period.37 For some measures, estimates of measure savings imply a modest change in user behavior or a reduction of service delivery. For example, whole-house fans are a residential-sector measure treated in the 2008 California energy efficiency study. They are modeled as yielding savings by an assumed substitution of the whole-house fan for other cooling, for some percentage of load hours, with the appropriate choice “guaranteed” by a smart thermostat (Itron & KEMA 2008).
Assumptions about usage in energy efficiency potential studies are usually implicit, with details exogenous to the study itself. Baseline usage estimates are typically expressed as annual unit energy consumption (UEC), in turn incorporating fixed assumptions about the individual technology or end-use, the technological and climatic context, and user choices for how and when to operate. In the California studies, UEC values from California’s Residential Appliance Saturation Survey are combined with savings assumptions from DEER to model savings. Assumptions about user behavior may be buried several layers down – for example, in building energy simulation modeling used to support savings estimates, which, in turn, rely on thermostat schedules developed elsewhere (DEER 2008b), while these assumed thermostat schedules may not match actual thermostat schedules very well (Woods 2006).38
Hidden from view, the behavioral and social bases of consumption thus seem out-of-scope as a means to energy savings, with energy services interpreted as fixed minimum needs
36 DEER is available at www.deeresources.com (password required), with some earlier editions via the CPUC website. See DEER (2008a, 2008b). The RASS gateway is available through a CEC website, (http://www.energy.ca.gov/appliances/rass/), as is the CEUS gateway (http://www.energy.ca.gov/ceus/). 37 The forecast of energy use, against which savings from energy efficiency investments are judged, may assume some service-level changes (e.g., increases in house size or projecting end-use saturation trends). Longer-term energy efficiency potential studies may also treat such changes explicitly (Marbek Resource Associates 2007; Rufo & North 2007). 38 This is not to say that the studies are inadequately documented. Rather, these are multi-layered analyses drawing data from dozens of sources. The task here is to draw out some of the assumptions embedded in the use of these sources.
Behavioral Assumptions in Energy Efficiency Potential Studies
24
corresponding to average or “proper” use. But in the day-to-day life of individuals who use energy, decisions about energy usage are ubiquitous, while decisions about purchases are rare. An ordinary citizen may participate in buying a heating system or similar high-usage appliance at most a few times in their life, while the little matters of thermostat-setting and opening the window are daily occurrences. Thus, usage and its variability are legitimate objects for examination here. Five themes are covered below: (1) distributions of usage, as opposed to averages; (2) price elasticity; (3) the “rebound effect” and other post-installation changes in use; (4) manual versus automated operation; and (5) measure effectiveness and persistence. Energy efficiency potential studies need not account for all of these explicitly, but the study of energy efficiency potential does.
3.2.1 Averages versus Distributions
Energy efficiency potential studies track average behavior and average consumption within modeling segments defined for each sector. Selected physical and geographic characteristics form a modeling segment (e.g., single-family homes in a particular climate zone) and end-use saturation for these groups is average by definition.39 While the studies address aggregate activity, the underlying theory of technology adoption pertains to decisions and actions by individual consumers. This creates a discontinuity between the two frames of reference – the aggregate view and the individual or micro-view. In energy efficiency potential modeling, cost-effectiveness criteria are used to estimate the proportion of eligible households in a particular modeling segment that would adopt a given measure, with energy savings determined by the average usage for the segment. But energy expenditures can vary greatly, even among buildings that are physically similar and geographically proximate (Lutzenhiser & Bender 2008). Thus, an investment may be highly cost-effective for some buildings and not for others in the same segment. Though cost-effectiveness may, in practice, rarely be the determining factor in consumer decisions about purchasing incremental increases in efficiency (Lutzenhiser 2009), there is almost undoubtedly some relationship between energy expenditures and potential savings from energy efficiency.
The result of using averages rather than accounting for variability is possible “aggregation bias,” as noted in California energy efficiency potential studies (e.g., KEMA-Xenergy 2003). The importance of aggregation bias could be partially assessed mathematically, for example, by comparing investments and expected savings, as calculated by premise-level cost-effectiveness criteria, as compared to aggregate criteria.40 Energy efficiency potential studies obviously have
39 Obviously, the greater the disaggregation into segments, the fewer the number of entities averaged in each segment. Except ad absurdum to segments of one, this does not diminish the claim that entities are represented by averages. 40 One way to do this would be to model individual households as adopting technologies by actual payback period, and to use, say, their estimated actual air conditioning costs to determine the theoretical level of high-efficiency adoptions and the corresponding savings that would result from these adoptions, all other things being equal. Basically, the theory of cost-effectiveness is retained, but, as an experiment, a distributional, rather than average approach to calculations would be used.

Behavioral Assumptions in Energy Efficiency Potential Studies
25
to use some level of averaging for the usage and savings values used in their calculation; the questions are, how much and whether it is worth the trouble. For example, it may be useful to separate out the lowest quartile of energy use or the lowest quartile of income, at least for certain adoption decisions. Calibration can improve the estimates of the overall program savings level (to the extent that underlying data are correct), but there is still a matter of targeting the right consumers. Further disaggregation in modeling may be favorable to socio-demographic segmentation in program selection, implementation, and results, as suggested by Lutzenhiser and Bender (2008).
3.2.2 Energy Price Elasticity
Energy price elasticity is an economics expression of behavioral change, whether through changes in the usage of energy services or longer-term strategies, such as shifted choices in technology adoption or fuel switching.41 Thus, energy elasticity estimates are aggregate summaries of past experience on what people did, and understanding the behavioral motor of elasticity is a way of understanding how consumers choose how they use and conserve energy. Many studies have estimated electricity use elasticities, but there is substantial regional variation and the overall story is not very clear (van den Bergh 2008).
The elasticity-as-behavior perspective raises questions about how economic theories of energy use and energy efficiency adoption are operationalized in real life. How price is signaled – whether through bill design (Iyer et al. 2006), program information, real-time price displays, or other modes – shapes how customers can react to it. That residential energy bills often give, at best, confusing guidance as to energy use and energy savings was noted long ago (Stern 1985), and it may be no better for most consumers since then. Demand response and time-of-use pricing programs try to make the price signal clearer, but focus on variation across short periods of time, rather than absolute levels over longer periods. Not only that, but adoption – and overwhelmingly, usage – decisions are made by individuals who are shielded from direct price, as discussed in the split incentives section below.42
As to energy efficiency potential, in theory, energy price changes affect both consumption levels and “natural” investment decisions, which, in turn, affect usage levels and DSM program potential. In the latest California energy efficiency potential studies, effects of the price elasticity of electricity and natural gas demand are outside the study scope.43 They could, however, be included as scenarios.
41 Price elasticity is a measure of the change of the quantity demanded of a particular commodity, in relationship to changes in the same commodity’s price. In California energy efficiency potential studies, price elasticity for measure investments, in contrast to energy costs, is modeled via the effect of program financial incentives on cost-effectiveness, as used to model the technology adoption decision. 42 For a sociological background and example, see Hackett & Lutzenhiser (1991). 43 As to levels of elasticity, PG&E’s econometric-based model for the residential sector assumes a price-elasticity of -0.1 on real electricity prices for the residential sector, with five-year elasticity expected to be about -0.4 – i.e., there is a 4% consumption decrease on a 10% increase in real price (PG&E 2008).
Behavioral Assumptions in Energy Efficiency Potential Studies
26
3.2.3 Rebound and Other Post-Installation Changes in Use
Technologies and programs intended to reduce energy consumption or increase energy efficiency may have unintended or unaccounted effects on behavior, including the possibility that energy services or energy consumption increase from previous levels, or what they would have been in the absence of the technology or program. Energy savings potential estimates rarely account for increases in service levels demanded, other than what is implicated in calibrations to program results. Technological changes may also encourage reductions in the level of energy services demanded – for example, if a new efficient washing machine performs better with coldwater wash than the previous less-efficient washing machine or otherwise encourages or allows coldwater wash, savings are additional.
The relationship between energy efficiency and energy consumption is one of the most contentious topics in the field (Geller & Attali 2005; Herring 1998, 2006; Sorrell & Herring 2009). Increases in the levels of energy services accompanying an increased efficiency are usually referred to as rebound or takeback. For example, if lighting costs with CFLs are perceived as low, there may be less attention to turning lights off, thus increasing the number of hours per year that a particular lamp is turned on. Thus the rebound effect refers to a case where some of the technically expected savings from an energy efficiency improvement are eroded by changes in users’ behavior, in accordance with economic explanations of price elasticity for energy services or income elasticity. Efficiency advocates acknowledge this effect, but argue that it is small (Geller & Attali 2005; Sanstad et al. 2006), though the evidence typically cited includes only the direct rebound effect, rather than indirect rebound or general equilibrium (Herring 2006).44
Rebound is a strictly economics framing of the issue. Direct rebound is often misunderstood as incorporating all types of behavioral changes that might occur in conjunction with an energy-efficient technology adoption, but it does not, since it does not cover indirect rebound or general equilibrium effects, nor, from the non-economics viewpoint, a number of ways in which technology design, information, and other factors can change usage patterns and user expectations.
Changes in usage levels upon the adoption of a new technology may occur via a number of mechanisms. For example, norms – meaning socially-reinforced levels of practice – may be influenced by a program or technology itself. Though efficiency marketing strategies may often assume that adoption of energy efficiency in one case may catalyze another (Crompton 2008), the direction could be toward either increased or decreased standards of service or usage. For example, the assurance of lower washing costs from an efficient washing machine or a bigger tub size may encourage increases in washing frequency and standards of cleanliness (Pears 2004; Shove 2003a). Admonitions to turn off “unnecessary” lights during peak demand emergencies
44 Direct rebound refers to increases in the level of service demanded due to decreases in the unit price of services (i.e., price elasticity). Indirect rebound results from reduced costs of an energy service, which leaves more income available to spend on other goods and services. General equilibrium effects are economy-wide adjustments for a range of goods and services (e.g., energy supply) or changes related to economic growth.
Behavioral Assumptions in Energy Efficiency Potential Studies
27
can also instill the idea that it is normal to have unnecessary lights on. Utility recommendations to set the cooling temperature at 78°F may instill not only the idea that lower temperatures are wasteful, but also that higher temperatures are too hot (Strengers 2008). The natural pattern of linking voluntary adoptions to positive market values may often legitimize higher levels of consumption. Purchases may be stimulated or modified by the program itself, such as efficiency-based rebates rewarding the adoption of a central air conditioner where there was none (Samiuallah et al. 2002). Even voluntary efficiency labeling programs may encourage that bigger models be developed and sold, whether because of the technical details of efficiency definitions, or as part of marketing strategies (Deumling 2004; Golove & Eto 1996; Moezzi & Diamond 2005). Automation that makes it easier to reduce services may also make it easier to add services, as seen in the programmable thermostat example examined later (Section 6).
There are many other plausible possibilities, most hard to prove or disprove. These shifts may appear trivial and outside the domain of technical efficiency, thus escaping notice. However, little changes can ratchet up to bigger ones (Shove 2003a; Wilhite 2007), creating trends that may vaguely seem to increase welfare, but at the same time erode the expected savings from improved technical efficiency. Anthropological or sociological methods can yield insight into these changes, though rarely solid quantification.
3.2.4 Manual versus Automatic
Technologies that provide automatic control (such as of lighting or temperature) are often presumed to provide savings over manual control. They are thus often credited with energy savings, whereas the same “conservation” actions taken manually would not be. In the current California energy efficiency potential studies, several automation measures are included – such as outdoor photocell sensors for multifamily buildings, indoor occupancy sensors for single-family dwelling lighting, and plug-load motion sensors and lighting area sensors for the commercial sector (Itron & KEMA 2008).45 When and where automation actually saves energy when installed, compared to manual management, is poorly documented. First, there is surprisingly little empirical data on how energy is actually managed or how people adjust energy use when they encounter automatic controls. Second, automated systems may not work as planned or modeled (see Section 6 for examples), even if commissioning is intended to overcome these glitches. So, unless backed with reliable empirical data, automation provides savings on a “theoretical plane” whose assumptions may or may not be realized.
Furthermore, not allowing users the manual control of the building envelope (for example, opening windows in commercial buildings, or automation that is difficult to override) may deter the development of buildings designed to take advantage of the lower-energy, adaptive comfort possibilities allowed by operable windows (Brager et al. 2004).
45 Plug-load motion sensors are power strips equipped with occupancy sensors that switch off connected devices after a pre-set delay if the area appears vacated. Itron & KEMA (2008) note the technical potential for this measure is high, but that the technology has low saturation and low familiarity among the public.
Behavioral Assumptions in Energy Efficiency Potential Studies
28
3.2.5 Measure Effectiveness and Persistence
The ability of new construction, system installations, or technology to work as designed or expected depends on compliance, construction, installation, commissioning, the appropriateness of the technology to the situation, the behavior of users, and other factors. All depend on people. Thus, the topic of measure effectiveness is relevant to the problem of behavioral assumptions in the study of potential: modeled performance depends on assumptions about behavior; actual performance depends on behavior; and recognizing and fixing problems depend on behavior – including how research documents (or does not document) performance problems. Simulation models cannot be expected to give precise answers as to how much energy a new technological system will use or save in practice in any particular case. In aggregate, however, biases matter. To our knowledge, there is no literature that definitively addresses systematic or common biases in modeled as opposed to actual measure effectiveness.46
Devices and buildings are generally rated on technical characteristics of efficiency, which is several steps away from actual energy consumption (Bordass 2007; Stein 1997a, 1997b) and building performance (Janda & von Meier 2004). Differences between estimated and measured energy use may be a matter of construction, usage, poor initial assumptions, or biased interpretation. Builders and rating systems cannot determine how buildings will be operated, of course, nor is this a problem of energy efficiency potential studies per se. Rather, savings from technological change are usually justified on the basis of simulation models and these modeled situations may not represent actual performance, even on average (e.g., Keegan 2008).
Behavior also affects the persistence of energy savings from technological measures. For example, the removal of target measures, lack of maintenance, or the disabling of sensors or timing devices effectively shortens measure life (Vine 1992). From a top-down perspective, these appear as problems of improper use or application, but from a user perspective, they also point to technological qualities that users found irritating or ineffective (Jelsma 1999). The possible shakiness of savings estimates on technological measures for energy efficiency, in turn, may loosen standards to which behavioral measures for reduced energy use might be held; evidence on the persistence and effectiveness of behavioral measures are reviewed in a later section (Section 5).
46 Many evaluations and other studies report these kind of data, but various stakes in “success” can affect what results are shown (Gillingham et al. 2004; Janda & von Meier 2004). In extreme cases, predicted usage might be very biased – for example, there was an apparent underestimation of energy use by 65% in the case of energy-efficient refrigerators in Japan (Tsurusaki et al. 2006). This implies that savings from these refrigerators would be far over-estimated if the rated energy performance were used as the basis for savings calculations. There is always a “worst case” for everything, so a few examples do not prove profound trouble. A systematic review of observed versus predicted energy performance could be very useful.
Behavioral Assumptions in Energy Efficiency Potential Studies
29
3.3 Measure Adoption
Behavioral assumptions about measure adoption create the active link between economic potential and realizable program potential, as calculated under alternative funding scenarios. There are two main operations. One translates the levels of program investments to their effects on consumers’ decision-making. The second describes how consumers will adopt (or not adopt) the target measures. Unless otherwise stated, the modeling example described below is the one used in the 2008 California energy efficiency potential studies for residential and commercial sectors (Itron & KEMA 2008).
The model is designed to estimate how many, of which type of consumers, adopt each of the relevant measures in the technology portfolio, considered under a varying set of program conditions. The California energy efficiency potential studies follow the basic framework for assessing publicly-funded energy efficiency laid out by Sebold et al. (2001). As in the PTEM model discussed earlier (Section 2), the basic structural assumption is that consumers – whether individuals or collectives, such as a household or a business – are economic agents facing a clear decision about adopting a technological option.47 Within this model, consumers are assumed to adopt the efficient option if it meets certain cost-effectiveness criteria, such as a minimum payback period relative to the incremental purchase price and reduced energy costs of the less-efficient alternative, modified by simple depictions of market barriers, as discussed below. These barriers aside, eligible consumers – those for whom the decision is applicable and the measure is feasible – are assumed to make an adoption decision based on cost-effectiveness. Utility incentives are credited as reducing the direct costs to the consumer. Utility programs are also assumed to reduce market barriers to adopting a measure. The values for the relevant parameters, screens, and structures are the explicit behavioral assumptions in California energy efficiency potential studies.
The CPUC’s Standard Practice Manual (CPUC 2001) is clear about the role and limitations of the cost-effectiveness criteria in modeling consumer adoption decisions:
“Until or unless more is known about customer attitudes and behavior, interpretations of Participant Test results continue to require considerable judgment. Participant Test results play only a supportive role in any assessment of conservation and load management programs as alternatives to supply projects.”
This proviso is underscored in the 2008 California energy efficiency potential study (Itron & KEMA 2008), which notes:
47 Itron & KEMA (2008) use three decision types for existing buildings: replacement-on-burnout, retrofit, and conversion. New construction decisions are considered independently. Any measure applied to an existing building is assumed to fall uniformly into one of these types, which subsequently determines the types of costs that are included in the payback calculation and constrains the timing of adoption. Replacement-on-burnout means that the technology is replaced when it reaches the end of its useful life, in which case only the incremental cost between the standard levels and efficient levels are included as costs. Retrofits and conversions include installation costs, with their adoption depending on customer payback for the full cost.
Behavioral Assumptions in Energy Efficiency Potential Studies
30
“The assumption of customer acquisition based on cost is somewhat counter-factual. Individual households, businesses, and industrial clients will purchase energy efficiency based on their individual needs, desires, and concerns. These needs, desires, and concerns are market barriers that may limit the acquisition of some high efficiency measures with very low cost, while leading to the acquisition of other measures, which appear less desirable from a purely cost and benefit analysis.”
Social science and some economics work on efficiency adoption decisions underscores the importance of these deviations.48 From the standpoint of understanding potential and improving the ability to achieve it, such counter-facts serve as clues and are of particular interest. But they risk being disregarded from an engineering and policy-modeling point-of-view, since they do not lend themselves easily to theory or modeling.
3.3.1 Details: California Energy Efficiency Potential Study Example
In the California studies, the main parameters dictating consumer adoption are payback periods (or cost-effectiveness criteria), incentive levels, and levels of market barriers. Incentives and market barrier levels are assigned by the modeling scenario. In the 2008 California energy efficiency potential study, the current or base scenario assumes current levels of incentive funding, the full incremental cost scenario assumes that incentives cover the full incremental cost of the measure, and the mid-level scenario assumes an incentive level midway between the base and full scenarios. Incentives are modeled as simply reducing the incremental cost of a measure, thereby increasing its cost-effectiveness and reducing its payback period.
Recent California studies (2006, 2008) use payback period as adoption criteria, while earlier California studies (2002/2003) used the cost-benefit ratio. The payback criteria in the 2006 and 2008 studies varied by measure and were based on a Northern States Power customer survey and subsequent conjoint analysis published in 1995. These criteria were adjusted by professional judgment for some measures in the energy efficiency potential study, where the conjoint analysis results did not match current information (Itron & KEMA 2008). Study authors note that no subsequent analysis has been published in California or elsewhere, and that these payback criteria might have changed due to movements in energy prices and climate change concerns; customer location (i.e., California versus Minnesota) might also matter. They recommend a new analysis on the influence of rebate levels on payback, especially in light of changed prices and general concerns since the original 1995 study (Itron & KEMA 2008).49
Because of the calibration step, which adjusts the results of structured calculations to program data, and because of the separate treatment of market barriers by the awareness and willingness
48 See, for example, Lutzenhiser 1993, Lutzenhiser 2009, Sanstad et al. 2006, and Shove 1998. 49 Footnote 18, p. 3-14 of Itron & KEMA (2008) provides more detailed reasoning. As an alternative to a conjoint analysis, the study authors also suggest a time-series analysis of program results on adoptions and rebate levels. This sort of cross-program analysis could provide results that not only update modeling assumptions, but also highlight sociological questions about how rebates and other financial incentives influence consumer perception and measure adoption.
Behavioral Assumptions in Energy Efficiency Potential Studies
31
parameters, these payback criteria cannot be directly compared to published literature on implicit discount rates, sometimes used to describe consumer valuation of energy efficiency.50 Observed average discount rates in the late 1970s and early 1980s literature are typically between 25% and 40% for various household investments, but higher rates have been calculated – 300% and even more (Sanstad & Howard 1994; Sanstad et al. 2006; see also Train 1985). For industry, hurdle rates have been found to be 50% to 100% (Sanstad et al. 2006).
Payback criteria stay fixed throughout the modeling period, while the assumed levels of market barriers change. As to assigning levels of market barriers, standard practice in energy efficiency potential studies is to use professional judgment to assign market barrier assumptions (Frisch 2008; Itron & KEMA 2008). This means that the reasoning behind market barriers assumptions may be undocumented, at least publicly – reflecting in large part the complexity of the problem and the expertise needed. Some studies specify a range of adoption curves at different levels of market barriers (e.g., very high barriers, moderate barriers, etc.), each relating penetration rate to participant benefit-cost-ratio criteria and assigning each technical measure to one initial market-barrier-level curve.
In recent California energy efficiency potential studies, market barriers are represented by two parameters – awareness and willingness (Itron & KEMA 2008). After passing technical feasibility and applicability screens for a particular technical measure, the customer must be aware of the measure, where aware means “hav[ing] been exposed to a technology and hav[ing] formed an opinion about the operating characteristics of that option” (Itron & KEMA 2008), expressed as a proportion of eligible customers. The proportion of relevant customers who are considered aware must then also pass the willingness screen, where willingness is expressed as the proportion of the remaining customers who are willing to adopt the technology. This segments the remaining population into two groups, one portion who would adopt the technology if it were cost-effective, the other who would not. Willingness summarizes non-awareness barriers, though some barriers or consumer preferences may also be implicitly reflected in the calibration step (Itron & KEMA 2008).51
Neither awareness nor willingness parameters translate directly to observable values. They are both high-level representations of the effects of a mélange of real-world conditions. Computationally, these parameters create two main levers through which program investment and market transformation effects can be represented and trended over time. In the 2008 California residential and commercial sector energy efficiency potential study, values of awareness and willingness start fairly high – 60% to 80% for lighting, sometimes lower for non-lighting measures, and sometimes higher, especially for commercial-sector willingness values.52
50 Implicit discount rates are descriptive rather than analytic; they can be calculated whether or not cost-effectiveness explicitly entered in decision-making (Sanstad & Howarth 1994). 51 The technical definitions of awareness and willingness (i.e., proportion of which population) have varied among studies, so care is needed when comparing them. 52 Awareness and willingness values for the 2006 energy efficiency potential study are documented in ACCESS databases available via CALMAC (www.calmac.org).
Behavioral Assumptions in Energy Efficiency Potential Studies
32
Awareness and knowledge of the product (the awareness parameter), and willingness to adopt it (the willingness parameter), are assumed to increase annually with program investment, reflecting information diffusion. Information and financial incentives are thus the ingredients by which directly consumer-oriented programs work.53 The values of both awareness and willingness parameters increase uniformly across measures at 3%, 4.5%, and 6% per year for the current mid-level and high-level funding scenarios (Itron & KEMA 2008). Thus, information diffusion is expected to aid technology diffusion at a fast clip. Awareness and willingness parameter values starting at 70%, for example, would reach 100% seven years later, under the mid-level funding scenario.
But contra this depiction, there may be a maximum level of penetration beyond which aggressive strategies – high incentives or high levels of information – cannot induce consumers to buy. This resistance cannot be assumed to be a matter of consumer irrationality or lack of knowledge. Though a long-standing question (Stern 1985), there has been little analysis on how customers respond to variations in incentive levels or to aggressive marketing of energy efficiency (Itron & KEMA 2008).
As to incentive levels, choice experiments or program data analysis could help to better refine these estimates (Rufo & Train 1999; Rufo et al. 2008). It may also be very useful to know why consumers do or do not buy the energy-efficient products that are offered, expressed in their own terms rather than through the industry lens of cost-effectiveness – consumer preferences, thought processes, and better characterization of purchase processes, rather than the question of “market barriers” per se.
Some values for willingness to adopt used in the current studies seem high. For example, the 2006 California energy efficiency potential study for the residential sector used values of 1.0 for the awareness and willingness parameters for low-flow showerheads, indicating that in 100% of households there are no remaining market barriers for all cases in which low-flow are feasible (Itron & KEMA 2006). That is, with sufficient program effort, this assumption implies that every household should be willing to adopt low-flow showerheads. Intuitively, this seems to be too liberal an estimate for a voluntary technology adoption.54 There may be no data to back up either the current value or an alternative. And, as noted above, for many other measures, awareness and willingness levels are assumed to reach 100% over time, given continued program awareness.
Information is treated more thoroughly in a later section that reviews the evidence on behavioral change (Section 5). The three main points relevant here are easily summarized: first, that it is difficult to measure the effects of information and education: second, data verifying effectiveness are weak (e.g., Green & Skumatz 2000); and third, that while program and measure information
53 This does not cover all types of DSM programs, in particular, programs directed toward the supply chain, such as training for building contractors, etc. 54 As reflected, for example, in popular culture, such as the Seinfeld episode “The Shower Head” (http://www.seinfeldscripts.com/TheShowerhead.htm).
Behavioral Assumptions in Energy Efficiency Potential Studies
33
can make a difference, the power of information to change behavior may be far less than imagined (McKenzie-Mohr Associates 2001; Owens & Driffill 2006).
The principle behind information dissemination is that consumers do not know about a particular measure, or have insufficient or incorrect information about it, and that information conveyed will be used to increase the awareness of a product and the willingness to adopt it, as well as to reduce search and transaction costs. But lack of information may rarely be the only reason that consumers do not adopt a measure, so disseminating more information may make only a limited difference in adoption decisions, none at all (Sebold et al. 2001). 55 As Owens & Driffill (2006) write, “Information is unlikely to be effective if it runs counter to other powerful influences, such as social norms or prices; [information] should be part of a wider strategy, and should flow in more than one direction.” The importance of information flow bears special emphasis. Too much information coming from the top down can backfire. And, second, in energy efficiency as it is currently practiced, the route for feedback from users and practitioners to policy and research labs is weak. Listening to energy users, observing social patterns, and reformulating the field’s problems into ones that better fit the problems and concerns of energy users have been largely ignored by the overriding mission of informing consumers that they should place more value on efficiency.
While energy efficiency potential studies may look like the result of large, straightforward model runs, they are mobilized by a great deal of calibration, simplification, and professional judgment (Itron & KEMA 2008) – and this is necessary. Empirical data for representing behavior is neither very strong nor always possible, even under ideal circumstances. With the right professional, professional judgment can be excellent, especially when buoyed by empirical observation. Some suggestions are given at the end of this section. For now, we return to theories about energy efficiency investments.
3.3.2 Theories on Why Energy Efficiency Investments are “Under”
The “energy efficiency gap” (e.g., Allen Consulting Group 2004; Blumstein et al. 1980; IEA 2007; Jaffe & Stavins 1994; Sanstad & Howarth 1994; Sanstad et al. 2006) refers to the observed consumer underinvestment in energy efficiency relative to levels considered economically optimal, where optimal is defined as cost-effective under rates-of-return equivalent to market rates for borrowing and saving. Explanations offered for this gap typically take one of two forms. The first type of explanation accepts the basic economic framework and the ideal of cost-effectiveness as a guide to consumer technology adoption. It explains the energy efficiency gap by itemizing costs and considerations that are unaccounted for in the original discount rate, and by attending to questions of to whom the costs and benefits accrue. These arguments are often used in justifying government investment in energy efficiency and to identify what policy and
55 The method of information delivery matters as well. For example, word-of-mouth may be more effective than mass information (Geltz 2008; Stern 1985), so programs that rely on or stimulate word-of-mouth have an advantage if consumers actually like the product offered, and a disadvantage if they dislike it. In turn, what is conveyed by word-of-mouth and, by extension, public discussion via the Internet, provides valuable “bottom-up” market data.
Behavioral Assumptions in Energy Efficiency Potential Studies
34
programs can do to narrow the gap, or, in the case of behavioral economics, incrementally improving programs. The second type of explanation for the energy efficiency gap rejects the basic economic framework. It promotes a different mode of thinking about how purchase decisions are made. From this perspective, energy-relevant purchases are rarely comparable to regular investment, with an expected flow of monetary returns from reduced energy use at issue. It is the technology adoption model that is wrong-headed and creates the appearance of a gap, rather than consumers.
The first type of explanation is more amenable to modeling. Basically, these explanations identify various market barriers and market failures to explain the gap, or alternatively point to the bounded rationality of consumers. Terminology in the energy efficiency field’s market barriers literature is not always consistent with that of economics literature (Eto et al. 1996; Sebold et al. 1996). For this paper, market barriers in the energy efficiency market are situations that suppress adoption rates of the energy-efficient alternative, in accordance with CPUC’s definition.56 Thus, as used here, “consumer preferences,” such as not liking the light from a CFL, are market barriers. Sathaye and Murtishaw (2004) provide the following list as factors hampering cost-effective investment in energy efficiency: “lack of information about energy efficiency opportunities, lack of capital to finance energy efficiency investment, misplaced incentives which separate responsibilities from making capital investments and paying operating costs, hidden costs, transaction costs, bounded rationality, and product unavailability” – to which we add consumer preferences and interests, as noted above. 57 DSM incentive programs (especially rebate programs) have been one of the main policy strategies used to overcome these barriers, the other two being education/information and standards (Murtishaw & Sathaye 2006). But market barriers are common to all markets and are not necessarily amenable to policy intervention (Allen Consulting Group 2004). It is thus debatable which, if any, market failures justify public investment (Sanstad et al. 2006), or what programs can and cannot do about them.
“Market barriers” has been the most active rubric within which the roles of people and social dynamics have been recognized in the mainstream energy efficiency field. But the “market barriers” framing constitutes a closed logical system in which everything can be explained (Shove 2009). This makes it robust against criticism, but only partly satisfactory, especially since there is little empirical analysis of barriers, and limited analysis of the extent and degree of various individual barriers. Strong beliefs that energy efficiency is virtuous may have led to over-optimistic views on how well barriers can be overcome, rather than to an analysis of the structure and social content of barriers interpreted with the nuance deserved. That is, in promoting energy efficiency, there is often a dogged insistence that consumers “should” appreciate energy efficiency products and that if they do not, they need to be educated to do so.
56 The CPUC defines market barriers as “Any characteristic of the market for an energy-related product, service, or practice that helps to explain the gap between the actual level of investment in, or practice of, energy efficiency and an increased level that would appear to be cost-beneficial to the consumer” (CPUC, http://docs.cpuc.ca.gov/ published/FINAL_DECISION/11474-05.htm, accessed October 2008). 57 Many lists and analyses of market barriers have been published since the mid-1990s; see Eto et al. (1996) for a good summary of the literature and IEA (2007) for a recent review.
Behavioral Assumptions in Energy Efficiency Potential Studies
35
These arguments do not always make sociological sense. For example, considering the residential sector, for many energy-relevant investments, monetary savings may be a few dollars per year or less, too small to bother with (Sanstad et al. 2006) and hardly detectable, given the variability of energy usage from billing cycle to billing cycle. Even when savings can be substantial, transaction costs – for example in pursuing a whole-house retrofit – can be very high. There may be non-energy benefits that counteract some of these transaction costs, but the investment is risky and the process disruptive. Another example of such over-optimism is the tendency of program information to emphasize only positive information about a product, despite evident concerns in target populations about what might be called “non-energy costs.”58
One especially powerful barrier is “split incentives,” which refers to cases where the financial incentive structure of the party making the investment does not align with those who would benefit from the purchase (Eto et al. 1996). Separating the payer of costs from the recipient of benefits disrupts the whole logic of cost-effectiveness. In theory, whenever the party that makes the investment decision does not pay the bills, there will be under-investment in energy efficiency relative to that classic case.59 Using the residential sector as an example, there are four basic possibilities, two of which predict such under-investment: (1) the household pays for the energy device and the energy bills, which fits the classic assumption; (2) the household pays for the energy device, but does not pay the bills, resulting, in theory, in under-investment in energy efficiency, as well as “a usage problem”; 60 (3) the household does not choose the device nor directly pay the bills, resulting in “a usage problem”; or (4) the most common version of split incentives – the household does not choose the energy device, but does pay the bills, resulting in under-investment in energy efficiency (Murtishaw & Sathaye 2006; IEA 2007). In the residential sector, split incentives occur most obviously in landlord-renter situations and between homebuilders and homebuyers, but they may occur in other situations as well, depending on how finances and financial decisions are shared within the households.
Only recently have studies attempted to quantify the importance of split incentives and their effect on energy consumption (ACEEE 2007; IEA 2007; Murtishaw & Sathaye 2006). In the U.S. residential sector, an estimated 33% of households are affected by the split-incentive issue for refrigerators, 78% for water heaters, 54% for main-space heating, and 5% for lighting (Murtishaw & Sathaye 2006). In total, among these four end-uses, this study estimates that 35% of residential site energy use is in households affected by split incentives (Murtishaw & Sathaye 2006).
58 For example, until recently, marketing efforts for CFLs rarely acknowledged consumer concerns about mercury content. Obviously, a private company may not want to introduce negative information, but the situation is different when public funds are at stake. 59 In the recent California energy efficiency potential studies (Itron & KEMA 2008), split-incentive considerations are nominally included in the willingness factor. 60 A usage problem refers to the idea that a consumer not paying utility bills will use higher levels of energy service than they would be willing to pay for themselves.
Behavioral Assumptions in Energy Efficiency Potential Studies
36
For the commercial sector, the problem of split incentives is even more complicated because of the structure of the market, investments, and energy costs (Reed et al. 2007), and the structure of decisions made within firms (deCanio 2003). The purchasing agent in a firm cannot be expected to necessarily act in the financial best interest of the company, for example, as opposed to his own interests or those of his department. Complicating this issue is the fact that many large commercial buildings are not sub-metered, resulting in a lack of premise-level data for even analyzing consumption or efficiency.61
A study by Sathaye and Murtishaw (2004) points to the importance of transaction costs and suggests that energy-efficient options are often imperfect substitutes for their less-efficient alternatives. Building on California energy efficiency potential studies (prior to 2006), the study assigned prices to reflect consumer preferences for CFLs and washing machines, as two residential sector examples. Using these preference prices and adding in estimates of transaction costs, their analysis adjusted nominal prices to reflect, through monetization, costs that were unaccounted for in the cost-effectiveness calculation. This monetization provides a possible route to more explicitly gauge the effects of various “preference” factors on actual customer adoptions. The current calculation method (2008 California energy efficiency potential studies) uses payback estimates for individual measures, which subsumes some of these preference factors.
Also external to the financial transaction are potential non-energy benefits of increased energy efficiency, which, in theory, overcome some of the costs that market barriers present. Energy efficiency potential studies do not directly represent non-energy benefits, though they can be implied in modeling choices, such as payback criteria, or integrated through calibration to past program results. But non-energy benefits may often be more important to the consumer than direct financial benefits. For example, homeowners may value a whole-house retrofit as providing comfort benefits (Amann 2006).62 By emphasizing the financial aspects of decision-making, consumer information promoting energy efficiency may unwittingly deter some investments and undershoot real potential, as Amann (2006) argues for whole-house retrofits.
Social and behavioral scientists from various disciplines have long been asked to help to explore the energy efficiency gap and to figure out how to close it, undertaking missions such as quantifying behavior, measuring attitudes, devising information to change behavior, and so on (Jelmsa 2004; Shove 1999; Wilson & Dowlatabadi 2007). This type of social science work is ultimately dedicated to increasing voluntary adoption of energy-efficient technologies and measures, bringing them closer to the levels indicated optimal and achievable in theory, without changing the framing of the problem or the terms by which it is addressed. Certainly there are insights and techniques here that individually-oriented social sciences, such as psychology or behavioral economics, can provide. But the strong focus on the energy efficiency gap and on
61 About 45% of the commercial building space is leased or rented (CBECS 2003: http://www.eia.doe.gov/emeu/ cbecs/cbecs2003/public_use_2003/data/FILE01.csv). 62 This may invite different accounting, both at the program-screening level (economic potential), as well as the consumer-adoption level. Some external benefits are already incorporated in CPUC cost-effectiveness tests. Amann (2006) identifies California’s Public Purpose Test as incorporating non-energy benefits.

Behavioral Assumptions in Energy Efficiency Potential Studies
37
justifying funding to close the gap (Sebold et al. 2001) has deflected attention from some of the most important potential contributions of social sciences.
This alternative social science viewpoint sees humans and organizations as core, and rated efficiencies of technology as peripheral, to questions about how society uses or could use energy. The focus is understanding what people do and why, in all its complexity (Bartiaux et al. 2006; Jelsma 2004; Lutzenhiser 1993; Lutzenhiser et al. 2002a; Shove 1999; Shove 2003a) – in contrast to figuring out why they do not do what theory suggests that they should do (“overcoming market barriers”) and how to get them to change along a prescribed path of technology adoption. In this view, energy-relevant and investment characteristics of people’s actions are just one element in a constellation of interests and constraints, and while the project of lowering energy use or increasing energy efficiency can still be relevant, the gap per se does not exist.
This realignment makes it easier to see why increasing voluntary adoption of energy efficiency measures is as hard as it is. In particular, the context of a decision – meaning the conditions under which a decision is made, the constraints of choice, the distribution of costs and benefits, and the many non-energy considerations – strongly shapes what decisions are made. The fact that issues are seen from the consumer side, rather than the marketing side, differentiates it from the market-barriers view. For example:
For most products, consumers rarely shop for energy efficiency or energy savings per se. Instead, they are looking for a refrigerator with the features and look they want, a good image for their company, a low-risk replacement, or something that makes them feel like they have made the right choice. Many considerations and factors enter into the purchase decision – such as intuition, self-interest of salespeople, personal relationships, concern with image, brand loyalty, etc. Some market barriers arguments partially recognize this, but it is a matter of degree and perspective.
Even where data on energy consumption are available, they may not be very convincing, either because they are not believed or because they are inconsequential. As mentioned for the residential sector above, savings for many measures may be very small – the average monthly energy bill in California is about $117 (EIA 2008). In the commercial sector, energy costs may not only be small, they may also be invisible in accounting.
Decisions rarely present themselves in a simple menu fashion, where energy efficiency takes a place alongside other features, to be selected or not. That format may be primarily a fiction of modeling. For example, energy efficiency is often bundled with additional features that may create an additional barrier to their purchase (Golove & Eto 1996) or, alternatively, an enticement to purchase a bigger model, contrary to a goal of absolute energy savings.
Savings estimates or other descriptions of benefits provided to promote the product may not be believed. Furthermore, the information may be wrong or not applicable to the purchaser (Sebold et al. 2001).
Behavioral Assumptions in Energy Efficiency Potential Studies
38
3.3.3 Possibilities for Improvement
The point of the social science critique is less to suggest active reconstructions of the calculative model than to reveal how little the real world may resemble the core model assumptions, and to suggest better understanding of the real world, alternative framings of problems, and thus policy solutions. In turn, this suggests a need for more real-world observations and openness to take these into account. The contextual and dynamic nature of sociological and anthropological explanations is not amenable to detailed modeling of the future. For the nitty-gritty of preparing energy efficiency potential studies in their established form, there are still some actionable directions. Among these are:
Basic qualitative research. More qualitative studies – whether through field observation and interviews, focus groups, or even surveys – could be very useful, as would be analyses that generalized from case study research. This could include not only the end “adoption decision” but also market and decision structures (e.g., Lutzenhiser et al. 2001).
Decision-making quantification and typology. Decision-making covers a variety of different purchasing and usage situations about which relatively little is known, but much has been assumed. Better knowledge here could contribute to both better program design and overall strategies. It can also suggest ways in which the variability of energy-relevant purchases and usage in the real world could be better accounted for in modeling, with no break in basic assumptions. For example, adoption decisions might be further partitioned by split incentives, the nature and size of the investment, household income, or business type. The variability of energy consumption across premises might also be taken more into account, as noted in the discussion on aggregation bias (see Section 3.2.1). As discussed above, one California energy efficiency potential study report (Itron & KEMA 2008) notes the particular need for updated information on payback parameters, and for better information on how incentive levels affect adoption. Conjoint analysis and choice experiments – which use surveys or interviews to ask or infer choices potential purchasers would make under various conditions – could be useful (Haynes et al. 2007; Itron & KEMA 2008; Rivers & Jaccard 2005; Rufo & Train 1999; Train 1985).
Energy efficiency potential studies already mobilize a great deal of data and assumptions, and there are limits to the value of trying to precisely describe real-world situations. Whether any of these additions would improve modeling would have to be assessed with a detailed technical analysis of model structure and uncertainties.
Assumptions about the value of increasing program investments. For want of alternative evidence, program investments in California studies are modeled as progressively increasing customer awareness and willingness to adopt, so that the more intense the program in terms of inventive levels and information dissemination, the higher the adoption rates. Successful conservation during the state’s 2000-2001 Energy Crisis and the increase in saturation of residential CFLs in conjunction with the recent low buy-down prices (Section 6) give credence to this assumption; but special circumstances matter and the long-term consequences of the ultra-low CFL prices, for example, are as yet unknown. A meta-analysis of past program results, combined with

Behavioral Assumptions in Energy Efficiency Potential Studies
39
techniques such as focus groups, interviews, and choice surveys might help inform the question of the extent to which increased funding increases adoption. As the marginal value (kWh/$) of increased funding for particular program efforts declines, alternative strategies may be preferable. The California residential and commercial energy efficiency potential study report (Itron & KEMA 2008) is explicit about the lack of empirical data on these matters:
“The current forecasting models lack empirical data to determine adoption parameters under [aggressive incentive and marketing] campaigns. The models also only have limited information on current consumer awareness and willingness to adopt high-efficiency measures, let alone how this awareness will be impacted by aggressive utility marketing campaigns. This lack of information leads to significant increases in uncertainty when increases in program incentives and marketing attempt to move program potential toward market potential.”
The next section examines another option for integrating behavior beyond technology adoption into energy efficiency potential studies.
40
4. Prospects for Integrating Behavioral Conservation Measures
The exclusion of behavioral change (other than tipping the adoption decision toward energy efficiency) as a means to energy savings in energy efficiency potential studies is consistent with traditional definitions of energy efficiency over the past two decades (Wilhite et al. 2000). California’s Standard Practice Manual (2001) defines energy efficiency improvements in the following way (CPUC 2001:2):
“Conservation programs reduce electricity and/or natural gas consumption during all or significant portions of the year. ‘Conservation’ in this context includes all ‘energy efficiency improvements’. An energy efficiency improvement can be defined as reduced energy use for a comparable level of service resulting from the installation of an energy efficiency measure or the adoption of an energy efficiency practice. Level of service may be expressed in such ways as the volume of a refrigerator, temperature levels, production output of a manufacturing facility, or lighting level per square foot.”63
In this definition, energy efficiency improvements result in conservation; they can include the adoption of an energy efficiency practice, so long as it does not reduce service levels. Most behavioral conservation reduces services levels. Doubts about the persistence, reliability, and measurability of behavioral conservation have further sealed its exclusion from California energy efficiency potential studies and most DSM program efforts.
Recent developments in the energy efficiency field, as outlined in Section 1, have raised the possibility that behavior may have more promise for energy savings than usually assumed. The question of how to assess energy savings from behavioral change has become current (Bartiaux et al. 2006; Broc et al. 2008; Marbek Resource Consultants 2007; Russell & Miner 2008; SeeLine Group 2005). In particular, BC Hydro, an electric utility serving most of British Columbia, integrated behavioral conservation measures into its quantification of energy savings potential in their 2007 Conservation Potential Review (Marbek Resource Associates 2007, Robillard et al. 2008), as they have in earlier reviews (Nyboer & Bailie 1994). To our knowledge, the BC Hydro studies are the only major energy efficiency potential study series to consider behavioral conservation as a formal, countable, route to long-term energy savings. Drawing from the 2007 BC Hydro Conservation Potential Review, this section discusses some difficulties and advantages of integrating simple behavioral measures into energy efficiency potential studies.
Our paper does not argue that behavioral conservation should be included in California energy efficiency potential studies. That answer depends on whether the regulatory definition of what is
63 The California Energy Efficiency Policy manual states that: “Energy efficiency activities encompassed by this document are those that require permanent replacement of energy-using equipment with more efficient models. Only those activities that fall within this definition or support the ultimate goal (such as related information or education activities), will be considered for PCG funding” (CPUC 2003). Load-shifting programs that use only “temporary or impermanent behavioral change” are ineligible for funding (CPUC 2003).

Behavioral Assumptions in Energy Efficiency Potential Studies
41
addressed by energy efficiency potential studies changes to include behavioral change (outside the paper’s scope), as well as on whether the logic is suitable, the data are good enough, and the potential scale of change is adequate (partially addressed here).
As to the basic potential of behavioral conservation, opinions on whether behavioral change can make much of a difference tend to be divided. One side sees people as being unacceptably wasteful of energy and assumes that information, moral suasion, and higher prices can get people to waste less energy. An opposing viewpoint presumes that most people and most establishments conserve most of the time. While energy price elasticity suggests that some energy-relevant behaviors would change if energy prices were to increase, the presumption is that, short-term emergencies aside, most additional savings from behavioral change are limited without substantially reducing people’s quality of life. Some have argued (Von Wieszäcker et al. 1997) that admonitions to conserve quickly become so moralistic that their effectiveness is limited. In this view, human nature generally trumps the logic embedded in “information” and moral suasion, so technological change becomes the general solution to limiting future energy use. Even accepting that behavior can be influenced and changed, the possibility that behavioral conservation could reduce quality of life cannot be dismissed. For example, one Swedish study suggests that conservation efforts can cause increased stress and workload burdens in some households, especially for women (Carlsson-Kanyama & Lindén 2007). And some of these conservation efforts may not even result in savings (Crompton 2008; Diamond & Moezzi 2000). Both the costs and the potential benefits of behavioral conservation are harder to judge than for technological change. Setting aside the question of how behavioral conservation savings could be achieved and at what costs, BC Hydro’s study first addresses how much energy might reasonably be saved based on best-available estimates of current practices and theoretical estimates of savings from changing these practices.
4.1 BC Hydro’s Conservation Potential Review
BC Hydro’s 2007 Conservation Potential Review uses the standard basic approach for bottom-up energy efficiency potential studies, but alongside modeling energy savings from technology adoption, also assesses savings potential for behavioral conservation in the residential and commercial sectors (Marbek Resource Consultants 2007; Robillard et al. 2008; Sahota et al. 2008; Tiedemann et al. 2008). To assess behavioral conservation potential, this analysis developed a long list of candidate behavioral measures and vetted this list based on data availability, potential savings, and judgment as to whether the measure would substantially affect lifestyle. Measures that were assumed to substantially affect quality of life – for example, line-drying clothes for the residential sector – were excluded from the behavioral conservation analysis.64 The result was a total of 25 behavioral conservation measures for the residential sector and 18 measures for the commercial sector, as detailed later in this section. Commercial measures included only actions that normal employees (as opposed to building operators or
64 Some of the omitted measures were considered in a parallel “lifestyle” change analysis.
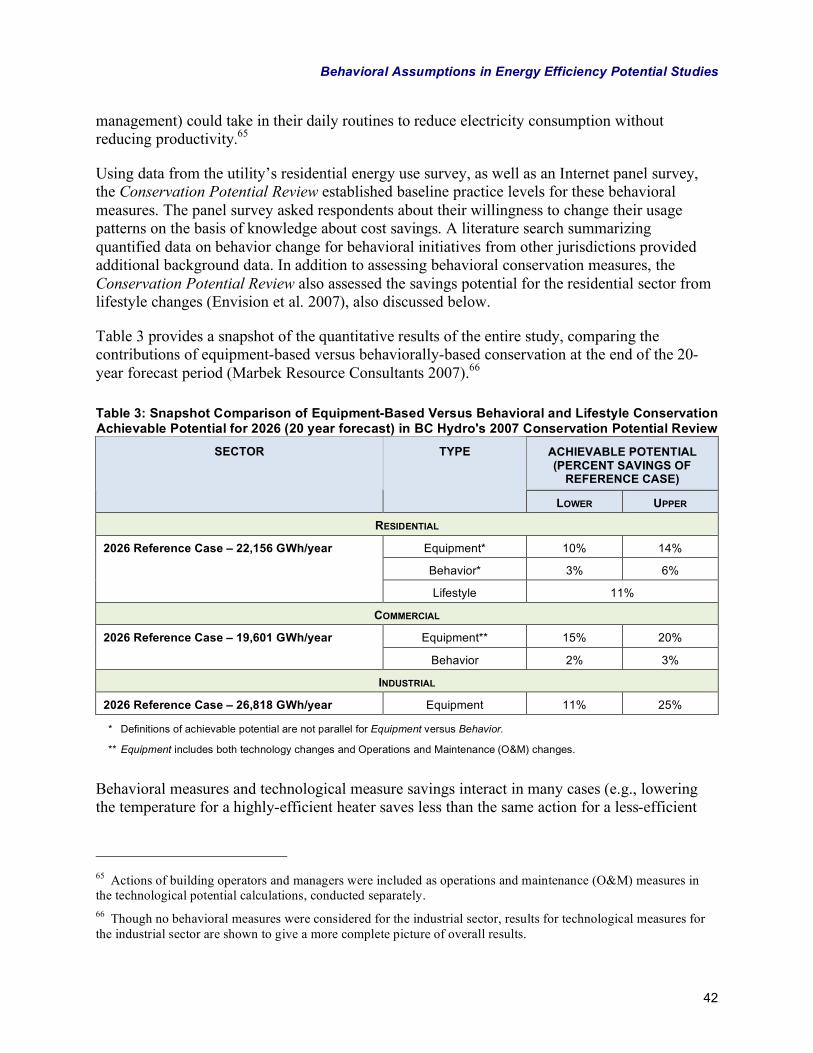
Behavioral Assumptions in Energy Efficiency Potential Studies
42
management) could take in their daily routines to reduce electricity consumption without reducing productivity.65
Using data from the utility’s residential energy use survey, as well as an Internet panel survey, the Conservation Potential Review established baseline practice levels for these behavioral measures. The panel survey asked respondents about their willingness to change their usage patterns on the basis of knowledge about cost savings. A literature search summarizing quantified data on behavior change for behavioral initiatives from other jurisdictions provided additional background data. In addition to assessing behavioral conservation measures, the Conservation Potential Review also assessed the savings potential for the residential sector from lifestyle changes (Envision et al. 2007), also discussed below.
Table 3 provides a snapshot of the quantitative results of the entire study, comparing the contributions of equipment-based versus behaviorally-based conservation at the end of the 20-year forecast period (Marbek Resource Consultants 2007).66
Table 3: Snapshot Comparison of Equipment-Based Versus Behavioral and Lifestyle Conservation Achievable Potential for 2026 (20 year forecast) in BC Hydro's 2007 Conservation Potential Review
ACHIEVABLE POTENTIAL (PERCENT SAVINGS OF
REFERENCE CASE)
SECTOR TYPE
LOWER UPPER
RESIDENTIAL
Equipment* 10% 14%
Behavior* 3% 6%
2026 Reference Case – 22,156 GWh/year
Lifestyle 11%
COMMERCIAL
Equipment** 15% 20% 2026 Reference Case – 19,601 GWh/year
Behavior 2% 3%
INDUSTRIAL
2026 Reference Case – 26,818 GWh/year Equipment 11% 25%
* Definitions of achievable potential are not parallel for Equipment versus Behavior.
** Equipment includes both technology changes and Operations and Maintenance (O&M) changes.
Behavioral measures and technological measure savings interact in many cases (e.g., lowering the temperature for a highly-efficient heater saves less than the same action for a less-efficient
65 Actions of building operators and managers were included as operations and maintenance (O&M) measures in the technological potential calculations, conducted separately. 66 Though no behavioral measures were considered for the industrial sector, results for technological measures for the industrial sector are shown to give a more complete picture of overall results.
Behavioral Assumptions in Energy Efficiency Potential Studies
43
heater). Table 3 shows results before accounting for interactions.67 At the upper end of the achievable potential ranges, behavioral changes are estimated to contribute less than half as much as equipment changes would in the residential sector, and one-seventh as much as equipment in the commercial sector. Behavioral measures in the residential sector are estimated at 3% to 6% of reference-case residential consumption – with subsequent analysis indicating even 11% savings (Sahota et al. 2008). Behavioral conservation measures in the commercial sector are 2% to 3% of commercial sector reference-case consumption. Lifestyle changes, conducted as a stand-alone analysis, not integrated in the final estimates of total potential, had estimated savings in the residential sector on the same scale (11% of reference-case total) as for the equipment-based potential.
These overall results suggest modest potential savings for behavioral conservation measures, roughly on the level suggested by past crises and energy consumption feedback (Section 7). Upper-bound expected savings from the lifestyle analysis are higher, up to 25% of reference-case savings, but low relative to the claims that are sometimes made for past savings from energy-efficient technology diffusion – e.g., Metcalf (2006), who suggests that energy efficiency reduced U.S. energy consumption requirements by half over three decades. Behavioral conservation measures are discussed in more detail below.
4.2 Residential Conservation Measures
Table 4 is a list of basic behavioral conservation measures for the residential sector, comprising all measures included in the BC Hydro analysis.68 Each measure either reduces energy use directly by reducing energy services, eliminates “unnecessary” uses, or uses behavioral means to increase the efficiency with which the service is carried out. Some measures are habitual and others are one-time or periodic. Measures that facilitate energy savings rather than directly produce them – such as doing full loads of laundry or using daylight – are excluded from the table to avoid overlap with service-reduction measures (e.g., using less electric lighting). Common no-cost low-cost measures that involve technological maintenance (e.g., draft-proofing) or do-it-yourself installation might as well be considered technological. Some of these measures have been considered in recent California energy efficiency potential studies.69
67 In the commercial sector, the calculated overlap between savings from occupant behaviors and those from technology measures was high: over 80% of the independently-calculated behavioral savings (i.e., in the absence of technological change) would be obviated by the modeled increases in technological efficiency. 68 The behavioral conservation measures in this table are derived from the measures that were used in BC Hydro’s Conservation Potential Review 2007 (Marbek Resource Associates 2007). 69 For example, natural gas measures analyzed in an earlier California study included pipe wrap, water heater insulation, low-flow showerheads, and faucet aerators. These measures were found to be very cost-effective (KEMA-Xenergy 2003), but the potential for increased penetration of these measures was questioned because of their current low penetration – interpreted as indicating low interest by customers.

Behavioral Assumptions in Energy Efficiency Potential Studies
44
Table 4: Examples of Behavioral Conservation Measures for the Residential Sector, Based on Measures Included in BC Hydro’s 2007 Conservation Potential Review
END-USE MEASURE FINAL MEASURE IN BC HYDRO
2007 CPR (YES/NO)*
Reduce temperature or turn off – daytime Yes
Reduce temperature or turn off – night Yes
Reduce temperature or turn off – not at home Yes
Heat only occupied parts of home Yes
Maintain draft-proofing** Yes
Space Heating
Install storm windows Yes
Increase temperature – at home Yes
Increase temperature or turn off – not at home Yes
Use lower-consuming method to cool or ventilate (e.g., a room air conditioner, evaporative cooler, or fans,
instead of a central air conditioner)
No
Space Cooling
Use shading and window treatments to reduce heat gain Yes
Refrigerator – proper temperature Yes
Refrigerator – place away from heat sources No
Refrigerator – recycle second or rarely used refrigerators No
Freezer – proper temperature Yes
Freezer – defrost Yes
Clothes washer – do fewer loads Yes
Clothes washer – wash/rinse in cold water Yes
Clothes dryer – use less (e.g., line-dry) No
Clothes dryer – use heat sensor Yes
Dishwasher – reduce number of loads No
Dishwasher/DWH – do not pre-clean dishes No
Dishwasher – air dry dishes Yes
Cooking – turn range/oven on less No
Appliances
Put lids on pots No
Light only what is needed for tasks Yes
Use lowest-wattage lights possible Yes
Reduce outdoor lighting Yes
Lighting
Turn off lights when leaving the room Yes
Continued
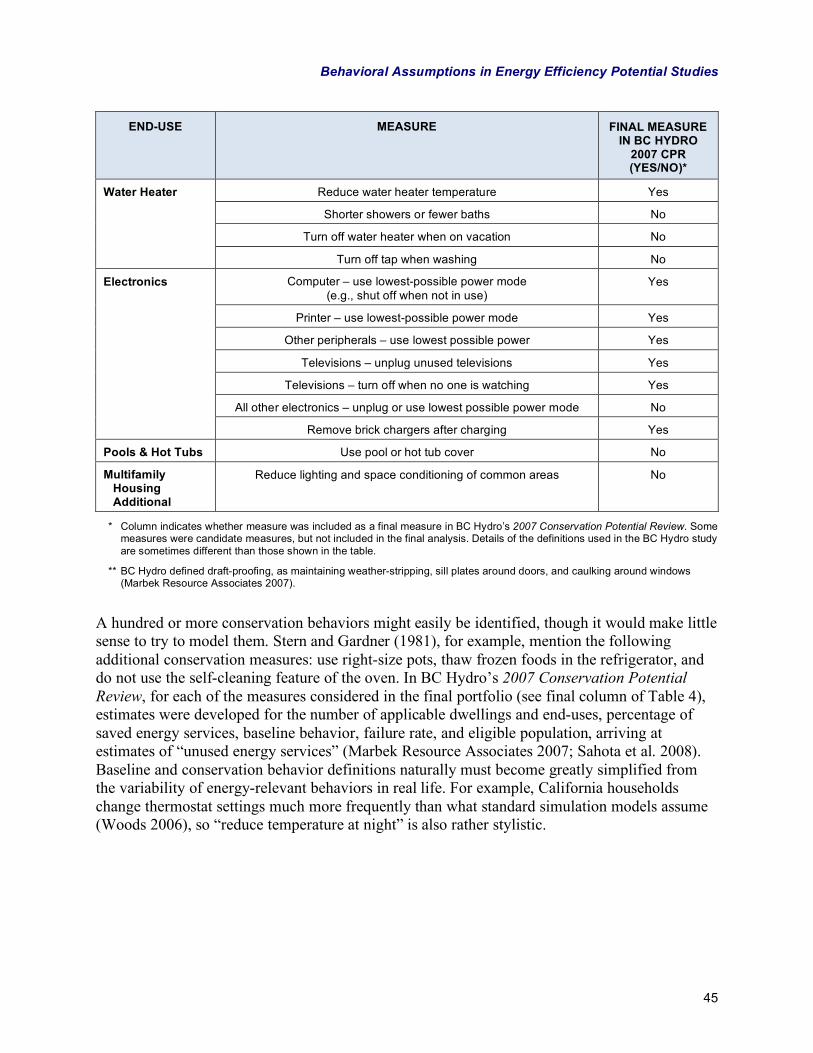
Behavioral Assumptions in Energy Efficiency Potential Studies
45
END-USE MEASURE FINAL MEASURE IN BC HYDRO
2007 CPR (YES/NO)*
Reduce water heater temperature Yes
Shorter showers or fewer baths No
Turn off water heater when on vacation No
Water Heater
Turn off tap when washing No
Computer – use lowest-possible power mode (e.g., shut off when not in use)
Yes
Printer – use lowest-possible power mode Yes
Other peripherals – use lowest possible power Yes
Televisions – unplug unused televisions Yes
Televisions – turn off when no one is watching Yes
All other electronics – unplug or use lowest possible power mode No
Electronics
Remove brick chargers after charging Yes
Pools & Hot Tubs Use pool or hot tub cover No
Multifamily Housing Additional
Reduce lighting and space conditioning of common areas No
* Column indicates whether measure was included as a final measure in BC Hydro’s 2007 Conservation Potential Review. Some measures were candidate measures, but not included in the final analysis. Details of the definitions used in the BC Hydro study are sometimes different than those shown in the table.
** BC Hydro defined draft-proofing, as maintaining weather-stripping, sill plates around doors, and caulking around windows (Marbek Resource Associates 2007).
A hundred or more conservation behaviors might easily be identified, though it would make little sense to try to model them. Stern and Gardner (1981), for example, mention the following additional conservation measures: use right-size pots, thaw frozen foods in the refrigerator, and do not use the self-cleaning feature of the oven. In BC Hydro’s 2007 Conservation Potential Review, for each of the measures considered in the final portfolio (see final column of Table 4), estimates were developed for the number of applicable dwellings and end-uses, percentage of saved energy services, baseline behavior, failure rate, and eligible population, arriving at estimates of “unused energy services” (Marbek Resource Associates 2007; Sahota et al. 2008). Baseline and conservation behavior definitions naturally must become greatly simplified from the variability of energy-relevant behaviors in real life. For example, California households change thermostat settings much more frequently than what standard simulation models assume (Woods 2006), so “reduce temperature at night” is also rather stylistic.
Behavioral Assumptions in Energy Efficiency Potential Studies
46
Some conservation measures are easy to imagine being promoted in public campaigns.70 For example, washing clothes in cold water provides good savings relative to hot or warm wash, since, on average, 80% of the total energy used per wash is for water heating for vertical-axis machines (Sabaliunas et al. 2006) and there are palpable non-energy benefits to cold water wash, such as less damage to clothes. The recommendation to wash or rinse in cold water is common in Energy Tip lists and marketing programs have successfully promoted these measures.71 On the other hand, some suggestions (e.g., change the temperature on a water heater or refrigerator) raise practical and maybe even liability questions. Even a recommendation to voluntarily change thermostat set-points may threaten the health of vulnerable populations (Brown & Walker 2008).72 And many behavioral conservation measures may be so banal and have so minor an impact on energy consumption that publicizing them could have a detrimental savings effect in the long run, risking advice overload, poor credibility, and the possibility that minor actions substitute for important ones.
4.3 Commercial Sector Measures
Traditional energy efficiency potential studies have not considered the actions of ordinary commercial building occupants, as these occupants do not make relevant technology investments. For estimating behavioral conservation potential, however, building occupants are central. Table 5 shows the behavioral conservation measures considered in the commercial behavioral conservation segment of the 2007 Conservation Potential Review (Marbek Resource Consultants 2007). Estimating the extent to which these measures are even applicable is obviously difficult. For example, using windows to increase natural ventilation depends on whether there are operable windows, who controls them, and how much ventilation the open windows provide; the energy savings depends on whether mechanical ventilation is correspondingly reduced.
Toward estimating applicability and baseline levels, BC Hydro undertook a panel survey with 279 respondents. For each measure, survey respondents were asked which of the conservation actions were possible, which they already practiced, and, in most cases, whether they were satisfied with existing conditions (Tiedemann et al. 2008). These responses were used to derive achievable potential estimates. The 3% upper bound savings potential suggested in Table 3 suggests that occupant behavior makes just a slight difference.
70 This presumes that measures included would be represented individually in DSM programs, as is done for technological measures, rather than as elements of a more diffuse change toward more disciplined, more conservative energy use or integrated in consumption feedback approaches that implicitly aggregate over any number of minor measures. 71 Switch to Cold/Passez au Froid by the Canadian Energy Efficiency office, for example. 72 For example, water quality can be affected by water tank temperature, and food safety and longevity related to refrigerator temperature.
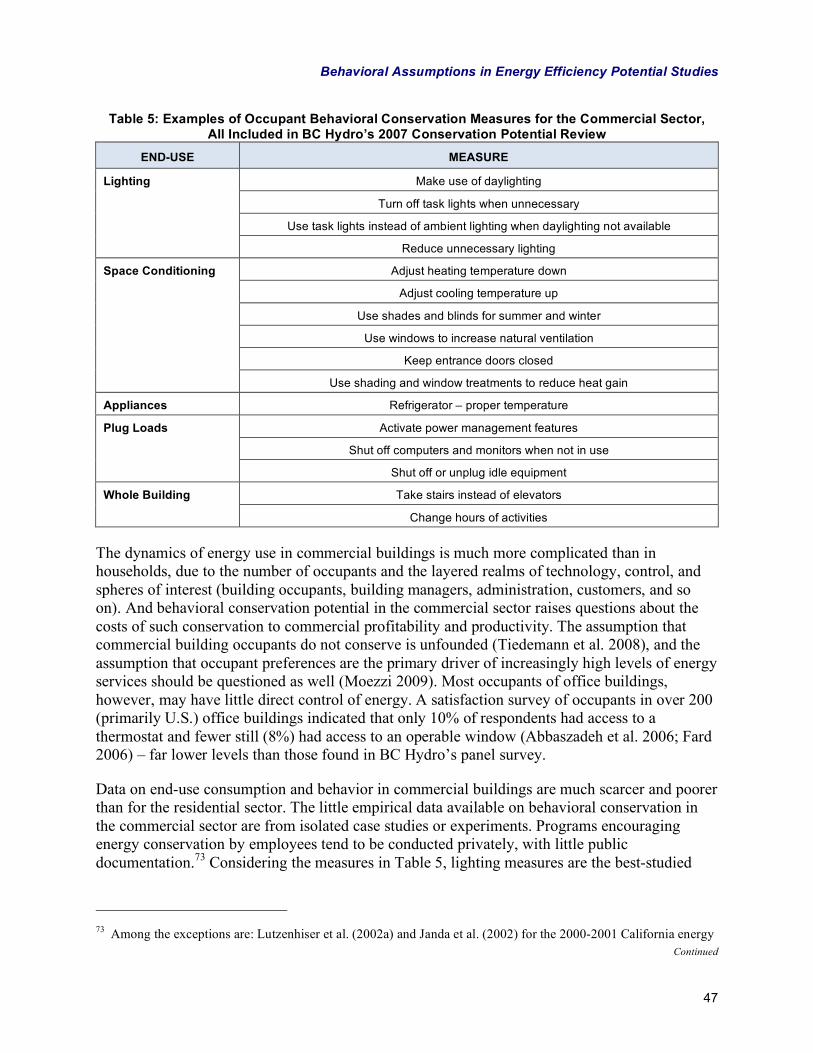
Behavioral Assumptions in Energy Efficiency Potential Studies
47
Table 5: Examples of Occupant Behavioral Conservation Measures for the Commercial Sector, All Included in BC Hydro’s 2007 Conservation Potential Review
END-USE MEASURE
Make use of daylighting
Turn off task lights when unnecessary
Use task lights instead of ambient lighting when daylighting not available
Lighting
Reduce unnecessary lighting
Adjust heating temperature down
Adjust cooling temperature up
Use shades and blinds for summer and winter
Use windows to increase natural ventilation
Keep entrance doors closed
Space Conditioning
Use shading and window treatments to reduce heat gain
Appliances Refrigerator – proper temperature
Activate power management features
Shut off computers and monitors when not in use
Plug Loads
Shut off or unplug idle equipment
Take stairs instead of elevators Whole Building
Change hours of activities
The dynamics of energy use in commercial buildings is much more complicated than in households, due to the number of occupants and the layered realms of technology, control, and spheres of interest (building occupants, building managers, administration, customers, and so on). And behavioral conservation potential in the commercial sector raises questions about the costs of such conservation to commercial profitability and productivity. The assumption that commercial building occupants do not conserve is unfounded (Tiedemann et al. 2008), and the assumption that occupant preferences are the primary driver of increasingly high levels of energy services should be questioned as well (Moezzi 2009). Most occupants of office buildings, however, may have little direct control of energy. A satisfaction survey of occupants in over 200 (primarily U.S.) office buildings indicated that only 10% of respondents had access to a thermostat and fewer still (8%) had access to an operable window (Abbaszadeh et al. 2006; Fard 2006) – far lower levels than those found in BC Hydro’s panel survey.
Data on end-use consumption and behavior in commercial buildings are much scarcer and poorer than for the residential sector. The little empirical data available on behavioral conservation in the commercial sector are from isolated case studies or experiments. Programs encouraging energy conservation by employees tend to be conducted privately, with little public documentation.73 Considering the measures in Table 5, lighting measures are the best-studied
73 Among the exceptions are: Lutzenhiser et al. (2002a) and Janda et al. (2002) for the 2000-2001 California energy
Continued
Behavioral Assumptions in Energy Efficiency Potential Studies
48
(Section 6), although data are still sparse and measure interaction complicates savings estimation. For an individual in an office, for example, there may be personally-controlled task lighting, communally- or sensor-controlled overhead lighting, and daylighting controlled by a few individuals; changes in any one measure may affect the energy use of the others.
The intertwining of behavior and technology leads to the question of what opportunities might be missing from both technology and behavior measure lists, and how design for renovation and new commercial building construction might best provide technological options that better allow for behavioral conservation (e.g., operable windows, usable and attractive stairways) without inviting new consumption. Buildings that are better adapted to the mutual provision of user wants and lower energy use – possibly providing more leeway for user choice, rather than less – may be a more effective route to lower conservation than asking people to use less.74 There is good opportunity here for the integration of building occupant satisfaction analysis with energy use analysis.
4.4 Beyond Behavior
Behavioral conservation measures, as illustrated in Table 4 and Table 5, above, fit easily alongside technical measures used in traditional bottom-up energy efficiency potential studies. This parallelism can be misleading. Not only are most behavioral changes more amorphous and variable than technical changes, behavioral conservation is also a restricted way of thinking about societal energy use. Caught in their basic definition of reducing energy service levels, behavioral conservation measures do not challenge assumptions about base levels of desires or expectations, nor the context which creates these expectations.75 This forces a provisional, temporary character onto behavioral change, and leaves out higher-level questions about how energy service needs are defined and can be changed.
Recognizing that “social” energy savings possibilities are much broader than behavioral conservation, the 2007 Conservation Potential Review also included a Lifestyle component (Envision et al. 2007; Marbek Resource Associates 2007). In addition to a visioning exercise where participants debated what sorts of futures were possible, this component modeled residential sector savings potential for a few scenarios (see summary results in Table 3, above). Two types of lifestyle changes were considered: activities and decisions that reduced energy services (e.g., reduced penetration of air conditioners and reduced use of these air conditioners); and changes to lower-impact built infrastructure, in particular, with smaller, attached dwellings
crisis; Smith et al. (2002) for two federal workplaces; the City of Toronto’s program e3@work (http://www.toronto.ca/energy/e3atwork/index.htm), targeted to businesses to help them design their own programs; studies at universities; and case studies by ENERGY STAR® and Flex Your Power, done for demonstration rather than research purposes. 74 This does not imply that more individualized electronic or mechanical controls (e.g., thermostat setting, automatic shades) would necessarily reduce consumption. Rather, the point here is the possibility of a less tightly controlled building, as proposed in work on adaptive comfort. 75 As noted earlier, not all measures traditionally classified as “behavioral conservation” reduce service levels.

Behavioral Assumptions in Energy Efficiency Potential Studies
49
substituting for bigger single-family houses. Both of these types of changes are outside the usual bounds of energy efficiency potential studies and of normal lists of energy conservation behaviors.76
Both the lifestyle and behavioral conservation analysis are explicitly bounded by subjective judgments on what is reasonable or possible, in contrast to the financially-based rules that drive much of energy-efficient technology adoption modeling. This subjectivity (and the weak connection to DSM programs) contrasts with the definition of energy efficiency potential implicit in the California studies completed for the CPUC. However, it also provides a tool that is otherwise absent in energy efficiency potential studies, since technology-centered approaches imply that beyond purchasing, behavior is out of bounds or even inconsequential. In undertaking the creation of a “conservation culture” (Robillard et al. 2008), BC Hydro’s analysis invites a view in which behavior matters beyond purchase decisions, and where technology-centered approaches and behavior-centered approaches are pushed to develop affinities.
4.5 Prospects and Difficulties
As for continuing and expanding this work, a number of questions arise:
Interpretation of potential studies that include behavioral change. Integrating conservation behavior into energy efficiency potential studies changes the interpretation of the studies. The loosened boundaries – lowered service levels, human-centered savings – makes the results more ambiguous, representing an in-between level of change, partially technological and partially behavioral. Once conservation behaviors are allowed, a new set of questions arise: What other, possibly more important, behavioral changes might be considered, and how can limits be established? Accounting for measure interactions is another difficulty. Conservation behaviors and behavioral baselines are difficult to define, and are poorly backed by observation or theory. All this reduces the perceived solidity of energy efficiency potential estimates and their political and rhetorical power. A formal uncertainty analysis could help address some of these questions.
Weak evidence of successful behavior-change programs. There is limited evidence to reliably link persistent new conservation behaviors or changes in energy behavior overall to information interventions (Section 5). This does not mean that these types of programs do not work. Rather, it is hard to prove that they do.
Old debates on conservation versus efficiency. Including conservation behaviors condones conservation and introduces an obvious moralism into strategies promoting conservation behaviors. For most of the last 15 years, efficiency has been routinely contrasted with conservation, with efficiency posed as a logical and modern way of
76 The lifestyle analysis was treated as a companion analysis, rather than integrated with the other potential analysis. Rufo & North (2007) do consider housing stock changes in their analysis of long-term California potential.

Behavioral Assumptions in Energy Efficiency Potential Studies
50
getting the same for less, and conservation as old-fashioned and a form of sacrifice. The underlying message has been that you could do anything you wanted, as long as it was done efficiently (Moezzi 1998). Hence, a shift to back to conservation may be seen as damaging the “efficiency” message.
Taking conservation seriously. If behavioral conservation is to be considered as a reliable part of the energy consumption reduction arsenal, it must be taken seriously (Broc et al. 2008; Lutzenhiser 2002b). This is not a matter of simply better marketing, but instead, understanding why people and sociotechnical systems use energy as they do and what opportunities and barriers there are to change. Behavioral measures promoted should be reasonable and be reasonably effective in conserving energy, and the information provided should, as much as possible, address the real questions that people have about energy use.77 As it is, with exceptions, behavioral conservation has been pursued haphazardly in the workplace (Broc et al. 2008) and often naively or technically incorrectly in programs addressed to the residential sector (Diamond & Moezzi 2000).78
For technological measures, energy efficiency potential studies are a way of testing scenarios, rather than forecasting per se, giving form and solidity to technological change and utility programs as an appropriate resource of future energy supply (Itron & KEMA 2008). Energy efficiency potential studies could serve a similar role for behavior-centered or – maybe even better – technology-behavior integrated measures. Detailed consideration of what individuals, companies, and other entities really can do to reduce energy consumption by behavioral means, barriers to these behaviors, and the costs and benefits of following them would lay useful groundwork. Such work, integrating both social scientific and technical sensibilities, could include questions about why, for example, residential clothes dryers are rare in some countries (Italy) and widespread in others (e.g., U.S.), or investigate more thoroughly the different levels of temperature considered normal or comfortable across households or workplaces, domestically or internationally.
77 It is sometimes argued that measures are effective if people do them, even if these save little or no energy, because these actions engage individuals in “doing the right thing.” A similar argument is found in the “small steps” approach to energy consumption reduction and sustainability in general; see the provocative critique by Crompton (2008). 78 High-quality publications directed to those seriously interested in their own energy use (e.g., Amman et al. 2007, for residential energy use) are among the exceptions.

51
5. Quantitative Data on Energy Behavior If behavior is an important and malleable determinant of energy consumption, there may be a case for integrating behavioral change into the assessment of energy efficiency or energy program savings potential, as already tested in the BC Hydro example covered in the previous section. This raises two practical questions; first, whether existing behavioral change data are good enough to support calculations; and second, which, if any, past programs have successfully influenced energy-relevant behavior with persistence. This section covers parts of both these questions, considering only behavioral conservation, rather than broader sorts of social change.79
The summary answer to the question of data quality is easy. Aside from the self-reported data on behavioral baselines reported in large-scale surveys (e.g., the U.S. DOE’s Residential Energy Conservation Survey), quantitative data on behavior and behavioral change related to energy use are sparse, difficult to compare, and from a statistical standpoint, inconclusive. These shortcomings are due in part to the limited funding that has been allocated to studying behaviors and the piecemeal approach resulting from the program-specific nature of most studies; but they are also due to fundamental difficulties with developing adequate quantitative descriptions on a topic as complex, contextual, difficult to observe, and dynamic as energy-relevant behavior. These problems of evidence are one reason that energy policy has shied away from addressing behavior very seriously. Program cost-effectiveness, in particular, has been difficult to defend.
Over the past thirty-five years, a vast literature on behavior-centered energy conservation has amassed, most of it on residential energy use. One Dutch study uncovered 2,000 references for consumer conservation behavior (Uitenbogerd et al. 2007), for example, and even a 1979 review of household energy consumption and conservation included over 500 studies (Ritchie et al. 1981). This literature has yielded neither a coherent picture of behavioral energy conservation nor its response to intervention. Even various basic practices and questions – such as how air conditioning levels are set in residences, why lights in commercial buildings are or are not turned off at night, how and whether savings from conservation are perceived, or how important this is, and so on – are poorly understood. In short, far less is known than the size of the literature suggests – speaking less to poor work than to the difficulty of the problems addressed.
5.1 Information as Intervention
Behavioral conservation programs sometimes provide monetary or material incentives, but “information” is the primary intervention used to try to invoke behavioral change to reduced
79 It does not address the program evaluation literature, debates on behavioral antecedents such as attitudes and intents, adoption behavior, or the behavioral economics literature.
Behavioral Assumptions in Energy Efficiency Potential Studies
52
energy consumption.80 Information and outreach programs have shown good results under certain circumstances, but not much evidence that such programs themselves can bring widespread and long-term changes in behavior that also yield notable energy savings (Bartiaux 2006; Ek & Söderholm 2008; Lutzenhiser 2002b; McKenzie-Mohr Associates 2001; Owens & Driffill 2006).81 Consumers may not feel under-informed about energy use at all. More likely, if they are looking for information on energy, it is probably rarely of the nature that program information typically gives – often simple, consumer-average statements, focused only on the presumed positive aspects of a measure, rather than on the specific problems, context, and multi-layered concerns of the consumer. Face-to-face, customized information may be quite effective, but such programs are expensive and uncommon. Yet as to mass information, Americans receive thousands of marketing messages per day, many urging consumption (e.g., new appliance purchases),82 and lists of things that one can or should do to save energy or “save the planet” are, at present, scattered everywhere. Any program directed to motivate behavioral change must compete for attention among these other messages and programs faced by consumers amid the normal stresses and duties of the day. This competition can lead to stridency, which can backfire. How information and education about behavioral change are received, and the deeper effect of these multiple environmentally-oriented messages, has received little formal attention in the energy efficiency field.
5.2 Reviews on Behavior-Centered Intervention
The existing literature on energy conservation may be insufficiently used (Bruel 2007), but it is also not easy to know how to use case studies – diverse in time, location, and context – that comprise most of this literature. Recent reports and projects – all from outside the U.S. – have undertaken literature reviews of published studies of behavioral conservation interventions, with a focus on their quantitative elements (Abrahmse 2007; Abrahmse et al. 2005; Bruel 2007; Marbek Resource Consultants 2007; Uitdenbogerd et al. 2007). The results of these meta-analyses are summarized below.
BEHAVE, a European Commission project, began with the assumption that changing the energy-relevant behaviors of residential consumers could significantly decrease household energy consumption, citing savings of up to 20% from feedback studies (Bruel 2007).83 The project undertook a meta-analysis of communication programs oriented to changing household energy behavior, with a view toward determining success factors, and offered an analysis of
80 The problem in discussing the role of information is that the term is terribly broad and can comprise just about any form of communication. In this simple discussion, we mean program material that is devised to get people to do something different than they would do otherwise. 81 Education and training programs aimed at market actors, rather than end-consumers, may be more successful, but are beyond the scope of this discussion. 82 One estimate, widely reported in the media, suggests that American consumers receive 3,000 marketing messages per day (e.g., http://www.fastcompany.com/magazine/14/permission.html). 83 The project website (http://www.energy-behave.net/home.html) also includes a database of these cases.
Behavioral Assumptions in Energy Efficiency Potential Studies
53
those factors and recommendations for what works best (Dahlbom et al. 2009). But the authors noted that impact evaluation of these communication programs was rare. “Most behavioural change strategies and/or programmes do not sufficiently include an evaluation of their effects of strategies. What is often measured is the distribution of leaflets, the number of hits on a specific website, etc” (Bruel 2007). Not only is quantitative assessment of behavioral change likely to be difficult and expensive, it does not capture the longer-term effects of changes in attitudes that most communication programs try to affect (Bruel 2007). This finding is consistent with California evaluation practices (TekMarket Works 2004) – the problem being that un-quantified savings risk being counted as zero (Green & Skumatz 2000).
Another review of the literature on energy-relevant household behavior, undertaken by the Dutch government, argued that there was a lack of systematic studies of program interventions directed towards changing household energy behavior (Uitdenbogerd 2008; Uitdenbogerd et al. 2007). The authors concluded that most studies focused on the intervention, rather than on the target group, offered only post-hoc explanations for results, and were rarely able to “prove” very much. Personally-delivered advice, customized information, feedback, and high peak rates for electricity were all identified as particularly effective. This review suggested that households undertake particular conservation measures less on the basis of the potential energy savings of the actions, but rather on their awareness of the action. The implication is that there is minimal calculation of tradeoff between effort and potential savings, even while evidence of savings appears to be important, as signaled by the successes seen in energy feedback studies. The review cited 0% to 25% potential savings for household electricity consumption and 3% to 22% potential savings for household gas consumption (Uitdenbogerd et al. 2007).
Abrahamse (2007) also reviewed behavior change programs aimed at household energy use, as well as behavioral antecedents for these changes. This review underscored the methodological problems noted in the two Dutch reviews summarized above, noting also that information dissemination often increased knowledge, but that increased knowledge did not necessarily make a difference in practices (Abrahmse et al. 2005). The reviewed programs focused on instigating voluntary behavior by changing perception or knowledge, rather than changing the reward structure, such as financial incentives (Abrahamse et al. 2005). Consumption feedback interventions – whether in-home monitors, frequent billing, or comparisons – were the found to be the most effective method for reducing household energy consumption, but questions about persistence remain. Simply put, the authors note, “Many environmental problems, such as energy use, are related to human behaviour, and consequently, may be reduced through behavioural changes” (Abrahamse et al. 2005), yet how to achieve these changes and to be reassured that they stick remains a stubborn problem.
A smaller-scale literature review, completed to support the conservation behavior potential component of BC Hydro’s Conservation Potential Review, located data on baseline and post-intervention levels of specific conservation measures in the residential and commercial sectors, covering both programs and experimental data (Marbek Resource Consultants 2007). The literature provided quantitative estimates of behavior change (rather than related energy savings, which is almost never available outside of feedback or whole-bill-based analyses) for a number of conservation measures. But statistically and sociologically, these results are poorly extrapolated to other conditions. Where there was good quantitative information, it was usually

Behavioral Assumptions in Energy Efficiency Potential Studies
54
derived from studying very specific groups (e.g., university dormitories or classrooms, military housing), for specific goals. In most cases, studies made no acknowledgement of the problems of self-selection and self-reporting. Case studies may be done as well as possible under the circumstances faced, but this does not necessarily constitute good science.
As evidenced by the reviews cited above, most studies on energy behavior focus on the behavior of individuals as representatives of household behavior, with little coverage of energy-relevant behavior of individuals as employees, purchasing agents, or as market actors in general (e.g., HVAC contractor, technology designer, appliance salespeople, real estate agent), or as members of a collective group (e.g., a household). Evidence on the persistence of behavioral change, even in the residential sector, is also weak.
All the reviews above generally conclude that the data are not very good, but questions remain as to what good data would look like and what value it would add compared to more intuitive, more aggregate, or non-quantitative approaches. Many behavior-centered programs and experiments suffer from doubts noted for the evaluation of DSM programs and standards (Gillingham et al. 2004): there is little independent academic review. There is also evidently limited interest in finding and exploring negative results, as opposed to confirming success. A focus on proving success in the short-term exacerbates the “low-hanging fruit” issue (i.e., individuals and organizations first seek the least-costly and cost-effective energy efficiency measures, such as CFLs). Concentration on getting good numbers soon can drive efforts to focus on short-term successes, rather than on emerging and longer-term possibilities (NEEA 2008), as well as on measures and activities that yield high modeled savings, rather than necessarily achieve them.
5.3 Why Collecting and Using Behavioral Data Is Hard
Beginning from an engineering- and economics-oriented framework of energy efficiency potential analysis, it is natural to seek behavioral information that mimics the apparent solidity and neatness of physical data. But data on behavior, especially on behavioral responses to program interventions, are different than physical data and cannot be collected or interpreted with equivalent precision. Psychology and behavioral economics offer some experimental methods (Lutzenhiser 2009), which can be valuable, but these have disadvantages – in particular, unrealistic conditions and experimental biases. The results of behavior, such as adoption rates and changes in levels of consumption, can sometimes be observed. But as to statistically-grounded field observation of energy-relevant behavior, unless the frame of analysis is pared down to questions that are narrow relative to energy policy needs, there are, at best, weak analogues to the plots of wheat or “average men” addressed in classical statistical theory and, therefore, a limited basis for making inferences beyond the sample.
Difficulties of collecting and interpreting quantified data on energy-relevant behavior may be well-known, but they are often set aside in the interest of immediate goals or for the lack of promising alternatives. The net result is that estimating behavioral change for something as ubiquitous and invisible as energy use is an art. Perfect data are not necessary and are impossible anyway, but a frank recognition of data limitations is a necessary step for planning on how behavioral potential could be calculated.
Behavioral Assumptions in Energy Efficiency Potential Studies
55
In summary:
Behavior is difficult to observe. Self-reported data are the best available data on most energy behaviors because they are usually the only available data on behavior. Data about behavior are usually very aggregate relative to real behavior. Surveys often ask about “typical” behavior or consistency of behavior. This is a difficult translation from the varied, contextual, and often non-routine choices made about energy use during the day – even if much energy-relevant behavior is habitual. Results are subjective in that every respondent answers on his or her own terms and may not have a very accurate idea anyway. These ambiguities do not necessarily average out, since responses may be biased toward a socially desirable or expected response, often quite unconsciously.84 Tracking change over time or asking hypothetical questions about what a respondent would do in the absence or presence of a particular program may be the only route in some cases, but results are even more suspect. This mode of data collection tends to give little insight into why people do what they do and what conditions would have to change in order for behavior to change. Here anthropological or sociological approaches would be especially helpful; “information” is not necessarily the answer.
Participant and response biases matter. In statistical theory, a good sample is crucial for making inferences about a population. Large-scale surveys such as RECS, CBECS, and RASS aside, this issue is given scant attention in most energy efficiency work (except in program evaluations), in part because proper sampling is expensive and time-consuming, and in part because there is often no clear “future” population anyway (e.g., most voluntary programs). Response bias refers to the fact that people who respond to a survey or a question may be quite different from those who don’t; there are statistical techniques to deal with this, though they are rarely practiced in the energy efficiency field and may usually be too hard to implement. 85 Participant bias refers to the fact that volunteers for a particular program do not necessarily represent any future population. Most importantly, results from one jurisdiction or pilot do not necessarily represent what would happen in another; conditions, context, socio-demographics, program details, and measurement all matter. In short, the degree of transferability of any one example to a prospective case is questionable. Thus, many studies – and meta-analyses of these studies – may be needed to get a clear picture.
Energy implications are barely known and are small for many actions. How much energy use changes when behavior changes is a critical link from behavior to achievable energy savings potential. One by one, the energy effects of behavioral changes are
84 For example, some studies have compared self-reports with observed or data-logged settings for residential thermostat temperature setting (Gladhart et al. 1998; Lutz & Wilcox 1990), finding modest biases on average – 1°F to 4°F, under-reporting heating temperatures and over-reporting cooling set-points. 85 The term response bias is sometimes used to refer to the tendency of respondents to give answers that serve the social situation of the survey itself (e.g., giving an answer that they think the survey implementers would like to hear or that appears normal). This phenomena is also called socially desirable response bias. While not a statistical issue, it can be very important to interpreting the results of surveys and interviews.

Behavioral Assumptions in Energy Efficiency Potential Studies
56
usually difficult to isolate and may often be very small. Theoretical calculations are possible, assuming all other things are equal, but the path between self-report and theoretical savings is highly uncertain. Outside of feedback studies and whole-bill analyses, energy savings from behavioral measures remains hypothetical. Certain commonly recommended measures may not save energy at all and others may easily cause increases in energy consumption elsewhere. In studies where savings are measured, variation from uncontrolled and uncontrollable factors may swamp savings from a changed practice, making savings changes difficult to detect.86
Behavior is difficult to describe or model. Technological measures can be relatively easily defined as installations relative to a finite number of existing efficiency baselines, but behavioral conservation, defined relative to practices, has no easy set of benchmarks.
Stability and persistence are hard to establish. Savings from technological measures do not necessarily persist throughout their calculated measure lifetime (Vine 1992), but it is relatively easy to specify attrition. Behavioral measures are less locked-in physically. This leads to skepticism about their persistence and reliability, including the fear that behavior might change suddenly in a way that technology cannot. Regulatory language reflects this skepticism (e.g. the California Standard Practice Manual – CPUC 2001) and there is, as yet, not much solid evidence to combat it. Few studies run long enough to measure behavioral persistence. But habits develop somehow and some conservation behaviors learned in crises decades past, stick (see Section 6), while others may create enough burden and discomfort (Carlsson-Kanyama & Lindén 2006) that their sticking power is questionable.
Behavioral change is difficult to observe and attribute. In traditional energy efficiency potential studies, the adoption of energy-efficient equipment is assumed to increase with economic incentives and program investment. The countability of rebates and other financial incentives create a strong link between measure adoption and program efforts. Behavioral changes cannot be observed and linked to programs nearly as readily. Distinguishing between naturally-occurring and program potential for behavioral change is even more difficult than it is in the case of technology adoption. Energy feedback experiments and experiments with energy crises suggest that customers can and do change behaviors in response to intervention in the short-term. But outside of these cases, evidence on how energy-relevant behavior changes in response to particular interventions is weak.
Little information exists outside the residential sector. Conservation measures are more specialized and harder to define for commercial and industrial sectors than for the residential sector.
86 A large study population can partly overcome this, but this can be costly, even if it is possible. Statistical methods may be used to try to adjust for some natural variations (e.g., weather), but imprecisely.
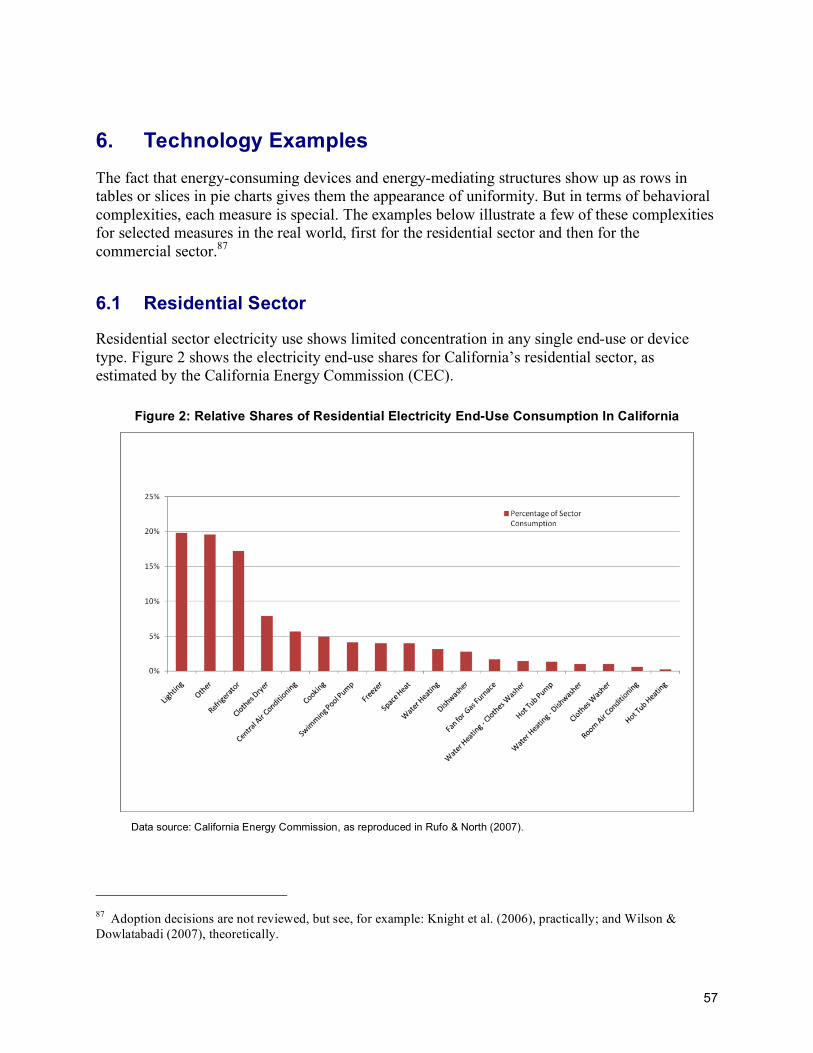
57
6. Technology Examples The fact that energy-consuming devices and energy-mediating structures show up as rows in tables or slices in pie charts gives them the appearance of uniformity. But in terms of behavioral complexities, each measure is special. The examples below illustrate a few of these complexities for selected measures in the real world, first for the residential sector and then for the commercial sector.87
6.1 Residential Sector
Residential sector electricity use shows limited concentration in any single end-use or device type. Figure 2 shows the electricity end-use shares for California’s residential sector, as estimated by the California Energy Commission (CEC).
Figure 2: Relative Shares of Residential Electricity End-Use Consumption In California
Data source: California Energy Commission, as reproduced in Rufo & North (2007).
87 Adoption decisions are not reviewed, but see, for example: Knight et al. (2006), practically; and Wilson & Dowlatabadi (2007), theoretically.
Behavioral Assumptions in Energy Efficiency Potential Studies
58
Lighting is the top single end-use, at 20% of total sector consumption, but this is an aggregation over dozens of diverse lighting devices in every home. The Other category accounts for nearly 20% in aggregate. Of the remaining end-uses, only refrigerators, clothes dryers, and central air conditioning account for more than 5% of sector electricity use. Thus, changes in either the usage or technical qualities of most end-uses can amount to at most a few percent difference in electricity consumption. This underscores the diffuse nature of end-use savings. Natural gas use is more concentrated; on average, 44% each goes to water heaters and space heating, 7% to cooking, 3% to drying, and the remaining 2% to miscellaneous uses, such as pools and spas (CEC 2008b).
6.1.1 Programmable Thermostats
For decades, automatic setback and programmable thermostats have been promoted to residential customers as providing high energy savings and convenience. Savings have been ascribed to new installations on the basis of behavioral assumptions of what consumers did before and would do after adopting the technology. Flex Your Power, for example, reports that the proper use of programmable thermostats can save 25% on heating costs and 20% to 25% on cooling costs.88 Other programs suggest 15% savings for heating and cooling (Meier & Walker 2007). Programmable thermostats are also a profit center for HVAC contracting (Osland 2000) and have garnered points in various home efficiency rating schemes. Thus, programmable thermostats appeared to be an ideal win-win measure for DSM and for market transformation to higher energy efficiency, symbolizing how technology could advantageously substitute for behavioral conservation and add non-energy benefits besides. Accordingly, the ENERGY STAR® program established programmable thermostat specifications in 1995, and utilities offered rebates for their purchase for years.
By 2006, however, programmable thermostats had been eliminated from California IOU programs (Itron & KEMA 2006) and ENERGY STAR® had reduced the scope of its programmable thermostat labeling program to an educational campaign (Meier & Walker 2007).89 High savings were clearly possible, but empirical evidence did not support the assumption that they were typical. The uncertainty of savings from programmable thermostats, as observed in empirical studies and then reproduced in modeling exercises, thus motivated a distancing of a previously well-accepted technology (Itron & KEMA 2008; Meier & Walker 2007).90
In programmable thermostats, the energy efficiency industry made an unusual reversal – partial and possibly temporary – in their promotion of a device. This case illustrates the complexity of
88 Flex Your Power website (http://www.fypower.org/res/tools/products_results.html?id=100133; accessed October 29, 2008). 89 Elsewhere, including utilities outside of California, programmable thermostats remain part of energy efficiency program portfolios. 90 In fact, there had been earlier warnings against over-optimism on programmable thermostat savings – for example, for technical reasons in the case of use with heat pumps (Plourde 2003).
Behavioral Assumptions in Energy Efficiency Potential Studies
59
behavior-technology interactions and some ways that behavioral assumptions can go wrong. In turn, the energy advantages of automation become questionable. Interface design is obviously important in helping to assure that programmable thermostats are used as intended. But it is not the only reason that programmable thermostats do not seem to deliver the promised savings. Rather, programmable thermostats tended to be sold with mixed messages about their purpose and with optimistic assumptions about typical energy use “before” and “after.” For example, a Wisconsin study found that households that already manually set their thermostats back for heating were the ones that preferentially adopted programmable thermostats, resulting in a limited net change in setback behavior and no necessary savings (Energy Design Update 2000; Nevius & Pigg 2000). Whatever they used to do, many households practice what might be considered conservative behaviors, and do so manually. Typical winter indoor temperature settings may now be lower than they were prior to the 1970s. Schipper et al. (1992) cites marked declines in the 1980s – from 85% of U.S. homes holding winter daytime indoor temperature to 70°F or above in 1972-1973 to 46% doing so in 1981-1982, with possible increases afterwards. An evaluation of a Wisconsin mass-marketing campaign designed to influence the heating set-point found no, or even negative effects, again suggesting that the lowered thermostat settings that provided energy savings in the 1970s had since become normal (Peters et al. 1998).
Even households that use the thermostat’s programmable features may use them to increase energy services – for example, pre-heating in the morning or pre-cooling before returning home from work (Energy Design Update 2000). A Florida study suggested that households with manual thermostats were more likely to set up cooling temperatures than were households with programmable thermostats – a difference partly attributed to the complexity of the programmable thermostat as a deterrent to proper use (Energy Design Update 2000).
None of the above results condemn programmable thermostats, nor do they insist that technologies work as intended in all cases. Programmable thermostats potentially provide energy savings and convenience to many households, and with design changes and social learning, they may do better in the future.91 The overall experience with programmable thermostats illustrates some general concerns at the juncture of behavior and technology:
Modeled savings may be biased relative to actual savings, leading to misstatements of technical and achievable savings potential.92
91 There is some costs to the reversal of support as well. For example, relationships with manufacturers and agencies who have promoted programmable thermostats may have been destabilized by shifting support (e.g., www.energystar.gov/ia/partners/prod_development/revisions/ downloads/thermostats/NRCan.pdf). 92 For that matter, estimates of baseline energy consumption at the end-use level have limited accuracy. The California Residential Appliance Saturation Survey (RASS) (KEMA 2004), for example, uses a conditional demand analysis to arrive at estimates of cooling energy consumption, calibrated to observed consumption via billing data – though end-use metered data for central air conditioning were collected for a small subset of households (KEMA 2004, pp. 1-2). Measuring savings in the field is difficult and expensive, so that on paper, modeled results have more credibility and generalizability, but it is unclear how accurate they are for representing typical situations or the variability of practice.

Behavioral Assumptions in Energy Efficiency Potential Studies
60
Market and program stakes may compromise unbiased production and dissemination of information, especially negative evaluation, which can improve technologies and programs (Archer et al. 1992; Douthwaite 2002). High savings claims for programmable thermostats persisted for many years, qualified by the presumption of “proper use,” despite some fairly obvious questions and anecdotal reports of dissatisfaction and problems.93 No party may have been intentionally misleading, but as in many fields, negative results likely often remain unpublished (Scargle 1999).
Automation does not necessarily provide savings over manual control. Automation can save energy, but it can also lead to consumption increases, depending on what behaviors the automation replaces, as well as what new behaviors and ideas are created by the standards or scripts that are built-in or promoted alongside the technological change (Nevius & Pigg 2000; Shove 2003b; Strengers 2008).
Manual-control measures, which amount to “behavioral conservation,” are excluded from most energy efficiency potential studies. Automation, insofar as it saves energy, often does so by a reduction of energy services. This conflicts with the general rule that excludes many behavioral measures: they reduce energy service levels. The implication is that, in the case of automation, these energy services are not needed and are thus wasteful. This obviously involves a subjective judgment about what an “energy service” is and in which cases it is needed. For example, lighting is not only used to illuminate tasks, but to provide security, advertising, and other well-recognized services. The air conditioning in a hotel lobby or office may be higher than the thermal preferences of most occupants, but it provides atmosphere (Cooper 1998).
As program interest in programmable thermostats has declined in California, interest has grown in the potential role of two-way communicating thermostats for direct load control and dynamic pricing. Field use of communicating thermostats has already been tested in California residences – for example in a statewide Critical Peak Pricing experiment. That experiment presented promising results for demand reduction from residential Programmable Communicating Thermostats, or PCTs (Herter et al. 2007). Such thermostats were proposed as a modification to California’s Title 24, but were dropped from consideration, in part because of public concern about external control of thermostat settings.94 Beyond customer acceptance issues, a large-scale rollout of communicating thermostats might benefit from an analysis of the behavioral and social aspects of past experience with programmable thermostats.
93 Because they are anecdotal, they cannot be easily documented; the comment is based on conversations that one of the authors had with DOE’s Building America practitioners in the 1990s, as well as anecdotal remarks heard from other energy efficiency industry professionals regarding their personal experience with programmable thermostats. 94 For example, see Press Enterprise (2008). Programmable Communicating Thermostats are still under consideration in the load management plans of California’s IOUs.

Behavioral Assumptions in Energy Efficiency Potential Studies
61
6.1.2 Swimming Pool Covers
Swimming pool covers are a hybrid measure, in that a new pool cover does nothing unless there is a new habit to take advantage of it. The behavioral dependence of pool covers may make it unattractive from a program point-of-view, especially since it applies to relatively few households. Swimming pool covers (already required by California’s Title 24 building standards for residential pools where less than 60% of heating is from solar heaters) are not included as a measure in the 2008 California energy efficiency potential studies (Itron & KEMA 2008). Existing studies on savings from pool covers suggest high potential savings – for example, over 80% for a pool heated to 80° during the summer – whether in San Francisco or Los Angeles (EERE n.d.). For a gas-heated pool in Los Angeles, this amounts to a savings of over $2,000 per year, with co-benefits of water savings from reduced evaporation, and a potential reduction in costs for chemicals and water filtration. The technical potential for savings from pool covers may be accordingly high, depending on how many non-solar-heated pools do not meet Title 24 requirements, while the achievable potential depends not only on who would buy such covers, but how consistently they would be used.
Covering and uncovering the pool takes effort, so there is a routine, non-trivial, but basically unknown, human cost in effort associated with this measure.95 There have been and continue to be pool cover incentive and information programs, as well as interest in addressing pool covers from utilities, water agencies, and energy agencies.96 Sparse data on actual practices and the heavy dependence of the measure on the purely behavioral factors may limit how far these efforts can go.
6.1.3 CFLs
Compact fluorescent lamps (CFLs) have been the California poster child for energy efficiency for several years, through the combined effects of utility buy-down prices, climate change-oriented messages of Flex Your Power, give-away efforts by non-profits, and media attention. CFL adoption has provided a major share of market potential in recent residential-sector energy efficiency potential estimates for California, and a high proportion of savings for the commercial sector as well. Overall, 75% of base scenario residential-sector energy efficiency potential in the latest California potential study (Itron & KEMA 2008) is from lighting measures.97 This high
95 To the authors’ knowledge, no assessment of these costs and public acceptance, in general, is publicly available. Automatic pool covers are on the market, though they are expensive and savings would still depend on the automatic features being reliably used. 96 For example, PG&E & Sempra (2006), EERE (n.d.), and Metropolitan Water District of Southern California (2003). 97 This result is based on the middle level of three funding scenarios modeled in the study, varying by program funding level, and thus incentive level, and a modeled rate of increase of the measure awareness parameter (awareness). For the mid-scenario, awareness was assumed to grow at 4.5% per year (Itron & KEMA 2008). Most of the savings are from CFLs, though other sorts of lighting measures are included. The high levels of cost-
Continued
Behavioral Assumptions in Energy Efficiency Potential Studies
62
proportion reflects the great emphasis that energy efficiency programs have placed on CFLs in recent years. It also raises questions about the continued adoption of CFLs and what savings measures will be promoted once CFL savings dry out. At what point might people be unwilling to put in more CFLs, especially when the buy-down prices (about $1 for a 13W bulb, as compared to $4 to $6 at regular price) are no longer available?
CFL adoption and lighting use in the residential sector have been studied perhaps more than any other technological adoption. Even so, the detail and quality has not necessarily been sufficient to give a close and unequivocal picture of what is going on, even with residential CFLs (Oman et al. 2007; Vine & Fielding 2006). In part, this is due to the natural complexity of humans and markets, of course. Beyond lists of purchase barriers (including disliked attributes) of CFLs, the social aspects of CFL adoption and use have been much less studied. Why was a particular CFL purchased? Where did it go and why? Is it liked, tolerated, or hated, a useful technology or more a symbol of environmental action, even one that may substitute for more effective actions? This is an area where focus groups, interviews, and even mining of Internet commentary on CFLs may help to understand their future, as well as help to bound their potential.
6.2 Commercial Sector Examples
The complexity of the market for new buildings and their subsequent energy management means that decisions about energy efficiency do not occur in the fashion that simple technology adoption models, centering on investment cost-effectiveness, portray (Lutzenhiser et al. 2001). Rather than operating as a single industry, commercial buildings result from a series of linked industries operating largely in separate realms; each contributes value in the series, but without an optimizing calculus of value for the chain overall (Lutzenhiser et al. 2001). The complexity of stakes in a building – management trying to impress clients, building operators trying to respond to complaining occupants, occupants blocking vents to suit preferences, etc. – mean that the dynamics of competing viewpoints often trump the traditional logic of energy conservation (Kulakowski 1999), which assumes that there is some collective interest in reducing energy consumption, given moral encouragement and the assurance that money will be saved.
Though California has better data on commercial building energy use than most other jurisdictions, data relevant to energy consumption (e.g., physical characteristics of buildings, effects of retrofits, variation in energy use) are less detailed and less available than for the residential sector. This limits the investigation of energy efficiency potential and leads to large uncertainties on top of natural variability. Two examples of commercial-sector energy efficiency are discussed below: the Leadership in Energy and Environmental Design (LEED) efforts for new commercial building construction, and daylighting as a general commercial building design issue.
effectiveness for CFLs are, in part, due to the fact that savings calculations include the avoided costs of incandescent lamp purchases (life-cycle-cost), rather than simply energy-cost payback (Itron &KEMA 2008).
Behavioral Assumptions in Energy Efficiency Potential Studies
63
6.2.1 Leadership in Energy and Environmental Design (LEED) Program
In 1998, the U.S. Green Buildings Council, a non-profit, non-government organization, launched the Leadership in Energy and Environmental Design (LEED) program. Combining input from builders, manufacturers, architects, government, non-profits, and others, LEED has developed sustainable building standards and rating systems covering development and construction for new commercial construction, existing commercial buildings, and several other types of situations. LEED certification creates a relatively integrated and market-oriented system toward the construction of buildings that perform better environmentally, according to specific criteria. LEED rating systems cover not just energy efficiency, but address water efficiency, land use, transportation, and other environmental matters, including the indoor environment. LEED credits and subsequent certification for energy efficiency are awarded based on design simulations, not measured building energy performance.
Whether LEED-certified buildings really use less energy than their non-certified counterparts is as yet undetermined. A recent study analyzing the energy performance of 121 LEED-certified new buildings, each with a year of post-occupancy energy consumption data, showed their median end-use intensity to be lower than the median for commercial buildings nationwide, uncontrolled for vintage (Turner & Frankel 2008). The same study showed that, on average, these LEED buildings performed as expected. However, much lies in the statistical analysis and interpretation, and the results have been controversial.98 Measured end-use intensity was 25% or more above design values for a quarter of the buildings examined (underperforming), and 25% or more lower than design values for 30% of the buildings (overperforming).
Differences in energy consumption between buildings as operated and buildings as designed, and the reasons behind the differences, are critical questions for future energy efficiency potential. Buildings in operation often use more energy than predicted by simulations performed during the design process (American Physical Society 2008; Bordass 2007). There are a number of possible reasons – implementation differing from design, building operation, mismatch of design to building use, plug-loads not included in the design simulations, etc. In the energy efficiency field, deviations from technical projections are sometimes shorthanded as being “behavioral” and generally discountable – i.e., the result of unusual circumstances that are the exception rather than the rule. Conversely, certain design elements of buildings – for example, the decision to disallow operable windows – can be viewed as intentionally withholding control from users in order to control the designed environment from the destabilizing effects of behavior and to reduce costs. Adaptive comfort standards can counteract some of this rigidity and possibly increase the psychological comfort of occupants as well (e.g., Brager et al. 2004). In any case, designed savings do not necessarily translate to actual savings. The European Commission has adopted a directive that requires actual energy consumption be collected and published (Bordass 2007), which could help address biases. In California, design-implementation mismatches may
98 See Gifford (2008). Turner & Frankel (2008) make clear that their study is not a statistically robust analysis of LEED energy performance, which would not be possible with the data at hand.
Behavioral Assumptions in Energy Efficiency Potential Studies
64
be of visible consequence when it comes to mainstreaming development of zero-energy buildings envisioned in the coming decades.
6.2.2 Daylighting and Lighting Controls
With the move toward sustainable building design, daylighting has again – as in pre-electricity days – become a prominent feature of mainstream construction and retrofit, and even a symbol of building green. Lighting can account for 40% or more of the energy costs of a typical commercial building (Vaidya et al. 2005). Using combinations of photo-sensors to tune electric lights in response to available daylight, programmable dimming of lights for changes in visual tasks, and occupancy sensors to turn off lights when spaces are unoccupied – daylighting design provides both a structure for flexible lighting choices and automation to take over the tasks that people could do in theory, but are assumed to do, at best, unreliably. In theory, daylighting projects promise to save substantially on energy costs, and to make occupants happier and more productive. The productivity benefits may be generally believed by designers, but are difficult to statistically prove and quantify. The productivity link provides a potentially powerful non-energy benefit, in that productivity gains are theoretically translatable to financial benefits. Whether this rationale is effective is not clear.
Daylighting projects do not, of course, necessarily live up to energy savings claims. Technical problems manifest due to variations in the quality and amount of natural light through the day and year, thus making the light source complex and something “to be managed.” Typically, when daylight is counted as a real light source, the design assumes that the building is used differently during the day and night. In U.S. commercial building lighting design, this is often not considered an acceptable assumption. As a consequence, artificial lighting systems are designed to provide all the light required in a space and usually these buildings will be designed to the same lighting levels as they would be in the absence of daylight. Energy use from manual versus automated control of lighting and window shades in day-lit offices are gaps in daylighting knowledge (Galasiu & Veitch 2006), and applicability in non-office environments is even less well understood.99
Occupants in green buildings with daylighting often complain that daylighting is insufficient and that there is inadequate user control for lighting systems (Abbaszadeh et al. 2006). The most promising route for electricity conservation via daylighting may be through well-commissioned design changes, but without overriding user control (Vaidya et al. 2004). However, since automatic controls are calculated to provide savings over manual controls, there is a heavier design reliance on automatic control systems, sometimes to the exclusion of manual controls. But implementation requires difficult coordination between different building design and
99 Two lighting control measures were included in the most recent California commercial-sector energy efficiency potential study – a motion sensor and daylighting with dimmable ballast, the latter specifically called out as having high uncertainty (Itron & KEMA 2008).
Behavioral Assumptions in Energy Efficiency Potential Studies
65
construction trades, control specification is often inadequately documented, and calibration after installation is rarely done well. All of these contribute to potential problems and can lead to the distrust of the technology or its performance. For example, Heschong et al. (1998) describe a case where occupants had taped over a sensor to disable controls to an automatic daylighting system. As it turned out, the controls were not even wired to the lights, so the attempted disabling was based on distrust rather than performance. This cannot be dismissed as a matter of silly users. Instead, it speaks to building occupant ideas about loci of control, which in turn raises questions about in whose interest automation is and whether building users’ desire for control can be mobilized to lower energy consumption – and more pleasing indoor environments. This is, again, a sort of potential that probably cannot reasonably be considered in conventional energy efficiency potential studies. The next section treats some alternative ways in which this alternative energy savings potential might be conceived.

66
7. Alternative Views on Potential Energy efficiency potential studies generally define a prospective future that is much like the current world, but with incremental improvements in technical efficiency reflecting currently-available or nearly-available technology. The item-by-item, spreadsheet-basis core to most energy efficiency potential studies renders models accessible, but also helps to restrict what sorts of potential can be treated (Goldstein 2008; Moezzi & Bartiaux 2007). Simply adding measures to existing studies can be useful up to a point, but many possibilities for change are not amenable to this treatment and even where they are, problems of accounting for measure interactions – which can be social, as well as technical (Section 4) – become severe, and the lack of empirical grounding can overwhelm the utility of modeling. Some energy utilities prefer econometric analysis to end-use forecasting, for similar reasons (PG&E 2008).
Energy research and regulatory organizations operate and “think” (Searle 1995) in ways that can have profound effects on the shape of research, and on what gets considered and what does not – a system which can itself be profitably researched (e.g., Archer et al. 1994; Jankovic 2008; Lutzenhiser & Shove 1999). Arguing that energy efficiency potential studies underestimate potential, Goldstein (2008) argues that in order to appear politically realistic – especially important when efficiency is considered a supply alternative – energy efficiency potential studies typically adopt conservative assumptions. The risk that policymakers will require that claims of energy efficiency potential be met in practice may create another bias toward lower estimates (Goldstein 2008). Others note opposite pressures toward exaggeration (Auffhammer et al. 2007).
This section gives some alternative views on energy savings potential, using two sets of examples, as well as a series of recommendations from the interviewees for this paper. The first set of examples covers real-world situations where variability in energy use and observed changes in energy use can be observed. These comparisons grant some empirical basis for estimating the effects of varying behavior, lifestyle, and changes in infrastructure. The second set of examples presents some less empirical approaches. Finally, the recommendations from interviewees, firmly centered on current modeling approaches, provide some reflections on these approaches and some recommendations for improvements.
7.1 Using Difference and Change
Energy crises, energy consumption feedback, and comparisons of energy use across premises, communities, and countries all provide empirical data on the variability of energy use. None of these approaches gives a blueprint as to how this potential might be achieved, but all help to overcome some shortcomings of item-by-item approaches, which are poorly suited to providing a systems perspective on energy consumption. Only the residential sector is discussed here, since those data are far more available.
Behavioral Assumptions in Energy Efficiency Potential Studies
67
7.1.1 Energy Crises
The California Energy Commission estimates that Californians’ efforts at reducing electricity use during the state’s 2000-2001 Energy Crisis netted an estimated 6.7% reduction in statewide electricity consumption and a 14% reduction in summer peak in 2001 (CEC 2002). The crisis motivated massive efforts to mobilize the public to reduce overall energy consumption and, to a lesser extent, peak consumption (Bender et al. 2002; CEC 2002). Hundreds of programs, including the statewide Flex Your Power public information campaign, the 20/20 IOU programs (Summit Blue Canada 2005), as well as local programs and corporate policy changes, were enacted. Newspaper and other journalistic sources gave enormous coverage to the threat of blackouts and efforts to avoid them; statutes against commercial outdoor lighting and other energy uses considered wasteful were enacted, retail establishments dimmed lights, and so on (Lutzenhiser et al. 2002a). Given the short time period of the crisis, opportunity for technological change-out was limited. Behavioral changes were estimated to have contributed 70% of the observed reduction (Goldman et al. 2002), representing 5% absolute electricity consumption reduction for 2001. Households showed what has been called “surprising flexibility” in their electricity consumption patterns (Lutzenhiser et al. 2004).
A review of energy emergencies worldwide found that many jurisdictions have had similar surprising successes in short-term energy consumption reductions (IEA 2004), and these experiences continue. In Juneau, for example, a 2008 electricity emergency resulted in electricity usage reductions of 30% in aggregate, albeit some through customer fuel switching; once the crisis subsided, energy use returned to levels closer to normal (NPR 2008).
These past experiences with energy emergencies give clues to the potential to reduce “normal” energy consumption quickly through behavioral means. In crises, technology is kept mostly fixed, while behavior varies. This is opposite of the traditional energy efficiency potential framework, which keeps behavior fixed while changing technology. Savings “observed” during a crisis obviously do not necessarily translate to future achievable savings from conservation behaviors.100 Crises are by definition abnormal. They are tuned to specific and usually local objectives, with immediacy and palpable benefits of action unmatched by the unbounded problems of global climate change and future energy supply. Also, once taken permanently, behavioral changes are no longer available to be retaken, so subsequent crises may yield lower savings.
As to verifying the persistence of behavioral change, it surely depends on what has been changed. People may often change to increased energy use (Shove 2003a), but sometimes to lower use (Carlsson-Kanyama & Linden 2007; Schipper et al. 2002) not clearly attributable to any particular policy or program. For the 2001 California crisis, one study showed that some behaviors persisted at least one year after the crisis, resulting in weather-corrected savings of
100 Savings themselves cannot be observed in a completely controlled fashion; rather, they are calculated relative to expected consumption, which depends on weather and other factors, and is a statistical art rather than a precise science.
Behavioral Assumptions in Energy Efficiency Potential Studies
68
about half the level of the crisis year (Lutzenhiser et al. 2004). Tracing persistence further in the future gets harder, because so much else (e.g., household composition, economy cycles) shifts as well, let alone the limits of funding cycles.
7.1.2 Feedback
For decades, consumption feedback through bill design, consumption display monitors, and other means has been proposed and experimented with as a means of reducing residential consumption (Darby 2006). It is now considered one of the most effective behavioral interventions for households in terms of yielding reductions in consumption (Abrahmse et al. 2005; Bruel 2007; Fischer 2007), in part because it so measurable. From the consumer standpoint, consumption feedback calls attention to energy consumption, makes it more visible, and can help to direct actions to changes that are more effective in reducing costs or energy use, rather than symbolic or otherwise less effective changes. Experience shows household electricity savings of 5% to 15% for direct feedback (in-home consumption monitors), and 0% to 10% for indirect feedback, such as frequent billing (Darby 2006). Those savings can include technological changes, but most seem to be from behavioral changes, due to the short time period of most studies.
Most feedback studies use self-selected populations and few are conducted outside of the experimental mode (Fischer 2007); how well their results carry over to regular practice and the general population is unknown. There is also limited evidence on the persistence of savings from feedback. Some billing feedback in Norway showed savings to persist through the three-year study period, and another study suggested that once behavior changes persisted for three months, they were likely to become habitual (Darby 2006). Emerging work on time-of-use rates, consumption feedback meters, and demand response will provide more information on the potential for feedback-centered change. Beyond estimating aggregate changes in demand, these programs offer a potentially fruitful area of research on what inhabitants actually change and on the constraints that they face in changing energy use (e.g., Carlsson-Kanyama & Lindén 2007). Not all changes are necessarily reductions in energy use: a few published experiments showed increased consumption (Fischer 2007), as feedback can remind households that energy services are cheaper than imagined and that incremental increases in energy service levels may make little difference to the bill.
7.1.3 Variation and Difference
Energy crises and feedback studies provide the chance to look at changes in a household’s consumption over time. Another possibly is offered by looking at differences in consumption across households. Experiments in the 1970s indicated that energy consumption in similar households, living in similar houses, side-by-side, could vary by a factor of two or more (Gram-Hanssen 2007, citing a Swedish study; Socolow 1978, for the U.S.). Socolow’s finding is one of the most often-quoted results in the field of energy social sciences. What creates such variation is still not well understood, yet potentially provides an empirical foundation for sorting out differences in technology versus household practices. Variation remains barely acknowledged in most energy efficiency analysis, which usually adopts a top-down, average, view of consumption, in part because of the data available (Bartiaux et al. 2006; Lutzenhiser & Bender
Behavioral Assumptions in Energy Efficiency Potential Studies
69
2008). Some studies have used modeling to try to partition variance in energy consumption into technological influences versus human ones (Gram-Hanssen 2007), or otherwise estimate total achieved savings from conservation measures, as opposed to technological ones (Mullaly 1999).
Regional and international differences in energy consumption, based on comparing average consumption across groups of households, can reveal stark differences in consumption, even where levels of development and weather are roughly similar. For example, climate-corrected energy consumption per dwelling in Belgium was nearly twice that in Austria in 1995 (European Environment Agency 2001). International comparisons speak to the overall societal “energy efficiency,” incorporating physical environment and infrastructure (e.g., construction, climate, devices), as well as social and behavioral differences. What is achievable in one country is not necessarily achievable in another, and some practices that are very common in some countries are rare in others, even with similar levels of development.
Anthropologically-oriented international comparisons have been rare. Two examples of cross-country comparisons are Bartiaux and Gram-Hanssen (2005), comparing residential energy use in Belgium versus Denmark, and Wilhite et al. (1996), comparing residential energy use in Norway versus Japan. The average Belgian household uses 40% more electricity than the average Danish dwelling, some of this due to: (1) structural factors, such as the number of people per dwelling and dwelling type; (2) different choices for appliance holdings (more televisions and clothes dryers in Belgium); (3) differences in time devoted to housework (more cooking, etc., in Belgium); and (5) more policy attention to energy conservation in Denmark (Bartiaux & Gram-Hanssen 2005).101
As to Norway versus Japan, Norwegians tend to heat the whole house, while Japanese focus more on heating the body rather than much of the space surrounding it (Wilhite et al. 1996). Less than a list of comparative factors, these comparisons call to mind the very different feel of living in one country versus another. Differences in sociotechnical systems suggest the possibility of trying to “civilize” habits and practices (Elias 2000) along these lines. In turn, this changes the focus from individual choice toward understanding how urban structure, work life, technological regimes (Shove 2003b), and other structural factors shape and constrain choice (Sanne 2002; Wilhite 2007). The great challenge would be to try to design and implement policies that influence these regimes to more environmentally-sound patterns.
Simulation modeling is another possible strategy to help bound the impact of behavior, controlling for physical conditions, and to make behavioral and operations and maintenance effects visible and appear “real” enough to take seriously. A study on the sensitivity of the building energy simulation model DOE-2 to modest variations in occupant behavior, using the example of an elementary school, found that energy consumption results ranged from +65% to -
101 The importance of sector boundaries comes into play in these and similar comparisons – e.g., less cooking in the home might require greater energy consumption (outside the home) in what foodstuffs are purchased. See also Bartiaux et al. (2006).
Behavioral Assumptions in Energy Efficiency Potential Studies
70
40%, relative to middle-scenario values for a school in the Sacramento climate zone (Clevenger & Haymaker 2006).102
Simulations may also be useful in considering the possible impacts of behavioral change in production processes for industrial settings, as Russell and Miner (2008) demonstrated for a food-processing plant. These authors used three years of metering and billing data to estimate process energy savings from a series of behavioral modifications suggested by production and facility staff. A statistical model controlled for various production variables, and a Monte Carlo simulation bounded effects of behavioral changes. This sort of analysis may help industrial facilities to better optimize their energy consumption and provides a better basis for attributing credit to behavioral changes that might otherwise go unrecognized (Russell & Miner 2008). Modeling and statistical analysis can help make the impact of behavior on energy consumption in a premise clearer, rather than considering behavior irrelevant because it is so hard to deal with (Emery & Gartland 1996). Emery & Gartland (1996) analyzed metered load data to deduce behavioral patterns – otherwise difficult to observe or survey – as well as to improve building simulation results and, ultimately, an understanding of how energy is consumed.
7.2 Visions and Actions
California agencies have begun grappling with more aggressive energy reduction goals in the name of climate change – for example, through the CPUC’s Big Bold Goals (CPUC 2008) or the Green Dream scenarios (Rufo & North 2007). Arguments formerly considered fringe or extreme have thus been brought into view, along with questions about how to make aggressive goals reasonably technically achievable and socially plausible and attractive, rather than fantasy or misery.
For decades, some groups have argued that the incremental changes typically envisioned in energy efficiency “normal science” are too conservative and too limited in scope.103 Factor Four or generally Factor X arguments, popularized by Von Wieszäcker et al. (1997), claim that energy and material efficiency could be a factor of four, ten, or even more, higher than current levels. These arguments are well-known in Europe, less so in the United States (Reijnders 1998), though collaborator Amory Lovins of the Rocky Mountain Institute has promoted similar claims for materials and energy efficiency for decades (Lovins 1976). The basic claim is that eco-efficiency – meaning all sorts of material consumption, including energy – for many activities could be much higher than it currently is in western countries, while increasing welfare. Factor Four arguments assume technological solutions on a grand scale, rather than more socially-centered styles of dematerialization, as pursued by some grassroots and local groups (e.g., Carbon
102 The scenario values were determined from Title 24 specifications.
103 Normal science, a term introduced by the historian of science Thomas Kuhn (1970), is the routine work that scientists carry out in their everyday practices. This work may often be innovative, but it is shaped to work within and to largely conform to existing paradigms (e.g., model structures, analytical conventions, traditional assumptions, political limitations), rather than to question or transcend them.
Behavioral Assumptions in Energy Efficiency Potential Studies
71
Reduction Action Groups, such as the 90% Reduction Group, or Eco-Action Teams).104 These Factor X and grassroots groups intensify the scope of change envisioned from those in conventional assumptions for technological change and conservation, respectively. What exactly the differences are between the standard and intensified scales has been partly addressed for technological change (Reijnders 1998; Goldstein 2008; Pears 2004).
Reijnders (1998) argues that the Factor X arguments rest on a remarkably high technological optimism, especially for large X. The recent “stretch” goals for carbon emissions reductions and technology penetration are optimistic too, but optimism has its problems. Nearly any level of energy consumption reduction is theoretically possible, whether through technological or social means. The questions are rather how isolated demonstrations of dramatic reductions indicate something that can be achieved broadly, the desirability, costs, and unintended consequences of such achievement, and how the transformations could be accomplished.
Existing policies and conditions can work at cross-purposes to these transformations. Energy efficiency policies have been criticized as being too short-term, with a widget-orientation, and thus unable to incorporate systems-level efficiency, and as overlooking absolute consumption. Narrow technology specifications designed to deliver efficiency in the short-term may hamper the development of even better technologies. Technological solutions, in general, are often criticized as answering too small a part of the problem, with energy savings from impressive increases in nominal efficiency overridden by other changes. One general strategy proposed for achieving a less energy-intensive future economy may be to focus on increasing the services sector of the economy, while reducing orientation toward physical products (Herring 2009).
7.3 Modeling Suggestions
Six experts experienced in energy efficiency potential studies were interviewed for this white paper. Their insights are visible throughout. As concerns the modeling process itself, the following comments stand out:
The possible utility of an integrated potential modeling system. In California, baseline forecasts and DSM potential modeling are prepared independently and by different institutions – the former by the CEC in its forecasting model and the latter by utilities. Energy efficiency potential studies model a wedge of savings, but, especially for the question of statewide potential, interactions between baseline scenarios and potential scenarios cannot be easily handled with the separate models. In particular, there is some embedded efficiency in the baseline econometrically-derived forecasts, creating ambiguities between program-induced and natural adoptions of energy efficiency (Rufo et al. 2008). As the questions about future savings potential become more elaborate and the policy options broaden, integration may be even more important. Overlapping the
104 These groups have some web presence, e.g., http://www.carbonrationing.org.uk/ for Carbon Reduction Action Groups, and http://www.globalactionplan.com/node/109 for EcoTeams.

Behavioral Assumptions in Energy Efficiency Potential Studies
72
modeling issues outlined above, utility voluntary programs, codes and standards, price effects, government programs, other efforts, and market transformation all affect the prevalence and form of energy efficiency. These multiple channels raise questions about under-counting and double-counting (CEC 2008a), and make attribution difficult and contestable. The CEC and the CPUC are now working together with the utilities to see how their separate processes can become more integrated.105
Need for data collection. The quality of input data is related to the goals of modeling. This is true for relatively observable quantities (e.g., appliance saturations, appliance energy consumption in use), as well as for synthetic parameters, such as the effects of increased program funding or high-level summaries of market barriers. Some specific suggestions were presented in Section 3.
Explicit assessment of uncertainty. Uncertainty enters end-use forecasting models through many routes – mis-specified structures, the quality of quantitative data (e.g., accuracy, aggregation over variability, biases), future prices, future events, technological development, etc. Scenario analysis is useful in thinking about possible futures, but it does not address the questions of the incremental value of improved data in terms of its contributions to results or program planning.
Checking speed. The rush to specify goals, show impressive short-term results, and complete analyses quickly can compete against longer-term strategies and intelligence gathering. Energy efficiency potential studies themselves are often done in a short timeframe, which, together with resource constraints, limit the ability to develop improvements or new approaches.
Institutional. The practices, policies, and stakes of various institutions are sometimes at odds with each other and can hamper open communications, effective research, and program development. Politics are inevitable, but such institutional issues are amenable to research (see Research Recommendations in the next section), and possibly to changes that might result in improved policy effectiveness.
105 In particular, the Demand Forecast Energy Efficiency Quantification Project (DFEEQP) – a CEC project involving CEC, CPUC, CARB, and California IOUs and POUs – is currently exploring these issues (personal communication, Edward Vine, May 2009).
73
8. Summary, Conclusions, and Recommendations Bottom-up energy efficiency potential studies rely on a host of behavioral assumptions, some explicit and some implicit. The technology adoption core of the studies is consistent with dominant theories in the energy efficiency field, namely, cost-effectiveness criteria modified by assumptions about market barriers. Beyond providing quantitative results, energy efficiency potential models highlight the field’s basic assumptions about technology adoption and program activity in explicit form.
For California energy efficiency potential studies, the major issues highlighted through this expression include: (1) cost-effectiveness criteria and its importance relative to market barriers or other concerns, by measure and the context of the decision-maker; (2) the effect of financial incentives on adoption, by level of incentive; and (3) the effect of education and informational elements of programs on increasing consumer awareness and willingness to adopt energy-efficient measures. But the evidence on all three of these matters is limited. The parameters used to specify cost-effectiveness criteria and market barriers have empirical or experimental bases, but are also largely matters of professional judgment. New research could help to further inform professional judgment and update existing estimates, as described above (Section 3). And given recent work on quantifying split incentives, split-incentive situations might be modeled more explicitly.
There are limits as to how far new research and model elaboration can go to improve potential estimates, because of: (1) the basic nature of forecasting a dynamic system in the face of uncontrollable uncertainties; (2) the fact that models are already calibrated to past program results; (3) the fact that some parameters have no relationship to empirically observable quantities; and (4) the fact that professional judgment can be quite good anyway. Thus, while there remains much unobserved about how energy devices and energy services are used, and how and why increased energy efficiency is adopted, the primary reason to pursue these research topics is to better understand and efficiently capture potential with the right programs and policies, rather than the value of improving quantitative estimates from large-scale aggregate studies.
In focusing on the voluntary adoption of increased device and building component efficiency, most energy efficiency potential studies consider only a small part of what determines future energy use. For goals of absolute reductions in GHG emissions and with broader policy options available for addressing these goals, the questions and opportunities become much bigger. The analysis above used energy efficiency potential studies as a strategy for beginning to pry open larger ways of seeing how societal energy use is constructed. Driving attention away from individual behavior and devices in isolation, and examining layers of context and infrastructure, points to systems of energy use and how energy service needs are shaped and created. It also helps to expose some ways in which focusing on the efficiency of devices can run at cross-purposes to reduced energy use and on the limits of trying to coerce behavioral change. How policy might assess and address these larger systems affecting future energy use is an open question.
74
Some suggestions for researchable social scientific questions are given below, organized into three topic areas: those fitting within the current energy efficiency potential study framework, those fitting an expanded frame for analyzing energy efficiency potential, and those raised in the course of this examination, but falling outside the purview of estimating energy efficiency potential itself.
8.1 Within Frame Recommendations
1. Landscape of Energy-Relevant Purchase Decision-Making
Individual decisions about purchases of energy-relevant technologies deviate from the aggregate depiction of adoption that is central to energy efficiency potential studies. In many cases, the deviations may be so big that the standard model explains little or nothing (Lutzenhiser 2009). That there are important deviations has often been noted and seems largely agreed upon (Section 3), though it is often difficult to take this situation to heart in practice. Despite all the work in identifying market barriers, the landscape of the deviations, and the degree, prevalence, and structure of any of them is sparsely and unevenly known insofar as modeling is concerned. Short of developing a deeper sociological or psychological understanding of why people and organizations act as they do, a systematic assessment of these deviations could provide a utilitarian way forward (see also Sanstad et al. 2006).
Work like the previously cited work estimating the segment size for split incentives in various investments (Sathaye & Murtishaw 2006; IEA 2007), for example, might be used to build up such a landscape. Such work could incrementally add knowledge that helps to better capture some key sources of deviations now modeled uniformly in energy efficiency potential studies. Better information on the variation of usage across households might also be integrated, as could more observed or experimental data on the cost- and non-cost aspects of adoption. The nature and structure of various market supply chains, which mediate between technological ideals and ultimate customer purchases, could be part of this analysis as well.
These sorts of elaborations are in line with the increased capabilities of targeting specific customers (e.g., segmentation, Internet communications, or other tools that programs might use). It is not clear how far such elaborations can go to improve the accuracy of scenario estimates from energy efficiency potential studies, but a clearer statement on the nature of decision-making for energy-relevant purchases, including a better idea of where cost-effectiveness figures at all, may contribute to the transformation of program elements themselves, so that they better reflect the diversity of decision-making situations and the supply chains that mediate them.

Behavioral Assumptions in Energy Efficiency Potential Studies
75
2. Meta-analysis of Program Data
The assignment of certain parameter values in energy efficiency potential studies – for example, the high-level market-barrier parameters awareness and willingness, used in California studies – is an art, as many of these parameters are not directly observable, nor are relevant program result data available in an accessible form. The relationship between investment in various types of program interventions and incentive levels, and customer technology adoption is also only weakly supported by observation (Rufo et al. 2008). Work analyzing these past results, with careful attention as to how well various aspects are known, could be very valuable. The empirical analysis of these sociological components of technology adoption may be beneficial, not only for improving modeling results, but also for revealing clues to deviations and opportunities that are otherwise hidden in aggregate or generic analyses.
3. Uncertainty
Uncertainty analysis in energy efficiency potential studies is only partly developed (Baudry & Osso 2007; Rufo 2007). Moreover, policymakers have not been able to integrate the uncertainty implicit in these studies and their inputs very well (Rufo 2007). A more formal treatment of uncertainty in energy efficiency potential studies – estimating the size of uncertainties by source, as well as their overall effect on study estimates – will make their interpretation more realistic and provide guidance in what aspects of uncertainty can be reduced by better behavioral (or other) data. A clearer view of uncertainty can also be useful in developing risk-averse program portfolios.
8.2 Expanded Frame Recommendations
4. Behavioral Conservation
The possibility of expanding the scope of energy efficiency potential studies to include behavioral conservation alongside technological measures was discussed in Section 4. The authors can make no recommendation as to whether this is worthwhile for California within the regulatory context of current energy efficiency potential studies. While it is clear that data on baseline behaviors, behavioral conservation, and particularly, the degree of persistence of behavioral changes, are poor from the point-of-view of modeling, it is also clear that behavior matters and can be changed.
There remains a lack of understanding of how people use energy services and the capacities, constraints, and conditions that shape these levels (Lutzenhiser et al. 2002a). The persistence of various behavioral measures, admittedly difficult to measure, is virtually unknown, and behavior in commercial buildings is barely explored. Nor has the psychology of energy conservation communications been adequately investigated, especially in a new era of massive marketing, where exhortations to buy or change are everywhere. Often, efforts to promote behavioral changes use a haphazard approach in
Behavioral Assumptions in Energy Efficiency Potential Studies
76
which convenient items of the consumer-energy-tip sort are selected and marketed. These may have little effect because they miss the reasons for energy use and the barriers to changing behavior. If behavioral change is to be promoted, sophisticated approaches are needed, not just better marketing.
5. Observational Studies
Energy efficiency potential studies and the core physical-technical-economic perspective that they embody are mental models, as well as quantitative ones. We earlier argued that these models have a profound influence on how industry professionals think. The downside of this influence is that strong theories cloud the interpretation of observations and make it seem unnecessary to observe. As a consequence, many situations routinely treated or implied in models are not well supported by observation or analysis. For example, how homeowners decide on what HVAC equipment to purchase, how building operators decide on how to air condition their building, how people and organizations assess the energy-efficient technologies that they have purchased, and the psychological reactions to rebate offers or consumer tips – all seem under-observed.
This type of research might be accomplished at a basic level with simple studies using anthropological and sociological approaches, if the methodology is carefully grounded (Hitchings 2009). This research could draw from the experience of market actors and practitioners more generally, whose insights are now often confined to anecdotes or held by isolated individuals or limited groups, rather than being published, shared more widely, or interpreted as data.106 The results from these observational studies could be a rich resource, possibly for revising models, but certainly for improving program assumptions and the short-term and long-term strategies for energy efficiency. The bottom line is that more listening and observing is needed – to improve practice and theoretical assumptions, rather than to try to get the world to conform to theory.
6. Higher Scales of Efficiency and Consumption: From the Individual to the Sociotechnical
As noted earlier in the paper (Table 2 and Figure 1), there are a number of higher levels, above device efficiency and behavioral conservation, that constrain and shape energy consumption. These contextual levels are potentially malleable, including the goods available for purchase, systems of provision, space planning, daily patterns of life, what actions are socially rewarded, etc. It is not clear what the most attractive options are for change and how well policy could direct society toward these changes. What is clear – for example, from the comparison of cross-household and cross-country variability in energy consumption (Section 7) – is that different modes of consumption can result in
106 We recognize that some insights of market actors and practitioners are heard, for example, as stakeholder input in state regulatory processes.
Behavioral Assumptions in Energy Efficiency Potential Studies
77
very different levels of energy consumption that are not explainable in terms of weather differences or quality of life.
Building a better understanding of these sociotechnical environments along the lines suggested by Sanne (2002), or through social studies of technology or future studies, could be immensely fruitful. This sort of work could be sustained by traditional academic research, but requires the involvement of stakeholders at many levels. It could support and shape goals that are currently specified in terms of technology penetrations, such as the zero net energy building goals specified in California’s long-term energy efficiency strategy (CPUC 2008), and could build from visions primarily conceived of in terms of technological systems (e.g., integrated building design – also specified by the CPUC [2008] to include social systems as well).
Put another way, energy efficiency can serve the purpose of reducing levels of future energy consumption relative to forecasted future needs assumed in the absence of these programs. How energy is used, however, is also a fundamental determinant of environmental quality and sustainability (Kemmler & Spreng 2007), and of the quality of life (Levett 1998). Conversely, quality of life and qualities of lifestyles shape energy use far beyond what can be explained by device-level efficiency. As policy goals broaden, there is a greater need to put energy efficiency into the policy arena in a way that can better simultaneously recognize energy efficiency’s multiple contributions and multiple determinants, and to judge these alongside those of other policy instruments and directions.
8.3 Outside and Crosscutting Recommendations
7. Institutions
Behavior in the study of energy efficiency potential includes not only the traditional subjects – consumers using energy and market actors providing products and services – but also researchers, funders, and policymakers (Lutzenhiser & Shove 1999; Rufo et al. 2008). Interviewees for this paper pointed to inter- and intra-institutional issues that constrained the possibility of doing things differently: timeframes are short; politicians need impressive-looking results; coordination and even trust between institutions is often poor; everybody needs funding; and so on. Such constraints are perfectly normal, but they also have major implications for what programs and results can be produced and what research questions can be pursued. At a time when the energy efficiency industry is adapting to new ways of thinking and new goals – in particular, those justified by climate change concerns – these constraints are especially important. There is little formal opportunity to openly discuss these constraints. An innovative investigation of institutional constraints and their consequences, as they are seen in practice, along with discussion forums among the participants involved, could identify promising opportunities for adaptations.
Behavioral Assumptions in Energy Efficiency Potential Studies
78
8. Making Social Sciences (Appear) Useful: Better Understanding Between Social Scientists and Technologists, and More Coordination Between Academic and Corporate Work
The energy efficiency industry is made of various sub-communities and disciplines, each with different interests, languages, assumptions, duties, and criteria of proof, and with only partially intersecting goals. The juncture between the small social scientist tribe and the more dominant technology tribe has been frustrating to all sides. Social scientists often feel pushed to contribute results that are analogous to natural science results, which cannot be done very well due to the nature of the social world and how it can be researched (Flyvbjerg 2001). Those in the more dominant technology-oriented mainstream of the energy efficiency industry may find much of the work in energy social sciences irrelevant, destructive, or even just wrong. A better mutual understanding between these two tribes can lay a foundation for the better integration of behavior, but even more so for more sophisticated strategizing about, and possibly achieving, energy efficiency potential.
Many of the questions raised in the course of this paper were raised long ago, near the beginnings of the energy efficiency field (e.g., Stern 1985). However, it cannot be said that many have an answer, and the reason for the continued void is likely not just a matter of inadequate funding. Some changes in expectations are needed, as well as better communication. As two of the interviewees for this paper noted, strengthening the links and developing joint projects among corporate analysts, academic researchers, government researchers, and willing policymakers could pave a way to better work in all domains.
With the expanded global interest in energy efficiency, the energy efficiency field has the opportunity to become a leader in a fundamentally applied realm, one intersecting the emerging transdisciplinary field of sustainability science (Komiyama & Takeuchi 2006). This may seem a grandiose conclusion for a white paper on energy efficiency potential studies. In crystallizing some of the central questions about energy efficiency in society, however, energy efficiency potential studies provide a forum to broaden the energy efficiency field’s terms of engagement with these questions, and thus support a sociotechnical transformation that is socially welcome, in addition to reducing energy and environmental burdens.
79
9. References References marked with “*” are relevant but not cited in the report.
Abbaszadeh, S., L. Zagreus, D. Lehrer, and C. Huizenga. 2006. “Occupant Satisfaction with Indoor Environmental Quality in Green Buildings,” Healthy Buildings (Conference). Lisbon.
Abrahamse, W. 2007. Energy Conservation Through Behavioral Change: Examining the Effectiveness of Tailor-Made Approaches. Ph.D. Dissertation. Groningen, Netherlands: University of Groningen.
Abrahmse, W., L. Steg, C, Vlek and T. Rothengatter. 2005. “A Review of Intervention Studies Aimed at Household Energy Conservation,” Journal of Environmental Psychology 25(3):273-291.
Allen Consulting Group. 2004. The Energy Efficiency Gap: Market Failures and Policy Options. Report to the Business Council for Sustainable Energy, Australasian Energy Performance Association and Insulation Council of Australia and New Zealand. November. Melbourne.
Amann, J.T. 2006. Valuing of Non-Energy Benefits to Determine Cost-Effectiveness of Whole-House Retrofits Programs: A Literature Review. Report A061. May. Washington, D.C.: American Council for an Energy Efficient Economy.
Amann, J. T., A. Wilson, and K. Ackerly. 2007. Consumer Guide to Home Energy Savings. 9th ed. Washington, D.C.: New Society Publishers.
American Council for an Energy Efficient Economy [ACEEE]. 2007. Quantifying the Effects of Market Failures in the End-Use of Energy. February. Final draft report. Washington, D.C.: American Council for an Energy Efficient Economy.
American Physical Society. 2008. Energy Future: Think Efficiency. www.aps.org/energyefficiencyreport/. College Park, Md: American Physical Society.
Archer, D., Pettigrew, T. F., and Aronson, E. 1992. “Making Research Apply. High Stakes Public Policy in a Regulatory Environment,” American Psychologist 47(10):1233-1236.
Auffhammer, M,, C, Blumstein, and M. Fowlie. 2007. Demand-Side Management and Energy Efficiency Revisited. CSEM WP 165R. Berkeley, Calif.: Center for the Study of Energy Markets, University of California.
Bartiaux, F, G. Vekemans, K, Gram-Hanssen, D. Maes, M. Cantaert, B. Spies and J. Desmedt. 2006. “Sustainable Consumption and Production Patterns.” Sociotechnical Factors Influencing Residential Energy Consumption (SEREC): Final Report. CP/52. Brussels: Belgian Federal Science Policy Office.
Behavioral Assumptions in Energy Efficiency Potential Studies
80
Bartiaux, F. and K. Gram-Hanssen. 2005. “Socio-Political Factors Influencing Household Electricity Consumption: a Comparison between Denmark and Belgium,” pp. 1313-1325, 2005 ECEEE Summer Study on Energy Efficiency. Stockholm: European Council for an Energy Efficient Economy.
Bartiaux, F. 2006. “Do Information and Awareness Work?” Chapter 4 in M. M. Andersen and A. Tukker (eds.), Proceedings: Perspectives on Radical Changes to Sustainable Consumption and Production. SCORE Workshop. 20-21 April 2006. Copenhagen.
Baudry, P. and D. Osso. 2007. “Uncertainties in the Evaluation of Energy Savings Potential,” pp. 583-588, 2007 ECEEE Summer Study on Energy Efficiency. Stockholm: European Council for an Energy Efficient Economy.
Bender, S., M. Moezzi, M.H.Gossard, and L.Lutzenhiser. 2002. “Using Mass Media to Influence Consumption Behavior: California's 2001 Flex Your Power Campaign as a Case Study,” pp. 8.15-8.28, 2002 ACEEE Summer Study on Energy Efficiency in Buildings. Washington, D.C.: American Council for an Energy Efficient Economy.
*Bensch, I., S. Pigg, and M. Andersen. 2006. “How Much is That Training Program Worth? Quantifying the Value of Training and Other ‘Fuzzy’ Education Events,” pp. 8.20-8.31, 2006 ACEEE Summer Study on Energy Efficiency in Buildings. Washington, D.C.: American Council for an Energy Efficient Economy.
*Blumstein, C., B. Krieg, L. Schipper, and C. York. 1980. “Overcoming Social and Institutional Barriers to Energy Conservation,” Energy 5:385-371.
Boonekamp, P. 2006. “Evaluation of Methods Used to Determine Energy Savings,” Energy Policy 34:3977-2992.
Bordass, W. 2007. “Energy Performance,” reprinted from D. Turrent (ed.), Chapter 3, pp. 18-23 in Sustainable Architecture. London: RIBA Publishing.
Bordass, W., A. Leaman, and S. Willis, 1994. “Control Strategies for Building Services: the Role of the User.” August. First presented at the Buildings and the Environment Conference, BRE. Watford.
Brager, G., G. Paliaga, and R. de Dear. 2004. “Operable Windows, Personal Control, and Occupant Comfort,” ASHRAE Transactions 110(2):17-35.
Broc, J-S, B. Bourges, P. Nogues, and J. Adnot. 2008. “Can Energy Savings From Operations Promoting Energy Efficient Behaviors in Office Buildings Be Accounted For?” International Conference on Improving Energy Efficiency in Commercial Buildings. 10-11 April. Frankfurt.
Brodt, S. 2007. Assessment of Energy Use and Greenhouse Gas Emissions in the Food System: A Literature Review. Agricultural Sustainability Institute. Davis, Calif.: University of California Davis.

Behavioral Assumptions in Energy Efficiency Potential Studies
81
Brown, M.A., F. Southworth, and A. Sarzynski. 2008. Shrinking the Carbon Footprint of Metropolitan America. Metropolitan Policy Program. Washington, D.C. The Brookings Institution.
Brown, S. and G. Walker. 2008. “Understanding Heat Wave Vulnerability in Nursing and Residential Homes,” Building Research & Information 36(4):363-372.
Bruel, R. 2007. “BEHAVE. Meta-Evaluation of Communicative Programmes Aimed at Consumers,” 2007 ECEEE Summer Study on Energy Efficiency. Stockholm: European Council for an Energy Efficient Economy.
[CEC] California Energy Commission. 2002. The Summer 2001 Conservation Report. CEC-400-2002-001. February. Sacramento, Calif.
[CEC] California Energy Commission. 2003. Proposed Energy Savings Goals for Energy Efficiency Programs in California. Staff Report. October 27. 100-03-021. Sacramento, Calif.
*[CEC] California Energy Commission. 2007. Statewide Energy Efficiency Potential Estimates and Targets for California Utilities. Draft Staff Report. CEC-200-2007-019-SD. August. Sacramento, Calif.
*[CEC] California Energy Commission. 2007. Achieving All Cost-Effective Energy Efficiency for California. Final Staff Report. CEC-200-2007-019-SF. December. Sacramento, Calif.
[CEC] California Energy Commission. 2008a. “Energy Conservation in California Energy Commission Demand Forecast Models.” Sacramento, Calif. http://www.energy.ca.gov/2008_energypolicy/documents/2008-03-05_SUMMARY_DSM_DATASETS.PDF
[CEC] California Energy Commission. 2008b. An Overview of Natural Gas Usage in California. California Energy Commission. CEC-180-2008-005. April. Sacramento, Calif.
[CMUA] California Municipal Utilities Association. 2007. Establishing Energy Efficiency Targets: A Public Power Response to AB2021. Final Update. October. Sacramento, Calif.
[CPUC] California Public Utilities Commission. 2001. California Standard Practice Manual. Economic Analysis of Demand-Side Programs and Projects. October. San Francisco, Calif.
[CPUC] California Public Utilities Commission. 2003. Energy Efficiency Policy Manual. Version 2. August. San Francisco, Calif.
[CPUC] California Public Utilities Commission. 2008. California Long Term Energy Efficiency Strategic Plan. San Francisco, Calif.
Behavioral Assumptions in Energy Efficiency Potential Studies
82
Callon, M. 1998. “An Essay on Framing and Overflowing: Economic Externalities Revisited by Sociology,” pp. 244-269, in Michel Callon (ed.), The Laws of the Markets. Oxford: Blackwell Publishers/Sociological Review.
Carlsson-Kanyama, A. & A. Lindén. 2007. “Energy Efficiency in Residences - Challenges for Women and Men in the North.” Energy Policy 35(4):2163-2172.
Clevenger, C. M. and J. Haymaker. 2006. “The Impact of the Building Occupant on Energy Modeling Simulations,” Joint International Conference on Computing and Decision Making. Montreal.
Cooper, G. C. 1998. Air-Conditioning America. Engineers and the Controlled Environment 1900-1960. Baltimore: Johns Hopkins University Press.
Cooper, G. C. 2008. “Escaping the House: Comfort and the California Garden,” Building Research & Information 36(4):373-380.
Crompton, T. 2008. Weathercocks & Signposts: The Environment Movement at a Crossroads. WWF-UK. Surrey. http://assets.wwf.org.uk/downloads/weathercocks_report2.pdf
Cross, D. and D. Judd. “Automatic Setback Thermostats: Measure Persistence and Customer Behavior,” 1997 International Energy Program Evaluation Conference. August 27-29, 1997. Chicago.
Dahlbom, B., H. Greer, C. Egmond, R.Jonkers. 2009. Changing Energy Behaviours. Guidelines for Behavioural Change Programmes. Madrid: Intelligent Energy Europe Programme of the European Commission.
Darby, S. 2006. The Effectiveness of Feedback on Energy Consumption. A Review for DEFRA of the Literature on Metering, Billing, and Direct Displays. Oxford: Environmental Change Institute.
DeCanio, S. J. 1993. “Barriers within Firms to Energy-Efficient Investment,” Energy Policy 21(9):906-914.
[DEER] Database for Energy Efficient Resources. 2008a. Final DEER 2006-2007 Measure Updates. http://www.deeresources.com
[DEER] Database for Energy Efficient Resources. 2008b. 2008 DEER Update – Summary of Measure Energy Analysis Revisions. December 2008. Version 2008.2.05 for 2009-2011 Planning/Reporting. http://www.deeresrouces.com
Deumling, R. 2004. “Thinking Outside of the Refrigerator: Shutting Down Power Plants with NAECA?” pp. 11.13-11.24, 2004 ACEEE Summer Study on Energy Efficiency in Buildings. Washington, D.C.: American Council for an Energy Efficient Economy.

Behavioral Assumptions in Energy Efficiency Potential Studies
83
Diamond, R and M. Moezzi. 2000. “Revealing Myths about People, Energy and Buildings,” pp. 8.55-8.66, 2000 ACEEE Summer Study on Energy Efficiency in Buildings. Washington D.C.: American Council for an Energy Efficient Economy.
Douthwaite, B. 2002. Enabling Innovation: A Practical Guide to Understanding Technological Change. London & New York: Zed Books.
Ehrhardt-Martinez, K., J.A. Laitner, and W. Reed. 2008. “Dollars or Sense: Economic versus Social Rationality in Residential Energy Consumption,” 2008 ACEEE Summer Study on Energy Efficiency in Buildings. Washington D.C.: American Council for an Energy Efficient Economy.
Ek, K. and P. Söderholm. 2008. “Analyzing Energy Conservation Behavior among Swedish Households: The Role of Information,” pp. 1-11, 31st IAEE International Conference. Istanbul.
Elias, N. 2000. The Civilizing Process. 2nd ed. Oxford: Wiley-Blackwell.
Emery, A. and L. Gartland. 1996. Quantifying Occupant Energy Behavior Using Pattern Analysis Techniques. LBNL-38579. Berkeley, Calif.: Lawrence Berkeley National Laboratory.
[EERE] Energy Efficiency and Renewable Energy. n.d. “Swimming Pool Heating” http://apps1.eere.energy.gov/consumer/your_home/water_heating/index.cfm/mytopic=13140
[EERE] Energy Efficiency and Renewable Energy. 1999. “Energy Efficiency Pays.” Technology Fact Sheet. DOE/GO-10099-745. Washington, D.C.: U.S. Department of Energy.
Energy Design Update. 2000. “An Unexpected Setback for Programmable Thermostats,” Energy Design Update 20 (Nov):1-4.
Energy Information Administration. Residential Energy Consumption 2001 (RECS). 2003. Washington, D.C.: U.S. Department of Energy.
[Envision et al.] Envision Sustainability Tools and Marbek Resource Associates, Ltd. 2007. BC Hydro 2007 Conservation Potential Review. The Potential for Energy Savings through Lifestyle Changes: F2006-F2026. Residential and Commercial Sectors in British Columbia. Final Report. Nov 20. Vancouver and Ontario.
[EPRI]. Electric Power Research Institute. 2009. Assessment of Achievable Potential from Energy Efficiency and Demand Response in the United States (2010-2030). Technical Report. 1016987. January. Palo Alto, Calif.
Eto, J., R. Prahl, and J. Schlegel. 1996. A Scoping Study on Energy Efficiency Market Transformation by California Utility DSM Programs. LBNL-39058. Berkeley, Calif.: Lawrence Berkeley National Laboratory.
Behavioral Assumptions in Energy Efficiency Potential Studies
84
European Environment Agency (EEA). 2001. “Indicators Fact Sheet Signals 2001 – Chapter on Households.” Copenhagen. http://themes.eea.europa.eu/Sectors_and_activities/households/indicators/energy/hh06households.pdf
European Commission. 2003. External Costs: Research Results on Socio-Environmental Damages Due to Electricity and Transport. EUR 20198. Brussels: European Commission.
Expert Group on Energy Efficiency. 2007. Realizing the Potential of Energy Efficiency: Targets, Policies, and Measures for G8 Countries. Washington, D.C.: United Nations Foundation.
Fard, S.A. 2006. Post Occupancy Evaluation of Indoor Environmental Quality: Do Green Buildings Have More Satisfied Occupants? M.S. Thesis. Berkeley, Calif.: University of California Berkeley.
Fischer, Corrina. 2007. “Influencing Electricity Consumption via Consumer Feedback. A Review of Experiments,” Discussion Paper 8. February. TIPS. Sozial-okologishe Forschung. Berlin.
Flyvbjerg, B. 2001. Making Social Science Matter. Why Social Inquiry Fails and How it Can Succeed Again. Cambridge: Cambridge University Press.
Frisch, C. 2008. Electric Utility Demand Side Management: Defining and Evaluating Achievable Potential. May. Master’s Thesis. Durham, N.C.: Duke University.
Galasiu, A. D. & J. Veitch. 2006. “Occupant Preferences and Satisfaction with the Luminous Environment and Control Systems in Daylit Offices: A Literature Review.” NRCC-47621. Ottawa: Natural Resources Canada.
Geller, E. S. 1981. “Evaluating Energy Conservation Programs: Is Verbal Report Enough?” The Journal of Consumer Research 83:331-335.
Geller, H., and S. Attali. 2005. The Experience with Energy Efficiency Policies and Programs in IEA Countries. Learning from the Critics. August. International Energy Agency. Paris: OECD.
Gellings, C. W., G. Wikler, and D. Ghosh. 2006. “Assessment of U.S. End-Use Energy Efficiency Potential,” The Electricity Journal 19(9):55-69.
Geltz, Christine. 2008. “Painting These Towns Green: How Diffusion of Innovations Theory Brought Energy Improvements and Sustainability to Hard-to-Serve Utility Customers and their Communities,” International Journal of Sustainability Communication 3(1).
Gifford, H. 2008. “A Better Way to Rate Green Buildings.” Available at http://www.energysavingscience.com/articles/henrysarticles/BuildingRatingSystems.pdf

Behavioral Assumptions in Energy Efficiency Potential Studies
85
Gillingham, K, R. G. Newell, and K. Palmer. 2004. Retrospective Examination of Demand-Side Energy Efficiency Policies. RFF DP 04-19 REV. Washington, D.C.: Resources for the Future.
Gladhart, P. M., J. S. Weihl, and S. Krabacher. 1988. “Reported Versus Actual Thermostat Settings: A Management Perspective,” pp. 11.15-11.28, 1988 ACEEE Summer Study on Energy Efficiency in Buildings. Washington, D.C.: American Council for an Energy Efficient Economy.
Goldman, C., J. Eto, and G. Barbose. 2002. California Customer Load Reductions during the Electricity Crisis: Did They Help to Keep the Lights On? LBNL-49733. Berkeley, Calif: Lawrence Berkeley National Laboratory.
Goldstein, David. 2008. “Extreme Efficiency: How Far Can We Go if We Really Need To?” pp. 10.44-10.56, 2008 ACEEE Summer Study on Energy Efficiency in Buildings. Washington D.C.: American Council for an Energy Efficient Economy.
Golove, W. H. and J. Eto. 1996. Market Barriers to Energy Efficiency: A Critical Reappraisal of the Rationale for Public Policies to Promote Energy Efficiency. LBNL-38059. Berkeley, Calif: Lawrence Berkeley National Laboratory.
Gram-Hanssen, Kirsten 2002. “Technology and Culture as Explanations for Variations in Energy Consumption,” pp.8.79-8.90, 2002 ACEEE Summer Study on Energy Efficiency in Buildings. Washington, D.C.: American Council for an Energy Efficient Economy.
Gram-Hanssen, K. C. Kofod, and K, Noervig Petersen. 2004. “Different Everyday Lives: Different Patterns of Electricity Use,” pp. 7.74-7.85, 2004 ACEEE Summer Study on Energy Efficiency. Washington, D.C.: American Council for an Energy Efficient Economy.
Green, J. and L.A. Skumatz. 2000. “Evaluating the Impacts of Education/Outreach Programs: Lessons on Impacts, Methods, and Optimal Education,” pp. 8.123-8.136, 2000 ACEEE Summer Study on Energy Efficiency in Buildings. Washington, D.C.: American Council for an Energy Efficient Economy.
Hajer, M. 2003. “Policy Without Polity: Policy Analysis and the Institutional Void,” Policy Sciences 36:175-195.
Hajer, M. 2006. “Doing Discourse Analysis: Coalitions, Practices, Meanings,” pp. 65-74, M. van den Brink and T. Metze (eds.), Words Matter in Policy and Planning. Utrecht: Netherlands Geographic Studies.
Hák, T., B. Moldan, and A. L. Dahl. 2008. Sustainability Indicators: A Scientific Assessment. Washington, D.C.: Island Press.
Harris, J., R. Diamond, M. Iyer, C. Payne, C. Blumstein, and H. Siderius. 2007. Towards a Sustainable Energy Balance: Progress Efficiency and the Return of Energy

Behavioral Assumptions in Energy Efficiency Potential Studies
86
Conservation. CSEM WP 171. September. Berkeley, Calif.: Center for the Study of Energy Markets, University of California.
Haynes, G. C., T. Ledyard, G. Azulay, and R.Prahl. 2007. “Building a Better Mousetrap: a Unique Approach to Determining Reliable Savings Potential,” pp. 883-894, 2007 International Energy Program Evaluation Conference. Chicago.
*Henryson, J, T. Hakansson and J. Pyrko 2000. “Energy Efficiency in Buildings through Information -- Swedish Perspective,” Energy Policy 28(3):169-180.
Herring, H. 1998. Does Energy Efficiency Save Energy? The Economists Debate. Milton Keynes: Open University.
Herring, H. 2006. “Energy Efficiency – a Critical View,” Energy 31(1):10-20.
Herring, H. 2009. “Sufficiency and the Rebound Effect,” in H. Herring and S. Sorrell (eds.), Energy Efficiency and Sustainable Consumption: The Rebound Effect. Hampshire, U.K.: Palgrave.
Herter, K., P. McAuliffe, and A. Rosenfeld. 2007. “An Exploratory Analysis of California Residential Critical Peak Pricing of Electricity,” Energy 32(1):25-34.
Heschong Mahone Group. 1998. Skylighting Guidelines. Fair Oaks, California.
Hitchings, R. 2009. “Studying Thermal Comfort in Context,” Building Research and Information 37(1):89-84.
*Howarth, R. B., B. M. Haddad, and B. Paton, 2000. “The Economics of Energy Efficiency: Insights from Voluntary Participation Programs,” Energy Policy 28(6-7):477-486.
[IEA] International Energy Agency. 1996. Inventory of Available Methods and Processes for Assessing Benefits, Costs, and Impacts of Demand-Side Options. Volume 1 - Overview of Methods Models and Techniques. July. Paris: OECD.
[IEA] International Energy Agency. 2005. Saving Electricity in a Hurry: Dealing with Temporary Shortfalls in Electricity Supply. July. Paris: OECD.
[IEA]. International Energy Agency. 2007. Mind the Gap. Paris: OECD.
*Itron, Inc. 2008. Assistance in Updating the Energy Efficiency Savings Goals for 2012 and Beyond - Task A4.1 Final Report: Scenario Analysis to Support Updates to the CPUC Savings Goals. Prepared for the California Public Utilities Commission [CPUC] Energy Division. March 24.
Itron, Inc., KEMA, Inc., RLW Analytics, Inc. and Architectural Energy Corp. 2006. California Energy Efficiency Potential Study. Volumes 1 & 2. Submitted to Pacific Gas & Electric. May 24.
Behavioral Assumptions in Energy Efficiency Potential Studies
87
Itron Inc. and KEMA Inc. 2008. California Energy Efficiency Potential Study. Final. Submitted to Pacific Gas & Electric Company. September 10. Oakland, Calif.
Iyer, M., W. Kempton, and C. Payne. 2006. “Comparison Groups on Bills and Automated, Personalized Energy Information,” Energy and Buildings 38(8):988-996.
Jaffe, A. B. and R. N. Stavins. 1994. “The Energy-Efficiency Gap. What Does it Mean?” Energy Policy 22(10):804-810.
Janda, K., C. Payne, R. Kunkle, and L. Lutzenhiser. 2002. “What Organizations Did (and Didn't) Do: Three Factors that Shaped Conservation in California's 2001 'Crisis'” pp. 8.117-8.128, 2002 ACEEE Summer Study on Energy Efficiency in Buildings. Washington, D.C.: American Council for an Energy Efficient Economy.
Janda, K. and A. von Meier. 2004. “The Role of Quantitative Data in Defining Success: A Tale of Two Green Academic Buildings,” pp. 7.135-7.146, 2004 ACEEE Summer Study on Energy Efficiency in Buildings. Washington, D.C.: American Council for an Energy Efficient Economy.
Jankovic, I. 2008. “The Eco-Industrial Complex in USA – Global-Warming and Rent-Seeking Coalitions,” Energy & Environment 19(7):947-958.
Jelsma, J. 1999. “Towards a Sustainable Society: The Moralising of Machines?” presented at the Meeting of the Society of Social Studies of Science (4S). San Diego, Calif.
Jelsma, J. 2004. “The Engineering Approach and Social Aspects of Energy Use: Mind The Gap, But Can It Be Closed?” pp. 7.144-7.160, 2004 ACEEE Summer Study on Energy Efficiency in Buildings. Washington, D.C.: American Council for an Energy Efficient Economy.
Karpiscak, M. and M.H.Marion. 1994. Evaporative Cooler Water Use. Publication 191045. May. Arizona Cooperative Extension.
KEMA, Inc. 2006. California Industrial Existing Construction Energy Efficiency Potential Study. Final report to Pacific Gas & Electric Company. May.
KEMA-Xenergy, Inc. 2003. California Statewide Residential Sector Energy Efficiency Potential Study. Study ID #SW063, Volumes 1 & 2. April.
KEMA-Xenergy Inc., Itron, and RoperASW. 2004. California Residential Appliance Saturation Study. June. Consultant Report. Prepared for the California Energy Commission.CEC 400-04-009. Sacramento, Calif.
Keegan, E. 2008. “Promise vs. Performance: A Deeper Shade of Green,” Architect Magazine. 1 October. http://www.architectmagazine.com/industry-news.asp?sectionID=1006&articleID=795408.

Behavioral Assumptions in Energy Efficiency Potential Studies
88
Kemmler, A. and D. Spreng. 2007. “Energy Indicators for Tracking Sustainability in Developing Countries,” Energy Policy (35):2466-2480.
Knight, R. L., L. Lutzenhiser, and S. Lutzenhiser. 2006. “Why Comprehensive Residential Energy Efficiency Retrofits are Undervalued,” pp. 7.142-7.150, 2006 ACEEE Summer Study on Energy Efficiency in Buildings. Washington, D.C.: American Council for an Energy Efficient Economy.
Komiyama, H., and K. Takeuchi. 2006. “‘Sustainability Science’: Building a New Discipline,” Sustainability Science 1:1-6.
Kuhn, T. 1970. The Structure of Scientific Revolutions. 2nd ed. Enlarged. Chicago: University of Chicago Press.
Kulakowski, S. L. 1998. Large Organizations’ Investments in Energy-Efficient Building Retrofits. LBNL-40895. Berkeley, Calif.: Lawrence Berkeley National Laboratory.
Laitner, J. A., and V. McKinney. 2008. Positive Returns: State Energy Efficiency Analyses Can Inform U.S. Energy Policy Assessments. Report E084.June. Washington, D.C.: American Council for an Energy Efficient Economy.
Levett, R. 1998. “Sustainability Indicators—Integrating Quality of Life and Environmental Protection,” Journal of the Royal Statistical Society 161(3):291-302.
*Lindén, A., A. Carlsson-Kanyama, B. Eriksson. 2006. “Efficient and Inefficient Aspects of Residential Energy Behavior: What Are the Policy Instruments for Change?” Energy Policy 34(14):1918-1927.
Lovins, A. 1976. “Energy Strategy: The Road Not Taken,” Foreign Affairs 55(1):65-96.
Lutz, J. and B. A. Wilcox. 1990. “Comparison of Self-reported and Measured Thermostat Behavior in New California Houses,” pp. 2.91-2.100, 1990 ACEEE Summer Study on Energy Efficiency in Buildings. Washington, D.C.: American Council for an Energy Efficient Economy.
Lutzenhiser. L. 1993. “Social and Behavioral Aspects of Energy Use,” Annual Review of Energy and Environment 18:247-289.
Lutzenhiser, L. 2002a. An Exploratory Analysis of Residential Electricity Conservation Survey and Billing Data: Southern California Edison, Summer 2001. Revised. Sacramento, Calif: California Energy Commission.
Lutzenhiser, L. 2002b. “Marketing Household Energy Conservation: The Message and the Reality,” Chapter 3 of T. Dietz and P.C. Stern (eds.), New Tools for Environmental Protection: Education, Information, and Voluntary Measures. Washington, D.C.: The National Academies Press.

Behavioral Assumptions in Energy Efficiency Potential Studies
89
Lutzenhiser, L. 2009. Behavioral Assumptions Underlying California Residential Sector Energy Efficiency Programs. February. Prepared for the California Institute for Energy and Environment (CIEE). Oakland, Calif.
Lutzenhiser, L. and S. Bender. 2008. “The ‘Average American’ Unmasked: Social Structure and Differences in Household Energy Use and Carbon Emissions,” pp.7.191-7.204, 2008 ACEEE Summer Study on Energy Efficiency in Buildings. Washington, D.C.: American Council for an Energy Efficient Economy.
Lutzenhiser, L. and M. H Gossard. 2000. “Lifestyle, Status, and Energy Consumption,” pp. 8.207-8.221, 2000 ACEEE Summer Study on Energy Efficiency in Buildings. Washington, D.C.: American Council for an Energy Efficient Economy.
Lutzenhier, L. and E. Shove. 1999. “Contracting Knowledge: The Organisational Limits to Interdisciplinary Energy Efficiency Research and Development in the U.S. and the U.K,” Energy Policy 27(4):217-227.
Lutzenhiser, L., Nicole B., R. Kunkle, T. Beamish, and T. Burr. 2001. Market Structure and Energy Efficiency: The Case of New Commercial Buildings. Oakland, Calif.: California Institute for Energy Efficiency (CIEE).
Lutzenhiser, L., K. Janda, R. Kunkle, C. Payne, and S. Bender. 2002a. Understanding the Response of Commercial and Institutional Organizations to the California Energy Crisis. Sacramento, Calif: California Energy Commission.
Lutzenhiser, L., M.H. Gossard, and S. Bender, 2002b. “Crisis in Paradise: Understanding the Household Conservation Response to California’s Energy Crisis,” pp. 8.153-8.166, 2002 ACEEE Summer Study on Energy Efficiency in Buildings. Washington, D.C.: American Council for an Energy Efficient Economy.
Lutzenhiser, L, R. Kunkle, J. Woods, S. Lutzenhiser and S. Bender. 2004. “Lasting Impressions: Conservation and the 2001 California Energy Crisis,” pp. 7.229-7.240, 2004 ACEEE Summer Study on Energy Efficiency in Buildings. Washington, D.C.: American Council for an Energy Efficient Economy.
Maniates, M. 2002. “Individualization: Plant a Tree, Buy a Bike, Save the World?” pp. 43-66 in T. Princen, M. Maniates, and K. Conca (eds.), Confronting Consumption. Cambridge, Mass.: MIT Press.
Marbek Resource Associates, Ltd. 2007. BC Hydro 2007 Conservation Potential Review. The Potential for Energy Savings through Behavioural Changes, 2006-2026. Residential and Commercial Sectors in British Columbia. Final Report. Eleven volumes plus appendices. Nov 20. Ontario, Canada.
McKenzie-Mohr Associates. 2001. Influencing Behaviour by Providing Environmental Information. Prepared for the Task Force on the Canadian Information System on the Environment (CISE).
Behavioral Assumptions in Energy Efficiency Potential Studies
90
McKinsey Global Institute. 2007a. Curbing Global Energy Demand Growth: The Energy Productivity Opportunity. May. McKinsey & Company.
McKinsey Global Institute. 2007b. Wasted Energy: How the U.S. can Realize Large Energy Efficiency Potential. June. McKinsey & Company.
Meier, A. 1982. Supply Curves of Supplied Energy. LBL-14686. Berkeley, Calif.: Lawrence Berkeley National Laboratory.
Meier, A. 2003. The Future of ENERGY STAR and Other Voluntary Efficiency Programs. Report EET/2003/02. March. International Energy Agency. Paris: OECD.
Meier, A. and I. Walker. 2007. “Emerging Requirements for Residential Thermostats in North America,” Sixth International Conference on Indoor Air Quality, Ventilation, and Energy Conservation in Buildings. Sendai, Japan.
*Meier, A. and A. Eide. 2007. “How Many People Really See the Price Signal? Quantifying Market Failures in the End Use of Energy,” pp. 1865-1872, 2007 ECEEE Summer Study on Energy Efficiency. Stockholm: European Council for an Energy Efficient Economy.
Metcalf, G.E. 2006. Energy Conservation in the United States: Understanding its Role in Climate Policy. Report No. 13. Discussion Paper Series. Department of Economics. Medford, Mass.: Tufts University.
Metropolitan Water District of Southern California. 2003. “Swimming Pool Cover Rebate Project. Grant application.” http://www.owue.water.ca.gov/docs/2003Apps/PSP2003018.pdf.
Moezzi, M. 1998. “The Predicament of Efficiency,” pp. 4.273-4.284, 1998 ACEEE Summer Study on Energy Efficiency in Buildings. Washington D.C.: American Council for an Energy Efficient Economy.
Moezzi, M. 2009. “Are Comfort Expectations of Building Occupants Too High?” Building Research and Information 37(1):79-83.
Moezzi, M. and R. Diamond. 2005. Is Efficiency Enough? Towards a New Framework for Carbon Savings in the California Residential Sector. CEC-500-2005-162. October. Sacramento, Calif: California Energy Commission.
Moezzi, M. and F. Bartiaux. 2007. “Liberating Energy Analysis,” pp. 147-154, 2007 ECEEE Summer Study on Energy Efficiency. Stockholm: European Council for an Energy Efficient Economy.
Morrow, W., B. Rutledge, D. Maniccia, and M. Rea. 1998. “High Performance Lighting Controls: A Field Study of User Behavior and Preference,” World Workplace Conference. Chicago.
Behavioral Assumptions in Energy Efficiency Potential Studies
91
Mullaly, C. 1998. “Home Energy Use Behaviour: A Necessary Component of Successful Local Government Home Energy Conservation (LGHEC) Programs,” Energy Policy 26(14):1041-1052.
Murtishaw, Scott and Jayant Sathaye. 2006. Quantifying the Effect of the Principal-Agent Problem on U.S. Residential Energy Use. LBNL-59772. 12 August. Berkeley, Calif.: Lawrence Berkeley National Laboratory.
Nadel, S., A. Shipley, and R.N. Elliott. 2004. The Technical, Economic and Achievable Potential for Energy Efficiency in the U.S.—A Meta-Analysis of Recent Studies. Washington, DC: American Council for an Energy-Efficient Economy.
National Action Plan for Energy Efficiency [NAPEE]. 2006. Guide to Resource Planning with Energy Efficiency. Prepared by Snuller Price et al., Energy and Environmental Economics, Inc. http:www.epa.gov/eeactionplan.
National Action Plan for Energy Efficiency [NAPEE]. 2007. Guide for Conducting Energy Efficiency Potential Studies. Prepared by Philip Mosenthal and Jeffrey Loiter, Optimal Energy, Inc. http:www.epa.gov/eeactionplan.
[NPR] National Public Radio. 2008. “Juneau Power Crisis Brings Stark Savings Measures,” http://www.npr.org/templates/story/story.php?storyId=90755754.
Nevius, M. J. and S. Pigg. 2000. “Programmable Thermostats That Go Berserk? Taking a Social Perspective on Space Heating in Wisconsin,” pp. 8.233-8.244, 2000 ACEEE Summer Study on Energy Efficiency in Buildings. Washington, D.C.: American Council for an Energy Efficient Economy.
*[NEEP] Northeast Energy Efficiency Partnerships. 2005. Economically Achievable Energy Efficiency Potential in New England. Updated. Prepared by Optimal Energy. Lexington, Mass.
[NEEA] Northwest Energy Efficiency Alliance. 2008. 2010-2014 Strategic Plan. Draft. September 25. Portland, Oregon.
Nyboer, J. and A. Bailie. 1994. “Achievable Conservation Potential in British Columbia: a Review and Critique,” Energy Studies Review 6(3):265-273.
Oman, S, L. Hoefgen, A. Li, and R. Prahl. 2007. “Blinded by the Light: Why Are We in the Dark About How Many CFLs Are Out There?” pp. 1110-1121, 2007 International Energy Program Evaluation Conference [IEPEC]. Chicago.
Osland, D. 2000. “Programmable Thermostat Myths: Know the Facts and Boost Your Profits,” Air Conditioning, Heating & Refrigeration News. September 19.
Owens, S. and L. Driffill. 2006. How to Change Attitudes and Behaviours in the Context of Energy. Version 1.0. Foresight. July. U.K.: Office of Science and Innovation.
Behavioral Assumptions in Energy Efficiency Potential Studies
92
Pacific Gas & Electric. 2008. “First Draft Written Comments of Pacific Gas and Electric Company Regarding Improvements to the CEC Demand Forecast Following CEC IEPR Workshop of August 12, 2008.” www.energy.ca.gov.
Pacific Gas & Electric [PG&E] and Sempra Energy. 2006. Residential Swimming Pools. Draft Report. San Francisco, Calif.
Pears, A. 2004. “Energy Efficiency – Its Potential: Some Perspectives and Experiences.” Background paper for the International Energy Agency Energy Efficiency Workshop, International Energy Agency [IEA]. Paris: OECD.
Peters, J. S., K. Seiden, S. Baggett, and L. Morander 1998. “Changing Consumer Attitudes to Energy Efficiency: Midterm Results from an Advertising Campaign,” pp. 8.251-8.262, 1998 ACEEE Summer Study on Energy Efficiency in Buildings. Washington, D.C.: American Council for an Energy Efficient Economy.
Plourde, A. 2003. Programmable Thermostats as Means of Generating Energy Savings: Some Pros and Cons. Canadian Energy Use Buildings Data and Analysis Center [CBEEDAC]. Edmonton, Canada: University of Alberta.
Press Enterprise. 2008. “Outcry Keeps State Cool.” 11 January. http://www.pe.com/localnews/inland/stories/PE_News_Local_C_thermostat12.34a4482.html
Reed, J. H., G. Jordan, and E. Vine. 2007. Impact Evaluation Framework for Technology Deployment Programs. July. Energy Efficiency and Renewable Energy [EERE]. Washington, D.C.: U.S. Department of Energy.
Reed, J. H., M. Morrissey, C. Bailey, J. Riggert, I. Gecils, and P. Turnbull. 2007. “Decision-Making in the Commercial Office Building Sector: Targeting Key Players in the Office Submarket,” pp. 474-485, 2007 International Energy Program Evaluation Conference [IEPEC]. Chicago.
Reijnders, L. 1998. “The Factor X Debate: Setting Targets for Eco-Efficiency,” Journal of Industrial Ecology 2(1):13-22.
Ritchie, J. R. Brent, Gordon H. G. McDougall, and John D. Claxton. 1981. “Complexities of Household Energy Consumption and Conservation,” Journal of Consumer Research 8(3):233-242.
Rivers, N and M. Jaccard. 2005. “Combining Top-Down and Bottom-Up Approaches to Energy-Economy Modeling Using Discrete Choice Models,” Energy Journal 26(1):83-106.
Robillard, P., D. Shipley, and C. Gustafson. 2008. “DSM Potential Studies are Alive and Well and Living in Canada,” pp. 5.248-p5.260, 2008 ACEEE Summer Study on Energy Efficiency in Buildings. Washington, D.C.: American Council for an Energy Efficient Economy.

Behavioral Assumptions in Energy Efficiency Potential Studies
93
*Rufo, M. 1993. “DSM Planning the Next Generation: Building the Foundation through Evaluation,” International Energy Program Evaluation Conference [IEPEC]. Chicago.
Rufo, M. 2007. “A Few Thoughts on EE Potential Studies,” Panel 2 Presentation. 2007 IEPR Committee Workshop. April 20. Sacramento, Calif.
Rufo, M. and K. Train. 1999. “Using Choice Modeling to Understand Customer Preferences,” Chapter 4 of A. Faruqui and J.R. Malko (eds.), Customer Choice: Finding Value in Retail Electricity Markets. March. Vienna, Virginia: Public Utility Reports, Inc.
Rufo, M. and F. Coito. 2002. California’s Secret Energy Surplus: The Potential for Energy Efficiency. Prepared for the Energy Foundation and the Hewlett Foundation. Prepared by Xenergy, Inc. San Francisco: The Energy Foundation.
Rufo, M. and A. North. 2007. Assessment of Long-Term Energy Efficiency Potential in California’s Residential Sector. PIER Project Report. CEC-500-2007-002. February 2007. Sacramento, Calif.: California Energy Commission.
Rufo, M., M. Ting, M. Messenger, and M. Wheeler. 2008. “Energy Efficiency as the First Resource: Opportunities, Challenges, and Beating the Next Bust,” pp. 8.299-8.310, 2008 ACEEE Summer Study on Energy Efficiency in Buildings. Washington, D.C.: American Council for an Energy Efficient Economy.
Russell, R. and C. Miner. 2008. “Assessing the Impact of Behavioral Energy Efficiency Measures,” pp. 7.274-7.284, 2008 ACEEE Summer Study on Energy Efficiency in Buildings. Washington, D.C.: American Council for an Energy Efficient Economy.
Sabaliunas, D., C. Pittinger, C. Kessel, and P. Masscheleyn. 2006. “Residential Energy Use and Potential Conservation Through Reduced Laundering Temperatures in the United States and Canada,” Integrated Environmental Assessment and Management 2(2):142-153.
Sahota, R., I. Sulyma, K.Tiedemann, and J. Habart. 2008. “Behavior and Potential Energy Savings in Residential Dwellings,” pp. 7.285-7.293, 2008 ACEEE Summer Study on Energy Efficiency in Buildings. Washington, D.C.: American Council for an Energy Efficient Economy.
Samiuallah, S., D. Hungerford, and A. Kandel. 2002. “Do Central Air Conditioner Rebates Encourage Adoption of Air Conditioning,” pp.8.253-8.264, 2002 ACEEE Summer Study on Energy Efficiency in Buildings. Washington, D.C.: American Council for an Energy Efficient Economy.
Sanstad, A. and R. Howarth. 1994. “Consumer Rationality and Energy-Efficiency,” pp. 1.175-1.184, 1994 ACEEE Summer Study on Energy Efficiency in Buildings. Washington, D.C.: American Council for an Energy Efficient Economy.
Sanstad, A. H., W. M. Hanemann, and M. Auffhammer. 2006. “End-Use Energy Efficiency in a ‘Post-Carbon’ California Economy: Policy Issues and Research Frontiers,” Chapter 6 in
Behavioral Assumptions in Energy Efficiency Potential Studies
94
Managing Greenhouse Gas Emissions in California. January. The California Climate Change Center. Berkeley, Calif.: University of California Berkeley.
Sanne, C. 2002. “Willing Consumers – or Locked-in? Policies for a Sustainable Consumption,” Ecological Economics 42(2):273-287.
Sathaye, J. and S. Murtishaw. 2004. Market Failures, Consumer Preferences, and Transaction Costs in Energy Efficient Purchase Decisions. CEC-500-2005-020. Sacramento, Calif.: California Energy Commission.
Scargle, J. 1999. Publication Bias (The “File-Drawer Problem”) in Scientific Inference. Presented at the Sturrock Symposium, Stanford. March 20. http://arxiv.org/PS_cache/physics/pdf/9909/9909033v1.pdf
Schipper, L., R. B. Howarth, and R. Steiner. 1992. Energy Efficiency and Human Activity: Past Trends, Future Prospects. Cambridge: Cambridge University Press.
Schneider, A, and H. Ingram. 1990. “Behavioral Assumptions of Policy Tools,” The Journal of Politics 52(2):510-529.
Searle, J.D. 1995. The Construction of Social Reality. New York: The Free Press.
Sebold, F.D., A. Fields, L. Skumatz, S. Feldman, M. Goldberg, K. Keating, and J. Peters. 2001. “A Framework for Planning and Assessing Publicly Funded Energy Efficiency.” March 1. Report for Pacific Gas & Electric Company.
SeeLine Group, Inc. 2005. Technology Assessment Study and TRC Analysis. Revised. December. Toronto: Ontario Power Authority.
Shove, E. 1998. “Gaps, Barriers and Conceptual Chasms: Theories of Technology Transfer and Energy in Buildings.” Energy Policy 26(15):1105-1112.
Shove, E. 2003a. Comfort, Cleanliness, and Convenience: the Social Organization of Normality. Oxford and New York: Berg Publishers.
Shove, E. 2003b. “Changing Human Behaviour and Lifestyle: A Challenge for Sustainable Consumption.” August. http://www.psi.org.uk/ehb/docs/shove-changinghumanbehaviourandlifestyle-200308.pdf.
Shove, E. 2009. “The Rest of the Alphabet: Moving Beyond the ABCs,” oral presentation at the Restructuring Choice: Energy and Social Demand Workshop. 7-9 April. Oxford.
Shove, E. and H. Wilhite. 1999. “Energy Policy: What It Forgot and What It Might Yet Recognize,” pp.1-12, 1999 ECEEE Summer Study on Energy Efficiency. Stockholm: European Council for an Energy Efficient Economy.
Behavioral Assumptions in Energy Efficiency Potential Studies
95
Shui Bin and H. Dowlatabadi. 2005. “Consumer Lifestyle Approach to U.S. Energy Use and the Related CO2 Emissions.” Energy Policy 33:197–208.
Socolow, R. H. (ed.). 1978. Saving Energy in the Home: Princeton’s Experiments at Twin Rivers. Cambridge, Mass: Ballinger Press.
Sorrell, S. and H. Herring. 2009. Energy Efficiency and Sustainable Consumption: The Rebound Effect. Hampshire, U.K.: Palgrave.
*[SWEEP] Southwest Energy Efficiency Project. 2002. The New Mother Lode: The Potential for More Efficient Electricity Use in the Southwest. Report for the Hewlett Foundation Energy Series. Boulder, Colorado: Southwest Energy Efficiency Project.
Strauch, R.E. 1974. “‘Squishy’ Problems and Quantitative Methods.” P5303. Santa Monica, Calif.: RAND.
Stein, J. R. 1997a “Home Energy Rating Systems: Actual Use May Vary,” Home Energy September/October.
Stein, J. R. 1997b. Accuracy of Home Energy Rating Systems. . LBL-40394. Berkeley, Calif.: Lawrence Berkeley National Laboratory.
Stern, P. (ed.). 1985. Energy Efficiency in Buildings: Behavioral Issues. Washington, D.C.: National Research Council.
Stern, P. 1986. “Blind Spots in Policy Analysis: What Economics Doesn't Say About Energy Use,” Journal of Policy Analysis and Management 5(2):200-227.
Stern, P. C. 1992. “What Psychology Knows about Energy Conservation,” American Psychologist 47(2):1224-1232.
Stern, P. C. and G.T. Gardner. 1981. “Psychological Research and Energy Policy,” American Psychologist 36(4):329.242.
Strengers, Y. 2008. Comfort Expectations: The Impact of Demand Management Strategies in Australia, Building Research & Information 36(4):381-391.
Summit Blue Canada, Inc. 2005. Quick-Hit DR Programs: a Case Study of California’s 20-20 Program. Toronto: Ontario Power Authority.
TekMarket Works. 2004. The California Evaluation Framework. June. Project Number K2033910. San Francisco: California Public Utilities Commission. http://www.cee1.org/eval/db_pdf/413.pdf.
Thompson, M., H. Reichmuth, and H. G. Peach. 2008. “Laying the Foundation for Energy Efficiency Potential through Market Assessment,” pp. 5.305-5.311, 2008 ACEEE
Behavioral Assumptions in Energy Efficiency Potential Studies
96
Summer Study on Energy Efficiency in Buildings. Washington, D.C.: American Council for an Energy Efficient Economy.
Tiedemann, K., I. Sulyma, R. Sahota, and J.Habart. 2008. “Behavior and Potential Energy Savings in Business Establishments,” pp. 7.327-7.335, 2008 ACEEE Summer Study on Energy Efficiency in Buildings. Washington, D.C.: American Council for an Energy Efficient Economy.
Train, K. 1985. “Discount Rates in Consumers’ Energy-Related Decisions: A Review of the Literature,” Energy 10(12):1243-1253.
Tsurusaki, T., Y. Iwafune, Y. Shibata, C. Murakoshi, and H. Nakagami. 2006. “Actual Energy Consumption of Top-Runner Refrigerators in Japan,” 11pp., 2006 International Conference on Energy Efficiency in Domestic Appliances and Lighting. London.
Turner, C. and M. Frankel. 2008. Energy Performance of LEED® for New Construction Buildings. Prepared for U.S. Green Buildings Council. White Salmon and Vancouver, Wash.: New Buildings Institute.
Uitdenbogerd, D., C. Egmond, R.Jonkers, and G. Kok. 2007. “Energy-Related Intervention Success Factors: a Literature Review,” pp. 1847-1853, 2007 ECEEE Summer Study on Energy Efficiency. Stockholm: European Council for an Energy Efficient Economy.
Vaidya, P., T. McDougall, D. Eijadi, J. Douglas, and J. Steinbock. 2004. “What’s Wrong with Daylighting. Where it Goes Wrong and How Users Respond to Failure,” pp. 7.342-7.357, 2004 ACEEE Summer Study on Energy Efficiency in Buildings. Washington, D.C.: American Council for an Energy Efficient Economy.
Vaidya, P, T. McDougall, J. Steinbeck, J. Douglas, and D. Eijadi. 2005. “Making Daylighting Work: Learning from Failures to Improve the Design and Implementation Process,” pp. 563-570, 2005 ECEEE Summer Study on Energy Efficiency. Stockholm: European Council for an Energy Efficient Economy.
van den Bergh, J. 2008. “Environmental Regulation of Households: An Empirical Review of Economic and Psychological Factors,” Ecological Economics 66:559-574.
Vine, E. 1992. “Persistence of Energy Savings: What Do We Know and How Can It Be Ensured?”Energy 17(11):1073-1084.
Vine, E. and Diane F. 2006. “An Evaluation of Residential CFL Hours-Of-Use Methodologies and Estimates: Recommendations for Evaluators and Program Evaluators,” Energy and Buildings 38(12):1388-1394.
Vine, E, P. Craig, J. Cramer, T. Dietz, B. Hackett, D. Kowalczyk, and M. Levine. 1982. "The Applicability of Energy Models to Occupied Houses: Summer Electric Use in Davis," Energy - The International Journal 7(11): 909-925.

Behavioral Assumptions in Energy Efficiency Potential Studies
97
Vine, E., G. Jordan, J. H. Reed, and J. Dowd. 2006, “An Inside Look at a U.S. Department of Energy Impact Evaluation Framework for Deployment Programs,” LBNL-60124. Berkeley, Calif.: Lawrence Berkeley National Laboratory.
Vine, E., M. Kushler, and D. York. 2007. “Energy Myth Ten—Energy Efficiency Measures are Unreliable, Unpredictable, and Unenforceable,” pp. 265-287 (Chapter 11) in B.K. Sovacool and M.A. Brown (eds.), Energy and American Society – Thirteen Myths. New York: Springer.
Von Wieszäcker, E., A. Lovins, and L. Lovins. 1997. Factor 4: Doubling Wealth, Halving Resource Use. London: Earthscan.
Wackernagel, M., W.E. Rees, and P. Testemale. 1995. Our Ecological Footprint. Gabriola Island, B.C.: New Society Publishers.
Wilhite, H. 2007. “Will Efficient Technologies Save The World? A Call For New Thinking On The Ways That End-Use Technologies Affect Energy Using Practices,” pp. 23-30, ECEEE Summer Study on Energy Efficiency. Stockholm: European Council for an Energy Efficient Economy.
Wilhite, H., H. Nakagami, T. Masuda, and Y. Yamaga. 1996. “A Cross-Cultural Analysis of Household Energy Use Behavior in Japan and Norway,” Energy Policy 24(9):795-803.
Wilhite, H., E. Shove, L. Lutzenhiser, and W. Kempton. 2000. “Twenty Years of Energy Demand Management: We Know More About Individual Behavior But How Much Do We Really Know About Demand?” pp. 8.435-8.453, 2000 ACEEE Summer Study on Energy Efficiency in Buildings. Washington, D.C.: American Council for an Energy Efficient Economy.
Wilson, C. and H. Dowlatabadi. 2007. "Models Of Decision Making And Residential Energy Use," Annual Review of Environment and Resources 32(2):1-35.
Woods, J. 2006. “Fiddling with Thermostats: Energy Implications of Heating and Cooling Set Point Behavior,” pp. 7.279-7.287, 2006 ACEEE Summer Study on Energy Efficiency in Buildings. Washington, D.C.: American Council for an Energy Efficient Economy.
Wynne, B. 1984. “The Institutional Context of Science, Models, and Policy: The IIASA Energy Study,” Policy Sciences 17:277-320.
Xenergy, Inc. 2002. California Statewide Commercial Sector Energy Efficiency Potential Study. Final Report Study ID #SW039A. Prepared for Pacific Gas & Electric Company. Oakland, Calif.
98
Appendix A: Glossary
BAU – Business as Usual
CBECS – Commercial Building Energy Consumption Survey (EIA)
CEC – California Energy Commission
CEUS – California Commercial End Use Survey
CMUA – California Municipal Utilities Association
CPUC – California Public Utilities Commission
DEER – Database for Energy Efficient Resources (CEC, CPUC)
DR – Demand Response
DSM – Demand Side Management
EIA – Energy Information Administration (U.S. Department of Energy)
ESCO – Energy Service Company
GHG – Greenhouse gases
HVAC – Heating Ventilation and Air Conditioning
IOU – Investor Owned Utility
LEED – Leadership in Energy and Environmental Design
NAECA – National Appliance Energy Conservation Act
POU – Publicly Owned Utility
RASS – Residential Appliance Saturation Survey
RECS – Residential Energy Consumption Survey (EIA)
UEC – Unit Energy Consumption (average annual energy consumption for an end-use or device)