behavioral regulation and the modulation of information
TRANSCRIPT

HAL Id: hal-01219972https://hal.archives-ouvertes.fr/hal-01219972
Submitted on 23 Oct 2015
HAL is a multi-disciplinary open accessarchive for the deposit and dissemination of sci-entific research documents, whether they are pub-lished or not. The documents may come fromteaching and research institutions in France orabroad, or from public or private research centers.
L’archive ouverte pluridisciplinaire HAL, estdestinée au dépôt et à la diffusion de documentsscientifiques de niveau recherche, publiés ou non,émanant des établissements d’enseignement et derecherche français ou étrangers, des laboratoirespublics ou privés.
Behavioral Regulation and the Modulation ofInformation Coding in the Lateral Prefrontal and
Cingulate CortexMehdi Khamassi, René Quilodran, Pierre Enel, Peter Dominey, Emmanuel
Procyk
To cite this version:Mehdi Khamassi, René Quilodran, Pierre Enel, Peter Dominey, Emmanuel Procyk. Behavioral Regu-lation and the Modulation of Information Coding in the Lateral Prefrontal and Cingulate Cortex. Cere-bral Cortex, Oxford University Press (OUP), 2015, 25 (9), pp.3197-3218. �10.1093/cercor/bhu114�.�hal-01219972�

Khamassi et al. Adaptive control in prefrontal cortex
1
Behavioral regulation and the modulation of information coding in
the lateral prefrontal and cingulate cortex Mehdi Khamassi 1,2,3,4, René Quilodran 1,2,5, Pierre Enel 1,2, Peter F. Dominey 1,2, Emmanuel Procyk 1,2 1 Inserm, U846, Stem Cell and Brain Research Institute, 69500 Bron, France 2 Université de Lyon, Lyon 1, UMR-S 846, 69003 Lyon, France 3 Institut des Systèmes Intelligents et de Robotique, Université Pierre et Marie Curie-Paris 6,
F-75252, Paris Cedex 05, France 4 CNRS UMR 7222, F-75005, Paris Cedex 05, France 5 Escuela de Medicina, Departamento de Pre-clínicas, Universidad de Valparaíso, Hontaneda
2653, Valparaíso, Chile Running title Adaptive control in prefrontal cortex Keywords: reinforcement-learning, decision, feedback, adaptation, cingulate, reward, This is a preprint of the paper published in Cerebral Cortex (Oxford University Press) in 2014. Corresponding author: M.K. Institut des Systèmes Intelligents et de Robotique (UMR7222) CNRS - Université Pierre et Marie Curie Pyramide, Tour 55 - Boîte courrier 173 4 place Jussieu, 75252 Paris Cedex 05, France tel: + 33 1 44 27 28 85 fax: +33 1 44 27 51 45 email: [email protected]

Khamassi et al. Adaptive control in prefrontal cortex
2
Behavioral regulation and the modulation of information coding in the lateral prefrontal and cingulate cortex
M. Khamassi, R. Quilodran, P. Enel, P.F. Dominey, E. Procyk
To explain the high level of flexibility in primate decision-making, theoretical models often invoke
reinforcement-based mechanisms, performance monitoring functions, and core neural features
within frontal cortical regions. However, the underlying biological mechanisms remain unknown.
In recent models, part of the regulation of behavioral control is based on meta-learning principles,
e.g. driving exploratory actions by varying a meta-parameter, the inverse temperature, which
regulates the contrast between competing action probabilities. Here we investigate how
complementary processes between lateral prefrontal cortex (LPFC) and dorsal anterior cingulate
cortex (dACC) implement decision regulation during exploratory and exploitative behaviors.
Model-based analyses of unit activity recorded in these two areas in monkeys first revealed that
adaptation of the decision function is reflected in a covariation between LPFC neural activity and
the control level estimated from the animal's behavior. Second, dACC more prominently encoded a
reflection of outcome uncertainty useful for control regulation based on task monitoring. Model-
based analyses also revealed higher information integration before feedback in LPFC, and after
feedback in dACC. Overall the data support a role of dACC in integrating reinforcement-based
information to regulate decision functions in LPFC. Our results thus provide biological evidence on
how prefrontal cortical subregions may cooperate to regulate decision-making.
INTRODUCTION
When searching for resources, animals can adapt their choices by reference to the recent history
of successes and failures. This progressive process leads to improved predictions of future outcomes
and to the adjustment of action values. However, to be efficient, adaptation requires dynamic
modulations of behavioral control, including a balance between choices known to be rewarding
(exploitation), and choices with unsure, but potentially better, outcome (exploration).
The prefrontal cortex is required for the organization of goal-directed behavior (Miller and Cohen
2001; Wilson et al. 2010) and appears to play a key role in regulating exploratory behaviors (Daw N.
D. et al. 2006; Cohen J. D. et al. 2007; Frank et al. 2009). The lateral prefrontal cortex (LPFC) and the

Khamassi et al. Adaptive control in prefrontal cortex
3
dorsal anterior cingulate cortex (dACC, or strictly speaking the midcingulate cortex, (Amiez et al.
2013)) play central roles, but it is unclear which mechanisms underlie the decision to explore and how
these prefrontal subdivisions participate.
Computational solutions often rely on the meta-learning framework, where shifting between
different control levels (e.g. shifting between exploration and exploitation) is achieved by dynamically
tuning meta-parameters based on measures of the agent’s performance (Doya 2002; Ishii et al. 2002;
Schweighofer and Doya 2003). When applied to models of prefrontal cortex’s role in exploration
(McClure et al. 2006; Cohen J. D. et al. 2007; Krichmar 2008; Khamassi et al. 2011), this principle
predicts that the expression of exploration is associated with decreased choice-selectivity in the LPFC
(flat action probability distribution producing stochastic decisions) while exploitation is associated
with increased selectivity (peaked probability distribution resulting in a winner-take-all effect).
However, such online variations during decision-making have yet to be shown experimentally.
Moreover, current models often restrict the role of dACC to conflict monitoring (Botvinick et al. 2001)
neglecting its involvement in action valuation (MacDonald et al. 2000; Kennerley et al. 2006;
Rushworth and Behrens 2008; Seo and Lee 2008; Alexander W.H. and Brown 2010; Kaping et al.
2011). dACC activity shows correlates of adjustment of action values based on measures of
performance such as reward prediction errors (Holroyd and Coles 2002; Amiez et al. 2005;
Matsumoto et al. 2007; Quilodran et al. 2008), outcome history (Seo and Lee 2007), and error-
likelihood (Brown and Braver 2005). Variations of activities in dACC and LPFC between exploration
and exploitation suggest that both structures contribute to the regulation of exploration (Procyk et al.
2000; Procyk and Goldman-Rakic 2006; Landmann et al. 2007; Rothe et al. 2011).
The present work assessed the complementarity of dACC and LPFC in behavioral regulation. We
previously developed a neurocomputational model of the dACC-LPFC system to synthesize the data
reviewed above (Khamassi et al. 2011; Khamassi et al. 2013). One important feature of the model was
to include a regulatory mechanism by which the control level is modulated as a function of changes in
the monitored performance. As reviewed above such a regulatory mechanism should lead to changes
in prefrontal neural selectivity. This work thus generated experimental predictions that are tested
here on actual neurophysiological data.
We recorded LPFC single-unit activities and made comparative model-based analyses with these
data and dACC recordings that had previously been analyzed only at the time of feedback (Quilodran
et al. 2008). We show that information related to different model variables (reward prediction errors,
action values, and outcome uncertainty) are multiplexed in different trial epochs both in dACC and
LPFC, with higher integration of information before the feedback in LPFC, and after the feedback in
dACC. Moreover LPFC activity displays higher mutual information with the animal’s choice than dACC,
Khamassi et al. Adaptive control in prefrontal cortex
4
supporting its role in action selection. Importantly, as predicted by prefrontal cortical models, we
observe that LPFC choice selectivity co-varies with the control level measured from behavior. Taken
together with recent data (Behrens et al. 2007; Rushworth and Behrens 2008), our results suggest
that the dACC-LPFC diad is implicated in the online regulation of learning mechanisms during
behavioral adaptation, with dACC integrating reinforcement-based information to regulate decision
functions in LPFC.
MATERIAL & METHODS
Monkey housing, surgical, electrophysiological and histological procedures were carried out
according to the European Community Council Directive (1986) (Ministère de l’Agriculture et de la
Forêt, Commission nationale de l’expérimentation animale) and Direction Départementale des
Services Vétérinaires (Lyon, France).
Experimental set up. Two male rhesus monkeys (monkeys M and P) were included in this
experiment. During recordings animals were seated in a primate chair (Crist Instrument Company
Inc., USA) within arm’s reach of a tangent touch-screen (Microtouch System) coupled to a TV
monitor. In the front panel of the chair, an opening allowed the monkey to touch the screen with one
hand. A computer recorded the position and accuracy of each touch. It also controlled the
presentation via the monitor of visual stimuli (colored shapes), which served as visual targets
(CORTEX software, NIMH Laboratory of Neuropsychology, Bethesda, Maryland). Eye movements
were monitored using an Iscan infrared system (Iscan Inc., USA).
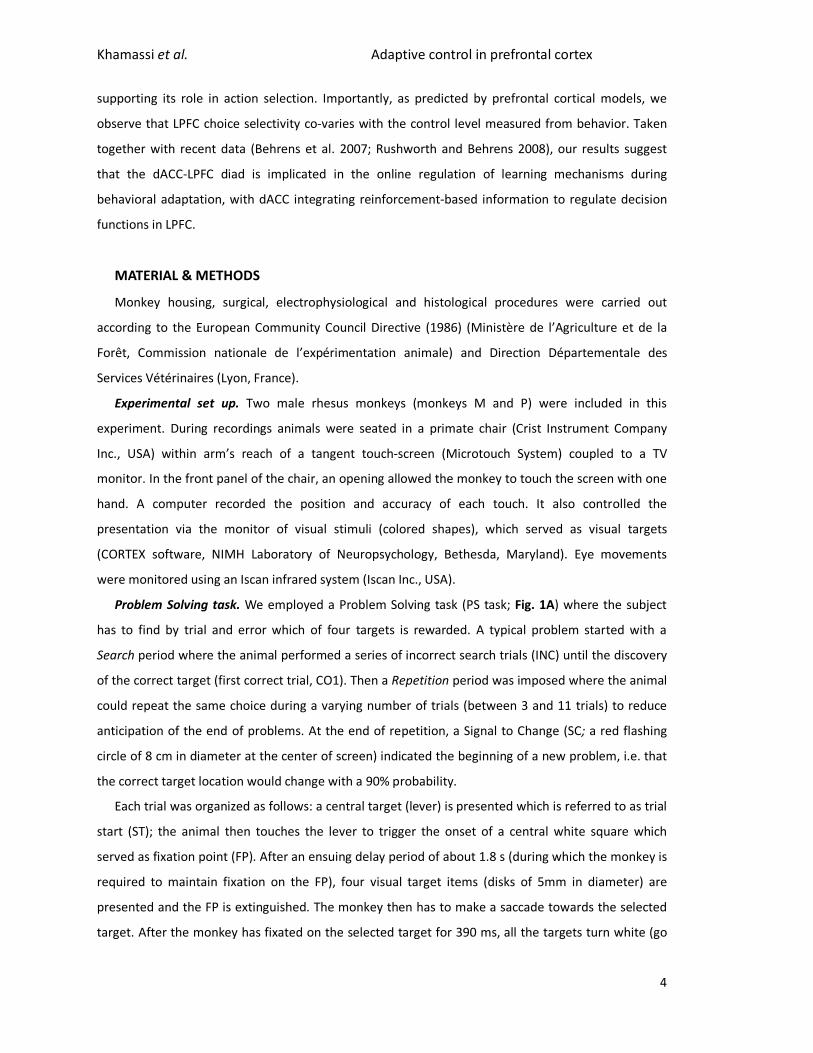
Problem Solving task. We employed a Problem Solving task (PS task; Fig. 1A) where the subject
has to find by trial and error which of four targets is rewarded. A typical problem started with a
Search period where the animal performed a series of incorrect search trials (INC) until the discovery
of the correct target (first correct trial, CO1). Then a Repetition period was imposed where the animal
could repeat the same choice during a varying number of trials (between 3 and 11 trials) to reduce
anticipation of the end of problems. At the end of repetition, a Signal to Change (SC; a red flashing
circle of 8 cm in diameter at the center of screen) indicated the beginning of a new problem, i.e. that
the correct target location would change with a 90% probability.
Each trial was organized as follows: a central target (lever) is presented which is referred to as trial
start (ST); the animal then touches the lever to trigger the onset of a central white square which
served as fixation point (FP). After an ensuing delay period of about 1.8 s (during which the monkey is
required to maintain fixation on the FP), four visual target items (disks of 5mm in diameter) are
presented and the FP is extinguished. The monkey then has to make a saccade towards the selected
target. After the monkey has fixated on the selected target for 390 ms, all the targets turn white (go

Khamassi et al. Adaptive control in prefrontal cortex
5
signal), indicating that the monkey can touch the chosen target. Targets turn grey at touch for 600ms
and then switch off. At offset, a juice reward is delivered after a correct touch. In the case of an
incorrect choice, no reward is given, and in the next trial the animal can continue his search for the
correct target. A trial is aborted in case of a premature touch or a break in eye fixation.
Behavioral data. Performance in search and repetition periods was measured using the average
number of trials performed until discovery of the correct target (including first correct trial) and the
number of trials performed to repeat the correct response three times, respectively. Different types
of trials are defined in a problem. During search the successive trials were labeled by their order of
occurrence (indices: 1, 2, 3, …, until the first correct trial). Correct trials were labeled CO1, CO2, … and
COn. Arm reaction times and movement times were measured on each trial. Starting and ending
event codes defined each trial.
Series of problems are grouped in sessions. A session corresponds to one recording file that
contain data acquired for several hours (during behavioral sessions) to several tens of minutes (during
neurophysiological recordings corresponding to one site and depth).
Electrophysiological recordings. Monkeys were implanted with a head-restraining device, and a
magnetic resonance imaging-guided craniotomy was performed to access the prefrontal cortex. A
recording chamber was implanted with its center placed at stereotaxic anterior level A+31. Neuronal
activity was recorded using epoxy-coated tungsten electrodes. Recording sites labeled dACC covered
an area extending over about 6 mm (anterior to posterior), in the dorsal bank and fundus of the
anterior part of the cingulate sulcus, at stereotaxic levels superior to A+30 (Fig. 1B). This region is at
the rostral level of the mid-cingulate cortex as defined by Vogt and colleagues (Vogt et al. 2005).
Recording sites in LPFC were located mostly on the posterior third of the principal sulcus.
Data analyses
All analyses were performed using Matlab (The Mathworks, Natick, MA).
Theoretical model for model-based analysis. We compared the ability of several different
computational models to fit trial-by-trial choices made by the animals. The aim was to select the best
model to analyze neural data. The models tested (see list below) were designed to evaluate which
among several computational mechanisms were crucial to reproduce monkey behavior in this task.
The mechanisms are:
a) Elimination of non-rewarded targets tested by the animal during the search period. This
mechanism could be modeled in many different ways, e.g. using Bayesian models or
reinforcement learning models. In order to keep our results comparable and includable within
the framework used by previous similar studies (e.g. Matsumoto et al., 2007; Seo and Lee, 2009;
Kennerley and Walton, 2011), we used reinforcement learning models (which would work with

Khamassi et al. Adaptive control in prefrontal cortex
6
high learning rates – i.e. close to 1 – in this task) while noting that this would be equivalent to
models performing logical elimination of non-rewarded targets or models using a Bayesian
framework for elimination. This mechanism is included in Models 1-10 in the list below.
b) Progressive forgetting that a target has already been tested. This mechanism is included in
Models 2-7 and 9-10.
c) Reset after the Signal to Change. This would represent information about the task structure and
is included in Models 3-12. Among these models, some (i.e. Models 4,6-10) also tend not to
choose the previously rewarded target (called ‘shift’ mechanism), and some (i.e. Models 5-10)
also include spatial biases for the first target choice within a problem (called ‘bias’ mechanism).
d) Change in the level of control from search to repetition period (after the first correct trial). This
would represent other information about the task structure and is included in Models 9 and 10
(i.e. GQLSB2β and SBnoA2β).
List of tested models:
1. Model QL (Q-learning)
We first tested a classical Q-learning (QL) algorithm which implements action valuation based on
standard reinforcement learning mechanisms (Sutton and Barto 1998). The task involving 4 possible
targets on the touch screen (upper-left: 1, upper-right: 2, lower-right: 3, lower-left: 4, Fig. 1C), the
model had 4 possible action values (i.e. Q1, Q2, Q3 and Q4 corresponding to the respective values
associated with choosing target 1, 2, 3 and 4 respectively).
At each trial, the probability of choosing target a was computed by a Boltzmann softmax rule for
action selection:
tβQ
tβQ=tP
bb
aa exp
exp (1)
where the inverse temperature meta-parameter β (0 < β) regulates the exploration level. A small β
leads to very similar probabilities for all targets (flat probability distribution) and thus to an
exploratory behavior. A large β increases the contrast between the highest value and the others
(peaked probability distribution), and thus produces an exploitative behavior.
At the end of the trial, after choosing target ai, the corresponding value is compared with the
presence/absence of reward so as to compute a Reward Prediction Error (RPE) (Schultz et al. 1997):
tQtrt a )1()1( (2)
where r(t) is the reward function modeled as being equal to 1 at the end of the trial in the case of
success, and -1 in the case of failure. The reward prediction error signal δ(t) is then used to update
the value associated to the chosen target:

Khamassi et al. Adaptive control in prefrontal cortex
7
)1(1 tα+tQtQ aa (3)
where α is the learning rate. Thus the QL model employs 2 free meta-parameters: α and β.
2. Model GQL (Generalized Q-learning)
We also tested a generalized version of Q-learning (GQL) (Barraclough et al. 2004; Ito and Doya
2009) which includes a forgetting mechanism by also updating values associated to each non chosen
target b according to the following equation:
)(1)()1( 0 tQQtQtQ bbb (4)
where κ is a third meta-parameter called the forgetting rate 10 , and Q0 is the initial Q-value.
3. Model GQLnoSnoB (GQL with reset of Q values at each new problem; no shift, no bias)
Since animals are over-trained on the PS task, they tend to learn the task structure: the
presentation of the Signal to Change (SC) on the screen is sufficient to let them anticipate that a new
problem will start and that most probably the correct target will change. In contrast, the two above-
mentioned reinforcement learning models tend to repeat previously rewarded choices. We thus
tested an extension of these models where the values associated to each target are reset to [0 0 0 0]
at the beginning of each new problem (Model GQLnoSnoB).
4. Model GQLSnoB (GQL with reset including shift in previously rewarded target; no bias)
We also tested a version of the latter model where, in addition, the value associated to the
previously rewarded target has a probability PS of being reset to 0 at the beginning of the problem, PS
being the animal’s average probability of shifting from the previously rewarded target as measured
from the previous session 95.0P85.0 S (Fig. 2A- middle). This model including the shifting
mechanism is called GQLSnoB and has 3 free meta-parameters.
5. Model GQLBnoS (GQL with reset based on spatial biases; no shift)
In the fifth tested model (Model GQLBnoS), instead of using such a shifting mechanism, target Q-
values are reset to values determined by the animal’s spatial biases measured during search periods
of the previous session; for instance, if during the previous session, the animal started 50% of search
periods by choosing target 1, 25% by choosing 2, 15% by choosing target 3 and the rest of the time
by choosing target 4, target values were reset to [θ1 ; θ2 ; θ3 ; (1-θ1-θ2-θ3)] where θ1=0.5, θ2=0.25 and
θ3=0.15 at each new search of the next session. In this manner, Q-values are reset using a rough
estimate of choice variance during the previous session. These 3 spatial bias parameters are not
considered as free meta-parameters since they were always determined based on the previous
behavioral session because they were found to be stable across sessions for each monkey (Fig. 2A-
right).
6. Model GQLSB (GQL with reset including shift in previously rewarded target and spatial biases)

Khamassi et al. Adaptive control in prefrontal cortex
8
We also tested a model which combines both shifting mechanism and spatial biases (Model
GQLSB ) and thus has 3 free meta-parameters.
7. Model SBnoA (Shift and Bias but the learning rate α is fixed to 1)
Since the reward schedule is deterministic (i.e. choice of the correct target provides reward with
probability 1), a single correct trial is sufficient for the monkey to memorize which target is rewarded
in a given problem. We thus tested a version of the previous model where elimination of non-
rewarded target is done with a learning rate α fixed to 1 – i.e. no degree of freedom in the learning
rate in contrast with Model GQLSB. This meta-parameter is usually set to a low value (i.e. close to 0)
in the Reinforcement Learning framework to enable progressive learning of reward contingencies
(Sutton and Barto 1998). With α set to 1, the model SBnoA systematically performs sharp changes of
Q-values after each outcome, a process which could be closer to working memory mechanisms in the
prefrontal cortex (Collins and Frank 2012). All other meta-parameters are similar as in GQLSB,
including the forgetting mechanism (Equation 4) which is considered to be not specific to
Reinforcement Learning but also valid for Working Memory (Collins and Frank, 2012). Model SBnoA
has 2 free meta-parameters.
8. Model SBnoF (Shift and Bias but no α and no Forgetting)
To verify that the forgetting mechanism was necessary, we tested a model where both α and κ are
set to 1. This model has thus only 1 meta-parameter: β.
9. Model GQLSB2β (with distinct exploration meta-parameters during search and repetition
trials: resp. βS and βR)
To test the hypothesis that monkey behavior in the PS Task can be best explained by two distinct
control levels during search and repetition periods, instead of using a single meta-parameter β for all
trials, we used two distinct meta-parameters βS and βR so that the model used βS in Equation 1
during search trials and βR in Equation 1 during repetition trials. We tested these distinct search and
repetition βS and βR meta-parameters in Model GQLSB2β which thus has 4 free meta-parameters
compared to 3 in Model GQLSB.
10. Model SBnoA2β (with distinct exploration meta-parameters during search and repetition
trials: resp. βS and βR)
Similarly to the previous model, we tested a version of Model SBnoA which includes two distinct
βS and βR meta-parameters for search and repetition periods. Model SBnoA2β thus has 3 free
meta-parameters.
11. and 12. Control models: ClockS (Clockwise search + repetition of correct target); RandS
(Random search + repetition of correct target)

Khamassi et al. Adaptive control in prefrontal cortex
9
We finally tested 2 control models to test the contribution of the value updating mechanisms
used in the previous models for the elimination of non-rewarded target (i.e. Equation 3 with α used
as a free meta-parameter in model GQLSB or set to 1 in Model SBnoA). Model ClockS replaces such
mechanism by performing systematic clockwise searches, starting from the animal’s favorite target –
as measured in the spatial bias –, instead of choosing targets based on their values, and repeats the
choice of the rewarded target once it finds it. Model RandS performs random searches and repeats
choices of the rewarded target once it finds it.
Theoretical model optimization. To compare the ability of models in fitting monkeys’ behavior
during the task, (1) we first separated the behavioral data into 2 datasets so as to optimize the
models on the Optimization dataset (Opt) and then perform an out-of-sample test of these models
on the Test dataset (Test), (2) for each model, we then estimated the meta-parameter set which
maximized the log-likelihood of monkeys’ trial-by-trial choices in the Optimization dataset given the
model, (3) we finally compared the scores obtained by the models with different criteria: maximum
log-likelihood (LL) and percentage of monkeys’ choice predicted (%) on Opt and Test datasets, BIC,
AIC, Log of posterior probability of models given the data and given priors over meta-parameters
(LPP).
1. Separation of optimization (Opt) and test (Test) datasets
We used a cross-validation method by optimizing models’ meta-parameters on 4 behavioral
sessions (2 per monkey concatenated into a single block of trials per monkey in order to optimize a
single meta-parameter set per animal; 4031 trials) of the PS task, and then out of sample testing
these models with the same meta-parameters on 49 other sessions (57336 trials). The out of sample
test was performed to test models’ generalization ability and to validate which model is best without
complexity issues.
2. Meta-parameter estimation
The aim here was to find for each model M the set of meta-parameters θ which maximized the
log-likelihood LL of the sequence of monkey choices in the Optimization dataset D given M and θ:
,maxarg MDPLogopt (5)
,max MDPLogLLopt (6)
We searched for each model’s LLopt and θopt on the Optimization dataset with two different
methods:

Khamassi et al. Adaptive control in prefrontal cortex
10
We first sampled a million different meta-parameters sets (drawn from prior distributions over
meta-parameters such that α,κ are in [0;1], β,βS,βR are in -10log([0;1])). We stored the LLopt score
obtained for each model and the corresponding meta-parameter set θopt.
We then performed another meta-parameter search through a gradient-descent method using
the fminsearch function in Matlab launched at multiple starting points: we started the function from
all possible combinations of meta-parameters in α,κ in {0.1;0.5;0.9}, β,βS,βR in {1;5;35}. If this method
gave a better LL score for a given model, we stored it as well as the corresponding meta-parameter
set. Otherwise, we kept the best LL score and the corresponding meta-parameter set obtained with
the sampling method for this model.
3. Model comparison
In order to compare the ability of the different models to accurately fit monkeys’ behavior in the
task, we used different criteria. As typically done in the literature, we first used the maximized log-
likelihood obtained for each model on the Optimization dataset (LLopt) to compute the Bayesian
Information Criterion (BICopt) and Akaike Information Criterion (AICopt). We also looked at the
percentage of trials of the Optimization dataset where each model accurately predicts monkeys’
choice (%opt). We performed likelihood ratio tests to compare nested models (e.g. Model SBnoF and
Model SBnoA).
To test models’ generalization ability and to validate which model is best without complexity
issues, we additionally compared models’ log-likelihood on the Test dataset given the meta-
parameters estimated on the Optimization dataset (LLtest), as well as models’ percentage of trials of
the Test dataset where the model accurately predicts monkeys’ choice given the meta-parameters
estimated on the Optimization dataset (%test).
Finally, because comparing the maximal likelihood each model assigns to data can result in
overfitting, we also computed an estimation of the log of the posterior probability over models on
the Optimization dataset (LPPopt) estimated with the meta-parameter sampling method previously
performed (Daw N.D. 2011). To do so, we hypothesized a uniform prior distribution over models
P(M); we also considered a prior distribution for the meta-parameters given the models P(θ|M),
which was the distributions from which the meta-parameters were drawn during sampling. With this
choice of priors and meta-parameter sampling, LPPopt can be written as:
N
iiopt MDP
NLogdMDPLogDMPLogLPP
1
,1,
(7)
Khamassi et al. Adaptive control in prefrontal cortex
11
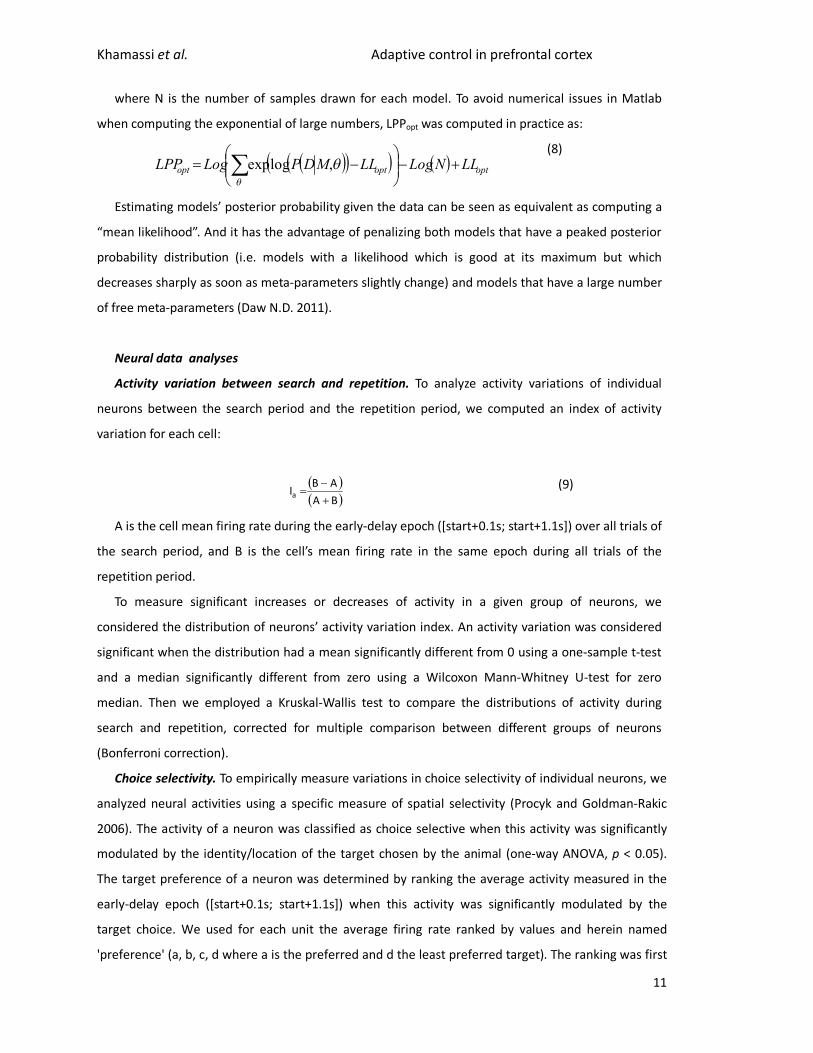
where N is the number of samples drawn for each model. To avoid numerical issues in Matlab
when computing the exponential of large numbers, LPPopt was computed in practice as:
optoptopt LLNLogLLMDPLogLPP
,logexp (8)
Estimating models’ posterior probability given the data can be seen as equivalent as computing a
“mean likelihood”. And it has the advantage of penalizing both models that have a peaked posterior
probability distribution (i.e. models with a likelihood which is good at its maximum but which
decreases sharply as soon as meta-parameters slightly change) and models that have a large number
of free meta-parameters (Daw N.D. 2011).
Neural data analyses
Activity variation between search and repetition. To analyze activity variations of individual
neurons between the search period and the repetition period, we computed an index of activity
variation for each cell:
BA
ABIa
(9)
A is the cell mean firing rate during the early-delay epoch ([start+0.1s; start+1.1s]) over all trials of
the search period, and B is the cell’s mean firing rate in the same epoch during all trials of the
repetition period.
To measure significant increases or decreases of activity in a given group of neurons, we
considered the distribution of neurons’ activity variation index. An activity variation was considered
significant when the distribution had a mean significantly different from 0 using a one-sample t-test
and a median significantly different from zero using a Wilcoxon Mann-Whitney U-test for zero
median. Then we employed a Kruskal-Wallis test to compare the distributions of activity during
search and repetition, corrected for multiple comparison between different groups of neurons
(Bonferroni correction).
Choice selectivity. To empirically measure variations in choice selectivity of individual neurons, we
analyzed neural activities using a specific measure of spatial selectivity (Procyk and Goldman-Rakic
2006). The activity of a neuron was classified as choice selective when this activity was significantly
modulated by the identity/location of the target chosen by the animal (one-way ANOVA, p < 0.05).
The target preference of a neuron was determined by ranking the average activity measured in the
early-delay epoch ([start+0.1s; start+1.1s]) when this activity was significantly modulated by the
target choice. We used for each unit the average firing rate ranked by values and herein named
'preference' (a, b, c, d where a is the preferred and d the least preferred target). The ranking was first

Khamassi et al. Adaptive control in prefrontal cortex
12
used for population data and structure comparisons. For each cell, the activity was normalized to the
maximum and minimum of activity measured in the repetition period (with normalized activity =
[activity - min]/[max - min]).
Second, to study changes in choice selectivity (tuning) throughout trials during the task, we used
for each unit the average firing rate ranked by values (a, b, c, d). We then calculated the norm of a
preference vector using the method of (Procyk and Goldman-Rakic 2006) which is equivalent to
computing the Euclidean distance within a factor of 2 : We used an arbitrary arrangement in a
square matrix ቂܽ ܾܿ ݀
ቃ to calculate the vector norm:
dbcaH and dcbaV
22 VHnorm
(10)
For each neuron, the norm was divided by the global mean activity of the neuron (to exclude the
effect of firing rate in this measure: preventing a cell A that has a higher mean firing rate than a cell B
to have a higher choice selectivity norm when they are both equally choice selective).
The value of the preference vector norm was taken as reflecting the strength of choice coding of
the cell. A norm equal to zero would reflect equal activity for the four target locations. This objective
measure allows the extraction of one single value for each cell, and can be averaged across cells.
Finally, to study variations in choice selectivity between search and repetition periods, we computed
an index of choice selectivity variation for each cell:
DC
CDIs
(11)
where C is the cell’s choice selectivity norm during search and D is the cell’s choice selectivity norm
during repetition.
To assess significant variations of choice selectivity between search and repetition in a given group
of neurons (e.g. dACC or LPFC), we used: a t-test to verify whether the mean was different from zero;
a Wilcoxon Mann-Whitney U- test to verify whether the median was different from zero; then we
used a Kruskal-Wallis test to compare the distributions of choice selectivity during search and
repetition, corrected for multiple comparison between different groups of neurons (Bonferroni
correction).
To assess whether variations of choice selectivity between search and repetition depended on the
exploration level β measured in the animal’s behavior by means of the model, we cut sessions into
two groups: those where β was smaller than the median of β values (i.e. 5), and those where β was
larger than this median. Thus, in these analyses, repetition periods of a session with β < 5 will be
considered a relative exploration, and repetition periods of a session with β > 5 will be considered a
relative exploitation. We then performed two-way ANOVAs (β x task phase) and used a Tukey HSD

Khamassi et al. Adaptive control in prefrontal cortex
13
post hoc test to determine the direction of the significant changes in selectivity with changing
exploration levels, tested at p=0.05.
Model-based analysis of single-unit data. To test whether single units encoded information
related to model computations, we used the following model variables as regressors of trial-by-trial
activity: the reward prediction error [δ], the action value [Q] associated to each target and the
outcome uncertainty [U]. The latter is a performance monitoring measure which assesses the
entropy of the probability over the different possible outcomes (i.e. reward r versus no reward r )
at the current trial t given the set T of remaining targets:
TrPTrPTrPTrPtU loglog . At the beginning of a new problem, when there are 4
possible targets, U starts at a low value since there is 75% chance of making an error. U increases trial
after trial during the search period. It is maximal when there remain 2 possible targets because there
is 50% chance of making an error. Then U drops after either the first rewarded trial or the third error
trial – because the fourth target is necessarily the rewarded one – and remains at zero during the
repetition period. We decided to use a regressor with this pattern of change because it is somewhat
comparable to the description of changes in frontal activity previously observed during the PS task
(Procyk et al., 2000; Procyk and Goldman-Rakic, 2006).
We used U as the simplest possible parameter-free performance monitoring regressor for neural
activity. This was done in order to test whether dACC and LPFC single-unit could reflect performance
monitoring processes in addition to responding to feedback and tracking target values. But we note
that the profile of U in this task would not be different from other performance monitoring measures
such as the outcome history that we previously used in our computational model for dynamic control
regulation in this task (Khamassi et al. 2011), or such as the vigilance level in the model of Dehaene
and Changeux (Dehaene et al. 1998) which uses error and correct signals to update a regulatory
variable (increased after errors and decreased after correct trials). We come back to possible
interpretations of neural correlates of U in the discussion.
To investigate how neural activity was influenced by action values [Q], reward prediction errors [δ]
as well as the outcome uncertainty [U], we performed a multiple regression analysis combined with a
bootstrapping procedure, focusing our analyses on spike rates during a set of trial epochs (Fig. 1C):
pre-start (0.5 s before trial start); post-start (0.5 s after trial start); pre-target (0.5 s before target
onset); post-target (0.5 s after target onset); the action epoch defined as pre-touch (0.5 s before
screen touch); pre-feedback (0.5 s before feedback onset); early-feedback (0.5 s after feedback
onset); late-feedback (1.0 s after feedback period); inter-trial-interval (ITI; 1.5 s after feedback onset).
The spike rate y(t) during each of these intervals in trial t was analyzed using the following
multiple linear regression model:

Khamassi et al. Adaptive control in prefrontal cortex
14
)()()()()()()( 65443322110 tUttQtQtQtQty (13)
where 4...1),( ktQk are the action values associated to the four possible targets at time t, δ(t)
is the reward prediction error, U(t) is the outcome uncertainty, and n...1i,i are the regression
coefficients.
δ, Q and U were all updated once in each trial. δ was updated at the time of feedback, so that
regression analyses during pre-feedback epochs were done using δ from the previous trial, while
analyses during post-feedback epochs used the updated δ. Q and U were updated at the end of the
trial so that regression analyses in all trial epochs were done using the Q-values and U value of the
current trial.
Note that the action value functions of successive trials are correlated, because they are updated
iteratively, and this violates the independence assumption in the regression model. Therefore, the
statistical significance for the regression coefficients in this model was determined by a permutation
test. For this, we performed a shuffled permutation of the trials and recalculated the regression
coefficients for the same regression model, using the same meta-parameters of the model obtained
for the unshuffled trials. This shuffling procedure was repeated 1000 times (bootstrapping method),
and the p value for a given independent variable was determined by the fraction of the shuffles in
which the magnitude of the regression coefficient from the shuffled trials exceeded that of the
original regression coefficient (Seo and Lee 2009), corrected for multiple comparisons with different
model variables in different trial epochs (Bonferroni correction).
To assess the quality of encoding of action value information by dACC and LPFC neurons, we also
performed a multiple regression analysis on the activity of each neuron related to Q-values after
excluding trials where the preferred target of the neuron was chosen by the monkey. This analysis
was performed to test whether the activity of such neurons still encodes Q-values outside trials
where the target is selected. Similarly, to evaluate the quality of reward prediction error encoding,
we performed separate multiple regression analyses on correct trials only versus error trials only.
This analysis was performed to test whether the activity of such neurons quantitatively discriminate
between different amplitudes of positive reward prediction errors and between different amplitudes
of negative reward prediction errors. In both cases, the significance level of the multiple regression
analyses was determined with a bootstrap method and a Bonferroni correction for multiple
comparisons.
Finally, to measure possible collinearity issues between model variables used as regressors of
neural activity, we used Brian Lau’s Collinearity Diagnostics Toolbox for Matlab
(http://www.subcortex.net/research/code/collinearity-diagnostics-matlab-code (Lau 2014)). We
extracted the variation inflation factors (VIF) computed with the coefficient of determination obtained

Khamassi et al. Adaptive control in prefrontal cortex
15
when each regressor was expressed as a function of the other regressors. We also computed the
condition indexes (CONDIND) and variance decomposition factors (VDF) obtained in the same
analysis. A strong collinearity between regressors was diagnosed when CONDIND ≥ 30 and more than
two VDFs > 0.5. A moderate collinearity was diagnosed when CONDIND ≥ 10 and more than two VDFs
> 0.5. CONDIND ≤ 10 indicated a weak collinearity.
Principal component analysis. To determine the degree to which single-unit activity segregated
or integrated information about model variables, we performed a Principal Component Analysis
(PCA) on the 3 correlation coefficients 6...4, ii obtained with the multiple regression analysis
and relating neural activity with the 3 main model variables (reward prediction error δ, outcome
uncertainty U, and the action value Qk associated to the animal’s preferred target k). For each trial
epoch, we pooled the coefficients obtained for all neurons in correlation with these model variables.
Each principal component being expressed as a linear combination of the vector of correlation
coefficients of neuron activities with these three model variables, the contribution of different model
variables to each component gives an idea as to which extent cell activity is explained by an
integrated contribution of multiple model variables. For instance, if a PCA on cell activity in the early-
delay period produces three principal components that are each dependent on a different single
model variable (e.g. PC1 = 0.95Q + 0.01δ + 0.04U; PC2 = 0.1Q + 0.8δ + 0.1U; PC3 = 0.05Q + 0.05δ +
0.9U), then activity variations are best explained by separate influences from the information
conveyed by the model variables. If in contrast, the PCA produces principal components which
strongly depend on multiple variables (e.g. PC1 = 0.5Q + 0.49δ + 0.01U; PC2 = 0.4Q + 0.1δ + 0.5U;
PC3 = 0.2Q + 0.4δ + 0.4U), then variations of the activities are best explained by an integrated
influence of such information (see Supplementary Figure S1 for illustration of different Principal
Components resulting from artificially generated data showing different levels of integration
between model variables).
We compared the normalized absolute values of the coefficients of the three principal
components so that a coefficient close to 1 denotes a strong correlation while a coefficient close to 0
denotes no correlation. To quantify the integration of information about different model variables in
single-unit activities, for each neuron k, we computed an entropy-like index (ELI) of sharpness of
encoding of different model variables based on the distributions of regression coefficients between
cell activities and model variables:
i
iik ccELI log (14)
Where ci is the absolute value of the z-scored correlation strength ρi with model variable i. A
neuron with activity correlated with different model variables with similar strengths will have a high

Khamassi et al. Adaptive control in prefrontal cortex
16
ELI; a neuron with activity highly correlated with only one model variable will have a low ELI. We
compared the distributions of ELIs between dACC and LPFC in each trial epoch using a Kruskal-Wallis
test.
Finally, we estimated the contribution of each model variable to neural activity variance in each
epoch and compared it between dACC and LPFC. To do so, we first normalized the coefficients for
each principal component in each epoch. These coefficients being associated to three model
variables Q, δ and U, this provided us with a contribution of each model variable to each principal
component in each epoch. We then multiplied them by the contribution of each principal
component to the global variance in neural activity in each epoch. The result constituted a
normalized contribution of each model variable to neural activity variance in each epoch. We finally
computed the entropy-like index (ELI) of these contributions. We compared the set of epoch-specific
ELI between dACC and LPFC with a Kruskal-Wallis test.
Mutual information. We measured the mutual information between monkey's choice at each
trial and the firing rate of each individual recorded neuron during the early-delay epoch ([ST+0.1s;
ST+1.1s]). The mutual information )R;S(I was estimated by first computing a confusion matrix (Quian
Quiroga and Panzeri 2009), relating at each trial t, the spike count from the unit activity in the early-
delay epoch (as “predicting response” R) and the target chosen by the monkey (i.e. 4 targets as
“predicted stimulus” S). Since neuronal activity was recorded during a finite number of trials, not all
possible response outcomes of each neuron to each stimulus (target) have been sufficiently sampled.
This is called the “limited sampling bias” which can be overcome by subtracting a correction term
from the plug-in estimator of the mutual information (Panzeri et al. 2007). Thus we subtracted the
Panzeri Treves (PT) correction term (Treves and Panzeri 1995) from the estimated mutual information
)R;S(I :
ss RR
NRSIBIAS 11
)2ln(21;
(15)
Where N is the number of trials during which the unit activity was recorded, R is the number of
relevant bins among the M possible values taken by the vector of spike counts and computed by the
“bayescount” routine provided by (Panzeri and Treves 1996), and SR is the number of relevant
responses to stimulus (target) s.
Such measurement of information being reliable only if the activity was recorded during a
sufficient number of trials per stimulus presentation, we restricted this analysis to units that verified
the following condition (Panzeri et al. 2007):
4R/NS (16)
Where SN is the minimum number of trials per stimulus (target).

Khamassi et al. Adaptive control in prefrontal cortex
17
Finally, to verify that such a condition was sufficiently restrictive to exclude artifactual effects, for
each considered neuron we constructed 1000 pseudo response arrays by shuffling the order of trials
at fixed target stimulus, and we recomputed each time the mutual information in the same manner
(Panzeri et al. 2007). Then we verified that the average mutual information obtained with such
shuffling procedure was close to the PT bias correction term computed with Equation 15 (Panzeri
and Treves 1996).
RESULTS
Previous studies have emphasized the role of LPFC in cognitive control and dACC in adjustment of
action values based on measures of performance such as reward prediction errors, error-likelihood
and outcome history. In addition, variations of activities in the two regions between exploration and
exploitation suggest that both contribute to the regulation of the control level during exploration.
Altogether neurophysiological data suggest particular relationships between dACC and LPFC, but
their respective contribution during adaptation remains unclear and a computational approach to
this issue appears highly relevant. We recently modeled such relationships using the meta-learning
framework (Khamassi et al. 2011). The network model was simulated in the Problem Solving (PS) task
(Quilodran et al., 2008) where monkeys have to search for the rewarded target in a set of four on a
touch-screen, and have to repeat this rewarded choice for at least 3 trials before starting a new
search period (Fig. 1A). In these simulations, variations of the model’s control meta-parameter (i.e.
inverse temperature β) produced variations of choice selectivity in simulated LPFC in the following
manner: a decrease of choice selectivity (exploration) during search; an increase of choice selectivity
(exploitation) during repetition. This resulted in a globally higher mean choice selectivity in simulated
LPFC compared to simulated dACC, and in a co-variation between choice selectivity and the inverse
temperature in simulated LPFC but not in simulated dACC (Khamassi et al. 2011). This illustrates a
prediction of computational models on the role of prefrontal cortex in exploration (McClure et al.
2006; Cohen J. D. et al. 2007; Krichmar 2008) which has not yet been tested experimentally.
Characteristics of behaviors
To assess the plausibility of such computational principles we first analyzed animals’ behavior in
the PS task. During recordings, monkeys performed nearly optimal searches, i.e., rarely repeated
incorrect trials (INC), and on average made errors in less than 5% of repetition trials. Although the
animals' strategy for determining the correct target during search periods was highly efficient, the
pattern of successive choices was not systematic. Analyses of series of choices during search periods
revealed that monkeys used either clockwise (e.g. choosing target 1 then 2), counterclockwise, or

Khamassi et al. Adaptive control in prefrontal cortex
18
crossing (going from one target to the opposite target in the display, e.g. from 1 to 3) strategies, with
a slightly higher incidence for clockwise and counterclockwise strategies, and a slightly higher
incidence for clockwise over counterclockwise strategy (Percent clockwise, counterclockwise,
crossing and repeats were 38%, 36%, 25%, 1% and 39%, 33%, 26%, 2% for each monkey respectively,
measured for 9716 and 4986 transitions between two targets during search periods of 6986 and
3227 problems respectively). Rather than being systematic or random, monkeys’ search behavior
appeared to be governed by more complex factors: shifting from the previously rewarded target in
response to the Signal to Change (SC) at the beginning of most new problems (Fig. 2A-middle);
spatial biases i.e. more frequent selection of preferred targets in the first trial of search periods (Fig.
2A-right); and efficient adaption to each choice error as argued above. This indicates a planned and
controlled exploratory behavior during search periods. This is also reflected in an incremental change
in reaction times during the search period, with gradual decreases after each error (Fig. 2B).
Moreover, reaction times shifted from search to repetition period after the first reward (CO1),
suggesting a shift between two distinct behavioral modes or two levels of control (Monkey M:
Wilcoxon Mann-Whitney U-test, p < 0.001; Monkey P: p < 0.001; Fig. 2B).
Model-based analyses. Behavioral analyses revealed that monkeys used nearly-optimal strategies
to solve the task, including shift at problem changes, which are unlikely to be solved by simple
reinforcement learning. In order to identify the different elements that took part in monkey's
decisions and adaptation during the task we compared the fit scores of several distinct models to
trial-by-trial choices after estimating each model’s free meta-parameters that maximize the log-
likelihood separately for each monkey (see Methods). We found that models performing either a
random search or a clockwise search and then simply repeating the correct target could not properly
reproduce monkeys' behavior during the task, even when the clockwise search was systematically
started by the monkeys' preferred target according to its spatial biases (Models RandS and ClockS ;
Table 1 and Fig. 2D). Moreover, the fact that monkeys most often shifted their choice at the
beginning of each new problem in response to the Signal to Change (SC) (Fig. 2A-middle) prevented
a simple reinforcement learning model (Q-learning) or even a generalized reinforcement learning
model from reproducing monkey's behavior (resp. QL and GQL in Table 1). Indeed, these models
obviously have a strong tendency to choose the previously rewarded target without taking into
account the Signal to Change to a new problem. Behavior was better reproduced with a combination
of generalized reinforcement learning and reset of target values at each new problem (shifting the
previously rewarded target and taking into account the animal's spatial biases measured during the
previous session; i.e. Models GQLSB, GQLSB2β, SBnoA, SBnoA2β in Figure 2D and Table 1). We tested

Khamassi et al. Adaptive control in prefrontal cortex
19
control models without spatial biases, without problem shift, and with neither of them, to show that
they were both required to fit behavior (resp. GQLSnoB, GQLBnoS and GQLnoSnoB in Table 1). We
also tested a model with spatial biases and shift but without progressive updating of target values
nor forgetting – i.e. 1,1 (Model SBnoF, which is a restricted and nested version of Model
SBnoA with 1 less meta-parameter) and found that it was not as good as SBnoA in fitting monkeys’
behavior, as found with a likelihood ratio test at p=0.05 with one degree of freedom.
Although Models GQLSB, GQLSB2β, SBnoA, SBnoA2β were significantly better than other tested
models along all used criteria (maximum likelihood [Opt-LL], BIC score, AIC score, log of posterior
probability [LPP], out-of-sample test [Test-LL] in Table 1), these 4 versions gave similar fit
performance. In addition, the best model was not the same depending on the considered criterion:
Model GQLSB2β was the best according to LL, BIC and AIC scores, and second best according to LPP
and Test-LL scores; Model SBnoA2β was the best according to LPP score; Model GQLSB was the best
according to Test-LL score.
As a consequence, the present dataset does not allow to decide whether allowing a free meta-
parameter α (i.e. learning rate) in model GQLSB and GQLSB2β is necessary or not in this task,
compared to versions of these models where α is fixed to 1 (Model SBnoA and SBnoA2β) (Fig. 2D and
Table 1). This is due to the structure of the task – where a single correct trial is sufficient to know
which is the correct target – which may be solved by sharp updates of working memory rather than
by progressive reinforcement learning (although a small subset of the sessions were better fitted
with 9.0;3.0 in Model GQLSB, thus revealing a continuum in the range of possible αs,
Supplementary Fig. S2). We come back to this issue in the discussion.
Similarly, models that use distinct control levels during search and repetition (Models GQLSB2β
and SBnoA2β) could not be distinguished from models using a single parameter (Models GQLSB and
SBnoA) in particular because of out-of-sample test scores (Table 1).
Nevertheless, model-based analyses of behavior in the PS task suggest complex adaptations
possibly combining rapid updating mechanisms (i.e. α close to 1), forgetting mechanisms and the use
of information about the task structure (Signal to Change; first correct feedback signaling the
beginning of repetition periods). Model GQLSB2β here combines these different mechanisms in the
more complete manner and moreover won the competition against the other models according to
three criteria out of five. Consequently, in the following we will use Model GQLSB2β for model-based
analyses of neurophysiological data and will systematically compare the results with analyses
performed with Models GQLSB, SBnoA, SBnoA2β to verify that they yield similar results.
In summary, the best fit was obtained with Models SBnoA, SBnoA2β, GQLSB, GQLSB2β which
could predict over 80% of the choices made by the animal (Table 1). Figure 2A shows a sample of

Khamassi et al. Adaptive control in prefrontal cortex
20
trials where Model SBnoA can reproduce most monkey choices, and illustrating the sharper update
of action values in Model SBnoA (with α = 1) compared to Model GQLSB (where the optimized α =
0.7). When freely simulated on 1000 problems of the PS task – i.e., the models learned from their
own decisions rather than trying to fit monkeys’ decisions –, the models made 38.23% clockwise
search trials, 32.41% counter-clockwise, 29.22% crossing and 0.15% repeat. Simulations of the same
models without spatial biases produced less difference between percentages of clockwise, counter-
clockwise and crossing trials, unlike monkeys: 33.98% clockwise, 32.42% counter-clockwise, 33.53%
crossing and 0.07% repeat.
Distinct control levels between search and repetition. To test whether behavioral adaptation
could be described by a dynamical regulation of the β meta-parameter (i.e. inverse temperature)
between search and repetition, we analyzed the value of the optimized two distinct free meta-
parameters (βS and βR) in Models GQLSB2β and SBnoA2β (Fig. 2E, 2C and Suppl. Fig. S2). The value of
the optimized βS and βR meta-parameters obtained for a given monkey in a given session constituted
a quantitative measure of the control level during that session. Such level was non-linearly linked to
the number of errors the animal made. For instance, a βR of 3, 5, or 10 corresponded to
approximately 20%, 5%, and 0% errors respectively made by the animal during repetition periods
(Fig. 2C).
Interestingly, the distributions of βS and βR obtained for each recording session showed
dissociations between search and repetition periods in a large number of sessions. We found a
unimodal distribution for the β meta-parameter during the search period (βS), reflecting a consistent
level of control in the animal behavior from session to session. In contrast, we observed a bimodal
distribution for the β meta-parameter during the repetition period (βR; Fig. 2E). In Figure 2E, the
peak on the right of the distribution (large βR) corresponds to a subgroup of sessions where behavior
shifted between different control levels from search to repetition periods. This shift in the level of
control could be interpreted as a shift from exploratory to exploitative behavior, an attentional shift
or a change in the working memory load, as we discuss further in the Discussion. Nevertheless this is
consistent with the hypothesis of a dynamical regulation of the inverse temperature β between
search and repetition periods in this task (Khamassi et al. 2011; Khamassi et al. 2013). The bimodal
distribution for βR illustrates the fact that during another subgroup of sessions (small βR), the animal’s
behavior did not shift to a different control level during repetition and thus made more errors. Such
bimodal distribution of the β meta-parameter enables to separate sessions in two groups and to
compare dACC and LPFC activities (see below) during sessions where decisions displayed a shift and
during sessions where no such clear shift occurred. Interestingly, the bimodal distribution of βR is not

Khamassi et al. Adaptive control in prefrontal cortex
21
crucially dependent of the optimized learning rate α since a similar bimodal distribution was
obtained with Model SBnoA2β and since the optimized βS and βR values in the two models were
highly correlated (N = 277; βS: r = 0.9, p < 0.001; βR: r = 0.96, p < 0.001; Supplementary Fig. S2).
Modulation of information coding
To evaluate whether a behavioral change between search and repetition was accompanied by
changes in LPFC activity and choice selectivity, we analyzed a pool of 232 LPFC single-units (see Fig.
1B for the anatomy) in animals performing the PS task, and compared the results with 579 dACC
single-unit recordings which have been only partially used for investigating feedback-related activity
(Quilodran et al. 2008). We report here a new study relying on comparative analyses of dACC and
LPFC responses, the analysis of activities before the feedback – especially during the delay period –,
and the model-based analysis of these neurophysiological data. The results are summarized in
Supplementary Table 1.
Average activity variations between search and repetition. Previous studies revealed differential
prefrontal fMRI activations between exploitation (where subjects chose the option with maximal
value) and exploration trials (where subjects chose a non-optimal option) (Daw N. D. et al. 2006).
Here a global decrease in average activity level was also observed in the monkey LPFC from search to
repetition. For early-delay activity, the average index of variation between search and repetition in
LPFC was negative (mean: -0.05) and significantly different from zero (mean: t-test p < 0.001,
median: Wilcoxon Mann-Whitney U- test p < 0.001). The average index of activity variation in dACC
was not different from zero (mean: -0.008; t-test p > 0.35; median: Wilcoxon Mann-Whitney U- test p
> 0.25). However, close observation revealed that the non-significant average activity variation in
dACC was due to the existence of equivalent proportions of dACC cells showing activity increase or
activity decrease from search to repetition, leading to a null average index of variation (Fig. 3A-B;
17% versus 20% cells respectively). In contrast, more LPFC single units showed a decreased activity
from search to repetition (18%) than an increase (8%), thus explaining the apparent global decrease
of average LPFC activity during repetition. The difference in proportion between dACC and LPFC is
significant (Pearson χ2 test, 2 df, t = 13.0, p < 0.01) and was also found when separating data for the
two monkeys (Supplementary Fig. S3). These changes in neural populations thus suggest that global
non-linear dynamical changes occur in dACC and LPFC between search and repetition instead of a
simple reduction or complete cessation of involvement during repetition.
Modulations of choice selectivity between search and repetition. As shown in Figure 3A, a higher
proportion of neurons showed a significant choice selectivity in LPFC (155/230, 67%) than in dACC

Khamassi et al. Adaptive control in prefrontal cortex
22
(286/575, 50%; Pearson χ2 test, 1 df, t = 20.7, p < 0.001) – as measured by the vector norm in
Equation 10. Interestingly, the population average choice selectivity was higher in LPFC (0.80) than in
dACC (0.70; Kruskal-Wallis test, p < 0.001; see Fig. 3C). When pooling all sessions together, this
resulted in a significant increase in average choice selectivity in LPFC from search to repetition (mean
variation: 0.04; Wilcoxon Mann-Whitney U-test p < 0.01; t-test p < 0.01; Fig. 3C).
Strikingly, the significant increase in LPFC early-delay choice selectivity from search to repetition
was found only during sessions where the model fit dissociated control levels in search and repetition
(i.e. sessions with large βR [βR > 5]; Kruskal-Wallis test, 1df, χ2 = 6.45, p = 0.01; posthoc test with
Bonferroni correction indicated that repetition > search). Such an effect was not found during sessions
where the model reproducing the behavior remained at the same control level during repetition (i.e.
sessions with small βR [βR < 5]; Kruskal-Wallis test, p > 0.98) (Fig. 4-bottom).
Interestingly, choice selectivity in LPFC was significantly higher during repetition for sessions
where βR was large (mean choice selectivity = 0.91) than for sessions where βR was small (mean
choice selectivity = 0.73; Kruskal-Wallis test, 1df, χ2 = 12.5, p < 0.001; posthoc test with Bonferroni
correction; Fig. 4-bottom). Thus, LPFC early-delay choice selectivity clearly covaried with the level of
control measured in the animal’s behavior by means of the model.
There was also an increase in dACC early-delay choice selectivity between search and repetition
consistent with variations of β, but only during sessions where the model capturing the animal’s
behavior made a strong shift in the control level (βR > 5; mean variation = 0.035, Kruskal-Wallis test,
1df, χ2 = 5.22, p < 0.05; posthoc test with Bonferroni correction indicated that repetition > search; Fig.
4-top). However, overall, dACC choice selectivity did not follow variations of the control level. Two-
way ANOVAs either for (βS x task phase) or for (βR x task phase) revealed no main effect of β (p > 0.2),
an effect of task period (p < 0.01), but no interaction (p > 0.5). And there was no significant difference
in ACC choice selectivity during repetition between sessions with a large βR (mean choice selectivity =
0.69) and sessions with a low one (mean choice selectivity = 0.75; Kruskal-Wallis test, 1 df, χ2 = 3.11, p
> 0.05).
At the population level, increases in early-delay mean choice selectivity from search to repetition
were due both to an increase of single unit selectivity, and to the emergence in repetition of selective
units that were not significantly so in search (Fig. 3A). Importantly, the proportion of LPFC early-delay
choice selective neurons during repetition periods of sessions where βR was small (55%) was
significantly smaller than the proportion of such LPFC neurons during sessions where βR was large
(72%; Pearson χ2 test, 1 df, t = 7.19, p < 0.01). In contrast, there was no difference in proportion of
dACC early-delay choice selective neurons during repetition between sessions where βR was small
(38%) and sessions where βR was large (35%; Pearson χ2 test, 1 df, t = 0.39, p > 0.5; Fig. 4B). These

Khamassi et al. Adaptive control in prefrontal cortex
23
analyses thus show a significant difference between dACC and LPFC neural activity properties. LPFC
mean choice selectivity as well as LPFC proportion of choice selective cells varied between search and
repetition in accordance with the control level measured in the behavior by means of the
computational model, while such effect was much weaker in dACC. These results are robust since they
could also be obtained with Model SBnoA2β (Supplementary Fig. S4A). Data separated for the two
monkeys also reflected the contrast between the two structures (Supplementary Fig. S4B).
Mutual information between neural activity and target choice. Generally, computational models
of the dACC-LPFC system make the assumption that LPFC is central for the decision output. LPFC
activity should thus be more tightly related to the animal’s choice than dACC activity. Here, in 63
LPFC neurons recorded during a sufficient number of presentations of each target choice (see
Methods), the average mutual information – corrected for sampling bias – was more than twice as
high (ILPFC = 0.10 bit) as in 85 dACC cells (IACC = 0.04 bit; Kruskal-Wallis test, p < 0.001) (Fig. 3D). This
effect appeared to be the result of the activity of a small subset of LPFC activity – in both monkeys
(Supplementary Fig. S3D) – with a high mutual information with choice. To verify that the applied
restriction on the number of sampling trials was accurate, we constructed 1000 shuffled pseudo
response arrays for each single unit and measured the average mutual information obtained with
this shuffling procedure. For the 63 LPFC and 85 dACC selected neurons, the difference between the
averaged shuffled information and the bias correction term was very small (mean=0.01 bit), while it
was high in non-selected neurons (mean=0.08 bit). Thus the difference in estimated information
between dACC and LPFC was not due to a limited sampling bias in the restricted number of analyzed
neurons. We can conclude that, in agreement with computational models of the dACC-LPFC system,
neural recordings show a stronger link between LPFC activity and choice than between dACC activity
and choice.
Neural activity correlated with model variables.
Following model-based analyses of behavior we tested whether single unit activity in LPFC and
dACC differentially reflect information similar to variables in Model GQLSB2β by using the time series
of these variables as regressors in a general linear model of single-unit activity (multiple regression
analysis with a bootstrapping control – see Methods) (Fig. 6). In dACC and LPFC, respectively 397/579
(68.6%) cells and 145/232 (62.5%) cells showed a correlation with at least one of the model's
variables in at least one of the behavioral epochs: pre-start, delay, pre-target, post-target, pre-touch,
pre-feedback, early-feedback, late-feedback, and inter-trial interval (ITI). More precisely, we found a
larger proportion of cells in LPFC than in dACC correlated with at least one model variable in the

Khamassi et al. Adaptive control in prefrontal cortex
24
post-target epoch (Fig. 6E; Pearson χ2 tests, T = 3.89, p < 0.05), and a larger proportion of cells in
dACC than in LPFC correlated with at least one model variable in the early-feedback epoch (Pearson
χ2 test, T = 7.90, p < 0.01). Differences in proportions of LPFC and dACC neurons correlated with
different model variables during pre- or post-feedback epochs were also observed for the two
monkeys separately (Supplementary Figure S6), and when the model-based analysis was done with
Models GQLSB, SBnoA or SBnoA2β (Supplementary Figures S5). Collinearity diagnostics between
model variables revealed a weak collinearity in 306/308 recording sessions, a moderate collinearity
in 1 session and a strong collinearity in 1 session (Supplementary Figure S9), thus excluding the
possibility that these results could be an artifact of collinearity between model variables.
Figure 5A shows an example dACC post-target activity negatively correlated with the action
value associated to choosing target #4 (Fig. 5A-top). The raster plot and peristimulus histogram for
this activity show lower firing rate in trials where the animal chose target #4 than in trials where he
chose one of the other targets (Fig. 5A-middle). Plotting the trial-by-trial evolution of the post-target
firing rate of the neuron reveals sharp variations following action value update and distinct from the
time series of the other model variables δ and U (Fig. 5A-bottom). The firing rate dropped below
baseline during trials where target #4 was chosen. Strikingly, the firing rate sharply increased above
baseline in trials following non-rewarded choices of target #4. Thus this single unit not only
responded when the animal selected the associated target but also kept track of the stored value
associated with that target. Figure 5B shows a LPFC unit whose activity in the post-target epoch is
positively correlated with the action value associated to choosing target #2. The raster plot illustrates
a higher firing rate for trials where target #2 was chosen (grey histogram and raster, fig. 5B-middle).
Similarly to the previous example, the trial-by-trial evolution of the post-target firing rate reveals
sharp variations from trial to trial (Fig. 5B-bottom), consistent with sharp changes of action values in
the model that best described behavior adaptation in this task (Fig. 2A).
We found 126/145 (87%) LPFC and 227/397 (57%) dACC Q-value encoding cells. The proportion
was significantly greater in LPFC (Pearson χ2 test, 1 df, T = 41.30, p < 0.001; Fig. 6A). We next verified
whether the activity of these cells carried Q value information only during trials where the neuron's
preferred target was selected by the monkey, or also during other trials. To do so, we performed a
new multiple regression analysis on the activity of each cell after excluding trials where the cell's
preferred target was chosen. The activity of respectively 18% (23/126) and 13% (29/227) of LPFC and
dACC Q value encoding cells were still significantly correlated with a Q value in the same epoch after
excluding trials where the cell's preferred target was selected by the animal (multiple regression
analysis with Bonferroni correction). Importantly, the difference in proportion of Q cells between LPFC
Khamassi et al. Adaptive control in prefrontal cortex
25
and dACC was still significant after restricting to Q cells showing a significant correlation while
excluding trials with their preferred target (LPFC: 23/145, 16%; dACC: 29/397, 7%; Pearson χ2 test, 1
df, T = 8.97, p < 0.01).
Given the deterministic nature of the task, and thus the limited sampling of options, a question
remains of whether these neurons really encode Q values or whether they participate to action
selection. The control analysis above excluding trials with each cells' preferred target showed that at
least a certain proportion of these cells carried information about action values outside trials where
the corresponding action is selected. But how much information about choice do these neurons carry
and is there a quantitative difference between LPFC and dACC? Interestingly, 43% (54/126) of LPFC Q
cells had high mutual information with monkey choice (I > 0.1) whereas only 33% (75/227) of dACC Q
cells verified such condition. The difference in proportion was marginally significant (Pearson χ2
proportion test, 1df, T = 3.37, p = 0.07). Moreover, LPFC Q cells activity contained more information
about monkey choice (mean I = 0.12) than dACC Q cells (mean I = 0.09; Kruskal-Wallis test, 1df, χ2 =
3.88, p < 0.05; Posthoc test with Bonferroni correction found that LPFC-Q > dACC-Q) and more than
LPFC non-Q cells (average = 0.09; Kruskal-Wallis test, χ2 = 6.65, 1df, p < 0.01; Posthoc test with
Bonferroni correction found that LPFC-Q > LPFC-nonQ). dACC Q cells activity did not contain more
information about monkey choice than LPFC non-Q cells (Kruskal, 1df, χ2 = 1.57, p > 0.05). Although
the observed difference in Q-encoding between dACC and LPFC are weak, these results are in line
with the hypothesized dACC role in action value encoding and with the transfer of such information to
LPFC for action selection – the LPFC would encode a probability distribution over possible actions.
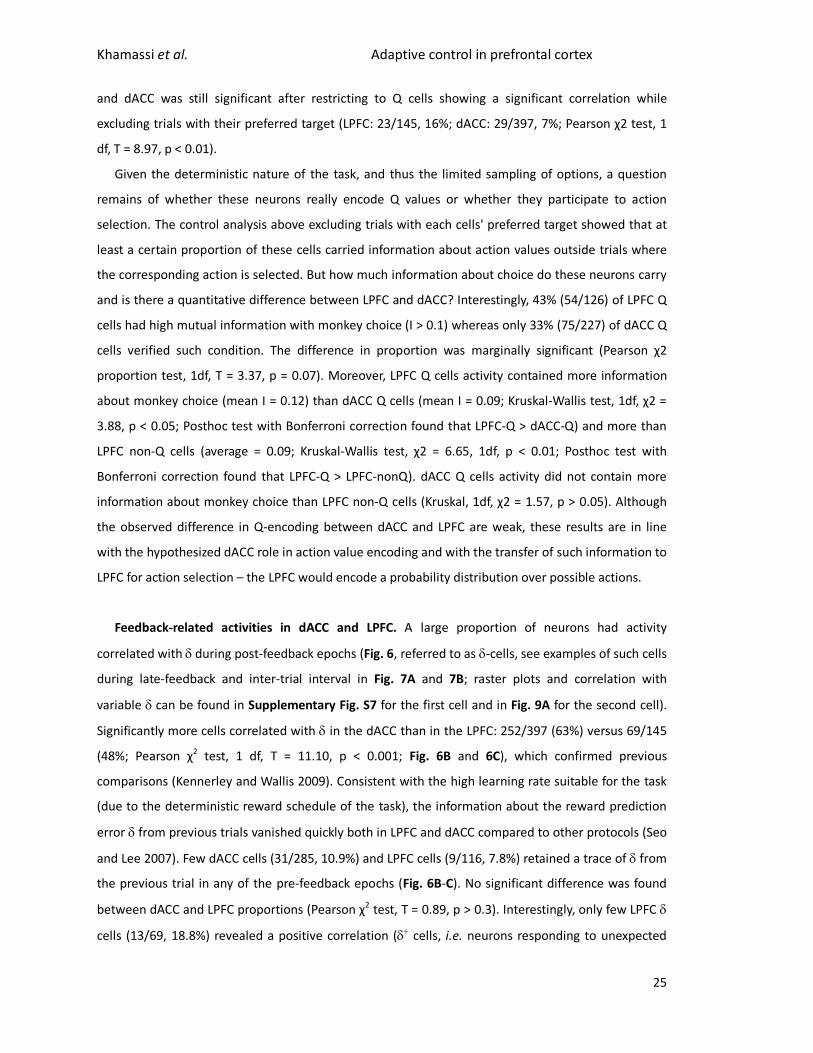
Feedback-related activities in dACC and LPFC. A large proportion of neurons had activity
correlated with during post-feedback epochs (Fig. 6, referred to as -cells, see examples of such cells
during late-feedback and inter-trial interval in Fig. 7A and 7B; raster plots and correlation with
variable can be found in Supplementary Fig. S7 for the first cell and in Fig. 9A for the second cell).
Significantly more cells correlated with in the dACC than in the LPFC: 252/397 (63%) versus 69/145
(48%; Pearson χ2 test, 1 df, T = 11.10, p < 0.001; Fig. 6B and 6C), which confirmed previous
comparisons (Kennerley and Wallis 2009). Consistent with the high learning rate suitable for the task
(due to the deterministic reward schedule of the task), the information about the reward prediction
error from previous trials vanished quickly both in LPFC and dACC compared to other protocols (Seo
and Lee 2007). Few dACC cells (31/285, 10.9%) and LPFC cells (9/116, 7.8%) retained a trace of from
the previous trial in any of the pre-feedback epochs (Fig. 6B-C). No significant difference was found
between dACC and LPFC proportions (Pearson χ2 test, T = 0.89, p > 0.3). Interestingly, only few LPFC
cells (13/69, 18.8%) revealed a positive correlation ( cells, i.e. neurons responding to unexpected
Khamassi et al. Adaptive control in prefrontal cortex
26
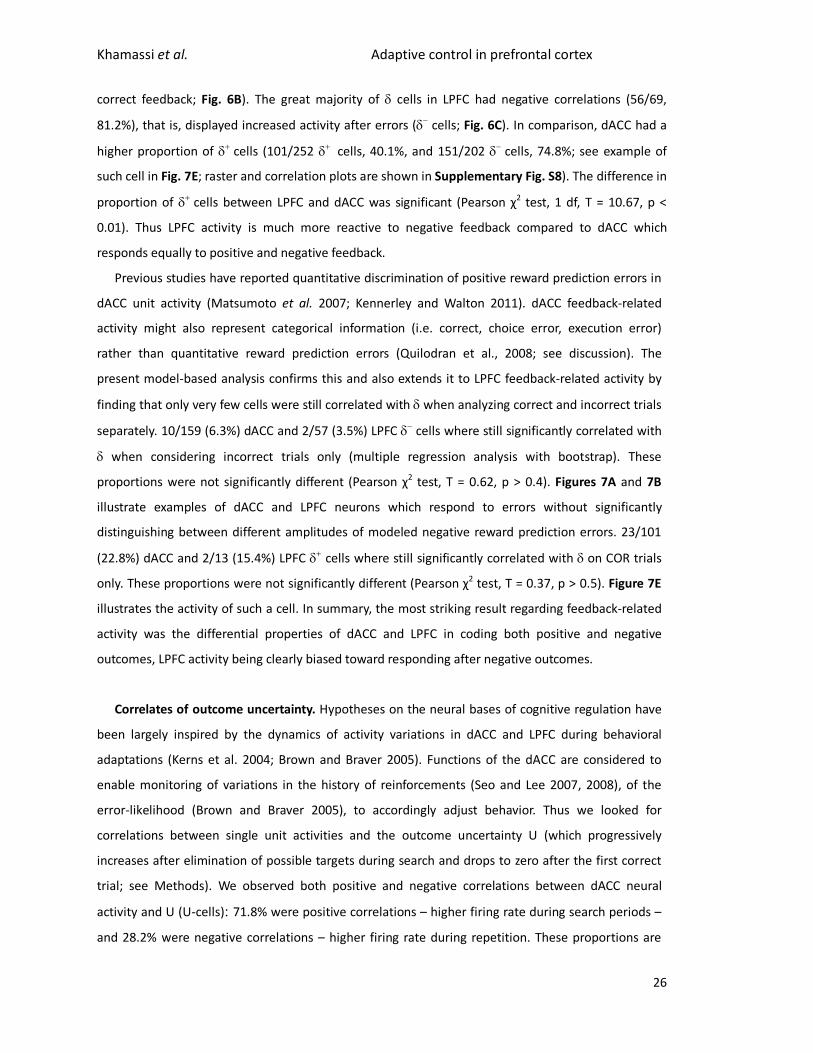
correct feedback; Fig. 6B). The great majority of cells in LPFC had negative correlations (56/69,
81.2%), that is, displayed increased activity after errors ( cells; Fig. 6C). In comparison, dACC had a
higher proportion of cells (101/252 cells, 40.1%, and 151/202 cells, 74.8%; see example of
such cell in Fig. 7E; raster and correlation plots are shown in Supplementary Fig. S8). The difference in
proportion of cells between LPFC and dACC was significant (Pearson χ2 test, 1 df, T = 10.67, p <
0.01). Thus LPFC activity is much more reactive to negative feedback compared to dACC which
responds equally to positive and negative feedback.
Previous studies have reported quantitative discrimination of positive reward prediction errors in
dACC unit activity (Matsumoto et al. 2007; Kennerley and Walton 2011). dACC feedback-related
activity might also represent categorical information (i.e. correct, choice error, execution error)
rather than quantitative reward prediction errors (Quilodran et al., 2008; see discussion). The
present model-based analysis confirms this and also extends it to LPFC feedback-related activity by
finding that only very few cells were still correlated with when analyzing correct and incorrect trials
separately. 10/159 (6.3%) dACC and 2/57 (3.5%) LPFC cells where still significantly correlated with
when considering incorrect trials only (multiple regression analysis with bootstrap). These
proportions were not significantly different (Pearson χ2 test, T = 0.62, p > 0.4). Figures 7A and 7B
illustrate examples of dACC and LPFC neurons which respond to errors without significantly
distinguishing between different amplitudes of modeled negative reward prediction errors. 23/101
(22.8%) dACC and 2/13 (15.4%) LPFC cells where still significantly correlated with on COR trials
only. These proportions were not significantly different (Pearson χ2 test, T = 0.37, p > 0.5). Figure 7E
illustrates the activity of such a cell. In summary, the most striking result regarding feedback-related
activity was the differential properties of dACC and LPFC in coding both positive and negative
outcomes, LPFC activity being clearly biased toward responding after negative outcomes.
Correlates of outcome uncertainty. Hypotheses on the neural bases of cognitive regulation have
been largely inspired by the dynamics of activity variations in dACC and LPFC during behavioral
adaptations (Kerns et al. 2004; Brown and Braver 2005). Functions of the dACC are considered to
enable monitoring of variations in the history of reinforcements (Seo and Lee 2007, 2008), of the
error-likelihood (Brown and Braver 2005), to accordingly adjust behavior. Thus we looked for
correlations between single unit activities and the outcome uncertainty U (which progressively
increases after elimination of possible targets during search and drops to zero after the first correct
trial; see Methods). We observed both positive and negative correlations between dACC neural
activity and U (U-cells): 71.8% were positive correlations – higher firing rate during search periods –
and 28.2% were negative correlations – higher firing rate during repetition. These proportions are

Khamassi et al. Adaptive control in prefrontal cortex
27
different from an expected 50%-50% proportion (χ2 goodness of fit - one sample test, 1 df, χ2 = 39.32,
p < 0.001). The population activity of these units correlated with U showed gradual trial-by-trial
changes during search, and sharp variations from search to repetition, after the first correct feedback
of the problem (see examples of such cells during the post-start epoch in Fig. 7C, D; see raster and
correlation plots in Supplementary Fig. S7B, C). These patterns of activity were in opposite direction
from changes in reaction times (Fig. 2B). They belonged to a larger group of cells that globally
discriminated between search and repetition (see a different profile of such type of neurons in the
post-target epoch in Fig. 7F; see raster and correlation plots in Supplementary Fig. S8B). Neural data
revealed that U cells were more frequent in dACC (206/397, 52%) than in LPFC (48/145, 33%;
Pearson χ2 test, T = 15.05, p < 0.001; Fig. 6D). Importantly, Figure 6 shows that, during trials, U was
decoded from dACC activity mostly just before and after feedback occurrence. By contrast, U was
better decoded during delay (i.e., pre-target epoch) in LPFC. These different dynamics reinforce the
idea of an intimate link between U updating and the information provided by feedback for
performance monitoring in dACC and, in contrast, of an implication of LPFC in incorporation of U into
the decision function in LPFC.
Multiplexed reinforcement-related information. We found that both dACC and LPFC single units
multiplexed information about different model variables, with LPFC activity reflecting more
integration of information than dACC activity. First, in LPFC the great majority of U-cells (81%, 39/48)
were also correlated with one of the model action values while this was true for only 52% (107/206)
of dACC U-cells (Pearson χ2 test, 1 df, T = 13.68, p < 0.001). Stronger integration was also reflected
through higher correlation strengths with multiple variables of the model, as found by a Principal
Component Analysis (PCA) on regression coefficients for all dACC and LPFC neurons (Fig. 8). The first
principal component (PC1) obtained with dACC neurons corresponds in all trial epochs to activity
variations mainly related to the outcome uncertainty U and reveals weak links with Q and (Fig. 8A).
In contrast, the two first components (PC1 and PC2) obtained with LPFC neurons both were
expressed as a combination of Q and U during pre-feedback epochs (Fig. 8A). The PCA also revealed
a strong change in the principal components between pre- and post-feedback epochs both in dACC
and LPFC and reliably in the two monkeys (Fig. 8A), consistent with the post-feedback activity
changes and correlations between model variables reported in the previous analyses.
To quantify differences in multiplexing at the single-unit level, we computed an entropy-like index
(ELI) of sharpness of encoding of different model variables based on the distributions of correlation
strengths between individual cell activities and model variables (see Methods): e.g. a neuron with
activity correlated with different model variables with similar strengths will have a high ELI; a neuron
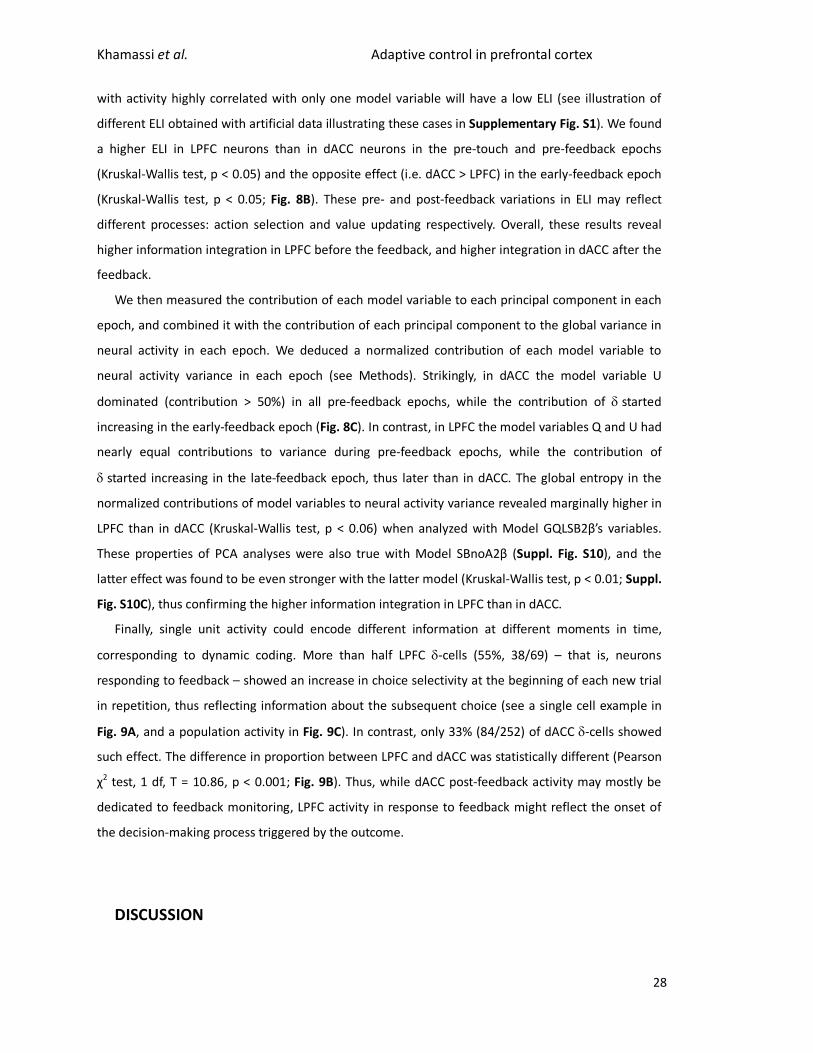
Khamassi et al. Adaptive control in prefrontal cortex
28
with activity highly correlated with only one model variable will have a low ELI (see illustration of
different ELI obtained with artificial data illustrating these cases in Supplementary Fig. S1). We found
a higher ELI in LPFC neurons than in dACC neurons in the pre-touch and pre-feedback epochs
(Kruskal-Wallis test, p < 0.05) and the opposite effect (i.e. dACC > LPFC) in the early-feedback epoch
(Kruskal-Wallis test, p < 0.05; Fig. 8B). These pre- and post-feedback variations in ELI may reflect
different processes: action selection and value updating respectively. Overall, these results reveal
higher information integration in LPFC before the feedback, and higher integration in dACC after the
feedback.
We then measured the contribution of each model variable to each principal component in each
epoch, and combined it with the contribution of each principal component to the global variance in
neural activity in each epoch. We deduced a normalized contribution of each model variable to
neural activity variance in each epoch (see Methods). Strikingly, in dACC the model variable U
dominated (contribution > 50%) in all pre-feedback epochs, while the contribution of started
increasing in the early-feedback epoch (Fig. 8C). In contrast, in LPFC the model variables Q and U had
nearly equal contributions to variance during pre-feedback epochs, while the contribution of
started increasing in the late-feedback epoch, thus later than in dACC. The global entropy in the
normalized contributions of model variables to neural activity variance revealed marginally higher in
LPFC than in dACC (Kruskal-Wallis test, p < 0.06) when analyzed with Model GQLSB2β’s variables.
These properties of PCA analyses were also true with Model SBnoA2β (Suppl. Fig. S10), and the
latter effect was found to be even stronger with the latter model (Kruskal-Wallis test, p < 0.01; Suppl.
Fig. S10C), thus confirming the higher information integration in LPFC than in dACC.
Finally, single unit activity could encode different information at different moments in time,
corresponding to dynamic coding. More than half LPFC -cells (55%, 38/69) – that is, neurons
responding to feedback – showed an increase in choice selectivity at the beginning of each new trial
in repetition, thus reflecting information about the subsequent choice (see a single cell example in
Fig. 9A, and a population activity in Fig. 9C). In contrast, only 33% (84/252) of dACC -cells showed
such effect. The difference in proportion between LPFC and dACC was statistically different (Pearson
χ2 test, 1 df, T = 10.86, p < 0.001; Fig. 9B). Thus, while dACC post-feedback activity may mostly be
dedicated to feedback monitoring, LPFC activity in response to feedback might reflect the onset of
the decision-making process triggered by the outcome.
DISCUSSION

Khamassi et al. Adaptive control in prefrontal cortex
29
Interaction between performance monitoring and cognitive control hypothetically relies on
interactions between dACC and LPFC (e.g. Cohen J.D. et al. 2004). Here we described how the
functional link between the two areas might contribute to the regulation of decisions.
In summary, we found that LPFC early-delay activity was more tightly related to monkeys’
behavior than dACC activity, displaying higher mutual information with animals’ choices than dACC,
supporting LPFC's role in action selection. Also, the high choice selectivity in LPFC co-varied with the
control level measured from behavior: decreased choice selectivity during the search period,
putatively promoting exploration; increased choice selectivity during the repetition period, putatively
promoting exploitation. In contrast, this effect was not consistent in dACC. dACC activity correlated
with various model variables, keeping track of pertinent information concerning the animal’s
performance. A calculation of outcome uncertainty (U) correlated with activity changes between
exploration and exploitation mostly in dACC, and dominated the contribution to neural activity
variance in pre-feedback epochs. Moreover, dACC post-feedback activity appeared earlier than in
LPFC and represented positive and negative outcomes with similar proportions while LPFC post-
feedback activity mostly tracked negative outcomes.
Reinforcement-related (Q and and task monitoring-related (U) information was multiplexed
both in dACC and LPFC, but with higher integration of information before the feedback in LPFC and
after the feedback in dACC. LPFC unit activity responding to feedback was also choice selective
during early-delay, possibly contributing to decision making, while dACC feedback-related activity –
possibly categorizing feedback per se – showed less significant choice selectivity variations. Taken
together, these elements suggest that reinforcement-based information and performance
monitoring in dACC might participate in regulating decision functions in LPFC.
Mixed information and coordination between areas
Correlations with variables related to reinforcement and actions were found in both structures in
accordance with previous studies showing redundancy in information content, although with some
quantitative biases (Seo and Lee 2008; Luk and Wallis 2009). However, compared to LPFC, dACC
neuronal activity was more selective for outcome uncertainty that could be used to regulate
exploration (Fig. 8). The PCA analysis showed that multiplexing of reinforcement-related information
is stronger in LPFC activity suggesting that this structure receives and integrates these information. In
this hypothesis dACC would influence LPFC computations by modulating an action selection process.
Such interaction have been interpreted as a motivational or energizing function (from dACC) onto
selection mechanisms (in LPFC) (Kouneiher et al. 2009). More specifically, our results support a
recently proposed model in which dACC monitors task-relevant signals to compute action values and

Khamassi et al. Adaptive control in prefrontal cortex
30
keep track of the agent’s performance necessary for adjusting behavioral meta-parameters
(Khamassi et al. 2011; Khamassi et al. 2013). In this model, values are transmitted to the LPFC which
selects the action to perform. But the selection process (stochastic) is regulated online based on
dACC's computations to enable dynamic variations of the control level.
This view preserves the schematic regulatory loop by which performance monitoring acts on
cognitive control as proposed by others (Botvinick et al. 2001; Cohen J.D. et al. 2004). We further
suggest a functional structure that reconciles data related to regulatory mechanisms, reinforcement
learning, and cognitive control. In particular we point to the potential role of dACC in using
reinforcement-related information (such as reward prediction error), relayed through the reward
system (Satoh et al. 2003; Enomoto et al. 2011), to regulate global tendencies (formalized by meta-
parameters) of adaptation. Interestingly, human dACC (i.e., mid-cingulate cortex) activation co-varies
with volatility or variance in rewards and could thereby also participate in regulating learning rates for
social or reward-guided behaviors (Behrens et al. 2007; Behrens et al. 2009). Kolling and colleagues
(Kolling et al. 2012) have recently found that dACC encodes the average value of the foraging
environment. This suggests a general involvement of dACC in translating results of performance
monitoring and task monitoring into a regulatory level.
The fact that dACC activity correlated with changes in modeled meta-parameters would suggest a
general function in the global setting of behavioral strategies. It has been proposed that dACC can be
regarded as a filter involved in orienting motor or behavioral commands (Holroyd and Coles 2002), in
regulating action decision (Domenech and Dreher 2010), and that it is part of a core network
instantiating task-sets (Dosenbach et al. 2006). Interestingly, dACC neural activity encodes specific
events that are behaviorally relevant in the context of a task, events that – like the Signal to Change
in our task – can contribute to trigger selected adaptive mechanisms (Amiez et al. 2005; Quilodran et
al. 2008). In line with this, Alexander and Brown recently proposed that dACC signals unexpected
non-occurrences of predicted outcomes, i.e. negative surprise signals, which in their model consist of
context-specific predictions and evaluations (Alexander W. H. and Brown 2011). Their model
elegantly explains a large amount of reported dACC post-feedback activity. But dACC signals related
to positive surprise (Matsumoto et al. 2007; Quilodran et al. 2008), and to other behaviorally salient
events (Amiez et al. 2005), suggest an even more general role in processing information useful to
guide selected behavioral adaptations.
Exploration
Khamassi et al. Adaptive control in prefrontal cortex
31
Following a standard reinforcement learning framework, exploratory behavior was here
associated to low β values, which flatten the probability distribution of competing actions in models
and simulations (Khamassi et al. 2011). Although the precise molecular and cellular mechanisms
underlying shifts between exploration and exploitation are not yet known, accumulating evidence
suggest that differential levels of activation of D1 and D2 dopamine receptors in the prefrontal cortex
may produce distinct states of activity: a first state allowing multiple network representations nearly
simultaneously and thus permitting “an exploration of the input space”; a second state where the
influence of weak inputs on PFC networks is shut off so as to stabilize one or a limited set of
representations, which would then have complete control on PFC output and thus promote
exploitation (Durstewitz and Seamans 2008). The consistent variations of LPFC choice selectivity
between search and repetition periods suggest that such mechanism could also underlie exploration
during behavioral adaptation.
However, this should not be interpreted as an assumption that monkeys’ behavior is purely
random during search periods of the task (see model-based analysis of behavior). In fact, animals
often display structured and organized exploratory behaviors as also revealed by our behavioral
analyses. For instance, when facing a new open arena, rodents display sequential stages of
exploration, first remaining around the nest position, second moving along walls and third visiting
the center of the arena (Fonio et al. 2009). Non-human primates also use exploration strategies, such
as optimized search trajectories adapted to the search space configuration (De Lillo et al. 1997),
trajectories that can evolve based on reinforcement history along repeated exposure to the same
environment (Desrochers et al. 2010). In ecological large scale environments search strategies are
best described by correlated random or Levy walks and are modulated by various environmental
parameters (Bartumeus et al. 2005).
One possible interpretation of our results is that decreases of choice selectivity in LPFC during
search could reduce the amount of information about choice and ergo release biases in the influence
on downstream structures such as the basal ganglia. In this way, efferent structures could express
their own exploratory decisions. Consistent with this, it has been recently suggested that variations
of tonic dopamine in the basal ganglia could also affect the exploration-exploitation trade off in
decision-making (Humphries et al. 2012).
The prefrontal cortex might also contribute to the regulation of exploration based on current
uncertainty (Daw N. D. et al. 2006; Frank et al. 2009). Uncertainty-based control could bias decision
towards actions that provide very variable quantities of reward so as to gain novel information and
reduce uncertainty. In our task, outcome uncertainty variations – progressive increase during search
and drop to zero during repetition – can be confounded with other similar performance monitoring

Khamassi et al. Adaptive control in prefrontal cortex
32
measures such as the feedback history (Khamassi et al. 2011) or variations of attentional level.
Nevertheless, they co-varied with the animal’s reaction times and were mostly encoded by dACC
neurons, thus revealing a possible relevance of this information for behavioral control in our task. It
should be noted that outcome uncertainty is distinct from action uncertainty which would be
confounded in our task with other task monitoring variables such as conflict (Botvinick et al. 2001)
and error-likelihood (Brown and Braver 2005). All of them gradually and monotonically decrease
along a typical problem of the PS task and remain low during repetition. We found neurons with such
activity profile (e.g. Fig. 7F), however in about half the proportion of U-cells. More work is required
to understand whether these different task monitoring measures are distributed and coordinated
within the dACC-LPFC system.
Reinforcement learning or working memory?
It has been recently suggested that model-based investigations of adaptive mechanisms often mix
and confound reinforcement learning mechanisms and working memory updating (Collins and Frank,
2012). In particular, rapid improvements in behavioral performance during decision-making tasks can
be best explained by gating mechanisms in computational models of the prefrontal cortex rather
than by slow adaptation usually associated with dopamine-dependent plasticity in the basal ganglia.
In the present study, the fact that Models SBnoA and SBnoA2β (with a high learning rate α fixed to 1)
and Models GQLSB and GQLSB2β (where α is a free-metaparameter between 0 and 1) produce a
non-different fitting score on monkey behavior suggests that behavior in this task might fall into such
a case. Under this interpretation, rapid behavioral adaptations would rely on gating appropriate
flows of information between dACC and LPFC. In fact, the increase of LPFC activity mostly after
negative and not positive outcomes, and the interaction with spatial selectivity, might reflect gating
working memory or planning processes at the time of adaptation, rather than direct outcome-related
responses. An alternative hypothesis that cannot be excluded is that in this type of deterministic task
animals still partly rely on reinforcement learning mechanisms, but would progressively learn to
employ a high learning rate during the long pretraining phase. The fact that a group of behavioral
sessions were better fitted with α between 0.3 and 0.9 when α was not fixed to 1 (i.e. in Model
GQLSB; Supplementary Fig. S2C) reveals a continuum in the range of optimized α values which could
be the result of a progressive but incomplete increase of the learning rate during pretraining. Such
adaptation in rate might have also contributed to the weak quantitative coding of reward prediction
errors. Further investigations will be required to answer this question, in particular by precisely
characterizing monkey behavioral performance during the pretraining phase and the associated
changes in information coding in prefrontal cortical regions.

Khamassi et al. Adaptive control in prefrontal cortex
33
Network regulation and decisions in LPFC
We reported new data on the possible functional link between LPFC and dACC. However, we have
no evaluation of putative dynamical and direct interactions between neurons of the two regions.
Functional coordination of local field potentials between LPFC and dACC has been described but
evidence for direct interactions is scarce (Rothe et al. 2011). The schematized modulatory function
from dACC performance monitoring into LPFC decision process could in fact be indirect. For instance,
it has been proposed that norepinephrine instantiates gain (excitability) variations in LPFC, and that
this mechanism would be regulated by dACC afferences to the locus coeruleus (Aston-Jones and
Cohen 2005; Cohen J. D. et al. 2007). Average activity variations in dACC and LPFC observed in our
recordings could be a consequence of such activity gain changes. Gain modulation and biased
competition are two mechanisms by which attentional signals can operate (Wang 2010). Increased
working memory load, higher cognitive control, or attentional selection are concepts widely used to
interpret prefrontal activity modulations dependent on task requirements (Miller and Cohen 2001;
Leung et al. 2002; Kerns et al. 2004). Note that these concepts are closely related and have similar
operational definitions (Barkley 2001; Miller and Cohen 2001; Cohen J.D. et al. 2004).
Recently, Kaping and colleagues have shown that spatial attentional and reward valuation signals
are observed in different subdivisions of the fronto-cingulate region (Kaping et al. 2011). Correlates
of spatial attention selectivity were found in both dACC and LPFC, together with correlates of
valuation, and independently of action plans. These signals would contribute to top-down
attentional control of information (Kaping et al. 2011). Here we also verified that values were coded
independently of choices by showing significant correlation with Q-values even after exclusion of
trials selecting the neuron's preferred target.
The present study revealed two effects of task periods on frontal activity that would reflect
variations in control and decision: an increased average firing rate and changes in recruited neural
populations during exploration in both dACC and LPFC, and an increased spatial selectivity in LPFC
during repetition. The latter would argue against a reduction of control implemented by LPFC during
repetition. This however suggests that transitions between exploration and repetition involve a
complex interplay between global unselective regulations and refined selection functions, and that
qualitative changes in control occurred between search and repetition.
Finally, studies in rodents suggest that adaptive changes in behavioral strategies are also
accompanied by global dynamical state transitions of prefrontal activity (Durstewitz et al. 2010). Our
analyses showed that for both LPFC and dACC the neural populations participating in exploratory
versus exploitative periods of the task differ significantly. We have also previously shown that the

Khamassi et al. Adaptive control in prefrontal cortex
34
oscillatory coordination between the two areas changes from one period to the other (Rothe et al.
2011). Hence, a dynamical system perspective might be imperative to explain cognitive flexibility and
its neurobiological substrate with more precision.
References
Alexander WH, Brown JW. 2010. Computational Models of Performance Monitoring and Cognitive Control. Topics in Cognitive Science. 2: 658-677.
Alexander WH, Brown JW. 2011. Medial prefrontal cortex as an action-outcome predictor. Nat Neurosci. 14: 1338-1344.
Amiez C, Joseph JP, Procyk E. 2005. Anterior cingulate error-related activity is modulated by predicted reward. Eur J Neurosci. 21: 3447-3452.
Amiez C, Neveu R, Warrot D, Petrides M, Knoblauch K, Procyk E. 2013. The location of feedback-related activity in the midcingulate cortex is predicted by local morphology. J Neurosci. 33: 2217-2228.
Aston-Jones G, Cohen JD. 2005. An integrative theory of locus coeruleus-norepinephrine function: adaptive gain and optimal performance. Annu Rev Neurosci. 28: 403-450.
Barkley RA. 2001. Linkages between attention and executive functions. In: Reid Lyon G, Krasnegor NA, eds. Attention, memory and executive function P.H. Brooks p 307-326.
Barraclough DJ, Conroy ML, Lee D. 2004. Prefrontal cortex and decision making in a mixed-strategy game. Nat Neurosci. 7: 404-410.
Bartumeus F, da Luz MG, Viswanathan GM, Catalan J. 2005. Animal search strategies: a quantitative random-walk analysis. Ecology. 86: 3078-2087.
Behrens TE, Hunt LT, Rushworth MF. 2009. The computation of social behavior. Science. 324: 1160-1164. Behrens TE, Woolrich MW, Walton ME, Rushworth MF. 2007. Learning the value of information in an uncertain
world. Nat Neurosci. 10: 1214-1221. Botvinick MM, Braver TS, Barch DM, Carter CS, Cohen JD. 2001. Conflict monitoring and cognitive control.
Psychol Rev. 108: 624-652. Brown JW, Braver TS. 2005. Learned predictions of error likelihood in the anterior cingulate cortex. Science. 307:
1118-1121. Cohen JD, Aston-Jones G, Gilzenrat MS. 2004. A systems-level perspective on attention and cognitive control. In:
Posner MI, ed. Cognitive Neuroscience of attention New York: Guilford p 71-90. Cohen JD, McClure SM, Yu AJ. 2007. Should I stay or should I go? How the human brain manages the trade-off
between exploitation and exploration. Philos Trans R Soc Lond B Biol Sci. 362: 933-942. Collins AG, Frank MJ. 2012. How much of reinforcement learning is working memory, not reinforcement
learning? A behavioral, computational, and neurogenetic analysis. Eur J Neurosci. 35: 1024-1035. Daw ND. 2011. Trial-by-trial data analysis using computational models. In: Affect, Learning and Decision Making.
New York: Oxford University Press Daw ND, O'Doherty JP, Dayan P, Seymour B, Dolan RJ. 2006. Cortical substrates for exploratory decisions in
humans. Nature. 441: 876-879. De Lillo C, Visalerberghi E, Aversano M. 1997. The organization of exhaustive searches in a patchy space by
capuchin monkeys (cebus apella). J Comp Psychol. 111. Dehaene S, Kerszberg M, Changeux JP. 1998. A neuronal model of a global workspace in effortful cognitive tasks.
Proc Natl Acad Sci U S A. 95: 14529-14534. Desrochers TM, Jin DZ, Goodman ND, Graybiel AM. 2010. Optimal habits can develop spontaneously through
sensitivity to local cost. Proc Natl Acad Sci U S A. 107: 20512-20517. Domenech P, Dreher JC. 2010. Decision threshold modulation in the human brain. J Neurosci. 30: 14305-14317. Dosenbach NU, Visscher KM, Palmer ED, Miezin FM, Wenger KK, Kang HC, Burgund ED, Grimes AL, Schlaggar BL,
Petersen SE. 2006. A core system for the implementation of task sets. Neuron. 50: 799-812. Doya K. 2002. Metalearning and neuromodulation. Neural Netw. 15: 495-506. Durstewitz D, Seamans JK. 2008. The dual-state theory of prefrontal cortex dopamine function with relevance to
catechol-o-methyltransferase genotypes and schizophrenia. Biol Psychiatry. 64: 739-749. Durstewitz D, Vittoz NM, Floresco SB, Seamans JK. 2010. Abrupt transitions between prefrontal neural ensemble
states accompany behavioral transitions during rule learning. Neuron. 66: 438-448.

Khamassi et al. Adaptive control in prefrontal cortex
35
Enomoto K, Matsumoto N, Nakai S, Satoh T, Sato TK, Ueda Y, Inokawa H, Haruno M, Kimura M. 2011. Dopamine neurons learn to encode the long-term value of multiple future rewards. Proc Natl Acad Sci U S A. 108: 15462-15467.
Fonio E, Benjamini Y, Golani I. 2009. Freedom of movement and the stability of its unfolding in free exploration of mice. Proc Natl Acad Sci U S A. 106: 21335-21340.
Frank MJ, Doll BB, Oas-Terpstra J, Moreno F. 2009. Prefrontal and striatal dopaminergic genes predict individual differences in exploration and exploitation. Nat Neurosci. 12: 1062-1068.
Holroyd CB, Coles MG. 2002. The neural basis of human error processing: reinforcement learning, dopamine, and the error-related negativity. Psychol Rev. 109: 679-709.
Humphries MD, Khamassi M, Gurney K. 2012. Dopaminergic Control of the Exploration-Exploitation Trade-Off via the Basal Ganglia. Frontiers in neuroscience. 6: 9.
Ishii S, Yoshida W, Yoshimoto J. 2002. Control of exploitation-exploration meta-parameter in reinforcement learning. Neural Netw. 15: 665-687.
Ito M, Doya K. 2009. Validation of decision-making models and analysis of decision variables in the rat basal ganglia. J Neurosci. 29: 9861-9874.
Kaping D, Vinck M, Hutchison RM, Everling S, Womelsdorf T. 2011. Specific contributions of ventromedial, anterior cingulate, and lateral prefrontal cortex for attentional selection and stimulus valuation. PLoS Biol. 9: e1001224.
Kennerley SW, Wallis JD. 2009. Evaluating choices by single neurons in the frontal lobe: outcome value encoded across multiple decision variables. Eur J Neurosci. 29: 2061-2073.
Kennerley SW, Walton ME. 2011. Decision making and reward in frontal cortex: complementary evidence from neurophysiological and neuropsychological studies. Behav Neurosci. 125: 297-317.
Kennerley SW, Walton ME, Behrens TE, Buckley MJ, Rushworth MF. 2006. Optimal decision making and the anterior cingulate cortex. Nat Neurosci. 9: 940-947.
Kerns JG, Cohen JD, MacDonald AW, 3rd, Cho RY, Stenger VA, Carter CS. 2004. Anterior cingulate conflict monitoring and adjustments in control. Science. 303: 1023-1026.
Khamassi M, Enel P, Dominey PF, Procyk E. 2013. Medial prefrontal cortex and the adaptive regulation of reinforcement learning parameters. Prog Brain Res. 202: 441-464.
Khamassi M, Lallee S, Enel P, Procyk E, Dominey PF. 2011. Robot cognitive control with a neurophysiologically inspired reinforcement learning model. Front Neurorobot. 5: 1.
Kolling N, Behrens TE, Mars RB, Rushworth MF. 2012. Neural mechanisms of foraging. Science. 336: 95-98. Kouneiher F, Charron S, Koechlin E. 2009. Motivation and cognitive control in the human prefrontal cortex. Nat
Neurosci. 12: 939-945. Krichmar JL. 2008. The neuromodulatory system – a framework for survival and adaptive behavior in a
challenging world. Adapt Behav. 16: 385-399. Landmann C, Dehaene S, Pappata S, Jobert A, Bottlaender M, Roumenov D, Le Bihan D. 2007. Dynamics of
prefrontal and cingulate activity during a reward-based logical deduction task. Cereb Cortex. 17: 749-759. Lau B. 2014. Matlab code for diagnosing collinearity in a regression design matrix. figshare.
http://dx.doi.org/10.6084/m9.figshare.1008225. Leung HC, Gore JC, Goldman-Rakic PS. 2002. Sustained mnemonic response in the human middle frontal gyrus
during on-line storage of spatial memoranda. J Cogn Neurosci. 14: 659-671. Luk CH, Wallis JD. 2009. Dynamic encoding of responses and outcomes by neurons in medial prefrontal cortex. J
Neurosci. 29: 7526-7539. MacDonald AW, 3rd, Cohen JD, Stenger VA, Carter CS. 2000. Dissociating the role of the dorsolateral prefrontal
and anterior cingulate cortex in cognitive control. Science. 288: 1835-1838. Matsumoto M, Matsumoto K, Abe H, Tanaka K. 2007. Medial prefrontal cell activity signaling prediction errors of
action values. Nat Neurosci. 10: 647-656. McClure SM, Gilzenrat MS, Cohen JD. 2006. An exploration–exploitation model based on norepinephrine and
dopamine activity. In: Weiss Y, Sholkopf B, Platt J, eds. Advances in neural information processing systems MIT Press, Cambridge, MA p 867–874.
Miller EK, Cohen JD. 2001. An integrative theory of prefrontal cortex function. Annu Rev Neurosci. 24: 167-202. Panzeri S, Senatore R, Montemurro MA, Petersen RS. 2007. Correcting for the sampling bias problem in spike
train information measures. J Neurophysiol. 98: 1064-1072. Panzeri S, Treves A. 1996. Analytical estimates of limited sampling biases in different information measures.
Network: Computation in Neural Systems. 7: 87-107. Procyk E, Goldman-Rakic PS. 2006. Modulation of dorsolateral prefrontal delay activity during self-organized
behavior. J Neurosci. 26: 11313-11323.

Khamassi et al. Adaptive control in prefrontal cortex
36
Procyk E, Tanaka YL, Joseph JP. 2000. Anterior cingulate activity during routine and non-routine sequential behaviors in macaques. Nat Neurosci. 3: 502-508.
Quian Quiroga R, Panzeri S. 2009. Extracting information from neuronal populations: information theory and decoding approaches. Nat Rev Neurosci. 10: 173-185.
Quilodran R, Rothé M, Procyk E. 2008. Behavioral shifts and action valuation in the anterior cingulate cortex. Neuron. 57(2): 314–325.
Rothe M, Quilodran R, Sallet J, Procyk E. 2011. Coordination of High Gamma Activity in Anterior Cingulate and Lateral Prefrontal Cortical Areas during Adaptation. J Neurosci. 31: 11110-11117.
Rushworth MF, Behrens TE. 2008. Choice, uncertainty and value in prefrontal and cingulate cortex. Nat Neurosci. 11: 389-397.
Satoh T, Nakai S, Sato T, Kimura M. 2003. Correlated coding of motivation and outcome of decision by dopamine neurons. J Neurosci. 23: 9913-9923.
Schultz W, Dayan P, Montague PR. 1997. A neural substrate of prediction and reward. Science. 275: 1593-1599. Schweighofer N, Doya K. 2003. Meta-learning in reinforcement learning. Neural Netw. 16: 5-9. Seo H, Lee D. 2007. Temporal filtering of reward signals in the dorsal anterior cingulate cortex during a mixed-
strategy game. J Neurosci. 27: 8366-8377. Seo H, Lee D. 2008. Cortical mechanisms for reinforcement learning in competitive games. Philos Trans R Soc
Lond B Biol Sci. 363: 3845-3857. Seo H, Lee D. 2009. Behavioral and neural changes after gains and losses of conditioned reinforcers. J Neurosci.
29: 3627-3641. Sutton RS, Barto AG. 1998. Reinforcement learning: an introduction. Cambridge, MA London, England: MIT
Press. Treves A, Panzeri S. 1995. The upward bias in measures of information derived from limited data samples.
Neural Comput. 7: 399-407. Vogt BA, Vogt L, Farber NB, Bush G. 2005. Architecture and neurocytology of monkey cingulate gyrus. J Comp
Neurol. 485: 218-239. Wang XJ. 2010. Neurophysiological and computational principles of cortical rhythms in cognition. Physiol Rev.
90: 1195-1268. Wilson CR, Gaffan D, Browning PG, Baxter MG. 2010. Functional localization within the prefrontal cortex:
missing the forest for the trees? Trends Neurosci. 33: 533-540.
Acknowledgments
The authors would like to thank Jacques Droulez, Mark D. Humphries, Henry Kennedy, Olivier
Sigaud and Charlie R.E. Wilson for comments on an early version of the manuscript, and Francesco P.
Battaglia and Erika Cerasti for useful discussions. They also would like to thank anonymous reviewers
for thorough comments and questions which helped drastically improve the manuscript. This work
was supported by the Agence Nationale de la Recherche ANR LU2 and EXENET, Région Rhône-Alpes
projet Cible, and by the labex CORTEX ANR-11-LABX-0042 for EP; by EU FP7 Project Organic (ICT
231267) for PFD; By Facultad de Medicina Universidad de Valparaíso (MECESUP UVA-106) and by
Fondation pour la Recherche Médicale for RQ; By ANR (Amorces and Comprendre) for PFD and MK.

Khamassi et al. Adaptive control in prefrontal cortex
37
Table 1 Score obtained by each tested theoretical model, models’ characteristics, and model performances to fit monkey choices for Optimization (Opt) and Test sessions.
Models r
1 RL2 NP
3 Opt -LL4
Opt NL5
Opt %6
Opt -LPP7
Opt BIC/28
Opt AIC/29
Test -LL4
Test NL5
Test %6
GQLSB2β Y Y 4 3290 .5921 83.47 3459 3360 3298 29732 .5830 74.17 SBnoA2β Y N 3 3385 .5831 84.13 3422 3438 3391 30901 .5708 73.11 GQLSB Y Y 3 3355 .5859 83.80 3502 3408 3361 29539 .5850 73.43 SBnoA Y N 2 3454 .5768 84.29 3480 3489 3458 30613 .5738 72.59 SBnoF Y N 1 3586 .5648 84.43 3604 3604 3588 32169 .5578 71.61 GQLBnoS Y Y 3 3721 .5528 78.59 3847 3773 3727 33274 .5467 69.47 GQLSnoB Y Y 3 3712 .5536 76.66 3843 3764 3718 31501 .5646 70.12 GQLnoSnoB Y Y 3 4253 .5079 69.14 4292 4305 4259 35376 .5262 66.60 GQL N Y 3 5590 .4104 65.10 5994 5643 5596 49282 .4089 53.20 QL N Y 2 5960 .3869 44.92 7755 5995 5964 59734 .3382 48.78 ClockS Y N 2 5249 .4333 70.92 5841 5284 5253 47504 .4223 58.71 RandS Y N 1 4607 .4800 69.43 4621 4624 4609 39488 .4884 63.73
1 Resetting action values at the beginning of each new problem (Yes or No) 2 Reinforcement Learning (RL) mechanisms or not 3 Number of free meta-parameters 4 Negative Log Likelihood 5 Normalized Likelihood over all trials 6 Percentage of trials where the model correctly predicted monkey choice 7 Log of Posterior Probability 8 Bayesian Information Criterion 9 Akaike Information Criterion

Khamassi et al. Adaptive control in prefrontal cortex
38
FIGURE LEGENDS
Figure 1. Task, recording sites, and trial epochs for analyses. (A) Problem Solving task. Monkeys had
to find by trial and error which target, presented in a set of four, was rewarded. Trial: description of
events in a trial (see methods). A juice reward is delivered if the trial was correct while only a blank
screen is presented for errors. Problem: In each trial the animal could select a target until the solution
was discovered (search period). Each block of trials (or problem) contained a search period and a
repetition period during which the correct response was repeated at least three times. A Signal to
Change (SC) is presented on the screen to indicate the beginning of a new problem. (B) Recording
sites for LPFC (grey spots) and dACC (black spots) for the two monkeys. dACC recordings covered a
region in the dorsal bank of the anterior cingulate sulcus, at stereotaxic levels superior to A+30, i.e.
rostral levels of the mid-cingulate cortex. Recording sites in LPFC were located on the posterior third
of the principal sulcus. (C) Target identifications and definition of epochs used for single unit analyses.
Figure 2. Model-based behavioral analyses. (A-left) Illustration of the trial by trial evolution of action
values after meta-parameters optimization so that the model behaves similarly to the monkey.
Sample data presented for 100 successive trials. The barcode on the top indicates the current correct
target. Each of the 4 targets is associated to one grey level. Head arrows represent the Signal to
Change (SC) presented at the beginning of each new problem. The second barcode indicates the
target selected by the animal in each trial. The third barcode indicates the target selected by the
model based on the feedback obtained by the animal. Variation of action values for each of the 4
targets are represented by curves. The high learning rate (α=0.9) that resulted from the optimization
produced sharp variations of action values. The data are presented for two models (SBnoA and
GQLSB). (A-middle) Proportion of shifts after SC for monkeys M and P. (A-right) Proportion of
selection of each target in the first trial of each problem across sessions of recordings. Each line
represents one target position. (B) Reaction times (RT) measured in two monkeys averaged for typical
optimal problems: those where the monkey made 2 errors (INC1 and INC2) during the search period,
found the correct target (CO1) in the third trial, and repeated the correct choice from 3 to 7 times
(CO2 to CO8), depending on the problem's length, during repetition trials. **: p<0.005, ***:p<0.001.
(C) Percentage of errors made by the animal during the repetition periods against the exploration rate
βR of the repetition periods. One data point per session. (D) Scores obtained by each tested model
during the model comparison analysis (see methods). Opt -LL = negative log-likelihood on the
optimization dataset. -LPP = negative log of posterior probability. BIC = Bayesian Information Criterion.
AIC = Akaike Information Criterion. Test -LL = negative log-likelihood on the test dataset. (E)

Khamassi et al. Adaptive control in prefrontal cortex
39
Distribution of exploration meta-parameters obtained after optimization of the model on monkey's
behavior using distinct degrees of freedom during the search period (βS) and the repetition period
(βR).
Figure 3. Variations of early-delay activity and choice selectivity. (A-top) Proportions of dACC and
LPFC cells with a higher activity during search or repetition. (A-bottom) Proportions of dACC and LPFC
cells with a higher choice selectivity during Sea or Rep. (B) Number of cells with significant changes (in
grey) in average unit activity between search (Sea) and repetition (Rep). The histograms represent the
distribution of indices of variation of activity from search to repetition computed in the early-delay
epoch with equation (9) in dACC and LPFC neurons. Grey bars represent neurons with significantly
different activity between search and repetition trials (Kruskal-Wallis test, p < 0.05). White bars
represent neurons with non-significantly different activity in search and repetition. (C) Increase of
choice selectivity from search to repetition in the two structures. Stars indicate statistically significant
comparisons *: p<0.05, **: p<0.01. (D) Compared to dACC neurons (grey bars), a higher proportion of
LPFC neurons showed significant mutual information between the early-delay average firing rate and
the animal's choice. Dashed grey and black lines represent the medians for dACC and LPFC
respectively.
Figure 4. Early-delay choice selectivity varies with exploration level. (A). The average choice
selectivity index is presented for units recorded in dACC (top) and LPFC (bottom), in sessions grouped
according to the fitted model's exploration meta-parameters for repetition (βR). The average
population index is measured for search (grey bars) and repetition (white bars) trials in the early-delay
epoch, separately for sessions where βR was inferior or superior to 5. Stars indicate statistically
significant comparisons. *: p<0.05. (B). Proportion of dACC and LPFC early-delay choice selective
neurons during repetition periods of sessions where βR was small (<5) or large (>5). Only LPFC
revealed a significant change in proportion.
Figure 5. Two examples of action value neurons. (A) dACC unit negatively correlated with the value
of target #4. (Top) plot of single trial activity (black dots) measured in the post-target epoch against
the Q-value, for trials where the animal chose target 4. Large grey dots represent the average for one
decile of the value distribution and are just used for illustration. The dashed line represents the linear
regression computed from single trial data. (Middle) peri-stimulus histograms aligned on target onset
(Target ON) and the corresponding raster plots for trials in which the animal chose target 4 (in black)
and for the other trials (in grey). The post-target epoch is represented in grey on the time line.
Khamassi et al. Adaptive control in prefrontal cortex
40
(Bottom) trial by trial evolution of the average activity measured in the post-target epoch during
successive trials in a session. The upper grey barcode represents the correct target to be chosen (4
greys for 4 target positions; corresponding target number is indicated above the bar code). The
second barcode represents the target chosen by the animal in each trial. Below, the graph represents
the average activity for each trial and, the trial by trial evolution of key model variables. Grey areas
represent trials where the animal selected target #4. See main text for details. (B) LPFC neuron with a
positive correlation with the value of target #2 during the post-target epoch. Conventions as in A.
Figure 6. Proportions of dACC and LPFC cells with activity correlated with one of the model
variables (Q, δ, and U) in one of the 9 trial epochs (bars from left to right: pre-start, delay, pre-
target, post-target, pre-touch, pre-feedback, early-feedback, late-feedback, ITI). The white and black
arrow heads indicate touch and feedback respectively. There were more LPFC cells correlated with
one of the action-values (Q, in A). In B and C, δ+ or δ- represent respectively positive and negative
correlations with δ. A higher proportion of dACC cells were either positively or negatively correlated
with δ (δ+ or δ-) compared to LPFC. These cells mostly responded during post-feedback epochs, and
very few cells retained a trace of the previous δ during the beginning of the next trial (pre-feedback
epochs). There were more U cells in dACC than in LPFC (in D). See text for details. E. Proportion of
cells, for each epoch, showing a significant correlation with at least one model variable.
Figure 7. Six examples (A-F) of unit activity correlated with some of the model's variables. Line
graphs represent average activity aligned on feedback (FB), trial start, or target onset. The grey
intensity of lines corresponds to the different trial types as described in the bar graphs below. The
grey zone on each time axis represents the epoch used for average measures displayed in the bar
graph. Bar graphs represent, for each unit, the average activity measured in the time epoch for the 6
trial types of a typical problem. The trial types in search are: sea1 (first error trial, black), sea2 (second
error trial, dark grey), sea3 (third trial in search for activity measured before feedback, grey), and CO1
(first correct trial for activity measured after the feedback, grey in A, B, and E). Trial types in repetition
are CO2, CO3, and CO4 (light grey). (A) example of dACC activity negatively correlated with RPE (δ-).
(B) example of LPFC activity negatively correlated with RPE (δ-). (C) example of LPFC activity
correlated with U. (D) example of dACC activity negatively correlated with U. (E) example of dACC
activity positively correlated with RPE (δ+). (F) example of activity discriminating search and repetition
but with a different profile than U.

Khamassi et al. Adaptive control in prefrontal cortex
41
Figure 8. Multiplexing of information and variations during epochs in dACC and LPFC. (A) A principal
component analysis was performed on the regression coefficients found for each neuron and for each
model variable (Q: the action value of the animal's preferred target, δ, and U; Model GQLSB2β). The
absolute value of the eigen values for each principal component computed during the early-feedback
epoch are shown in each matrix for one trial epoch. Black denotes strong weights. Data are presented
for each monkey M and P. (B) Evolution of the entropy-like factor on regression coefficients computed
for 2 variables Q and U, and Q and δ. A * indicates a statistically significant difference between dACC
(in grey) and LPFC (in black). (C) Proportion of total variance explained by each model variable over
the 3 PCs for dACC and LPFC data along trial epochs. See main text for details.
Figure 9. Variations of choice selectivity in δ-cells. (A) Example of a LPFC cell responding after errors
(activity negatively correlated with δ in the late-feedback epoch) and showing an increase in choice
selectivity at the beginning of trials. Left: error trials are illustrated in grey, correct trials in black.
Right: trials are grouped by chosen targets. 4 grey curves for 4 target locations. (B) Percentage of
dACC and LPFC δ-cells showing a significant increase in choice selectivity from search to repetition. (C)
Averaged population activity (50 ms bins) of all dACC (left) and LPFC (right) units negatively correlated
with δ. For each cell, the activity was averaged separately for trials in which the animal selected the
cell's preferred target (black plain line), the second preferred target (black dashed line), the third (gray
dashed line) or the least preferred target (gray plain line). The activity is represented in 3s windows
centered on the feedback time (FB, Left) and on the next trial start (ST, Right), for search trials (Top)
and repetition trials (Bottom). In LPFC, negative δ cells showed an increase in choice selectivity in the
post-start epoch of repetition trials.
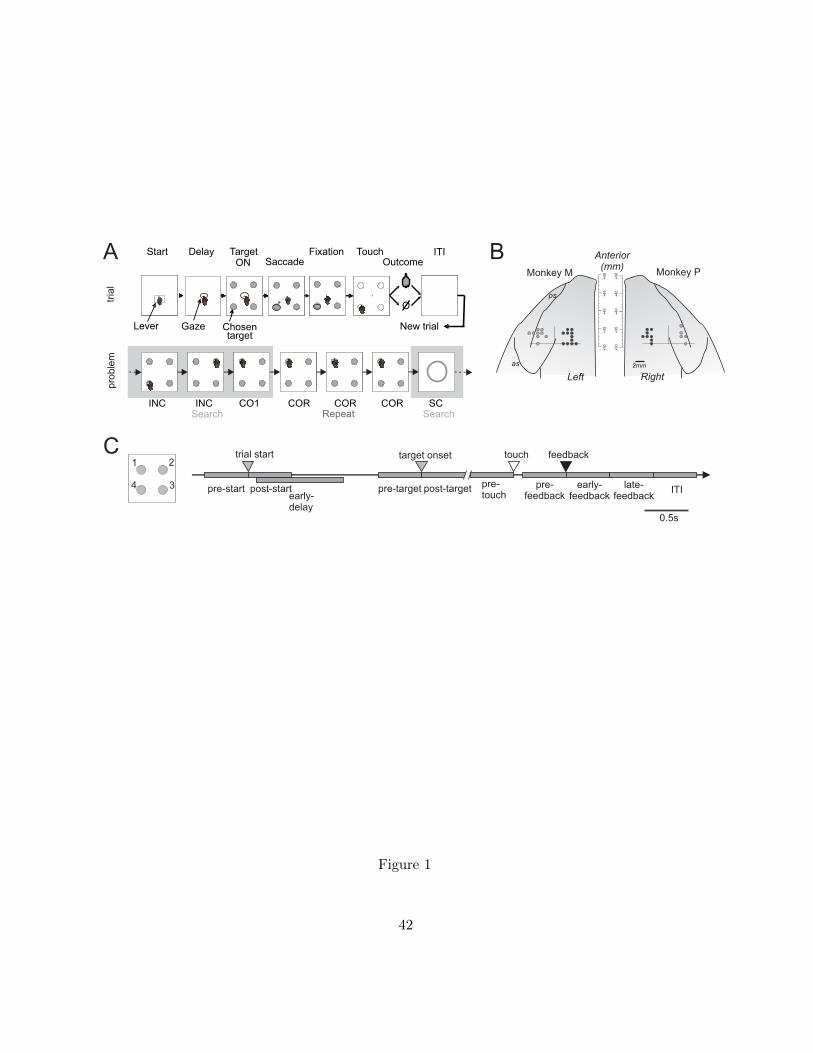
+3
0+
35
+4
0+
45
+5
0
Left
Anterior(mm)
Monkey M
-2-6 6-4
12
34
5
0 42 4
+3
0+
35
+4
0+
45
+5
0
Right
Monkey P
0 -6-226
12
34
5
4 -4
2mm
ps
as
B
1 2
34 pre-start post-start
trial start target onset touch feedback
pre-target post-target ITIlate-feedback
early-feedback
pre-feedback
pre-touchearly-
delay0.5s
C
A Start Delay TargetSaccade
Fixation
Lever Gaze Chosen target
ON
RepeatINC INC CO1 COR
tria
lpro
ble
m
TouchOutcome
COR COR
New trial
O
ITI
SCSearch Search
Figure 1
42

D
100
50
0Stay Shift StayShift
M P
perc
ent st
rate
gy
after
Sig
nal t
o c
hange
sessions
monkey M
monkey P
pro
port
ion o
f se
lect
ions
0
.5
1
20 40 60 800
.5
1
20 40 60 80
A
E
4
321
B
**
*****
**
***
CO2 - - CO8
Repetition
CO5 - -
monkey M monkey P
0.1
0.14
0.18
0.22
0.26
RT
(s)
0.1
0.14
0.18
0.22
0.26
RT
(s)
INC1 INC2 CO1 CO2 - - CO8
Search Repetition
CO5 - - INC1 INC2 CO1
Search
C50
0
20
40
30
10
0 10 1 10 2 10
bR
% e
rror
during r
epetit
ion
4
3214
321
4
321
20 40 60 80 100 120-1
0
1
target selected by model SBnoA
20 40 60 80 100 120
-.5
0
.5
corr
ect
act
ion v
alu
es
monke
y
target selected by model GQLSB
act
ion v
alu
es
412 31 2 2 143 2 14 41 23 3 32 2
trials
Opt -LL
Opt -LPP
Opt BIC/2
Opt AIC/2
Test -LL/10
11
GQLSB
2b
10
GQL
10
QL
01
SBnoF
01
ClockS
01
RandS
reset11
GQLSB¯
11
GQLSB̄
11
GQLSB¯ ¯
RL 01
SBnoA
2b
11
GQLSB
01
SBnoA
2800
3800
4800
5800
6800
7800
num
ber
of se
ssio
ns
0 5 10 15 20 25 ³300
20
40
60
80
100
120
140
optimal beta
bS
bR
arb
itrary
units
Figure 2
43

Figure 3. Variations of early-delay activity and choice selectivity. (A-top) Proportions of dACC and LPFC cells with a higher activity
during search or repetition. (A-bottom) Proportions of dACC and LPFC cells with a higher choice selectivity during Sea or Rep. (B)
Number of cells with significant changes (in grey) in average unit activity between search (Sea) and repetition (Rep). The histograms
represent the distribution of indices of variation of activity from search to repetition computed in the early-delay epoch with equation
(9) in dACC and LPFC neurons. Grey bars represent neurons with significantly different activity in between search and repetition trials
(Kruskal-Wallis test, p < 0.05). White bars represent neurons with non-significantly different activity in search and repetition. (C)
Increase of choice selectivity from search to repetition in the two structures. Stars indicate statistically significant comparisons *:
p<0.05, **: p<0.01. (D) Compared to dACC neurons (grey bars), a higher proportion of LPFC neurons showed significant mutual
information between the early-delay average firing rate and the animal's choice. Dashed grey and black lines represent the medians for
dACC and LPFC respectively.
C
A dACC LPFC
noneSearch > RepetitionRepetition > Search
non selective selective in Searchselective in Repetitionselective in both
act
ivity
choic
e s
ele
ctiv
ity
0.6
0.65
0.7
0.75
0.8
0.85
dACC LPFC
choic
e s
ele
ctiv
ity
**
*
BdACC
-1 0 1
40
80
120
nu
mb
er
of
ne
uro
ns
LPFC
40
80
-1 0 1
nu
mb
er
of
ne
uro
ns
D
Sea > Rep Rep > Sea
Sea > Rep Rep > Sea
mutual information between firing rateand monkey choice
num
ber
of ce
lls
0 0.1 0.2 0.3 0.4 0.5 0.6 0.70
5
10
15
20
25
30
35
40
LPFCdACC
activity of 575 dACC cells and 230 LPFC cells
SearchRepetition
Figure 3
44

sele
ctiv
ity index
LPFC
b <5 R b >5 R
sele
ctiv
ity in
dex
0.6
0.7
0.8
0.9
0.6
0.7
0.9
1
b <5 R b >5 R
0.8
1
*
****
dACC in SEAin REP
0
20
40
60
80
100
0
20
40
60
80
100LPFC
**
b <5 R b >5 R
% c
hoiv
e s
ele
ctiv
e n
euro
ns
b <5 R b >5 R
A B dACC
% c
hoiv
e s
ele
ctiv
e n
euro
ns
Figure 4
45

A B
corr
ect
chose
n
target 4 12 31 2 21 4 3 2 1 4 4 3 2
30
spk/
s
0
20 40 60 80 100trials
corr
ect
chose
n
41 2 32 2 2 2 24 4 41 1 113 3target
0
40
-3 -2 -1 0 1 2 3 (s)target ON
spk/
str
ials
(ch
orn
olo
gic
al o
rder)
touch
target 4other
-3 -2 -1 0 1 2 3
0
10
target ON
spk/
str
ials
(ch
orn
olo
gic
al o
rder)
(s)touch
target 2other
1
d
d a
nd
UQ
2
U
post
-Targ
et m
ean firin
g r
ate
(sp
k/s)
MOP2_5460 correlation : r=0.37 p<0.0001
-1 -0.5 0 0.5 1
0
10
20
30
Q2
MH3_3956 correlation : r=-0.58 p<0.0001
post
-Targ
et m
ean firin
g r
ate
(sp
k/s)
-1 -0.8 -0.6 -0.4 -0.2 0 0.2 0.4 0.6 0.8 10
10
20
30
40
Q4
-1
0
1
-2
-1
0
1
d and U
- Q
4
Ud
-1
0
1
-2
-1
0
1
spk/
s
40
trials
0
10 20 30 40 50 60 70 80 90 100
Figure 5
46

A
B
C
D
E
*
***
pre-start
pre-target
early-FB
pre-touch
ITI
dACCLPFC
10
15
20
25
30
35
% o
f ce
lls
397 dACC neurons 145 LPFC neurons
0
20
0
20
0
20
0
20
% o
f ce
lls%
of
cells
% o
f ce
lls%
of
cells
d-
d+
U
Q
pre-feedback(FB) epochs
post-FB epochs
pre-feedback(FB) epochs
post-FB epochs
pre-start
pre-target
early-FB
pre-FB
pre-touch
ITI pre-start
pre-target
early-FB
pre-FB
pre-touch
ITI
0
20
0
20
0
20
0
20
Figure 6
47
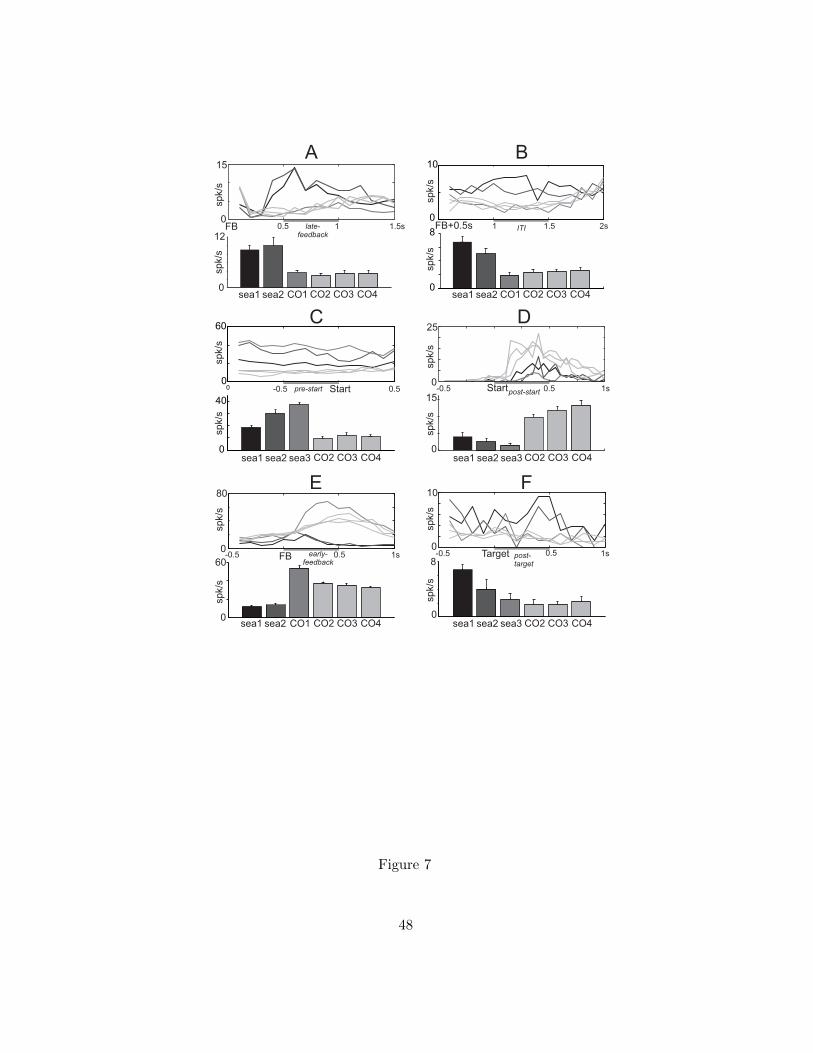
A B
25
0
15
0
Start
spk/
ssp
k/s
0.5 1s-0.5
80
0
60
0
0.5 1s
spk/
ssp
k/s
FB-0.5
10
0
8
0
spk/
ssp
k/s
0.5Target 1s-0.5
C D
E F
FB 0.5 1 1.5s
15
0
12
0
spk/
ssp
k/s
10
0
8FB+0.5s
01 1.5 2s
sea1 sea2 CO1 sea1 sea2 sea3
sea1 sea2 sea3
sea1 sea2 CO1 CO2 CO3 CO4 sea1 sea2
spk/
ssp
k/s
post-target
early-feedback
post-start
late-feedback
ITI
CO1 CO2 CO3 CO4
CO2 CO3 CO4
CO2 CO3 CO4CO2 CO3 CO4
spk/
ssp
k/s
0.5Startpre-start00
60
0
40
sea1 sea2 sea3 CO2 CO3 CO4
-0.5
Figure 7
48

A
0
1
Q
U
d
Q
U
d
dACC
LPFC
pre-start post-start pre-target post-targetlate-
feedbackearly-
feedbackpre-
feedbackpre-
touch ITI
PC1 PC2 PC3m
onkey
M
pre-feedback(FB) epochs
post-FB epochs
dACC
LPFC
pre-start post-start pre-target post-targetlate-
feedbackearly-
feedbackpre-
feedbackpre-
touch ITI
Q
U
d
Q
dU
monkey P
PC1 PC2 PC3
0
0.2
0.4
0.6
Q
U
0.2
0.4
0.6
Cd
0post-start post-target late-
feedbackpre-
feedbackpost-start post-target late-
feedbackpre-
feedback
dACC LPFC
rela
tive p
roport
ion o
f va
riance
exp
lain
ed
pre-start post-start pre-target post-targetlate-
feedbackearly-
feedbackpre-
feedbackpre-
touch ITI
dACC
LPFC
0.7
0.8
ELI on abs(zscore(reg coeffs)) with 2 model variables: Q and U
0.7
0.8
0.9ELI on abs(zscore(reg coeffs)) with 2 model variables: Q and d
0.9B
entr
opy-
like in
dex
dACC
LPFC
*
**
Figure 8
49

A
FB
0
5
10
0
5
10
touch ST-0.5 0 0.5 1 1.5-121.510.50-0.5-1
spik
es/
s
spik
es/
s
(s) (s)
incorrect correct
B C
spik
es/
ssp
ikes/
s
dACC LPFCSearch
Repetition
Search
Repetition
2
10
2
10
2
10
2
10
-1 0 1 -1 0 1FB ST
(s)
-1 0 1 -1 0 1FB ST
(s) -1 0 1 -1 0 1FB ST
(s)
-1 0 1 -1 0 1FB ST
(s)
% o
f d-
cells
with
choic
e s
ele
ctiv
ity in
crease
dACC LPFC0
20
40
60
80
***
Figure 9
50
Behavioral regulation and the modulation of information coding in the lateral prefrontal and cingulate cortex
1,2,3,4 1,2,5 1,2 1,2 1,2Mehdi Khamassi , René Quilodran , Pierre Enel , Peter F. Dominey , Emmanuel Procyk
1 Inserm, U846, Stem Cell and Brain Research Institute, 69500 Bron, France2 Université de Lyon, Lyon 1, UMR-S 846, 69003 Lyon, France
3 Institut des Systèmes Intelligents et de Robotique, Université Pierre et Marie Curie-Paris 6, F-75252, Paris Cedex 05, France4 CNRS UMR 7222, F-75005, Paris Cedex 05, France
5 Escuela de Medicina, Departamento de Pre-clínicas, Universidad de Valparaíso, Hontaneda 2653, Valparaíso, Chile
Supplementary table and figures

dACC LPFC
Q cells 227 (39%) 126 (54%)
RPE cells 252 (44%) 69 (30%)
U cells 206 (36%) 48 (21%)
Cells w. multiple correlates 218 (38%) 75 (32%)
Cells w. single correlates 179 (31%) 70 (20%)
Cells without correlation 179 (31%) 87 (37.5%)
Cells w. correlates without other effect 78 (14%) 20 (9 %)
Excluded cells (not enough trials) 461 (80%) 159 (69%)
Included cells with M.I. < 0.1 111 (19%) 56 (24%)
Included cells with M.I. > 0.1 4 (1%) 17 (7%)
M.I. cells without other effect 0 (0%) 0 (0%)
SEA<REP cells 96 (17%) 20 (9%)
SEA>REP cells 116 (20%) 39 (17%)
Non signif. variation cells 364 (63%) 173 (75%)
SEA<>REP cells without other effect 22 (4%) 4 (2%)
SEA-REP choice selectivity analysis
SEA only selective cells 60 (10%) 12 (5%)
REP only selectivecells 162 (28%) 83 (36%)
Both SEA and REP selective cells 64 (11%) 60 (26%)
Non selective cells 290 (50%) 77 (33%)
Choice selective cells without other effect 27 (5%) 13 (6%)
Non task-related cells 61 (11%) 38 (16%)
TOTAL number single units analysed 576 (100%) 232 (100%)
Multiple regression analysis
Mutual Info analysis
REP activity variation analysis-SEA
SUMMARY TABLE
Analysis on all cells
Cells with M.I. < 0.1 409 (71%) 145 (62.5%)
Cells with M.I. > 0.1
167 (29%)
87 (37.5%)
Restrictive analysis (requiring a large number of samples)

Q
U
d
PC1 PC2 PC3 PC1 PC2 PC3PC1 PC2 PC3
Q
U
d
Q
U
d
−200 0 200 400 6000100
200300
00.5
1
Q−200 0 200 400 6000
100200
300
050
100
Q
d
U
−200 0 200 400 6000100
200300
0500
1000
Q
U
dd
U
weak U reg.coefs medium U reg.coefs strong U reg.coefsA High covariation between regression coefficients for Q and d
Figure S1. Simulations testing the effect of covarying variables. 6 ensembles of virtual data were created with covariations of coefficients of
regressions (found with the multiple regression analysis cell x model variables) associated to Q and d, and for which the coefficients associated to U are independant and represent a uniform noise (across the entire Z axis). The 6 data sets illustrate (from left to right, and from top to bottom) :
- case of strong covariation between coefficients for Q and d, and weak reg coefficients associated to U (between 0 and 1)
- case of strong covariation between coefficients for Q and d, and medium reg coefficients associated to U (between 0 et 100)
- case of strong covariation between coefficients for Q and d, and strong reg coefficients associated to (between 0 et 1000)
- case of weak covariation between coefficients for Q and d, and weak reg coefficients associated to U (between 0 and 1)
- case of weak covariation between coefficients for Q and d, and medium reg coefficients associated to U (between 0 et 100)
- case of weak covariation between coefficients for Q and d, and strong reg coefficients associated to (between 0 et 1000) For each of the 6 cases 3 graphs are shown from top to bottom: - distribution of coefficients of regression for each of the 576 simulated cell data (one point per cell), - a matrix of the Principal Components (PC) for the three model variables (as in figure 8A), - the ELI (entropy-like
index) measured on the absolute value of the Z-scores of the coefficients of regression associated to d and Q.
These analyses show that the strength of correlation with model variables is reflected in the order of the principal components. They also show that strong covariation between regression coefficients for two different model variables results in principal components expressed as a function of both variables with nearly equal strength. These are the characteristics that are expected from the Principal Component Analysis applied to real neural data in dACC and LPFC.
0.94
0.96
0.94
0.96
0.94
0.96
E.L
.I.
E.L
.I.
E.L
.I.
weak U reg.coefs medium�U reg.coefs strong U reg.coefs
B
Q
U
d
PC1 PC2 PC3
Q
U
d
PC1 PC2 PC3
Q
U
d
PC1 PC2 PC3
Weak covariation between regression coefficients for Q and d
−200 0 200 400 6000100
200300
00.5
1
Q−2000 200 400 6000
100200
300
050
100
Q−2000 200 400 6000
100200
300
0500
1000
Q
d dd
U UU
0.94
0.96
0.94
0.96
0.94
0.96
E.L
.I.
E.L
.I.
E.L
.I.

a
b
k0.2 0.3 0.4 0.5 0.6 0.7 0.8 0.9 10
40
80
120
160
200
optimal alpha
GQLSB distribution of alpha parameter (learning rate)
num
ber
of se
ssio
ns
0.2 0.3 0.4 0.5 0.6 0.7 0.8 0.9 1
optimal alpha
GQLSB2b distribution of alpha parameter (learning rate)
0
40
80
120
160
200
num
ber
of se
ssio
ns
0 5 10 15 20 25 ³300
20
40
60
80
100
120
140
optimal beta
GQLSB distribution of beta parameter (exploration rate)
num
ber
of se
ssio
ns
0 5 10 15 20 25 ³300
50
100
150
optimal beta
SBnoA distribution of beta parameter (exploration rate)
num
ber
of se
ssio
ns
0 0.1 0.2 0.3 0.4 0.5 0.6 0.7 0.8 0.9 10
5
10
15
20
25
30
optimal kappa
GQLSBdistribution of kappa parameter (forgetting rate)
num
ber
of se
ssi
ons
0 0.1 0.2 0.3 0.4 0.5 0.6 0.7 0.8 0.9 10
10
20
30
40
50
60
optimal kappa
GQLSB2b distribution of kappa parameter (forgetting rate)
num
ber
of se
ssio
ns
0 0.1 0.2 0.3 0.4 0.5 0.6 0.7 0.8 0.9 10
10
20
30
40
50
60
optimal kappa
SBnoA2bdistribution of kappa parameter (forgetting rate)
num
ber
of se
ssio
ns
0 0.1 0.2 0.3 0.4 0.5 0.6 0.7 0.8 0.9 10
5
10
15
20
25
30
35
optimal kappa
SBnoA distribution of kappa parameter (forgetting rate)
num
ber
of se
ssio
ns
0 10 20 30 40 50 600
10
20
30
40
50
60
optimal betaR from SBnoA2b
optim
albeta
Rfr
om
GQ
LS
B2b
0 10 20 30 40 50 60 70 800
10
20
30
40
50
60
70
80
optimal beta from SBnoA
optim
albeta
from
GQ
LS
B
0 10 20 30 40 50 600
10
20
30
40
50
60
optimal betaS from SBnoA2b
optim
albeta
Sfr
om
GQ
LS
B2b
B
C
Figure S2. Distributions of Beta with model SBNoA and comparisons betwen GQLSB and SBnoA. A. Distribution of exploration
meta-parameters obtained after optimization of the model on monkey's behavior using distinct degrees of freedom during the
search period (β ) and the repetition period (β ). B. Comparisons of optimal bs obtained with SBnoA and GQLSB for one b versions, S R
and 2 b versions. C. Distributions of meta-parameters (a,�b,�k) over sesssions as obtained with the two models SBnoA and GQLSB,
with one or 2 b as indicated on the figures. Green is for SBnoA, orange for GQLSB. Overall the figures shows the high similarity
between the two models in their capacity to describe behaviour.
A
average betanum
ber
of sessio
ns
bS
bR
0 5 10 15 20 25 ³300
20
40
60
80
100

monkey M
dACC LPFC
noneSearch > RepetitionRepetition > Search
non selective selective in Searchselective in Repetitionselective in both
act
ivity
cho
ice
se
lectiv
ity
dACC LPFC
noneSearch > RepetitionRepetition > Search
non selective selective in Searchselective in Repetitionselective in both
activ
ity
cho
ice
se
lectivi
ty
monkey PA
-1 -0.5 0 0.5 10
20
40
60
80
100monkey M dACC
-1 -0.5 0 0.5 10
10
20
30
40
50
60
70
80monkey M LPFC
-1 -0.5 0 0.5 10
10
20
30
40
50monkey P dACC
-1 -0.5 0 0.5 10
5
10
15monkey P LPFC
choic
e s
ele
ctiv
ity
0
0.1
0.2
0.3
0.4
0.5
0.6
0.7
0.8
0.9
1P
dACC LPFC
SearchRepetition
0
0.1
0.2
0.3
0.4
0.5
0.6
0.7
0.8
0.9
1M
*
*
LPFCdACC
choic
e s
ele
ctiv
ity
B C
0 0.1 0.2 0.3 0.4 0.5 0.6 0.70
5
10
15
mk P
median 0.03
median 0.02
0 0.1 0.2 0.3 0.4 0.5 0.6 0.70
5
10
15
20
25
30
mk M
median 0.03
median 0.07
LPFCdACC
num
ber
of ce
lls
num
ber
of ce
lls
mutual information between firing rateand monkey choice
mutual information between firing rateand monkey choice
D
num
ber
of neuro
ns
num
ber
of neuro
ns
Figure S3. Variations of early-delay activity and choice selectivity - data for each monkey (M and P). (A-top) Proportions of dACC and
LPFC cells with a higher activity during search (Sea) or repetition (Rep). (A-bottom) Proportions of dACC and LPFC cells with a higher
choice selectivity during Sea or Rep. (B) Number of cells with significant changes (in grey) in average unit activity between search (Sea)
and repetition (Rep). (C) Increase of choice selectivity from search to repetition in the two structures. Stars indicate statistically
significant comparisons *: p<0.05, **: p<0.01. (D) Mutual information between the early-delay average firing rate and the animal's
choice. Dashed grey and black lines represent the medians for dACC and LPFC respectively.

Figure S4. A. Choice selectivity and exploration level. Data computed using the SBNoA2b model (Left), and proportion of dACC and
LPFC early-delay choice selective neurons during repetition periods of sessions where β was small (<5) or large (>5) (obtained with R
model SBNoA - Right). B. Choice selectivity depending on exploration level using model GQLSB 2 Beta for each monkey (M and 2b
P). The average choice selectivity index is presented for units recorded in dACC (top) and LPFC (bottom), in sessions grouped
according to the fitted model's exploration parameters for search (β ) and repetition (β ). The average population index is measured S R
for search (grey bars) and repetition (white bars) trials in the early-delay epoch, separately for sessions where β was inferior or S
superior to 5, and for sessions where β was inferior or superior to 5. Stars indicate statistically significant comparisons. *: p<0.05. R
When separating the data for the two monkeys, no significant effect was found in dACC for neither monkeys (Kruskal-Wallis test with
Bonferroni correction, p > 0.05), a significant effect of β was found in Monkey M LPFC (Kruskal-Wallis test with Bonferroni correction, R
p < 0.05), and a tendency, although non-significant, was found in Monkey P LPFC.
A
sele
ctiv
ity in
dex
dACC
LPFCse
lect
ivity
index
0.6
0.7
0.8
0.9
1
0.6
0.7
0.8
0.9
1
in SEAin REP
b <5 R b >5 R
b <5 R b >5 R
*****
*
B
0.6
0.7
0.8
0.9
1
0.6
0.7
0.8
0.9
1
*
***
b <5 R b >5 R
b <5 R b >5 R
dACC
LPFC
Monkey M Monkey P
in SEAin REP
sele
ctiv
ity in
dex
sele
ctiv
ity in
dex
0.6
0.7
0.8
0.9
1
0.6
0.7
0.8
0.9
1
sele
ctiv
ity in
dex
sele
ctiv
ity in
dex
b <5 R b >5 R
b <5 R b >5 R
dACC
LPFC
in SEAin REP
0
20
40
60
80
100
0
20
40
60
80
100
**
b <5 R b >5 R
b <5 R b >5 R

Figure S5. Proportions of dACC and LPFC cells with activity correlated with one of the model variables (Q, δ, and U) using 4 different
models. The GQLSB model (A), and the SBNoA model (B) with 1 or 2 b parameter. (top and bottom). The GQLSB 2b is the model used for
further analyses and presented in main figure 6.
GQLSB
0
20
398 dACC neurons
0
20
0
20
0
20
141 LPFC neurons
d-
d+
U
Q
% o
f ce
lls%
of
ce
lls%
of
cells
% o
f ce
lls
pre-feedback(FB) epochs
post-FB epochs
pre-feedback(FB) epochs
post-FB epochs
pre-start
pre-target
early-FB
pre-FB
pre-touch
ITI pre-start
pre-target
early-FB
pre-FB
pre-touch
ITI
pre-start
pre-target
early-FB
pre-FB
pre-touch
ITI pre-start
pre-target
early-FB
pre-FB
pre-touch
ITI
pre-start
pre-target
early-FB
pre-FB
pre-touch
ITI pre-start
pre-target
early-FB
pre-FB
pre-touch
ITI
pre-start
pre-target
early-FB
pre-FB
pre-touch
ITI pre-start
pre-target
early-FB
pre-FB
pre-touch
ITI
GQLSB 2 b
397 dACC neurons 145 LPFC neurons
0
20
0
20
0
20
0
20
% o
f ce
lls%
of
ce
lls%
of
cells
% o
f ce
lls
d-
d+
U
Q
pre-feedback(FB) epochs
post-FB epochs
pre-feedback(FB) epochs
post-FB epochs
pre-start
pre-target
early-FB
pre-FB
pre-touch
ITI pre-start
pre-target
early-FB
pre-FB
pre-touch
ITI
390 dACC neurons 140 LPFC neurons
SBnoA
d-
d+
U
Q
0
20
0
20
0
20
0
20
% o
f ce
lls%
of
ce
lls%
of
ce
lls%
of
ce
lls
pre-feedback(FB) epochs
post-FB epochs
pre-feedback(FB) epochs
post-FB epochs
pre-start
pre-target
early-FB
pre-FB
pre-touch
ITI pre-start
pre-target
early-FB
pre-FB
pre-touch
ITI
pre-start
pre-target
early-FB
pre-FB
pre-touch
ITI pre-start
pre-target
early-FB
pre-FB
pre-touch
ITI
pre-start
pre-target
early-FB
pre-FB
pre-touch
ITI pre-start
pre-target
early-FB
pre-FB
pre-touch
ITI
pre-start
pre-target
early-FB
pre-FB
pre-touch
ITI pre-start
pre-target
early-FB
pre-FB
pre-touch
ITI
SBnoA 2 b
388 dACC neurons 141 LPFC neurons
pre-start
pre-target
early-FB
pre-FB
pre-touch
ITI pre-start
pre-target
early-FB
pre-FB
pre-touch
ITI
pre-start
pre-target
early-FB
pre-FB
pre-touch
ITI pre-start
pre-target
early-FB
pre-FB
pre-touch
ITI
pre-start
pre-target
early-FB
pre-FB
pre-touch
ITI pre-start
pre-target
early-FB
pre-FB
pre-touch
ITI
pre-start
pre-target
early-FB
pre-FB
pre-touch
ITI pre-start
pre-target
early-FB
pre-FB
pre-touch
ITI
pre-feedback(FB) epochs
post-FB epochs
pre-feedback(FB) epochs
d-
d+
U
Q
0
20
0
20
0
20
0
20
% o
f ce
lls%
of
ce
lls%
of
cells
% o
f ce
lls
post-FB epochs
A B
pre-start
pre-target
early-FB
pre-FB
pre-touch
ITI pre-start
pre-target
early-FB
pre-FB
pre-touch
ITI
pre-start
pre-target
early-FB
pre-FB
pre-touch
ITI pre-start
pre-target
early-FB
pre-FB
pre-touch
ITI
pre-start
pre-target
early-FB
pre-FB
pre-touch
ITI pre-start
pre-target
early-FB
pre-FB
pre-touch
ITI

245 dACC neurons 127 LPFC neurons
10
15
20
25
30
35
40
* *
*dACCLPFC
0
20
0
20
0
20
0
20
d-
d+
U
Q
% o
f ce
lls%
of
cells
% o
f ce
lls%
of
cells
pre-feedback(FB) epochs
post-FB epochs
pre-feedback(FB) epochs
post-FB epochs
pre-start
pre-target
early-FB
pre-FB
pre-touch
ITI pre-start
pre-target
early-FB
pre-FB
pre-touch
ITI
pre-start
pre-target
early-FB
pre-FB
pre-touch
ITI pre-start
pre-target
early-FB
pre-FB
pre-touch
ITI
pre-start
pre-target
early-FB
pre-FB
pre-touch
ITI pre-start
pre-target
early-FB
pre-FB
pre-touch
ITI
pre-start
pre-target
early-FB
pre-FB
pre-touch
ITI pre-start
pre-target
early-FB
pre-FB
pre-touch
ITI
Monkey M
pre-start
pre-target
early-FB
pre-touch
ITI
% o
f ce
lls
152 dACC neurons 18 LPFC neurons
0
5
10
15
20
25
30
35
40
*
*
dACCLPFC
Monkey P
pre-feedback(FB) epochs
post-FB epochs
pre-feedback(FB) epochs
post-FB epochs
pre-start
pre-target
early-FB
pre-FB
pre-touch
ITI pre-start
pre-target
early-FB
pre-FB
pre-touch
ITI
0
20
0
20
0
20
0
20
% o
f ce
lls%
of
ce
lls%
of
cells
% o
f ce
lls
pre-start
pre-target
early-FB
pre-FB
pre-touch
ITI pre-start
pre-target
early-FB
pre-FB
pre-touch
ITI
pre-start
pre-target
early-FB
pre-FB
pre-touch
ITI pre-start
pre-target
early-FB
pre-FB
pre-touch
ITI
pre-start
pre-target
early-FB
pre-FB
pre-touch
ITI pre-start
pre-target
early-FB
pre-FB
pre-touch
ITI
pre-start
pre-target
early-FB
pre-touch
ITI
% o
f ce
lls
d-
d+
U
Q
Figure S6. Proportions of dACC and LPFC cells with activity correlated with one of the model variables (Q, δ, and U) using the GQLSB 2 b
model for each monkey (Left). On the Right, Proportion of cells, for each epoch, showing a significant correlation with at least one model
variable. See figure 6 for average data and figure S5 for comparisons with other models.

start HIGH�U TRIALS, red dots : targetON
-3000 -2000 -1000 0 1000 2000 30000
10
20
CH3T1
9f start SMALL U TRIALS, red dots : targetON
10
20
30
-3000 -2000 -1000 0 1000 2000 3000
20
40
60
80
100
120
140
start
start
S
MA
LL
U T
RIA
LS
HIG
H U
TR
IAL
S
C (figure 7D)
Figure S7. Three examples of unit activity from figures 7A (A), 7C (B) and 7D (C) correlated with some of the model's variables. (A) example of dACC activity negatively correlated with RPE (δ-). (B) example of LPFC activity correlated with U. (C) example of dACC activity negatively correlated with U. (Top) plot of single trial activity (black dots) measured in the late feedback (A) and post-Sart (B, C) epochs against RPE and Uvalues respectively. Large grey dots represent the average for one decile of the value distribution and are just used for illustration. The red line represents the linear regression computed from single trial data. (Middle) peri-stimulus histograms aligned on feedback (A), Target Onset (B), and Start (C) and the corresponding raster plots for trial types indicated on the figures. (Bottom) trial by trial evolution of the average activity measured in the relevant epoch during successive trials in the session. The upper grey barcode represents the correct target to be chosen (4 greys for 4 target positions). The second barcode represents the target chosen by the animal in each trial. Below, the graphs represent the average activity for each trial and the trial by trial evolution of key model variables.
A (figure 7A)
10
20
30
40
CH1T - feedback ERROR TRIALS, red dots : touch
Feedback
ER
RO
R T
RIA
LS
CO
R T
RIA
LS
-3000 -2000 -1000 0 1000 2000 30000
10
20
- feedback COR TRIALS, red dots : touch
Feedback
-3000 -2000 -1000 0 1000 2000 3000
20
40
60
80
100
120
140
160
RPE
late
FB
me
an
firin
g r
ate
-2 -1.5 -1 -0.5 0 0.5 10
5
10
15
20
25
30
MB13199N CH1
Temp1
flag1 correlation : r -0.39056 p 7.2345e-11
20 40 60 80 100 120
-1
0
1
2
20 40 60 80 100 120-1
0
1
Q1
U
correct target between 4 possible ones
target selected by the monkey
20 40 60 80 100 120
sp
k/s
-RP
EQ
1 a
nd
U
trials
-3000 -2000 -1000 0 1000 2000 30000
20
40
ev20002
1 - targetON HIGH U TRIALS, red dots : touch
- targetON SMALL U TRIALS, red dots : touch
-3000 -2000 -1000 0 1000 2000 3000
20
40
60
80
100
120
140
tS
MA
LL
U T
RIA
LS
B (figure 7C)
targetON
5
10
15
20
25
30
35
40
45
HIG
H U
TR
IAL
StargetONstart
correct target between 4 possible ones
target selected by the monkey
20 40 60 80 100 120 140
20 40 60 80 100 120 140
0
0.5
1
20 40 60 80 100 120 140-2
-1
0
1
RPE
Q4
spk/
sU
Q4
an
d R
PE
trials
correct target between 4 possible ones
target selected by the monkey
10 20 30 40 50 60 70 80 90 100
10 20 30 40 50 60 70 80 90 100
-1
-0.5
0
10 20 30 40 50 60 70 80 90 100-2
-1
0
1
RPE
Q4
spk/
s-U
Q4
an
d R
PE
trials
po
stS
tart
me
an
firin
g r
ate
U0 0.2 0.4 0.6 0.8 1
0
10
20
30
40
50
60
MQR40212 ev
20002
1 correlation : r 0.59746 p 3.191e-21
pg
po
stS
tart
me
an
firin
g r
ate
U0 0.2 0.4 0.6 0.8 1
0
5
10
15
20
25
30
35
40
MDC35174 CH3
T1
9flag1 correlation : r -0.56355 p 4.587e-17
0
5
10
15
20
25
0
10
20
30
40
50
0
10
20
30

- targetON REPEAT TRIALS, red dots : touch
-3000 -2000 -1000 0 1000 2000 3000
0
5
10
15
CH1Temp2
flag1 - targetON SEARCH TRIALS, red dots : touch
-3000 -2000 -1000 0 1000 2000 3000
10
20
30
40
50
RE
PE
AT
TR
IAL
S
10
20
30
40
50
SE
AR
CH
TR
IAL
S
targetON
-3000 -2000 -1000 0 1000 2000 3000
20
40
60
80
100
120
-3000 -2000 -1000 0 1000 2000 30000
50
CH2T1 - feedback CORRECT TRIALS, red dots :
10
20
30
40
- feedback ERROR TRIALS, red dots : touch
feedback
CO
RR
EC
T T
RIA
LS
ER
RO
R T
RIA
LS
0 0.1 0.2 0.3 0.4 0.5 0.6 0.7 0.80
2
4
6
8
10
12
14
16
18
20
PRB16344 CH1
T2 correlation : r 0.42317 p 1.278e-05
EL
po
stTa
rge
t m
ea
n f
irin
g r
ate
B (figure 7F)
feedback
targetON
Figure S8. The two exemples from figures 7E (A) and 7F (B) correlated with some of the model's variables. (A) example of dACC activity positively correlated with RPE (δ+). (B) example of activity discriminating search and repetition but with a different profile than U; profile labelled EL for Error Likelihood. (Top) plot of single trial activity (black dots) measured in the early feedback (A) and post-target (B) epochs against RPE and EL values respectively. Large grey dots represent the average for one decile of the value distribution and are just used for illustration. The red line represents the linear regression computed from single trial data. (Bottom) peri-stimulus histograms aligned on feedback (A) and Target Onset (B) and the corresponding raster plots for trial types indicated on the figures. Other conventions as in Fig S7.
RPE
A (figure 7E)
ea
rlyF
B m
ea
n f
irin
g r
ate
-2 -1.5 -1 -0.5 0 0.5 10
10
20
30
40
50
60
70
80
MLB25330 CH2
Temp1
flag1 correlation : r 0.80758 p 1.5862e-41
-2 -1.5 -1 -0.5 0 0.5 10
5
10
15
20
25
30
35
MMN10546 CH1
Temp1
flag1 correlation : r -0.3407 p 2.6613e-12
RPE
ITI
me
an
firin
g r
ate
C (figure 9)
correct target between 4 possible ones
target selected by the monkey
20 40 60 80 100 120
20 40 60 80 100 120
-1
-0.5
0
0.5
1
1.5
2
20 40 60 80 100 120-1
-0.5
0
0.5
1
Q1
U
-RPE
sp
k/s
correct target between 4 possible ones
target selected by the monkey
10 20 30 40 50 60 70 80 90 100
10 20 30 40 50 60 70 80 90 1000
5
10
15
20
0
0.2
0.4
0.6
0.8
1
U
10 20 30 40 50 60 70 80 90 100-2
-1
0
1
RPE
Q4
spk/
s
correct target between 4 possible ones
target selected by the monkey
20 40 60 80 100 120
20 40 60 80 100 1200
10
20
30
40
50
60
70
20 40 60 80 100 120-2
-1
0
1
RPE
20 40 60 80 100 120-1
-0.5
0
0.5
1
Q4
U
trials
trials
spk/s
0
2
4
6
8
10
12
14
-RP
E
U

2 4 6 8 ≥100
100
200
300
model w. rwd 1/-1
5 10 15 20 25 ≥300
100
200
300
2 4 6 80
20
40
60
80
100
num
ber
of se
ssio
ns
1/308 (resp. 1/308) sessions w. moderate (resp. strong) collin.
2 4 6 8 ≥100
500
1000
1500
random regressors
5 10 15 20 25 ≥300
100
200
300
400
2 4 6 80
20
40
60
80
100
0/308 (resp. 0/308) sessions w. moderate (resp. strong) collin.
2 4 6 8 ≥100
100
200
300
model w. rwd 1/0
5 10 15 20 25 ≥300
100
200
300
2 4 6 80
50
100
150
284/308 (resp. 5/308) sessions w. moderate (resp. strong) collin.
Figure S9. Analyses of colinearity. Evaluation of the degree of collinearity between regressors used in the multiple regression analysis of single-
unit activities as a function of model variables. (Left) Model GQLSB2b with the reward function used throughout the paper (1 in case of
success, -1 in case of failure); (Middle) Control model with randomly generated regressors; (Right) Model GQLSB2b with a different reward function (1 in case of success, 0 in case of failure). For each recording session (308 in total) and for each regressors (7 in total), the figure shows the degree of collinearity measured when expressing the regressor as a function of the 6 other regressors for that session. The histograms on top show the variation inflation factors (VIF) computed with the coefficient of determination obtained when each regressor was expressed as a function of the other regressors. The middle figure shows the condition indexes (CONDIND) obtained in the same analysis. The bottom figure shows the number of variance decomposition factors (VDF) superior or equal to 0.5 obtained for each recording session.
The figure shows that the GQLSB2b model used throughout the paper (Left) displayed a strong collinearity between regressors only for 1/308 session (condind>=30 and more than two VDPs > 0.5) and a moderate collinearity only for 1/308 session (condind>=10 and more than two VDPs > 0.5). All other sessions showed a weak collinearity between regressors. In contrast, when the same model is used with a reward function equal to 1 for correct trials and 0 for error trials, collinearity is strong fo . As a r 5/308 sessions and moderate for 284/308 sessionscontrol, a model with randomly generated regressors shows weak collinearity in 100% simulated sessions.
V.I.F V.I.F V.I.F
CONDIND CONDIND CONDIND
num
ber
of sessio
ns
# V.D.F. ³ 0.5 # V.D.F. ³ 0.5 # V.D.F. ³ 0.5
num
ber
of se
ssio
ns

1.35
1.4
1.45
1.5
1.55
Kruskal-Wallis between variance entropy ACC vs PFC : Chi2=8.24 ; p = 0.0041
1.38
1.4
1.42
1.44
1.46
1.48
1.5
1.52
1.54
1.56
1.58
Kruskal-Wallis between variance entropy ACC vs PFC : Chi2=3.6 ; p = 0.0576
GQLSB 2b SBNoA 2b
0
0.2
0.4
0.6
dA
CC
0
0.2
0.4
0.6
LP
FC
Q
Ud
post-start post-target late-feedback
pre-feedback
post-start post-target late-feedback
pre-feedback
dACC LPFC
Figure S10. Multiplexing of information and variations during trials in dACC and LPFC - Data given for model SBNoA2b.
(A) A principal component analysis was performed on the regression coefficients found for each neuron and for each
model variable (Q: the action value of the animal's preferred target, δ, and U). The absolute value of the eigen values for
each principal component computed during the early-feedback epoch are shown in each matrix for one trial epoch. (B)
Top. Proportion of total variance explained by each model variable over the 3 PCs for dACC and LPFC data along trial
epochs. Bottom. Comparison between models GQLSB2b and SBnoA2b of an entropy-like index computed on the set of %
variance explained by each model variable in each trial epoch (data from part A). A kruskal-Wallis test indicated a higher
entropy in LPFC than in dACC (marginal significance for model GQLSB2b; strong significance for model SBnoA2b). See
main text for details.
B
C
A
0
1
Q
U
d
Q
U
d
dACC
LPFC
pre-start post-start pre-target post-targetlate-
feedbackearly-
feedbackpre-
feedbackpre-
touch ITI
PC1 PC2 PC3
monkey M
pre-feedback(FB) epochs
post-FB epochs
dACC
LPFC
pre-start post-start pre-target post-targetlate-
feedbackearly-
feedbackpre-
feedbackpre-
touch ITI
Q
U
d
Q
dU
monkey P
PC1 PC2 PC3
SBNoA
SBNoA