behavioral/systems/cognitive ... · behavioral/systems/cognitive...
TRANSCRIPT
Behavioral/Systems/Cognitive
Optic Glomeruli and Their Inputs in Drosophila Share anOrganizational Ground Pattern with the Antennal Lobes
Laiyong Mu,1 Kei Ito,2 Jonathan P. Bacon,3 and Nicholas J. Strausfeld1
1Department of Neuroscience, University of Arizona, Tucson, Arizona 85721, 2Center for Bioinformatics, Institute of Molecular and Cellular Biosciences,University of Tokyo, Bunkyo-Ku, Tokyo 113-0032, Japan, and 3School of Life Sciences, University of Sussex, Falmer, Brighton BN1 9QG, East Sussex, UnitedKingdom
Studying the insect visual system provides important data on the basic neural mechanisms underlying visual processing. As in vertebrates, thefirst step in visual processing in insects is through a series of retinotopic neurons. Recent studies on flies have found that these converge ontoassemblies of columnar neurons in the lobula, the axons of which segregate to project to discrete optic glomeruli in the lateral protocerebrum.This arrangement is much like the fly’s olfactory system, in which afferents target uniquely identifiable olfactory glomeruli. Here, whole-cellpatch recordings show that even though visual primitives are unreliably encoded by single lobula output neurons because of high synaptic noise,they are reliably encoded by the ensemble of outputs. At a glomerulus, local interneurons reliably code visual primitives, as do projectionneurons conveying information centrally from the glomerulus. These observations demonstrate that in Drosophila, as in other dipterans, opticglomeruli are involved in further reconstructing the fly’s visual world. Optic glomeruli and antennal lobe glomeruli share the same ancestralanatomical and functional ground pattern, enabling reliable responses to be extracted from converging sensory inputs.
IntroductionVisual processing allows animals to negotiate their environmentand direct their behaviors. The optic lobes of Drosophila recon-struct salient features of the taxon’s visual ecology by processingoptic flow and distinguishing static features. Although Drosophilahas a less elaborate nervous system than most vertebrates, manyfeatures are shared (Sanes and Zipursky, 2010). Visual processingin Drosophila involves sequential interactions by stratified net-works in the medulla, with retinotopic neurons that supply in-formation to two deeper retinotopic neuropils, the lobula and thelobula plate. The latter is a tectum-like neuropil in which largefield tangential cells integrate signals from achromatic relays andrespond to the orientation and direction of optic flow (Schnell etal., 2010). In contrast, the lobula is a cortex-like neuropil (Ramony Cajal and Sanchez, 1915) that comprises many palisades oflobula columnar neurons (LCNs). These are comparable to py-ramidal cells of the mammalian striate cortex (Strausfeld, 1970).The next level of the fly’s visual system is glomerular. Axons fromeach palisade of LCNs group into a unique bundle that targets aunique glomerulus in the brain’s lateral protocerebrum (Straus-feld and Bacon, 1983; Strausfeld and Lee, 1991; Otsuna and Ito,2006; Strausfeld and Okamura, 2007). This deepest part of thevisual system shares a neural organization with the glomerular
antennal lobes, composing a network of local interneurons(LINs) and projection neurons (Strausfeld and Bacon, 1983;Strausfeld et al., 2007).
Such commonality raises fundamental questions about prin-ciples of sensory-system organization. Optic glomeruli, and theorganization of local interneurons within them, are the protoce-rebral (segmental) homologs of the deutocerebral antennal lobe(Strausfeld et al., 2007), in which each glomerulus receives con-verging inputs from olfactory sensory neurons expressing thesame odorant-receptor gene (Gao et al., 2000; Vosshall et al.,2000). Noisy olfactory signals from receptors are refined throughinteractions among glomeruli through local interneurons and arethen relayed to higher centers by projection neurons (Laurent,2002; Wilson, 2008). Whereas olfactory receptor neurons encodeonly one modality, the identities of specific molecular ligands,compound-eye photoreceptors, encode many submodalities,such as intensity changes, e-vectors, and spectral properties. Fea-tures of the visual world, comparable in their specificity to theencoding of specific odorants, are not detected at the receptorlevel but are reconstructed by subsequent retinotopic layers re-laying to palisades of LCNs. There are as many unique palisadesof these neurons as there are optic glomeruli, and organizationalcorrespondence of optic glomeruli and antennal lobe glomerulisuggest comparable network organization in which each glomer-ulus is supplied by a characteristically defined input relaying aspecific sensory feature of the visual or olfactory environment.
To test whether optic glomeruli are indeed functionally com-parable to antennal-lobe glomeruli, we focused on LCNs consist-ing of clones of �40 identical neurons and their postsynaptictargets. Responses of single lobula output neurons, LINs, andprojection neurons were obtained using whole-cell patch-clamprecording methods developed for the olfactory system (Wilson
Received January 16, 2012; revised March 1, 2012; accepted March 7, 2012.Author contributions: L.M., J.P.B., and N.J.S. designed research; L.M. performed research; L.M. and K.I. contrib-
uted unpublished reagents/analytic tools; L.M. analyzed data; L.M., J.P.B., and N.J.S. wrote the paper.This work was supported by National Institutes of Health National Center for Research Resources Grant RO1
08688 and Air Force Office of Scientific Research Grant 300900. We thank Dr. Rachael Wilson for suggestions on thewhole-cell patch recording setup, and Dr. Jie Pu for advice on data analysis methods.
Correspondence should be addressed to Laiyong Mu, Department of Neuroscience, 1040 East 4th St, University ofArizona, Tucson, AZ 85721. E-mail: [email protected].
DOI:10.1523/JNEUROSCI.0221-12.2012Copyright © 2012 the authors 0270-6474/12/326061-11$15.00/0
The Journal of Neuroscience, May 2, 2012 • 32(18):6061– 6071 • 6061
and Laurent, 2005). Our results providethe first electrophysiological evidence forconvergent processing in an optic glomer-ulus. Convergent signals at a glomerulusare disambiguated at, and enhanced by,the follower relay neuron. Our data alsoshow the participation in this conver-gence by local interneurons associatedwith that specific glomerulus.
Materials and MethodsFlies. Flies were raised on standard cornmeal-agar medium. The experimental flies were 2- to7-d-old adult female Drosophila melanogasterof the UAS-mCD8::GFP A307 line or the prog-eny of crossing GAL4 enhancer-trap linesNP3045 (Otsuna and Ito, 2006) and NP5092with UAS-GFP reporter line UAS-GFP S65T.Single-neuron somata of lobula complex out-put clones labeled in NP3045 and NP5092 weretargeted for patch-clamp recording (Fig. 1).Recordings were also obtained from a LIN ofthe glomerulus receiving inputs from oneclone in NP5092 and from the major projec-tion neuron [the giant fiber (GF)] associatedwith this glomerulus, resolved in the GFP lineUAS-mCD8::GFP A307.
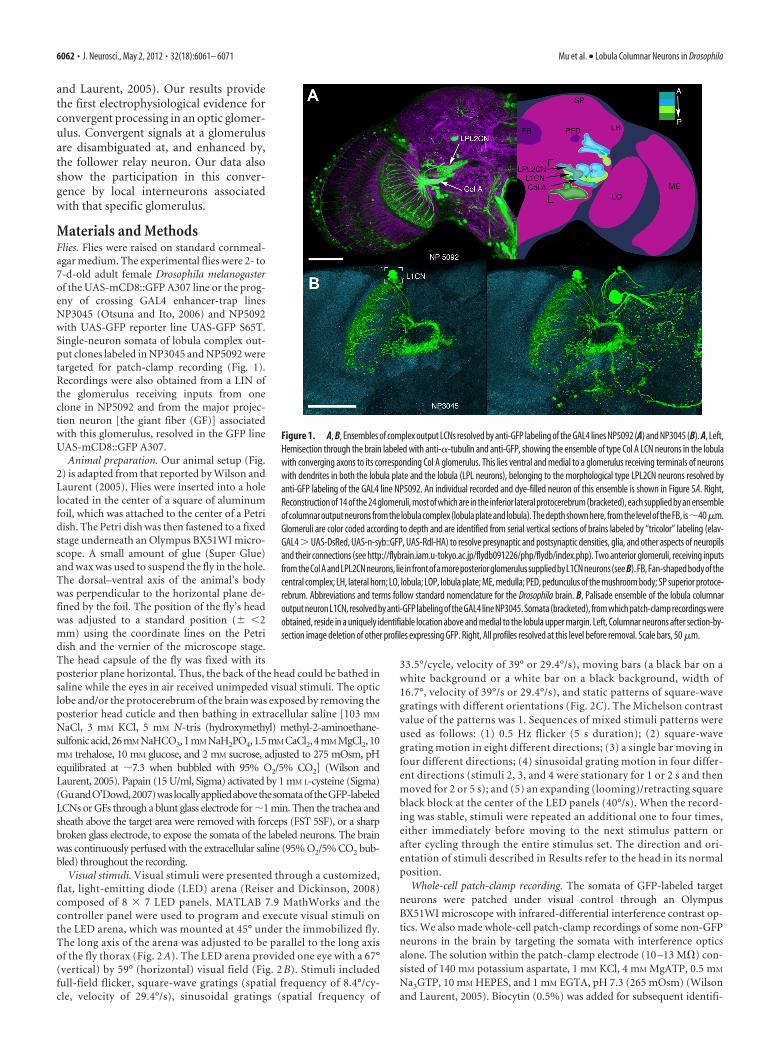
Animal preparation. Our animal setup (Fig.2) is adapted from that reported by Wilson andLaurent (2005). Flies were inserted into a holelocated in the center of a square of aluminumfoil, which was attached to the center of a Petridish. The Petri dish was then fastened to a fixedstage underneath an Olympus BX51WI micro-scope. A small amount of glue (Super Glue)and wax was used to suspend the fly in the hole.The dorsal–ventral axis of the animal’s bodywas perpendicular to the horizontal plane de-fined by the foil. The position of the fly’s headwas adjusted to a standard position (� �2mm) using the coordinate lines on the Petridish and the vernier of the microscope stage.The head capsule of the fly was fixed with itsposterior plane horizontal. Thus, the back of the head could be bathed insaline while the eyes in air received unimpeded visual stimuli. The opticlobe and/or the protocerebrum of the brain was exposed by removing theposterior head cuticle and then bathing in extracellular saline [103 mM
NaCl, 3 mM KCl, 5 mM N-tris (hydroxymethyl) methyl-2-aminoethane-sulfonicacid,26mM NaHCO3,1mM NaH2PO4,1.5mM CaCl2,4mM MgCl2,10mM trehalose, 10 mM glucose, and 2 mM sucrose, adjusted to 275 mOsm, pHequilibrated at �7.3 when bubbled with 95% O2/5% CO2] (Wilson andLaurent, 2005). Papain (15 U/ml, Sigma) activated by 1 mM L-cysteine (Sigma)(GuandO’Dowd,2007)waslocallyappliedabovethesomataoftheGFP-labeledLCNs or GFs through a blunt glass electrode for �1 min. Then the trachea andsheath above the target area were removed with forceps (FST 5SF), or a sharpbroken glass electrode, to expose the somata of the labeled neurons. The brainwas continuously perfused with the extracellular saline (95% O2/5% CO2 bub-bled) throughout the recording.
Visual stimuli. Visual stimuli were presented through a customized,flat, light-emitting diode (LED) arena (Reiser and Dickinson, 2008)composed of 8 � 7 LED panels. MATLAB 7.9 MathWorks and thecontroller panel were used to program and execute visual stimuli onthe LED arena, which was mounted at 45° under the immobilized fly.The long axis of the arena was adjusted to be parallel to the long axisof the fly thorax (Fig. 2 A). The LED arena provided one eye with a 67°(vertical) by 59° (horizontal) visual field (Fig. 2 B). Stimuli includedfull-field flicker, square-wave gratings (spatial frequency of 8.4°/cy-cle, velocity of 29.4°/s), sinusoidal gratings (spatial frequency of
33.5°/cycle, velocity of 39° or 29.4°/s), moving bars (a black bar on awhite background or a white bar on a black background, width of16.7°, velocity of 39°/s or 29.4°/s), and static patterns of square-wavegratings with different orientations (Fig. 2C). The Michelson contrastvalue of the patterns was 1. Sequences of mixed stimuli patterns wereused as follows: (1) 0.5 Hz flicker (5 s duration); (2) square-wavegrating motion in eight different directions; (3) a single bar moving infour different directions; (4) sinusoidal grating motion in four differ-ent directions (stimuli 2, 3, and 4 were stationary for 1 or 2 s and thenmoved for 2 or 5 s); and (5) an expanding (looming)/retracting squareblack block at the center of the LED panels (40°/s). When the record-ing was stable, stimuli were repeated an additional one to four times,either immediately before moving to the next stimulus pattern orafter cycling through the entire stimulus set. The direction and ori-entation of stimuli described in Results refer to the head in its normalposition.
Whole-cell patch-clamp recording. The somata of GFP-labeled targetneurons were patched under visual control through an OlympusBX51WI microscope with infrared-differential interference contrast op-tics. We also made whole-cell patch-clamp recordings of some non-GFPneurons in the brain by targeting the somata with interference opticsalone. The solution within the patch-clamp electrode (10 –13 M�) con-sisted of 140 mM potassium aspartate, 1 mM KCl, 4 mM MgATP, 0.5 mM
Na3GTP, 10 mM HEPES, and 1 mM EGTA, pH 7.3 (265 mOsm) (Wilsonand Laurent, 2005). Biocytin (0.5%) was added for subsequent identifi-
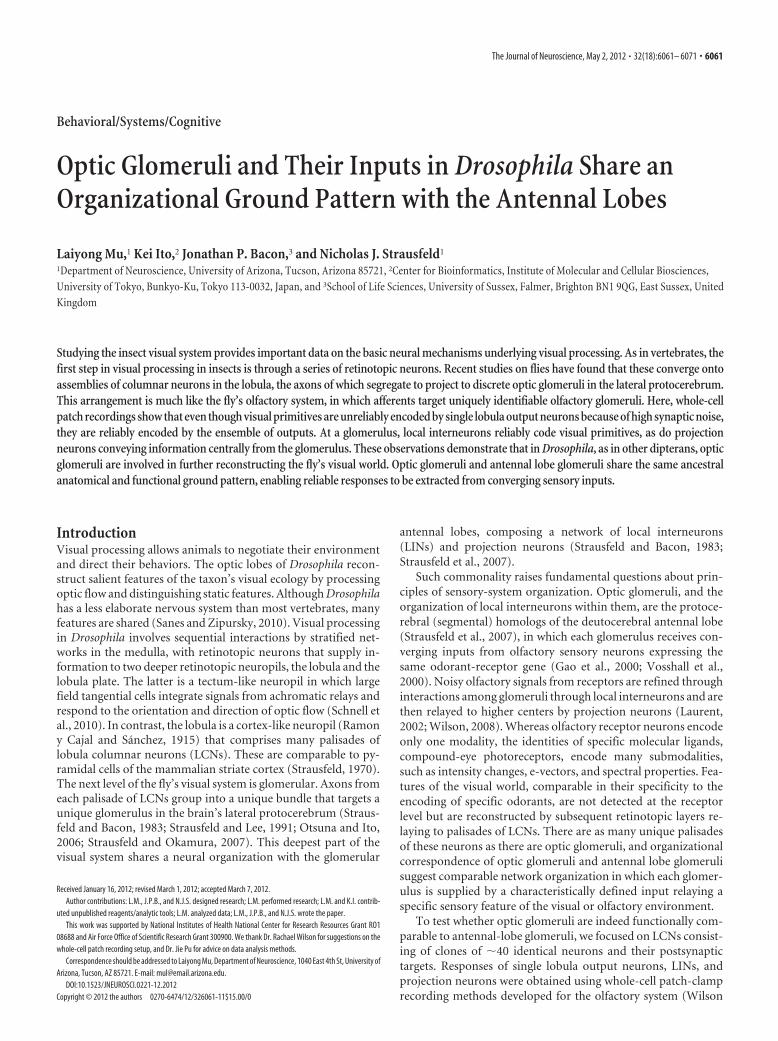
Figure 1. A, B, Ensembles of complex output LCNs resolved by anti-GFP labeling of the GAL4 lines NP5092 (A) and NP3045 (B). A, Left,Hemisection through the brain labeled with anti-�-tubulin and anti-GFP, showing the ensemble of type Col A LCN neurons in the lobulawith converging axons to its corresponding Col A glomerulus. This lies ventral and medial to a glomerulus receiving terminals of neuronswith dendrites in both the lobula plate and the lobula (LPL neurons), belonging to the morphological type LPL2CN neurons resolved byanti-GFP labeling of the GAL4 line NP5092. An individual recorded and dye-filled neuron of this ensemble is shown in Figure 5A. Right,Reconstruction of 14 of the 24 glomeruli, most of which are in the inferior lateral protocerebrum (bracketed), each supplied by an ensembleofcolumnaroutputneuronsfromthelobulacomplex(lobulaplateandlobula).Thedepthshownhere, fromtheleveloftheFB, is�40�m.Glomeruli are color coded according to depth and are identified from serial vertical sections of brains labeled by “tricolor” labeling (elav-GAL4 � UAS-DsRed, UAS-n-syb::GFP, UAS-Rdl-HA) to resolve presynaptic and postsynaptic densities, glia, and other aspects of neuropilsand their connections (see http://flybrain.iam.u-tokyo.ac.jp/flydb091226/php/flydb/index.php). Two anterior glomeruli, receiving inputsfromtheColAandLPL2CNneurons, lie infrontofamoreposteriorglomerulussuppliedbyL1CNneurons(seeB).FB,Fan-shapedbodyofthecentral complex; LH, lateral horn; LO, lobula; LOP, lobula plate; ME, medulla; PED, pedunculus of the mushroom body; SP superior protoce-rebrum. Abbreviations and terms follow standard nomenclature for the Drosophila brain. B, Palisade ensemble of the lobula columnaroutput neuron L1CN, resolved by anti-GFP labeling of the GAL4 line NP3045. Somata (bracketed), from which patch-clamp recordings wereobtained, reside in a uniquely identifiable location above and medial to the lobula upper margin. Left, Columnar neurons after section-by-section image deletion of other profiles expressing GFP. Right, All profiles resolved at this level before removal. Scale bars, 50 �m.
6062 • J. Neurosci., May 2, 2012 • 32(18):6061– 6071 Mu et al. • Lobula Columnar Neurons in Drosophila
cation of recorded cells. Voltage was recorded with Spike2 6.0 software(Cambridge Electronic Design) in current-clamp mode through an Axo-patch 200B amplifier (Molecular Devices), low-pass filtered at 5 kHz, anddigitized at 10 kHz with a Power 1401 digitizer (Cambridge ElectronicDesign). To subsequently confirm the identity of a recorded cell, onlyone cell was patch-clamped in each animal.
Immunohistology and anatomical reconstruction. After recording, thefly’s brain was dissected and fixed in 4% formaldehyde in PBS for 2 h atroom temperature or overnight at 4°C. After six rinses with PBST (0.5%Triton X-1000 in PBS) for 15 min each, the brains were blocked with 10%goat serum for 2 h at room temperature, then incubated with 1:1000rabbit antibody to GFP (Invitrogen) overnight at 4°C. After six rinseswith PBST for 15 min each, the brains were incubated overnight at 4°Cwith 1:1000 goat antibody to rabbit:Cy5 (Invitrogen) to visualize GFP-labeled neurons or 1:1000 streptavidin:Cy3 (Jackson ImmunoResearch)to visualize the biocytin-filled cells. After six rinses in PBST for 15 mineach, brains were mounted in Vectashield (Vector Laboratories) on aslide. Images of brains were obtained from a Zeiss AxioPlan2 confocalmicroscope with a 40� oil-immersion objective. Stacks (1–2 �m slices)of images were used to reconstruct the anatomy of the recorded neuronsin Adobe Photoshop CS2.
Data analysis. Because electrophysiological records of the lobula out-put neurons revealed both fast and slow membrane potential fluctua-tions other than spikes, we used power spectrum analysis to quantify theactivity of the lobula output neurons. Results are reported only for neu-rons that had input resistance �5 G�, which was our threshold criterionfor the goodness of the seal and, therefore, the quality of the electrophys-iological recording. Time–frequency analysis was conducted in MAT-LAB 7.9 (MathWorks) using a program written by author L.M. based onan algorithm published by Cohen et al. (2009). Time–frequency decom-position was computed through wavelet analysis, by which the recordingwas convolved with a set of complex Morlet wavelets, defined as aGaussian-windowed complex sine wave as follows: ei2�tf e�t2/�2�2, where tis time and f is frequency, which ranges from 2 to 80 Hz in 20 logarith-mically spaced steps; � defines the width of each frequency band and wasset according to 5/(2�f ); and 5 is the number of wavelet cycles thatprovides a balance between time and frequency resolution. After con-volving the signal with the wavelets, power was defined as the modulus ofthe resulting complex signal z(t) (power time series: p(t) real[z(t)] 2 �imag[z(t)] 2). The baseline was defined as the average power in the secondbefore the beginning of each stimulus. The final power time sequenceswere normalized to a decibel scale, 10*log10(response/baseline), whichallows a direct comparison across frequency bands. Furthermore, theaveraged dB power from 2 to 80 Hz through a given time period can becalculated from the time–frequency analysis. We also used an alternativemethod to calculate time-averaged power spectra (see Fig. 6C), which
directly uses the discrete Fourier transform function, fft, in MATLAB 7.9(MathWorks).
The extracted power data were statistically analyzed to examinewhether these neurons show selective responses to particular visual stim-uli. To test the effect of flicker, one-way repeated-measures ANOVA wasconducted using time (time windows a � e; see Fig. 7B,C) as the solefactor. If a significant effect of time was found, multiple comparisonsamong pairs of time windows (e.g., time windows a vs b, time windows bvs c) were made using the Holm step-down procedure (Holm, 1979) tocontrol the overall type I error level. To test the responses of motionstimuli and static patterns, data were analyzed by two-way repeated-measures ANOVA with direction/orientation and time (200 ms before vs200 ms after the onset of the stimuli) as factors. If significant direction-by-time or orientation-by-time interaction effects were found, it indi-cated that the neurons did respond to the stimuli differently at thedifferent directions (or orientations). To determine which directions ororientations caused the power of a neuron’s membrane potential fluctu-ations to change significantly following the onset of the stimuli, a test ofthe simple effect of time was conducted at each direction or orientation.For all analyses, effects were considered significant at p � 0.05 and mar-ginally significant at p � 0.10.
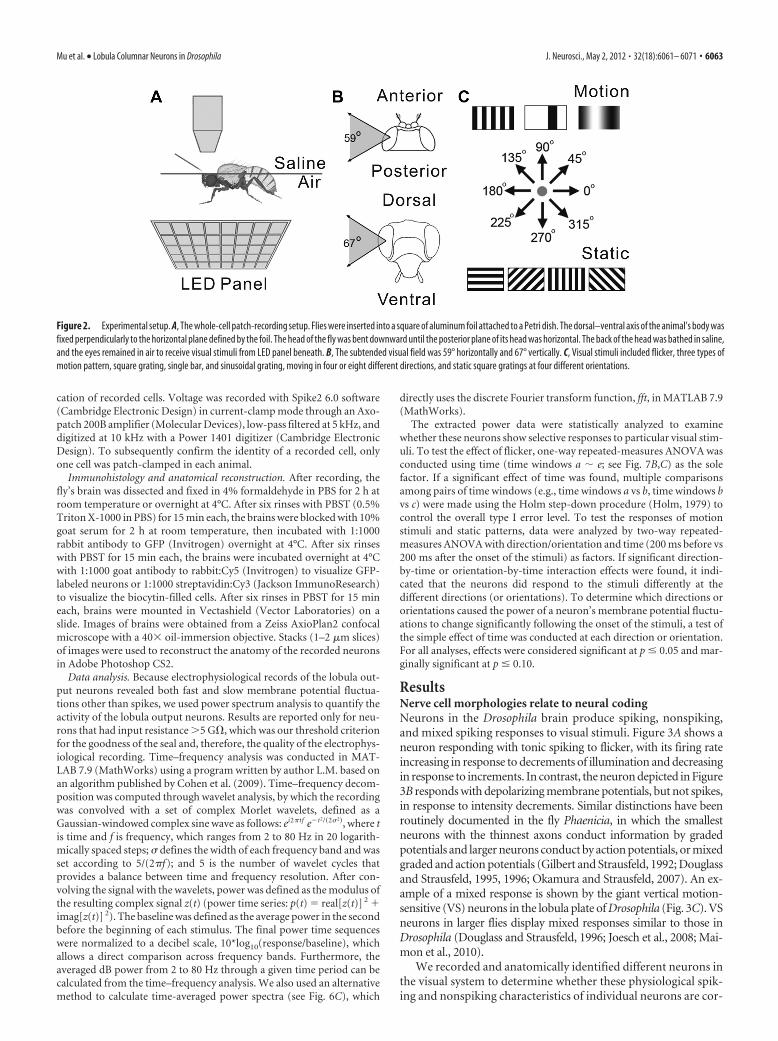
ResultsNerve cell morphologies relate to neural codingNeurons in the Drosophila brain produce spiking, nonspiking,and mixed spiking responses to visual stimuli. Figure 3A shows aneuron responding with tonic spiking to flicker, with its firing rateincreasing in response to decrements of illumination and decreasingin response to increments. In contrast, the neuron depicted in Figure3B responds with depolarizing membrane potentials, but not spikes,in response to intensity decrements. Similar distinctions have beenroutinely documented in the fly Phaenicia, in which the smallestneurons with the thinnest axons conduct information by gradedpotentials and larger neurons conduct by action potentials, or mixedgraded and action potentials (Gilbert and Strausfeld, 1992; Douglassand Strausfeld, 1995, 1996; Okamura and Strausfeld, 2007). An ex-ample of a mixed response is shown by the giant vertical motion-sensitive (VS) neurons in the lobula plate of Drosophila (Fig. 3C). VSneurons in larger flies display mixed responses similar to those inDrosophila (Douglass and Strausfeld, 1996; Joesch et al., 2008; Mai-mon et al., 2010).
We recorded and anatomically identified different neurons inthe visual system to determine whether these physiological spik-ing and nonspiking characteristics of individual neurons are cor-
Figure 2. Experimental setup. A, The whole-cell patch-recording setup. Flies were inserted into a square of aluminum foil attached to a Petri dish. The dorsal–ventral axis of the animal’s body wasfixed perpendicularly to the horizontal plane defined by the foil. The head of the fly was bent downward until the posterior plane of its head was horizontal. The back of the head was bathed in saline,and the eyes remained in air to receive visual stimuli from LED panel beneath. B, The subtended visual field was 59° horizontally and 67° vertically. C, Visual stimuli included flicker, three types ofmotion pattern, square grating, single bar, and sinusoidal grating, moving in four or eight different directions, and static square gratings at four different orientations.
Mu et al. • Lobula Columnar Neurons in Drosophila J. Neurosci., May 2, 2012 • 32(18):6061– 6071 • 6063
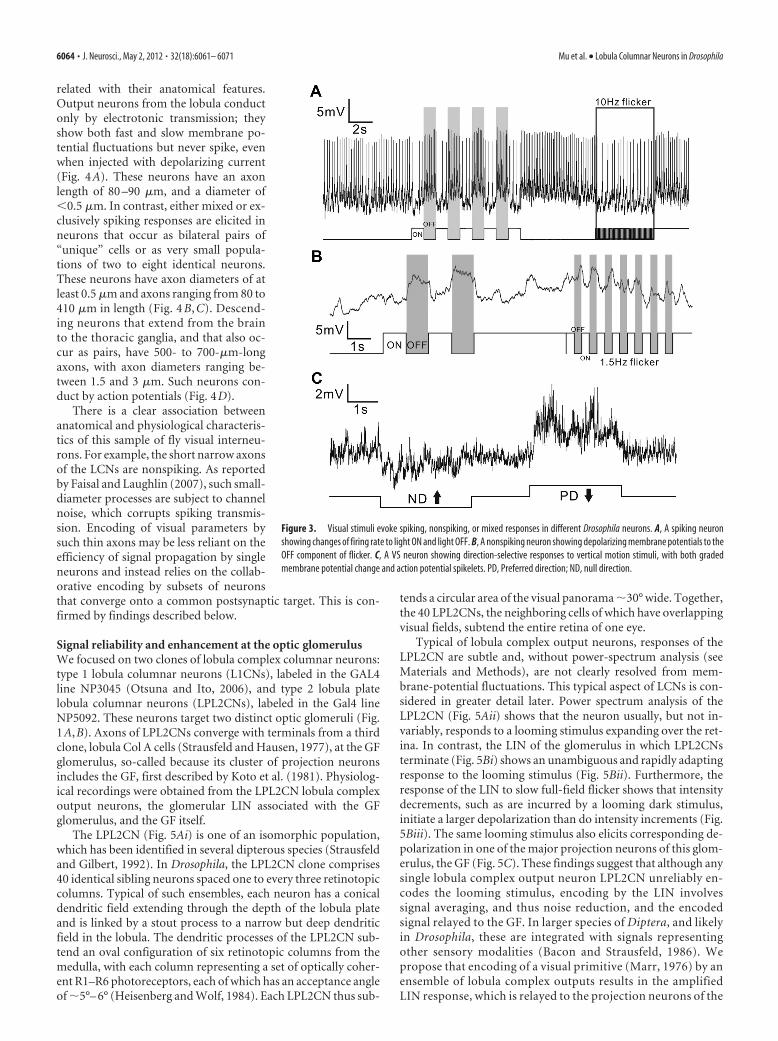
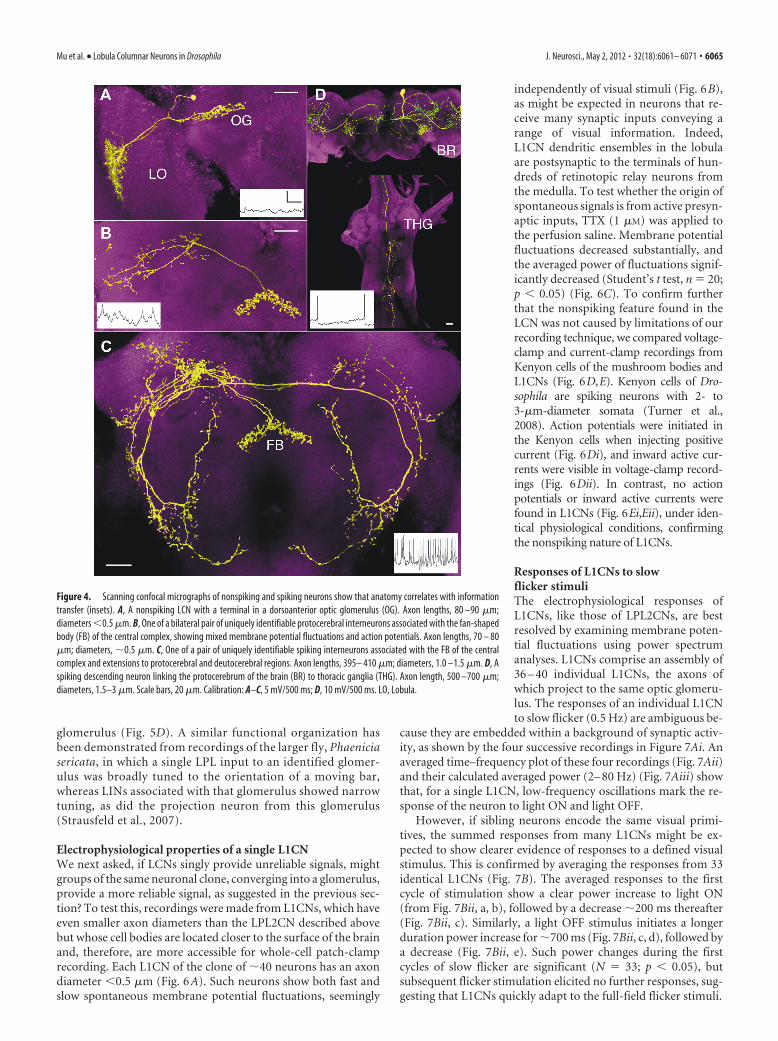
related with their anatomical features.Output neurons from the lobula conductonly by electrotonic transmission; theyshow both fast and slow membrane po-tential fluctuations but never spike, evenwhen injected with depolarizing current(Fig. 4A). These neurons have an axonlength of 80 –90 �m, and a diameter of�0.5 �m. In contrast, either mixed or ex-clusively spiking responses are elicited inneurons that occur as bilateral pairs of“unique” cells or as very small popula-tions of two to eight identical neurons.These neurons have axon diameters of atleast 0.5 �m and axons ranging from 80 to410 �m in length (Fig. 4 B, C). Descend-ing neurons that extend from the brainto the thoracic ganglia, and that also oc-cur as pairs, have 500- to 700-�m-longaxons, with axon diameters ranging be-tween 1.5 and 3 �m. Such neurons con-duct by action potentials (Fig. 4D).
There is a clear association betweenanatomical and physiological characteris-tics of this sample of fly visual interneu-rons. For example, the short narrow axonsof the LCNs are nonspiking. As reportedby Faisal and Laughlin (2007), such small-diameter processes are subject to channelnoise, which corrupts spiking transmis-sion. Encoding of visual parameters bysuch thin axons may be less reliant on theefficiency of signal propagation by singleneurons and instead relies on the collab-orative encoding by subsets of neuronsthat converge onto a common postsynaptic target. This is con-firmed by findings described below.
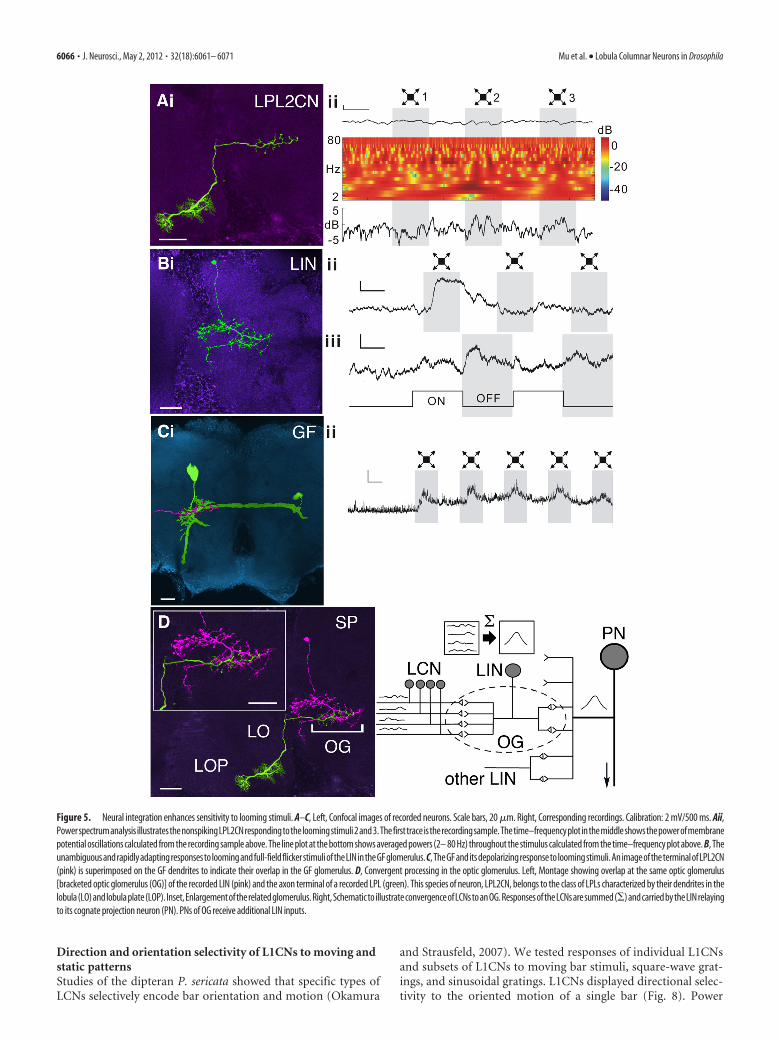
Signal reliability and enhancement at the optic glomerulusWe focused on two clones of lobula complex columnar neurons:type 1 lobula columnar neurons (L1CNs), labeled in the GAL4line NP3045 (Otsuna and Ito, 2006), and type 2 lobula platelobula columnar neurons (LPL2CNs), labeled in the Gal4 lineNP5092. These neurons target two distinct optic glomeruli (Fig.1A,B). Axons of LPL2CNs converge with terminals from a thirdclone, lobula Col A cells (Strausfeld and Hausen, 1977), at the GFglomerulus, so-called because its cluster of projection neuronsincludes the GF, first described by Koto et al. (1981). Physiolog-ical recordings were obtained from the LPL2CN lobula complexoutput neurons, the glomerular LIN associated with the GFglomerulus, and the GF itself.
The LPL2CN (Fig. 5Ai) is one of an isomorphic population,which has been identified in several dipterous species (Strausfeldand Gilbert, 1992). In Drosophila, the LPL2CN clone comprises40 identical sibling neurons spaced one to every three retinotopiccolumns. Typical of such ensembles, each neuron has a conicaldendritic field extending through the depth of the lobula plateand is linked by a stout process to a narrow but deep dendriticfield in the lobula. The dendritic processes of the LPL2CN sub-tend an oval configuration of six retinotopic columns from themedulla, with each column representing a set of optically coher-ent R1–R6 photoreceptors, each of which has an acceptance angleof �5°– 6° (Heisenberg and Wolf, 1984). Each LPL2CN thus sub-
tends a circular area of the visual panorama �30° wide. Together,the 40 LPL2CNs, the neighboring cells of which have overlappingvisual fields, subtend the entire retina of one eye.
Typical of lobula complex output neurons, responses of theLPL2CN are subtle and, without power-spectrum analysis (seeMaterials and Methods), are not clearly resolved from mem-brane-potential fluctuations. This typical aspect of LCNs is con-sidered in greater detail later. Power spectrum analysis of theLPL2CN (Fig. 5Aii) shows that the neuron usually, but not in-variably, responds to a looming stimulus expanding over the ret-ina. In contrast, the LIN of the glomerulus in which LPL2CNsterminate (Fig. 5Bi) shows an unambiguous and rapidly adaptingresponse to the looming stimulus (Fig. 5Bii). Furthermore, theresponse of the LIN to slow full-field flicker shows that intensitydecrements, such as are incurred by a looming dark stimulus,initiate a larger depolarization than do intensity increments (Fig.5Biii). The same looming stimulus also elicits corresponding de-polarization in one of the major projection neurons of this glom-erulus, the GF (Fig. 5C). These findings suggest that although anysingle lobula complex output neuron LPL2CN unreliably en-codes the looming stimulus, encoding by the LIN involvessignal averaging, and thus noise reduction, and the encodedsignal relayed to the GF. In larger species of Diptera, and likelyin Drosophila, these are integrated with signals representingother sensory modalities (Bacon and Strausfeld, 1986). Wepropose that encoding of a visual primitive (Marr, 1976) by anensemble of lobula complex outputs results in the amplifiedLIN response, which is relayed to the projection neurons of the
Figure 3. Visual stimuli evoke spiking, nonspiking, or mixed responses in different Drosophila neurons. A, A spiking neuronshowing changes of firing rate to light ON and light OFF. B, A nonspiking neuron showing depolarizing membrane potentials to theOFF component of flicker. C, A VS neuron showing direction-selective responses to vertical motion stimuli, with both gradedmembrane potential change and action potential spikelets. PD, Preferred direction; ND, null direction.
6064 • J. Neurosci., May 2, 2012 • 32(18):6061– 6071 Mu et al. • Lobula Columnar Neurons in Drosophila
glomerulus (Fig. 5D). A similar functional organization hasbeen demonstrated from recordings of the larger fly, Phaeniciasericata, in which a single LPL input to an identified glomer-ulus was broadly tuned to the orientation of a moving bar,whereas LINs associated with that glomerulus showed narrowtuning, as did the projection neuron from this glomerulus(Strausfeld et al., 2007).
Electrophysiological properties of a single L1CNWe next asked, if LCNs singly provide unreliable signals, mightgroups of the same neuronal clone, converging into a glomerulus,provide a more reliable signal, as suggested in the previous sec-tion? To test this, recordings were made from L1CNs, which haveeven smaller axon diameters than the LPL2CN described abovebut whose cell bodies are located closer to the surface of the brainand, therefore, are more accessible for whole-cell patch-clamprecording. Each L1CN of the clone of �40 neurons has an axondiameter �0.5 �m (Fig. 6A). Such neurons show both fast andslow spontaneous membrane potential fluctuations, seemingly
independently of visual stimuli (Fig. 6B),as might be expected in neurons that re-ceive many synaptic inputs conveying arange of visual information. Indeed,L1CN dendritic ensembles in the lobulaare postsynaptic to the terminals of hun-dreds of retinotopic relay neurons fromthe medulla. To test whether the origin ofspontaneous signals is from active presyn-aptic inputs, TTX (1 �M) was applied tothe perfusion saline. Membrane potentialfluctuations decreased substantially, andthe averaged power of fluctuations signif-icantly decreased (Student’s t test, n 20;p � 0.05) (Fig. 6C). To confirm furtherthat the nonspiking feature found in theLCN was not caused by limitations of ourrecording technique, we compared voltage-clamp and current-clamp recordings fromKenyon cells of the mushroom bodies andL1CNs (Fig. 6D,E). Kenyon cells of Dro-sophila are spiking neurons with 2- to3-�m-diameter somata (Turner et al.,2008). Action potentials were initiated inthe Kenyon cells when injecting positivecurrent (Fig. 6Di), and inward active cur-rents were visible in voltage-clamp record-ings (Fig. 6Dii). In contrast, no actionpotentials or inward active currents werefound in L1CNs (Fig. 6Ei,Eii), under iden-tical physiological conditions, confirmingthe nonspiking nature of L1CNs.
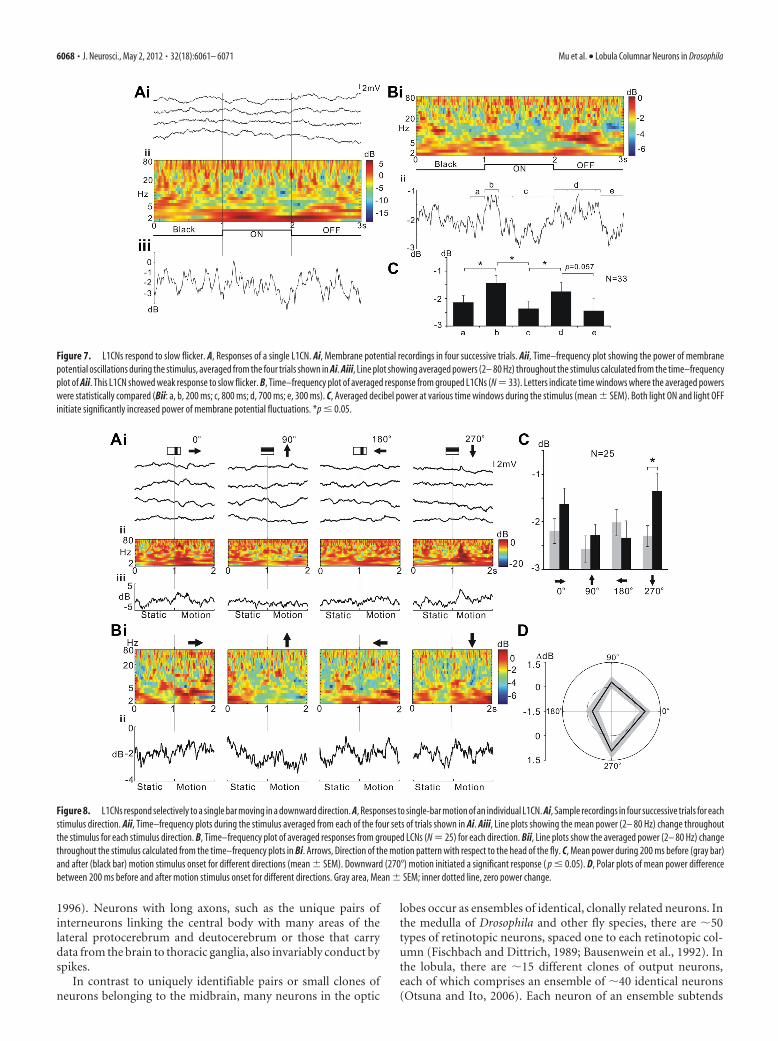
Responses of L1CNs to slowflicker stimuliThe electrophysiological responses ofL1CNs, like those of LPL2CNs, are bestresolved by examining membrane poten-tial fluctuations using power spectrumanalyses. L1CNs comprise an assembly of36 – 40 individual L1CNs, the axons ofwhich project to the same optic glomeru-lus. The responses of an individual L1CNto slow flicker (0.5 Hz) are ambiguous be-
cause they are embedded within a background of synaptic activ-ity, as shown by the four successive recordings in Figure 7Ai. Anaveraged time–frequency plot of these four recordings (Fig. 7Aii)and their calculated averaged power (2– 80 Hz) (Fig. 7Aiii) showthat, for a single L1CN, low-frequency oscillations mark the re-sponse of the neuron to light ON and light OFF.
However, if sibling neurons encode the same visual primi-tives, the summed responses from many L1CNs might be ex-pected to show clearer evidence of responses to a defined visualstimulus. This is confirmed by averaging the responses from 33identical L1CNs (Fig. 7B). The averaged responses to the firstcycle of stimulation show a clear power increase to light ON(from Fig. 7Bii, a, b), followed by a decrease �200 ms thereafter(Fig. 7Bii, c). Similarly, a light OFF stimulus initiates a longerduration power increase for �700 ms (Fig. 7Bii, c, d), followed bya decrease (Fig. 7Bii, e). Such power changes during the firstcycles of slow flicker are significant (N 33; p � 0.05), butsubsequent flicker stimulation elicited no further responses, sug-gesting that L1CNs quickly adapt to the full-field flicker stimuli.
Figure 4. Scanning confocal micrographs of nonspiking and spiking neurons show that anatomy correlates with informationtransfer (insets). A, A nonspiking LCN with a terminal in a dorsoanterior optic glomerulus (OG). Axon lengths, 80 –90 �m;diameters �0.5 �m. B, One of a bilateral pair of uniquely identifiable protocerebral interneurons associated with the fan-shapedbody (FB) of the central complex, showing mixed membrane potential fluctuations and action potentials. Axon lengths, 70 – 80�m; diameters, �0.5 �m. C, One of a pair of uniquely identifiable spiking interneurons associated with the FB of the centralcomplex and extensions to protocerebral and deutocerebral regions. Axon lengths, 395– 410 �m; diameters, 1.0 –1.5 �m. D, Aspiking descending neuron linking the protocerebrum of the brain (BR) to thoracic ganglia (THG). Axon length, 500 –700 �m;diameters, 1.5–3 �m. Scale bars, 20 �m. Calibration: A–C, 5 mV/500 ms; D, 10 mV/500 ms. LO, Lobula.
Mu et al. • Lobula Columnar Neurons in Drosophila J. Neurosci., May 2, 2012 • 32(18):6061– 6071 • 6065
Direction and orientation selectivity of L1CNs to moving andstatic patternsStudies of the dipteran P. sericata showed that specific types ofLCNs selectively encode bar orientation and motion (Okamura
and Strausfeld, 2007). We tested responses of individual L1CNsand subsets of L1CNs to moving bar stimuli, square-wave grat-ings, and sinusoidal gratings. L1CNs displayed directional selec-tivity to the oriented motion of a single bar (Fig. 8). Power
Figure 5. Neural integration enhances sensitivity to looming stimuli. A–C, Left, Confocal images of recorded neurons. Scale bars, 20 �m. Right, Corresponding recordings. Calibration: 2 mV/500 ms. Aii,Powerspectrumanalysis illustratesthenonspikingLPL2CNrespondingtotheloomingstimuli2and3.Thefirsttraceistherecordingsample.Thetime–frequencyplotinthemiddleshowsthepowerofmembranepotential oscillations calculated from the recording sample above. The line plot at the bottom shows averaged powers (2– 80 Hz) throughout the stimulus calculated from the time–frequency plot above. B, Theunambiguousandrapidlyadaptingresponsestoloomingandfull-fieldflickerstimulioftheLINintheGFglomerulus.C,TheGFanditsdepolarizingresponsetoloomingstimuli.AnimageoftheterminalofLPL2CN(pink) is superimposed on the GF dendrites to indicate their overlap in the GF glomerulus. D, Convergent processing in the optic glomerulus. Left, Montage showing overlap at the same optic glomerulus[bracketed optic glomerulus (OG)] of the recorded LIN (pink) and the axon terminal of a recorded LPL (green). This species of neuron, LPL2CN, belongs to the class of LPLs characterized by their dendrites in thelobula(LO)andlobulaplate(LOP). Inset,Enlargementoftherelatedglomerulus.Right,SchematictoillustrateconvergenceofLCNstoanOG.ResponsesoftheLCNsaresummed(�)andcarriedbytheLINrelayingto its cognate projection neuron (PN). PNs of OG receive additional LIN inputs.
6066 • J. Neurosci., May 2, 2012 • 32(18):6061– 6071 Mu et al. • Lobula Columnar Neurons in Drosophila
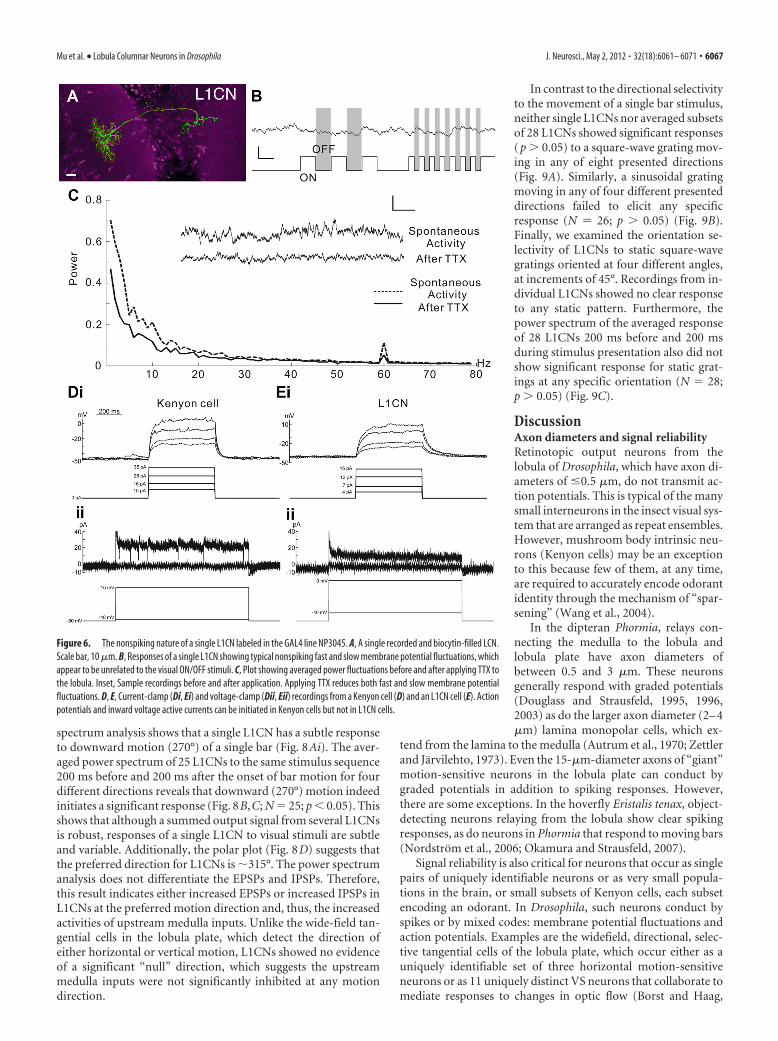
spectrum analysis shows that a single L1CN has a subtle responseto downward motion (270°) of a single bar (Fig. 8Ai). The aver-aged power spectrum of 25 L1CNs to the same stimulus sequence200 ms before and 200 ms after the onset of bar motion for fourdifferent directions reveals that downward (270°) motion indeedinitiates a significant response (Fig. 8B,C; N 25; p � 0.05). Thisshows that although a summed output signal from several L1CNsis robust, responses of a single L1CN to visual stimuli are subtleand variable. Additionally, the polar plot (Fig. 8D) suggests thatthe preferred direction for L1CNs is �315°. The power spectrumanalysis does not differentiate the EPSPs and IPSPs. Therefore,this result indicates either increased EPSPs or increased IPSPs inL1CNs at the preferred motion direction and, thus, the increasedactivities of upstream medulla inputs. Unlike the wide-field tan-gential cells in the lobula plate, which detect the direction ofeither horizontal or vertical motion, L1CNs showed no evidenceof a significant “null” direction, which suggests the upstreammedulla inputs were not significantly inhibited at any motiondirection.
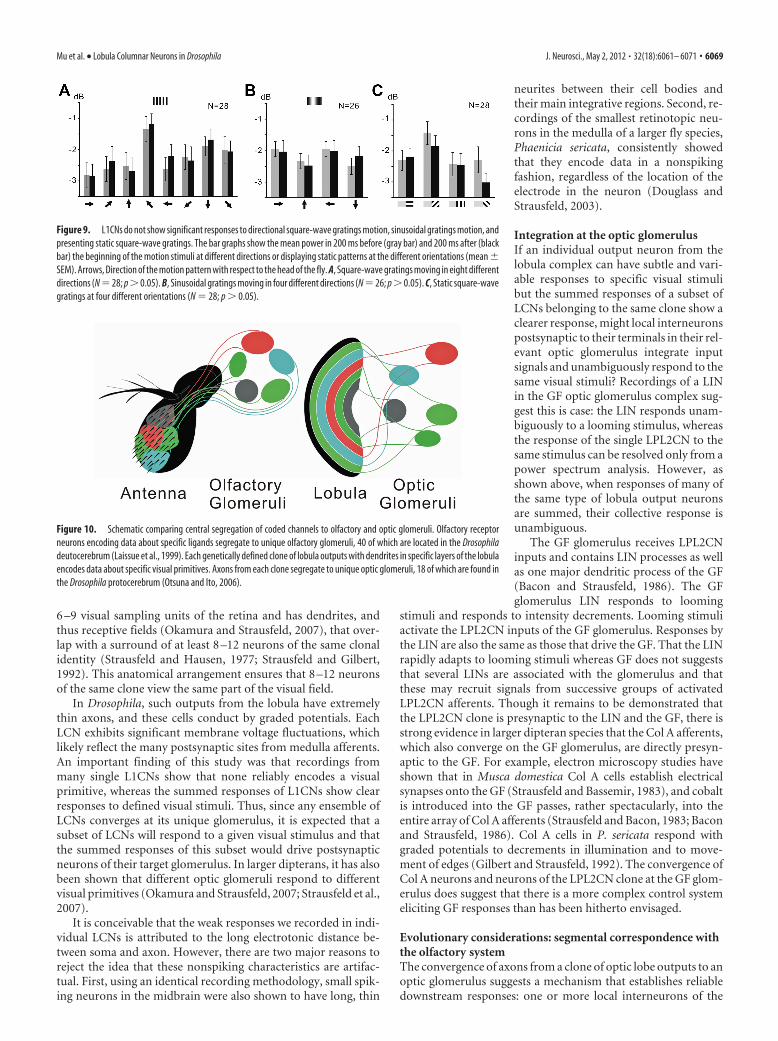
In contrast to the directional selectivityto the movement of a single bar stimulus,neither single L1CNs nor averaged subsetsof 28 L1CNs showed significant responses(p � 0.05) to a square-wave grating mov-ing in any of eight presented directions(Fig. 9A). Similarly, a sinusoidal gratingmoving in any of four different presenteddirections failed to elicit any specificresponse (N 26; p � 0.05) (Fig. 9B).Finally, we examined the orientation se-lectivity of L1CNs to static square-wavegratings oriented at four different angles,at increments of 45°. Recordings from in-dividual L1CNs showed no clear responseto any static pattern. Furthermore, thepower spectrum of the averaged responseof 28 L1CNs 200 ms before and 200 msduring stimulus presentation also did notshow significant response for static grat-ings at any specific orientation (N 28;p � 0.05) (Fig. 9C).
DiscussionAxon diameters and signal reliabilityRetinotopic output neurons from thelobula of Drosophila, which have axon di-ameters of �0.5 �m, do not transmit ac-tion potentials. This is typical of the manysmall interneurons in the insect visual sys-tem that are arranged as repeat ensembles.However, mushroom body intrinsic neu-rons (Kenyon cells) may be an exceptionto this because few of them, at any time,are required to accurately encode odorantidentity through the mechanism of “spar-sening” (Wang et al., 2004).
In the dipteran Phormia, relays con-necting the medulla to the lobula andlobula plate have axon diameters ofbetween 0.5 and 3 �m. These neuronsgenerally respond with graded potentials(Douglass and Strausfeld, 1995, 1996,2003) as do the larger axon diameter (2– 4�m) lamina monopolar cells, which ex-
tend from the lamina to the medulla (Autrum et al., 1970; Zettlerand Jarvilehto, 1973). Even the 15-�m-diameter axons of “giant”motion-sensitive neurons in the lobula plate can conduct bygraded potentials in addition to spiking responses. However,there are some exceptions. In the hoverfly Eristalis tenax, object-detecting neurons relaying from the lobula show clear spikingresponses, as do neurons in Phormia that respond to moving bars(Nordstrom et al., 2006; Okamura and Strausfeld, 2007).
Signal reliability is also critical for neurons that occur as singlepairs of uniquely identifiable neurons or as very small popula-tions in the brain, or small subsets of Kenyon cells, each subsetencoding an odorant. In Drosophila, such neurons conduct byspikes or by mixed codes: membrane potential fluctuations andaction potentials. Examples are the widefield, directional, selec-tive tangential cells of the lobula plate, which occur either as auniquely identifiable set of three horizontal motion-sensitiveneurons or as 11 uniquely distinct VS neurons that collaborate tomediate responses to changes in optic flow (Borst and Haag,
Figure 6. The nonspiking nature of a single L1CN labeled in the GAL4 line NP3045. A, A single recorded and biocytin-filled LCN.Scale bar, 10 �m. B, Responses of a single L1CN showing typical nonspiking fast and slow membrane potential fluctuations, whichappear to be unrelated to the visual ON/OFF stimuli. C, Plot showing averaged power fluctuations before and after applying TTX tothe lobula. Inset, Sample recordings before and after application. Applying TTX reduces both fast and slow membrane potentialfluctuations. D, E, Current-clamp (Di, Ei) and voltage-clamp (Dii, Eii) recordings from a Kenyon cell (D) and an L1CN cell (E). Actionpotentials and inward voltage active currents can be initiated in Kenyon cells but not in L1CN cells.
Mu et al. • Lobula Columnar Neurons in Drosophila J. Neurosci., May 2, 2012 • 32(18):6061– 6071 • 6067
1996). Neurons with long axons, such as the unique pairs ofinterneurons linking the central body with many areas of thelateral protocerebrum and deutocerebrum or those that carrydata from the brain to thoracic ganglia, also invariably conduct byspikes.
In contrast to uniquely identifiable pairs or small clones ofneurons belonging to the midbrain, many neurons in the optic
lobes occur as ensembles of identical, clonally related neurons. Inthe medulla of Drosophila and other fly species, there are �50types of retinotopic neurons, spaced one to each retinotopic col-umn (Fischbach and Dittrich, 1989; Bausenwein et al., 1992). Inthe lobula, there are �15 different clones of output neurons,each of which comprises an ensemble of �40 identical neurons(Otsuna and Ito, 2006). Each neuron of an ensemble subtends
Figure 7. L1CNs respond to slow flicker. A, Responses of a single L1CN. Ai, Membrane potential recordings in four successive trials. Aii, Time–frequency plot showing the power of membranepotential oscillations during the stimulus, averaged from the four trials shown in Ai. Aiii, Line plot showing averaged powers (2– 80 Hz) throughout the stimulus calculated from the time–frequencyplot of Aii. This L1CN showed weak response to slow flicker. B, Time–frequency plot of averaged response from grouped L1CNs (N 33). Letters indicate time windows where the averaged powerswere statistically compared (Bii: a, b, 200 ms; c, 800 ms; d, 700 ms; e, 300 ms). C, Averaged decibel power at various time windows during the stimulus (mean � SEM). Both light ON and light OFFinitiate significantly increased power of membrane potential fluctuations. *p � 0.05.
Figure 8. L1CNs respond selectively to a single bar moving in a downward direction. A, Responses to single-bar motion of an individual L1CN. Ai, Sample recordings in four successive trials for eachstimulus direction. Aii, Time–frequency plots during the stimulus averaged from each of the four sets of trials shown in Ai. Aiii, Line plots showing the mean power (2– 80 Hz) change throughoutthe stimulus for each stimulus direction. B, Time–frequency plot of averaged responses from grouped LCNs (N 25) for each direction. Bii, Line plots show the averaged power (2– 80 Hz) changethroughout the stimulus calculated from the time–frequency plots in Bi. Arrows, Direction of the motion pattern with respect to the head of the fly. C, Mean power during 200 ms before (gray bar)and after (black bar) motion stimulus onset for different directions (mean � SEM). Downward (270°) motion initiated a significant response ( p � 0.05). D, Polar plots of mean power differencebetween 200 ms before and after motion stimulus onset for different directions. Gray area, Mean � SEM; inner dotted line, zero power change.
6068 • J. Neurosci., May 2, 2012 • 32(18):6061– 6071 Mu et al. • Lobula Columnar Neurons in Drosophila
6 –9 visual sampling units of the retina and has dendrites, andthus receptive fields (Okamura and Strausfeld, 2007), that over-lap with a surround of at least 8 –12 neurons of the same clonalidentity (Strausfeld and Hausen, 1977; Strausfeld and Gilbert,1992). This anatomical arrangement ensures that 8 –12 neuronsof the same clone view the same part of the visual field.
In Drosophila, such outputs from the lobula have extremelythin axons, and these cells conduct by graded potentials. EachLCN exhibits significant membrane voltage fluctuations, whichlikely reflect the many postsynaptic sites from medulla afferents.An important finding of this study was that recordings frommany single L1CNs show that none reliably encodes a visualprimitive, whereas the summed responses of L1CNs show clearresponses to defined visual stimuli. Thus, since any ensemble ofLCNs converges at its unique glomerulus, it is expected that asubset of LCNs will respond to a given visual stimulus and thatthe summed responses of this subset would drive postsynapticneurons of their target glomerulus. In larger dipterans, it has alsobeen shown that different optic glomeruli respond to differentvisual primitives (Okamura and Strausfeld, 2007; Strausfeld et al.,2007).
It is conceivable that the weak responses we recorded in indi-vidual LCNs is attributed to the long electrotonic distance be-tween soma and axon. However, there are two major reasons toreject the idea that these nonspiking characteristics are artifac-tual. First, using an identical recording methodology, small spik-ing neurons in the midbrain were also shown to have long, thin
neurites between their cell bodies andtheir main integrative regions. Second, re-cordings of the smallest retinotopic neu-rons in the medulla of a larger fly species,Phaenicia sericata, consistently showedthat they encode data in a nonspikingfashion, regardless of the location of theelectrode in the neuron (Douglass andStrausfeld, 2003).
Integration at the optic glomerulusIf an individual output neuron from thelobula complex can have subtle and vari-able responses to specific visual stimulibut the summed responses of a subset ofLCNs belonging to the same clone show aclearer response, might local interneuronspostsynaptic to their terminals in their rel-evant optic glomerulus integrate inputsignals and unambiguously respond to thesame visual stimuli? Recordings of a LINin the GF optic glomerulus complex sug-gest this is case: the LIN responds unam-biguously to a looming stimulus, whereasthe response of the single LPL2CN to thesame stimulus can be resolved only from apower spectrum analysis. However, asshown above, when responses of many ofthe same type of lobula output neuronsare summed, their collective response isunambiguous.
The GF glomerulus receives LPL2CNinputs and contains LIN processes as wellas one major dendritic process of the GF(Bacon and Strausfeld, 1986). The GFglomerulus LIN responds to looming
stimuli and responds to intensity decrements. Looming stimuliactivate the LPL2CN inputs of the GF glomerulus. Responses bythe LIN are also the same as those that drive the GF. That the LINrapidly adapts to looming stimuli whereas GF does not suggeststhat several LINs are associated with the glomerulus and thatthese may recruit signals from successive groups of activatedLPL2CN afferents. Though it remains to be demonstrated thatthe LPL2CN clone is presynaptic to the LIN and the GF, there isstrong evidence in larger dipteran species that the Col A afferents,which also converge on the GF glomerulus, are directly presyn-aptic to the GF. For example, electron microscopy studies haveshown that in Musca domestica Col A cells establish electricalsynapses onto the GF (Strausfeld and Bassemir, 1983), and cobaltis introduced into the GF passes, rather spectacularly, into theentire array of Col A afferents (Strausfeld and Bacon, 1983; Baconand Strausfeld, 1986). Col A cells in P. sericata respond withgraded potentials to decrements in illumination and to move-ment of edges (Gilbert and Strausfeld, 1992). The convergence ofCol A neurons and neurons of the LPL2CN clone at the GF glom-erulus does suggest that there is a more complex control systemeliciting GF responses than has been hitherto envisaged.
Evolutionary considerations: segmental correspondence withthe olfactory systemThe convergence of axons from a clone of optic lobe outputs to anoptic glomerulus suggests a mechanism that establishes reliabledownstream responses: one or more local interneurons of the
Figure 9. L1CNs do not show significant responses to directional square-wave gratings motion, sinusoidal gratings motion, andpresenting static square-wave gratings. The bar graphs show the mean power in 200 ms before (gray bar) and 200 ms after (blackbar) the beginning of the motion stimuli at different directions or displaying static patterns at the different orientations (mean �SEM). Arrows, Direction of the motion pattern with respect to the head of the fly. A, Square-wave gratings moving in eight differentdirections (N 28; p � 0.05). B, Sinusoidal gratings moving in four different directions (N 26; p � 0.05). C, Static square-wavegratings at four different orientations (N 28; p � 0.05).
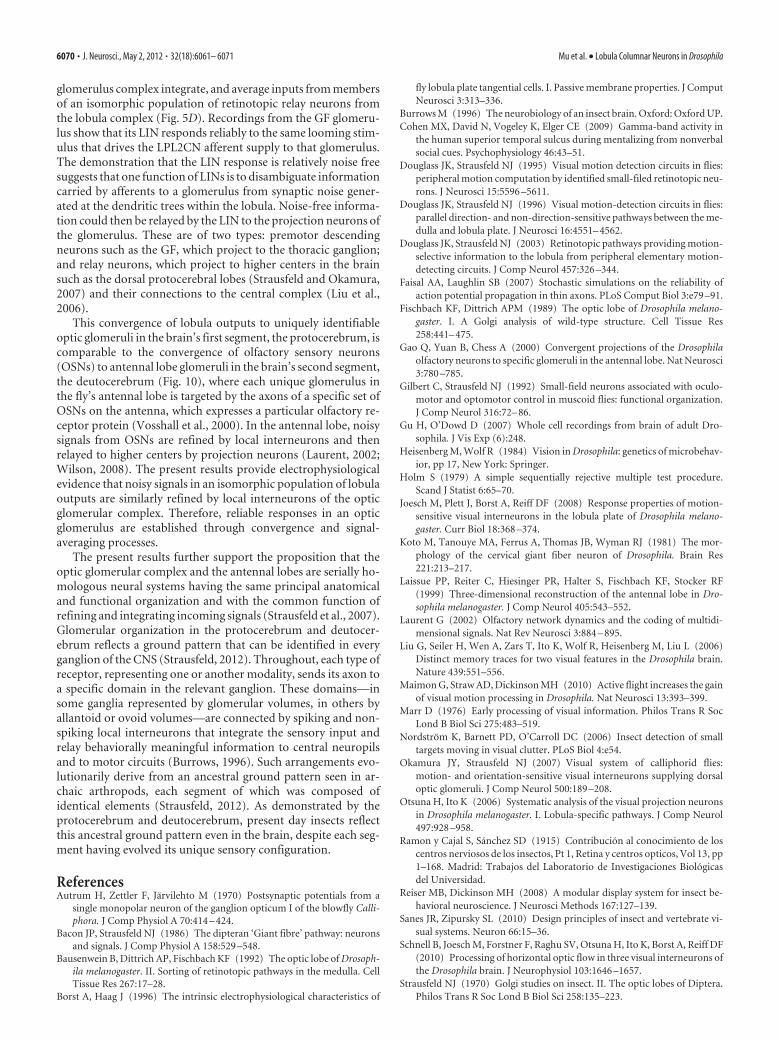
Figure 10. Schematic comparing central segregation of coded channels to olfactory and optic glomeruli. Olfactory receptorneurons encoding data about specific ligands segregate to unique olfactory glomeruli, 40 of which are located in the Drosophiladeutocerebrum (Laissue et al., 1999). Each genetically defined clone of lobula outputs with dendrites in specific layers of the lobulaencodes data about specific visual primitives. Axons from each clone segregate to unique optic glomeruli, 18 of which are found inthe Drosophila protocerebrum (Otsuna and Ito, 2006).
Mu et al. • Lobula Columnar Neurons in Drosophila J. Neurosci., May 2, 2012 • 32(18):6061– 6071 • 6069
glomerulus complex integrate, and average inputs from membersof an isomorphic population of retinotopic relay neurons fromthe lobula complex (Fig. 5D). Recordings from the GF glomeru-lus show that its LIN responds reliably to the same looming stim-ulus that drives the LPL2CN afferent supply to that glomerulus.The demonstration that the LIN response is relatively noise freesuggests that one function of LINs is to disambiguate informationcarried by afferents to a glomerulus from synaptic noise gener-ated at the dendritic trees within the lobula. Noise-free informa-tion could then be relayed by the LIN to the projection neurons ofthe glomerulus. These are of two types: premotor descendingneurons such as the GF, which project to the thoracic ganglion;and relay neurons, which project to higher centers in the brainsuch as the dorsal protocerebral lobes (Strausfeld and Okamura,2007) and their connections to the central complex (Liu et al.,2006).
This convergence of lobula outputs to uniquely identifiableoptic glomeruli in the brain’s first segment, the protocerebrum, iscomparable to the convergence of olfactory sensory neurons(OSNs) to antennal lobe glomeruli in the brain’s second segment,the deutocerebrum (Fig. 10), where each unique glomerulus inthe fly’s antennal lobe is targeted by the axons of a specific set ofOSNs on the antenna, which expresses a particular olfactory re-ceptor protein (Vosshall et al., 2000). In the antennal lobe, noisysignals from OSNs are refined by local interneurons and thenrelayed to higher centers by projection neurons (Laurent, 2002;Wilson, 2008). The present results provide electrophysiologicalevidence that noisy signals in an isomorphic population of lobulaoutputs are similarly refined by local interneurons of the opticglomerular complex. Therefore, reliable responses in an opticglomerulus are established through convergence and signal-averaging processes.
The present results further support the proposition that theoptic glomerular complex and the antennal lobes are serially ho-mologous neural systems having the same principal anatomicaland functional organization and with the common function ofrefining and integrating incoming signals (Strausfeld et al., 2007).Glomerular organization in the protocerebrum and deutocer-ebrum reflects a ground pattern that can be identified in everyganglion of the CNS (Strausfeld, 2012). Throughout, each type ofreceptor, representing one or another modality, sends its axon toa specific domain in the relevant ganglion. These domains—insome ganglia represented by glomerular volumes, in others byallantoid or ovoid volumes—are connected by spiking and non-spiking local interneurons that integrate the sensory input andrelay behaviorally meaningful information to central neuropilsand to motor circuits (Burrows, 1996). Such arrangements evo-lutionarily derive from an ancestral ground pattern seen in ar-chaic arthropods, each segment of which was composed ofidentical elements (Strausfeld, 2012). As demonstrated by theprotocerebrum and deutocerebrum, present day insects reflectthis ancestral ground pattern even in the brain, despite each seg-ment having evolved its unique sensory configuration.
ReferencesAutrum H, Zettler F, Jarvilehto M (1970) Postsynaptic potentials from a
single monopolar neuron of the ganglion opticum I of the blowfly Calli-phora. J Comp Physiol A 70:414 – 424.
Bacon JP, Strausfeld NJ (1986) The dipteran ‘Giant fibre’ pathway: neuronsand signals. J Comp Physiol A 158:529 –548.
Bausenwein B, Dittrich AP, Fischbach KF (1992) The optic lobe of Drosoph-ila melanogaster. II. Sorting of retinotopic pathways in the medulla. CellTissue Res 267:17–28.
Borst A, Haag J (1996) The intrinsic electrophysiological characteristics of
fly lobula plate tangential cells. I. Passive membrane properties. J ComputNeurosci 3:313–336.
Burrows M (1996) The neurobiology of an insect brain. Oxford: Oxford UP.Cohen MX, David N, Vogeley K, Elger CE (2009) Gamma-band activity in
the human superior temporal sulcus during mentalizing from nonverbalsocial cues. Psychophysiology 46:43–51.
Douglass JK, Strausfeld NJ (1995) Visual motion detection circuits in flies:peripheral motion computation by identified small-filed retinotopic neu-rons. J Neurosci 15:5596 –5611.
Douglass JK, Strausfeld NJ (1996) Visual motion-detection circuits in flies:parallel direction- and non-direction-sensitive pathways between the me-dulla and lobula plate. J Neurosci 16:4551– 4562.
Douglass JK, Strausfeld NJ (2003) Retinotopic pathways providing motion-selective information to the lobula from peripheral elementary motion-detecting circuits. J Comp Neurol 457:326 –344.
Faisal AA, Laughlin SB (2007) Stochastic simulations on the reliability ofaction potential propagation in thin axons. PLoS Comput Biol 3:e79 –91.
Fischbach KF, Dittrich APM (1989) The optic lobe of Drosophila melano-gaster. I. A Golgi analysis of wild-type structure. Cell Tissue Res258:441– 475.
Gao Q, Yuan B, Chess A (2000) Convergent projections of the Drosophilaolfactory neurons to specific glomeruli in the antennal lobe. Nat Neurosci3:780 –785.
Gilbert C, Strausfeld NJ (1992) Small-field neurons associated with oculo-motor and optomotor control in muscoid flies: functional organization.J Comp Neurol 316:72– 86.
Gu H, O’Dowd D (2007) Whole cell recordings from brain of adult Dro-sophila. J Vis Exp (6):248.
Heisenberg M, Wolf R (1984) Vision in Drosophila: genetics of microbehav-ior, pp 17, New York: Springer.
Holm S (1979) A simple sequentially rejective multiple test procedure.Scand J Statist 6:65–70.
Joesch M, Plett J, Borst A, Reiff DF (2008) Response properties of motion-sensitive visual interneurons in the lobula plate of Drosophila melano-gaster. Curr Biol 18:368 –374.
Koto M, Tanouye MA, Ferrus A, Thomas JB, Wyman RJ (1981) The mor-phology of the cervical giant fiber neuron of Drosophila. Brain Res221:213–217.
Laissue PP, Reiter C, Hiesinger PR, Halter S, Fischbach KF, Stocker RF(1999) Three-dimensional reconstruction of the antennal lobe in Dro-sophila melanogaster. J Comp Neurol 405:543–552.
Laurent G (2002) Olfactory network dynamics and the coding of multidi-mensional signals. Nat Rev Neurosci 3:884 – 895.
Liu G, Seiler H, Wen A, Zars T, Ito K, Wolf R, Heisenberg M, Liu L (2006)Distinct memory traces for two visual features in the Drosophila brain.Nature 439:551–556.
Maimon G, Straw AD, Dickinson MH (2010) Active flight increases the gainof visual motion processing in Drosophila. Nat Neurosci 13:393–399.
Marr D (1976) Early processing of visual information. Philos Trans R SocLond B Biol Sci 275:483–519.
Nordstrom K, Barnett PD, O’Carroll DC (2006) Insect detection of smalltargets moving in visual clutter. PLoS Biol 4:e54.
Okamura JY, Strausfeld NJ (2007) Visual system of calliphorid flies:motion- and orientation-sensitive visual interneurons supplying dorsaloptic glomeruli. J Comp Neurol 500:189 –208.
Otsuna H, Ito K (2006) Systematic analysis of the visual projection neuronsin Drosophila melanogaster. I. Lobula-specific pathways. J Comp Neurol497:928 –958.
Ramon y Cajal S, Sanchez SD (1915) Contribucion al conocimiento de loscentros nerviosos de los insectos, Pt 1, Retina y centros opticos, Vol 13, pp1–168. Madrid: Trabajos del Laboratorio de Investigaciones Biologicasdel Universidad.
Reiser MB, Dickinson MH (2008) A modular display system for insect be-havioral neuroscience. J Neurosci Methods 167:127–139.
Sanes JR, Zipursky SL (2010) Design principles of insect and vertebrate vi-sual systems. Neuron 66:15–36.
Schnell B, Joesch M, Forstner F, Raghu SV, Otsuna H, Ito K, Borst A, Reiff DF(2010) Processing of horizontal optic flow in three visual interneurons ofthe Drosophila brain. J Neurophysiol 103:1646 –1657.
Strausfeld NJ (1970) Golgi studies on insect. II. The optic lobes of Diptera.Philos Trans R Soc Lond B Biol Sci 258:135–223.
6070 • J. Neurosci., May 2, 2012 • 32(18):6061– 6071 Mu et al. • Lobula Columnar Neurons in Drosophila
Strausfeld NJ (2012) Arthropod brains: evolution, functional elegance, andhistorical significance. Cambridge: Harvard UP.
Strausfeld NJ, Bacon J (1983) Multimodal convergence in the central ner-vous system of dipterous insects. In: Fortschritteder zoologie: multimodalconvergence in sensory systems, Chap 28 (Horn E, ed), pp 47–76. NewYork: Gustav Fischer Verlag.
Strausfeld NJ, Bassemir UK (1983) Cobalt-coupled neurons of a giant fibresystem in Diptera. J Neurocytol 12:971–991.
Strausfeld NJ, Gilbert C (1992) Small-field neurons associated with oculo-motor control in muscoid flies: cellular organization in the lobula plate.J Comp Neurol 316:56 –71.
Strausfeld NJ, Hausen K (1977) The resolution of neural assemblies aftercobalt injection into neuropil. Proc R Soc Lond B 199:463– 476.
Strausfeld NJ, Lee JK (1991) Neuronal basis for parallel visual processing inthe fly. Vis Neurosci 7:13–33.
Strausfeld NJ, Okamura JY (2007) Visual system of calliphorid flies: organi-zation of optic glomeruli and their lobula complex efferents. J CompNeurol 500:166 –188.
Strausfeld NJ, Sinakevitch I, Okamura JY (2007) Organization of local in-terneurons in optic glomeruli of the dipterous visual system and compar-isons with the antennal lobes. Dev Neurobiol 67:1267–1288.
Turner GC, Bazhenov M, Laurent G (2008) Olfactory representations byDrosophila mushroom body neurons. J Neurophysiol 99:734 –746.
Vosshall LB, Wong AM, Axel R (2000) An olfactory sensory map in the flybrain. Cell 102:147–159.
Wang Y, Guo HF, Pologruto TA, Hannan F, Hakker I, Svoboda K, Zhong Y.(2004) Stereotyped odor-evoked activity in the mushroom body of Dro-sophila revealed by green fluorescent protein-based Ca 2� imaging. J Neu-rosci 24:6507– 6514.
Wilson RI (2008) Neural and behavioral mechanisms of olfactory percep-tion. Curr Opin Neurobiol 18:408 – 412.
Wilson RI, Laurent G (2005) Role of GABAergic inhibition in shaping odor-evoked spatiotemporal patterns in the Drosophila antennal lobe. J Neuro-sci 25:9069 –9079.
Zettler F, Jarvilehto M (1973) Active and passive axonal propagation ofnon-spike signals in the retina of Calliphora. J Comp Physiol A 85:89 –104.
Mu et al. • Lobula Columnar Neurons in Drosophila J. Neurosci., May 2, 2012 • 32(18):6061– 6071 • 6071