behaviorscan - faculty.fuqua.duke.edu
TRANSCRIPT

Copyright © 2006 Information Resources, Inc. Confidential and proprietary.
BehaviorScanThe Next Generation

Copyright © 2006 Information Resources, Inc. Confidential and proprietary.
Why Test New Products & What Options are Available?Why Test TV Advertising & What Options are AvailableBehaviorScan: How it Works & What You GetNew Multi-Outlet Panel DataImproved Panel ANCOVA ModelAppendices
Agenda
Copyright © 2006 Information Resources, Inc. Confidential and proprietary.

3Copyright © 2006 Information Resources, Inc. Confidential and proprietary.
Why Should you Test New Products?
Many new products launches are failing, costing $millionsIncrease the odds of success by testing
The biggest opportunities have the biggest risksAccurately evaluate innovative ideas – without betting the company on them
Bscan is more accurate than STMs and less costly than Roll N’Reads
Test the NEW: New brand, major line extension/restage, new usage and benefits, 3rd entry or later
Why Test New Products?

4Copyright © 2006 Information Resources, Inc. Confidential and proprietary.
% of Total New Brands Introduced in CPG Food & Beverage Categories by Year One Dollar Sales (F/D/M)
Most New Products Are Bunts, Not HomerunsWhy Test New Products?
Source: New food & beverage Pacesetter brand sales based on 52 weeks of dollar sales after achieving 30% ACV distribution between February 2003 and January 2004
InfoScan® Reviews Advantage, Food/Supermarkets, Drugstores & Mass Merchandisers, excluding Wal-Mart data for 2002-04 Pacesetters; 1997 – 2001 based on FDM including Wal-Mart store data.
2004 = 851 total new brands; 2003 = 749 total new brands; 1997 – 2002 = 3,567 total new brands
79%
3%7% 8%
2% 1%
76%
4% 8% 9%2% 1%
78%
4% 8% 7%2% 1%
<$7.5MM $7.5- $10MM $10- $20MM $20- $50MM $50- $100MM $100MM+
1997-2002 2003 2004

5Copyright © 2006 Information Resources, Inc. Confidential and proprietary.
And New Products Are ExpensiveAverage launch-only costs: $25 million (range: $5 million - $100 million)Trade
Retail slotting fees: $1-2 million per SKU
Off-invoice allowances, feature ad & display fees: 5-20% of sales
Sales force time & sell-in materials/sales kits
ConsumerAdvertising: $5 - 75 million
Couponing: $5 - 10 million
Other: R&D, Market Research, etc
Cost of a Typical Failure: $14,200,000
Why Test New Products?

6Copyright © 2006 Information Resources, Inc. Confidential and proprietary.
Testing Significantly Reduces the Risk of Failure
SOURCE: IRI New Product Trends 2000
Why Test New Products?
Success48%
Failure52%
Of all new products introduced nationally,
less than half succeed.
Of new products tested in BehaviorScan and introduced nationally, over 84% succeed.
SOURCE: IRI New Product Trends 2000
Not Rolled
Out60%
Success38%
Failure 2%
40%rolled
out

7Copyright © 2006 Information Resources, Inc. Confidential and proprietary.
What Options do You Have for New Product Testing?
Simulated Test Market (STM)
Roll & Read Test
BehaviorScan
Testing Options: New Product Tests

8Copyright © 2006 Information Resources, Inc. Confidential and proprietary.
Good diagnosticsBased on what people say, not what they do
Insights
Only a concept board stimulusJust norms for marketing mix elements
Completeness
Good where norms existCan be very wrong for unusual products
Accuracy
Almost guaranteedConfidentiality
Supplier handles everythingVery limited product requirements
Effort Required
Typically under $100k Cost
2-4 week setupResults in 6-12 weeks
Speed
CommentsScoreCriteria
Simulated Test Markets: Less Accuracy & Insights
ExcellentGoodAverage Low Poor
Testing Options: New Product Tests

9Copyright © 2006 Information Resources, Inc. Confidential and proprietary.
STM’s promise +/- 20% accuracy 80% of the time, BUT…
+43%$40mm$70mmFrozen Snack
+58%$25mm$60mmShelf Stable Pasta
-60%$150mm$90mmCleaning Product
+60%$40mm$100mmFrozen Ethnic Food
+62%$15mm$40mmAnalgesic
+79%$15mm$70mmSkin Care
ErrorActualSTM Brand/Category
The more unique the product,the higher potential for error.
Testing Options: New Product Tests
10Copyright © 2006 Information Resources, Inc. Confidential and proprietary.
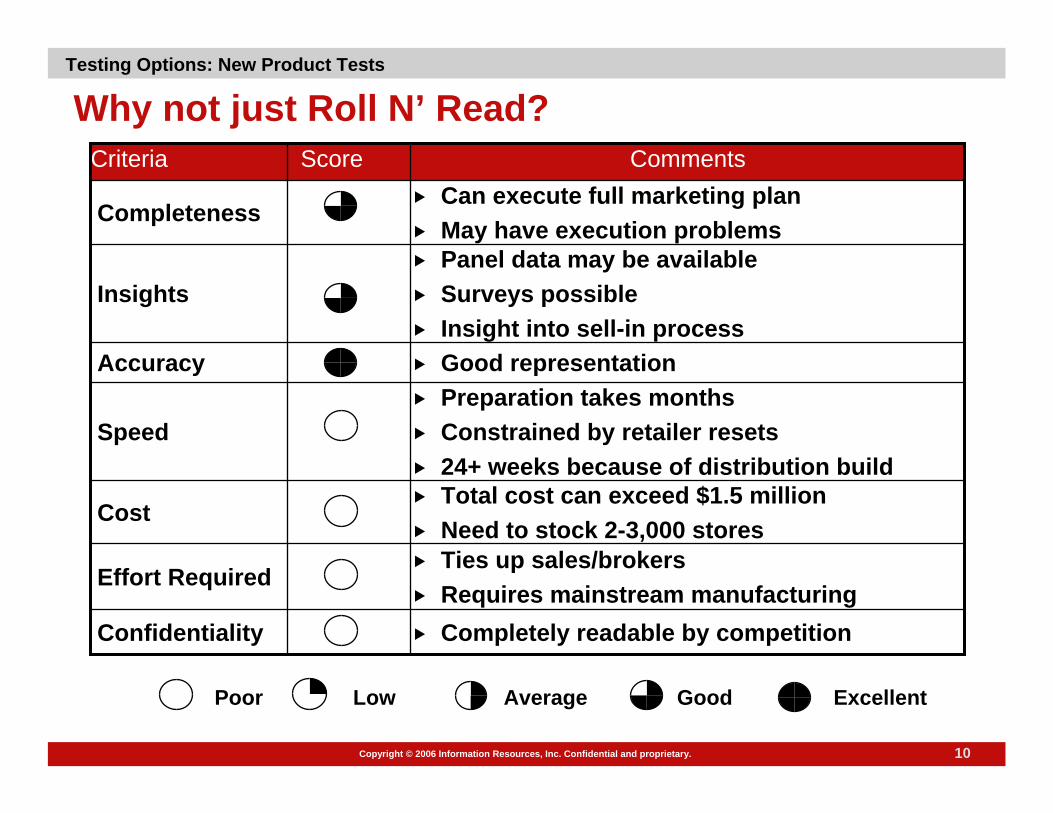
Why not just Roll N’ Read?
Panel data may be availableSurveys possibleInsight into sell-in process
Insights
Can execute full marketing planMay have execution problems
Completeness
Good representationAccuracy
Completely readable by competitionConfidentiality
Ties up sales/brokersRequires mainstream manufacturing
Effort Required
Total cost can exceed $1.5 millionNeed to stock 2-3,000 stores
Cost
Preparation takes monthsConstrained by retailer resets24+ weeks because of distribution build
Speed
CommentsScoreCriteria
ExcellentGoodAverage Low Poor
Testing Options: New Product Tests

11Copyright © 2006 Information Resources, Inc. Confidential and proprietary.
Complete panel data availableCan test/model alternative marketing plansCan identify and survey triers
Insights
Can execute full marketing plan. Full controlCompleteness
IntroCast validates at +/- 9%, 90% of timeAccuracy
Some of store data is maskedAll of panel data is masked
Confidentiality
IRI negotiates with retailer IRI stocks and merchandises product
Effort Required
Research costs $350k+Need to stock 20-40 stores
Cost
6 week setup12-24 weeks to run
Speed
CommentsScoreCriteria
ExcellentGoodAverage Low Poor
BehaviorScanTesting Options: New Product Tests

12Copyright © 2006 Information Resources, Inc. Confidential and proprietary.
When to use STM vs. BScan?
Need results in 12-24 weeksNeed results in 6-8 weeks
Some exposure acceptableConfidentiality critical
High riskLow risk
High investmentLow investment
“Unique” marketing plan“Typical” marketing plan
Cannibalization importantCannibalization not important
New or multiple categoriesEstablished category
BscanSTM
Testing Options: New Product Tests
13Copyright © 2006 Information Resources, Inc. Confidential and proprietary.
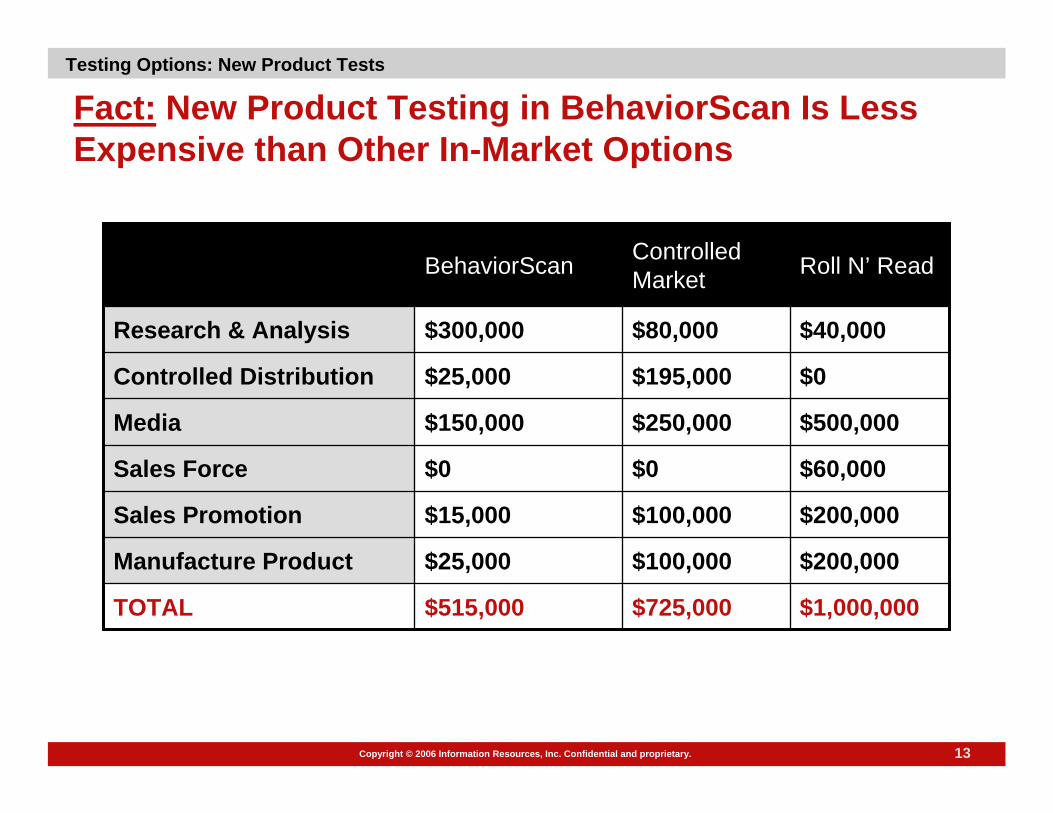
Fact: New Product Testing in BehaviorScan Is Less Expensive than Other In-Market Options
$1,000,000$725,000$515,000TOTAL
$200,000$100,000$25,000Manufacture Product
$200,000$100,000$15,000Sales Promotion
$60,000$0$0Sales Force
$500,000$250,000$150,000Media
$0$195,000$25,000Controlled Distribution
$40,000$80,000$300,000Research & Analysis
Roll N’ ReadControlled MarketBehaviorScan
Testing Options: New Product Tests
Copyright © 2006 Information Resources, Inc. Confidential and proprietary.
Why Test New Products & What Options are Available?Why Test TV Advertising & What Options are AvailableBehaviorScan: How it Works & What You GetNew Multi-Outlet Panel DataImproved Panel ANCOVA ModelAppendices
Agenda
Copyright © 2006 Information Resources, Inc. Confidential and proprietary.

15Copyright © 2006 Information Resources, Inc. Confidential and proprietary.
Why Should you Test TV Advertising?
Many advertising programs have negative ROI’sAdvertising doesn’t always work – you need to test itGet more for your marketing dollar; reduce uncertainty
The media has changed; you must adapt
Bscan is more accurate than Matched Market tests and often costsless
Test TV: Heavy or reduced spend, broadcast vs. cable, in/out season, 15s vs. 30s, multi vs. single brand
Why Test TV Advertising?
16Copyright © 2006 Information Resources, Inc. Confidential and proprietary.
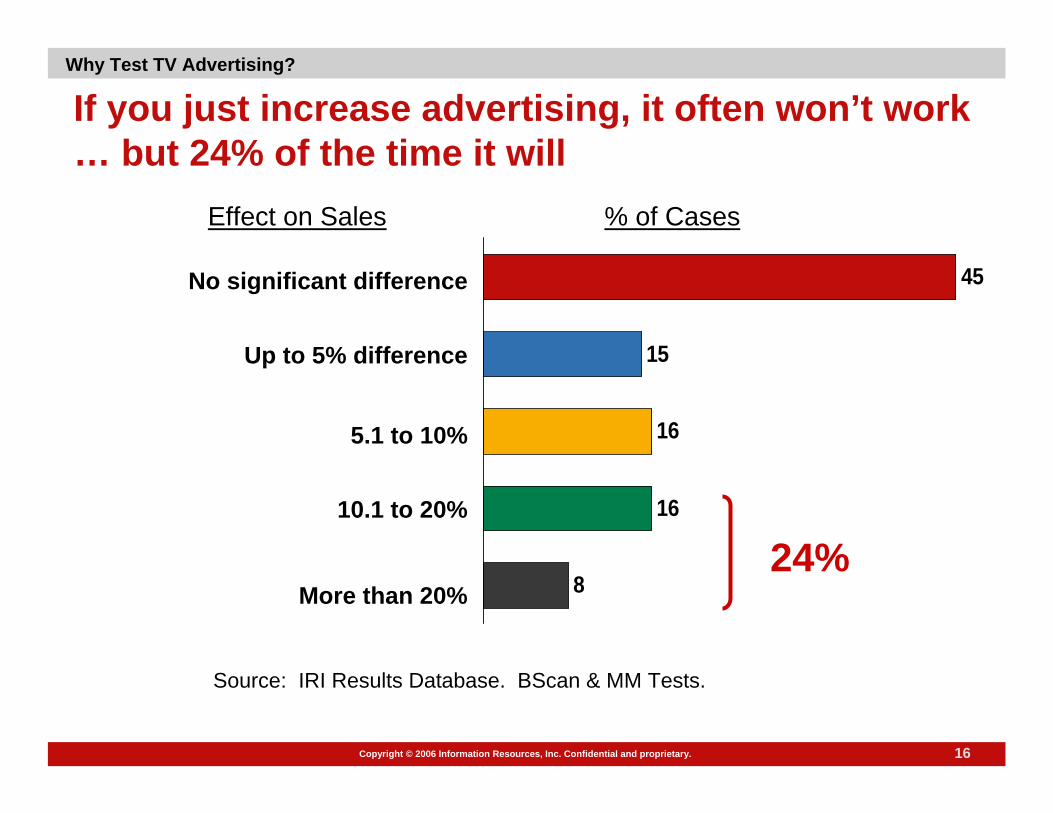
If you just increase advertising, it often won’t work … but 24% of the time it will
Why Test TV Advertising?
No significant difference
Up to 5% difference
5.1 to 10%
10.1 to 20%
More than 20%
Effect on Sales % of Cases
Source: IRI Results Database. BScan & MM Tests.
24%8
16
16
15
45

17Copyright © 2006 Information Resources, Inc. Confidential and proprietary.
Most Marketing Programs Have Negative ROI’s
57%
51%
72%
Advertising
Coupons
Trade
Incremental Profit Per Marketing Dollar Spent
Source: 21 Recent Mix Drivers Studies
Why Test TV Advertising?

18Copyright © 2006 Information Resources, Inc. Confidential and proprietary.
The Media has Changed
More channels, more choices means more opportunity for media targeting
# of Channels in the Avg Home
10.0
100
1980
2004
TV is more expensive:A 414% increase in CPM vs. a
212% increase in Cost of Living.
Cost per Thousand Viewers (CPM $)
4.8
19.9
1980
2004
Source: Media Dynamics
Why Test TV Advertising?

19Copyright © 2006 Information Resources, Inc. Confidential and proprietary.
What Options do you Have for TV Ad Testing?
Look to the Past: Model
Advertising Tests: Informal Matched Market Statistical Matched MarketBehaviorScan
Copy Testing
Testing Options: TV Ad Tests
20Copyright © 2006 Information Resources, Inc. Confidential and proprietary.
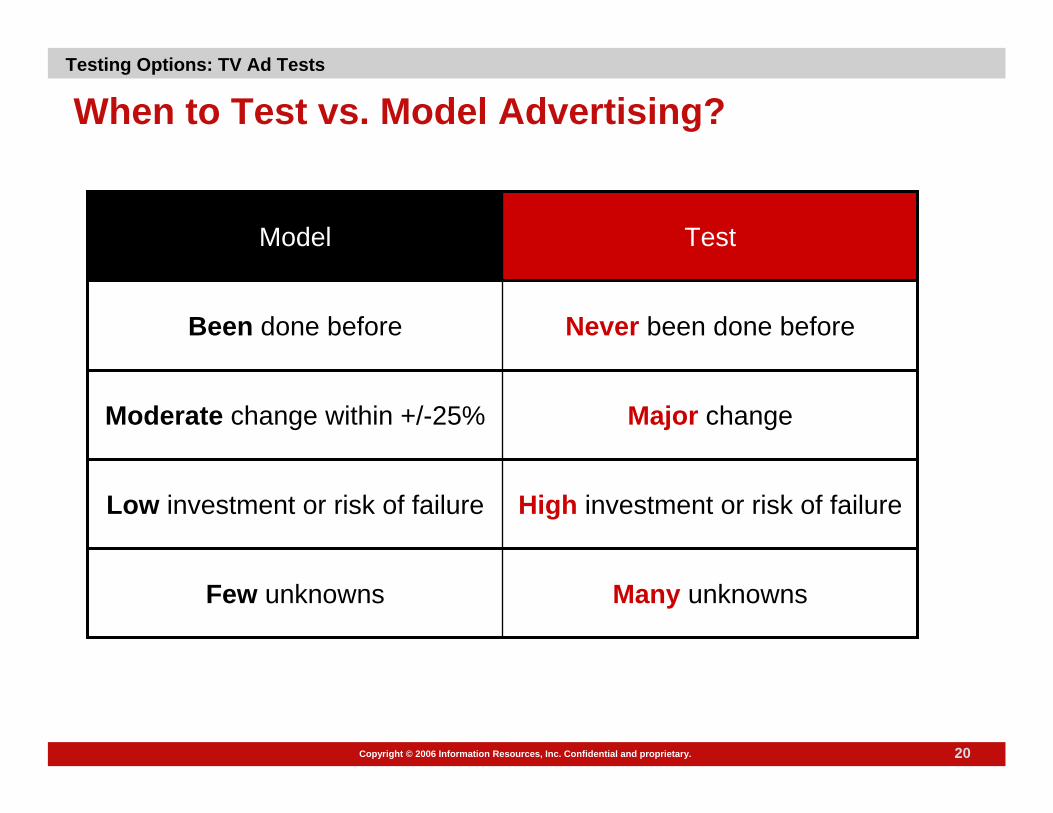
When to Test vs. Model Advertising?
Many unknownsFew unknowns
High investment or risk of failureLow investment or risk of failure
Major changeModerate change within +/-25%
Never been done beforeBeen done before
TestModel
Testing Options: TV Ad Tests
21Copyright © 2006 Information Resources, Inc. Confidential and proprietary.
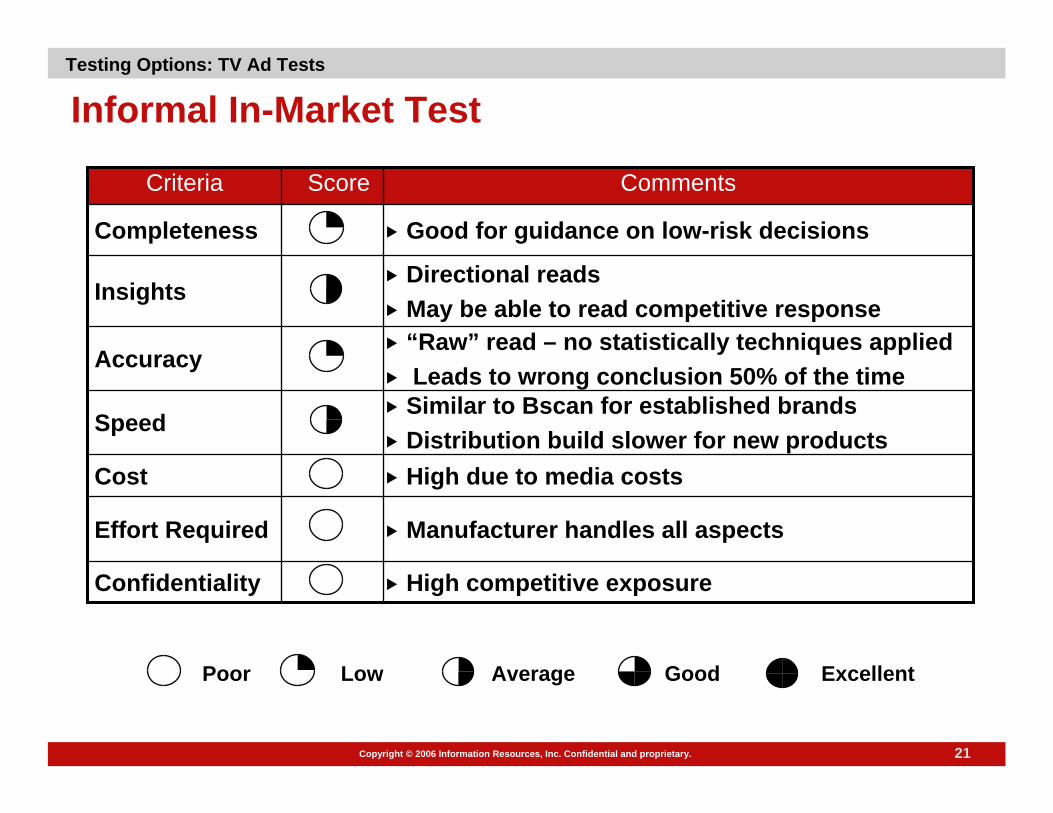
Directional readsMay be able to read competitive response
Insights
Good for guidance on low-risk decisionsCompleteness
“Raw” read – no statistically techniques appliedLeads to wrong conclusion 50% of the time
Accuracy
High competitive exposureConfidentiality
Manufacturer handles all aspectsEffort Required
High due to media costsCost
Similar to Bscan for established brandsDistribution build slower for new products
Speed
CommentsScoreCriteria
ExcellentGoodAverage Low Poor
Informal In-Market Test Testing Options: TV Ad Tests

22Copyright © 2006 Information Resources, Inc. Confidential and proprietary.
ExcellentGoodAverage Low Poor
Panel overlay possibleMay be able to read competitive responseInsights
Good for analyses that can’t be tested at the HH-level like consumer promotions and radio advertising.Completeness
Statistical match and ANCOVA greatly improve accuracyLess control/more unknowns than Bscan
Accuracy
High competitive exposureConfidentiality
Client sales force executes treatmentIRI matches markets and analyzes results Effort Required
Usually higher than Bscan due to media costsCost
Similar to Bscan for established brandsDistribution build slower for new productsSpeed
CommentsScoreCriteria
Statistical Matched Market Test Testing Options: TV Ad Tests

23Copyright © 2006 Information Resources, Inc. Confidential and proprietary.
ExcellentGoodAverage Low Poor
Reads actual panel sales; surveys also available.Multi-outlet panel captures Wal-Mart purchases
Insights
Controlled, real-world environment.Often the only way to test new copy in the real world
Completeness
Most accurate design: test and control cells exposed to the same conditions with targetable TV
Representative marketsStatistical procedures like ANCOVA improvesensitivity
Accuracy
Most store and all panel data is masked.Possibility of competitive exposure
Confidentiality
IRI handles all execution (e.g., cut-ins), except media buyLow panelist burden
Effort Required
Typical Media + Research = $325Frequently lower than MMT’s due to media costs
Cost
Typical test is 52 weeks; 12-24 reads are possibleSpeed
CommentsScoreCriteria BehaviorScan TV Ad Testing
Testing Options: TV Ad Tests

24Copyright © 2006 Information Resources, Inc. Confidential and proprietary.
ExcellentGoodAverage Low Poor
Measures recall, awareness, ad effectiveness Extensive databases available
Insights
Good for ranking of alternative copy ideasNot helpful for new copy or significant changes
Completeness
Based on recall, not actual behaviorLow sample size
Accuracy
Low competitive exposureConfidentiality
Ads do not have to be complete to be tested Respondents watch tape more than once and are interviewed extensively
Effort Required
Low end $15K; average test $50-60KCostTypical test takes at least 5 wks (start to finish)Speed
CommentsScoreCriteria
Copy Testing Testing Options: TV Ad Tests
25Copyright © 2006 Information Resources, Inc. Confidential and proprietary.
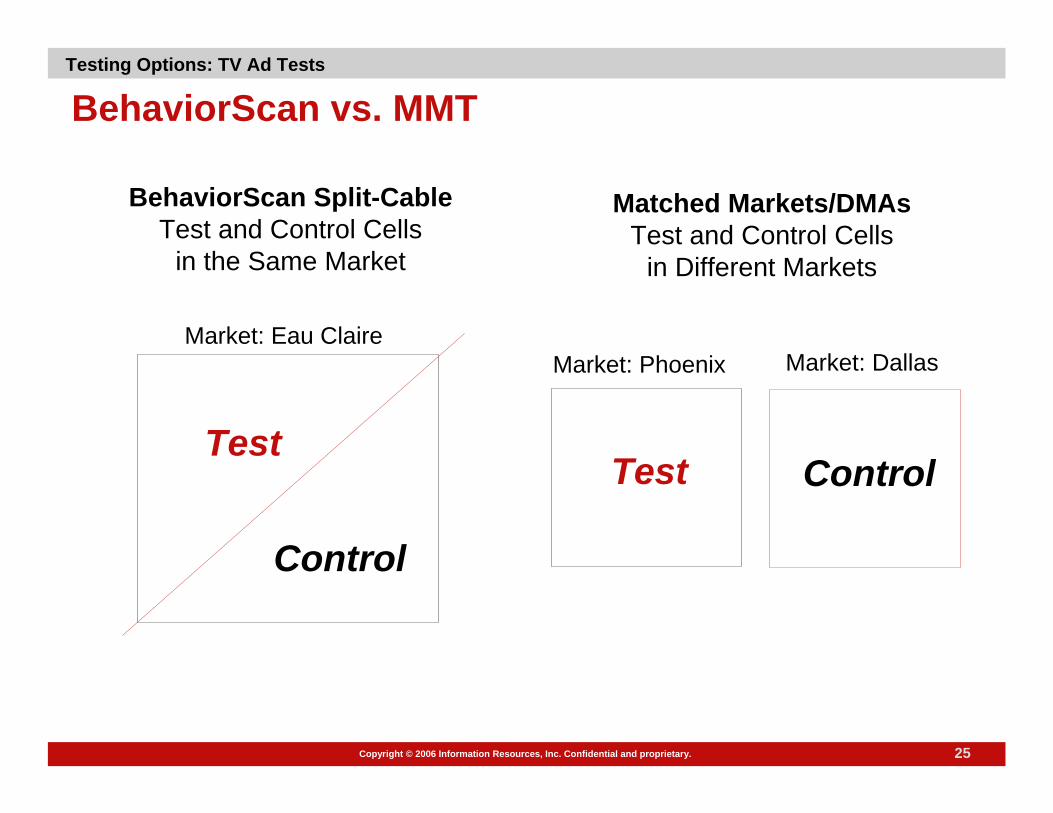
BehaviorScan vs. MMT
BehaviorScan Split-CableTest and Control Cells
in the Same Market
Matched Markets/DMAsTest and Control Cells
in Different Markets
Test
Control
Test Control
Market: Eau ClaireMarket: Phoenix Market: Dallas
Testing Options: TV Ad Tests

26Copyright © 2006 Information Resources, Inc. Confidential and proprietary.
Fact: For TV Ad Testing, BehaviorScan is Often Cheaper than Matched Market
Lower media costs in small markets offset higher research costs
Research Cost for B-Scan: 24-week contract (1 outlet, 2 markets) with 20%under-utilized category discount, analytics, and TV ad cut-ins.Research Cost for MMT: IRI analytics only, 1 outlet. (NOTE: Albany is the worst case; other markets are less expensive.)
AND you get much more with BehaviorScan!
$5,000SAVINGS
$330,000$325,000Total Cost
$50,000$165,000Research Cost *$280,000$160,000Media Cost
Nashville + Indianapolis
Pittsfield (Albany) + MidlandMarkets
Matched MarketBscan
Testing Options: TV Ad Tests

27Copyright © 2006 Information Resources, Inc. Confidential and proprietary.
This Client Saved Nearly $400K with Bscan
$392,000SAVINGS$762,000$370,000Total Cost
$50,000$250,000Research Cost$712,000$120,000Media Cost
2 DMAs2 Bscan MarketsMarkets
Matched MarketBscan
Testing Options: TV Ad Tests

28Copyright © 2006 Information Resources, Inc. Confidential and proprietary.
Flipping a coin would be just as accurate
54%
8%17%
Informal MarketComparison
Matched Mkt w/Statistical Methods
BehaviorScan WithinMarket
% False Positive*
* Reporting a “test effect” when none exists
Bscan is the Most Accurate MethodTesting Options: TV Ad Tests

29Copyright © 2006 Information Resources, Inc. Confidential and proprietary.
A Major Client said…
“In 2003, our ad spending rose to 8.9 percent of sales, while trade and consumer spending fell to 10.2 percent. Most importantly, rigorous testing tells us that we’re spending our money on marketing and advertising programs that are among the very best in persuasion and impact.”
Jim Kilts, the CEO of Gillette
Testing Options: TV Ad Tests

Copyright © 2006 Information Resources, Inc. Confidential and proprietary.
Why Test New Products & What Options are Available?Why Test TV Advertising & What Options are AvailableBehaviorScan: How it Works & What You GetNew Multi-Outlet Panel DataImproved Panel ANCOVA ModelAppendices
Agenda
Copyright © 2006 Information Resources, Inc. Confidential and proprietary.

31Copyright © 2006 Information Resources, Inc. Confidential and proprietary.
BehaviorScan is . . .
Full retail execution for testing new products
The nation’s only within-market Targetable TV system for testing new creative and alternative media plansIn-depth analytics
Retail sales Household purchasingAttitudinal surveys available
Benefits
32Copyright © 2006 Information Resources, Inc. Confidential and proprietary.
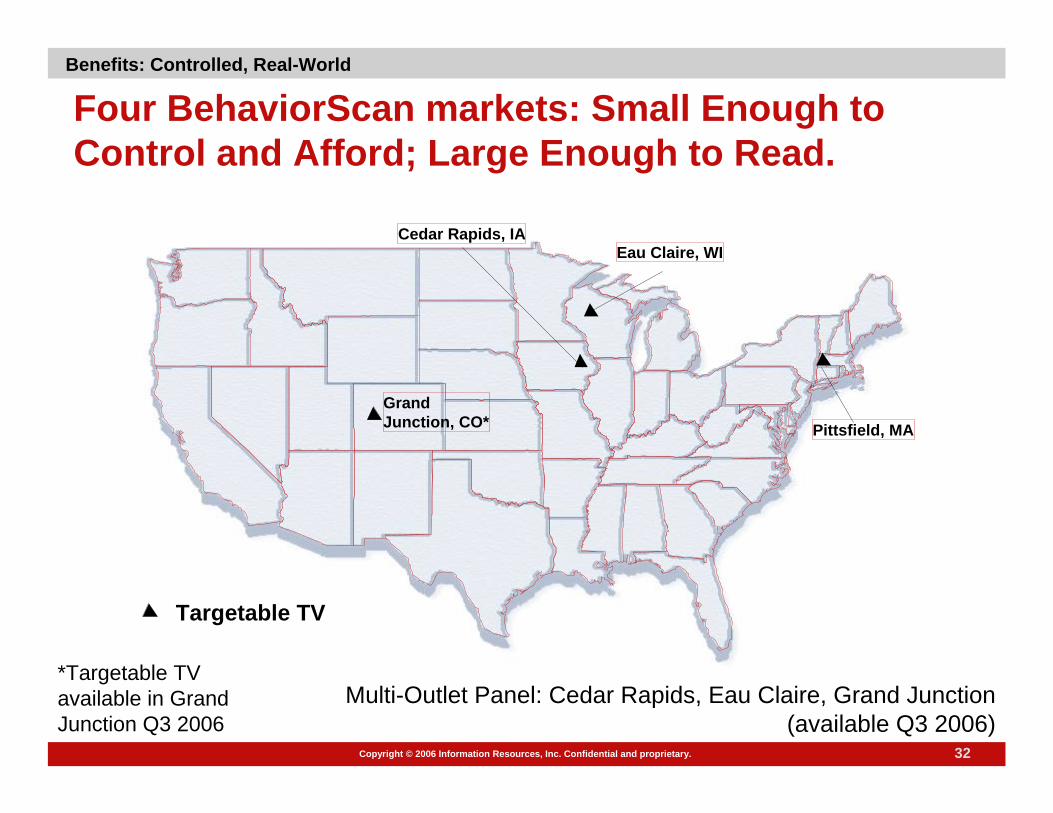
Four BehaviorScan markets: Small Enough to Control and Afford; Large Enough to Read.
GrandJunction, CO* Pittsfield, MA
Cedar Rapids, IAEau Claire, WI
Targetable TV
Multi-Outlet Panel: Cedar Rapids, Eau Claire, Grand Junction (available Q3 2006)
Benefits: Controlled, Real-World
*Targetable TV available in Grand Junction Q3 2006
33Copyright © 2006 Information Resources, Inc. Confidential and proprietary.
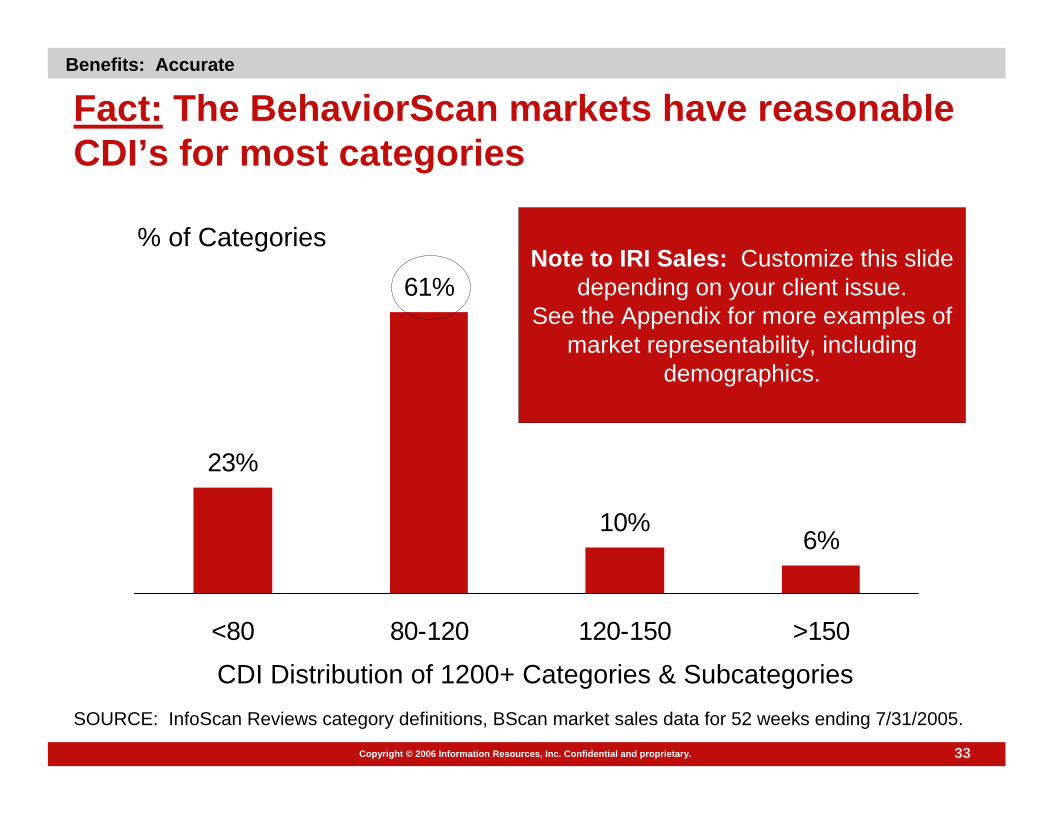
Fact: The BehaviorScan markets have reasonable CDI’s for most categories
23%
61%
10%6%
<80 80-120 120-150 >150
CDI Distribution of 1200+ Categories & Subcategories
% of Categories
SOURCE: InfoScan Reviews category definitions, BScan market sales data for 52 weeks ending 7/31/2005.
Note to IRI Sales: Customize this slide depending on your client issue.
See the Appendix for more examples of market representability, including
demographics.
Benefits: Accurate

34Copyright © 2006 Information Resources, Inc. Confidential and proprietary.
Complete Coverage of Retail Sales & Merchandising Retail scanner sales data collected weekly from nearly all grocery, drug, and mass merchandise stores*Weekly collection of feature ads and displaysData from other sources can also be incorporated
Participating in each BScan market are:
7 to 12 FOOD stores
1 to 14 DRUG stores
3 to 5 MASS stores*
*Mass stores are not under contract but can be approached on a test-by-test basis
Benefits: Accurate
35Copyright © 2006 Information Resources, Inc. Confidential and proprietary.
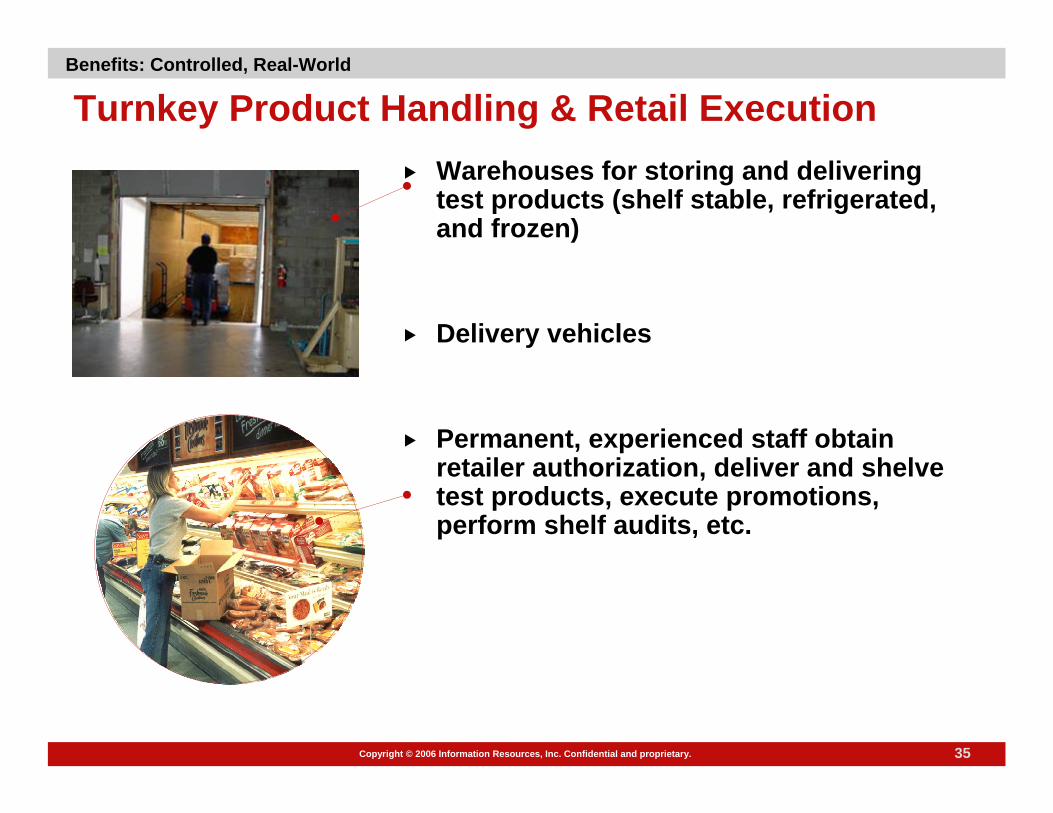
Turnkey Product Handling & Retail ExecutionWarehouses for storing and delivering test products (shelf stable, refrigerated, and frozen)
Delivery vehicles
Permanent, experienced staff obtain retailer authorization, deliver and shelve test products, execute promotions, perform shelf audits, etc.
Benefits: Controlled, Real-World
36Copyright © 2006 Information Resources, Inc. Confidential and proprietary.
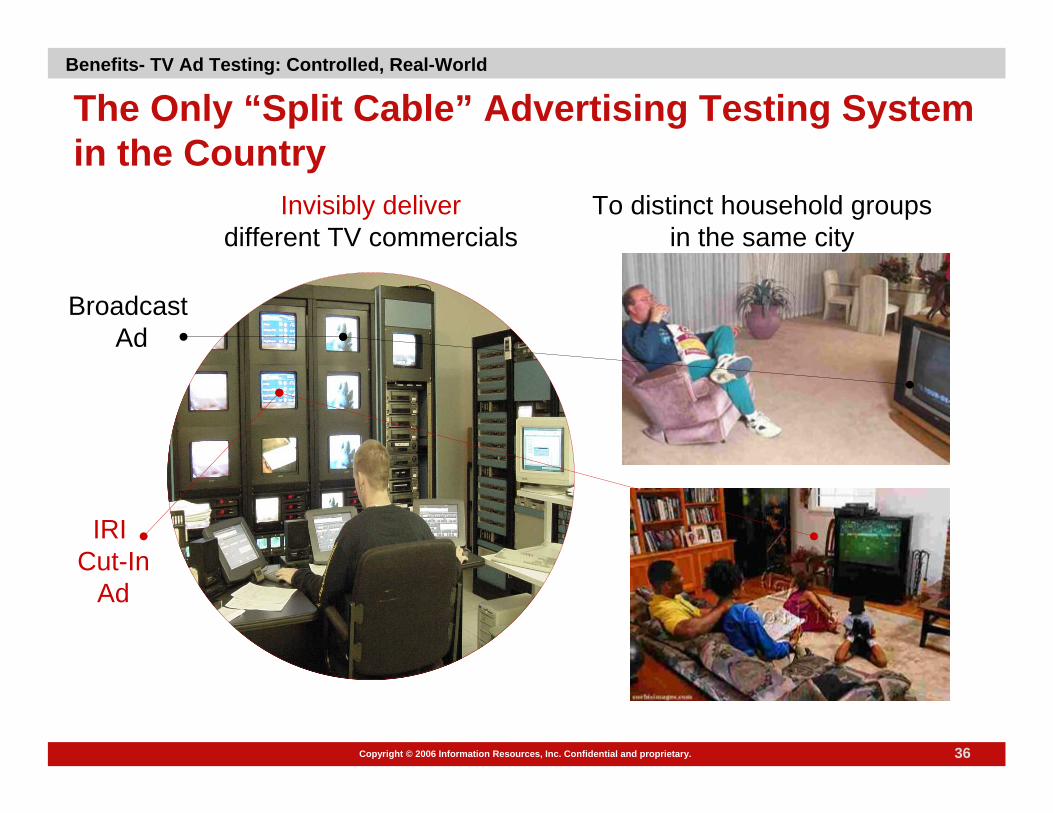
The Only “Split Cable” Advertising Testing System in the Country
Invisibly deliverdifferent TV commercials
Broadcast Ad
IRI Cut-In
Ad
To distinct household groupsin the same city
Benefits- TV Ad Testing: Controlled, Real-World

37Copyright © 2006 Information Resources, Inc. Confidential and proprietary.
AA
A
BB
C
A
A
B
CA
A
B
B
C
A C
Markets have 30+ fiber optic “nodes”, grouped into three demographically balanced cells.Covers all TV channels in that market and all TV sets in the householdLarge sample for survey researchNo panelist workload
Checkerboard TV Ad Testing Using Underlying Cable System
Benefits- TV Ad Testing: Controlled, Real-World
38Copyright © 2006 Information Resources, Inc. Confidential and proprietary.
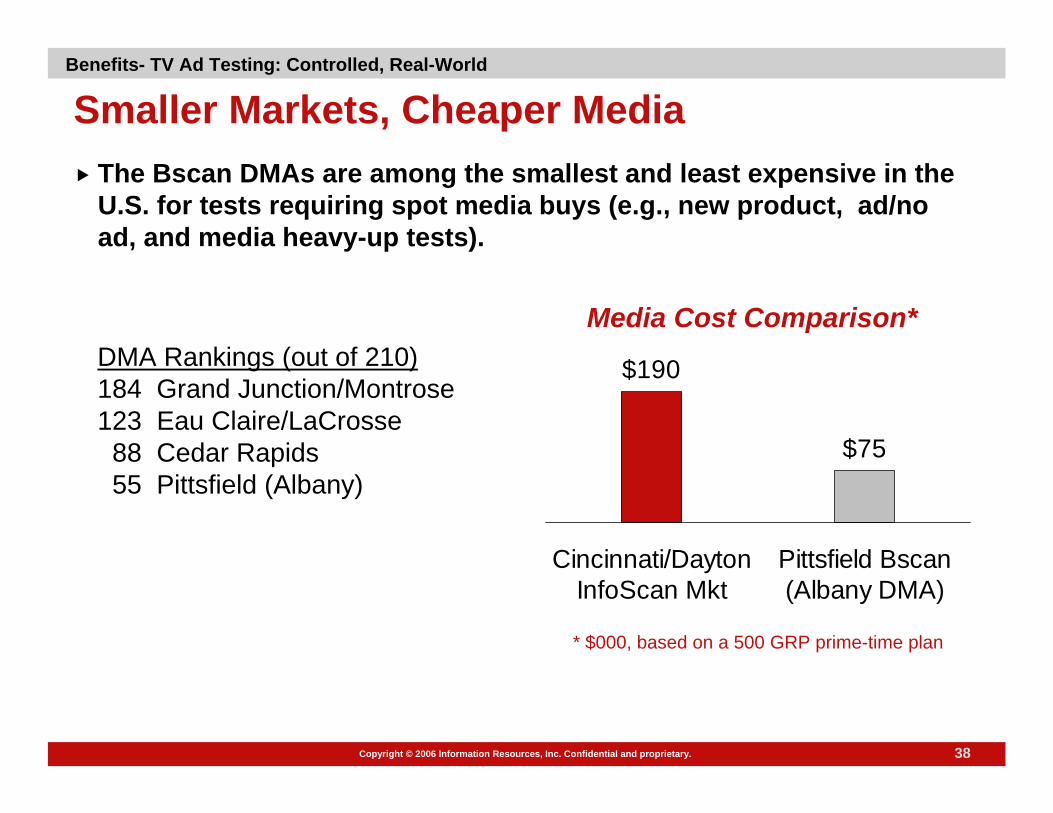
Smaller Markets, Cheaper MediaThe Bscan DMAs are among the smallest and least expensive in the U.S. for tests requiring spot media buys (e.g., new product, ad/no ad, and media heavy-up tests).
DMA Rankings (out of 210)184 Grand Junction/Montrose123 Eau Claire/LaCrosse88 Cedar Rapids55 Pittsfield (Albany)
* $000, based on a 500 GRP prime-time plan
Media Cost Comparison*
$190
$75
Cincinnati/DaytonInfoScan Mkt
Pittsfield Bscan(Albany DMA)
Benefits- TV Ad Testing: Controlled, Real-World
39Copyright © 2006 Information Resources, Inc. Confidential and proprietary.
Quicker Ad Test Reads are Available
A 52-week read is preferred, however 12- and 24-week reads are generally feasible.
If there is going to be a long term effect, you will begin to see it within 8 weeks.
Benefits- TV Ad Testing: Speed

40Copyright © 2006 Information Resources, Inc. Confidential and proprietary.
IntroCast Forecasting Model
TRIAL REPEAT ADDITONAL REPEAT
Potential Additional Repeaters
Potential Repeaters
Potential Triers
Advertising, Consumer and Trade Promotion
• Accurate forecasts in 12-16 weeks
• Ability to simulate alternative marketing plans
Benefits- New Product Testing: Speed

41Copyright © 2006 Information Resources, Inc. Confidential and proprietary.
An Accurate Forecast After 12-24 Weeks
Accuracy when predicting year-one after 12-24 weeks in-market: IntroCast validation: ± 9% in 90% of the casesMajor manufacturer validated at ±7% at 12 weeksYear-one forecast in 12-16 weeks for many products
Length of test depends on purchase cycle and product incidence
Need at least 150 triers and 50 repeaters
Benefits- New Product Testing: Speed

42Copyright © 2006 Information Resources, Inc. Confidential and proprietary.
Volume Decomposition by Marketing Mix Element
Base PlanYear One Sales = 20MM units
Advertising 15%
Coupons 10%
Trade 15%
Synergy 10%
Base 50%
Benefits- New Product Testing: Actionable

43Copyright © 2006 Information Resources, Inc. Confidential and proprietary.
Ability to Evaluate Alternative Marketing Plans
Base Plan with Coupons
20MM Units
Revised Plan, No Coupons
18MM Units
Trade
Coupons
Advertising
Base
Benefits- New Product Testing: Actionable

44Copyright © 2006 Information Resources, Inc. Confidential and proprietary.
Attitudinal Research OptionsAttitudeLinkTM: Survey IRI panelists to evaluate Trial & Repeat and other new product measures by consumer segment
comScore Behavior Activated Research (BAR): Survey invitation via coupon issued through Catalina check-out machines triggered by purchase and/or purchase history (e.g. brand buyer, trier that switched to competitor)
Available through 3rd parties:Phone surveys of non-panelists: Awareness, Usage, & Attitudes (must use Survey Sampling)Focus groups / one-on-one interviewsShopper intercept interviews and retailer feedback surveys
Benefits: Actionable
Copyright © 2006 Information Resources, Inc. Confidential and proprietary.
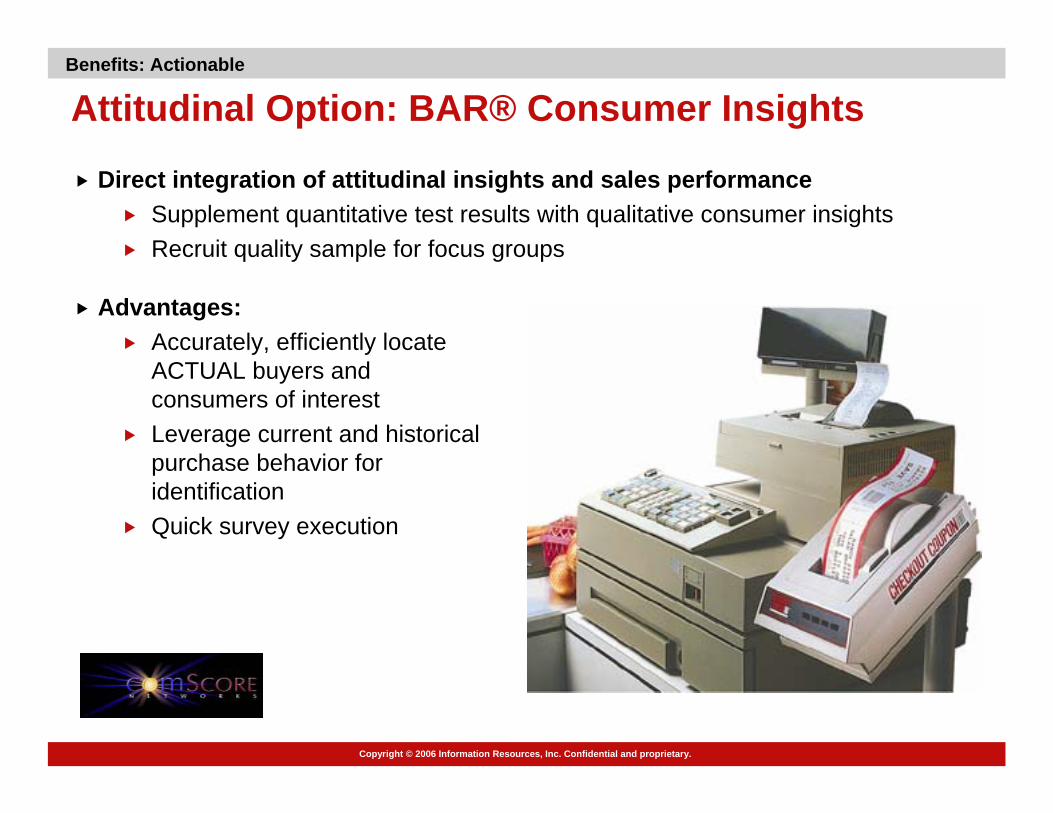
Attitudinal Option: BAR® Consumer Insights Benefits: Actionable
Direct integration of attitudinal insights and sales performanceSupplement quantitative test results with qualitative consumer insightsRecruit quality sample for focus groups
Advantages:Accurately, efficiently locate ACTUAL buyers and consumers of interestLeverage current and historical purchase behavior for identificationQuick survey execution

46Copyright © 2006 Information Resources, Inc. Confidential and proprietary.
BAR® Survey Process
ShoppingShopping Research InvitationResearch InvitationCheckoutCheckout
Call InitiatedCall Initiated Telephone InterviewTelephone Interview Web InterviewWeb Interview
Picture of a check?
Incentive RewardIncentive Reward
POSPOS
Qualifies potential survey respondents using in-store purchase data from the Catalina Marketing Network®Triggers survey invitations at checkout registersConsumers respond via telephone or Web to receive cash incentive
Benefits: Actionable
47Copyright © 2006 Information Resources, Inc. Confidential and proprietary.
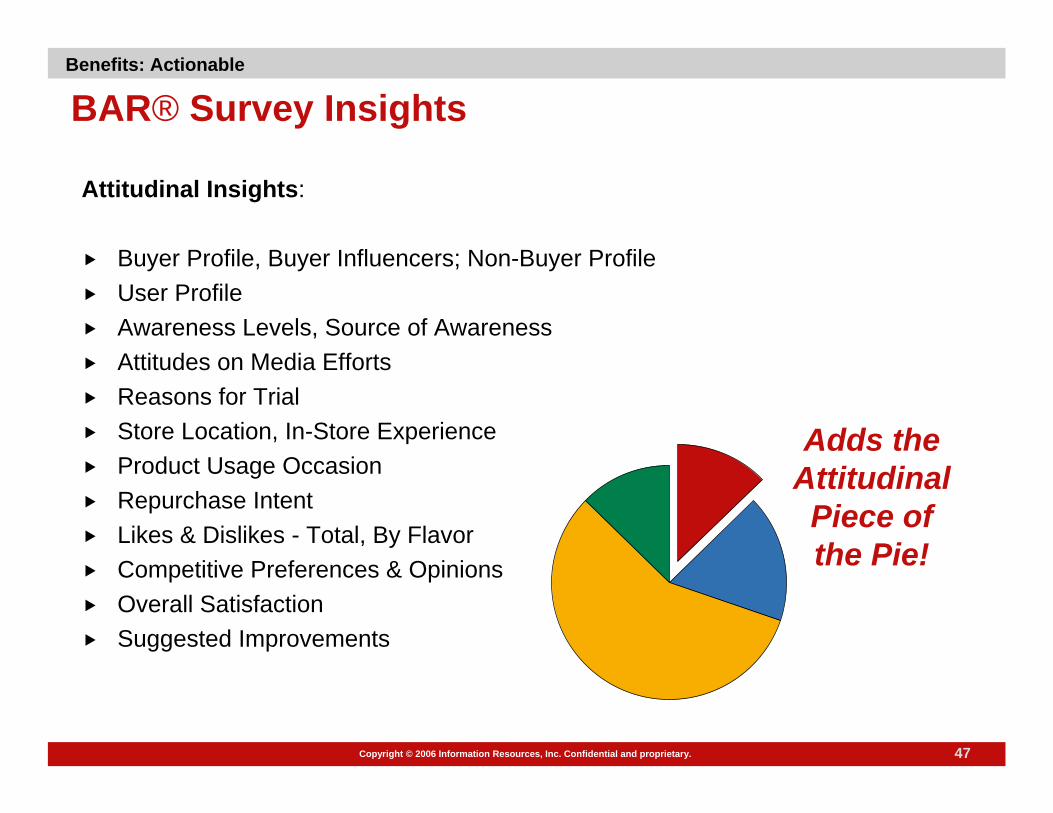
Attitudinal Insights:
Buyer Profile, Buyer Influencers; Non-Buyer ProfileUser ProfileAwareness Levels, Source of Awareness Attitudes on Media EffortsReasons for TrialStore Location, In-Store ExperienceProduct Usage OccasionRepurchase IntentLikes & Dislikes - Total, By FlavorCompetitive Preferences & OpinionsOverall SatisfactionSuggested Improvements
BAR® Survey Insights
Adds the Attitudinal Piece of the Pie!
Benefits: Actionable
Copyright © 2006 Information Resources, Inc. Confidential and proprietary.
Why Test New Products & What Options are Available?Why Test TV Advertising & What Options are AvailableBehaviorScan: How it Works & What You GetNew Multi-Outlet Panel DataImproved Panel ANCOVA ModelAppendices
Agenda
Copyright © 2006 Information Resources, Inc. Confidential and proprietary.
49Copyright © 2006 Information Resources, Inc. Confidential and proprietary.
What’s Exciting About the New BehaviorScan?
Accuracy & CoverageImproved coverage: captures Wal-Mart and other outlets Better sensitivity: more transactions from more householdsNew panel ANCOVA methodology = better sensitivity, tighter results
ActionabilityMore relevant for Non-Food categories and anyone that has Wal-Mart as a top clientNew ways to collect attitudinal data
Still the most controlled, real-world testing environment
Benefits
50Copyright © 2006 Information Resources, Inc. Confidential and proprietary.
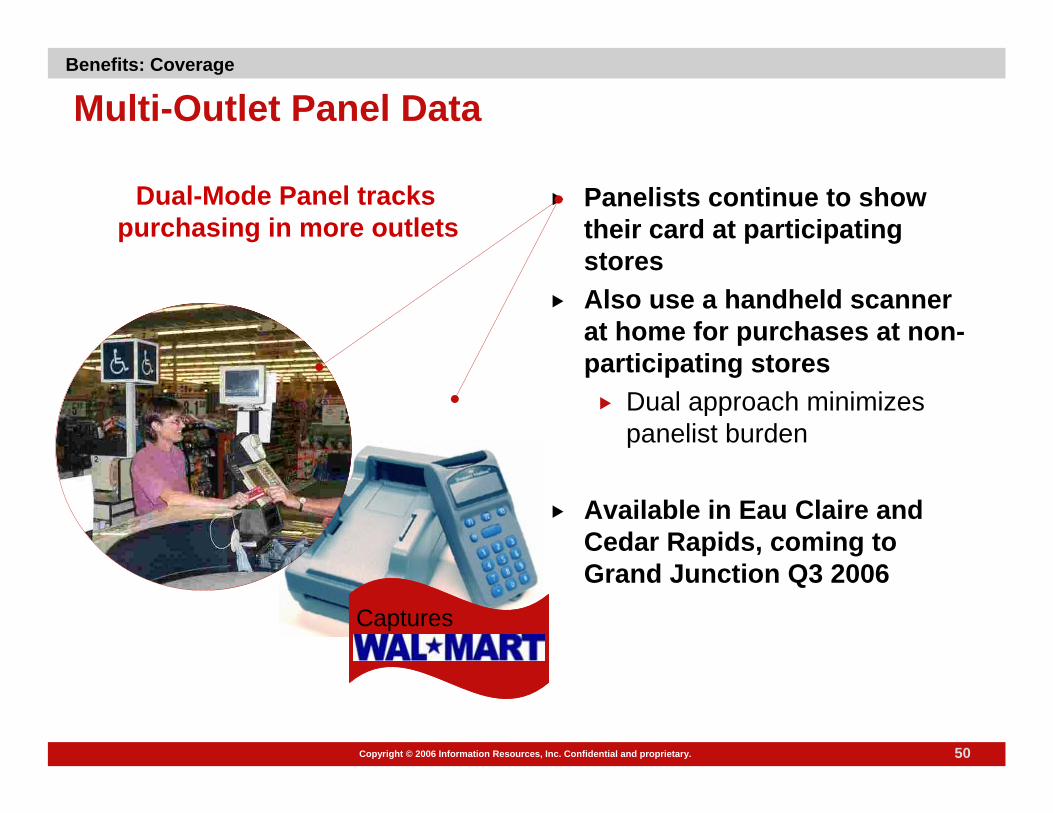
Multi-Outlet Panel Data
Dual-Mode Panel tracks purchasing in more outlets
Panelists continue to show their card at participating stores Also use a handheld scanner at home for purchases at non-participating stores
Dual approach minimizes panelist burden
Available in Eau Claire and Cedar Rapids, coming to Grand Junction Q3 2006
Captures
Benefits: Coverage
51Copyright © 2006 Information Resources, Inc. Confidential and proprietary.
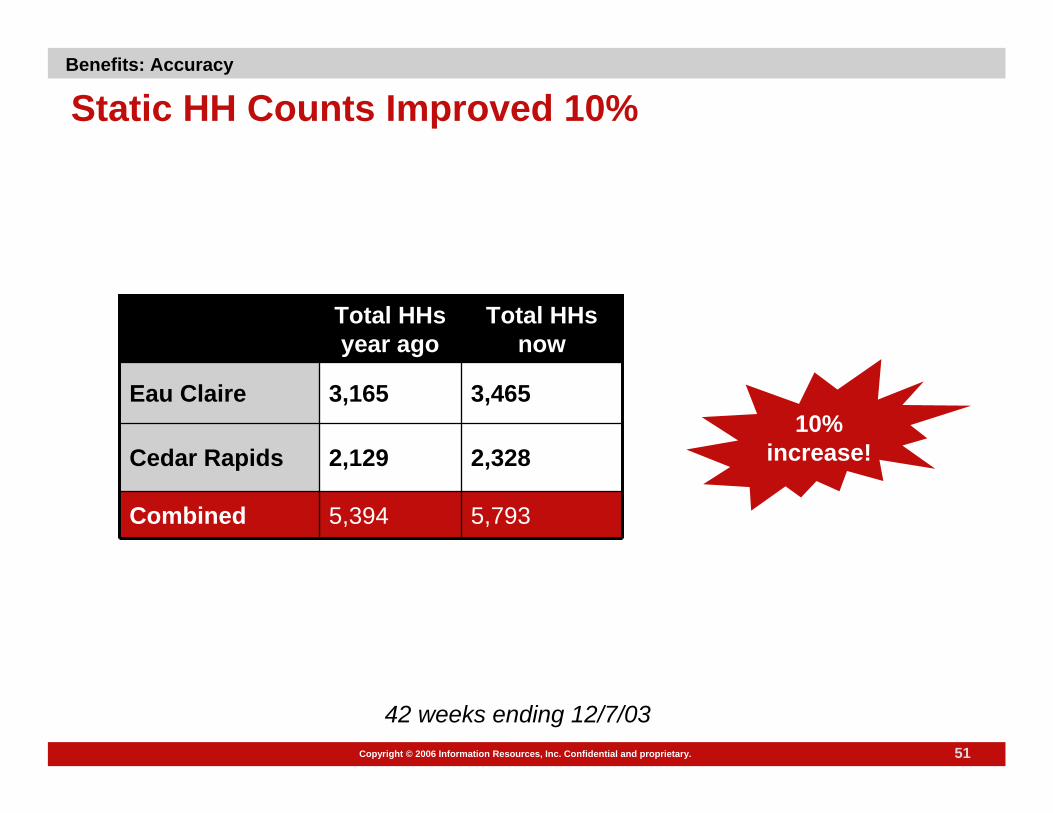
Static HH Counts Improved 10%
5,7935,394Combined
2,328
3,465
Total HHs now
2,129Cedar Rapids
3,165Eau Claire
Total HHs year ago
42 weeks ending 12/7/03
10% increase!
Benefits: Accuracy
52Copyright © 2006 Information Resources, Inc. Confidential and proprietary.
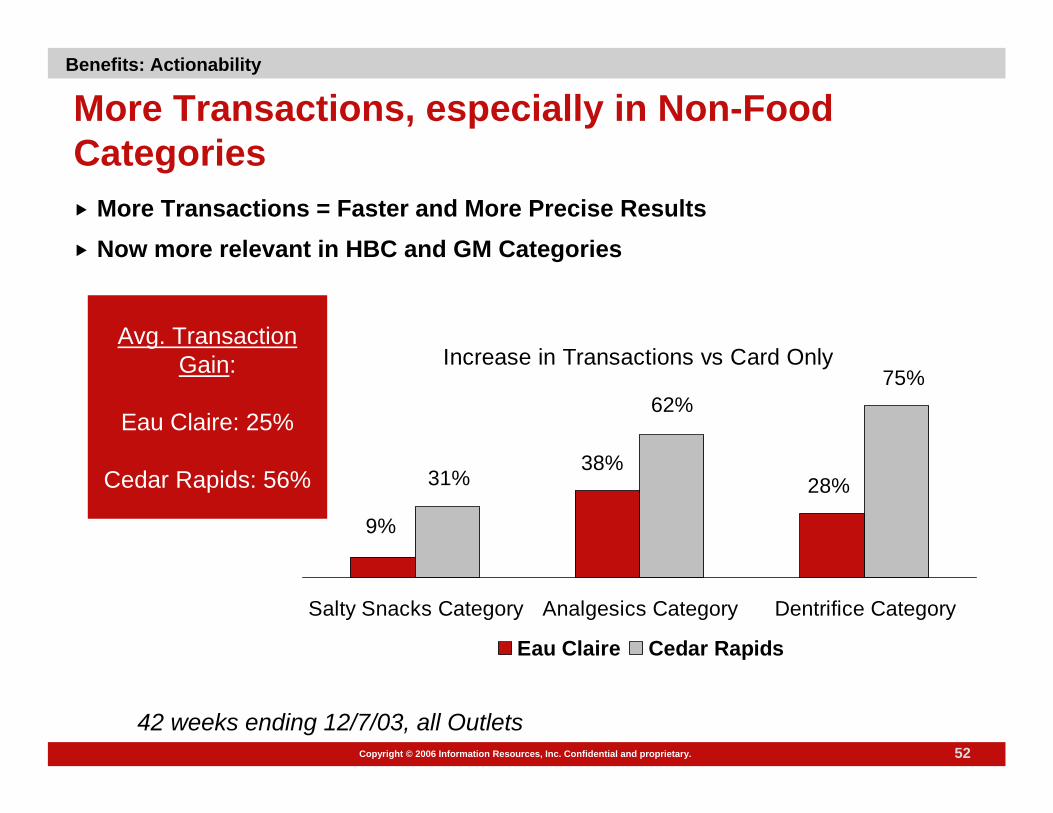
More Transactions, especially in Non-Food Categories
Increase in Transactions vs Card Only
9%
38%28%31%
62%75%
Salty Snacks Category Analgesics Category Dentrifice Category
Eau Claire Cedar Rapids
More Transactions = Faster and More Precise ResultsNow more relevant in HBC and GM Categories
42 weeks ending 12/7/03, all Outlets
Avg. Transaction Gain:
Eau Claire: 25%
Cedar Rapids: 56%
Benefits: Actionability

53Copyright © 2006 Information Resources, Inc. Confidential and proprietary.
Multi-Outlet Improves Test Sensitivity by 15%
Source: EC & CR combined – 52 pre vs 52 post - Sensitivities at 80% CL
11.5
10
Grocery Only Panel Multi-Outlet Panel
Average Sensitivity Across 6 Non-Food Brands with Long Purchase Cycles
15% improvement!
Benefits: Accuracy
Copyright © 2006 Information Resources, Inc. Confidential and proprietary.
Why Test New Products & What Options are Available?Why Test TV Advertising & What Options are AvailableBehaviorScan: How it Works & What You GetNew Multi-Outlet Panel DataImproved Panel ANCOVA ModelAppendices
Agenda
Copyright © 2004 Information Resources, Inc. Confidential and proprietary.
55Copyright © 2006 Information Resources, Inc. Confidential and proprietary.
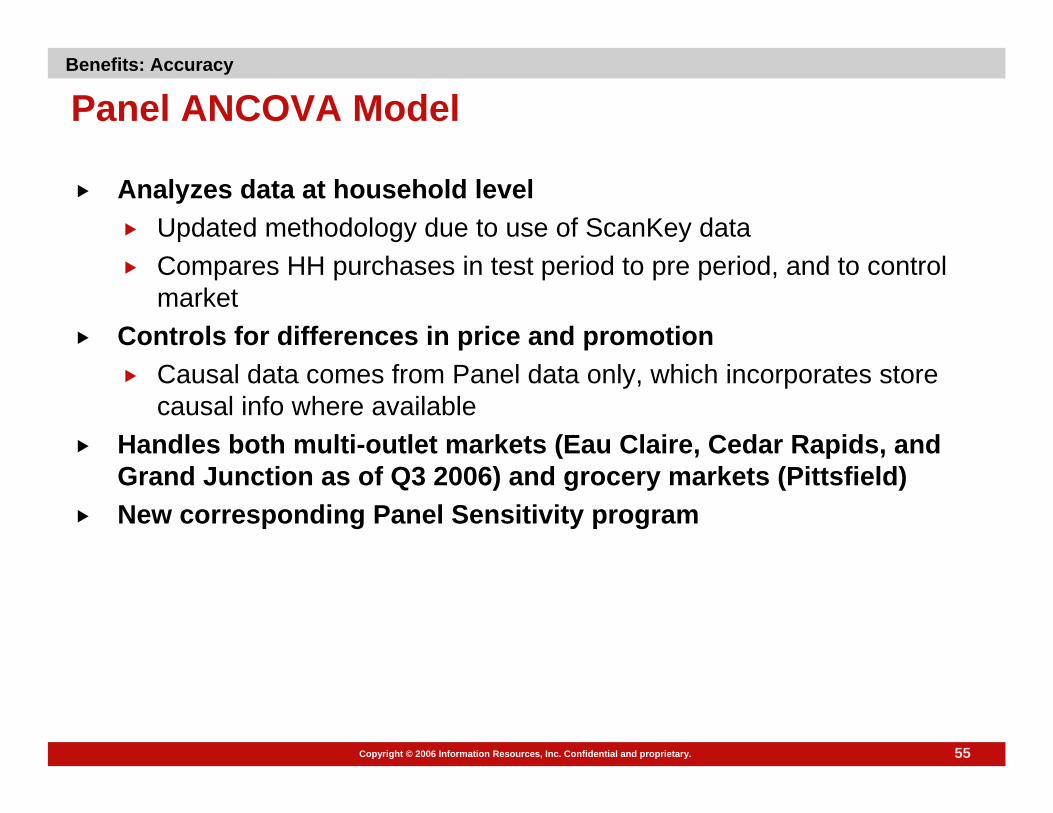
Panel ANCOVA Model
Analyzes data at household levelUpdated methodology due to use of ScanKey dataCompares HH purchases in test period to pre period, and to control market
Controls for differences in price and promotionCausal data comes from Panel data only, which incorporates storecausal info where available
Handles both multi-outlet markets (Eau Claire, Cedar Rapids, and Grand Junction as of Q3 2006) and grocery markets (Pittsfield)New corresponding Panel Sensitivity program
Benefits: Accuracy

56Copyright © 2006 Information Resources, Inc. Confidential and proprietary.
Estimate
-15.3% +15.3%
The New ANCOVA Model Provides Tighter Results
Estimate
+7.8%-7.8%
Old Covariate New Covariate
Results from Validation of 8 Tests
Benefits: Accuracy

57Copyright © 2006 Information Resources, Inc. Confidential and proprietary.
Yields the Most Accurate Results
Controlled, representative marketsReal-world = reads consumer sales, not claimed intentOften cheaper than other methods, more insightsMulti-Outlet Panel data
Improved relevancy: captures Wal-Mart and other outlets Better sensitivity: more transactions from more households
New ANCOVA methodology = better accuracyAttitudinal surveys available
Summary

58Copyright © 2006 Information Resources, Inc. Confidential and proprietary.
Appendices
Copyright © 2006 Information Resources, Inc. Confidential and proprietary.
More on Building the Business CaseMore Examples of BScan Market RepresentabilityMore on Methodology
Appendices
Copyright © 2006 Information Resources, Inc. Confidential and proprietary.

60Copyright © 2006 Information Resources, Inc. Confidential and proprietary.
Assumptions: Brand w/$75MM sales/yr, 4 SKUs, $40MM ad budget, $10MM capital investment
Bscan Gives you Better OddsTake the Net Present Value of Operating Income streams over 6 years for the average “homerun” new product …
Bscan reduces risk by $12.1 MM!
NPV of -$10.9 MMBrand 0perating income over 6 yrs
NPV of $1.2 MMBrand operating income over 6 yrs
38% Success ($8 MM)
2% Failure (-$32.2 MM)
60% Not Rolled (-$2 MM)
48% Success (+$11 MM)
52% Failure (-$31.2 MM)
Without Bscan
With Bscan
Why Test New Products?
Note to IRI Sales: A spreadsheet is available
for you to customize these calculations for your client. Contact
Claire Boyle.

61Copyright © 2006 Information Resources, Inc. Confidential and proprietary.
Why New Products Fail
30% -- Poorly articulated positioning
30% -- Product fails to meet consumer expectations
20% -- Insufficient awareness / advertisingMedia weight, compelling copy
10% -- Insufficient promotion (incentive to try)10% -- Inadequate distribution
SOURCE: Clancy & Shulman, Marketing Myths that are Killing Business
Test marketing
solves!
Why Test New Products?

62Copyright © 2006 Information Resources, Inc. Confidential and proprietary.
Criteria for a New Product Test
Able to test the total marketing planCompleteness
Restrict competitors ability to read testConfidentialityMinimum effort required by brokers, sales forceEffort Required
Research Product requirementsSlotting allowancesMarketing programs
Cost
Fast to get into the fieldFast results
Speed
A reliable national forecastEstimates of category expansion and cannibalization
Accuracy
Trial, repeat and other consumer dynamicsAttitudinal measuresImpact of marketing programs
Insights
Why Test New Products?
63Copyright © 2006 Information Resources, Inc. Confidential and proprietary.
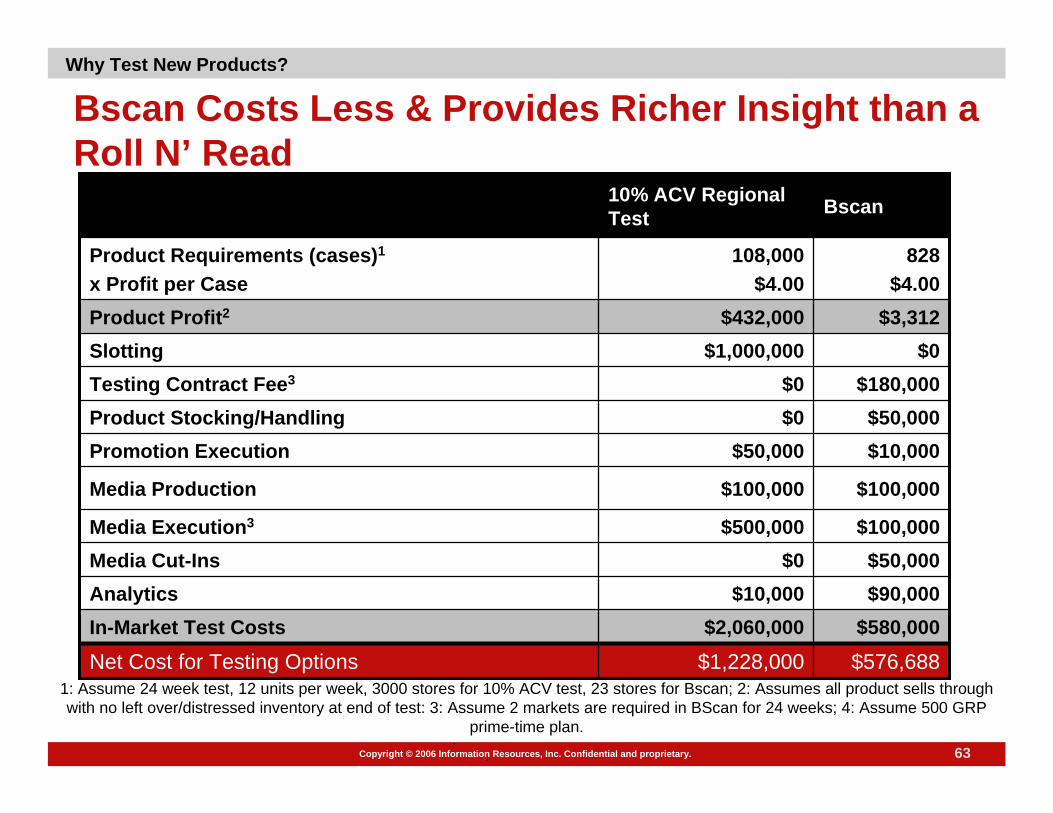
Bscan Costs Less & Provides Richer Insight than a Roll N’ Read
1: Assume 24 week test, 12 units per week, 3000 stores for 10% ACV test, 23 stores for Bscan; 2: Assumes all product sells through with no left over/distressed inventory at end of test: 3: Assume 2 markets are required in BScan for 24 weeks; 4: Assume 500 GRP
prime-time plan..
.
$576,688$1,228,000Net Cost for Testing Options$580,000$2,060,000In-Market Test Costs
$90,000$10,000Analytics$50,000$0Media Cut-Ins
$100,000$500,000Media Execution3
$100,000$100,000Media Production
$10,000$50,000Promotion Execution$50,000$0Product Stocking/Handling
$180,000$0Testing Contract Fee3
$0$1,000,000Slotting$3,312$432,000Product Profit2
828$4.00
108,000$4.00
Product Requirements (cases)1
x Profit per Case
Bscan10% ACV Regional Test
Why Test New Products?
64Copyright © 2006 Information Resources, Inc. Confidential and proprietary.
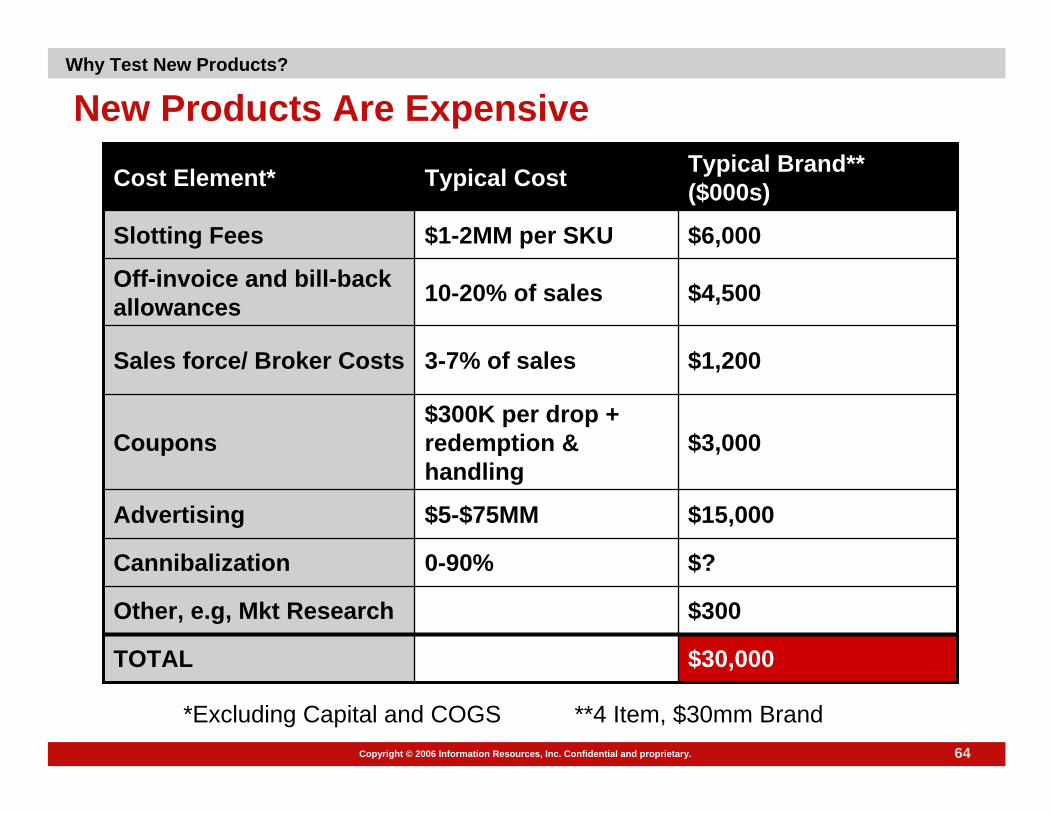
New Products Are Expensive
**4 Item, $30mm Brand
$30,000TOTAL
$300Other, e.g, Mkt Research
$?0-90%Cannibalization
$15,000$5-$75MMAdvertising
$3,000$300K per drop + redemption & handling
Coupons
$1,2003-7% of salesSales force/ Broker Costs
$4,50010-20% of salesOff-invoice and bill-back allowances
$6,000$1-2MM per SKUSlotting Fees
Typical Brand** ($000s)Typical CostCost Element*
*Excluding Capital and COGS
Why Test New Products?

65Copyright © 2006 Information Resources, Inc. Confidential and proprietary.
The Cost of a Typical New Product Failure (000s)
($14,200)LOSS
$20,000Total Costs
$200Other
$10,000Advertising
$2,000Coupons
$2,000Off-invoice and bill-back allowances
$6,000Slotting allowances
Costs
$6,000Contribution
40%Profit Margin$15,000Revenue from product sold
Income
Why Test New Products?

66Copyright © 2006 Information Resources, Inc. Confidential and proprietary.
Why Make Costly Decisions on the Basis of a Shaky set of Assumptions?
Consumer statementsActual ObservedSource of Volume
Claimed frequency of purchase, adjusted based on benchmarksSame as aboveAdditional Repeats
Claimed after 1 week use, adjusted based on benchmarksSame as aboveFirst Repeat
Claimed after viewing concept board, adjusted based on benchmarks
Actual to date, with forecast based on intro-to-date response to marketing as actually executed
Trial
Forecast based on planned marketing eventsActualAwareness
Planned (Quality of created estimated)
Actual, including actual creativeMarketing Events
EstimatedActualDistribution
Simulation (BASES)In-Market Launch (e.g., w/ IRI IntroCast used in Bscan)
Most crucial to long-term volume
and most often wrong in STM
Why Test New Products?

67Copyright © 2006 Information Resources, Inc. Confidential and proprietary.
A Leading Client Says:
“BehaviorScan is a critical component of Frito-Lay’s go-to-market strategy for a couple of reasons.
First, it gives us absolutely the most accurate read on the sales potential of a new product, and a well-rounded view of consumer response to all elements of the marketing mix.
Second, BehaviorScan TV ad testing has enabled us to significantly increase our return on our advertising investment.
We definitely plan to continue using BehaviorScan, especially with the new multi-outlet panel enhancement.”
Dwight RiskeySenior Vice President, Frito-Lay
October 29, 2001
Why Test New Products?
68Copyright © 2006 Information Resources, Inc. Confidential and proprietary.
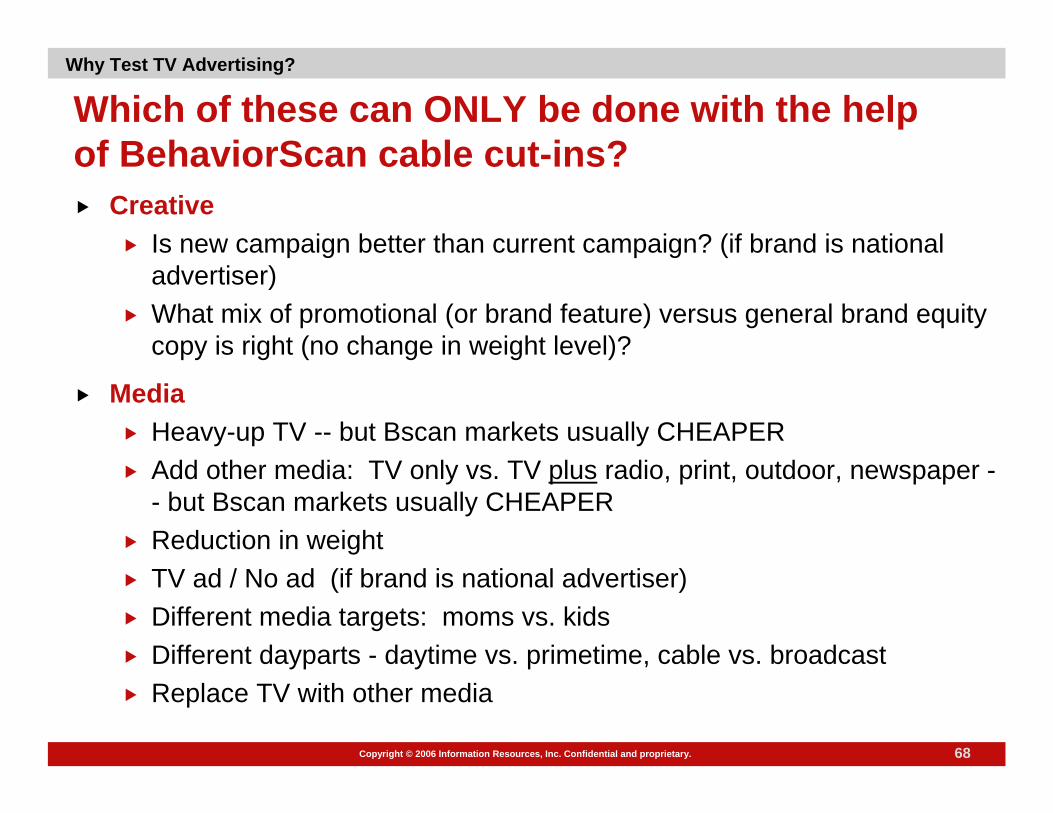
Which of these can ONLY be done with the help of BehaviorScan cable cut-ins?
CreativeIs new campaign better than current campaign? (if brand is national advertiser)What mix of promotional (or brand feature) versus general brand equity copy is right (no change in weight level)?
MediaHeavy-up TV -- but Bscan markets usually CHEAPERAdd other media: TV only vs. TV plus radio, print, outdoor, newspaper -- but Bscan markets usually CHEAPERReduction in weightTV ad / No ad (if brand is national advertiser)Different media targets: moms vs. kidsDifferent dayparts - daytime vs. primetime, cable vs. broadcastReplace TV with other media
Why Test TV Advertising?
69Copyright © 2006 Information Resources, Inc. Confidential and proprietary.
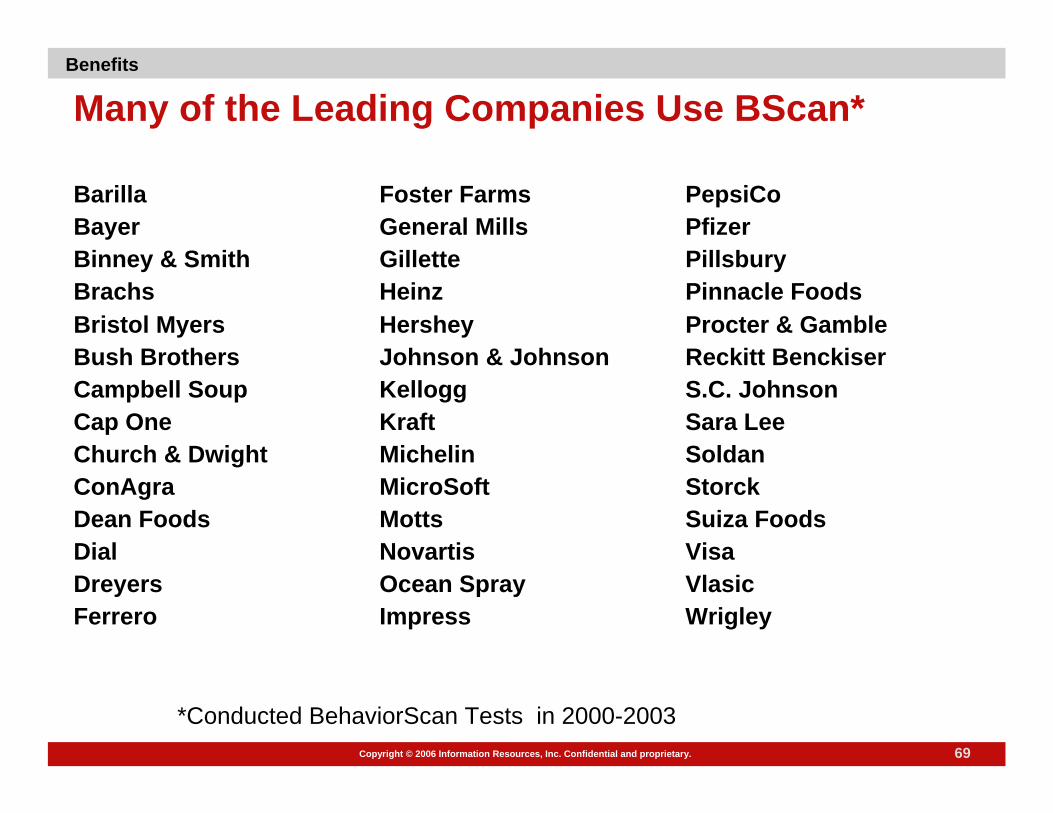
Many of the Leading Companies Use BScan*
WrigleyImpressFerreroVlasicOcean SprayDreyersVisaNovartisDialSuiza FoodsMottsDean FoodsStorckMicroSoftConAgraSoldanMichelinChurch & DwightSara LeeKraftCap OneS.C. JohnsonKelloggCampbell SoupReckitt BenckiserJohnson & JohnsonBush BrothersProcter & GambleHersheyBristol MyersPinnacle FoodsHeinzBrachsPillsburyGilletteBinney & SmithPfizerGeneral MillsBayerPepsiCoFoster FarmsBarilla
*Conducted BehaviorScan Tests in 2000-2003
Benefits
Copyright © 2006 Information Resources, Inc. Confidential and proprietary.
More on Building the Business CaseMore Examples of BScan Market Representability
Comparison of Bscan vs. US regarding demographics, market dynamics, stores, and media climate
More on Methodology
Appendices
Copyright © 2006 Information Resources, Inc. Confidential and proprietary.

71Copyright © 2006 Information Resources, Inc. Confidential and proprietary.
Isolated but Representative MarketsDemographics: Accuracy
35.133.845.640.843.2*$45K+ Income
68.9
20.5
Grand Junction
72.9
16.8
Cedar Rapids
63.658.858.61-2 Persons
25.426.829.3**With Kids
Eau ClairePittsfieldTotal U.S.%HHs
Bscan Markets vs. Total U.S.(Survey of Buying Power 2004)
Source: Survey of Buying Power 2004*Source: Est. figures based on Survey of Buying Power 2004
**Source: U.S. Census, Total US Distribution of Demographics - March 2002 update

72Copyright © 2006 Information Resources, Inc. Confidential and proprietary.
Occupations
Avg TotalU.S.
Avg BscanMarkets
Management, professional, and related occupations
Source: U.S. Census Bureau; Profile of Selected Social Characteristics, 2000 Census
33.6% 33.3%
Sales and office occupations
33.6%26.7%
Production, transportation, material moving occupations
Avg TotalU.S.
Avg BscanMarkets
14.6% 12.4%
Service occupations
33.6%
Avg TotalU.S.
Avg BscanMarkets
14.9% 16.9%
Demographics
Avg TotalU.S.
Avg BscanMarkets
26.7% 28.7%

73Copyright © 2006 Information Resources, Inc. Confidential and proprietary.
HH IncomeDemographics
28.7%
18.6%
28.1%24.5%
28.5%
19.5%20.3%
29.7%
Less than $25,000 $25,000 - 44,999 $45,000 - 64,999 $65,000 or more
Avg Total U.S.Avg Bscan Markets
Source: Survey of Buying Power, 2004. *Estimated Figures based on Survey of Buying Power 2004
Household Income
*
*
*

74Copyright © 2006 Information Resources, Inc. Confidential and proprietary.
EducationDemographics
Source: U.S. Census Bureau; Profile of Selected Social Characteristics, 2000 Census
80.4%
93.2%90.1%
83.7%
89.8%
Total U.S. Cedar Rapids Eau Claire GrandJunction
Pittsfield
% High School Graduate or Higher
75Copyright © 2006 Information Resources, Inc. Confidential and proprietary.
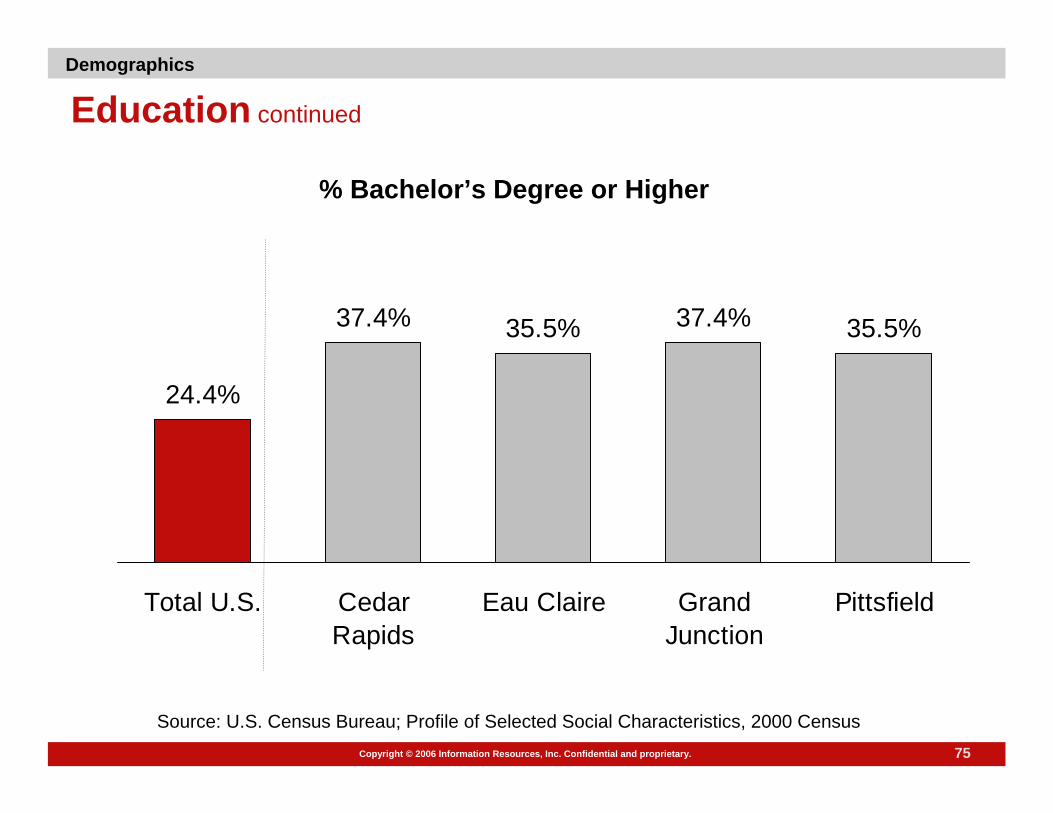
Education continued
Demographics
Source: U.S. Census Bureau; Profile of Selected Social Characteristics, 2000 Census
24.4%
37.4% 35.5% 37.4% 35.5%
Total U.S. CedarRapids
Eau Claire GrandJunction
Pittsfield
% Bachelor’s Degree or Higher

76Copyright © 2006 Information Resources, Inc. Confidential and proprietary.
Household SizeDemographics
Source: Survey of Buying Power, 2004.
26.1%
6.5% 4.2%
43.5%
14.0%16.7%
32.4%
22.0%
14.1% 13.2%
5.2%2.0%
1 Member 2 Member 3 Member 4 Member 5 Member 6+Member
Avg Total U.S.Avg Bscan Markets
% of Households
77Copyright © 2006 Information Resources, Inc. Confidential and proprietary.
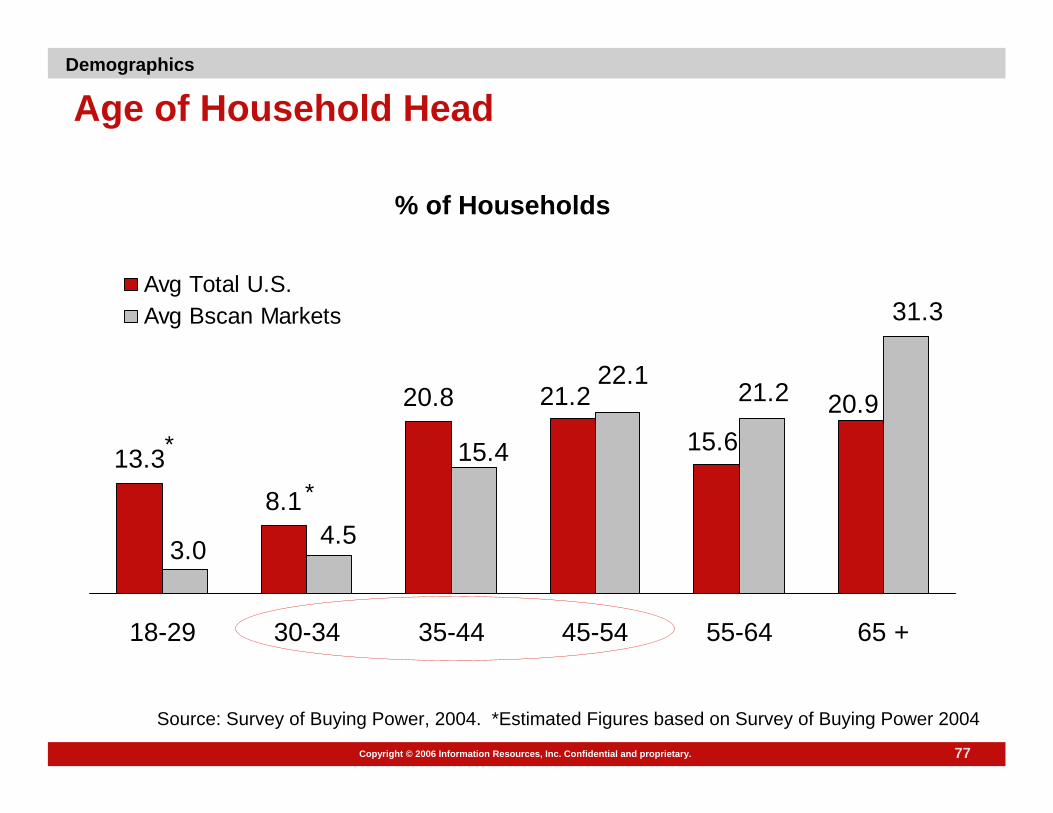
Age of Household HeadDemographics
13.38.1
20.8 21.2 20.915.6
4.5
31.3
21.222.1
15.4
3.0
18-29 30-34 35-44 45-54 55-64 65 +
Avg Total U.S.Avg Bscan Markets
% of Households
Source: Survey of Buying Power, 2004. *Estimated Figures based on Survey of Buying Power 2004
*
*

78Copyright © 2006 Information Resources, Inc. Confidential and proprietary.
Market Dynamics: Bscan Consumers buy like the Rest of the Country
Source: IRI Panel Dollars per Buyer; All IRI Categories; 52 Week Ending 6/29/03
$48
$193
$106$147
$53
$484
$52$107
$152
$49
$489
$192
Frito-Lay Kraft GeneralMills
P&G Quaker PrivateLabel
U.S. MarketsBscan Markets
Dollars per Buyer Over 1 Year
Market Dynamics

79Copyright © 2006 Information Resources, Inc. Confidential and proprietary.
The Top 50 Products Sold in Bscan Markets Reflect U.S. Buying Habits
Source: Bscan Market Video, IRI InfoScan Reviews, 52 week period ending 7/13/03, ranking based on top edible categories.
2925General Mils Cheerios 15 oz
2216Nabisco Ritz Crackers 16 oz
2314Oscar Mayer Sliced Bacon 16 oz
2113Philadelphia Cream Cheese 8 oz
1112Lays Potato Chips 12 oz
12Pepsi Cola 144 oz
21Coke Classic 144 oz
Bscan Market Rank
U.S. Market Rank
Market Dynamics

80Copyright © 2006 Information Resources, Inc. Confidential and proprietary.
Bscan Markets are Comprised Largely of Chain Grocery Stores
78% 71% 75%
100% 100%
Total U.S. Pittsfield Eau Claire GrandJunction
CedarRapids
% of Chain Stores
Source: Bscan market video, 6/03
Market Dynamics

81Copyright © 2006 Information Resources, Inc. Confidential and proprietary.
Bscan Grocery Stores are Somewhat Larger than the U.S. Average
27.2
38.047.0 43.9
39.6
Total U.S. Pittsfield Eau Claire GrandJunction
CedarRapids
Average Store Square Footage (000s)
Source: Bscan market video, 6/03
Market Dynamics
82Copyright © 2006 Information Resources, Inc. Confidential and proprietary.
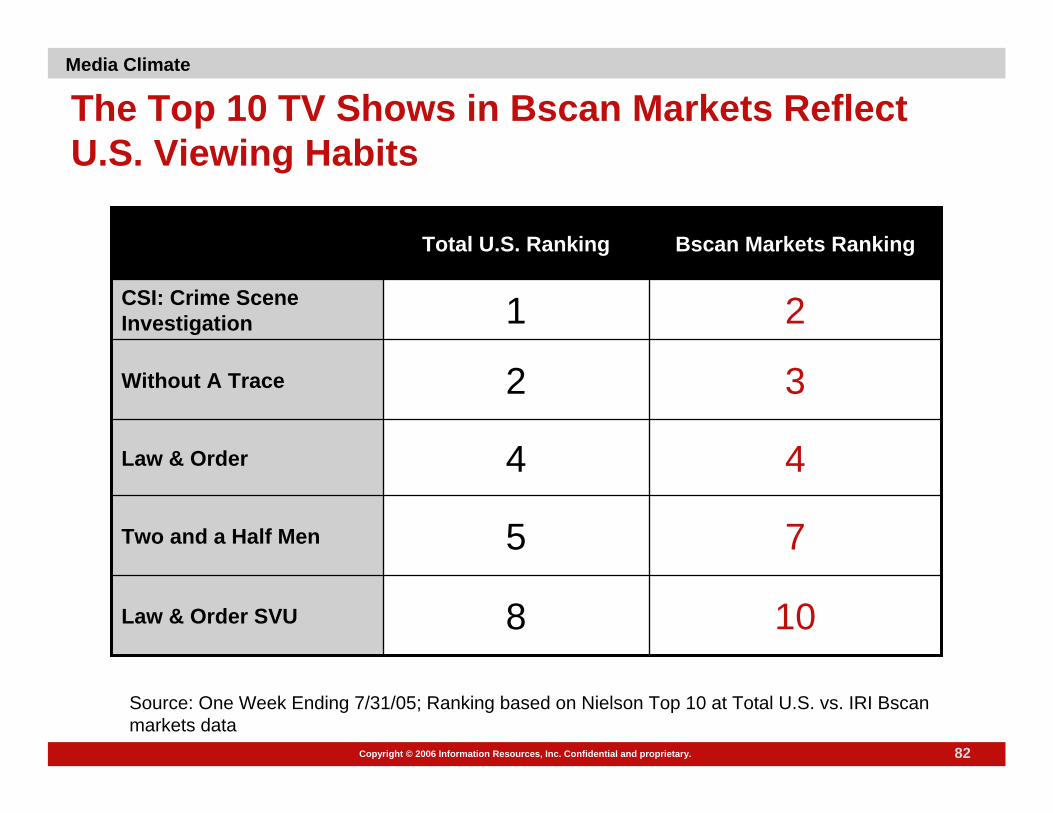
The Top 10 TV Shows in Bscan Markets Reflect U.S. Viewing Habits
Source: One Week Ending 7/31/05; Ranking based on Nielson Top 10 at Total U.S. vs. IRI Bscan markets data
108Law & Order SVU
75Two and a Half Men
44Law & Order
3
2
Bscan Markets Ranking
2Without A Trace
1CSI: Crime Scene Investigation
Total U.S. Ranking
Media Climate
83Copyright © 2006 Information Resources, Inc. Confidential and proprietary.
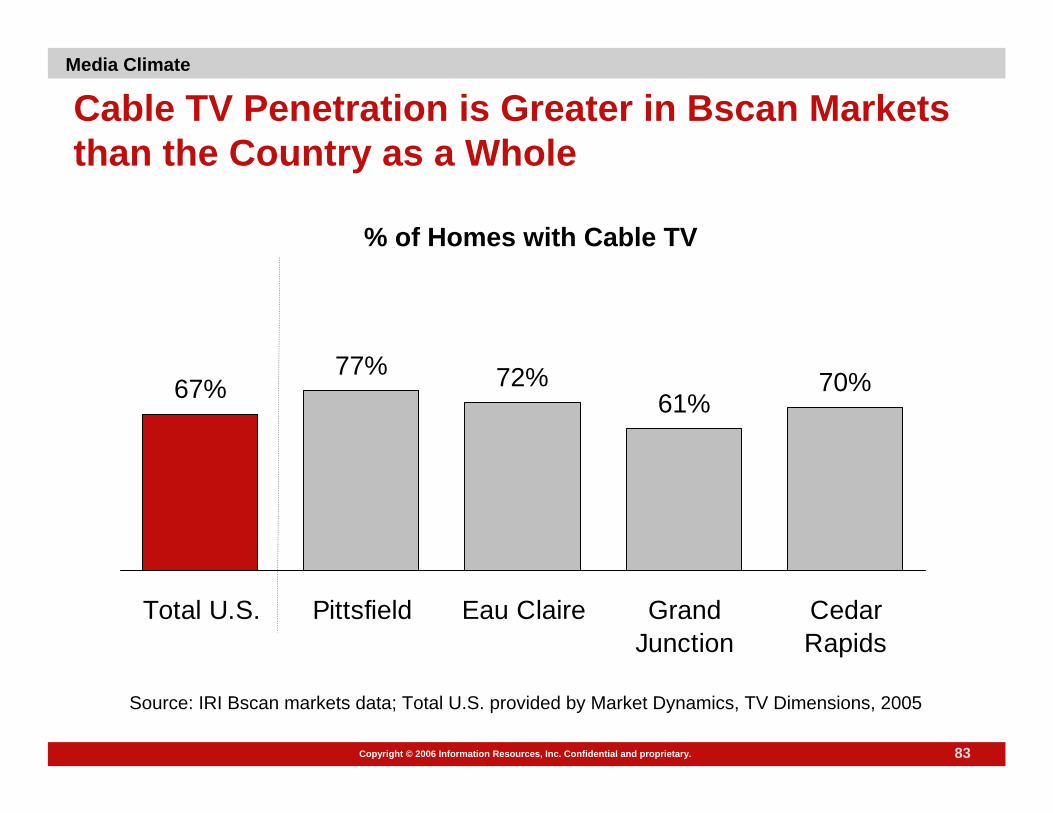
Cable TV Penetration is Greater in Bscan Markets than the Country as a Whole
% of Homes with Cable TV
67%77% 72%
61%70%
Total U.S. Pittsfield Eau Claire GrandJunction
CedarRapids
Source: IRI Bscan markets data; Total U.S. provided by Market Dynamics, TV Dimensions, 2005
Media Climate
84Copyright © 2006 Information Resources, Inc. Confidential and proprietary.
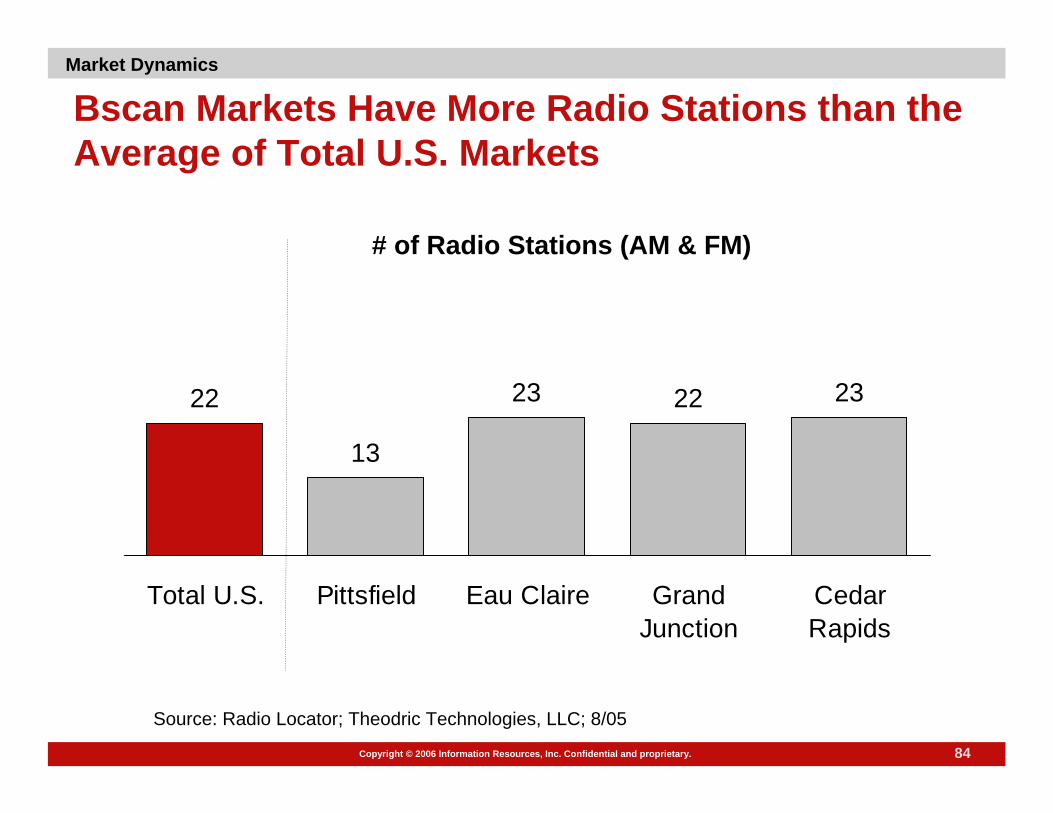
Bscan Markets Have More Radio Stations than the Average of Total U.S. Markets
22
13
23 22 23
Total U.S. Pittsfield Eau Claire GrandJunction
CedarRapids
# of Radio Stations (AM & FM)
Source: Radio Locator; Theodric Technologies, LLC; 8/05
Market Dynamics

85Copyright © 2006 Information Resources, Inc. Confidential and proprietary.
Internet Penetration is Similar in Bscan Markets to the Total U.S.
Internet Penetration*
Source: Total U.S. Computerwire 3/22/04; IRI Bscan Household Panel Survey 6/2005.
75% 77% 74% 73% 73%
Total U.S. Pittsfield Eau Claire GrandJunction
CedarRapids
Market Dynamics

Copyright © 2006 Information Resources, Inc. Confidential and proprietary.
More on Building the Business CaseMore Examples of BScan Market RepresentabilityMore on Methodology
Appendices
Copyright © 2006 Information Resources, Inc. Confidential and proprietary.
87Copyright © 2006 Information Resources, Inc. Confidential and proprietary.
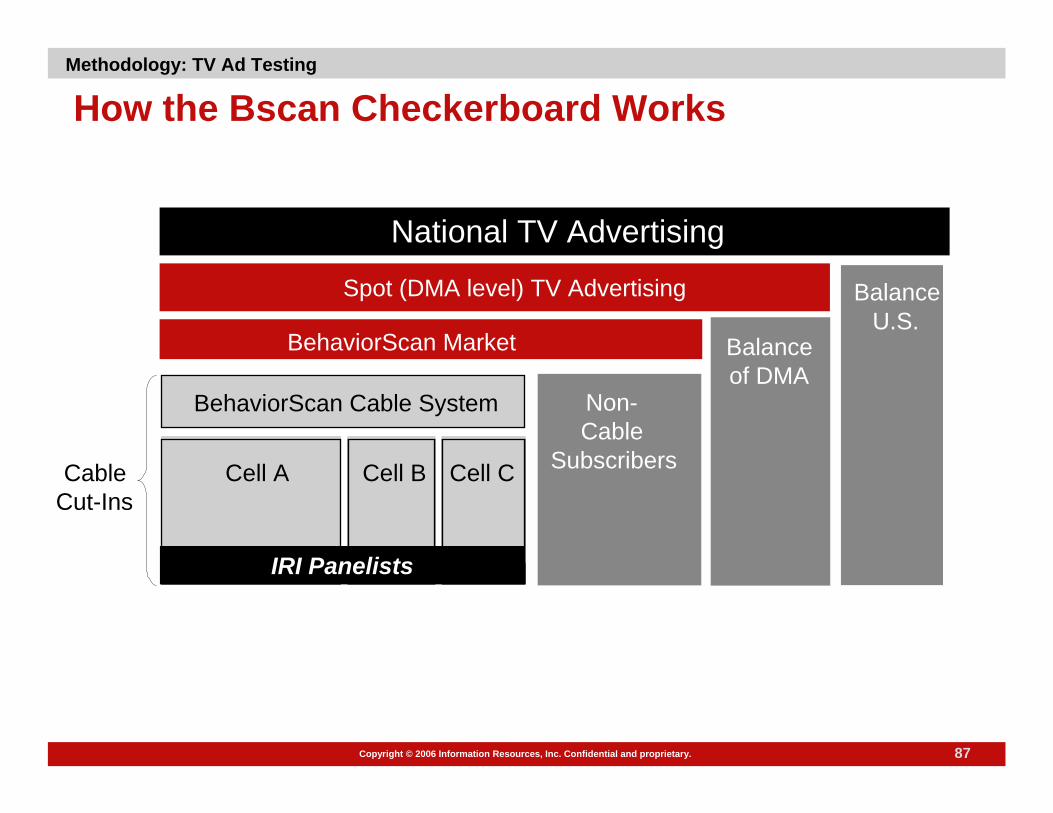
How the Bscan Checkerboard Works
BalanceU.S.
Balanceof DMA
BehaviorScan Cable System Non-Cable
SubscribersCell A Cell B Cell CCableCut-Ins
National TV Advertising
Spot (DMA level) TV Advertising
BehaviorScan Market
IRI Panelists
Methodology: TV Ad Testing

88Copyright © 2006 Information Resources, Inc. Confidential and proprietary.
Within-Market Design Ensures an “Apples to Apples” Comparison
Test and control cells experience the same ...Environmental conditions - temperature, humidity, weather disastersLocal festivals and special eventsCompetitive advertising and promotionsRetailer presence and outlet mixAlternative media presencePublicity / press coverage, other business conditions
Market 1Test
Control Test
Control
Market 2
Methodology: TV Ad Testing

89Copyright © 2006 Information Resources, Inc. Confidential and proprietary.
BehaviorScan Split-Cable TV Ad Testing Who Sees What
Cell A Cell B Cell C-Test- -Control-
Non-CableSubscribers
DMA ConditionDMA Condition
Local Cable System / BehaviorScan Studio
¤¤¤¤¤¤¤¤¤ ¤¤¤¤ ¤¤¤¤
¤ = IRI Panel HHs
National Condition
30% of market
30% of market
30% of market
Methodology: TV Ad Testing
90Copyright © 2006 Information Resources, Inc. Confidential and proprietary.
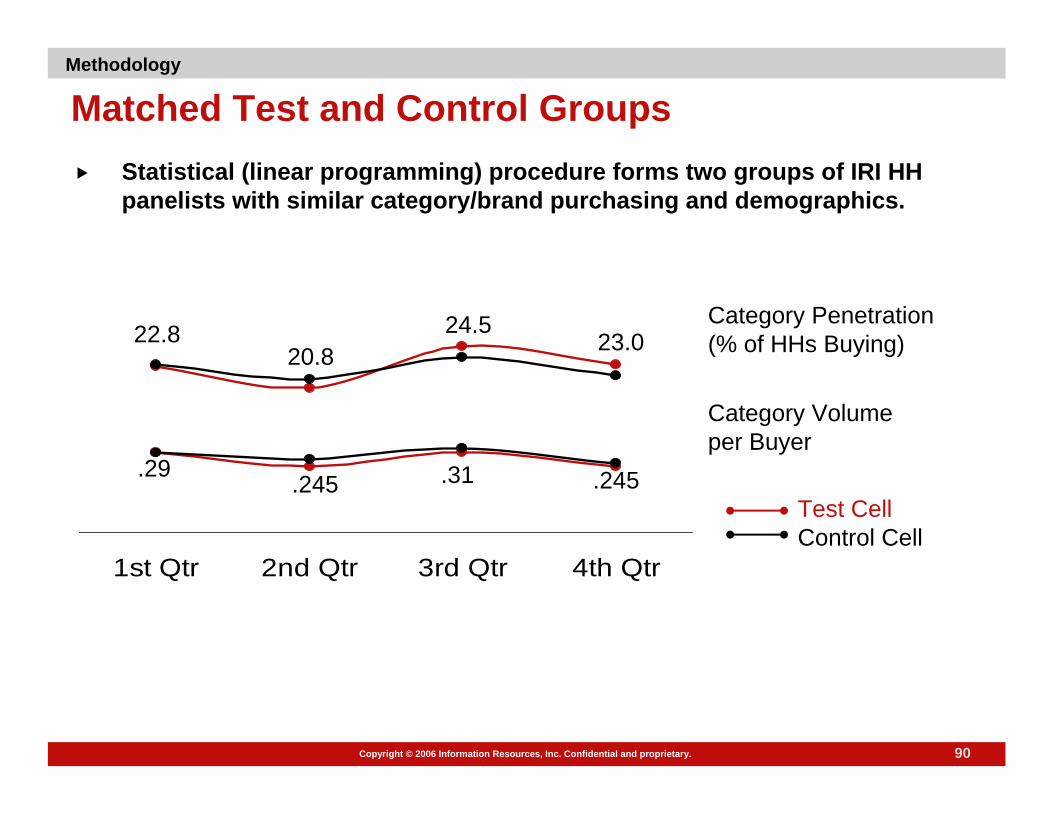
Matched Test and Control GroupsStatistical (linear programming) procedure forms two groups of IRI HH panelists with similar category/brand purchasing and demographics.
Methodology
1st Qtr 2nd Qtr 3rd Qtr 4th Qtr
Category Penetration (% of HHs Buying)
Category Volume per Buyer
20.822.8 24.5
.245.31.245.29
23.0
Test CellControl Cell
91Copyright © 2006 Information Resources, Inc. Confidential and proprietary.
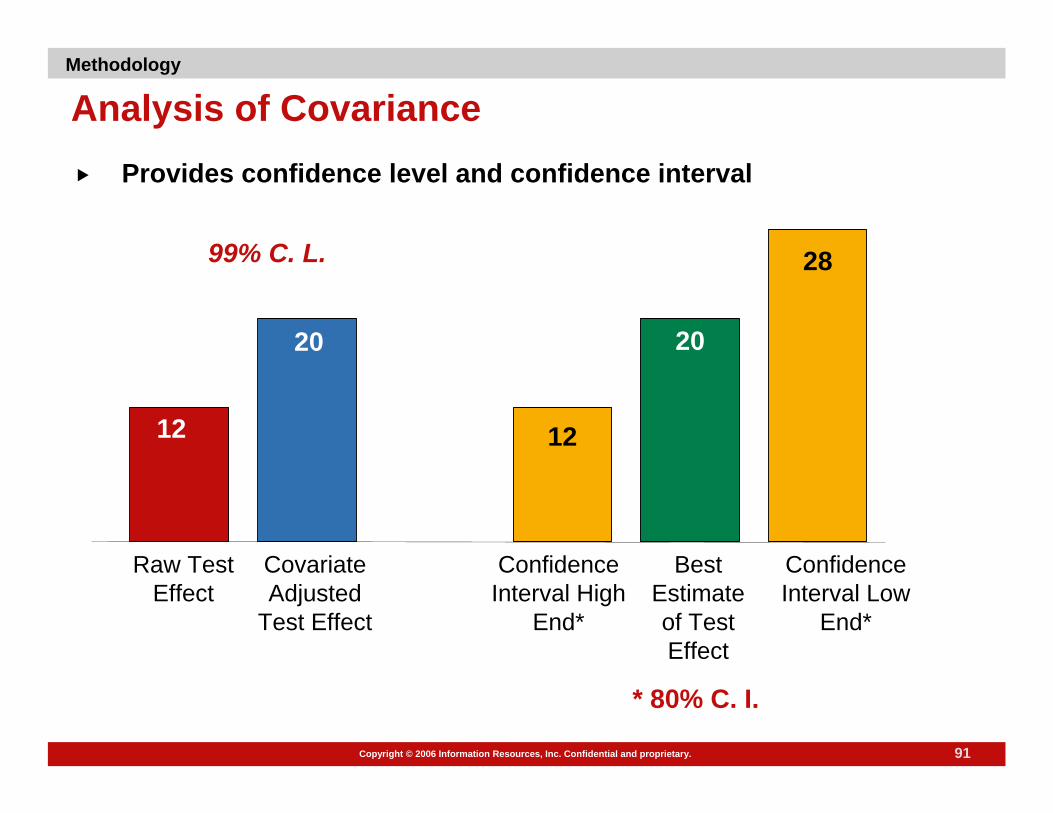
Analysis of CovarianceProvides confidence level and confidence interval
Raw Test Effect
Confidence Interval Low
End*
Best Estimate of Test Effect
Covariate Adjusted
Test Effect
Confidence Interval High
End*
99% C. L.
* 80% C. I.
12
20
28
12
20
Methodology
92Copyright © 2006 Information Resources, Inc. Confidential and proprietary.
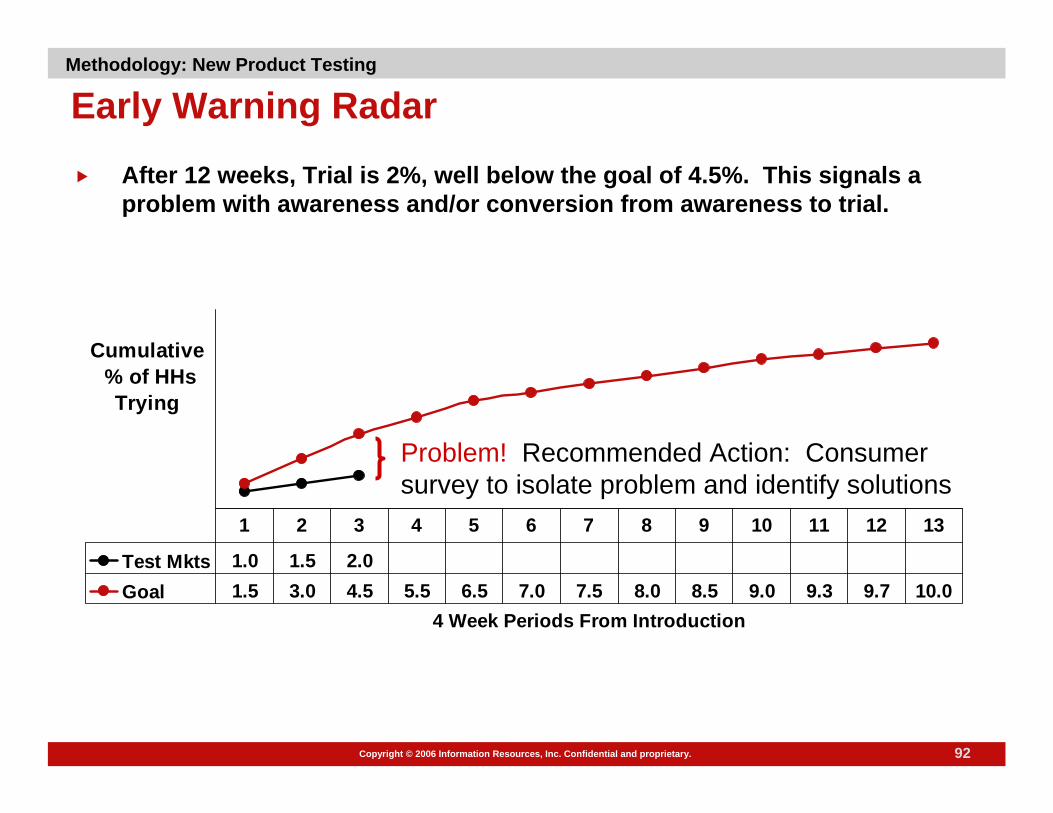
Early Warning Radar
After 12 weeks, Trial is 2%, well below the goal of 4.5%. This signals a problem with awareness and/or conversion from awareness to trial.
Methodology: New Product Testing
Cumulative % of HHs
Trying
4 Week Periods From Introduction
Test Mkts 1.0 1.5 2.0Goal 1.5 3.0 4.5 5.5 6.5 7.0 7.5 8.0 8.5 9.0 9.3 9.7 10.0
1 2 3 4 5 6 7 8 9 10 11 12 13
Problem! Recommended Action: Consumer survey to isolate problem and identify solutions

93Copyright © 2006 Information Resources, Inc. Confidential and proprietary.
Estimate “National Year-One” Sales Potential
IntroCast Post-Launch
0 1 2 3 4 5 6 7 8 9 10 11 12 134 week periods from introduction
Year OneVolume Sales (MM)
ForecastActualActual
Varianceto Goal
Methodology: New Product Testing
94Copyright © 2006 Information Resources, Inc. Confidential and proprietary.
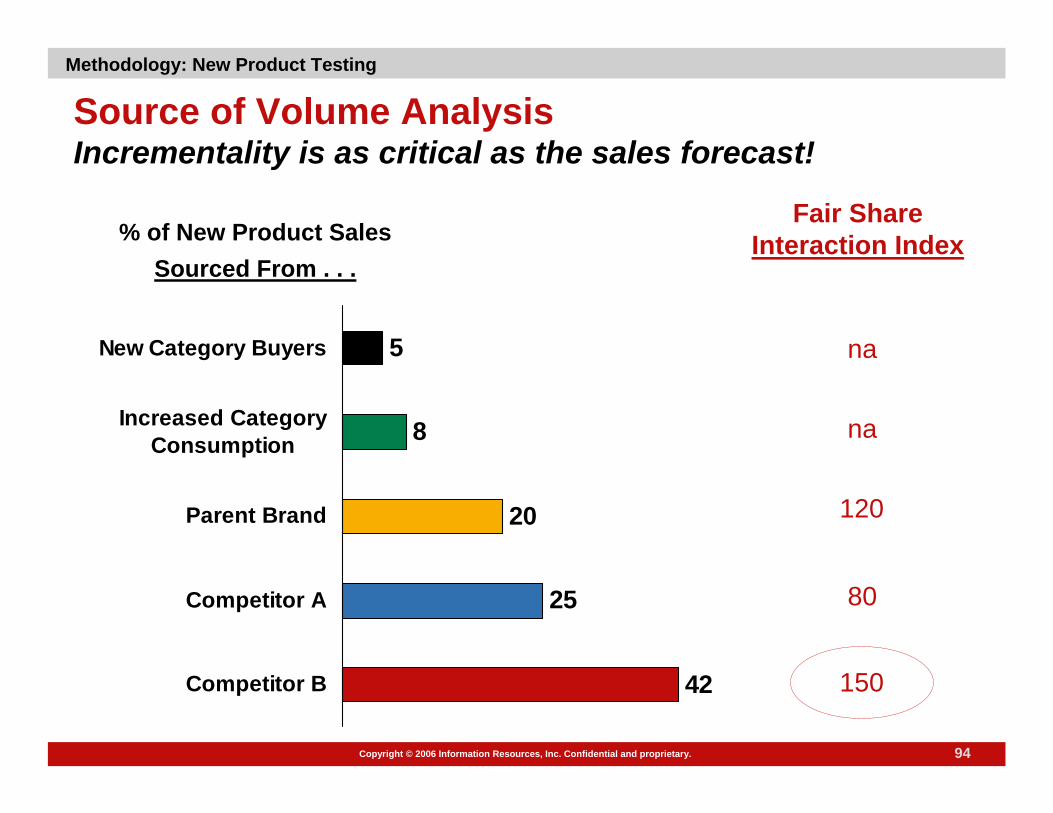
Source of Volume Analysis Incrementality is as critical as the sales forecast!
Methodology: New Product Testing
Fair Share Interaction Index
na
na
120
80
150
% of New Product Sales Sourced From . . .
42
25
20
8
5
Competitor B
Competitor A
Parent Brand
Increased CategoryConsumption
New Category Buyers
95Copyright © 2006 Information Resources, Inc. Confidential and proprietary.
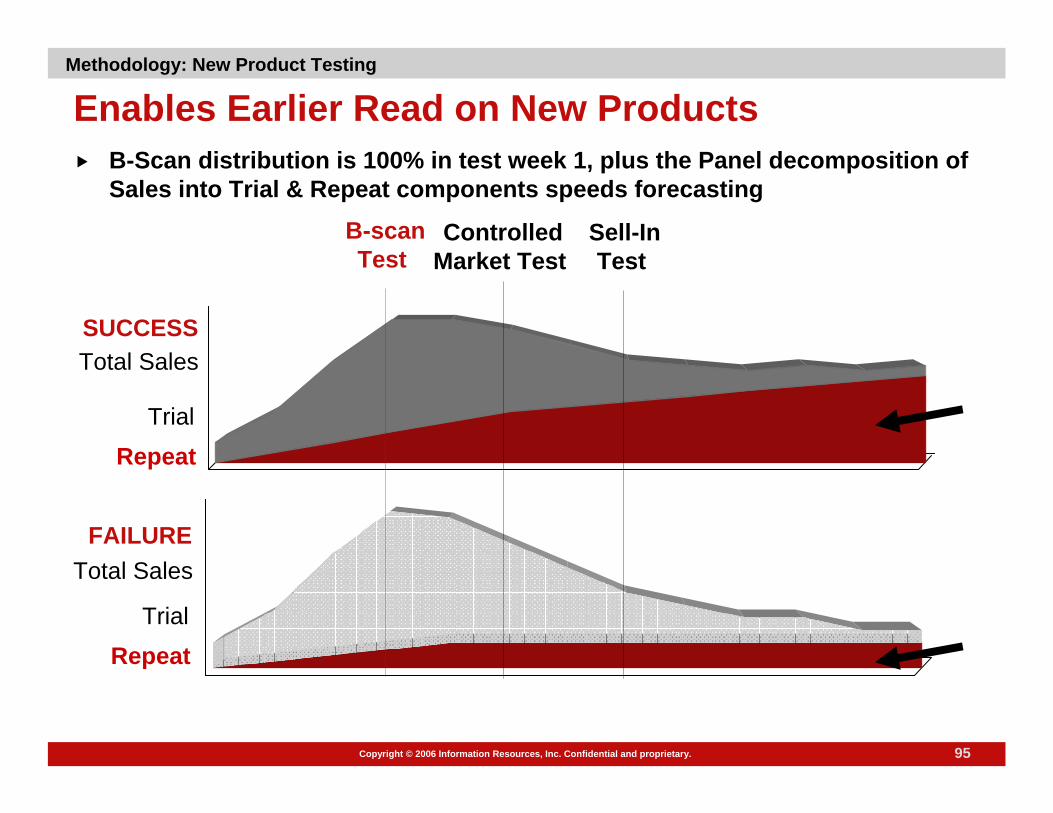
Enables Earlier Read on New ProductsB-Scan distribution is 100% in test week 1, plus the Panel decomposition of Sales into Trial & Repeat components speeds forecasting
B-scanTest
ControlledMarket Test
Sell-InTest
SUCCESSTotal Sales
Trial
Repeat
FAILURETotal Sales
Trial
Repeat
Methodology: New Product Testing

96Copyright © 2006 Information Resources, Inc. Confidential and proprietary.
Assess Performance vs. GoalsMethodology: New Product Testing
Total DollarSales ($MM)
% of HHs Trial % of TriersRepeating
AdditionalRepeaters
AvgVol/Occasion
GoalForcast
Critical Success Factors
40
8
35
1.1
12
50
8
35
2.1
12
+20% +20% Over Over Goal!Goal!